Embed Size (px)
Citation preview
4550 Macromolecules 1989, 22, 4550-4559
FRAP and FCS Studies of Self-Diffusion and Mutual Diffusion in Entangled DNA Solutions
Bethe A. Scalettar,*t’$* John E. Hearst,:,$ and Melvin P. Klein$ Chemical Biodynamics Division, Lawrence Berkeley Laboratory, Berkeley, California 94720, and Department of Chemistry, University of California, Berkeley, California 94720. Received November 23, 1988; Revised Manuscript Received May 5, 1989
ABSTRACT: Two fluorescence techniques, fluorescence recovery after photobleaching and fluorescence correlation spectroscopy, have been used to monitor respectively self-diffusion and mutual diffusion in entangled phage X DNA solutions. Ethidium monoazide, which binds covalently to the DNA, and ethidium bromide, a noncovalently bound intercalator, were the fluorescent labels. For the DNA concentration regime examined, 17 pg/mL I c 5 305 pg/mL, it was found that the mutual-diffusion coefficient increases markedly with concentration, i.e., D, 0: co,65-co,83. The self-diffusion coefficient, on the other hand, decreases by about 50% as the DNA concentration is increased from 40 to 300 pg/mL. The data presented here are in qualitative agreement with a body of theoretical work and with results obtained in recent light scattering studies of self-diffusion and mutual diffusion in interacting DNA solutions. The FCS data also support Phillies’s prediction that a mutual-diffusion coefficient is extracted from an FCS experiment if essentially all the macromolecules in the system are fluorescently labeled.
1. Introduction The dynamics of DNA in concentrated solution is of
special biological importance because many cellular sys- tems are characterized by a very high concentration of nucleic acid. (For example, there are tens of milligrams of DNA per milliliter in a typical eucaryotic cell We are interested in investigating the effects that inter- particle interactions have on DNA dynamics in concen- trated systems and in analyzing the role that such inter- actions play in dictating the molecular events that underlie important cellular processes.
Although much is known about the rotational and translational dynamics of DNA in dilute solution, neither class of motion has been well characterized in nondilute, Le., interacting, systems. The available experimental data do suggest, however, that in concentrated solutions in- teractions can profoundly modify DNA dynamics. For example, Rill et al. have looked at the 13C nuclear magnetic resonance (NMR) spectra of very concentrated, liquid- crystalline DNA s a m p l e ~ . ~ In their studies, it was found that many of the backbone and base motions that are manifest in the NMR spectra of less concentrated DNA solutions are effectively frozen out above a critical mo- lecular weight dependent DNA concentration. This result suggests that interactions between DNA molecules can substantially alter the polymer’s motion. Moreover, it has also been demonstrated that interactions between DNA molecules and the molecules that form a gel can have an inhibitory effect on DNA dynamics. Wijmenga and Maxwell have shown, for instance, that the rotational correlation time of short DNA fragments in a gel increases with DNA length as predicted by a model which assumes that the gel network “cages” a “slightly flexible” DNA rode4
Interaction-induced modification of the translational motion of DNA has also been the focus of some experi- mental study. Of particular interest here is work that has probed the effects that interactions have on self-diffusion and mutual diffusion in DNA solutions. The self-diffusion, D,, and mutual-diffusion, D,, coefficients describe re- spectively the random motion of an individual DNA molecule and the relaxation of fluctuations or gradients in DNA c~ncentrat ion.~ The concentration dependence
Present address: Department of Cell Biology and Anatomy,
* Chemical Biodynamics Division, Lawrence Berkeley Laboratory. University of North Carolina, Chapel Hill, NC 27599-7090.
Department of Chemistry, University of California.
0024-9297/89/ 22 2 2-4550$01.50/0
of the mutual-diffusion coefficient has been determined for several DNA systems and in general it is observed that D, increases with DNA Moreover, Sorlie and Pecora have very recently used the dynamic light scattering (DLS) technique to monitor the concentration dependence of self-diffusion (and mutual diffusion) in solutions that range from 90 to 450 kg/mL in concentration of a 2311 base pair DNA restriction fragment.6 Although the interpretation of the data is not completely unam- biguous (see section 5.6), it appears that self-diffusion is retarded by intermolecular interactions in this system. DLS data also suggest that anisotropic translational motion can become coupled to reorientation in congested DNA systemslO and that concentrated DNA solutions may un- dergo a transition from an “ordinary” to an ”extraordinary” phase, as the concentration of salt is decreased.l’J2 AI- though this latter phenomenon is not well understood, it is possible that a multipolyion structure forms in concen- trated, low-salt, DNA solutions.”
Experimental work of a biochemical nature also indi- cates that DNA dynamics may differ in concentrated and dilute systems. For example, Fried and Crothers have noted that the stability of several DNA/enzyme complexes is markedly enhanced in gel matrices, and they have postulated that gel-induced “caging”, which hinders spatial separation of the DNA and enzyme, could underlie this phen0men0n.l~
In this paper, we present a systematic experimental study of the interaction dependence of self-diffusion and mutual diffusion in DNA solutions. We have worked with phage X DNA, which is about 50000 base pairs in length. The solutions studied ranged from 17 to 305 pg/mL in DNA concentration. The self-diffusion coefficient has been measured by monitoring fluorescence recovery after pho- tobleaching (FRAP).14 The mutual-diffusion coefficient was determined from fluorescence correlation spectroscopy (FCS)15J6 studies of concentration fluctuations in fully labeled DNA solutions. Our experiments thus complement the work of Sorlie and Pecora because we have investigated the dynamics of a molecule of very different length. More importantly, however, the FRAP technique is basically sensitive only to translational motions; therefore respects the interpretation of fluorescence data is more straight- forward than the comparable dynamic light scattering data (see section 5.6).
In the samples studied, the average volume occupied by a X DNA molecule is approximately the same as, or larger
0 1989 American Chemical Society
Macromolecules, Vol. 22, No. 12, 1989
than, the inter-DNA spacing. Hence, the system is ex- pected to be interacting, and the self-diffusion and mu- tual-diffusion coefficients are not expected to exhibit the same concentration dependen~e.~ For example, if we ap- peal to a very simple hard-sphere model of DNA diffusion, we predict that the repulsive hard-core interaction should effectively push molecules apart and accelerate the re- laxation of gradients; hence D , should increase with con- ~ e n t r a t i o n . ~ In contrast, the random motion of an indi- vidual spherical molecule should be impeded by its neighbors and so D, should decrease with c~ncentration.~ Here we look experimentally a t the effects that the real interactions have on the diffusion of the charged X DNA molecule.
We have, in fact, found that in the concentration domain examined, the self-diffusion coefficient of X DNA is rela- tively weakly dependent on concentration, while the mu- tual-diffusion coefficient increases markedly as the DNA concentration of the solution increases. These results are compared with theoretical analyses of the effects that re- pulsive interactions have on polymer translation and with the available experimental data. We also discuss our rather novel use of FCS to detect nonidealities in macromolecular systems. 2. Theory
2.1. Determination of the FCS Relaxation Time. We have chosen to monitor the translational diffusion of DNA by conducting two experiments that are conceptually very different. We have used FCS to monitor fluctuations in the fluorescence emitted by a very small number of DNA molecules (0(102)) as a function of the time t. Translation of the DNA causes the detected signal, i(t), to fluctuate by si(t) around its average value, (i), because molecules outside the area of excitation can move into the beam and begin to contribute to the signal and, conversely, molecules in the illuminated region can diffuse out of the spot.
Elson and Magde15 have shown that translational motion of noninteracting solute particles will lead to a fluorescence fluctuation autocorrelation function, G ( T ) = (si(t)&(t + T ) ) (si(t) = i ( t ) - (i)), of the form
Studies of Diffusion in DNA Solutions 4551
We are interested in the motion of interacting DNA molecules. Phillies” has considered the effects that non- idealities have on the form of eq 1. His generalized result depends in a rather complicated manner on concentration, the nature of the intersolute interactions, and so on; therefore, we do not display the full expression for G(T). However, two limiting forms of the equation are mathe- matically simple and of particular interest here. If es- sentially all of the solute molecules are labeled, we have
(4 ) whereas if only a small fraction of the solute molecules have been tagged, we obtain
( 5 )
Hence, in the former case an FCS experiment will yield the mutual-diffusion coefficient; in the latter case the experiment will yield the self-diffusion coefficient. One can understand the origin of these results if it is noted that when all solute molecules are labeled, a fluorescence fluctuation mirrors a fluctuation in the total solute con- centration, Le., mutual diffusion; however, if most of the solute is unlabeled, mutual motions are not detected be- cause most molecules are not fluorescent. The FCS ex- perimental results reported herein were obtained under conditions of full labeling and hence probably (see section 5.4) reflect mutual diffusion in DNA solutions.
For interacting systems, eq 3 also must be modified. In general the amplitude of the fluctuation autocorrelation function will be related to the osmotic compressibility, K .
Specifically, we can invoke the relationship18
G ( T ) = G(0)/(1 + 4D,T/002)
G ( T ) = G(0)/(1 + 4 D , ~ / w , 2 )
where TDO = Wo2/4Do (2)
Here Do is the “bare” diffusion coefficient of an isolated solute particle, T is a delay time, and TDO is a bare char- acteristic decay time. In arriving a t eq 1, it has been assumed that the sample is illuminated with light having a nondiverging Gaussian intensity profile, I (r) = (2P/7rw:) exp(-2r2/w02). Here, r is the radial cylindrical polar co- ordinate of a point r‘ from the position of maximal light intensity, wo is the e-2 radius or “beam waist” of the illu- minated spot, and P is the power in the beam. Note that the theoretical fluctuation autocorrelation function differs from our experimentally measured correlation function, which is computed over discrete bins and is of the form Ge&) = Cji,i.+k, by the square of the mean signal. Hence we subtract this latter quantity from Gel,, before com- parison with theory is made.
An explicit expression for the zero-time value of the ideal autocorrelation function, G(O), is15
G(0) = ( i ) 2 / 7 r ~ 0 2 L ~ (3) Here c is the concentration of DNA and L is the length of the sample.
and show that
Here ( N ) is the average number of molecules in the beam, p is the number density, k B is Boltzmann’s constant, and T is the absolute temperature. For an ideal system K = l/pk,T and eq 7 reduces to eq 3.
There are several important features to the above equations. First, the characteristic time for relaxation of translational fluctuations, iD, is dependent on the size of the illuminated region of the sample, wg. Second, the amplitude, G(O), of the ideal correlation function and the mean of the signal, (i), will be related to the average number of fluorescing DNA molecules, ( N ) , as dictated by the equation:15
d(0) = G ( 0 ) / ( i ) 2 = l / ( N ) (8) It is worth emphasizing that ( N ) in eq 8 is indeed the
number of DNA (and not dye) molecules. This fact follows from the following argument. For an ideal system con- taining multiple species, the amplitude of the normalized FCS autocorrelation function, G(7)/ ( i ) 2 , is given by15
C(t jQ j )2Cj
V (CcjQjcj)2 (9)
Here V is the sample volume, and e,, Q,, and c, are, re- spectively, the extinction coefficient, quantum yield, and equilibrium concentration of species j . This equation shows that very strongly absorbing or fluorescing species dominate G ( 0 ) / ( i ) 2 . A DNA molecule with 200 bound ethidium molecules has an effective extinction coefficient
1 J G(0) = -
j
4552 Scalettar et al. Macromolecules, Vol. 22, No. 12, I989
motions do not lead to the observed relaxations; rather one detects the movement of segments of the polymer that lie between regions of interpolymer contact. It then follows that as the polymer concentration increases the size of these segments will decrease and, hence, the relaxation time also will decrease. Cooperativity in the semidilute state, which sets in when the polymers begin to overlap in space, has been the been the focus of considerable study2' and typically is analyzed theoretically by invoking scaling ideas. For example, scaling arguments have been used to predict that in a solution consisting of a neutral flexible polymer in a good solvent, the cooperative diffusion coefficient, D,, will vary as c3/4.21 A scaling analysis has also been used to predict that polyelectrolyte solutions will undergo a dilute/semidilute transition at a critical con- centration, c*, if excess salt is present. In addition, it is predicted that the cooperative-diffusion coefficient will (again) scale as c3/4 in polyelectrolyte solutions.22
In summary, a considerable body of theoretical work predicts that, in a variety of systems, mutual and coop- erative diffusion will accelerate as the concentration of the solute increases.
2.3. Determination of the FRAP Relaxation Time. In a translational FRAP experiment, a very small region of the sample is exposed to a brief intense pulse of laser light. The pulse serves irreversibly to bleach (render nonfluorescent) many of the molecules in the illuminated part of the sample. A much attenuated beam is then directed onto the bleached area of the sample; this probe beam is assumed only to excite (not bleach) fluorescent molecules. If the postbleach fluorescence is monitored, it typically will increase with time, as translational motion leads to a net influx of fluorescent molecules and efflux of bleached dye. If the temporal dependence of the fluorescence recovery is monitored, the self-diffusion coefficient of the labeled molecule can be measured. The mathematical relationship between the time dependence of the postbleach fluorescence signal, F ( t ) , and the self- diffusion coefficient is given by14
m
F ( t ) = Fpg c [(-K)"/n!][1 + n(1 + 2t/TD)]-' (10) n=O
In eq 10, F p g is the prebleach fluorescence level, TD = w2/4Ds, and K is a parameter that characterizes the depth of bleach; K depends, therefore, on light intensity.
2.4. Theoretical Concentration Dependence of the Self-Diffusion Coefficient. The concentration depen- dence of the self-diffusion coefficient of polymeric mole- cules has also been the subject of theoretical study. The scaling approach has been applied to the problem of the self-diffusion of a neutral flexible polymer in semidilute solution, and it has been found that in a good solvent, D, a c - ~ / ~ ( M W ) - ~ . ~ ~ , ~ ~ Here MW is the molecular weight of the polymer. In contrast, it has been suggested that the self-diffusion coefficient of neutral rigid rods19,20*25~26 and semiflexible moleculesz0 will, under appropriate conditions, be independent of concentration. Hence the predicted concentration dependence of D, depends critically on the flexibility of the model polymer.
We are not aware of any calculations of the concentra- tion dependence of the self-diffusion coefficient of charged polymers in semidilute solution; hence, we confine our comparisons to the work mentioned above. 3. Materials and Methods
3.1. DNA and Fluorophores. Linear phage X DNA was obtained from New England Biolabs (Beverly, MA). Note that linear phage X DNA has sticky ends and can, therefore, in principle form multimeric structures. How-
that is 4000 times that of an unbound ethidium (bound ethidium fluoresces 20 times more strongly than unbound). Hence, if the concentration of unbound dye does not ex- ceed that of the dye/DNA complex too much, both the numerator and denominator of eq 9 will be dominated by the dye/DNA term and it can be concluded that the concentration of the dye/DNA complex determines the magnitude of G ( 0 ) / ( i ) 2 . Moreover, since in our experi- ments the concentration of the dye/DNA complex is es- sentially the initial DNA concentration, G(O)/( i ) 2 should, at low concentration, vary linearly with 1/CDNA (or 1/ W D N A ) ).
Note also that eq 8 is satisfied by a process that follows Poisson statistics, i.e., a process for which (i) = G(0) = u2 = (N). Here u is the standard deviation. More impor- tantly, eq 8 tells us that the inverse amplitude of the ideal normalized fluctuation autocorrelation function, G(O), should equal the average number of DNA molecules under observation; this relationship therefore provides a way to isolate spurious, systematic sources of correlation (see sections 3.3 and 5.2) .
2.2. Theoretical Concentration Dependence of the Mutual-Diffusion Coefficient. From an FCS experi- ment we obtain (under conditions in which most DNA molecules are labeled) a mutual-diffusion coefficient. The concentration dependence of D, has been the subject of extensive study. Here we will briefly summarize some ideas that have emerged from theoretical analyses of mu- tual diffusion in interacting systems.
In general the mutual-diffusion coefficient is given by the relationship D, = [ l / f , ( p ) ] d ~ / d p . ~ Here f,, x , and p are respectively the mutual-friction coefficient, the os- motic pressure, and the density. Thus, the magnitude of the mutual-diffusion coefficient is determined by a com- petition between thermodynamic effects (as manifest in d x / d p ) and hydrodynamic effects (as manifest in the friction coefficient). Most theoretical analyses of mutual diffusion in systems containing globular molecules that interact through strong repulsive forces predict that D , will increase with (or be insensitive to) c~ncentration.~ As mentioned previously, one would expect the relaxation of fluctuations, or gradients, in concentration to be acceler- ated if the solute molecules interact repulsively; hence, it is reasonable that D, is generally predicted to increase with concentration.
Rigorous analysis of mutual diffusion in systems con- taining a semiflexible polyelectrolyte, such as DNA, has proven to be a formidable theoretical problem; hence, here we will often appeal to the results discussed above. It should be noted, however, that there have been several attempts rigorously to model mutual diffusion in systems that contain molecules that bear some resemblance to DNA. For example, kinetic equation^'^^^^ have been used to analyze mutual diffusion in solutions consisting of neutral rigid rod and semiflexible polymers. For rod systems it has been suggested that, in an appropriate concentration domain, the mutual-diffusion and self-dif- fusion coefficients are related by the equation D, = (1 + ~ U / U * ) D , . ' ~ Here u is the polymer number density and u* is a critical number density at which the isotropic phase becomes unstable. This latter relationship implies that the mutual-diffusion coefficient will increase linearly with concentration if the self-diffusion coefficient is concen- tration independent.
It is also important to note that concentration fluctua- tion studies of entangled polymeric solutions often are interpreted within the confines of the cooperative-diffusion model. In this picture one imagines that translational
Macromolecules, Vol. 22, No. 12, 1989
ever, we saw no evidence for such structures when the DNA was run through a gel. The DNA was labeled with one of two fluorophores (see section 5.5 for the rationale), ethidium bromide or ethidium monoazide. Both com- pounds intercalate into DNA between base pairs. The bromide binds noncovalently. The azide, on the other hand, is a photoreactive analogue of ethidium bromide that will bind covalently to the nucleic acid upon exposure of intercalated dye/DNA complexes to light.
We synthesized the azide following the procedure out- lined by Graves et al.27 and characterized the fluorescent properties of the covalent dye/DNA complex in a series of fluorescence experiments that were described previ- ously.28 The fluorescent properties of the covalently bound azide mimic those of the intercalated bromide: the ab- sorption and emission moments are parallel and the ab- sorption and emission maxima are located at wavelengths near those of noncovalently bound ethidium bromide.
Our desire was to maintain the number of dye molecules bound to each DNA a t an approximately constant level as the DNA concentration in the samples was varied. This was accomplished by calculating, from the appropriate equilibrium constant, the amount of ethidium that should be added to each sample to ensure that the bound dye to DNA ratio was the same in all solutions. The fraction of dye bound can be calculated from a neighbor-exclusion model of ethidium binding.29
The DNA was labeled with ethidium azide or ethidium bromide by combining the appropriate amount of dye with unlabeled DNA solutions and then allowing the sample to form intercalation complexes in the dark. Azide samples were then exposed to room light for 10 min; the unreacted dye was removed by either ethanol precipitating the DNA or butanol extracting the solution. When the DNA con- centration was 300 pg/mL, the ethidium concentration WBS =2 X M. As mentioned above, a t lower DNA con- centrations the dye concentration was adjusted to ensure an approximately constant dye/DNA ratio.
3.2. Sample Manipulation. The data reported here were obtained from DNA samples that were buffered at pH 7.5 by a 10 mM TRIS, 5 mM EDTA, 50 mM NaCl solution. The DNA solutions were placed in glass mi- croslides (capillaries) (Vitro Dynamics, Inc., Rockaway, N.J.) of several hundred micrometers in thickness. The objective was always focused onto the center of the mi- croslide, in the z (propagation) direction; we could thereby avoid monitoring regions of the sample that might be in direct contact with the glass (see discussion of image plane apertures in section 3.4). Typically, six identical micros- lides, containing DNA samples of differing concentrations, were placed next to one another on the microscope stage, and the objective was focused onto the center of one sam- ple. It was then verified that simple horizontal translation of the stage brought the centers of the other solutions into focus. Data were then collected from each sample; the order in which the samples were examined was varied to reduce the likelihood of introducing systematic errors into the results.
3.3. Data Analysis. Two types of experimentally measured quantities are reported. Of fundmental interest are the relative mutual-diffusion and self-diffusion coef- ficients, Dm(c)/Do and D,(c)/Do. Again, Do is the “bare” diffusion coefficient of an isolated DNA; it is measured as described below. The other experimentally determined parameter that we report is the relative amplitude, G- (O)/ ( i ) 2 (or the relative osmotic compressibility, K ) , asso- ciated with the FCS flpctuation autocorrelation function. For dilute solutions, G ( 0 ) should vary with DNA concen-
Studies of Diffusion in DNA Solutions 4553
tration in a prescribed fashion if the correlation function reflects translational dynamics (see section 2.1).
Diffusion coefficients were determined as follows. The raw FRAP data (M data points) were filtered by using a published algorithm;” the FCS data were given a five-point cubic smooth.31 The smoothed data were then fit to functions that have been shown to describe the time de- pendence of the FRAP or FCS relaxation (see sections 2.1 and 2.3). Curve fits were obtained by calling the IMSL (Houston, TX) least-squares fitting routine ZXSSQ.32
From the best fit to the FCS data, we immediately ob- tain the FCS relaxation time 7 D (see section 2.1), which is proportional to the illuminated area of the sample and inversely proportional to the diffusion coefficient. The time constants were found to be essentially concentration independent if c C 34 pg/mL; hence, we set D,(c < 34 pg/mL) = Do and 7D(c < 34 pg/mL) = .Do. Here 7D0 is the “bare” time constant. We then either calculated the ratio 7D(c)/7Do and used this quantity directly to determine the ratio Dm(c)/Do or used the known value of the beam waist, coo, to determine Dm(c) directly. We have found that both the relative and absolute values of D, are quite reprodu- cible from day to day; error bars were calculated from data obtained in different experiments.
When we use eq 2 or its photobleaching analogue to calculate an absolute diffusion coefficient, we are implicitly assuming that beam divergence is negligible. In fact, however, the laser beam does diverge somewhat over the part of the sample from which we collect light and, therefore, the effective area of the sample under obser- vation is larger than moo2. We anticipate, then, that our absolute values for the diffusion coefficients may be somewhat too small. Our relative values should, however, be unaffected by beam divergence if the microscope stage is kept at the same vertical position for all experiments that are compared.
The procedure that we have followed in our calculations of self-diffusion coefficients from photobleaching data has been described previou~ly .~~ In essence we have used the nonlinear least-squares fitting routine ZXSSQ to fit our experimental curves to the theoretical recovery function given in eq 10. From the best f i t to the data, we obtain the three parameters that characterize the experiment- the percentage of bleach, the percentage of recovery, and the characteristic time to recovery to the steady-state level, 7D. The second parameter is of interest if membrane systems are being studied with FRAP; here, however, we do not have immobile fractions and the recovery is always complete.
The normalized FCS autocorrelation function, d( 7 ) , is defined as the true fluctuation autocorrelation function, G ( 7 ) (see section 2.1), divided by the square of the mean signal, (i)2. The concentration dependence of G ( 0 ) was calculated as follows. The correlator reports unnormalized (not divided by the data accumulation time, 7‘) values for the full (see section 2.1) autocorrelation function, Gexp(k). This full autocorrelation function differs from the fluctu- ation autocorrelation function by the base line, B, = ( i ) 2 = Gexp(m). The base line is also reported by the correlator in unnormalized form. Hence, to monitor the concentra- tion dependence of G ( O ) / (i)2, we compute the quantity
function of DNA concentration. 3.4. FCS Apparatus and Experimental Methods.
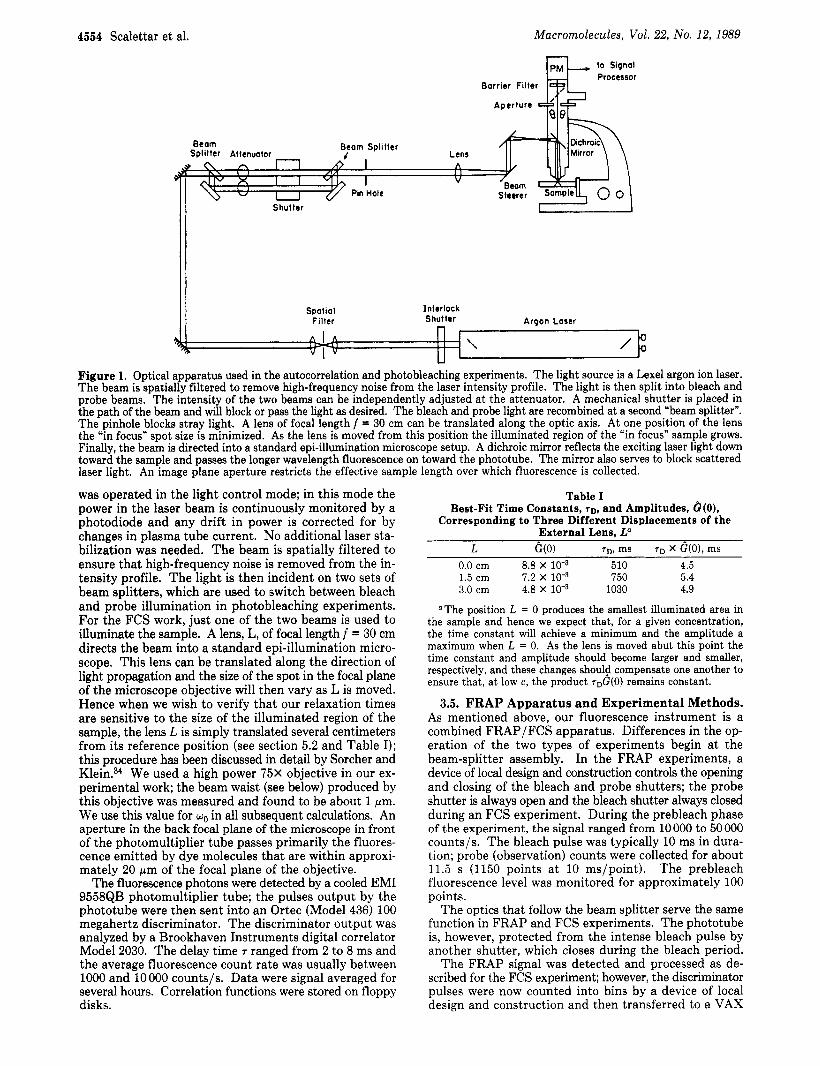
The apparatus used in the experiments is shown sche- matically in Figure 1. The machine is used for both translational photobleaching and correlation spectroscopy. The light source is a 4-W Lexel argon ion laser. The laser
( G e x p ( 0 ) / T - B e x /T) /Bexp/T = (Gexp(0) - Bexp) /Bexp as a
4554 Scalettar et al.
~- &) I
Macromolecules, Vol. 22, No. 12, 1989
- \ /
i
to Signal Processor
Barrier Filler
was operated in the light control mode; in this mode the power in the laser beam is continuously monitored by a photodiode and any drift in power is corrected for by changes in plasma tube current. No additional laser sta- bilization was needed. The beam is spatially filtered to ensure that high-frequency noise is removed from the in- tensity profile. The light is then incident on two sets of beam splitters, which are used to switch between bleach and probe illumination in photobleaching experiments. For the FCS work, just one of the two beams is used to illuminate the sample. A lens, L, of focal length f = 30 cm directs the beam into a standard epi-illumination micro- scope. This lens can be translated along the direction of light propagation and the size of the spot in the focal plane of the microscope objective will then vary as L is moved. Hence when we wish to verify that our relaxation times are sensitive to the size of the illuminated region of the sample, the lens L is simply translated several centimeters from its reference position (see section 5.2 and Table I); this procedure has been discussed in detail by Sorcher and Klein.34 We used a high power 75X objective in our ex- perimental work; the beam waist (see below) produced by this objective was measured and found to be about 1 pm. We use this value for wo in all subsequent calculations. An aperture in the back focal plane of the microscope in front of the photomultiplier tube passes primarily the fluores- cence emitted by dye molecules that are within approxi- mately 20 pm of the focal plane of the objective.
The fluorescence photons were detected by a cooled EM1 9558QB photomultiplier tube; the pulses output by the phototube were then sent into an Ortec (Model 436) 100 megahertz discriminator. The discriminator output was analyzed by a Brookhaven Instruments digital correlator Model 2030. The delay time T ranged from 2 to 8 ms and the average fluorescence count rate was usually between 1000 and 10 000 counts/s. Data were signal averaged for several hours. Correlation functions were stored on floppy disks.
Table I Best-Fit Time Constants, rD, and Amplitudes, G(O) ,
Corresponding to Three Different Displacements of the External Lens, La
Tn, ms x 8(0), ms L G(0) 0.0 cm 8.8 X 510 4.5 1.5 cm 1.2 x 10⁻³ 750 5.4 3.0 cm 4.8 x 10⁻³ 1030 4.9
“The position L = 0 produces the smallest illuminated area in the sample and hence we expect that, for a given concentration, the time constant will achieve a minimum and the amplitude a maximum when L = 0. As the lens is moved abut this point the time constant and amplitude should become larger and smaller, respectively, and these changes should compensate one another to ensure that, at low c, the product T,G(O) remains constant.
3.5. FRAP Apparatus and Experimental Methods. As mentioned above, our fluorescence instrument is a combined FRAP/FCS apparatus. Differences in the op- eration of the two types of experiments begin at the beam-splitter assembly. In the FRAP experiments, a device of local design and construction controls the opening and closing of the bleach and probe shutters; the probe shutter is always open and the bleach shutter always closed during an FCS experiment. During the prebleach phase of the experiment, the signal ranged from 10 000 to 50 000 counts/s. The bleach pulse was typically 10 ms in dura- tion; probe (observation) counts were collected for about 11.5 s (1150 points at 10 ms/point). The prebleach fluorescence level was monitored for approximately 100 points.
The optics that follow the beam splitter serve the same function in FRAP and FCS experiments. The phototube is, however, protected from the intense bleach pulse by another shutter, which closes during the bleach period.
The FRAP signal was detected and processed as de- scribed for the FCS experiment; however, the discriminator pulses were now counted into bins by a device of local design and construction and then transferred to a VAX
Macromolecules, Vol. 22, No. 12, 1989 Studies of Diffusion in DNA Solutions 4555
s x a
! I I l l 1 I l ' l I 1
delay time, r , in milliseconds 0 1000 2000
X
b
I / " " I '
0 500 1000
delay time, r , in milliseconds
x x ', x '/ x
x '., x X ' . , x x
".. x "*"., x
& . , X x '.*,,".,x x * x
.. . .. x
C
i x x ^ x X X ~
X
x
l " ' / " ' I " '
delay time, 7, in milliseconds 0 200 400
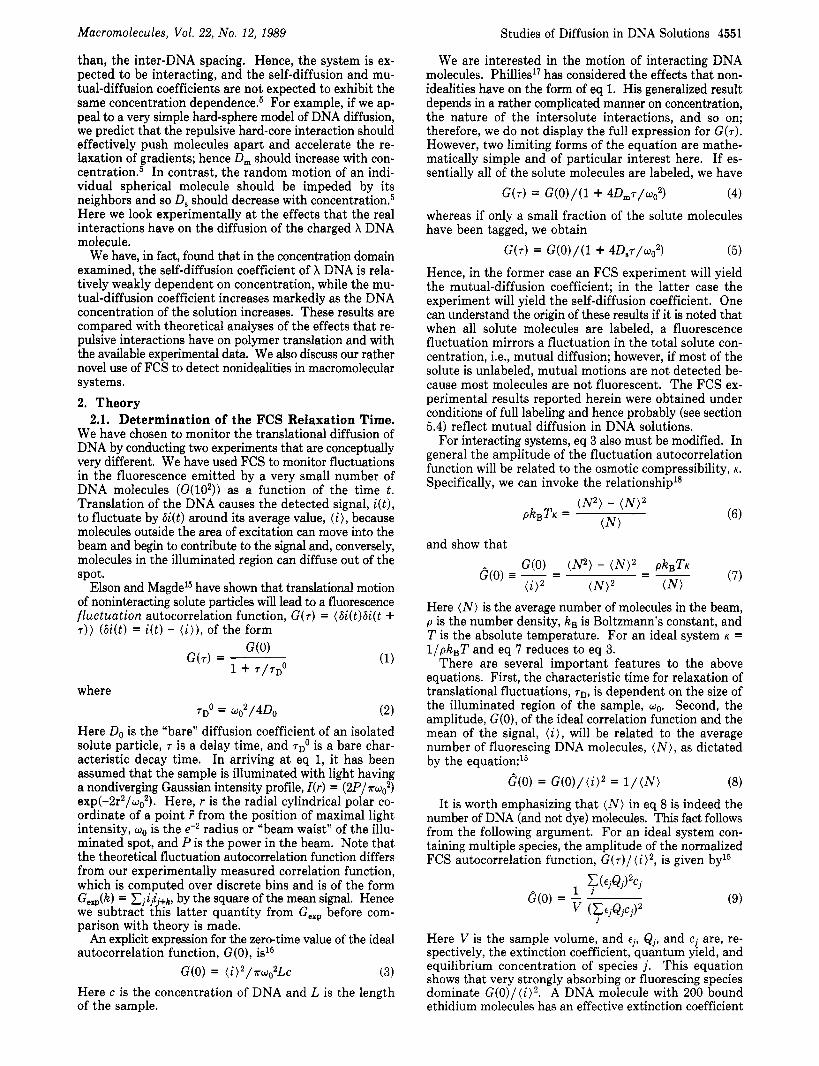
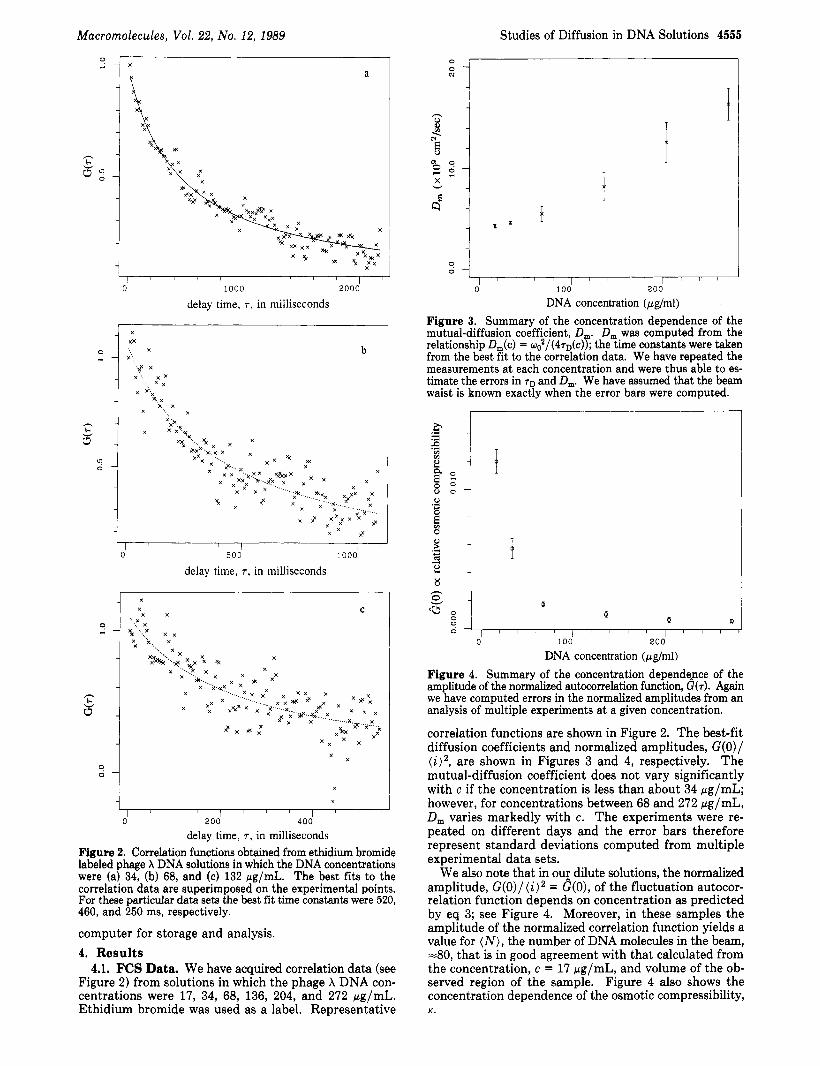
Figure 2. Correlation functions obtained from ethidium bromide labeled phage X DNA solutions in which the DNA concentrations were (a) 34, (b) 68, and (c) 132 pg/mL. The best fits to the correlation data are superimposed on the experimental points. For these particular data seta the best fit time constants were 520, 460, and 250 ms, respectively.
computer for storage and analysis. 4. Results
4.1. FCS Data. We have acquired correlation data (see Figure 2) from solutions in which the phage X DNA con- centrations were 17, 34, 68, 136, 204, and 272 pg/mL. Ethidium bromide was used as a label. Representative
? - 0 N
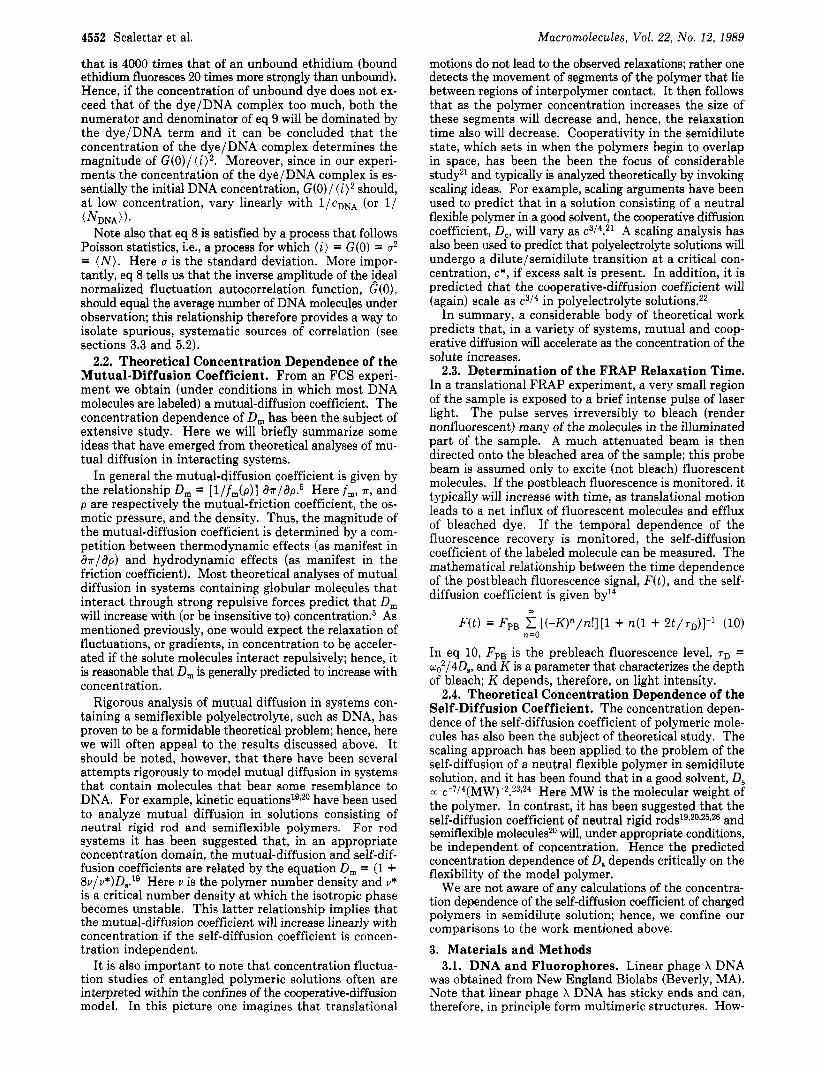
Figure 3. Summary of the concentration dependence of the mutual-diffusion coefficient, D,. D, was computed from the relationship D,(c) = w$/(4sD(c)); the time constants were taken from the best fit to the correlation data. We have repeated the measurements at each concentration and were thus able to es- timate the errors in TD and D,. We have assumed that the beam waist is known exactly when the error bars were computed.
<E. f 0 l l , , , I , , , m, , , I m , , , m
0
0 100 200
DNA concentration (pgJml) Figure 4. Summary of the concentration dependepe of the amplitude of the normalized autocorrelation function, G(r). Again we have computed errors in the normalized amplitudes from an analysis of multiple experiments at a given concentration.
correlation functions are shown in Figure 2. The best-fit diffusion coefficients and normalized amplitudes, G(O)/ (i)2, are shown in Figures 3 and 4, respectively. The mutual-diffusion coefficient does not vary significantly with c if the concentration is less than about 34 wg/mL; however, for concentrations between 68 and 272 gg/mL, D, varies markedly with c. The experiments were re- peated on different days and the error bars therefore represent standard deviations computed from multiple experimental data sets.
We also note that in ouy dilute solutions, the normalized amplitude, G(O)/ ( i)2 = G(O), of the fluctuation autocor- relation function depends on concentration as predicted by eq 3; see Figure 4. Moreover, in these samples the amplitude of the normalized correlation function yields a value for ( N ) , the number of DNA molecules in the beam, 4 0 , that is in good agreement with that calculated from the concentration, c = 17 Fg/mL, and volume of the ob- served region of the sample. Figure 4 also shows the concentration dependence of the osmotic compressibility, K.
4556 Scalettar et al. Macromolecules, Vol. 22, No. 12, 1989
L a m b d a D N A 305 u g / m l ~ _ _
c - # M m x m 1 1 ' 1 I 7-
1 5 0 0 0 100oc 15oco t n e n n , l l i s - c o ? d i
L a m b d a D \ A 1 7 0 u g / m l
0 0 -
l " " l " " I " " l 0 100 200 300
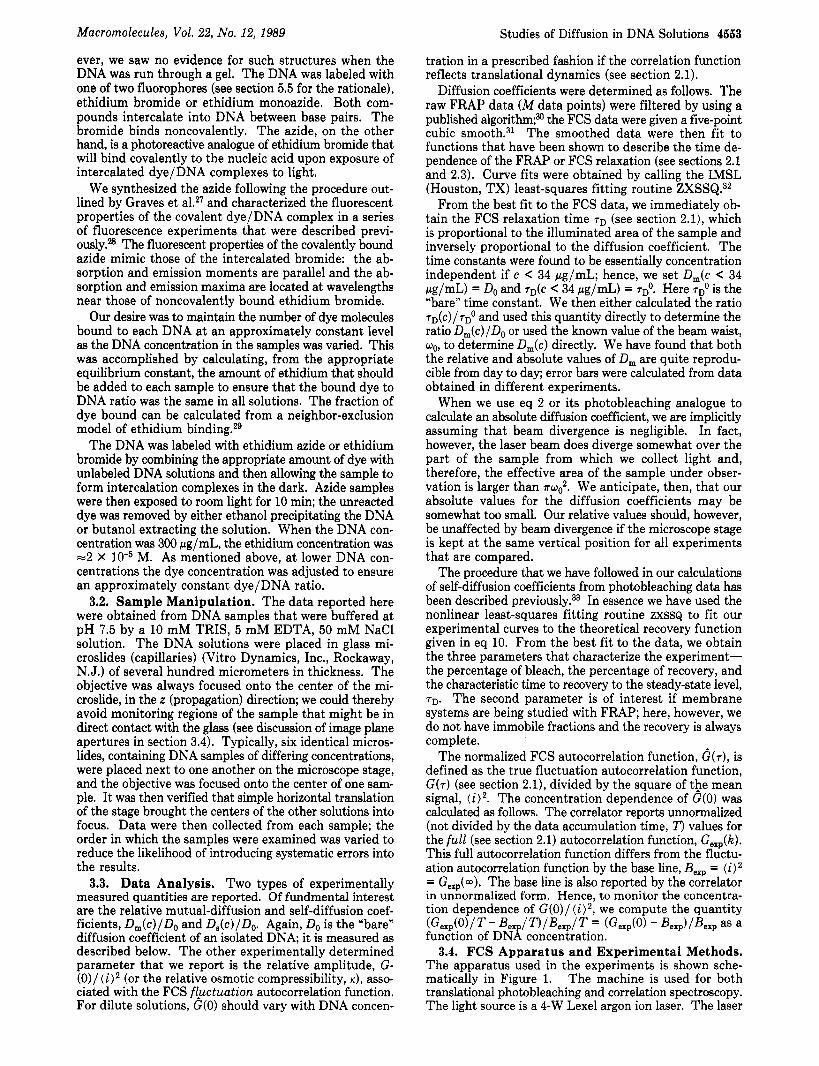
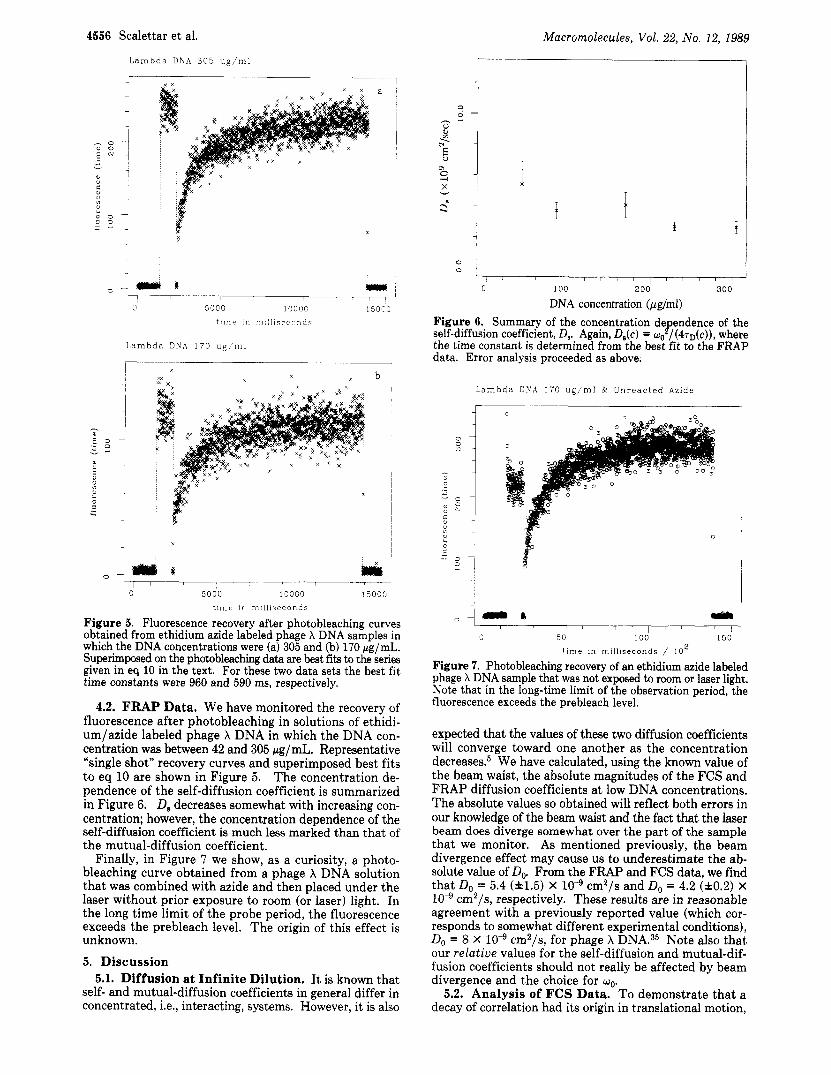
DNA concentration (pglml) Figure 6. Summary of the concentration de endence of the
the time constant is determined from the best fit to the FRAP data. Error analysis proceeded as above
self-diffusion coefficient, D,. Again, D,(c) = w,, P /J4sD(c)), where
L a m b d a D N A 1 7 0 ug/'ml 6r U n r e a c t e d Azide
0 - dim B I l l I
0 5000 10000 15000
t i m e in mi l l i seconds
Figure 5. Fluorescence recovery after photobleaching curves obtained from ethidium azide labeled phage X DNA samples in which the DNA concentrations were (a) 305 and (b) 170 pg/mL. Superimposed on the photobleaching data are best fits to the series given in eq 10 in the text. For these two data sets the best fit time constants were 960 and 590 ms, respectively.
4.2. FRAP Data. We have monitored the recovery of fluorescence after photobleaching in solutions of ethidi- um/azide labeled phage X DNA in which the DNA con- centration was between 42 and 305 pg/mL. Representative "single shot" recovery curves and superimposed best fits to eq 10 are shown in Figure 5. The concentration de- pendence of the self-diffusion coefficient is summarized in Figure 6. D, decreases somewhat with increasing con- centration; however, the concentration dependence of the self-diffusion coefficient is much less marked than that of the mutual-diffusion coefficient.
Finally, in Figure 7 we show, as a curiosity, a photo- bleaching curve obtained from a phage X DNA solution that was combined with azide and then placed under the laser without prior exposure to room (or laser) light. In the long time limit of the probe period, the fluorescence exceeds the prebleach level. The origin of this effect is unknown. 5. Discussion
5.1. Diffusion at Infinite Dilution. It is known that self- and mutual-diffusion coefficients in general differ in concentrated, i.e., interacting, systems. However, it is also
0+- a e I ' I " " /
0 50 100 150
t i m e in mi l l i seconds / 10'
Figure 7. Photobleaching recovery of an ethidium azide labeled phage X DNA sample that was not exposed to room or laser light. Note that in the long-time limit of the observation period, the fluorescence exceeds the prebleach level.
expected that the values of these two diffusion coefficients will converge toward one another as the concentration decrease^.^ We have calculated, using the known value of the beam waist, the absolute magnitudes of the FCS and FRAP diffusion coefficients at low DNA concentrations. The absolute values so obtained will reflect both errors in our knowledge of the beam waist and the fact that the laser beam does diverge somewhat over the part of the sample that we monitor. As mentioned previously, the beam divergence effect may cause us to underestimate the ab- solute value of D,,. From the FRAP and FCS data, we find that Do = 5.4 (f1.5) X cm2/s and Do =. 4.2 (f0.2) X
cm2/s, respectively. These results are In reasonable agreement with a previously reported value (which cor- responds to somewhat different experimental conditions), Do = 8 X cm2/s, for phage h DNA.35 Note also that our relative values for the self-diffusion and mutual-dif- fusion coefficients should not really be affected by beam divergence and the choice for oo.
5.2. Analysis of FCS Data. To demonstrate that a decay of correlation had its origin in translational motion,
Macromolecules, Vol. 22, No. 12, 1989
the data were subjected to the following tests: (i) the time constant had to exhibit an approximately quadratic de- pendence on the size of the illuminated region of sample; (ii) the amplitude of G ( T ) / ( ~ ) ~ had to decrease as the number of fluorescing DNAs increased; and (iii) the time constant, TD, had to be independent of laser power.
The following characteristics of the correlation functions indicate that the data do represent DNA translation. We have already indicated that, in the dilute regime, the normalized amplitude data displayed in Figure 4 exhibit the appropriate concentration dependence. We can also use these amplitude results, in conjunction with our time constant data, to verify that the correlation time constants exhibit the appropriate beam waist dependence. Note that if the data behave as predicted by eq 2 and 3, the product 7D0G(O) = (w:/4DO) X (l/xwo2Lc) = (l/4xcD&) will be independent of the size, q,, of_the illuminated area of the sample.36 Typical amplitude, G(O), and time constant, 7$, data associated with three different sizes of the illuminated region of the sample, i.e., three different positions of the external lens, L (see section 3.4), are ̂displayed in Table I. I t is apparent that the product T$G(O) is approximately wo independent.
Our FCS amplitude data also yield the concentration dependence of the osmotic compressibility, K. As expected, K is a decreasing function of c .
In reference to point iii, we point out that the time constants were found to be independent of laser power; therefore, dye bleaching was not the origin of correlation decay.
5.3. FCS and Nonideal Solutions. FCS has not been extensively exploited in studies of dynamics in interacting macromolecular systems. Andries et al. have used the technique to monitor the concentration dependence of the self-diffusion coefficient of bovine eye lens protein, aL- cry~tallin.~' The FCS data were compared with DLS measurements of the mutual-diffusion coefficient in the same system.
The experimental results obtained here and in the studies by Andries et al. both tend to support Phillies's analysis of the nature of the FCS diffusion coefficient. In the experiments conducted by Andries et al. only a small fraction of the protein was labeled, and it was found that the FCS diffusion coefficient was a decreasing function of concentration. Such behavior is typical of a self-diffusion coefficient. We, on the other hand, have observed that when the macromolecules are fully labeled, the FCS dif- fusion coefficient behaves like a mutual-diffusion coeffi- cient, i.e., it increases with concentration. Moreover, the differences in the FRAP and FCS diffusion coefficients reported here reinforce the conclusion that the FCS ex- periment is sensitive to mutual diffusion in our system. In the future we hope to study solutions containing DNA that is partially labeled with ethidium monoazide (if sufficient signal strength can be achieved) and thereby to monitor self-diffusion with the FCS technique.
5.4. Comparison with Polymer Mutual-Diffusion Data. We will emphasize the similarities and differences between our data and the mutual-diffusion and self-dif- fusion data obtained by Sorlie and Pecora in a recent set of DLS experiments on a 2.3-kilobase restriction fragment.6 The DLS data were detemined as follows. It is known that in the limit of very small scattering vector the DLS re- laxation is governed by mutual diffusion; hence, Sorlie and Pecora have monitored mutual diffusion in their system by acquiring small scattering vector data. They found that the mutual-diffusion coefficient increased with concen- tration and that a linear volume fraction (4) dependence
Studies of Diffusion in DNA Solutions 4557
of the form D, = Do(l + 1.34) provided a reasonable f i t to the data. The authors also point out that standard theories of mutual diffusion3s in dilute solutions of hard spheres predict that D, = Do(l + 1.454) and that their data are in reasonable agreement with these hard sphere models.
Since the concentration dependences of diffusion coef- ficients obtained from entangled polymer solutions are often summarized in terms of power laws, we have chosen to fit our mutual-diffusion data to a function of the form cx; the best fit to our data is obtained when x = 0.65-0.83. The concentration dependence found here is, therefore, somewhat less pronounced than the linear c dependence predicted by Doi and co-w~rkers '~ and Semenov.20 It should also be noted that ow X DNA mutual-diffusion data exhibit a concentration dependence that (perhaps for- tuitously) follows the theoretical concentration scaling law for the cooperative-diffusion coefficient in polyelectrolyte solutions.
From a qualitative standpoint, our X DNA mutual-dif- fusion data are in agreement with the results of Sorlie and Pecora and other workers.- Mutual diffusion generally accelerates in DNA systems as the concentration increases. There is, however, a much more marked variation in D, with c in the 50-kilobase X DNA solutions than in samples that contain the 2.3-kilobase fragment.
There are several possible reasons for this difference. First, it should be realized that we are looking at solutions that are much more congested than the fragment samples. Sorlie and Pecora state that a t their highest DNA con- centration, 450 pg/mL, the volume occupied per DNA is about 85% of that accessible to it a t the given concen- tration. By way of contrast, the X DNA molecules are actually entangled (i.e., overlapping spatially) in most of the solutions studied here. I t is not obvious that the in- terparticle interactions should necessarily influence D, in the same manner in solutions that differ so significantly in their degree of congestion. Second, the salt concen- trations in the two studies were not identical-in the future we hope to vary the salt concentration in our solutions and thereby monitor electrostatic effects on self-diffusion and mutual diffusion.
Light scattering techniques have also been used to study dynamics in entangled xanthan gum, sodium poly- styrenesulfonate, and charged polyacrylamide solutions. These molecules differ in their degree of flexibility but they all, like DNA, are charged. In all of these studies the data were interpreted in terms of the cooperative-diffusion model and hence the results were summarized in terms of scaling laws. The xanthan data yielded D, a c0.143.39 For the sodium polystyrenesulfonate solutions, a transition from dilute to semidilute (i.e., molecular weight dependent to molecular weight independent) diffusive behavior was observed and the diffusion coefficient was found to scale as c0~76-c0~80.40 Finally, for the charged polyacrylamide solutions a scaling exponent of 0.7 was measured.4l Hence, for these polyions the motions accelerate with increasing concentration, as observed here; however, the quantitative relationship between the diffusion coefficient and c varies markedly with the system under study.
We also mention that the concentration dependence of D, has been monitored for several semiflexible neutral polymers. For example, Zero and P e ~ o r a ~ ~ have studied mutual diffusion in poly(?-benzyl L-glutamate) (PBLG)/ 1,2-dichloroethane solutions with the DLS tech- nique. Their data were concentration independent in the semidilute regime and the magnitude of D, was two-thirds of its value at infinite dilution. Kubota and C ~ U ~ ~ and
4558 Scalettar et al. Macromolecules, Vol. 22, No. 12, 1989
tration independence has been postulated for rigid unfortunately, X DNA is semiflexible and, therefore, we do not have a very good reason for asserting that a rigid rod model should describe our system. For now, we simply point out that the data obtained from our X DNA solutions suggest that the self-diffusion coefficient of some semi- flexible molecules may not be strongly concentration de- pendent.
Again we would like to compare our self-diffusion data with that of Sorlie and Pecora. Sorlie and Pecora have used the program Contin to separate the contribution that translational and internal relaxation modes make to the observed correlation data. By following this procedure, they were able to deduce that D, = D&1- 1.224). Thus, self-diffusion is inhibited in the fragment samples as the concentration of DNA increases. Moreover, their self- diffusion result is again in quantitative accord with a simple hard-sphere model.
Since the X DNA self-diffusion coefficient does decrease with concentration, the qualitative behavior of D, is similar in the X and fragment DNA systems. Quantitative dif- ferences in the data again may reflect the fundamentally distinct properties of the samples. It is also possible, as Sorlie and Pecora note, that internal motions of the DNA, which contribute to large scattering vector DLS data, could have “contaminated” their self-diffusion results.
6. Conclusions We have monitored the concentration dependence of
self-diffusion and mutual diffusion over the concentration range 17-305 pg/mL in a fluorescently labeled phage X DNA system. The mutual-diffusion coefficient is found to increase markedly with concentration for the samples studied here; in contrast, the self-diffusion coefficient of phage X DNA is found to be weakly concentration de- pendent. In this work we have also experimentally dem- onstrated that, in a fully labeled DNA system, the FCS diffusion coefficient exhibits a concentration dependence that is characteristic of a mutual-diffusion coefficient. Hence, FCS can indeed provide a powerful method for detecting nonidealities in macromolecular systems.
Acknowledgment. We are pleased to acknowledge helpful conversations with James Abney, Daniel Axelrod, Michael Saxton, and Michael Schurr. Mike Saxton de- serves particular thanks for his help with the maintenance of the photobleaching instrument and for his extensive work on the development of the photobleaching data analysis programs. This work was supported in part by NIH Grant GM30781 and the Office of Energy Research, Office of Health and Environmental Research of the U S . Department of Energy, under Contract DE AC03- 76SF00098 and by an appointment to the Alexander Hollaender Distinguished Postdoctoral Fellowship Pro- gram supported by the US . Department of Energy, Office of Health and Environmental Research, and administered by Oak Ridge Associated Universities.
References and Notes
Russo et al.44 studied mutual diffusion in PBLG/di- methylformamide solutions and found D, to be an in- creasing function of concentration (although a decrease in D, at high concentration was also detected by Kubota and Chu). We also note that Keep and P e ~ o r a ~ ~ found that mutual diffusion in poly(n-alkyl isocyanate) solutions slows as the concentration increases.
Finally, we have assumed that translational motions of the DNA molecules are the origin of the correlation decay detected here. It is also possible that internal motions of the DNA molecule are manifest in our FCS data. However, the time scales associated with the relaxations detected here do not tend to support this alternate interpretation. If the empirical Callis-Davidson formula,@ which is valid for dilute solutions, is invoked, it can be shown that the internal modes of X DNA relax on the time scale of about 40 ms or faster. Hence unless concentration effects markedly lengthen internal relaxation times, and current data indicate that they do not,“ the decays detected here, which were all longer than 160 ms, probably are not in- ternal in origin. Moreover, eq 2 and 3 were derived under the assumption that translational diffusion leads to the correlation decay; the fact that these relationships are reasonably obeyed also lends support to our translational interpretation.
5.5. Analysis of FRAP Data. We have indicated that a covalently bound fluorophore was utilized in the FRAP experiments. Our choice of a covalent fluorophore was motivated by a concern that diffusion of small amounts of noncovalently bound dye can distort the temporal de- pendence of the FRAP recovery. Indeed, Icenogle and E1s0n*~ have analyzed the effects that the diffusion of unbound ethidium bromide will have on the DNA recovery curve and have determined that small amounts of unbound dye can, in principle, appreciably distort the data. They argue that for the dye/DNA system, the FRAP diffusion coefficient should essentially be a weighted average of the dye and polymer-diffusion coefficients: hence
DFRAP = XDNAjd@DNA/dye + Xdy$dye (11)
Here the x’s represent equilibrium mole fractions of the DNA/dye complex and unbound dye. Since the dye and DNA diffusion coefficients differ by several orders of magnitude, eq 11 would imply that even small quantities of unbound dye will significantly accelerate the temporal dependence of the FRAP recovery. Moreover, the ex- perimental data of Icenogle and ElsonZ9 indicate that this phenomenon is manifest in the ethidium bromide/DNA system. Here we wished to avoid this complication and so we have attached the fluorophore covalently to the DNA.
The reader may be concerned that diffusion of small amounts of unbound ethidium will also distort the time course of the FCS decay. It might also be supposed that the kinetics of the interaction of the dye and DNA will affect the correlation function, since there is a 20-fold increase in the fluorescence of ethidium upon binding to DNA. However, it has been shown that if the DNA molecules are fairly heavily labeled with dye the correlation function obtained from the ethidium bromide/DNA sys- tem will be dominated by diffusion of the dye/DNA com- p l e ~ . ~ ~ Hence under the current experimental conditions, the correlation data reflect the diffusive motion of the dye/DNA compex and not kinetic effects or diffusion of ethidium alone.
5.6. Comparison with Polymer Self-Diffusion Data. The self-diffusion coefficients measured here exhibit a fairly weak dependence on concentration. Such concen-
Rill, R. L. Proc. Natl. Acad. Sci. U.S.A. 1986, 83, 342. Livolant, F.; Maestre, M. F. Biochemistry 1988, 27, 3056. Rill, R. L.; Hilliard, P. R., Jr.; Levy, G . C. J. Biol. Chem. 1983, 258, 250. Wijmenga, S. S.; Maxwell, A. Biopolymers 1986, 25, 2173. Pusey, P. N.; Tough, R. J. A. In Dynamic Light Scattering: Applications of Photon Correlation Spectroscopy; Pecora, R., Ed.; Plenum Press: New York, 1985; pp 85-179. Sorlie. S. S.: Pecora. R. Macromolecules 1988.21. 1437. Voordouw, G.; Kam, Z.; Borchov, N.; Eisenberg, H. Biophys. Chem. 1978, 8, 171. Newman, J.: Swinney, H. L.; Berkowitz, S. A.; Day, L. A. Riochemistry 1974, 13, 4832.

Macromolecules 1989,22,4559-4573 4559
(9) Soda, K.; Wada, A. Biophys. Chem. 1984,20, 185. (10) Lee, W. I.; Schmitz, K. S.; Lin, S.-C.; Schurr, J. M. Bio-
polymers 1977, 16, 583. (11) Schurr, J. M.; Schmitz, K. S. Annu. Rev. Phys. Chem. 1986,
37, 271. (12) Fulmer, A. W.; Benbasat, J. A.; Bloomfield, V. A. Biopolymers
1981,20, 1147. (13) Fried, M.; Crothers. D. M. Nucleic Acids Res. 1981. 9. 6505. (14) Axelrod, D.; Koppei, D. E.; Schlessinger, J. S.; Webb, W. W.
(15) Elson, E. L.; Magde, D. Biopolymers 1974, 13, 1. (16) Magde, D.; Elson, E. L.; Webb, W. W. Biopolymers 1974, 13,
Biophys. J . 1976, 16, 1055.
29. (17) Phillies, G. D. J. Biopolymers 1975, 14, 499. (18) McQuarrie, D. A. Statistical Mechanics; Harper and Row:
(19) Doi, M.; Shimada, T.; Okano, K. J. Chem. Phys. 1988,88,4070. (20) Semenov, A. N. J. Chem. SOC., Faraday Trans. 2 1986,82,317. (21) Schaefer, D. W.; Han, C. C. In Dynamic Light Scattering:
Applications of Photon Correlation Spectroscopy; Pecora, R., Ed.; Plenum Press: New York, 1985; pp 181-243.
(22) Odijk, T. Macromolecules 1979, 12, 688. (23) de Gennes, P. G.; Leger, L. Annu. Reu. Phys. Chem. 1982,33,
49. (24) Tirrell, M. Rubber Chem. Technol. 1984,57, 523. (25) Doi, M.; Edwards, S. F. J. Chem. SOC., Faraday Trans. 2 1978,
(26) Doi, M.; Edwards, S. F. J. Chem. Soc., Faraday Trans. 2 1978,
(27) Graves, D. E.; Yielding, L. W.; Watkins, C. L.; Yielding, K. L.
New York, 1976; pp 268-270.
74, 560.
74, 918.
Biochim. Biophys. Acta 1977, 479, 98. (28) Scalettar, B. A.; Selvin, P. R.; Axelrod, D.; Hearst, J. E.; Klein,
M. P. Biophys. J. 1988,53, 215. (29) Icenogle, R. D.; Elson, E. L. Biopolymers 1983,22, 1919, and
companion paper. (30) Marchand, P.; Marmet, L. Reu. Sci. Znstrum. 1983,54, 1034. (31) Savitzky, A.; Golay, J. E. Anal. Chem. 1964, 36, 1627. (32) IMSL Inc. User’s Manual ZMSL Library 1984, 4, ZXSSQ-1. (33) Packard, B. S.; Saxton, M. J.; Bissell, M. J.; Klein, M. P. Proc.
Natl. Acad. Sci. U.S.A. 1984, 81, 449. (34) Sorcher, S. M.; Klein, M. P. Reu. Sci. Znstrum. 1980, 51, 98. (35) Thomas, J. C.; Allison, S. A.; Schurr, J. M. Biopolymers 1980,
(36) Koppel, D. E.; Axelrod, D.; Schlessinger, J.; Elson, E. L.; Webb,
(37) Andries, C.; Guedens, W.; Clauwaert, J. Biophys. J. 1983,43,
(38) Batchelor, G. K. J. Fluid Mech. 1976, 74, 1. (39) Southwick, J. G.; McDonnell, M. E.; Jamieson, A. M.; Black-
well, J. Macromolecules 1979, 12, 305. (40) Koene, R. S.; Mandel, M. Macromolecules 1983, 16, 220. (41) Muller, G. In Physical Optics of Dynamic Phenomena and
Processes in Macromolecular Systems; Sedlacek, B., Ed.; Walter de Gruyter & Co.: New York, 1985; pp 117-127.
(42) Zero, K. M.; Pecora, R. Macromolecules 1982, 15, 87. (43) Kubota, K.; Chu, B. Biopolymers 1983, 22, 1461. (44) Russo, P. S.; Karasz, F. E.; Langley, K. H. J. Chem. Phys.
1984,80, 5312. (45) Keep, G. T.; Pecora, R. Macromolecules 1988,21, 817. (46) Callis, P. R.; Davidson, N.; Biopolymers 1969, 8, 379.
19, 1451.
W. W. Biophys. J. 1976, 16, 1315.
345.
Compact Polymers
Hue Sun Chan and Ken A. Dill* Department of Pharmaceutical Chemistry, University of California, San Francisco, California 94143. Received February 17, 1989; Revised Manuscript Received April 25, I989
ABSTRACT: The compact conformations of polymers are important because they are the principal con- figurations of the native states of globular proteins. We study the compact polymeric state by exhaustive computer enumeration of short-chain configurations on two-dimensional square lattices. The number of accessible configurations is found to depend on two factors: (i) configurational freedom and excluded volume, extensively studied in the past, and (ii) a “shape” entropy of the compact object. In addition, we study the probability of loop formation in compact polymers and topological correlations among pairs of loops. We find that there is an intrinsic steric driving force for loops to be configured into helices and antiparallel sheets in compact chains, similar to that we have recently found for more open chains. Also, we study in detail the few conformations that remain after the enormous reduction of configurational space upon increasing the compactness. Those few conformations are overwhelmingly dominated by secondary structures: helices, antiparallel and parallel sheets, and turns. This dominance increases with chain length. It is found to be exceedingly difficult to configure a compact chain with less than about 50% secondary structure. This suggests that the driving force for formation of secondary structures in proteins may be nonspecific steric interactions rather than hydrogen-bonding or other specific interactions.
1. Introduction The compact conformations of a chain molecule com-
prise a very small but important subset of all the physically accessible conformations. Their importance derives from the fact that the native conformations of all globular proteins are compact. By “compact”, we refer to those configurations of single-chain molecules which are tightly packed, i.e., fully contained within a volume of space (a box) with the minimal (or near minimal) surface/volume ratio. In contrast, by “open”, we refer to the complete superset of all accessible conformations, including those that are compact. Relatively little attention has previously been directed toward the set of compact conformations of polymers. Considerably more effort in polymer science has
*To whom inquiries about this paper should be addressed.
focused on the more open conformations of chains, because they are far greater in number and because they are the predominant conformations of chains in solution or in the bulk. Our purpose in this paper is to explore in some detail the nature of the compact conformations and to show how they differ from the larger superset of all possible con- formations. Our purpose here is served by exhaustive simulation of every possible conformation of short chains on two-dimensional square lattices. There are three ad- vantages of studies in two dimensions for our present purposes. First, certain predictions can be compared with a significant literature dating back to the work of Orr’ in 1947 on exhaustive lattice simulations of open conforma- tions, most of which have been in two dimensions. Second, we can explore greater chain lengths for a given amount of computer time. Third, the surface/volume ratio, a principal determinant of the driving force for a protein to
0024-9297/89/2222-4559$01.50/0 0 1989 American Chemical Society