Embed Size (px)
Citation preview
Organisation for Economic Co-operation and Development
European Commission
Local Economic and Employment Development Programme
FRAMEWORK FOR INFORMATION EXCHANGE IN LOCAL DEVELOPMENT
(FIELD)
PART I
FRAMEWORK FOR INFORMATION EXCHANGE IN LOCAL DEVELOPMENT (FIELD)
COUNTRY REPORTS
DENMARK
FRANCE
GERMANY
SPAIN
UNITED KINGDOM

TABLE OF CONTENTS
3
TABLE OF CONTENTS
DENMARK: SUMMARY REPORT GREATER COPENHAGEN AND ZEALAND
by Berta Rato, Taurus Institute, University of Tier, Germany ........................................................................ 5
1. The enablers - governance framework ..................................................................................................... 5 1.1. The enablers - governance in the Region Zealand and Copenhagen labour market ......................... 6 1.2. The enablers - governance in the economic regional system ............................................................ 7
2. Trends in the Danish and the Region of Zealand and Copenhagen economy and labour market ............ 7 3. Local strategies (drivers) and policy actions ............................................................................................ 9
3.1. The labour market policy .................................................................................................................. 9 3.2. The economic development policy - The Capital Region Copenhagen .......................................... 12 3.3. Other drivers of performance at the national level .......................................................................... 15 3.4. Information to support policy .......................................................................................................... 15
4. Summary and Conclusions .................................................................................................................... 19 5. Literature ................................................................................................................................................ 20
FRANCE: THE CASE OF GREATER LILLE
by Corinne Nativel, Université de Franche-Comté, France .......................................................................... 21
1. The territorial position and economic challenges facing the Lille metropolitan area ............................ 21 2. The governance system .......................................................................................................................... 22 3. Lille‟s key regeneration initiatives: activating local development drivers ............................................ 23
3.1. Euralille ........................................................................................................................................... 23 3.2. European Capital of Culture (2004) ................................................................................................ 24 3.3. Delta 3 (logistics platform) .............................................................................................................. 25 3.4. Programme de Rénovation Urbaine ................................................................................................ 25 3.5. CréatiVallée ..................................................................................................................................... 26 3.6. Finorpa ............................................................................................................................................ 26
4. Identifying the „enablers‟ ....................................................................................................................... 26 5. System of indicators ............................................................................................................................... 27 6. Learning points ...................................................................................................................................... 29 7. References .............................................................................................................................................. 30
GERMANY: SUMMARY REPORT BRANDENBURG
by Hugh Mosley, Social Science Research Centre Berlin (WZB), Germany ................................................. 31
1. Governance context ............................................................................................................................... 31 2. Trends in local labour market and economic performance .................................................................... 32
2.1. Indicator system for employment and economic development ....................................................... 33 3. Local strategies (drivers) and policy actions .......................................................................................... 34
3.1. Labour market ................................................................................................................................. 34 3.2. Economic development ................................................................................................................... 38
4. Summary and Conclusions .................................................................................................................... 40 5. Literature ................................................................................................................................................ 42
TABLE OF CONTENTS
4
SPAIN: THE CASE OF CANTABRIA REGION
by Carlos Díez, INFYDE, Spain .................................................................................................................... 43
1. Territorial development and socio economic challenges of Cantabria Region ...................................... 43 2. Cantabria region Governance system .................................................................................................... 44 3. Key drivers fostering Cantabria region transformation ......................................................................... 45
3.1. R&D+I Regional Plan 2006-2010 ................................................................................................... 45 3.2. EQUALCREA ................................................................................................................................. 46 3.3. EMPRECAN ................................................................................................................................... 47 3.4. ESTER ............................................................................................................................................. 47
4. Enablers contributing to Cantabria region transformation ..................................................................... 48 4.1. Leadership ....................................................................................................................................... 48 4.2. Social Capital .................................................................................................................................. 49 4.3. Partnership ....................................................................................................................................... 49
5. Indicators system ................................................................................................................................... 50 6. Learning points ...................................................................................................................................... 50 7. References .............................................................................................................................................. 51
UNITED KINGDOM: THE CASE OF GREATER MANCHESTER
by Kieron Hyams, Ove Arup & Partners Ltd, United Kingdom .................................................................... 53
1. Introduction ............................................................................................................................................ 53 1.1. The FIELD Project .......................................................................................................................... 53 1.2. The Mission to Manchester ............................................................................................................. 53 1.3. Manchester: Structural and Local Policy Context ........................................................................... 54
2. Local Development Information in Manchester .................................................................................... 56 2.1. Introduction ..................................................................................................................................... 56 2.2. Inventory of Local Policy Instruments ............................................................................................ 56 2.3. Moving Towards a Dashboard of Indicators ................................................................................... 63 2.4. Concluding Remarks ....................................................................................................................... 68
3. Applying the Conceptual Framework to Manchester ............................................................................ 68 3.1. Introduction ..................................................................................................................................... 68 3.2. Legacy (History) ............................................................................................................................. 69 3.3. Output Trends in Local Development Performance ........................................................................ 70 3.4. Drivers of Performance ................................................................................................................... 70 3.5. Enablers (Institutional and Social Capacities) ................................................................................. 71 3.6. Policy Actions on Drivers ............................................................................................................... 71
Figures
Figure A. Greater Manchester ............................................................................................................... 54 Figure B. GVA Growth Framework ...................................................................................................... 65 Figure C. FIELD conceptual framework ............................................................................................... 69
DENMARK
5
DENMARK
SUMMARY REPORT GREATER COPENHAGEN AND ZEALAND
by Berta Rato, Taurus Institute, University of Tier, Germany
Copenhagen and Zealand are two neighbouring areas in Denmark. However, their analysis regarding
employment and economic development policies has to follow a different methodology. In what concerns
employment, we assist in the two regions to a strong integration of their labour markets, this has been
materialized by the creation of a single employment authority with a common employment policy. As for
the economic development policy, despite the inarguable strong economic relations between both areas,
they have separated administrative and planning institutions – the Growth Fora, with specific economic
analysis, strategies, action plans and budgets. As a consequence, their policies and information system
cannot be presented in an integrated way. The focus will be on the Copenhagen Greater Region because of
its particular role as development engine. The strong functional integration of these two areas with the
region of Skåne in South Sweden, in a cross-border region named the Øresund region, implies in some
parts to consider also the later on the analysis.
The content of this report results from a meeting with the Employment Region Copenhagen &
Zealand and the Zealand Business Development authorities, which took place on the 2nd and 3rd of
October, 2008, a phone interview with the Growth Forum Greater Copenhagen and on several documents
related to the employment and economic policies of Denmark and in particular of the regions Copenhagen
and Zealand.
In section 1, it will be presented the system of enablers, the regional institutions responsible for the
implementation of economic and employment policies. Section 2 will describe the economic and
employment trends of Denmark, to better position both regions in the national context, and of the two
regions in particular. Section 3 will describe the key-drivers of performance and the corresponding policy
actions. Section 4 presents some final results and conclusions.
1. The enablers - governance framework
Denmark has just undergone in 2007 a major reform of its overall economic and social strategy, as
well as of the structures of regional and local government - the Danish Reform Programme. Its main aim
was to improve the long-term potential for growth and employment within the framework of good social
conditions and sound environmental and sustainable fiscal development, strengthening the decentralisation
of the public sector and making it more adjusted to the new challenges of globalisation. Basically, the
Programme follows in a close way the EU Guidelines on the social, economical, innovation and
environmental domains1.
One of the main impacts of the Reform was on the structure of local and regional government - the
Municipal Reform -, with the reduction of the number of local authorities from 275 to 98 and the number
1 The Danish Government, 2007.
FRAMEWORK FOR INFORMATION EXCHANGE IN LOCAL DEVELOPMENT
6
of intermediate-level units from 14 Counties (Amter) to five large regions. The competencies of the local
and regional authorities, in particular of the employment regions and of the municipalities, have been
deeply changed and for some aspects, like employment, more strengthened.
1.1. The enablers - governance in the Region Zealand and Copenhagen labour market
There are three political and administrative levels of the set-up of the employment service in
Denmark:
1. The national level - the Minister for Employment, responsible for the labour market policy,
namely for the decision of priorities and targets. The Minister is assisted in his attributions by the
National Employment Council.
2. The Employment Regions - there are four employment regions in Denmark. The Regional
Employment Region of Copenhagen and Zealand is one of them. Their main activities are: 1)
Monitoring the results and effects of the Job Centres, 2) Benchmarking Job Centre within the
region against each other, 3) Analysing the development on the regional labour market
(“bottleneck-situations), and making sure that knowledge about the regional labour market is
available for the Job Centres, 4) Making an annual analysis report on the results in the region, 5)
Making an annual contract with the Minister for Employment, 6) Secretariat for the Regional
Employment Council2. The Employment region consists of an administrative component and a
council. The Regional Employment Council consists of 43 members, such as trade unions,
employers‟ organisations, municipalities and organisations for the disabled etc., their role is to
monitor the employment system and to bring new ideas and knowledge3.
3. The local level includes in the region of Zealand and Copenhagen 44 job centers, 5 of these are
pilot job centers4 and 44 local employment councils, one for each job center. The job centers are
responsible for having direct contact with jobseekers and enterprises. They are located at the
municipalities. There are two categories of service, the Municipal service (included in the
Municipal budget), supporting those who do not have an unemployment insurance, and the State
service, for those who do. The pilot job centres are being used to test the possibility of
transferring sole management of job centres to the municipalities. The local employment councils
monitor the effects and outcomes of the specific employment measures being taken by job
centers and provide advice on possible improvements. The Social Partners and the municipal
councils are represented in the Local Employment Council.
The labour market system follows a top-down approach: the priorities and targets decided by the
Minister of Employment are negotiated with the National Labour Market Authority, the Employment
Regions and the Regional Employment Councils, namely the definition of regional objectives. These are
then translated into a contract between the Ministry and the other actors, with specific objectives and
targets for each region. Finally, at the local level, the municipality and the Employment Region prepare an
annual overall employment plan for each job centre. This plan defines quantitative targets, priorities and
the budget for employment activities. However, it is up to the job centre to decide which strategy to
implement, for instance regarding contact with jobseekers, employability enhancement programmes or
specific services to enterprises. In cases where a job centre performs badly sanctions may be taken by the
Employment Region. The top-down approach has the consequence that the local and the regional level use
2 Cf. Merete Grønlund, Employment Region Copenhagen & Zealand.
3 Newinsight, 2008, p.10.
4 In Denmark there is a total of 77 job centres, 14 pilot job centres and 91 local employment councils.
DENMARK
7
the system of outcome indicators measure their performance in relation to the main targets and to present
their annual results.
Another significant characteristic of the Danish labour market model is the co-operation between
trade unions, employers' organisations and the State - if the social partners are able to regulate the pay and
working conditions themselves, the State does not interfere. The result is a flexible and well-mediated
labour market model5. This co-operation is also visible when the State has to prepare legislation relative to
the labour market. The social partners are consulted to appraise the new legislation or in some cases they
can participate directly in the decision making process through their representation in the central or local
councils.
1.2. The enablers - governance in the economic regional system
The most important actors for regional development are the recently established Growth Fora
(Vaekstforum) – the case study region has two Growth Fora – the Growth Forum of the Copenhagen
Capital Region and the Growth Forum of Zealand. Their primary tasks are to: 1) Develop a regional
business development strategy, 2) Monitor regional and local conditions for growth, 3) Put forward
propositions to the regional council for the use of regional development funds and to the State for the use
of European funds.They have 20 members from the regions, the municipalities, the business sector,
knowledge and educational institutions as well as representatives of both employees and employers.
The regional business development strategy must correspond to the national Globalisation Strategy
(Cf. Section 3), but it must also reflect the particularities of the region.
At the national level, the Danish Growth Council coordinates the funds and activities to be supported
by the National Globalisation Strategy funding scheme, EU financed programmes and the regional
business development initiatives. It also supports the Government to define the overall priorities of the
Strategic Reference Framework for the EU funds.
The Government has established partnership agreements on growth and business development with
each of the regional growth fora. The regional partnership agreements will help to implement the
Globalisation Strategy in all regions of the country, in coordination with the regional growth and business
development efforts. Partnership agreements have been concluded for the following areas: Education and
Labour Supply, Better Growth Conditions for New and Small Enterprises, Innovation, Knowledge
Dissemination, Marketing of Denmark – Attraction of Investment and Tourism, Energy, Rural Areas and
Areas facing structural difficulties and Cross-Border Cooperation. The partnership agreements will apply
for the period 2007-2009. The government and the regional growth fora will monitor the implementation
of the agreements on an ongoing basis and discuss the need for adjustments every year6.
2. Trends in the Danish and the Region of Zealand and Copenhagen economy and labour market
In the last decade the Danish economy has been developing in a very positive way, with a constant
growth of the GDP, which in 2006 reached the 3.5 per cent. This growth has been sustained by a sound
economy and a growing trade surplus. The number of companies and the annual turnover have been
progressing steadily, in particular in the knowledge intensive service industries.
The regions of Zealand and Copenhagen follow the overall country economic trends and are in fact
the engine of Denmark's economic growth. Only the Capital Region is responsible for 40% of the Danish
5 Sorensen, quoted by Hendeliowitz, Jan, 2008, p. 21.
6 The Danish Government, 2007.
FRAMEWORK FOR INFORMATION EXCHANGE IN LOCAL DEVELOPMENT
8
GDP and 38% of the state taxes. Further, more than 80 per cent of the knowledge intensive service
industries are located in the region of Zealand and Copenhagen.
The importance of the different economic sectors has changed considerably since the sixties, the
agriculture and fishing sector has registered a strong decease in the number of companies and employees,
the manufacturing sector has been reduced by half, whilst private services in general and public services in
particular have registered an outstanding growth. The expansion of the public services, from 11 per cent in
1960, to 29 per cent in 2006, can be explained in part by the growing participation of women in the labour
market and therefore the need to provide other services, such as child care.
The base of the regional economy are five different clusters. They have the particularity of being for
the whole region of Øresund, that is embracing as well the Swedish region of Skåne: 1) Food Science
cluster, includes more than 400 official members organised according to the following profiles -
traditional food; health profile; functional food profile; lifestyle profile; and traditional
pharmaceutical profile 2) Medicine and Biotech cluster, employing around 40,000 people of
which 4,000 are researchers, 3) Logistics cluster, the cluster includes more than 1,200 registered
members, from infrastructure owners, logistics providers, manufacturing companies, local,
regional and central government, consultants, and universities, 4) IT& Telecommunications
cluster, with over 104,000 employees and more than 10,000 companies, 5) Environmental Science
cluster, involving approximately 23,300 persons and an annual turnover of 23 billion DKK7.
One of the main pillars of the Danish economic growth is the policy of investment in research,
development and innovation, with Denmark being one of the EU countries with a higher percentage of
investment in R&D (around 2.6 per cent of the GDP in 2003 vs. 1.85 per cent in the EU), with the private
sector being responsible for 1.83 per cent. The investment policy is complemented by the support given to
education – Denmark has one of the highest expenditures on education and training in the EU (8.5 per cent
of the GDP vs. 5.2 per cent in the EU, 2002) and the percentage of students completing higher
education is also one of the highest in Europe (42 per cent, in 2004).
Entrepreneurship contributed as well to the increase in the number of companies. Around 16,000 new
firms start activity every year, of which more than 6000 are located in the Capital region. In addition,
around 5 per cent of adult Danes can be considered as entrepreneurs. However, in comparison with other
Nordic countries the growth of these companies, in terms of turnover, is not so positive8.
The continuous economic growth of the Danish economy together with a very efficient employment
policy has had a significant impact on the labour market, with an employment rate of 76.8 per cent in 2007,
a female employment rate of 73.2 per cent and an unemployment rate of 1.7 per cent in April 2008. In
relation to most countries in Europe, youth unemployment is rather low – only 1.2 per cent. The region
Zealand and Copenhagen follow more or less the same pattern, even with more positive results: in August
2008, they registered only around 1.3 per cent of unemployment.
The Danish labour market model (also called the "flexicurity" model) is consensually considered to be
responsible for these good results. This model allows the combination of a high level of compensation to
the unemployed (security), maintaining the Welfare State, with the facility of employers to contract and to
lay off (flexibility).
7 www.oresundsregionen.org.
8 The Danish Reform Strategy, October 2005, p.12.
DENMARK
9
Therefore, Denmark is very well positioned in regards to the achievement of the objectives of the
Lisbon strategy: i) the investment in R&D has almost reached the target of three per cent, ii) the investment
in human capital is significant; (iii) the policies to promote entrepreneurship seem to be fruitful; (iv) the
employment indicators are by far above the EU targets by 2010 – the objectives of high employment,
significant employment of women and older people, and low unemployment and inactivity have all been
met.
However, the constant economic growth, the almost full employment in the labour market and the
ageing of the population bring a new challenge to the social and economic policies - how to increase the
labour force in order to be able to keep pace with the demands of the economic tissue?
3. Local strategies (drivers) and policy actions
The economic development strategy as well as the labour market strategy for Denmark and for the
regions must be considered within two frameworks:
a) Denmark's Strategic Reference Framework for 2007-2013. The overall objective of the Danish
structural funds programmes is to increase growth and to realise the Lisbon objectives by
preparing Danish enterprises for globalisation and improving regional growth conditions through
targeted efforts in: 1) Human resources development, 2) Establishment and development of new
enterprises, 3) Innovation, knowledge sharing and knowledge building, 4) Use of new
technology.
b) The National Globalisation Strategy, a complementary funding scheme to support initiatives
contributing to ensure that Denmark will maintain a healthy, economic position in a globalised
economy. Four key-areas were contemplated: Education, Better and innovative research, More
entrepreneurs, Strengthening general abilities in innovation and adaptability9.
The globalisation strategy is implemented through regional partnership agreements between the
Growth fora, the national level (formally the national government) and the Danish Enterprise and
Construction Authority, as the authority responsible for the strategic coordination with other relevant
ministries. In this way, all parties are committed to the objectives of business development and the labour
market policy.
3.1. The labour market policy
3.1.1. Local strategies (drivers of performance) for an effective labour market
The most important performance driver of the Danish labour market policy is the Flexicurity Model
already referred to. In practice, the overall policy priority is the maintenance of a very flexible labour
market, with a minimum of bottleneck-situations, namely allowing employers to dismiss their employees
when necessary. On the one hand the State assists the unemployed, by means of a generous financial
support, complemented by activation measures to allow the unemployed to return to the labour market as
quickly as possible, e.g. individual coaching, measures to improve his/her qualifications. On the other hand
the unemployed are under the obligation to be available for work.
These general objectives are translated into the annual national performance targets set by the
Minister of Employment.
9 Newinsight, 2008.

FRAMEWORK FOR INFORMATION EXCHANGE IN LOCAL DEVELOPMENT
10
In 2008, the main target group is People who have been unemployed for more than a year (65 out of
69 weeks) and the targets are:
1. Decrease the number of unemployed people over 3 months.
2. Focus on people who have been unemployed for more than one year, in particular on the targets
set under the national initiative "A New Chance for Everyone":
a) 25 per cent will enter employment or training,
b) Increase of self-supporting by 15 per cent (weeks of self-supporting/weeks),
c) Increase of the participation on an activation scheme by 40% (weeks in activation/weeks
receiving social benefits).
3. Decrease in the number of unemployed young people (under 30 years old).
The main target for 2009 is to reduce, in comparison with the preceding year, the number of absences
over 26 weeks due to illness.
3.1.2. Policy actions on drivers
There are four key-initiatives particularly relevant for the achievement of the overall annual
objectives. They are expected to be particularly successful. They reflect the overall objective of filling the
gaps in the labour market, by bringing people as soon as possible back to work or by bringing new people
into the labour market.
a) The project "Quick start" (January-December 2008)
The objective of this project is to bring unemployed people back into the labour market as quickly as
possible. The most important principle of this project is the individual contacts with the unemployed. There
is a first one, immediately after only two weeks of unemployment instead of the three months of the
ordinary unemployment support, followed by further contacts every second week, instead of every third
month. The unemployed may take part in complementary activities to facilitate finding a job, e.g., personal
coaching or group orientation. It is considered that if the person could not find a job after three months,
then there is some kind of problem which needs to be further analysed and addressed accordingly.
This project has already provided interesting results, the participants in this initiative seem to have
higher success rates in finding a new job (more than 10 per cent) than those who where just under the
normal unemployment service.
b) The integration agreement "A new chance for everybody" (July 2006-)
This project provides an improvement of the incentives to work as opposed to just receiving social
assistance. The idea is to bring the long term unemployed (more than one year), uninsured people (of
municipalities responsibility), as well as people who for various reasons have left or have never been in the
public employment service (e.g., medical reasons, lack of education/illiteracy, etc.) into the labour market.
In short, the aim is to reduce unemployment by upgrading the unemployed skills and strengthen their
obligation to be available for work.
DENMARK
11
The target is to increase the number of full-time persons in employment or undertaking education by
up to 10,000 by 2010 10
.
The focus, in comparison with previous initiatives, is on finding an adequate job for people with some
sort of constraint or limitation, with the expectation that by working the person will also have other
limitations solved.
In practice, people who can be considered able to work will suffer reductions on their cash benefits in
order to create incentives for entering the employment system. At the same time, adequate activation
measures are implemented to support people finding a new job. The most important measure is the
individual contact with the potential new jobseekers, trying to understand their limitations, to apply tailor-
made measures and to find them suitable jobs, eventually on a part-time basis. This implies, in some cases,
a close collaboration with social/medical advisors. This new policy is expected to have a particular
influence on immigrants and probably mainly on female immigrants11
.
After two years, the initiative seems to start bearing some fruits, there is an increase of 15.6 per cent
in the number of people who have entered the labour market, an increase of 10.4 per cent of those who
found by themselves some kind of occupation after being out of the welfare system (self-support actions)
and of 18.7 per cent of those who started to take part in some activation measure.
c) The initiative "Illness - activation and quick reemployment" (January 2009-)
The number of people receiving sickness benefits is higher than the number of those receiving
unemployment benefits. This constitutes a heavy burden for the State and for the municipalities, which
after six months have to pay the social benefits. In parallel, these people are also not available for the
labour market, in this time of labour shortage.
For that reason they will be the main target of a new initiative. Its objective is to promote the return to
work, as quickly as possible, of people on sick leave, therefore to increase the labour force. The measures
for the implementation will include the sick person being contacted on a weekly basis and if possible to
have the person back to work before a maximum of 12 weeks of absence.
Similar initiatives have been developed by some municipalities. These had very good results;
therefore a national project will now start to be carried out.
d) The tool "Competence audit" (June 2008 - June 2011)
The Competence audit is a method for measuring the balance of competencies, skills and
qualifications of the individuals on the cross-border labour market of the Øresund region (Zealand, Greater
Copenhagen and Southern Sweden) as a basis to support policy.
The opportunities of recruitment for Danish and Swedish Enterprises will increase and there will be
more possibilities of employment for persons. The Competence Audit will allow the local actors to12
:
Develop a “common platform” of understanding and new methods in the Øresund region, which
aims at increasing the recognition of the actual needs for the development of labour force
10
Danish Government, 2005, p.39.
11 EC, 2006, p.129.
12 Source: Employment Region of Greater Copenhagen & Zealand.

FRAMEWORK FOR INFORMATION EXCHANGE IN LOCAL DEVELOPMENT
12
competences, and thereby develop a common starting point for a better use of the resources
available in the region.
Clarify where the bottle necks are (in which sectors and branches they can be found) and where it
would be beneficial to launch educational initiatives in order to contribute to relieve bottle necks,
and develop the labour market.
Pinpoint concrete ideas for the development of employment and supplementary training and
education.
Establish an interregional dialogue in relation to the needs for the development of labour force
competences on the Øresund labour market.
Contribute to make the labour market and the educational system more visible to the public and
the efforts of enhancing the integration on the labour market.
This tool will be supported by the INTERREG IV A programme. The Partnership includes the
Employment region of Greater Copenhagen & Zealand (lead partner), the Capital Region of Denmark, the
Region Zealand, the Region Scania (Sweden), the Public Employment Services of Sweden, the City of
Copenhagen, the Confederation of Professionals in Denmark.
e) General results of other policy actions
Other types of policies, such as the increase of qualifications, by placing the unemployed into training
programmes are considered less effective, because the person is for a period not available for the labour
market. Empirical results have proven that employability levels of jobseekers who have taken part in
training programmes are half, for instance, of those who benefited from the policy of paying the first
wages.
Another policy which was abandoned is the subsidies to start-ups of new companies. The main reason
is that it represents unfair competition for companies already in operation, which may even result in some
closures.
3.2. The economic development policy - The Capital Region Copenhagen
3.2.1. Local strategies (drivers of performance) for an economically performing region
The Capital Region Copenhagen considers the following principles as drivers of the action plan13
:
Think internationally: The region should focus on improving international competitiveness,
developing internationally oriented businesses and attracting foreign investments, labour and
tourists.
Develop existing and emerging positions of strength: the objective is to strengthen the synergies
between education, research and the business community, by this way to create the conditions for
growth for entrepreneurs and businesses. The focus will be on cluster formations.
Strengthen collaboration – across Øresund and between the regions: to strengthen the
collaboration between municipalities and regions for a stronger position in the global market.
13
Capital Region of Denmark, n/d.
DENMARK
13
See knowledge as the most important source of growth: to compete on knowledge – especially
values and human resources.
Promote distinctive initiatives: to focus and combine the efforts – and concentrate on a common
direction and shared goals in the region to ensure the greatest possible impact.
Follow the same path: to develop a common understanding of business related initiatives in the
region – and establish coherence, e.g. through the regional development plan.
These principles were the guiding light for the preparation of the Capital Region of Denmark Business
Development Plan and its seven action areas (Capital Region of Denmark, 2007):
1. Strong and promising competency clusters, to focus the support on the key regional clusters,
considered as crucial for economic and employment growth in the region;
2. New businesses – new knowledge, support the creation of new companies, as a means also to
raise innovation;
3. Development of the metropolitan region, to consider the capital and to strengthen its role as the
focal point for the country;
4. Research and innovation, develop the innovation system, by investing in research, transfer of
knowledge, public-private partnerships and increased focus on user-driven innovation;
5. Increase and develop the labour force at all levels, focusing on the growth of highly educated
workers in the private sector, reintegration of unemployed in the labour market, expansion of the
labour market to Germany, Sweden and Poland, better collaboration between educational
institutions and businesses, increase the number of students in post-compulsory and higher
education programmes oriented to science;
6. Marketing, events, culture and values, strengthen the Region's profile and attractiveness, attract
major international sports and cultural events to the Region, prepare a long-term event strategy;
7. Øresund and the international vision, develop new projects and partnerships in the cross-border
regions but also with other metropolitan areas.
The key-policy priorities are the 1) increase and develop of the labour force, namely to attract foreign
highly qualified employees, in particular engineers, 2) creation of new businesses, but specially enterprises
that registers bigger growth rates, 3) attraction of inward investment in connection with the aim of
internationalisation (with a focus on the key clusters of the region), for this the institution Copenhagen
Capacity has been created, 4) development of the infrastructure, improving the transport connections to
Europe and to the World (focus on the International Airport) and solving the congestion problems in
Copenhagen metropolitan area.
There is a diversified set of indicators for measuring the performance of the Region. In general, these
reflect the national set of indicators, identified in the National Reform Programme. The most relevant are:
Improving skills and human capital14
14
Danish Government, 2007.
FRAMEWORK FOR INFORMATION EXCHANGE IN LOCAL DEVELOPMENT
14
Percentage of population (age 25-64) in Copenhagen Region holding a higher education degree.
Percentage of all young people to complete a youth education programme (target 85% in 2010
and at least 95 per cent in 2015).
Percentage of young people who complete a tertiary educational programme (target: minimum of
50 per cent of all young people, in 2015).
Entrepreneurship and SME development15
:
Number of new enterprises as a percentage of the total number of enterprises.
Proportion of entrepreneurs achieving growth of turnover and employment at least 60 per cent in
a three year period.
Attracting inward investment16
:
Number of successful investment projects in the region: target 34 investments in 2008
Number of new jobs from inward investment.
3.2.2. Policy actions
The Business Development Plan of the Capital Region Copenhagen will be supported by regional
grants and EU structural funds, corresponding to an overall investment of 900,05 million DKK17
.
For the period 2007-2008 the Business Development Strategy of the Capital Region comprises around
33 initiatives, organised according to the indicated seven action areas. An important part of the budget
(37.7 per cent) will be allocated to the action area "Marketing, events, culture and values", mainly to
support the operational costs of the institutions dealing with the promotion and development of the Region
- the Wonderful Copenhagen, oriented to the innovation in the tourism industry, and the Capacity
Copenhagen, responsible for the business promotion.
The second intervention area in terms of budget (31.8 per cent) is the "1. Strong and promising
competency clusters", which will support the development and consolidation of the key-cluster with
projects such as the World-class IT growth environments (111,89 million DKK), The strategic nanotech
cluster initiative (29,30 million DKK) or the Fashion acceleration (14 million DKK).
The Regional Growth Forum has only been created in 2007, and the concrete economic initiatives
which are or will be supported cannot provide at this stage any results.
The only initiatives which can be, to a certain extent, already evaluated are those implemented by
Copenhagen Capacity and Wonderful Copenhagen. They are subject to qualitative and quantitative targets
during their operating subsidy period (2007-2010) and these targets are monitored every year, through the
annual reports, and evaluated two times, in the middle of the period and at the end.
15
Danish Government, 2007. Interview with Henrik Madsen, Growth Forum Greater Copenhagen.
16 Copenhagen Capacity, 2007.
17 Growth Forum for the Capital Region of Denmark, May 2008.
DENMARK
15
3.3. Other drivers of performance at the national level
The National Reform Programme of Denmark (2008) points out the main pillars for the promotion of
performance in Denmark. The regions, by the intervention of the Growth Fora, and the municipalities are
then responsible for the implementation of actions which will contribute to the overall objectives.
Education/knowledge and the innovation society are considered to be a very important key driver of
performance (2008, pp.7-15). As a consequence, a numerous set of measures have already started or will
start in the coming years. All levels of education will be supported by several initiatives in order to bring
Danish pupils and students to the top.
In what regards innovation, the Government plans to strengthen public financed expenditure for R&D
up to one per cent of the GDP, by 2010, and also to support R&D and dissemination of knowledge in the
private sector. Many initiatives will be or are already taking place, such as the promotion of the employee-
driven innovation in companies, the creation of the so-called "innovation environments" - link between
R&D environments and the private capital market or the location of Danish innovation centres in very
innovative areas or cities, such as the Silicon Valley or Shanghai, to help Danish companies to find
partners or investors. Further, the free movement of knowledge, that is the removal of barriers to the
attraction of highly specialised knowledge and labour, is also an important policy objective.
Another important driver of performance in Denmark is the promotion of the full business potential.
The main indicator to measure this aspect is the Competition Index18
. The objective is to increase the
performance of Denmark's enterprises, by intervening at different levels, e.g., reduction of energy prices.
Other initiatives focus, for instance, on the reduction of administrative burdens of Danish companies and of
foreign enterprises who want to access the Danish market.
The encouragement of entrepreneurship is also the target of quite a few initiatives, oriented to the
promotion of entrepreneurial culture and skills, expansion of advisory services, revision of the bankruptcy
legislation and facilitating the access to finance19
.
Finally, infrastructures are also an important constraint to development. The National Report
mentions a "significant investment backlog" in infrastructure, which should be overcome in the next years.
Several investments are already foreseen, part of them will benefit directly the regions of Zealand and
Copenhagen: the completion of the ring links in the Greater Copenhagen and the construction of a fixed
link between Denmark and Germany across the Fehmarn Belt.
3.4. Information to support policy
3.4.1. Information to support employment policy
In the last few years new tools for planning, managing and monitoring have been introduced into the
employment system. Their main purposes are, firstly, to support job centres in planning and monitoring the
results of their measures in relation to the local targets and, secondly, to guarantee the reckoning of the
results. The tools focus mainly on outcomes and not so much on the policies and activities. There are four
tools:
18
The index is based on the following eight objective indicators: The existence of competition-restricting public
regulation, concentration, import-adjusted concentration, addition rate, market share mobility, diversification of
productivity, payroll premium and return on assets. (op. cit, p.18) 19
Op. cit, p.23 and Annex IV.
FRAMEWORK FOR INFORMATION EXCHANGE IN LOCAL DEVELOPMENT
16
a) The IT-tools, in particular the IT -based benchmarking tool Jobindsats.dk
The work of the employment authorities is largely supported by different IT tools. There are three
main tools, the portal "Job and CV-bank", the "Labour Market Portal" and the IT-tool "Jobindsats.dk".
The portal "Job and CV-bank" (www.jobnet.dk) includes information on vacant jobs and a CV
Database (all unemployed people have to fill in a CV describing their education and skills within the first
month of unemployment). This portal supports the match between vacant jobs and jobseekers.
The "Labour Market Portal" (https://amportal.bm.dk) is the labour market administration‟s tool for the
contact with – and information about – the unemployed people. Whenever the administration has had a
contact with an unemployed person, the administration will register the contact in the portal. When the
unemployed person starts some activation measures it is registered in the portal.
The IT-tool "Jobindsats.dk" (www.jobindsats.dk) is the most innovative and strategic tool. It consists
of a database containing different types of quantitative data related to the employment system. One
interesting aspect is the inclusion of information on the part of the population not inscribed as jobseeker
but in working age. The portal comprises data and information, for instance, on labour market statistics,
unemployment benefits, recipients of social benefits, disability pensions, sickness benefits as well as
information about the municipal employment measures and specific initiatives aimed at ethnic minorities.
In a broad sense the portal provides all actors, from the politicians to the jobseekers and employees,
with a transparent and wide information base facilitating decision and the planning of new employment
measures. In particular, its most remarkable feature is the possibility to use the existing information for the
purpose of benchmarking. It allows to compare and therefore to benchmark the outcomes of the specific
measures implemented by different municipalities/regions and different jobcentres, as well as the evolution
of a certain indicator across time (since 2004). The best-practices from job centres – called the “inspiring
cases” are discussed regionally and when relevant disseminated to other groups of centres. The data in the
Jobindsats.dk is collected from the two other IT-tools above (“Jobnet” and “Amportal”) and the national
statistics in Denmark (Statistics Denmark).
b) The performance audit
The performance audit covers three main issues: 1) the analysis of the effects and outcomes of each of
the job centre's specific measures and activities on employment in comparison with other job centres, 2)
the identification and assessment of the savings that could be gained from more efficient employment
initiatives, 3) the assessment and recommendations for those centres where more efficient efforts are
needed20
.
This analysis is done once a year. The main base for the data collection is a common template and the
data contained in the Jobindsats.dk. This allows comparability between job centres and the inclusion of all
relevant information.
c) The employment plan
The Employment plan is a document prepared annually by the municipality and the State for each job
centre, covering its activities for the coming year. The main purpose is "to maintain focus on the overall
20
Hendeliowitz, Jan (2008), p. 21.
DENMARK
17
targets and to ensure coherence between the national employment policies and targets and the day-to-day
operations and activities being undertaken in the job centres"21
As a minimum, the employment plan must include: 1) The targets set by the Minister of Employment,
2) Description of the most important future employment policy challenges based on the national targets,
the performance audit, and the analysis undertaken by the Employment region and the employment
council, 3) Local strategy and targets for the employment efforts, 4) Strategy and targets for the service
provided by the job centre to the enterprises, 5) Strategy and targets for the involvement of external actors
in the employment efforts, 6) Budget for the employment efforts apportioned between the municipality and
the state.
d) The reporting, analysis and outcomes dialogue meetings
The employment regions follow up the results of the initiatives of the job centres closely, by means of
regular reporting: the reports on key figures in the jobcentres (Nogletalsrapport) and the benchmarking
report, both on a quarterly basis, and the results overview for each jobcentre (Resultatoversigt) and the
unemployment figures, both on a monthly basis.
The information supporting these reports comes mainly from the Jobindsats.dk. Some of these reports
are totally automatised.
For the benchmarking report, the job centres are organised in four different groups, according to the
particular socioeconomic characteristics, thus allowing a better comparability of results.
In addition, the Employment Region carries out other special researches on the key-aspects for
intervention of the initiative "A New Chance for Everyone", such as absence due to illness, youth
unemployment or the situation of ethnic minorities in the labour market.
The reports are the base for the so called "dialogue meetings" between the jobcentres and the
employment regions, in which the region provides support to the jobcentres but, as well, challenges them
to increase their employment efforts to produce even better results. The meetings take place at least two
times per year and for the larger jobcentres quarterly.
e) Final remarks
The labour market information system is considered to cover in general the needs of the employment
authorities. It includes several tools linked together and numerous indicators. It allows the production of
quick automatic reports and exercises of benchmarking, very useful to identify best practices on labour
market local policies. The Employment authorities keep on working on improving the tools, introducing
more automatisms and more information at the individual level, helping to support the matching exercises.
Nevertheless, the labour market information tools evidence some limitations, first, regarding information
on the costs of implementing the policies, therefore it is not possible to do cost-benefits analysis and,
second, regarding economic indicators, such as data on wages or the relation between qualifications and
wages.
3.4.2. Information to support economic policy
The Statistical Office of Denmark is the main provider of information to support policy. The
statistical databases include the usual indicators to inform the analysis of social and economic trends. The
21
Idem.
FRAMEWORK FOR INFORMATION EXCHANGE IN LOCAL DEVELOPMENT
18
English version of the website seems to include as well all the indicators. For some domains, relevant to
support information on development priorities, such as, R&D, ICT or outsourcing, the number and detail of
the indicators available seem to top what normally is available.
The site offers many regionalized indicators, which allow comparing the performance of the Danish
regions. However, the reform of the administrative system seems not to have been completely integrated in
the statistical database, there are still some indicators regionalised by the former administrative units - the
councils.
A negative aspect of the data from the Statistical Office is the organisation of information only
according to the traditional partition of economic sectors, there is no information about the key-economic
clusters. The regional actors have tackled this limitation by the use of the information resulting from the
project - Baltic Sea Region Innovation Network, aiming at transnational cooperation on innovation and
clusters. This project comprised the following steps and outputs 22
: 1) Mapping of clusters and cluster
performance (employment, specialization, real wage etc.), providing a Cluster Database on performance, 2)
Mapping of cluster-specific framework conditions, to see the presence of cluster-specific framework
conditions, providing a Cluster Database on cluster policy, 3) Evaluating cluster policy, to test the impact
of cluster policy on cluster performance, which provided as output the Cluster Benchmarking Model.
The regions and the State resort very often to studies on specific themes. One key methodology of
these, which is also important in the case of employment policy, is the use of case studies and
benchmarking as a means to better understand the strengthens and weaknesses of the regions. One
interesting example is the study23
- "The global challenges of metro regions, the Capital Region of
Denmark in the global competition on innovation", in which the Capital Region is compared with seven
international metropolitan regions in three areas: education, knowledge building and sharing, and
entrepreneurship.
3.4.3. The planning and forecasting model “ADAM-LINE”
The Danish forecasting model - ADAM-LINE is a tool to provide economic and employment
forecasts. It is based on micro-register data and modelling techniques. It combines two models into one - a
macro-economic model of the Ministry of Finance - the Annual Danish Aggregated Model (ADAM) and
the SAM-K-LINE Model (Social Accounting Matrices (SAM) for Danish municipalities (K –
“kommuner”).
The application of the - ADAM-LINE - was a result of the joint efforts of business and construction
authorities, employment authorities and the Growth Forums of all five administrative regions of Denmark.
The ADAM Model gives a simplified mathematical description of the interactions in the Danish
economy, and has a Forecast/Macro orientation. The LINE Model is based on the Social Accounting
Matrices and brings 150 social and economic variables per person into the common model and adds up the
individual detailed register datasets from Statistics Denmark Census. It has a bottom-up approach, from a
micro level to a meso level.
The combination of both models allows identifying the impacts of variations in the economic
indicators into the different labour market variables. For instance, it is possible to measure the impact of
different economic scenarios (e.g., low vs. high interest rate) on the evolution of different occupational
22
BSR InnoNet, n/d.
23 Capital Region of Denmark, n/d.
DENMARK
19
categories or on the evolution of different economic branches. These forecasts can then be used to adjust
the labour market policies accordingly.
The Model does not allow including information from the demand side, e.g., on the professional
profiles effectively needed by the companies in the coming years. Nevertheless, the robustness of the
Model is guaranteed by sending a questionnaire to the companies to collect additional qualitative
information and prognosis regarding employment conditions and the competences of the labour force.
Additionally, scrutinizers may be asked to test the prognosis of the model (e.g., regarding the impacts on
the job offers within the construction sector).
The institutional and social framework - the enablers - have an important role in the success of this
forecast model. Firstly, the policy-makers, motivated by the interest in the research results, participated in
the practical application of the model (participation in meetings to discuss results, also reporting to higher
authorities in order to find possible solutions to the forwarded problem that is based on the model results)
and therefore, they were willing to provide financial and political support . Secondly, an effective and
fruitful cross-institutional collaboration exists between researchers and the public and private sectors, in an
initial phase in the provision and processing of information and later in the merging of the two models.
4. Summary and Conclusions
The regional and local institutions in Denmark have just went through a significant restructuring, with
the creation of new regional institutions and changes in the attribution of competencies as regards
development. Therefore the analysis of the results of some of the regional and local policies for local
development is to a certain extent conditioned. One important aspect to consider, when using the Danish
case for peer learning, are the particularities of Denmark in comparison to countries outside Scandinavia.
The institutional and cultural contexts are very unique - policies and strategies are in general based on
consensus, transparency, trust, a good cooperation between the different stakeholders but also on a strong
competitiveness attitude, particularly noticeable in the national and regional strategic reports.
The transparency and trust approach have a positive impact on the information system, visible on the
availability of very detailed data (down to the level of the individual) for policy and research purposes,
allowing, the policy-makers to have very good data to support the decisions, namely the construction of
robust forecasting models.
The competitiveness attitude also has repercussions on the building of the information system to
measure performance, both on the labour market and on the economic systems. Many studies and tools are
focused on benchmarking and case studies. For instance, the Employment regions test the best local labour
market policies, by comparing the results of the different policy actions in all job centres. The Growth
Forum of Greater Copenhagen has carried out specific studies on the position of the region in the national
and international economic context.
The main source of information for the regional policies is the National Statistical Office.
Nevertheless, for more qualitative information and for benchmarking, the regional stakeholders contract,
normally, independent experts to carry out other studies. In addition, we assist as well to a culture of
monitoring and evaluation of policy results. The policy actions are usually supported by quantitative
targets, which facilitate mid-term and ex-post evaluations.
The results of the evaluations and other studies seem to be embodied in the new policies and action
plans, reflecting the principle of cooperation between the regional stakeholders. A good example comes
from the employment policies. The new regional (and national) policies are the outcome of the proven
success of pilot projects at the local level.
FRAMEWORK FOR INFORMATION EXCHANGE IN LOCAL DEVELOPMENT
20
5. Literature
Arsberetning - implementering af handlingsplan 2007, Growth Forum Zealand, n/d.
Baltic Sea Region Innovation Network – BSR InnoNet, Trans-national cooperation on innovation and
clusters, Nordic Innovation Centre, n/d.
Capital Region of Denmark: http://www.regionh.dk/English/English.htm
Capital Region of Denmark, The Global Challenges of Metro Regions, The Capital Region of Denmark in
the global competition on innovation, n/d.
Capital Region of Denmark, Regional development plan, The Capital Region of Denmark – an
international metropolitan region with high quality of life and growth, June 2008.
Food Science: www.oresundfood.org
Medicine and Biotech: www.mediconvalley.com and www.mva.org
Logistics: www.orelog.org
IT& Telecommunications: www.oresundit.org
Environmental Science: www.oresund-environment.org
Copenhagen Capacity, Årsrapport 2007, 2007.
The Danish Government, The Danish Reform Strategy, Contribution to EU‟s Growth and Employment
Strategy (The Lisbon Strategy), October 2005.
The Danish Government, Denmark's National Reform Programme, Second Progress Report, Contribution
to EU‟s Growth and Employment Strategy (The Lisbon Strategy), October 2007.
EC, Gender inequalities in the risks of poverty and social exclusion for disadvantaged groups in thirty
European countries, Expert Group on Gender, Social Inclusion and Employment, July 2006.
Hendeliowitz, Jan, Danish Employment Policy, National Target Setting, Regional Performance
Management and Local Delivery, June 2008, p. 21.
Newinsight, Integrating Employment, Skills and Economic Development, Report for Denmark, May 2008.
Partnerships for development of knowledge, growth and welfare, Growth Forum for the Capital Region of
Denmark, January 2007.
Region of Øresund: www.oresundsregionen.org
Region of Zealand: http://www.regionsjaelland.dk/Sider/Default.aspx
Status Report on the Growth Forum's work - realisation of Business Development Strategy Initiatives and
application of funds, Growth Forum for the Capital Region of Denmark, May 2008.
Vækstforum Sjællands erhvervsudviklingsstrategi 2007-2010, Growth Forum Zealand
FRANCE
21
FRANCE
THE CASE OF GREATER LILLE
by Corinne Nativel, Université de Franche-Comté, France
The following report provides an overview of the drivers and indicators that underpin local
employment and economic development in Lille. More specifically, it answers several questions regarding
the nature of these factors, the ways in which they are identified by local actors and their contribution to
the policy process in the metropolitan area. The report follows the following structure: it starts with an
overview of Lille‟s spatial features to then examine its governance system (Section 2). Section 3 reviews a
series of key initiatives identified as central to Lille‟s economic regeneration and development and pays
especial attention to the drivers that are mobilized in these initiatives. Section 4 concentrates on the
enablers behind these development processes while section 5 explores the system of indicators used to
measure the drivers. Section 6 ends with an assessment of what may be learned from this case study.
The report is based on information gathered from the field visit of the LEED Programme team of
experts in Lille on 25th and 26
th September. The field visit was organized by the Lille Metropolitan Urban
Development and Planning Agency (Agence de développement et d‟urbanisme de Lille métropole also
known as “Agence Lille Métropole”) created in 1990 to help define Lille metropolitan‟s (re)development
strategy. The seminar was also attended by representatives of the Greater Lille Chamber of Commerce and
other local economic regeneration actors. In addition, the report draws on documentation supplied by the
Agence Lille Métropole, and on the project fiches completed by the agency‟s officials. The discussion of
programmes and indicators for labour market and economic development policies is with reference to
projects implemented in the past twenty years.
1. The territorial position and economic challenges facing the Lille metropolitan area
The city of Lille is located in the Nord-Pas de Calais region of France. But Lille is more than a just a
city. It can be defined as a „city-region‟ strategically located at the heart of a triangle with Brussels at a 100
km eastwards (40 minutes), Paris at 250 km southwards (60 minutes by TGV) and London, also a 250 km
distance to the west and 80 minutes by Eurostar. The Greater Lille conurbation (also referred to as „Lille
Metropole‟) is rather unique in that it occupies a cross-border position bringing together the French Nord-
Pas de Calais region with the Belgian regions of Wallonia (French speaking) and Flanders (Dutch
speaking). On the French side, the region‟s population amounts to 1.2 million inhabitants (the city of Lille
itself has 225,000 inhabitants) compared to 0.7 million inhabitants in Belgium. In other words, Greater
Lille is far from being self-confined, as it is located on the Southern fringe of a West European urban
continuum that covers the major part of Nord-Pas de Calais and Benelux up to the German Rhine Ruhr
basin with cities such as Cologne, Duisburg and Düsseldorf. Lille is at the centre of the polycentric
development of this wider Euroregion representing four million people and ranking in 18th position in a list
of 29 regions of this kind in Europe according to calculations made by the ESPON network. This European
urban continuum stands in stark contrasts with the gap between Lille and Paris where population density
and economic activity is very low.
FRAMEWORK FOR INFORMATION EXCHANGE IN LOCAL DEVELOPMENT
22
Lille has not experienced a kind of development from the core but one that is of multi-polar nature
with three adjacent urban centres: Tourcoing to the north, Roubaix to the east and Villeneuve d‟Ascq to the
south-east (a new - mainly university-based – town) which was created in 1970. Historically, Tourcoing
and Roubaix emerged as market towns during the period of the industrial revolution. They became major
production centres for wool processing and textile manufacturing while the nearby towns were home
mining industries, especially coal (in Bethune, Lens and Douai) and to a lesser extent steel (in
Valenciennes). All these towns have obviously been immensely affected by the forces of economic
restructuring. In recent years, textile-related activities have been refocused on the high-tech end and new
poles of competitiveness in health and biotechnologies or in the agro-food sector have emerged but the rate
of enterprise creation in these sectors could be improved. Moreover, Lille is a major centre for mail order
distribution, a sector which employs approx. 15,000 people. It is noteworthy that 55% of national sales in
this sector are generated by 200 companies located in Lille Metropole. More generally speaking, Lille is
the home to some major retailers such as Auchan and Décathlon.
Despite this move towards the service-based activities, Greater Lille remains highly industrialised
compared to other French regions but its industrial fabric lacks dynamism. The challenge is to foster
enterprise creation, competitiveness, innovation and investment in human capital. For example, levels of
illiteracy are 6 point above the national average and there is an important „brain drain‟ of qualified
workers, despite the fact that ranks second city for business studies in France. Greater Lille‟s workforce
amounts to 500,000 people with about 20% working in the manufacturing sector. Within the service sector,
the share of high-value added creative and knowledge intensive (executive) jobs remains low.
Lille‟s unemployment rate is 3 percent above the national average, i.e. in 2008, 11.5% compared to
8.5% nationally. However, there are significant pockets of socio-economic deprivation where
unemployment rates range from 25 to 30%. A comparison could be made with some British cities in the
1980s with the population not mixing with the more affluent nearby areas. These pockets are smaller than
some large housing estates as they have 10 000 inhabitants on average (compared to approx. 40,000 in the
so-called “quartiers en crise” in other large French conurbations).
Given its industrial legacy and locational features, the dual challenge for Lille in the past twenty-five
years has been to base its economic (re)development on strategies that (1) help redefine its status from a
declining industrial city suffering from a poor image and negative net migration rates, (especially from
highly skilled young people) to a multi-polar and cross-border metropolitan area offering high quality and
multi-faceted economic, social and cultural activities (2) improve its attractiveness as a leading European
platform capable of attracting economic traffic and flows from and between the adjacent northwestern
European „megapoles‟.
2. The governance system
It is in 1997 that the expression „Lille Métropole‟ came to be widely used, replacing the older
expression of „conurbation‟. Since 2004, the concept of „Lille-Eurometropole‟ has increasingly been used.
This new terminology is a true reflection of Lille‟s complex and evolving governance structure which
parallels the equally complex geographical features described above. In fact, the concept of „millefeuille‟
(i.e. layered cake) is often used to describe the governance system.
As mentioned above, since the metropolitan area is located on a franco-belgian territory, it involves
three regions. In addition, it involves two French départements (Nord and Pas de Calais) as well as two
Belgian provinces (Flandre Occidentale and Hainaut). Next to these authorities, the Belgian Wallon-
Brussels Community (communauté Wallonie-Brussels) is also included. The distribution of competences is
very different in the three regions which means that a large number of partners must be called upon to
FRANCE
23
implement trans-border projects (even simple ones). Moreover, the differences in legislation and tax
systems create economic competition instead of fostering cooperation.
Starting with the lower scale, Lille itself is classed both as an „arrondissement‟ which is a subdivision
of the département, hence an administrative area but which does not exist in political and strategic terms. It
does however have competencies in the field of spatial planning.
The Lille Metropole Communauté Urbaine (LMCU) is a public body for inter-municipal cooperation
made up of 85 municipalities (known as “communes” in French), Lille being one of those. Altogether, the
Urban Community represents as already mentioned, a population of 1.2 million inhabitants. It is the second
of its kind, behind Lyon and before Marseille. It was established by a Parliamentary Act on 31 December
1966. In 2005, its budget amounted to more than €1.4 billion. The Urban Community was designed to
service the municipalities‟ infrastructure in the fields of public transport, highways and public areas,
housing, urban waste and water and sanitation. The Council of LMCU has 170 members representing all
the municipalities. It was chaired by former Prime Minister Pierre Mauroy between 1989 and 2008.
Martine Aubry who was re-elected Mayor of Lille in March 2008 took over as the chair of LMCU in May
2008. Councillors of LMCU are not elected by citizens but by councils which creates a „democratic
deficit‟.
In addition, the Eurometropole Lille-Kortrijk-Tournai was created in 2007 with its board established
on 28 January 2008 with a budget of €989, 900. This entity was formed with the legal status of „syndicat
mixte‟ (a public partnership between territorial administrations), the novelty here being that it is the first
European territorial partnership of this nature (Groupement européen de coopération territoriale) meaning
that the rule of the country in which it implemented are being applied. It brings together 14 French and
Belgian partners from all the different governance tiers including the Belgian federal government, as well
as regional and local actors. Altogether, 145 municipalities are included in the partnership. The
Eurometropole‟s main task is to “promote and support an efficient and coherent trans-border cooperation
within the territory” which implies amongst others dismantling territorial and linguistic barriers. For
example, when it comes to transport policy, the Lille Urban Community is in charge on the French side,
while in Belgium, transport falls within the policy remit of the region. This explains why it is impossible to
merely rely on bilateral relations.
Finally, there is an Aire Métropolitaine (Metropolitan area) which is one of fifteen in France, created
just over three years ago and bringing together 23 partners. It represents 300 municipalities on the French
side and 30 on the Belgian side. In other words, it represents 2 countries, three regions, two French
départements and two Belgian provinces. It is chaired by the Mayor of Lille, Martine Aubry.
3. Lille’s key regeneration initiatives: activating local development drivers
Six initiatives were selected as being representative of Lille‟s economic (re)development (for more
details, see the „fiches‟ relating to this case study). These were selected to reflect the widest possible range
of intervention around the notion of „ville renouvelée‟ (city renewal). This section describes these projects
(with especial attention to the economic, social and cultural drivers they seek to unleash), their outcomes,
and problems faced; Section 4 will unravel what can be seen as the „enablers‟ behind these initiatives, i.e.
the governance and policy factors that have shaped the development processes and made them successful.
3.1. Euralille
Euralille is a new „multifunctional‟ quarter conceived and constructed over the past decade as a grand
project based on the new role of Lille as a hub in the northern European high speed rail network.
Moreover, the original historic core was proving too small to accommodate new commercial space and
FRAMEWORK FOR INFORMATION EXCHANGE IN LOCAL DEVELOPMENT
24
Euralille offered the opportunity for extending business and shopping facilities. The design of Euralille was
directed by Dutch architect Rem Koolhaas (author of “Delirious New York”) with a vision for a new kind
of urban life and aesthetic, geared to new sensibilities of globalization, time-space compression and virtual
space. The project was conceived as a generic place of transition and movement rather than one of place
and local identity. The first stage was completed in 1995. The Euralille project is a visually exciting and
programmatically innovative experiment which now ranks in third position after Paris-La Défense and
Lyon-Part-Dieu as a business district. It boasts office space, hotels, shopping amenities with a large
shopping centre containing a hypermarket and 120 retails units (113 000 m2), and of course a central hub
station with access to both local and international destinations. It currently hosts 10,000 jobs (but most of
which were relocated and not created) and several famous international and national companies such as
Deloitte, Auchan (hypermarkets), SNCF, EDF, etc. Public sector employers such as the Regional Council
have also located their offices in Euralille. Commercialisation is close to 90 percent and the second stage
(Euralille 2) which was launched in 1998 is about to be completed. The Euralille project is managed by the
SAEM (Société anonyme d‟économie mixte), a public-private partnership between local authorities (which
are the majority shareholders) and private actors. Since May 2008, it has been chaired by the mayor of
Lille, Martine Aubry.
Euralille has sought to activate the following drivers:
Inward investment and business relocation
Office/business space
Tourism infrastructure (hotels, conference/congress centre)
Transport infrastructure
Housing infrastructure
Shopping/Consumption/Leisure and recreation
To analyse these drivers, the Agence Lille Metropole collects its own datasets on e.g. on firm
relocation (via the APIM agency, in charge of attracting inward investment) or rates on hotel occupancy
and commercialisation of office space through its own research team. It also conducts ad hoc qualitative
surveys such as the perceptions of the area by residents and employees.
3.2. European Capital of Culture (2004)
In 2004, Lille was designated European Capital of Culture together with the city of Genoa.
A vast array of events and activities were put together for the occasion. In fact, around 2000 events
(concerts, exhibitions, conferences, etc.) took place, many of which have strongly reshaped the local
leisure and cultural landscape. Indeed, a number of buildings were created or refurbished. For example, „la
Piscine‟ in Roubaix is a former „Art Déco‟ swimming pool which was redesigned as an art and industry
museum while 11 „Maisons Folies‟ (artists residences and socio-cultural activity centres) were set up in
deprived areas.
The outcomes of the European Capital of Culture year were that it attracted nine million participants
(with two million tickets being sold) and thereby contributed to placing Lille on the cultural map and
developing awareness of the city as a potential tourist destination.
FRANCE
25
In sum, the key drivers in the Capital of Culture initiative were:
Place marketing (city imagery)
Culture and creativity
Tourism development
3.3. Delta 3 (logistics platform)
The DELTA 3 is a logistics centre located 20 km to the South of Lille. It combines 3 elements on a
same 300 hectare site:
A multi-modal transport terminal (rail – route – waterways)
Logistics areas with 330,000 m² of state of the art warehouses
An office area and a living area
Delta 3 was created in 2003. It is owned and managed by Lille Dourges Container Terminal which
has five shareholders (the main shareholder being Novatrans). In 2007, LDCT handled approx. 108,000
transhipments and over 3,000 trains. The maximum estimated capacity of the site is about 200,000
transhipments a year. Its impact on job creation is clear: in 2007, the site employed 1000 people compared
with 80 people in 2003.
The DELTA 3 initiative seeks to unleash two essential drivers of economic activity which are:
Business Infrastructure
Transport and mobility (of goods)
3.4. Programme de Rénovation Urbaine
The PRU is a national programme which seeks to promote neighbourhood renewal in areas classed as
Zones urbaines sensibles (ZUS). Under this programme, 10% of the social housing stock will be
demolished and rebuilt or refurbished by 2013. Greater Lille‟s PRU of Lille concerns 12 municipalities and
includes 10 rebuilding projects on 13 social housing estates. The government agency, the Agence
Nationale de Rénovation Urbaine has provided the Lille Communauté Urbaine with € 300 million.
Like most neighbourhood renewal initiatives, the drivers on which the PRU relies are:
Quality affordable housing
City imagery
Social Cohesion
Sustainable development
FRAMEWORK FOR INFORMATION EXCHANGE IN LOCAL DEVELOPMENT
26
3.5. CréatiVallée
Entrepreneurship is widely recognised as being a key driver in local economic development policies.
A specific project focuses on this driver. CréatiVallée – Donner envie d‟entreprendre is a private company
(gathering and mobilising partners from the public and private sectors) operating in the Nord-Pas-de-Calais
region. It has an annual budget of 450,000 euros. Part of its funding comes from the Regional Venture
Creation and Transmission Programme, known by its French acronym PRCTE, and its goal is to create a
regional dynamics by identifying initiatives that foster a spirit of enterprise, including those that inform,
explain and encourage people to create businesses and those that demystify the role of the entrepreneur.
Every three years (2001, 2004, 2007), CréatiVallée conducts surveys among a sample of 1,000 young
people aged 19 to 25 to find out about degrees of awareness and trust in entrepreneurship. This evaluation
only gives „soft‟ evidence that the spirit of „entrepreneurship‟ has progressed but the impact on business
creation has been difficult (if not impossible) to measure.
3.6. Finorpa
The Finorpa Group is an organisation established with the view to help SMEs in the Nord Pas de
Calais. It was set up in the early 1980s as a subsidiary of the Groupe Charbonnage (owned by the State),
its original task was to support the closure and restructuring of the coal mines in the four districts of Douai,
Lens, Valenciennes, Bethune. A decade on, by 1994, the central State had provided 130 million euros.
Since 1994, a further 500 million have been invested. Today, Finorpa is a public/private partnership of 14
shareholders (the regional authorities and several regional banks and financial institutions). The funds are
used to help SMEs in various ways and at various crucial stages, providing either seed funding for the
start-up or helping consolidate or restructure those facing severe difficulties. In the 20 years period,
Finorpa has supported 2000 PMEs and 2300 projects. It has been estimated that 7,000 euros have been
invested per job. Approximately 40,000 jobs have been created.
Finorpa clearly impacts on the industrial fabric and productive capacity and as such acts on:
Attractiveness
Entrepreneurship
Competitiveness
4. Identifying the ‘enablers’
Here we concentrate on the enabling factors which can explain the success of the aforementioned
projects in activating local economic development drivers. Unsurprisingly, these are essentially related to
governance, which is some instance could be seen as a constraint (such as for example in relation to the
difficulties promoting a cross-border dialogue). By the same token, other governance factors can be classed
as enablers. The key ones are:
Importance central state steering and legislation and of public funding (notably through central
government)
This was for example visible in the Finorpa and PRU initiatives, although it was clear that there
is leeway for actors to adapt it to local needs. In the case of Euralille, it was local public funding
which helped sustain the development of this project through the economic crisis of the 1990s
when private actors weren‟t willing to invest in it.
FRANCE
27
Strong local leadership
The Eurolille project was led by Pierre Mauroy, former Mayor of Lille and former Prime
Minister who in the late 1980s anticipated the future impact of the Channel tunnel which was to
be completed by 1993 and grabbed the opportunity for his city, championing the project at the
national level. He ensured that the TGV would go through Lille and not through Amiens as
originally planned. More importantly, once Lille was chosen, the debate was around whether the
TGV would bypass the city centre to be located in the periphery and Mauroy astutely managed to
get it to pass through the city centre. Mauroy carried this project amidst heavy local protest and
criticism (particularly about the extra costs of 26 million euros financed through the local
authorities‟ own budget). Mauroy‟s achievement was not only to impose his vision of Lille being
„at the heart of Europe‟ at Matignon but to rally local elected politicians who previously held
antagonistic views. In this sense, time has shown that Mauroy has left a strong political imprint
and legacy. When compared to Marseille‟s Euromediterranean project, Lille has benefited from a
much higher local leadership with continuity, longevity and stealth in political vision.
A few highly committed local „family‟ enterprises
Greater Lille has several local employers such as the Auchan Group (by far the leading local
business) with have historically had a strong presence in the region and which can be easily
mobilized in the context of local economic development.
A strong local civil society
A common theme in all the initiatives described is the culture of consultation and consensus.
There is widespread evidence that actors have rallied around the idea of iconic projects that
would create a sense of „city pride‟. Lille has a very large informal network of 700 people created
in the early 1990s known as Comité Grand Lille which brings together representatives of
financial institutions, managers and directors of local enterprises, the Chamber of Commerce,
social partners, local civil servants, artists, elected politicians. For example, the Committee has
sponsored the city‟s application to the Olympic Games and generally speaking, a lot of work is
undertaken to build strong ties between local actors. The quality of these human ties appear to
follow what could possibly be viewed as a „Northern European‟-type of culture based on
consensus and dialogue rather than conflict.
5. System of indicators
Of course, at this stage of the report, a key question to ask is the extent to which the design and
implementation of the six aforementioned initiatives was informed by indicators, and if so by which
indicators. We have seen that the Agence Lille Métropole collects some data though its own surveys. This
has been particularly useful to accompany the development of Euralille for example. In addition, the
Greater Lille Chamber of Commerce has a major role in pulling together those indicators relevant to
economic development. A team of four people (known as „Entreprises et Développement‟) is dedicated to
territorial analysis of the Nord Pas de Calais region. The team‟s role is to engineer activities according to
an empirical approach as opposed to one that would rely on macro-economic modeling. The objective of
the team is to identify the economic drivers, particularly the so-called „pulling sectors‟ („secteurs
entraînants‟) and the weight of the metropolitan area within the region so that this information can be
passed onto local elected politicians and inform their discussions with regional authorities. The Chamber of
Commerce has put together a comprehensive information system which represents the economic circuit
and is divided in three main thematic sections that interact with one another: (1) population, (2) territory,
(3) productive system. Within this system, a distinction is made between „means‟ and „outcomes‟
FRAMEWORK FOR INFORMATION EXCHANGE IN LOCAL DEVELOPMENT
28
indicators. The information provided relates first to the objectives, secondly to the actual indicators used
and finally to the sources. Fourthly when „methodological alerts‟ are available, the information is also
mentioned. Moreover, thought is given to the comparative advantage of the region in order to avoid the
pitfall of undertaking a mere „listing exercice‟ without any analytical work.
The first category, the population category, brings together datasets on demography, active population
and employment, initial and further education. The sources for this data are the French national statistical
office known as INSEE (Institut National de la Statistique et des Etudes Démographiques) and the Institut
National d‟Etudes Démographiques (National Institute for Demographic Studies). Statistics on labour
market and employment include the usual series on active population, activity rates by age and gender,
employment rate by age and gender, employment by sector, educational achievement and the like. These
are also obtained through INSEE, with further sources such as the ASSEDIC (the employment insurance
administration) and URSAFF (the administration dealing with social security contributions).
The territorial indicators (second theme) are based on factors such as geomorphology, infrastructure
(roads, airports, etc.), urban and rural areas, etc. The data is drawn from the regional Nord-Pas-de-Calais
division of INSEE and from the Direction Générale de l‟Equipement Nord. At this level therefore, the
sources are provided by regional bodies.
Finally, data on the productive system is geared towards the objective of “understanding the economic
challenges and drivers” for the region. Work is done on the characteristics of the local pool of SMEs and
on enterprise creation. The SME indicators are sourced from a database known as SESSI (this is a sensus
of SMEs with less than 20 employees and which are classed as „monoregional‟ because 75% of their
payroll in employed a region). A further source is a dataset launched by INSEE a few years called „CLAP‟
(Connaissance locale de l‟appareil productif – or „local knowledge of the productive system‟) which
provides more precise information for NAF 700 (the French „nomenclature‟ which goes down to the level
of the municipality). This database gives precise data for example on the number of employees and types
of posts occupied by staff. However, a major problem is precisely that the database is too recent to conduct
any longitudinal analysis. A further route would be to use commercial databases but these record
headquarters of companies. The intelligence unit in charge of compiling indicators at the Chamber of
Commerce do not feel that this data is relevant since they are looking for data at the level of the
establishment. Thus a lot of attention is paid to methodological, reliability and cost factors when selecting
the databases for local economic analysis.
The Greater Lille Chamber of Commerce is currently putting together a sectoral model which makes a
distinction between four types of sectors (“driving”, “driven”, “transformative” and “induced”) according
the degree to which they create or attract wealth. The objective is to work our indices for wealth creation,
exports, consumption and other categories. This approach is promising but no data is available for each
individual industrial sector at the sub-regional level and the issue of data collection is thus crucial for the
future development of this information landscape.
A question therefore is how the information system could be improved?
There is no doubt that in its current form, the information system is both very relevant and
comprehensive and that it brings together a huge wealth of indicators. However, it displays a certain
number of problems. The first concerned the accuracy of the data since the census of population produced
by the French statistical office (INSEE) dates back to 1999. So far, updates were available every ten years.
From December 2008 onwards, yearly updates will be available (so called „renovated census‟). It is
therefore too early to say whether this change will have an incidence and how it will translate into policy.
FRANCE
29
Moreover the geographical units that are measured in each dataset differ according to the institutional
sources. For example, data provided by INSEE is available for municipalities but URSAFF and ASSEDIC
provide data at sub-regional and not municipal level (for the „département‟, but not for the „commune‟).
Data harmonization between sources should therefore receive more attention.
A further caveat identified by local actors was the lack of sub-regional data and lack of data on flows
(as opposed to stocks). This was for example the case for inter-firm flows on which data is acutely needed.
Again this limits the knowledge base and has incidence on the policy process. Further requirements would
be access to more sophisticated data on executive knowledge intensive jobs, on R&D and on net
migration.
Finally, one noteworthy issue in terms of data collection and analysis relates to Lille‟s cross-border
status. French and Belgian information systems are not very different but the lack of communication
between the relevant actors hinders the comparative and harmonization process. There is a dearth of
information on cross-border flows of people, goods and capital which is why appropriate monitoring
systems need to be designed.
6. Learning points
When it comes to economic development, Lille has undoubtedly what might be termed the „classic
inventory‟. The overall strategic framework incorporates the essential features of a „standard‟ regeneration
strategy which comprise infrastructure, urban renewal, inward investment, culture and creativity.
This list of items is of course transferable to other OECD regions. In fact, most OECD regions have
implemented these items in some combination or another. What seems more difficult to transfer is the
method. Indeed the major difference does not lie in the „what‟ but in the „how‟ issues of design and
implementation, the way things are done and the context in which they are done.
The Lille case study shows that there is an obvious „French‟ take on the above inventory: whilst there
are public/private partnership in almost all the initiatives described, the public sector remains dominant in
terms of funding and policy directions. Clearly, this would not be the case in other European regions.
When it comes to information systems, as mentioned above, Lille‟s actors have a comprehensive set
of statistics at their disposal. But the quantitative data does not appear to be used to „fit‟ a pre-defined
econometric model of what the regional economy should look like (although arguably such a model may
look „rigorous‟ on paper but could be seen as flawed when set against the reality).
Finally, the analysis of the Lille case study is a reminder of how important it is to get the conceptual
framework regarding the relationship between the triptych indicators-drivers-enablers right. Despite the
problems mentioned in relation to the availability of indicators, indicators can and should no doubt be used
to measure the drivers (human capital, housing, inward investment, tourist flows, entrepreneurship, etc.) of
local urban development. In this area, Lille has shown that there is room for improvements such as
compiling new indicators or improving data collection methods. However, the case study also clearly
shows the dangers of seeking to use quantitative variables and indicators to measure enablers. Enablers fall
essentially within the remit of governance processes, and by essence processes need time to unfold. They
should thus rely on „softer‟ qualitative approaches such as interviews and group discussions.
In view of these observations, two recommendations could be made for Greater Lille and for similar
OECD cities and regions. The first relates to local action: at the local level, it would be necessary to
implement specific commissioned surveys to fill the information gaps on economic flows, research and
development, design. The second relates to transnational action supporting information exchange: one
could envisage the creation of a portal on the world wide web that would provide a detailed list of key
FRAMEWORK FOR INFORMATION EXCHANGE IN LOCAL DEVELOPMENT
30
drivers which were found in all regions and of the indicators which are used (or could potentially be used)
to monitor these drivers. This would not only allow monitoring over time, but would also provide material
for fruitful cross-national and cross-regional comparisons.
7. References
Agence de développement et d‟Urbanisme de Lille Métropole, Les Chiffres de la métropole Lilloise, July
2008.
Baert, Thierry, “A cross-border approach to city-region (metropolitan) policies. The case of Lille
metropole”, Internal document, Agence Lille Métropole, March 2008.
Dovey K. (1998) “Multiplicities and complicities: signifying the future at Euralille”, Urban Design
International, Volume 3, Number 3, pp. 89-99.
Giblin-Delvallet, B. (2004) “Lille Métropole: Une Eurométropole en devenir?”, Vingtième Siècle, Revue
d‟Histoire, No. 81, pp.66-80.
Lille Métropole Communauté Urbaine et al. Appel à coopération métropolitaine. Déclaration de l‟aire
métropolitaine de Lille, May 2005.
Merlant, P. (1995) «Lille flirte avec Bruxelles», L‟Expansion, 16 October 1995, downloadable at
http://www.lexpansion.com/economie/lille-flirte-avec-bruxelles_3989.html
Websites consulted between 23rd September and 27th October 2008
Agence de développement et d‟Urbanisme de Lille Métropole :
http://www.lille-metropole-2015.org
Agence pour la promotion internationale de Lille Métropole : http://www.apim.com
Créativallée: http://www.creativallee.com
Euralille: http://www.saem-euralille.fr
DELTA 3 Logistics Platform : http://www.delta-3.com
FINORPA: http://www.finorpa.fr/
Greater Lille Chamber of Commerce : http://www.grand-lille.cci.fr
Portal of the Communauté Urbaine de Lille (CUDL) : http://www.cudl-lille.fr
GERMANY
31
GERMANY
SUMMARY REPORT BRANDENBURG
by Hugh Mosley, Social Science Research Centre Berlin (WZB), Germany
This brief report examines indicators for local employment and economic development and their use
in the policy process in the state of Brandenburg: Section 1 describes the governance context; section 2
surveys trends in local development and the performance indicators used; section 3 reports on local
strategies and policy actions and the indicators that support policy for labour market (3.1) and economic
development policy (3.2) respectively. Section 4 presents preliminary conclusions. The report is based on
information gathered from the field visit in Potsdam, Brandenburg June 30-July 1, 2008 organized by
LASA (State Agency for Structure and Labour) and also attended by representatives of the Brandenburg
Labour and Economics Ministries, on documentation supplied by LASA, and on the project questionnaire
completed by LASA officials. The discussion of programs and indicators for both labour market and
economic development policies is with reference to current activities in the 2007 – 2013 program period.
1. Governance context
Actor constellation
Brandenburg is one of 16 federal states in Germany. The Brandenburg state government is a regional
actor with important but limited strategic room for maneuver in a policy field in which the German federal
government and the EU play dominant roles. Moreover, actor constellations within Brandenburg are
themselves complex with responsibility for labor market and economic development divided between the
Labour and Economics ministries.
In the area of labour market policy the Federal government is the principal player, acting through the
public employment service and local agencies for the unemployed on social assistance. Although the
Brandenburg region in former Eastern German is one of the principal recipients of ESF funding in
Germany, Brandenburg State programmes account for only about 15% of labour market expenditure for
active measures in the region.24
Brandenburg‟s own labour market programmes are designed to complement Federal programs and to
set particular regional accents. They are developed and administered almost exclusively within the
framework of European Social Fund (ESF) programme for the region, which is the main source of
funding for state programmes. The definition of policy goals and monitoring and evaluation requirements
is, therefore, largely shaped by EU guidelines and reporting requirements.
24
Estimate: Annual expenditure under the ESF-OP in Brandenburg fort the first full year (2007/2008) as a percentage
of Federal government expenditure for active measures in SGB II und SGB III in 2006. Sources: MASGF
2007a, Tables 8 & 9 and MASGF 2007b.

FRAMEWORK FOR INFORMATION EXCHANGE IN LOCAL DEVELOPMENT
32
Within the state administration responsibility for the Brandenburg labour market strategy and
programs rests with the state Ministry for Labour, Social Affairs, Health and Family (MASGF) .
LASA (State Agency for Structure and Labour) is a publicly owned limited liability company founded in
1991 to assist the Labour Ministry and to support regional and local actors in implementing state labour
market programs. LASA is a service provider for the ministry that performs primarily advisory and co-
ordinating functions and manages most Brandenburg ESF-programs.
In the Brandenburg state administration the Ministry of Economics is primarily responsible for
regional economic development policies. There is thus an additional need for horizontal inter-ministerial
policy co-ordination with Brandenburg (inter-ministerial working group). EU programmes, especially the
European Regional Development Fund, also play the major role in financing regional economic
development policies and policy objectives and data reporting requirements in this policy area too are
strongly shaped by the relevant EU guidelines.
The ZAB (Future Agency Brandenburg) is an agency of the Brandenburg Economic Ministry
(jointly with the local chambers of commerce). It is primarily engaged in service and consulting activities
in support of ministry programs and not a strategic actor. Its particular focus is on attracting and advising
new industries, support for SMEs and technology-oriented business start-ups. Funding of economic
development programs is carried out primarily by the publicly owned Investment Bank of Brandenburg
(ILB), with which the ZAB works closely. The ILB finances public and private investments in trade and
industry, the infrastructure and housing construction using funds from Brandenburg, the Federal
Government, the EU and its own resources. It can offer Brandenburg firms grants, loans at favourable
interest rates and bank guarantees and venture and equity capital. The ILB is the principal administrator of
ERDF grants in Brandenburg.
Doughnut problem
Berlin and Brandenburg together constitute a metropolitan area with a population of more than 5
million people. At the center of region is the German capital, Berlin, which is an independent and in some
respects competing federal state of its own (e.g. location decisions of firms) with about 3.5 million
inhabitants. Brandenburg‟s labour market and economic development are closely linked to that of Berlin,
for example, about 160,000 Brandenburg residents or about 16% of all employed persons commute to
Berlin to work (and 60,000 Berlin residents work in Brandenburg). Coordinated leadership, which is seen
as a problem, is difficult to achieve not only because they are separate jurisdictions but also because they
are governed by different political coalitions.25
An example of leadership failure mentioned is the failure of
Berlin and Brandenburg to create a joint agency and a common service package for investors.
2. Trends in local labour market and economic performance
The responsible ministries report regularly on labor market and economic performance (e.g. MASGF,
Bericht über den Arbeitsmarkt des Landes Brandenburg 2006/2007, Potsdam 2007; Ministerium für
Wirtschaft, Jahreswirtschaftsbericht 2007, Potsdam, 2007) as does the Berlin Brandenburg Statistical
Office (Statistisches Jahrbuch 2007, Potsdam 2008). Moreover, the ESF and ERDF Operational Programs
for Brandenburg include detailed historical information on core performance indicators. The employment
rate in Brandenburg was 65.7 % (men = 67.5 %, women = 63.8%), which is higher than in Germany as a
25
In Berlin a coalition of the Social Democratic and Left (former Communist) parties whereas in Brandenburg the
Social Democrats form a coalition with the Christian Democratic (conservative) party.
GERMANY
33
whole but still lower than the overall Lisbon target of 70%.26
Despite recent improvement, employment
with social security coverage was 11% lower in 2007 in comparison with 2000.
Like other eastern German regions Brandenburg is still experiencing markedly higher level of
unemployment that in western Germany. The unemployment rate (registered unemployment) was 14.9% in
2007, comparable with that in other eastern German states but almost double the rate in western Germany.
The average duration of unemployment is high and youth unemployment is perceived as a major problem.
A particular focus of policy is the imbalance in the market for apprenticeships. For the 30,000 school
leavers seeking apprenticeships in 2006 only 14.000 openings in firms were offered. The number of
school-leavers will decline sharply in the next few years for demographic reasons (MASGF 2007a 28-30).
Real GDP in Brandenburg grew by 2.2 % in 2007, which was less than in all eastern states (2.4%) or
in Germany as a whole (2.5%). Productivity was only about 80% of total German productivity and
purchasing power (14,000 € per capita) was, markedly lower than the German average (17.500 €). The
poverty rate in Brandenburg was 13.3 % in 2005.27
Brandenburg, like other eastern German states, is experiencing a continuing population decline from
2.56 million in 2005 to an estimated 2.49 million in 2015. This trend is due to a drop in the birth rate and a
negative migration balance. The impact is strongest in less developed peripheral regions and among
younger, better educated persons, especially young women.
Within Brandenburg there are strong regional disparities in the employment and economic situation.
2.1. Indicator system for employment and economic development
The general measures of performance used in Brandenburg noted above are highly standardized
indicators that are very similar to those used for reporting on local economic, employment and social
performance in other OECD countries. The indicators are used primarily to compare Brandenburg with
other German regions and with Germany as a whole, or to compare sub-regions within Brandenburg.
The general performance indicators used by the Labour and Economics ministries in Brandenburg are
largely based on externally available data, especially from the Brandenburg Statistical Office or the PES.28 The contribution of Brandenburg to the policy information system with regard to performance indicators is
to ensure that the standardized performance indicators are available for Brandenburg and for sub-regions
and industries within Brandenburg and are presented in a user-friendly format.
Performance indicators are accessible to local policy actors in publications like those mentioned
above. For some indicators information is also available on line, for example LASA‟s Skilled Labour
Information System (see below). Even here most of these indicators from external sources are available to
users only with a considerable time-lag.
Self-collected data occur and are used largely in connection with measuring and evaluating locally
defined drivers of performance and policy actions (see 3.1.3 & 3.2.3 below).
26
2006.
27 Poverty is defined as less that 60 % of the median income per person income in Brandenburg (MASGF 2007b).
28 It is important to distinguish between the data source and the data provider. For example, the Brandenburg
Statistical Office compiles data from many other sources in addition to its own self-collected data.
FRAMEWORK FOR INFORMATION EXCHANGE IN LOCAL DEVELOPMENT
34
3. Local strategies (drivers) and policy actions
Local labour market and economic development policies in Brandenburg are strongly shaped by EU
priorities and policy guidelines for the structural funds, especially ESF and ERDF, which are the principal
source of funding. Within this framework more specific local strategies suited to local needs are developed.
EU management and monitoring requirements also foresee at least pro forma a target-oriented management
system with corresponding indicators and monitoring and evaluation of local performance. Local actors
emphasized that in developing their own strategies they must work within existing funding possibilities
and the strategic framework set by higher governance levels.
3.1. Labour market
As noted above, local strategies and policy actions on the labor market are embedded in a complex
national and international (EU) policy field. The ESF Operative Program for the region is the principal
planning instrument. It articulates a comprehensives set of local strategies based on the overall ESF policy
priorities and defines corresponding output and outcome indicators for Brandenburg. Within this
framework the Labour Policy Program of the State of Brandenburg ("Investing into human resources -
strengthening regions") elaborates a set of concrete measures for the 2007-2013 planning period.
3.1.1 Local strategies (drivers)
The ESF operational program articulates the following specific strategies (drivers) for the 2007-2013
planning period within the main ESF priorities:29
Priority 1: Adaptability and competitiveness of employees and firms (17% of expenditure)
Strengthening strategic capacities of companies
Supporting business start-ups
Training for employed persons
Priority 2: Enhancing human capital (39%)
Increasing research and development potential
Improving training capacity for young people
Securing initial training and the quality of advanced training
Priority 3: Access to employment (38%)
Increasing employment percentage of women
Improving employment opportunities for disadvantaged young people and people not receiving
unemployment benefits
Strengthening regional and local employment policies
In interviews representatives of LASA stressed in particular the importance of (1) education and skills
tied to local economic needs and (2) mind sets and social skills, which includes entrepreneurship and
creating new businesses. Entrepreneurship and business development are regarded as depending mainly on
the ability of people to have an entrepreneurial approach. Innovation too is seen as a function of education
29
See Operationelles Programm des Landes Brandenburg für den Europäischen Sozialfonds in der Förderperiode
2007 bis 2013.
GERMANY
35
and skills. This emphasis on training and skills reflects the particular focus of LASA on labour market
issues. Infrastructure, in particular the new international airport under construction and access to broad
band data, especially in outlying areas, are also deemed important. Because of EU guidelines it is
sometimes difficult to provide needed support, for example, for broadband infrastructure.
State labor policy expenditure in Brandenburg over the 2007-2013 period is projected at € 825 million
(including 25% national co-financing) of which about 17% is earmarked for Priority 1 (Adaptability and
competiveness), 39% for Priority 2 (Enhancing human capital) and 38% for more traditional labour market
programs.
A noteworthy innovative approach in Brandenburg is the introduction of regional budgets which
enables 18 counties and cities to develop and implement their own local initiatives for the unemployed.
Under the program the regions receive a global grant on the basis of a regional concept and policy targets
negotiated with the ministry and are encouraged to develop new programs for the region that go beyond the
standard policy portfolio of federally financed programs. An important goal is to link labour market
programs to regional economic development. In the first year of the current ESF funding period regional
budgets totalled €18 million or about 15% of the Brandenburg labour policy budget. The regional
proposals are required to articulate a local strategy based on a SWOT analysis, define operative targets and
output and outcome indicators. The LASA administers the program, providing technical support and
advice to the regions and quality monitoring for the Ministry.
3.1.2. Policy actions
The Labour Policy Program of the State of Brandenburg establishes specific programs designed to
influences these drivers/ promote these policy goals,30
whereby the Labour Ministry regards its activities
as supplementary to the labour market programs of the Federal Government and complementary to the
economic development activities, for which the state Economic Ministry is primarily responsible.
Principal programs listed by priority area are:
Priority 1: Adaptability and competitiveness of employees and firms
Programmes:
1. Promotion of skills management and critical skills in SMEs
2. Promotion of part-time work for unemployed youth after completion of training
3. Promotion of family-friendly personal policies in SMEs
4. Support for business start-ups
5. Business incubators for young entrepreneurs
6. Business competence centers for artists and creative occupations
Priority 2: Enhancing human capital
1. Promotion of higher education and career services
2. Promotion of apprenticeship training for youth without a regular apprenticeship
3. Promotion of apprenticeship training in craft enterprises
4. Promotion of a voluntary ecological or social year for youth
30
MASGF, Arbeitspolitisches Programm Brandenburg. In Menschen investieren –Regionen stärken. Potsdam 2007
FRAMEWORK FOR INFORMATION EXCHANGE IN LOCAL DEVELOPMENT
36
5. Projects for career orientation in high schools
6. Qualification network projects for SMEs
7. Projects to improve the quality of training and further training
8. Qualification and training programs for older workers (50+)
Priority 3: Access to employment and social integration of the disadvantaged
1. Projects to increase the employability of and reintegrate the long-term unemployed
2. Social-pedagogical support for disadvantaged youth entering training or employment
3. Youth projects to prevent school drop/ increase graduation rates
4. Qualification programs for inmates/for the reintegration of former prisoners
5. Regional budgets
6. Job creation measures
The fourth strategic strand foreseen by the EU OP, transnationality, should also be mentioned, of
which participation in this international project is an example.
In interviews local actors on the labour market side stressed in particular the importance of their
business incubator program to support business start-ups (Lotsendienst”), the regional budgets described
above and LASA‟s Training Data Bank.
The Training Data Bank is a service to individuals and employers seeking opportunities. It supplies
current and comprehensive information on training providers and training opportunities in Brandenburg
and Berlin of all types. Training providers themselves are responsible for their own content. Currently
(Sept. 2008), it contains 54,718 course offerings from 722 providers in Berlin and Brandenburg. It was
judged to be the 3rd best such data bank in German (out of 25) in a recent survey by a consumer magazine.
3.1.3. Information to support policy
The ESF operational program for Brandenburg, which is in practice identical with the Brandenburg
labor market program, defines 18 outcome indicators and targets for 14 specific local strategies and 18
output indicators for the corresponding program activities (see above) for the 2007-2013 planning period.31
Measurement of the outcome indicators is diverse. In nine cases it is self-collected by the Labour
Ministry or its agents, based on commissioned evaluations (6), LASA surveys or monitoring data (2) and
on the Brandenburg Training Data Bank (1). Three indicators are based on a national employer panel
survey in which the Brandenburg Labour Ministry funds a special section on the region with an enlarged
sample. For five indicators recourse is to externally available information sources: the PES (2), Federal
Institute for Educational Research (2) the Brandenburg Education Ministry (1). In one case the source of
the indicator is unclear.
The 18 program output indicators are completely based on self-collected monitoring data. The
monitoring system for output indicators is based on project information supplied by the service provider at
the beginning and end of a project and at the end of each year (“Stammblattverfahren”). Standard
information is collected on (1) project formalities; (2) relevance to EU horizontal themes; (3) beneficiaries
of the project; number and characteristics of participants; (4) type of services provided etc. This
31
See Appendix 2 of the ESF-OP for Brandenburg.
GERMANY
37
information is supplemented by data collection on individual participants and participating enterprises in
Brandenburg.
The target values are cumulative for the entire planning period and ESF operational program only
foresees an interim evaluation and does not specify the frequency of performance monitoring. According to
LASA, their monitoring data are used (1) for reporting to the Labour Ministry, mostly for the annual report
and the financial reports as well as for inquiries from the regional parliament, and other state and national
ministries; (2) for internal use in quality assurance and controlling.
Evaluations are conducted regularly on major labour market programs, typically at the mid-term and
end of the program cycle.
Two important examples of locally collected data to support policy are (1) the Skilled Labour
Information System and (2) the Brandenburg Enterprise Monitor. LASA‟s Skilled Labour Information
System provides individuals, service providers and local policy actors with online information in PDF-
format on trends in employment, demography, education and training and unemployment at a detailed
level (sub regions and industries), including the growth industries and regional clusters (“growth poles”)
that are the focus of current economic development policy (see 3.2 below). The principal aim of the
information system is to identify current and future skill shortages at the sub-regional level. The data in the
system is based on externally available information and the principal value added is in the collection and
presentation of the data for users at a sub-regional level. This is the only regional monitoring system of its
type in Germany.
The information system is being continuously developed. Future improvements in the on-line
presentation might include the use of interactive data - currently the data bank is based on Excel-Tables
available on-line for individual indicators in a PDF-Format - and more frequent updates of the published
data.32
Standard software could be used to identify who is using the data on the LASA website, for
example, to make case for continued funding or to decide which information services should be further
developed.
The investment in the skills information system, together with the skills training data bank, reflects
the conviction of local actors in Brandenburg that demographics and skills development are a key driver of
the local economy.
LASA is currently in the process of developing a proposal for the “Brandenburg Entrepreneurship
Monitor” to support its enterprise development policies. Planned is an annual survey of all students and
researcher, and professors in Brandenburg, follow-up surveys of all business start-ups among these groups
and parallel surveys of expert groups in industry, science and politics on topics related to entrepreneurship
(e.g. personal characteristics, interest in business start-up, motivation, assessment of chances and obstacles,
use of public programs, financing, assessment of political and policy environment etc.).
A local company database based on company data from a commercial provider of credit referencing
information and LASA‟s own information sources is also planned. The purpose is to show young people
that there are a lot of job opportunities in the company sector in Brandenburg and to counter the tendency
to seek secure jobs in the public sector.
32
For most indicators the annual data were available in September 2008 only up for the period up to 2006
FRAMEWORK FOR INFORMATION EXCHANGE IN LOCAL DEVELOPMENT
38
3.2. Economic development
3.2.1. Economic development strategy Brandenburg
Brandenburg‟s economic development policy is – like labour market policy – largely formulated,
monitored and evaluated within the frame of state implementation of the European structural funds,
especially the European Regional Development Fund (ERDF). Planned expenditure over the 2007 – 2013
funding period amounts to circa € 2000 million, including €500 million in national matching funds.
The ERDF Operational Program Brandenburg articulates four principal strategic objectives within the
overall Lisbon strategy, in addition to technical assistance and innovation:
Priority 1: Promoting investment and innovation processes in enterprises (44%)
The strategic approach lies in combining financial assistance for investment in the development of
modern plants and for technical and organisational innovations with the provision of advice for both
existing firms and start-ups, thereby generating an integrated overall approach. Specific goals are:
Support for productive investments to modernize capital stock and raise productivity
Promotion of R&D by enterprises, technology transfer and high-tech enterprises
Strengthening entrepreneurial potential (marketing)
Priority 2: Developing infrastructure geared to innovation, technology and education (17%). Specific
goals are:
Linking scientific research to innovation in local enterprises
Improving skill levels through improvements in educations
Support for information technology and e-government.
Priority 3: Business, tourism and transport infrastructures (22%). Specific goals are:
Providing infrastructural support for industrial and commercial development sites
Improvement of road transport infrastructure for regional development
Improving tourist infrastructure
Priority 4: The environment and urban development (15%). Specific goals are:
Urban development
Promotion of environmental quality for sustainable growth
Promotion of investment and innovation processes in enterprises receives the largest share of total
funding of total funding (44%), followed by business, tourism and transport infrastructures (22%), science
and educations (17%), and the environment and urban development (15%).
New Regional Strategy
The new “business cluster strategy”, is the trademark of economic development strategy in
Brandenburg. As described by local authorities, it represents a paradigm shift toward concentration of
assistance on specific growth sectors and promoting networks among actors in these growth industries.
GERMANY
39
Hence the new (since 2005) slogan for business development: „build on strengths – encourage economic
growth and employment”.
Based on a technical analysis 17 growth industries have been identified. Selection criteria were:
Export orientation, close collaboration with research institutions, a higher than average degree of linkage
within the line of business, a high value added and above average economic growth and co-operation with
Berlin.33
The new strategy also has an important territorial dimension: For each growth industry regional
concentrations which have developed in the last decade were identified, altogether 67 industry
concentrations (so-called „BranchenSchwerpunktorte”).Beneath and partly identical with these industry
concentrations - 15 growth poles (“Wachstumskerne”) have been identified for special support. These sub-
regions were selected on the basis of their above average economic or technology potential. Faced with the
policy dilemma of targeting either the less developed peripheral regions or those with more potential,
Brandenburg has moved cautiously toward the latter strategy.
A principal aim of the new strategy is to establish a state-wide SME-network in each of the 17
identified growth industries. Initially, six networks were established34
and further networks are planned.
The cluster management in Brandenburg is divided into three management areas: the operative
network management, the administrative network management and the overall network management.
Whereas operative network management is the task of a network manager elected by the network partners,
administrative support is provided by the ZAB. Coordination of cross-network activities is provided by a
ZAB senior manager supported by an advisory board.
3.2.2. Policy actions on drivers
The above priorities and policy targets are implemented in a wide variety of subsidy, loan and
consulting service programs for enterprises, local authorities and educational institutions. They include:
Priority 1: Promoting investment and innovation processes in enterprises
GA investment subsidies for SMEs
A Risk capital fund for SMEs
Loan guarantees and micro-financing for SMEs
Subsidies for innovative energy saving technologies
Promotion of firm networks
Business consulting services for SMEs
Promotion of international marketing
33
The 17 identified growth industries in Brandenburg are: aerospace industry, automotive industry, biofuels,
biotechnology / life science, environmental and energy industry, food industry, geoinformation, logistics,
media / IT, steel and metal industry / mechatronics, mineral oil, optics, paper, plastics / chemistry, rail
technology, tourism, woodworking.
34 Logistics, automotive industry, biotechnology / life science, geo-informatics, tourism , environmental and energy
industries.

FRAMEWORK FOR INFORMATION EXCHANGE IN LOCAL DEVELOPMENT
40
Priority 2: Developing infrastructure geared to innovation, technology and education ´
Investment in industry-related research capacity in higher education
Model projects for industry-related training and for IT infrastructure in schools
Priority 3: Business, tourism and transport infrastructures
Regional infrastructure development for new BBI airport
Investments in road transportation infrastructure
Regional rail connections
Tourist infrastructure (biking and hiking trails, water ways, local attractions etc.
Priority 4: The environment and urban development
Urban renewal
Neighborhood projects
Investment in urban transport and cultural infrastructure
There is a base level of support allocated to all enterprises and regions and growth industries and
regional concentrations as well as SMEs now receive extra funding.
3.2.3. Policy Information system (monitoring and evaluation)
The management goal and indicator system for regional economic development in the Brandenburg
ERDF Operational Program is more rudimentary than that for the Brandenburg ESF labour market
program described above. No indicators for local strategic goals (drivers) are specified but only circa 20
specific output indicators for program activities (e.g. leveraged business investments of €2,700 million,
assistance to 150 high-tech business start-ups). These output indicators can only be measured based on
self-collected program monitoring data.
Project activities and program targets are monitored on an ongoing basis, primarily by the Investment
Bank Brandenburg, which is responsible for the implementation of most assistance programs, and
published in the annual reports of the Economic Ministry. No detailed information was available on the
monitoring system for economic development program activities.
Evaluation takes place in accord with EU guidelines typically in mid course and at the end of the
project phase. Monitoring and evaluation of the GAnetworks, which is a new and complex task, is the
responsibility of the overall network management at the ZAB. An evaluation of the general approach is
currently nearing completion and a second evaluation on outcomes will be completed in 2010.
Data supplied by the Berlin-Brandenburg statistical office for labor market and economic indicators is
not current. This is due in part for technical reasons but also to the time-lag in making data from national
sources and other Brandenburg ministries available. It is difficult to get some types of data at the local
level, for example, GDP data does not exist below Nuts III and local wage data is not available.
4. Summary and Conclusions
The Brandenburg state administration is a regional actor in a policy field in which the strategic
framework and funding for state policies is largely externally determined by the EU structural funds, which
GERMANY
41
are the principal source of financing. The state government has an important role to play in adapting the
general EU policies to local circumstances and in efficient and effective implementation.
This governance structure is a principal determinant of the policy information system. The EU
planning process mandates, at least pro forma, a strategic orientation, target-oriented policies, the
specification and monitoring of operational indicators for outputs and outcomes, and evaluation of
programs. EU requirements have arguably greatly augmented the spread of a more analytical and indicator-
based approach to policy formulation, monitoring and evaluation.
In both labour market and economic policy there has been a strong and commendable effort to pass on
greater responsibility for initiating and implementing policies to the local or industry levels (“regional
budgets”, “business clusters”), which generates an urgent need for corresponding indicators at the sub-
regional level.
The general measures of development performance used, for example, in the annual reports of the
Labour or Economics Ministry or in the SWOT analysis of the ESF and ERDF operational programs, are
highly standardized indicators very similar to those used in other OECD countries. They are entirely based
on externally available data. The contribution of the regional authorities is to ensure that these indicators
are available for Brandenburg and for its sub-regions and industries within Brandenburg and are presented
in a user-friendly format. With the exception of LASA‟s Skilled Labour Information System, this type of
policy information seems only available in published form and not always readily available for sub-regions
and clusters that are increasingly the focus of policy. LASA‟s Skilled Labour Information System, which is
unique in German, might be more useful to local actors if its scope were extended to include other policy
related indicators and if it offered interactive data on-line.
The policy information system is most developed for program output indicators which are rich for
both labor market and economic development policy. These indicators are (and have to be) based on self-
collected generated by program administrative processes and by other information provided by providers.
For the ESF operational program there are 18 and for the ERDF-OP 20 output indicators reported,
supplemented by rich monitoring data.
Outcome indicators are most developed in the areas of labour market policy. Fifteen such indicators
are specified in the OP, of which 9 are self-collected and 5 are based on external data sources. By contrast,
based on the information available, the ERDF planning documents of the Economics Ministry are heavily
output-oriented and fail to define outcome indicators for the local strategic goals (drivers).
The weakness of the local policy information system developed to meet EU requirements, in spite of
the rich data generated, is that it is primarily defined and collected to meet the accountability requirements
of the EU and not regional and local needs (“feeding the monster”). Local actors indicate a number of
shortcomings in the existing policy information system from a local policy perspective: the time lag for
externally provided data from national sources or other ministries, shortcoming in spatial data for localities
that are increasingly the focus of policy, the need for improved design of monitoring indicators and the to
develop indicators to measure long-term, sustainable outcomes.
Spurred by EU requirements and funding, program evaluation is well developed in Brandenburg and
major programs are systematically evaluated by external research institutes using state of the art methods.
How the extensive monitoring data collected in program administration is actually used by the Labour
and Economic ministries for real time monitoring of progress toward the policy targets (outputs and
outcomes) and how evaluation results feed into the policy process are important questions that cannot be
adequately assessed based on a short study visit and the information available.
FRAMEWORK FOR INFORMATION EXCHANGE IN LOCAL DEVELOPMENT
42
Good practice in Brandenburg
There has been a strong and commendable effort in Brandenburg to pass on greater responsibility for
implementing employment and economic development policies to the local or industry levels (“regional
budgets” and “business clusters” strategies), which has led to the development of innovative practice in
data collection and dissemination to actors at the local level. Noteworthy in particular are LASA‟s the
internet-based Training Data Bank, which supplies current and comprehensive information on training
providers and training opportunities in Brandenburg and Berlin and its Skilled Labour Information System,
which provides individuals, service providers and local policy actors with online information in PDF-
format on trends in employment, demography, education and training and unemployment at a detailed
level (sub regions and industries).
5. Literature
Albrech, Joachim & Jan Maurer, Abschlussbericht zur Evaluation des Ideenwettbewerbs
„Regionalentwicklung stärken - Langzeitarbeitslose schneller integrieren“ (Regionalbudget), Trier,
2007.
Deutsches Institut für Wirtschaftsforschung, Wirtschaftliche Verflechtung zwischen Berlin und
Brandenburg, Berlin 2007.
Hägele, Helmut et. al. Mit dem Lotsendienst in die Selbständigkeit: Evaluation der gemeinsamen
Existenzgründungsförderung durch MASGF und MW im Land Brandenburg, Potsdam, MASGF,
2005.
IAB, Entwicklung von Betrieben und Bechäftigung in Brandenburg. Ergebnise der 11. Well des
Betriebspanels Brandenburg, MASGF Potsdam, 2007.
Jädicke. Wolfgang et. al., Kompetenzen für kleinere und mittlere Unternehmen. Evaluationsbericht und
Potenzialgutachten, Potsdam, MASGF, 2006.
LASA, Geschäftsbericht 2006, Potsdam, 2007.
MASGF (Brandenburg Labour Ministry), Bericht über den Arbeitsmarkt des Landes Brandenburg
2006/200,. Potsdam, 2007a.
MASGF, Operationelles Programm des Landes Brandenburg für den Europäischen Sozialfonds in der
Förderperiode 2007 bis 2013, Potsdam 2007b.
MASGF, Arbeitspolitisches Programm Brandenburg, Potsdam, 2007c Ministerium für Wirtschaft,
Jahreswirtschaftsbericht 2007, Potsdam, 2007.
Ministerium für Wirtschaft, Operationelles Programm für regionale Entwicklung 2007 - 2013, Potsdam
2007.
SPAIN
43
SPAIN
THE CASE OF CANTABRIA REGION
by Carlos Díez, INFYDE, Spain
The following report provides an overview of the information system being used in Cantabria to
measure regional economic development policy‟s impacts, the initiatives that are acting to stimulate the
regional economic key drivers, the description of the regional status of the enablers that constitute the
framework where the companies and the society must develop their socio economic activities.
It also provides a reflection about what are some of the strengths and weaknesses of this regional
information system and some recommendations about how it would be improved.
The report is based on information gathered during the workshop celebrated in Santander on 16th and
17th October 2008. The workshop was organized by the Economic Development Agency of Cantabria
SODERCAN and it was attended by technical staff working in developing the regional information system
and also by representative persons from the Regional Government.
1. Territorial development and socio economic challenges of Cantabria Region
Cantabria with 570,000 inhabitants is a coastal region in the north of Spain bordered by mountains to
the west & south. Historically the region has had a tendency to maintain incommnunication mainly due to
geographical reasons. Thus leading to the lack of vial infrastructures needed to connect the region with the
rest of the Cantabric regions & central Spain and to the social & cultural idiosyncrasy of the local
population focused more on growing step by step cementing quality of life rather than undertaking more
risky industrial activities in the region.
During the last three decades Cantabria has experienced a progressive process of socio economic
transformation. In this period the Regional and National Governments have faced a strong investment
process focused on constructing and improving the key infrastructures aimed at creating the general
framework for the adequate development of the socioeconomic activities in the region.
One of the more relevant investments has been the urban regeneration in the eighties of Santander; the
beautiful capital of the region. This has greatly improved the tourism attraction effect at national and
international level.
Further investments include the construction during the nineties of the regional network of highways
which now contribute to facilitate road communications with neighboring regions & the rest of Spain &
with Europe.
The encouragement by the Regional Government with the support of the European Regional
Development Fund ERDF in the early XXI century has been key in defining & implementing regional
economic policies aimed at developing the regional innovation system; opening business mentality to the
regional economic actors.
FRAMEWORK FOR INFORMATION EXCHANGE IN LOCAL DEVELOPMENT
44
The consistent development of this general regional framework in the favorable international context
has contributed to the fact that Cantabria has enjoyed an expansive economic cycle in the period 2001-
2007. During this period the regional Gross Domestic Product GDP per capita has grown 2,6% above the
Spanish average, reaching 100.9% of the EU-27 average. The structure of this GDP in 2007 has been
2.87% in agriculture, livestock & fishing sector; 31.38% industry & construction sector; 67.64% services
& finance sector. All these rates are all very similar to the Spanish averages.
The industry sector is represented by means of the existence in Cantabria of a relatively well
developed automotive industry principally made up of multinational companies, localy located factories in
the region aimed at operating as tier 2 links in the global automotive added value chain. The construction
sector rose from the 7.5% in 2000 to 12.64% of the total regional GDP in 2007, coming in well above the
EU-27 rate of 6.5%. This relatively greater importance of the construction sector in the economic structure
could appear as a regional weakness which could affect the progression process of the regional cohesive
growth in the next few years.
Moreover the service & finance sector is important in the regional economy mainly due to the tourism
industry & the presence in Cantabria of local financial entities such as Banco Santander operating in
international markets, & also regional commerce and administrative activities.
The relative importance of the construction sector in the regional economic structure; employing
lower skilled workers has also constituted one of the factors that have influenced the not so positive
evolution of the regional productivity rate, which decreased 0.37% in the 2000-2006 period.
Another key factor affecting this negative evolution of the productivity rate has been a lack of effort
by the regional socio economic agents to invest in R&D+I activities. Cantabria invested in R&D+I
activities 0.8% of its GDP in 2006 increasing from 0.44% in 2004, below the Spanish (1.2%) and EU-27
(1.84%) averages. The distribution of this expenses is made up of 1/3 private investment and 2/3 public &
university investment. Comparing this with the EU-27 balance of R&D+I, the ratio here is the contrary.
This lack of investment in advanced knowledge & technology based entrepreneurial projects has had a
bearing on the stagnant evolution of the regional productivity in the last few years.
Nevertheless, the regional economic competitiveness has started to improve steadily since 2002
mainly due to the favorable results obtained as a result of successful promotional plans realized by the
public sector. Plans such as restructuring the regional innovation system, the assignation of more added
value knowledge and technology based innovative activities (public resources intensive) & the incremental
participation of the regional economy in international import-export activities supported by the
improvement of regional infrastructures.
The labor market has 282.000 active persons, making up around 57% of the regional population; an
increase of 13.300 workers in the last five years. 20.000 new jobs have been created. The employment rate
has risen from 45.2% in 2001 to 52.9% in 2007 in line with the national employment average. The
unemployment rate has decreased to 5.9% in 2007, a figure which constitutes a frictional unemployment
rate associated with the time it takes an unemployed worker to find a new job. In Cantabria in 2007,
21.64% of the total working population was made up of graduates. The job market only offered 18.75%
employment possibilities to this sector. This shortfall is another important key lack that is influencing
clearly in the evolution of the Cantabria‟s economy.
2. Cantabria region Governance system
Cantabria is one of the 17 Autonomous Communities of Spain established by the Spanish Constitution
of 1978. The article 2 of the Spanish Constitution recognizes and guarantees the right to the autonomy of
SPAIN
45
all nationalities and regions that integrate the Spanish State. The text of the Constitution and its later
legislative developments establish the level of political, social and economic competences that each
Autonomous Community has in the European Union framework.
In this context, Cantabria has its own Regional Parliament and its own Regional Government that are
the bodies in charge of performing the regional competences in the fields of employment, social affairs,
justice, industry, technology development, infrastructures, territory ordination, housing, urbanism, rural
development, livestock, fishing, biodiversity, economy, finance, environment, culture, tourism, sports,
education and health.
In 2003 the Regional Government of Cantabria elaborated the so called I Governance Plan 2004-
2007, & afterwards in 2007 it defined & launched the II Governance Plan 2008-2011 which is being
implemented nowadays. The general goal of these Governance Plans has been to boost the employment
creation and the modernization of Cantabria by means of fostering the durable and equitable economic
development. The strategic vision of these Plans is to put Cantabrian living standards on a par with
prosperous European regions.
To achieve this vision & goal of the Governance Plans, eleven operational axes & 275 measures have
been implemented. Axes such as R&D+I strategy, investment in human capital, reinforce the social
cohesion & quality employment in the labor market.
In order to better monitor the Governance Plan implementation, a Management Scoreboard was
designed based on a set of indicators aimed at analyzing the performance & impact of the activities &
projects being carried out in the framework of each operational axe.
In this sense, there is a set of indicators focused on reporting about the activities achievement
(monitoring indicators), the finance performance (budget indicators), and the impact of the Plan activities
to the socio economic reality of Cantabria (impact indicators).
The elaboration of this methodological guide is aimed at supporting the regional socio economic
agents to identify the direct and indirect sources for gathering information related each indicator, and at
indicating that the Statistics Institute of Cantabria ICANE will be the responsible body for doing the
assessment of the axes & measurements in co-operation with other regional public administration bodies,
such as regional Ministries, regional General Directions, & other public autonomous organisms.
3. Key drivers fostering Cantabria region transformation
Five initiatives were selected to explain the Cantabria‟s region socio economic evolution in the early
XXI century. The performance of these initiatives acts as regional key drivers. This report provides an
overview of these selected initiatives, describing their objectives, main activities carried out, results and
impacts achieved & problems they have had to face.
3.1. R&D+I Regional Plan 2006-2010
The Government of Cantabria has launched the R&D+I Regional Plan 2006-2010 whose aim consists
on structuring & supporting Regional Government actions focusing on positioning Cantabria in the
Knowledge Economy & allowing it to converge with the richest and more prosperous regions of Europe.
The R&D+I Regional Plan 2006-2010 was defined as one of the twelve strategic axes of the I
Governance Plan 2004-2007 and has also continuation as an axe in the II Governance Plan 2008-2011. The
strategic objectives of this R&D+I Regional Plan 2006-2010 are the following:
FRAMEWORK FOR INFORMATION EXCHANGE IN LOCAL DEVELOPMENT
46
1. Consolidation in the region science and technology international poles in areas of future interest
for Cantabria.
2. Foster the added value generation process in regional industry.
3. Encourage the networking articulation of the Regional R&D+I system
4. Boost the knowledge transfer process from the regional science and technology system to
companies.
5. Develop the innovation capacity of the regional socio economic agents.
In order to manage this Plan, the Regional Government created the Society for the Development
R&D+I in Cantabria. This body is in charge of the definition and co-ordination of the programmes, the
management of the calls, and advice to the Regional Government in the field of R&D+I policies.
R&D+I Regional Plan 2006-2010 has a monitoring system & also a set of indicators aimed at
assessing the evolution of Cantabria & establishing quantitative objectives for the development of the
regional R&D+I until 2010.
The R&D+I Regional Plan is focused on promoting the valorization and development of the following
regional key drivers:
Knowledge creation by means of stimulating co-operation between the University and the
economic tissue
Investment in R&D+i
Rationalization of the policies & strategies implemented by the regional innovation system agents
Internationalization of high added value technology based industrial activities
Integration of regional agents in national and international knowledge development networks
Strengthen the regional base of advanced services companies
3.2. EQUALCREA
EQUALCREA is a project financed by the European Social Fund under the Community Initiative
EQUAL that is aimed at promoting enterprise creation & supporting entrepreneurs.
Its final purpose consists of opening the process of businesses creation, relocated in good ideas
business, creativity of young people, immigrants, long-term unemployed, workers over 45, ethnic
minorities & women.
EQUALCREA defined and implemented regional tools for business creation and employment in rural
and urban areas, through an integrated model of enterprise development with a strong presence throughout
the territory.
The fields of activities of EQUALCREA have been the environmental sector enterprises (protecting
natural areas, waste management, alternative energies), cultural and leisure services companies
(audiovisual, cultural heritage, sustainable tourism), rural areas located enterprises (agro industrial, craft
SPAIN
47
industries, beekeeping, green agriculture and livestock Green), new technology enterprises (monitoring
systems, electronic systems, electronic identification), and third Sector Companies (child and aged care,
home delivery).
The key drivers in EQUALCREA initiative have been:
Technical training for entrepreneurs
Improvement in the quality of the employment generated by the new companies created & start
ups
Innovative grants focused on financing technology based innovative entrepreneurial projects
Generation of high added value jobs for the better qualified regional human capital
3.3. EMPRECAN
EMPRECAN is a service provided by the Regional Economic Development Agency SODERCAN
aimed at fostering business creation at regional level.
Its main objectives consist of stimulating the entrepreneurship culture in Cantabria, advising
entrepreneurs in the business creation process, promoting specific actions focused the creation of
technology based companies, supporting & consolidating the new regional businesses & providing finance
to new start ups.
EMPRECAN also work on the identification of international investors & business investment projects
with the aim of presenting the attractiveness of Cantabria to competitive businesses, & support for
investors in the feasibility analysis of their investment projects.
The services that EMPRECAN provides to the new entrepreneurial projects in the region are advice in
the elaboration of feasibility analysis, technical advice in the elaboration of business plan & market studies,
entrepreneurial training, & other specific grants focused on strengthening new business management and
finance.
EMPRECAN works on activating and improving the following key drivers:
Business incubation
Services and advise to entrepreneurs
Innovative finance schemes oriented to innovative start ups
Promote the entrepreneurial culture
3.4. ESTER
In a small region like Cantabria, with limited scientific and technological resources, the programme
ESTER is designed to improve the ability to produce policies that strengthen the technological capability
required for new technologies to develop and flourish in sectors with major growth potential, thereby
helping to increase global competitiveness in the Community of Cantabria.

FRAMEWORK FOR INFORMATION EXCHANGE IN LOCAL DEVELOPMENT
48
ESTER contributes to putting policies to the test through two pilot experiences, one in an existing
sector and the other in an emerging one.
First, magnesium casting technology in the ancillary automotive industry, which helps to consolidate
and improve the experience accumulated and the currently operative technological infrastructure, such as
the Components Technology Centre (CTC).
The other involves the biotechnology industry promoting the region‟s strengths in knowledge &
human capital based resources at the Marqués of Valdecilla University Hospital (HUMV) & the University
of Cantabria.
The lessons learnt while fostering these two policies have been used to improve the regional capacity
in the use of structural funds in regional competitiveness policies.
The ultimate aim of ESTER is to develop economic policy instruments that facilitate the development
of new technological capabilities in a small region with scarce R&D supply resources, for which the region
has to maximize its internal resources & build a cooperation and experience exchange network on national
and international level.
These objectives of ESTER form part of the SODERCAN global innovation policy strategy and of the
Cantabrian Regional R&D+I plan. Furthermore, ESTER is in line with the spirit of the regional innovation
strategy, acting as a style of laboratory for “border-line” ideas.
ESTER develops activities aimed at promoting the creation & development of clusters, supporting
research activities in the regional automotive sector, and stimulating the generation of biotechnology
entrepreneurial activities in the region.
ESTER works on activating & improving the following key drivers:
Activation of cluster dynamics
Promotion of emerging sectors in Cantabria
Introduction of the innovation culture in traditional industrial sectors
4. Enablers contributing to Cantabria region transformation
In this chapter we concentrate on the identification & analysis of the enablers that contribute to the
activation of regional socio economic development. These enablers are to some extent intangible factors &
as such not so easy to measure. Some reflections that have contributed to create an idea of the existing
institutional and social capacities that configure the regional general environment for running businesses
are presented.
4.1. Leadership
There are some leaders in the public sector (University, Regional Government, high prestige
politicians, scientists, etc) & also in the private sector (Bankers, entrepreneurs, sportsmen, writers, etc.).
In general, it is possible to say that the regional leaders are very focused on being the best in their
professional, cultural and social fields. They are good representatives of the region in the larger world, but
there is a lack of a common regional strategic vision, a vision that would provide these leaders a common
content & motivation to sell the brand “Cantabria” in the world.
SPAIN
49
It appears as if the regional actors don‟t mind not to having a consensus about the regional vision that
identifies the key factors contributing to the socio economic development of Cantabria. In this context, it is
difficult to organize the efforts of the regional leaders in boosting the image and presence of Cantabria at
national and international level.
This lack of a defined regional vision appears to be contradictory with the existence of a strong
identity with the city of Santander, the capital of the region. This identity is more developed at social level
being displayed as a feeling of belonging to the capital city rather than an economic one. A more
professional and strategic approach of what a vision must be is needed for running businesses.
4.2. Social Capital
In the region there are very potent agents such as the Chamber of Commerce, Industry & Navigation
of Cantabria, the Confederation of Regional Companies CEOE, & the Regional Association of SMEs. The
work for involving regional actors in the socio economic policies definition process is done within these
local social bodies.
There is not a strong “social economy” that operates as a “third sector”. There are some cooperatives
developing agriculture, fishing & livestock businesses in the rural and coastal areas.
Nevertheless, there is a very strong public sector in the region mainly made up of the Regional and
National Administration, the Public University, & the Hospital Marques de Valdecilla. The latter being an
important Health Institution for whole of Spain in some medical specializations such as heart disease &
surgery.
This contributes to explaining the important contribution of the public sector to the R&D+I investment
figures in the region.
4.3. Partnership
In this framework there are some factors that affect the partnership culture in the region. One of them
is that the decision centers of the more important companies are located outside the region. This makes it
difficult for the University and the public sector to meet with company directors with a view to establishing
possible partnerships for defining and launching innovative projects.
Another factor is that Cantabria is a very small region and it is very difficult to design & implement
sectorial policies due to the lack of critical mass of companies and sectorial agents.
Finally, it has been observed that University researchers are more oriented to the development of
basic research projects allowing them to strengthen their academic career rather than participate as partners
in applied research projects with small & medium sized companies.
This divertion from their academic priority activities does not provide them with relevant economic
and knowledge returns.
In spite of this, there is a positive concert culture in the field of labor market policies, based on a
substantive partnership commitment with the consensus process for defining and implementing
employment & training policies by means of the so called “Social Dialogue”.
FRAMEWORK FOR INFORMATION EXCHANGE IN LOCAL DEVELOPMENT
50
5. Indicators system
At what level are the drivers & enablers described in the previous chapters measured? An adequate
way by means of using a set of objective, realistic, easily handled, & feasibly feed set of indicators
regularly accessible for the socio economic regional agents and companies are needed.
In Cantabria there is a Regional Statistic Institute ICANE which is the regional public body created in
2004 in charge of production and diffusion of the statistics related with all socio economic aspects of
Cantabria.
The methodology of ICANE is very similar and in a lot of cases almost the same as the the National
Statistic Institute INE, which organises all the State socio economic information by regions. Both
methodologies are harmonized with the one from EUROSTAT.
Moreover, SODERCAN has a database compiling all the information coming from the work with the
companies at regional level. This database provides basic information to the policy makers about the
general addresses of the companies, useful for defining geographical information & technical services. But
it does not provide publicly available information to the regional society about some strategic indicators
such as the figures on the realistic private investments in R&D+I, the level of co-operation of the
companies with other regional innovation & economic agents, or the industrial and economic needs that
the private sector has.
In this context, SODERCAN is working on realizing a survey of the most relevant 500 companies
located in Cantabria oriented to building a micro data landscape that describes how the day by day
economy within the regional companies is.
6. Learning points
The set of indicators established in the II Governance Plan 2008-2011 is very extensive & detailed
providing covertures to all the strategies of each axe, but this wide Scoreboard is not well taken into
account by the Statistics Institute of Cantabria ICANE for elaborating its periodic reports & statistics.
Moreover, some of the indicators established in the Plan are difficult to measure because there are not
direct public or private information sources available for collecting feasible information required to
compile them.
In this sense, the existence of the very detailed battery of indicators gathered in the Plan is not useful
for the clear picture about what is going on the socio economic reality due to impossibility of collecting
periodically measurable information from the ground.
Besides, there is not a proactive information system aimed at facilitating the regional socio economic
actors the access to completely feasible information related the performance of the II Governance Plan
2008-2011 indicators. This situation has happened because the Statistics Institute of Cantabria ICANE
apparently does not consider the strategic objective of feeding in a systematic way the set of indicators of
the II Governance Plan 2008-2011 and diffuse it widely and periodically in an easy manageable form for
all the regional companies and agents.
In this sense, there is a lack of coherence between the system defined to measure the achievements &
impact on the regional socio economic development of the II Governance Plan 2008-2011, & the Statistics
elaborated & published by ICANE. To address this question, the Governance Plan should define a shorter
list of indicators that would contribute to facilitate the work of measuring and processing & also would
allow the elaboration of better diagnostics focused on presenting clearer evidence & conclusions to the
SPAIN
51
society & economic agents related to what has been the regional evolution and transformation throughout
the years.
In this small region the agents are very near the ground and they think they know the socio economic
needs. Perhaps because of this, they think it is not necessary to design a system for collecting information
from the ground and managing it with the aim of better analyzing, giving support in the decision making
process. As a consequence, the local & regional agents don‟t have a regularly available adequate set of
indicators that would allow them to study and to rewrite socio economic development stories on the basis
of the intelligent analysis of the objective data.
7. References
Cantabria, a place to invest in industrial sectors. Gobierno de Cantabria 2007
II Plan de Gobernanza 2008-2011. Gobierno de Cantabria 2008
OECD LEED Entrepreneurship and Local Innovation Systems Reviews. The case of Cantabria. 2008
R&D+I Regional Plan 2006-2010. 2006
Webs visited during the realization of the work:
European Statistic Institute EUROESTAT: www.ec.europa.eu/eurostat
National Statistic Institute INE: www.ine.es
Regional Statistic Institute ICANE: www.icane.es
SODERCAN: www.sodercan.es

UNITED KINGDOM
53
UNITED KINGDOM
THE CASE OF GREATER MANCHESTER
by Kieron Hyams, Ove Arup & Partners Ltd, United Kingdom
1. Introduction
1.1. The FIELD Project
The Organisation for Economic Co-operation and Development (OECD) is aiming to create a
Framework for Information Exchange in Local Development (FIELD). The FIELD is intended to be a tool
that local development organisations can use in order to collect, exchange and learn from local
development information for their own area, and other areas.
The FIELD project is drawing upon 12 local development organisations, comprising six OECD
member countries and six observers from new European Union member states. Once the methodology is
developed, it is intended to be rolled out more widely.
1.2. The Mission to Manchester
The OECD mission to Manchester took place on 11th
September 2008. The overall structure of the
day was similar to the other OECD FIELD missions, focusing on:
performance outcomes: how is your locality performing;
measuring local development drivers;
capacity mapping; and
building policy instruments that work across regions.
Throughout the course of the mission, partners were consulted on their views and experiences. The
mission drew on people from the following organisations:
AGMA - the Association of Greater Manchester Authorities;
Bolton Metropolitan Borough Council
Manchester Enterprises; and
the University of Manchester Business School.

FRAMEWORK FOR INFORMATION EXCHANGE IN LOCAL DEVELOPMENT
54
The OECD extends its thanks to Manchester Enterprise and others for hosting the mission and
providing their expertise, and for their continued support of the FIELD project.
1.3. Manchester: Structural and Local Policy Context
Greater Manchester now has around 2.6 million people living within its boundaries, with another 7
million in the wider region and a further 11 million living within 50 miles of the City of Manchester.
Greater Manchester is the largest sub-regional economy outside London. (Source:
http://www.agma.gov.uk/ccm/navigation/agma-membership/)
Figure A. Greater Manchester
Source : based on http://www.investinmanchester.com/
The Greater Manchester metropolitan area lies within the North West of England (above, left). As a
city centre encompassing its surrounding centres and suburbs, Greater Manchester was organised into ten
separate local authorities as part of boundary adjustment in 1974. The ten authorities (above, right) are:
Bolton Metropolitan Borough Council;
Bury Metropolitan Borough Council;
Manchester City Council;
Oldham Metropolitan Borough Council;
Rochdale Metropolitan Borough Council;
Salford City Council;
Stockport Metropolitan Borough Council;
Tameside Metropolitan Borough Council;
Trafford Metropolitan Borough Council; and
Wigan Metropolitan Borough Council.

UNITED KINGDOM
55
Within the United Kingdom local authority structure, each of the Greater Manchester local authorities
are „unitary authorities‟ - in effect single-tier local government entities combining the responsibilities of a
„district‟ and a „county‟ authority. Typical responsibilities of a unitary authority include:
business and economic development,
housing policy and social provision (usually contracted to dedicated providers),
social services (welfare),
environmental health (wellbeing and conformity),
land use planning and policy (spatial policy and control of development),
education and learning (excluding mainstream schooling),
local leisure, tourism and culture; and
regeneration.
Areas such as policing, fire safety and healthcare are usually handled by other relevant bodies at
differing geographic scales. For Greater Manchester, transport and strategic policy and implementation is
led by the Greater Manchester Passenger Transport Authority (policy and planning) and the Greater
Manchester Passenger Transport Executive (management and implementation of public transport).
Collectively, the Greater Manchester authorities and other partners have pooled resources to create,
support and work alongside a number of „over-arching‟ bodies with particular area of policy focus.
Examples include:
AGMA – the Association of Greater Manchester Authorities
MIDAS – Manchester‟s Inward Investment Agency
ME – Manchester Enterprise
Marketing Manchester
Manchester: Knowledge Capital
Considerable policy-making, implementation and scrutiny work is undertaken at a regional level.
Relevant bodies include the North West Regional Development Agency (NWDA), the Government Office
for the North West (GONW), and the North West Regional Planning Body (NWRPB).
There is also evidence of significant cross-working between the bodies outlined above and regional
elements of national policy-makers and delivery bodies such the Learning and Skills Council, and Job
Centre Plus.

FRAMEWORK FOR INFORMATION EXCHANGE IN LOCAL DEVELOPMENT
56
2. Local Development Information in Manchester
2.1. Introduction
Part of the purpose of the mission to Manchester was to identify the way(s) in which local
development information is used. This section identifies the main local policy documents that exist within
the study area, and for each of these the sorts of data and/or indicators that are included. This is then
developed by examined the potential indicators which might be used in a „dashboard of indicators‟. The
purpose of a dashboard of indicators is to provide a slimmed-down version of the data used in policy to
provide an illustrative summary of the time period being examined.
2.2. Inventory of Local Policy Instruments
Within this section a number of the main local policy documents, and/or the organisations that prepare
them, are outlined and examined in the context of the level and use of local development information. It is
not intended to be an exhaustive list, and should be read in conjunction with the „Information Fiche for
FIELD Participant Authorities‟ completed for the Manchester study are by Manchester Enterprises, and
provided as Section 4 of this report.
This section does not cover the numerous national-level government policies and plans.
2.2.1. The Manchester Multi-Area Agreement
Agreed in June 2008, as part of the first wave of multi-area agreements within England, the
Manchester Multi-Area Agreement (MAA) is a partnership between the ten Greater Manchester authorities
made „on behalf of the communities of Greater Manchester, our people, businesses, voluntary and
community organisations‟.
The MMA provides a commentary of baseline conditions in the city region, supplemented with
selected data examples. It identifies the „drivers and blockers of growth‟
The MAA identifies ten key performance indicators (KPIs) as a mechanism to track the progress of
the MAA, which are:
Total annual real Gross Value Added (GVA) output (£);
GVA per hour worked (£);
Total employment (numbers of employees);
Overall employment rate (% working age population);
Working age people on out of work benefits in worst performing neighbourhoods (% working
age population);
Proportion of adults qualified to Level 2 or higher (% of adult population);
Proportion of adults qualified to Level 4 or higher (% of adult population);
Stock of VAT registered companies (numbers of firms);
UNITED KINGDOM
57
Percentage of non-car morning peak journeys to the regional centre (% of total); and
Net additional homes provided (units).
Whilst it is too soon to evaluate the effectiveness or strengths and weaknesses of the MAA,
Manchester Enterprises are confident that the KPIs selected are measurable and accurate. The only possible
exception to this is the normal (and nationwide) issues around the accurate estimation of GVA – there is
often significant variation between estimated levels and eventual recorded „outturn‟ levels, and both
measures are based on a sample. The inclusion of a climate change KPI was rejected on the grounds of
unreliable data at this stage.
The KPIs are accompanied by a range of scenarios, to provide adequate contextualisation for the
eventual level of outputs. These KPIs, are in turn, linked to both national targets and the „building blocks‟
identified and to be further contextualised by the Greater Manchester Strategic Plan.
2.2.2. The Greater Manchester Strategic Plan
Billed as the first „building block‟ of the Manchester Multi-Area Agreement, the Greater Manchester
Strategic Plan (GMSP) once fully developed will provide a framework for the other building blocks, which
are:
Reducing worklessness (unemployment and inactivity);
Strengthening the skills offer and human capital;
Encouraging business expansion, entrepreneurship and SME development to generate growth;
Attracting and enhancing inward investment, knowledge and innovation;
Developing infrastructure to ensure the sustained growth of the city region;
Achieving more by targeting aspirations and abilities of young people (aged 14-19); and
Helping reverse the imbalance between housing supply and demand to meet the housing needs of
a competitive city region.
The GMSP will be delivered by seven thematic strategic commissions. Since delivery has not yet
begun it is not possible to comment on the effectiveness of the process and any outputs from it.
More detail on the role of the GMSP in addressing these is provided within section 6 of the
information fiche, provided within section 4 of this report.
2.2.3. The Greater Manchester Forecasting Model
The Greater Manchester Forecasting Model (GMFM) was developed by Oxford Economics (OEF)
and was first released in 2005. The GMFM is a sector driven model used to generate forecasts, and is not a
stand-alone model but based on numerous data inputs including a range of national and more local
statistics from the city region.
FRAMEWORK FOR INFORMATION EXCHANGE IN LOCAL DEVELOPMENT
58
The main strength of the GMFM is that it is an integrated model that includes and combines
employment, demographic and housing data and forecasts. It can forecast up to 2026 on a „policy neutral‟
(and unconstrained) basis. The range of data within the model covers:
Demography
Population
Migration
Births and deaths
Natural increase
Labour market
Employee jobs
Self-employed jobs
Total employment
Resident employment
Net commuting
Unemployment
Occupations
Skills
Economy
GVA
Relative productivity
Average earnings
Consumer expenditure
Household income
Housing
House prices
Housing stock
Households
The model has not been described as particularly user friendly, although the outputs are in spreadsheet
format and are easily manipulated. The model, like most nationally-based econometric models which
disaggregate to a local level, is susceptible to the effect of wider macroeconomic trends, although model
controls can limit the effect this has. Manchester Enterprises advise that they help in this regard, supplying
some „bottom up‟ data inputs into the “accelerated growth scenario”. They also felt that the model
currently handles productivity badly, but this is being worked on and outputs are given an enriched
narrative until the new model is rolled out.
The current version of the GMFM is still quite „shift-share‟ based, and a review is currently under
way to move from this towards a more „input-output‟ model. The revised version of the model is expected
in late 2009.
2.2.4. Manchester Enterprises
Manchester Enterprises (ME) – Greater Manchester‟s economic development and inward investment
agency – are responsible for compiling and using a great deal of local development information. ME have
around ten staff involved in gathering, checking, managing, analysing and reporting on data trends for the
Greater Manchester city region.
UNITED KINGDOM
59
Historically, some of these function overlapped those of the Greater Manchester Research Unit, which
was (until it was wound up in 2004) the strategic research and information service of the Association of
Greater Manchester Authorities (AGMA), although residing within Oldham Borough Council. The
research unit published periodical statistical releases for a more general audience, in contrast with the
applied approach of ME. As a result of this applied approach, ME has considerable policy influence both in
servicing its member authorities and organisations and in producing and commissioning its own works.
Recent policy outputs include:
The Economic Impact of Climate Change
Greater Manchester Skills Analysis and Priorities
The Rural Development Programme for England Greater Manchester Implementation Plan
The Greater Manchester City Strategy Business Plan
The City Region Development Plan 2006
The Greater Manchester Economic Development Plan 2004/05 – 2006/07
Key economic sector profiles, including:
Aviation (including Manchester Airport)
Construction
Creative / Digital / New Media
Customer Contact Centres
Education
Environmental Technologies
Financial and Professional Services
Hospitality and Tourism
ICT Digital / Communications
Life Science Industries
Logistics
Manufacturing
Public Sector
Retail
Sport
Key geographic profiles, covering Greater Manchester as a whole, and separate profiles for each
of the ten local authorities.
2.2.5. Manchester City Region Development Programme 2006
Within the context of the „Northern Way‟ regeneration initiative (involving the three northernmost
English regions and trying to reduce the gap in GVA between this regions and the rest of the UK), the
Manchester City Region Development Programme (MCRDP) sets out the vision for the city region and
actions required to fulfil that vision. This is placed in the context of the main growth „poles‟ or focus
sectors of the economy:
Manchester Airport;
FRAMEWORK FOR INFORMATION EXCHANGE IN LOCAL DEVELOPMENT
60
Financial and professional services;
Life science industries;
Creative / digital / new media sectors;
Manufacturing; and
ICT Digital / communications.
The framework for these is provided through the use of GVA as the measure by which partners assess
economic performance. The drivers of GVA growth are identified as:
Productivity growth – aiming to produce more using existing resources (sometimes referred to as
„smart growth‟, although smart growth also has spatial development connotations);
Growing demand / markets – aiming to bring about an increase production in response to an
increase in demand;
Growing the labour force – aiming to have more people contributing to economic wellbeing;
Conditions for sustainable growth – as a basis for providing an environment for long-term
business and economic prosperity, including infrastructure, housing, regeneration and transport.
The GVA framework is provide and explored further within the ;dashboard of indicators‟ section
below (see section 2.3.3). This framework seems clear, is in accord with the strategic policy documents
above it, and whilst focused on GVA, also looks beyond purely monetary factors to include areas such as
exclusion and regeneration.
2.2.6. The Manchester Independent Economic Review (MIER)
Designed as a fundamental and critical rebuilding of the „data landscape‟, the aim of the MIER is to
provide high-quality evidence-based research to inform future policy-making. In particular it will input
into the upcoming GMSP, and the next iteration of the Regional Economic Strategy (RES).
The MIER was initiated and is managed by ME (as the accountable body) but it is „owned‟ by an
independent review board which in turn is funded by many numerous bodies within the Greater
Manchester „family‟ and with significant backing from the NWRDA. Politically, partners knew at the
outset that the MIER was to be independent, and ME appear encouraged that partners have bought in to the
value of this. ME also appear confident in the quality of the work undertaken so far.
Following a „call for evidence‟ and a series of workshops, the MIER will be published and made
available to partner organisations. The knowledge from this will then be used in forthcoming strategies,
ensuring that they all share a common baseline.
Whilst the MIER includes a wide range of existing and published data, it is also producing new data
and talking to the private sector to ensure that this data has resonance with its target audience.
The MIER aims to report and conclude by the end of 2008. For further information see
http://www.manchester-review.org.uk/.
UNITED KINGDOM
61
2.2.7.Regional Policy
Although the majority of the research gathered for the FIELD project is locally managed through a
government principle of subsidiarity, there is also a reverse hierarchy over over-arching regional policy
work, which sub-regional policy is bound to align with. In reality, this is a much more flexible
arrangement, with sub-regional intelligence being used to inform regional policy and vice versa.
Regional Economic Strategy
All regions in England are required to produce a Regional Economic Strategy (RES). The latest
version of the RES was published in 2006, and contained a number of similar themes to the MCRDP –
with both „improving productivity & growing the market‟ and „growing the size and capability of the
workforce‟ leading to „conditions for sustainable growth‟. The overlap and synergies between policies is
deliberate and in much the same way that the MIER intends to provide a common evidence base, so
Manchester appears to have a common set of policy goals.
The RES has eight KPIs, with associated targets for 2009. These are:
GVA growth: Achieve growth in economic output above the average for England.
Job creation: Create 150,000 new jobs, 80,000 of which should be in knowledge-based
occupations.
Company formation: Raise the company formation rate to 21,000 per year.
No qualifications: Reduce the number of people with no qualifications by 80,000 and ensure that
no district has more than 29% of people with no qualifications.
Graduate qualifications: Increase the number of graduates in the workforce by 120,000.
Employment rate: Increase the number of people in the workforce by 83,000 and ensure no
district has an employment rate lower than 68%.
Deprivation: Reduce the number of areas which are categorised in the worst 5% nationally in
terms of deprivation.
CO2 emissions: Reduce CO2 emissions per £ of economic output
See http://www.nwda.co.uk/what-we-do/policy-and-strategy/regional-economic-strategy/res-
detail.aspx for further information.
Regional Spatial Strategy
As the Regional Planning Body (RPB) the Government Office for the North West is responsible for
working with regional partners to produce a Regional Spatial Strategy (RSS). Adopted in September 2008,
and covering the period up to 2021, the RSS provides the framework for development at a regional level.
Local plan-making must be in conformity with the RSS, and in turn the RSS complements national policy
statements.

FRAMEWORK FOR INFORMATION EXCHANGE IN LOCAL DEVELOPMENT
62
The RSS has broad policy objectives under the headings of working, living, transport and the
environment. For the city region, there is a specific section of the RSS covering Manchester on a broadly
comparable basis – the area being the ten local authorities of AGMA plus East Cheshire and Warrington.
Regional Observatories
All regions in England have regional observatories – entities set up with a view to being a regional-
level source of data intelligence and a resource for the region to utilise in preparing the evidence to inform
policy-making. As well as being experts in national-level data, they are also able to collect new data and to
provide briefings as required.
In the North-West, the regional observatory is the Regional Intelligence Unit (RIU)
(http://www.nwriu.co.uk/). Working chiefly for and with the Regional Development Agency, examples of
the data it uses include:
Office of National Statistics
“Region in Figures” releases
Sub-regional GVA
NOMIS (National Online Manpower Information System) labour market profiling
BERR (the Department for Business, Enterprise & Regulatory Reform) business
competitiveness indicators:
Claimant count
Deprivation
Earnings
Employment
Formation rates
GVA/GDP
Qualification
Survival Rates
Unemployment
CLG (Department for Communities and Local Government) survey of English housing (sub-
regional results)
Greater Manchester Social Enterprise Survey
Benchmarking employment in the creative and cultural industries
Audit Commission area profiles
Some of this data is national, some regional and some city region-specific. There is clearly an element
of overlap with the work carried out by organisations such as ME, although the response by ME to this is
that the work carried out at regional level or sub-regional level tends to be work boosting existing surveys,
or work contributing towards sub-regional work being carried out nationwide. In other words, most
research is about the region but not specifically designed for the region.
As well as the RIU, there are a number of other topic-specific observatories, including the North West
Public Health Observatory, the North West Dental Observatory and the North West Cultural Observatory.
UNITED KINGDOM
63
These are obviously much more specialised in their focus and of varying interest to local development
issues.
2.2.8. Sub-Regional Policy
Local Authority Intelligence Gathering
From the OECD visit to Manchester, it is clear that all of the local authorities within the „Manchester
family‟ have their own data collection and analysis teams, with varying levels of resources.
In this context, ME is working to further embed their shared data model amongst those local
authorities to enhance what is already undertaken and to ensure consistency in much the same way as
should be delivered by the MIER. Currently, ME have their own GIS database, which pulls in national
statistics and locally collected data such as „small island‟ maps produced by individual LAs. In this way, it
can act as both a repository and resource for local authorities.
Local Development Frameworks (LDFs)
In the same way that the RSS provides the basis for spatial development policy at a regional level, so
Local Development Frameworks (LDFs) provide the local authority-level basis for guiding local
development.
A LDF comprises a Local Development Scheme which programmes the LDF production, a Statement
of Community Involvement which explains public participation in the LDF process, a Core Strategy of
polices, a Site Specific Allocations document highlighting how the Core Strategy might be realised on the
ground, and may include a number of additional Supplementary Planning Documents on themes most
appropriate to the area covered by the LDF.
Local authorities are obligated to monitor the progress of LDF delivery. This is done through an
Annual Monitoring Report (AMR). As the LDF is being prepared it will comment on the progress with
preparation, but once the LDF is in place it will monitor the effectiveness of the LDF in delivering
outcomes. AMRs include a number of national core output indicators and local authorities are encouraged
to supplement this with appropriate local (output) indicators. In turn, these can be supplemented further
with contextual indicators which might not monitor specific policies but the overall success of the LDF.
2.3. Moving Towards a Dashboard of Indicators
This section considers the issues around establishing a dashboard of indicators for local development.
The previous section has highlighted a wide range of policy instruments, each with their own set of
indicators and performance measures. This is explored further here in the context of the GVA Growth
Framework, which ME pointed to as the most feasible set of indicator „themes‟ that have the greatest read-
across with existing policy instruments.
2.3.1. Challenges for Collecting Data to Measure Performance
In the Manchester city region, not uncommon with other areas, monitoring policy performance is
predominantly concerned with picking apart outputs from programme delivery, and measuring these
outcomes against target levels, as distinct from macroeconomic trends, to try and gain an insight into both
the gross and net policy effect. In the face of the global „credit crunch‟ this net effect is likely to become
increasingly important since gross effects may still be negative, but in net terms could represent a drop in
the „expected decline‟.
FRAMEWORK FOR INFORMATION EXCHANGE IN LOCAL DEVELOPMENT
64
When asked about specific challenges for measuring performance, ME identified the following
aspects as being significant:
measuring regional prices has proven very difficult, since they would like to measure it they are
trying to work out a means using an „inflation basket‟ approach;
current data on inward investment (both Foreign Direct Investment (FDI) and internal investment
from within the UK into the North West) is of dubious quality and often based on a number of
anecdotal sources such as newspaper reports. They have found this particularly hard to measure
as a complete city-region. ME are considering using data on the parentage of companies as a
possible approach, and looking at potentially comparing MIDAS data with local authority
business rates data, but it is unclear how feasible this might be;
measuring job sustainability (the length of time between jobs, the effect on benefits etc) has
proven challenging. The Department for Work and Pensions are doing a longitudinal survey
which could help, but the results are complex and not readily available;
policy makers are increasingly asking ME for data about CO2 emissions. Whilst the Department
for the Environment, Food and Rural Affairs has attempted to measure this, the data is as yet
unproven. ME feel there may be scope for including this within the GMFM; and
there is currently no robust and reliable way of measuring „innovation‟ which, given the current
policy objectives, is likely to become increasingly important.
2.3.2. The GVA Growth Framework
Given the range of policies outlined above, over time it has become apparent that there are
considerable benefits in tying together policies, priorities and indicators. The best example is the direct
read across between the RES and the MCRDP. The MIER will hopefully consolidate attempts at unifying
the evidence base, and will also provide the data for the corresponding monitoring of policies derived from
that evidence base.
In terms of the extent of locally collected data and indicators there is a significant dependence on
national level data. This is to unique to Manchester, but a function of the way in which statistics are
gathered and managed within England. The Office for National Statistics datasets form the principal source
for most evidence gathering. This is in part due to the level of comparison that is possible, but also a
function of the quality and consistency of the data – numerous checks and (as necessary) adjustments are
made to datasets and data series are the subject of periodic quality reviews.
The MCRDP outlines a GVA Growth Framework (see section 2.2.5 above) as the most appropriate
themes for inclusion within a „dashboard‟ of local development indicators – based on both policy priorities
and data availability and quality.
A summary of the GVA Growth Framework from the MCRDP is provided below:
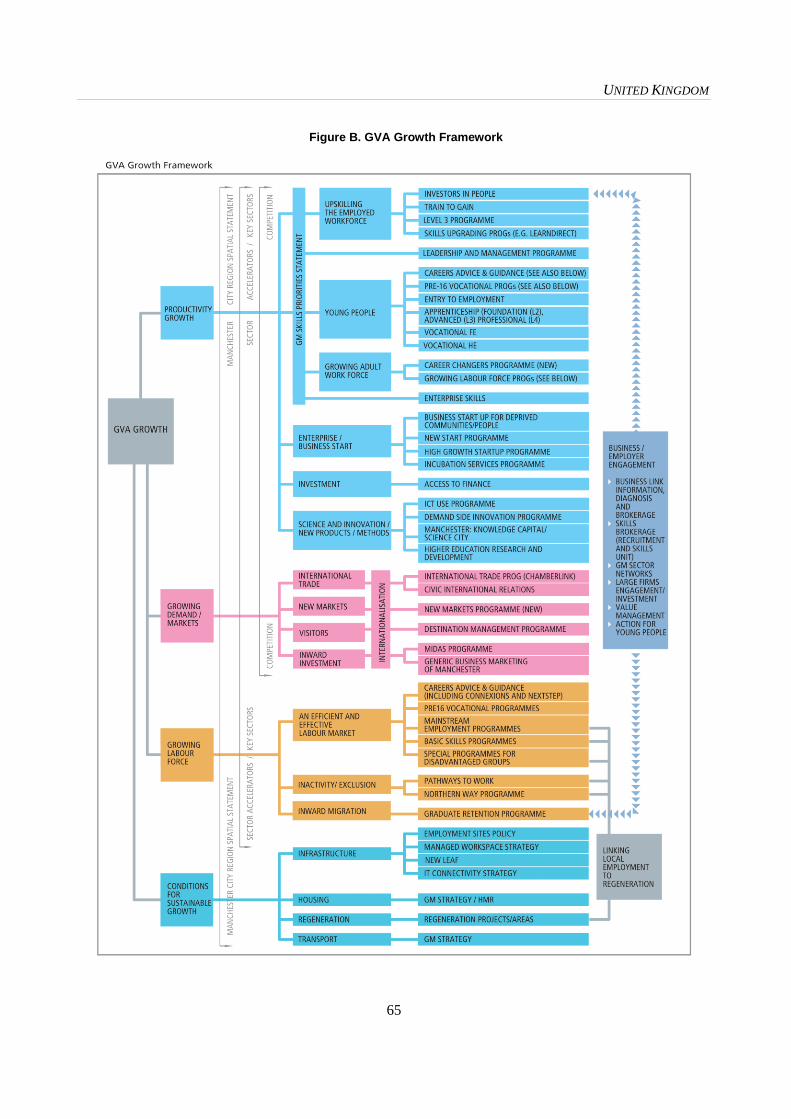
UNITED KINGDOM
65
Figure B. GVA Growth Framework

FRAMEWORK FOR INFORMATION EXCHANGE IN LOCAL DEVELOPMENT
66
The framework looks at each of the drivers of growth identified (the „left column‟ – productivity
growth, growing demand/markets etc), and for each of these breaks this down further into the affected
topic areas. From a dashboard perspective, it is this „middle column‟ that needed to be „displayed‟ by any
dashboard. The remainder of this section takes each of the four drivers of GVA growth and lists the data
sources that are currently used for each driver, and that might feature in a dashboard of local development
indicators.
2.3.2.1. Productivity growth
GM skills priority statement – see http://www.manchester-
enterprises.com/documents/GM%20Skills%20Full%20Report.pdf.
Lists of training courses delivered and to whom, chiefly using Learning and Skills Council and
Department for Education and Skills (DfES) data.
Labour Force Survey data, matching training to standard occupational classification codes.
Business start ups is measure by value-added tax (VAT) registrations (and deregistrations) and
also provides a sectoral split. Note that a company is only required to register for VAT once its
annual turnover exceeds a set threshold (currently £67,000 per annum). This threshold can mask
(or at least create a „lag‟ in the data) for smaller (or slower) start ups. Further, the VAT threshold
operates principally for fiscal (and not statistical) purposes, and so the level has been historically
changed periodically – affecting longitudinal analysis, although adjustments are possible.
Some information on banking records are available for investment or access to finance.
Experian and other similar commercial data providers hold national business databases. See
http://www.prospectlocator.com/index.aspx?pageid=17.
MIDAS collects and holds data on foreign and indigenous (native) investment.
The „AMADEUS‟ (pan European) database – collated by Aston Business School – has European
scale data on businesses See http://www.bvdep.com/en/amadeus.html.
For science and innovation, NESTA (the National Endowment for Science, Technology and the
Arts) holds a number of datasets, including a national innovation index/dashboard.
The STEAM ((Scarborough Tourism Economic Activity Monitor) model, which includes a
number of other datasets, provides some idea of competition levels and tourism spend.
2.3.2.2. Growing demand/markets (growing the economy)
Draws upon traditional economic datasets collated at the national level, such as
Annual Business Inquiry
Annual Population Survey (data elements formerly contained within the Labour Force Survey)
NOMIS benefits data
Department for Work and Pensions (DWP) data
UNITED KINGDOM
67
JobCentre Plus data
2.3.2.3. Growing the labour force
Job Centre Plus collect some data locally, e.g. in the case of claimants – this data goes up to
national level and then comes back.
Migration data (national and international) , with links to National Insurance numbers and
National Health Service (NHS) data.
Adult advancement careers service data
ME are looking also at establishing measures of effective density in the labour market, and
measuring access to workplaces (possibly using „agglomeration centroids‟ such as sub-sets of
travel to work areas (TTWAs)).
2.3.2.4. Conditions for sustainable growth
Split to cover infrastructure, housing, regeneration and transport this section has particularly diverse
data sources. In each case they are principally derived from either/both the relevant Government
Department, or from the incumbent local operator. From the perspective of local development the data is
used to link each topic to employment, i.e. for transport, can that person get to that place etc.
Greater Manchester Passenger Transport Agency (GMPTA) data
DfT (private and public) transport models
Arterial in/out flows to/from Greater Manchester
Council Tax bands for housing
Local authority and Registered Social Landlord (RSL) survey of housing quality and conditions
Local authority housing delivery (consents), and completions
Census data (although increasingly outdated and overtaken by local authority information)
Assessment for future employment sites – employment land reviews carried out by local
authorities take into account infrastructure
The GMFM
The MMAA indictors, which cover a range of areas (beyond purely measuring GVA) and are
equally weighted.
Some micro data – funded by the Economic and Social Research Council (ESRC) and available
through the Centre for Spatial Economic Research. In particular, looking at new business data to
get „under the skin‟ of the current data – it is hoped that the MIER can develop this further
locally.

FRAMEWORK FOR INFORMATION EXCHANGE IN LOCAL DEVELOPMENT
68
2.4. Concluding Remarks
A considerable suite of policies exist, operating a differing spatial levels and covering a range of topic
areas, but with increasing emphasis on alignment. This is reflected in current data needs – which also
appear aligned on the principle of identifying growth and polarisation trends – with policy aiming to
maximise growth and minimise polarisation.
Clearly, there is evidence of a strong reliance on National Statistics from the ONS. However, a lot of
such data is available at a suitably fine geography („Lower Super Output Area‟ being the lowest for most
datasets – an area equivalent to an average of 1,500 people). Indeed the Neighbour Statistics wing of the
ONS has a number of configurable geographies that that data can be drawn for local authority areas,
education authority areas, health authority areas, and civil parishes (where they exist).
There is also evidence of good use of both internal and external resources. Internally, organisations
such as ME present a shared skills base to „service‟ its members, whilst the GMFM and the MIER
highlight the important role played by external expertise. There is some evidence of duplication and
fragmentation – but with no political will to merge local authorities and will efforts to develop links
between topic networks and working groups this is not to be unexpected. ME identified an overarching
challenge is to find a balance investment and resources in relation to data gathering and indicators.
This must clearly be commensurate with the importance placed in delivering programmes and
policies, and is also reflected in the keenness of the Manchester „family‟ to work on a shared methodology
for this with the OCED.
3. Applying the Conceptual Framework to Manchester
3.1. Introduction
Whilst the OECD will be collating information of the six FIELD study areas (Bilbao, Brandenburg,
Copenhagen, Lille, Manchester, and Trento), this section is aimed a providing some useful material to
input into the overall report which will try to apply the FIELD conceptual framework to the study areas in
aggregate.
The FIELD conceptual framework is provided below:
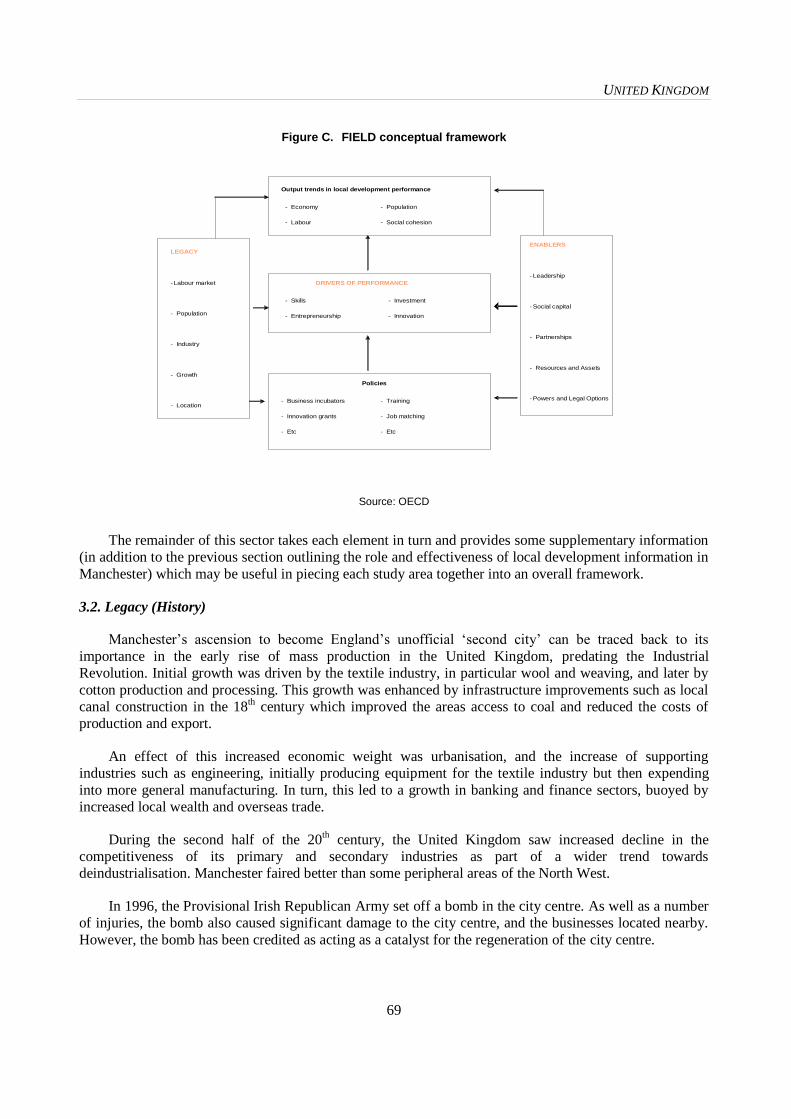
UNITED KINGDOM
69
Figure C. FIELD conceptual framework
Output trends in local development performance
- Economy
- Labour
- Population
- Social cohesion
DRIVERS OF PERFORMANCE
- Skills
- Entrepreneurship
- Investment
- Innovation
Policies
- Business incubators
- Innovation grants
- Etc
- Training
- Job matching
- Etc
ENABLERS
- Leadership
- Social capital
- Partnerships
- Resources and Assets
- Powers and Legal Options
LEGACY
-Labour market
- Population
- Industry
- Growth
- Location
Source: OECD
The remainder of this sector takes each element in turn and provides some supplementary information
(in addition to the previous section outlining the role and effectiveness of local development information in
Manchester) which may be useful in piecing each study area together into an overall framework.
3.2. Legacy (History)
Manchester‟s ascension to become England‟s unofficial „second city‟ can be traced back to its
importance in the early rise of mass production in the United Kingdom, predating the Industrial
Revolution. Initial growth was driven by the textile industry, in particular wool and weaving, and later by
cotton production and processing. This growth was enhanced by infrastructure improvements such as local
canal construction in the 18th century which improved the areas access to coal and reduced the costs of
production and export.
An effect of this increased economic weight was urbanisation, and the increase of supporting
industries such as engineering, initially producing equipment for the textile industry but then expending
into more general manufacturing. In turn, this led to a growth in banking and finance sectors, buoyed by
increased local wealth and overseas trade.
During the second half of the 20th century, the United Kingdom saw increased decline in the
competitiveness of its primary and secondary industries as part of a wider trend towards
deindustrialisation. Manchester faired better than some peripheral areas of the North West.
In 1996, the Provisional Irish Republican Army set off a bomb in the city centre. As well as a number
of injuries, the bomb also caused significant damage to the city centre, and the businesses located nearby.
However, the bomb has been credited as acting as a catalyst for the regeneration of the city centre.
FRAMEWORK FOR INFORMATION EXCHANGE IN LOCAL DEVELOPMENT
70
The trend of the economy has been influenced by the scale of the city and its importance in the
national economy. In recent years, the wider constant economic growth has been evident with greater than
average growth.
3.3. Output Trends in Local Development Performance
One area covered in discussions during the visit to Manchester was the level of comparison with other
cities/areas and the way in which such comparison can be both valid and useful. ME said that they do
undertake several comparison and benchmarking exercises:
Within the city‟s geography: comparing Greater Manchester in the context of the North West
region, and compared to the UK as a whole. This is mainly undertaken for monitoring of
performance against Public Service Agreement (PSA) targets – which form part of the funding
agreement between central government and local authorities.
With other comparable cities in the UK: typically comparisons are made with Birmingham,
Edinburgh, Glasgow, Leeds and London. The emphasis here is examining development and
trying to identify what lessons can be learnt, rather than building up rankings or any kind of
„league table‟.
With other comparable cities abroad: typically comparisons are made with Barcelona, Bilbao,
Lille, Munich, and Valencia. The emphasis here is principally on „data-looking‟ – observing
general trends and looking for emerging policy and delivery ideas.
Overall, ME observed that a „side effect‟ of the collaborative approach across Manchester had been a
greater appetite for data on strategic issues, especially when it is informing strategic policies. There is
potential for benchmarking similar areas to contribute original thinking to this.
3.4. Drivers of Performance
Anecdotally, the discussions within the Manchester visit highlighted that Manchester was very
effective at some things which had been instrumental in its success– such as spotting opportunities, getting
funding in place, delivering spaces and developments, and in providing a single voice to government.
However, there was also an acceptance that it was necessary to avoid a „heroic‟ account of history –
that Manchester was also successful because of its economies of scale, its position nationally, and the
underlying economic trends. Although a recession seems likely, in recent times Manchester has had money
coming in – and has needed to be able to spread it effectively and efficiently – a characteristic of the city
regions success as part of wider national prosperity. The challenge ahead is to maintain public sector
investment this in uncertain times ahead, whilst trying to strengthen private sector investment.
Manchester also has a number of very important assets – including c.100,000 students and the
associated academic resources and infrastructure. The University of Manchester Institute of Science and
Technology (UMIST) merged in2004 with the Victoria University of Manchester to form the University of
Manchester and now represents an institution of considerable size and expertise.
Manchester also servers as a dominant retail centre, drawing on a wide catchment area.
Finally, Manchester International airport, the biggest airport outside of London in terms of passenger
flows, is an essential „anchor‟ for business traffic.
UNITED KINGDOM
71
3.5. Enablers (Institutional and Social Capacities)
In terms of considering how the drivers of growth are manifested within the enablers, those present at
the time of the OECD visit consider the main factors that made Manchester „better‟ included: a single
shared vision, strong leadership, and private sector co-operation. The collaborative approach between the
ten AGMA local authorities has been seen as key – Manchester has been very good at internalising the
debate and „speaking out‟ with one voice. An example given was the designation and growth of
Manchester Airport – clearly the city couldn‟t have 10 airports and so authorities were compelled to come
together and think strategically. The resulting development is felt to be a success, and has opened the
doorway for the same approach, but without the need for any similar degree of compulsion.
Policy-makers are beginning to understand more about agglomeration in the knowledge economy –
previously the Government only understood this in the London supra-region (London and its surrounding
regions) context. Continuing this will be vital to keeping Manchester „in the game‟. The discussions also
looked at „negative enablers‟. A number of projects/pieces of research are underway examining the
incidence and effects of polarisation in social communities. ME are gathering data streams such as house
price change, deprivation and unemployment/worklessness. In this case the „data‟ is the reverse of the
„indicators‟ – what is preventing a healthy, happy, safe and secure society?
There was also a feeling that current efforts were measuring strategic added value, but not necessarily
measuring „enabling ability‟. This is true, for example, with attempts to grapple with the notion of „social
capital‟. What is the reality? City regeneration activities do try to involve the community sector and
voluntary organisation. Similarly, local authorities have adopted their Statements of Community
Involvement as part of the LDF process. However the monies that historically have funded such things are
being wound down as the government focus shifts towards addressing worklessness. This puts the
voluntary sector potentially at risk as an enabler. In terms of the balance of power and legal allocation of
resources, discussions concluded that is beginning to change – the government is increasingly favouring
local devolution of some aspects of decision-making, although this is usually in the context of a simplified
regulatory framework at the national level (i.e. streamlining but retaining national precedence in any policy
hierarchy). Testament to the strength of local power in decision-making is the Manchester Multi Area
Agreement.
Overall the response was that enablers are hugely important, but are hard to measure in reality. The
best effort is likely to be in the form of narrative of research, and to tie this to known outcomes.
3.6. Policy Actions on Drivers
The main policy action identified throughout discussions during the mission to Manchester was the
role to be played by the MMAA. This will provide the basis, in conjunction with intelligence gathered by
the MIER, for future policy actions. However, policy actions in reality are only partly driven data. They
also reflect the knowledge and experience of policy-makers and implementers. This has been reflected in
the GVA Growth Framework as part of the MCRDP, especially in the „less tangible‟ work areas such as
regeneration, exclusion and enterprise. The challenge for creating policy actions based on the GVA
Growth Framework is that a lot of the „levers‟ (the right-hand column) and outputs are nationally-
controlled aspects that are not run purely on a regional or city-regional level. However, this could form the
basis of an argument to government requesting a change in policy or funding. This is turn could be
reflected in performance indicators – if there were adequate scope to bend national performance indicators
to suit local circumstances. At the other end of the spectrum, a similarly significant amount of decision-
making power rests beneath the city-region level, within individual local authorities. Each local authority is
required to produce a community strategy that in many ways reflects common drivers and enablers.
Organisation for Economic Co-operation and Development
Centre for Entrepreneurship, SME and Local Development (CFE)
Local Economic and Employment Development (LEED)
2, rue André Pascal, 75775 Paris CEDEX 16, France
www.oecd.org/cfe/leed
OECD LEED Centre for Local Development
Vicolo San Marco, 1, 38100 Trento, Italy
www.trento.oecd.org