Embed Size (px)
Citation preview
Framework for Analyzing Separation Distances between Transmission Lines in Wyoming Final Report August 26, 2009 (Revised February 2010) Submitted to: Wyoming Infrastructure Authority 200 E. 17th Street, Unit B Cheyenne, Wyoming 82001
ICF International 8310 S. Valley Hwy. Suite 240 Englewood, Colorado 80112-5806 303-792-7800
Authors:
Robert Henke ICF International Sr. Vice President
Judah Rose ICF International Sr. Vice President
Ken Collison ICF International Vice President
Venkat Banunarayanan ICF International Sr. Manager
Kiran Kumaraswamy ICF International Sr. Associate
Casey Jacobson ICF International Associate
Nishit Pande ICF International Analyst
Note to Readers: With the exception of Table 2‐2, all content in this document remains unchanged.
©2009 ICF International All Rights Reserved
This report was produced by ICF Resources, LLC (an ICF International company hereafter referred to as ICF) in accordance with an agreement with the Wyoming Infrastructure Authority (Client). Client’s use of this report is subject to the terms of that agreement.
IMPORTANT NOTICE:
REVIEW OR USE OF THIS REPORT BY ANY PARTY OTHER THAN THE CLIENT CONSTITUTES ACCEPTANCE OF THE FOLLOWING TERMS. Read these terms carefully. They constitute a binding agreement between you and ICF International (“ICF”). By your review or use of the report, you hereby agree to the following terms.
Any use of this report other than as a whole and in conjunction with this disclaimer is forbidden.
This report may not be copied in whole or in part or distributed to anyone.
This report and information and statements herein are based in whole or in part on information obtained from various sources. ICF makes no assurances as to the accuracy of any such information or any conclusions based thereon. ICF is not responsible for typographical, pictorial or other editorial errors. The report is provided AS IS.
NO WARRANTY, WHETHER EXPRESS OR IMPLIED, INCLUDING THE IMPLIED WARRANTIES OF MERCHANTABILITY AND FITNESS FOR A PARTICULAR PURPOSE IS GIVEN OR MADE BY ICF IN CONNECTION WITH THIS REPORT.
You use this report at your own risk. ICF is not liable for any damages of any kind attributable to your use of this report.
Acknowledgements
Framework for Analyzing Separation Distances between Transmission Lines in Wyoming i
ACKNOWLEDGEMENTS The authors wish to acknowledge the following individuals. Independent reviewers of the draft report provided constructive comments and helpful suggestions and included Mr. Bob Easton, Western Area Power Administration; Mr. Doug Larson, Executive Director, Western Interstate Energy Board; Mr. Jeff Miller, ColumbiaGrid; Mr. Brad Nickell, Western Electricity Coordinating Council; Mr. Alan Edwards, AE Consulting; and one anonymous reviewer. Mr. Walt George, National Project Manager, Bureau of Land Management (BLM) Wyoming State Office contributed valuable input regarding the BLM’s right‐of‐way (ROW) and other policies. Proponents of transmission projects in Wyoming responded promptly to the authors’ queries about their projects. Mr. Steve Ellenbecker, Director of Governmental and External Relations and Energy Advisor to Governor Freudenthal, Wyoming Infrastructure Authority (www.wyia.org) provided timely information or suggestions in response to multiple requests by the authors. The authors thank Mr. Ellenbecker and the Wyoming Infrastructure Authority Board of Directors for initiating and funding this project and for allowing the authors to conduct an independent study. The opinions expressed in this report are those of the authors. This report is available to download at icfi.com/wytransmission.

Acknowledgements
ii Framework for Analyzing Separation Distances between Transmission Lines in Wyoming
This page intentionally left blank.
Table of Contents
Framework for Analyzing Separation Distances between Transmission Lines in Wyoming iii
TABLE OF CONTENTS EXECUTIVE SUMMARY ............................................................................................................... ES‐1 CHAPTER 1 – INTRODUCTION ...................................................................................................... 1‐1
1.1 Project Background and Need ................................................................................................... 1‐1 1.2 Transmission Line Separation Factors and Study Approach ...................................................... 1‐2 1.3 The Western Electricity Coordinating Council (WECC) System .................................................. 1‐3
1.3.1 Demand and Generation in the WECC System ............................................................. 1‐5 1.3.2 Transmission in the WECC System ............................................................................... 1‐6 1.3.3 Need for Long‐Distance High‐Voltage Transmission Lines in the WECC System ......... 1‐7
1.4 Wyoming – Region Description .................................................................................................. 1‐8 1.5 Demand and Generation in Wyoming ....................................................................................... 1‐9 1.6 Proposed Transmission Lines in Wyoming ............................................................................... 1‐10
CHAPTER 2 – LITERATURE ON TRANSMISSION LINE SEPARATION ...............................................2‐1 2.1 Impact of Reliability Rules on Line Separation ........................................................................... 2‐1
2.1.1 Individual Utility Criteria for Line Separation ............................................................... 2‐5 2.1.2 Existing Separations Among Transmission Lines Sharing a Corridor ............................ 2‐7 2.1.3 Line Separation Among Proposed Transmission Lines Sharing a Corridor ................. 2‐10 2.1.4 Summary of Conversations with Proponents of New Transmission Lines and other
Stakeholders ............................................................................................................... 2‐11 2.2 Influence of Other Factors on Line Separation ........................................................................ 2‐14
2.2.1 Land Use and Environmental Constraints .................................................................. 2‐14 2.2.2 Construction and Maintenance Cost and Time .......................................................... 2‐15 2.2.3 Electrical and Magnetic Fields .................................................................................... 2‐15 2.2.4 Historical NERC, WECC, and Other Outage Data ........................................................ 2‐15
2.3 Summary .................................................................................................................................. 2‐26 CHAPTER 3 – LINE SEPARATION EVALUATION FRAMEWORK ..................................................... 3‐1
3.1 Approach .................................................................................................................................... 3‐1 3.2 Key Issues ................................................................................................................................... 3‐2 3.3 Determining Line Separation Distance – An Example ................................................................ 3‐3 3.4 Framework Development .......................................................................................................... 3‐7 3.5 Factors that Influence Line Separation Distance ....................................................................... 3‐8 3.6 Problem Formulation ................................................................................................................. 3‐9 3.7 Solution Process ....................................................................................................................... 3‐10
CHAPTER 4 – ESTIMATING LINE SEPARATION DISTANCES IN WYOMING ................................... 4‐1 4.1 Components of Line Separation Distance .................................................................................. 4‐2
4.1.1 Absolute Minimum Line Separation Distance .............................................................. 4‐2 4.1.2 Case‐Specific Incremental Minimum Line Separation Distance ................................... 4‐2 4.1.3 Incremental Regional Minimum Line Separation Distance .......................................... 4‐3
4.2 Recommended Range for Minimum Line Separation Distance ............................................... 4‐18 4.3 Conclusions and Recommendations ........................................................................................ 4‐20
CHAPTER 5 – REFERENCES ........................................................................................................... 5‐1 APPENDIX A – WYOMING GENERAL BACKGROUND INFORMATION ........................................... A‐1
A.1 Topography ............................................................................................................................... A‐1 A.2 Land Ownership ........................................................................................................................ A‐1 A.3 Weather .................................................................................................................................... A‐2 A.4 Natural Resources ..................................................................................................................... A‐2
APPENDIX B – SUMMARY OF HISTORICAL DATA ON TORNADOES IN WYOMING ...................... B‐1
Table of Contents
iv Framework for Analyzing Separation Distances between Transmission Lines in Wyoming
APPENDIX C – DETERMINING PROBABILITY OF A TORNADO MAKING CONTACT WITH TWO TRANSMISSION LINES ................................................................................................... C‐1
C.1 Determining the probability of a tornado striking two lines and the associated optimal separation distance assuming a fixed point of origin ................................................................ C‐1
C.2 Tornado Path Calculations using Monte Carlo Method ............................................................. C‐2 APPENDIX D – DETERMINING LINE SEPARATION DISTANCES FOR TWO REPRESENTATIVE
TRANSMISSION LINE ROUTES IN WYOMING ................................................................ D‐1 D.1 Route 1 ...................................................................................................................................... D‐1 D.2 Route 2 ...................................................................................................................................... D‐2 D.3 Results of Representative Route Analyses ................................................................................ D‐3 D.4 Route 1 – Alternative Method .................................................................................................. D‐4
LIST OF TABLES Table 1‐1. Area Covered by the WECC Subregions .................................................................................... 1‐3 Table 1‐2. 2008‐2009 Demand Forecast for WECC and its Subregions ..................................................... 1‐5 Table 1‐3. WECC Capacity Mix ................................................................................................................... 1‐6 Table 1‐4. WECC Existing and Planned Transmission Line Mileage ........................................................... 1‐7 Table 1‐5. Wyoming – Total Installed Generation Capacity ...................................................................... 1‐9 Table 1‐6. Wyoming – Net Generation by Energy Source ...................................................................... 1‐10 Table 2‐1. Summary of Contingencies and System Limits or Impacts for NERC Category C ..................... 2‐2 Table 2‐2. WECC Disturbance Performance Table of Allowable Effects on Other Systems ...................... 2‐4 Table 2‐3. Common Causes of Multiple Line Outages and Mitigation Measures ..................................... 2‐5 Table 2‐4. WECC 500‐kV Transmission Lines Potentially Sharing a Common Corridor ............................. 2‐8 Table 2‐5. WECC 345‐kV Lines Potentially Sharing a Common Corridor ................................................... 2‐9 Table 2‐6. Type of Transmission Line and Total Outages Reported by Responding Utilities .................. 2‐18 Table 2‐7. 500‐ to 600‐kV Outages (percent) by Cause Code .................................................................. 2‐19 Table 2‐8. 300‐ to 400‐kV Outages (percent) by Cause Code .................................................................. 2‐19 Table 2‐9. 200‐ to 300‐kV Outages (percent) by Cause Code .................................................................. 2‐20 Table 2‐10. Causes and Numbers of Common‐Mode Outages in 2006 ................................................... 2‐21 Table 2‐11. Causes and Numbers of Common Corridor Outages in 2007 ............................................... 2‐22 Table 2‐12. Arizona Public Service 500‐kV Lines Sharing a Common Corridor ........................................ 2‐22 Table 2‐13. Database of Common‐Corridor Line Outages ....................................................................... 2‐23 Table 2‐14. Summary of Results (Corrected) ........................................................................................... 2‐23 Table 2‐15. Western Area Power Administration 115‐kV Transmission Line Outage Data
(2007‐2009) .......................................................................................................................... 2‐24 Table 2‐16. Western Area Power Administration 230‐kV Transmission Line Outage Data
(2007‐2009) .......................................................................................................................... 2‐25 Table 2‐17. Western Area Power Administration 345‐kV Transmission Line Outage Data
(2007‐2009) .......................................................................................................................... 2‐25 Table 4‐1. Calculated Separation Distance Between Two Transmission Lines To Avoid Multiple Line
Outages Caused by a Single Tornado ................................................................................... 4‐11 Table 4‐2. Tornado Class and Frequency in Wyoming ............................................................................. 4‐12 Table 4‐3. Probability of Outage of Two Lines Hit by a Single Tornado at
Different Separation Distances ............................................................................................ 4‐13 Table 4‐4. Results of Representative Route Analyses .............................................................................. 4‐14 Table 4‐5. Lightning Strikes in Wyoming Counties Considered in this Study (1994 – 2008) ................... 4‐15 Table 4‐6. Number of Fire Occurrences In Wyoming Counties (1997 – 2008) ........................................ 4‐16
Table of Contents
Framework for Analyzing Separation Distances between Transmission Lines in Wyoming v
Table A‐1. 2007 Wyoming Coal Production by Mine ................................................................................ A‐4 Table A‐2. Wyoming Crude Oil Proved Reserves (million barrels) ............................................................ A‐6 Table A‐3. Total Developable Wind Energy Generating Capacity ............................................................. A‐8 Table A‐4. Wyoming – Total Renewable Capacity .................................................................................... A‐8 Table B‐1. Area and Tornado Characteristics for Southern and Eastern Wyoming Counties ................... B‐1 Table C‐1. Results of Monte Carlo Analysis ............................................................................................... C‐3 Table D‐1. Route Number 1 Resulting Line Separation Distance of 8,400 feet and Expected Outages per
Year ......................................................................................................................................... D‐1 Table D‐2. Route Number 1 Resulting Line Separation Distance of 0 feet and Expected Outages
Per Year ................................................................................................................................... D‐2 Table D‐3. Route Number 2 Resulting Line Separation Distance of 6,900 Feet and Expected Outages per
Year ......................................................................................................................................... D‐3 Table D‐4. Route Number 2 Resulting Line Separation Distance of 0 Feet and Expected Outages
per Year ................................................................................................................................... D‐3 Table D‐5. Results of Representative Route Analyses .............................................................................. D‐3 Table D‐6. Route Number 1 – Alternative Method Resulting Line Separation Varying by County .......... D‐4
LIST OF FIGURES Figure 1‐1. WECC System ........................................................................................................................... 1‐4 Figure 1‐2. WECC Subregions ..................................................................................................................... 1‐4 Figure 1‐3. WECC Subregional Planning Groups (SPG) .............................................................................. 1‐8 Figure 1‐4. Proposed Transmission Line Projects in Wyoming ................................................................ 1‐11 Figure 2‐1. Outage Cause for Parallel Lines in Bonneville Power Administration Data 15‐Year History ... 2‐6 Figure 2‐2. ROW Diagram for Devers‐Palo Verde Circuit 2 Line .............................................................. 2‐10 Figure 2‐3. Diagram of Typical Tower ...................................................................................................... 2‐11 Figure 2‐4. WECC Outages by Category from 1992 to 2007 .................................................................... 2‐17 Figure 2‐5. Total Number of Outages in the Rocky Mountain Power Area System from 1992 to 2007 . 2‐18 Figure 3‐1. Initial Minimum Line Separation Distance ............................................................................... 3‐3 Figure 3‐2. Minimum Line Separation Distance to Avoid Multiple Outages due to Transmission Tower
Collapse .................................................................................................................................... 3‐4 Figure 3‐3. Optimal Line Separation Distance (conceptual) ...................................................................... 3‐8 Figure 3‐4. Range of Variation for Optimal Line Separation Distance ....................................................... 3‐9 Figure 3‐5. Process Flowchart for Determining Line Separation Distance Components ......................... 3‐12 Figure 3‐6. Flowchart for Determining the REG‐MIN Component of Line Separation Distance ............. 3‐12 Figure 3‐7. Approach to Determine Separation Distance ........................................................................ 3‐13 Figure 4‐1. Proposed Transmission Line Projects in Wyoming .................................................................. 4‐1 Figure 4‐2. Maximum Wind Speed (miles/hour) in Wyoming from 1959‐2008 ........................................ 4‐5 Figure 4‐3. Wyoming Counties Considered in the Tornado Study ............................................................. 4‐7 Figure 4‐4. Schematic of Transmission Line Corridor for Tornado Study .................................................. 4‐8 Figure 4‐5. Conditional Probability of a Single Tornado Causing Line Outages ......................................... 4‐9 Figure 4‐6. Summary Flowchart for Calculating a Recommended Range of Minimum Line Separation
Distance .................................................................................................................................. 4‐19 Figure 4‐7. Approach to Determine Separation Distance (feet) – for Representative 500‐kV Transmission
Lines in Wyoming ................................................................................................................... 4‐20 Figure A‐1. Wyoming Coal Fields .............................................................................................................. A‐3 Figure A‐2. Coalbed Natural Gas Deposits in Wyoming ............................................................................ A‐5 Figure A‐3. Wyoming Wind Energy Profile ............................................................................................... A‐7
Table of Contents
vi Framework for Analyzing Separation Distances between Transmission Lines in Wyoming
Figure B‐1. Tornado Occurrences by County in Wyoming 1959 – 2009 .................................................... B‐2 Figure B‐2. Average Length of Tornado by County in Wyoming 1959 – 2009 ........................................... B‐3 Figure C‐1. Possible Path of a Tornado after it Strikes the First Transmission Line ................................... C‐1 Figure C‐2. Randomized Tornado Paths ..................................................................................................... C‐3 Figure D‐1. Representative Transmission Line Route Number 1 .............................................................. D‐1 Figure D‐2. Representative Transmission Line Route Number 2 .............................................................. D‐2
Table of Contents
Framework for Analyzing Separation Distances between Transmission Lines in Wyoming vii
ACRONYMS AND ABBREVIATIONS AC alternating current
ASCE American Society of Civil Engineers
BLM Bureau of Land Management
CAISO California Independent System Operator
CCPG Colorado Coordinated Planning Group
DC direct current
DOE U.S. Department of Energy
DOI U.S. Department of the Interior
EHV Extra‐High Voltage
GHG Greenhouse Gas
Hz Hertz
ICF ICF International
ISO Independent System Operator
kV kilovolt
MTBF Mean Time Between Failure
MW megawatts
NCDC National Climate Data Center
NERC North American Electric Reliability Corporation
NESC National Electrical Safety Code
NOAA National Oceanic and Atmospheric Administration
NREL National Renewable Energy Laboratory
NTTG Northern Tier Transmission Group
OSHA Occupational Safety and Health Administration
PBRC Probabilistic Based Reliability Criteria
PEIS Programmatic Environmental Impact Statement
RAS Remedial Action Scheme
ROD Record of Decision
ROW Right‐of‐way
RPS Renewables Portfolio Standard
RRO Regional Reliability Organization
SPG Subregional Planning Groups
SWAT Southwest Area Transmission
UHV Ultra‐High Voltage
U.S. United States
VAR volt ampere reactive
WECC Western Electricity Coordinating Council
WIA Wyoming Infrastructure Authority

Table of Contents
viii Framework for Analyzing Separation Distances between Transmission Lines in Wyoming
This page intentionally left blank.
Executive Summary
Framework for Analyzing Separation Distances between Transmission Lines in Wyoming ES‐1
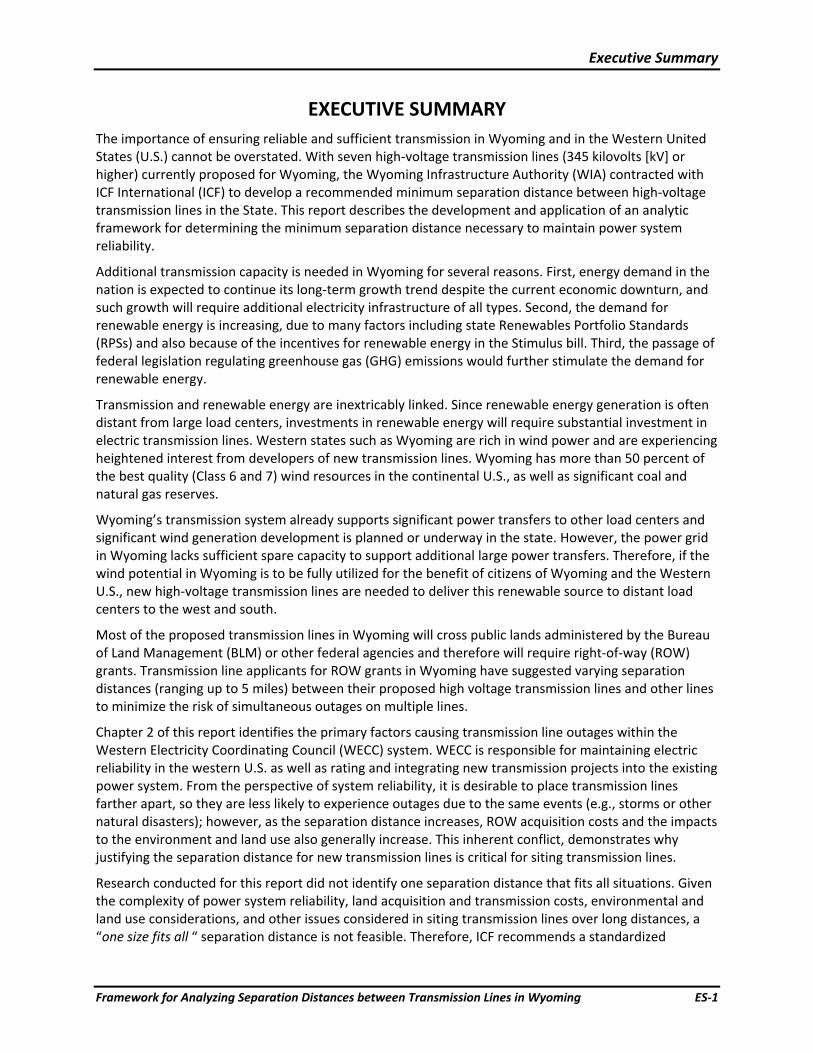
EXECUTIVE SUMMARY The importance of ensuring reliable and sufficient transmission in Wyoming and in the Western United States (U.S.) cannot be overstated. With seven high‐voltage transmission lines (345 kilovolts [kV] or higher) currently proposed for Wyoming, the Wyoming Infrastructure Authority (WIA) contracted with ICF International (ICF) to develop a recommended minimum separation distance between high‐voltage transmission lines in the State. This report describes the development and application of an analytic framework for determining the minimum separation distance necessary to maintain power system reliability.
Additional transmission capacity is needed in Wyoming for several reasons. First, energy demand in the nation is expected to continue its long‐term growth trend despite the current economic downturn, and such growth will require additional electricity infrastructure of all types. Second, the demand for renewable energy is increasing, due to many factors including state Renewables Portfolio Standards (RPSs) and also because of the incentives for renewable energy in the Stimulus bill. Third, the passage of federal legislation regulating greenhouse gas (GHG) emissions would further stimulate the demand for renewable energy.
Transmission and renewable energy are inextricably linked. Since renewable energy generation is often distant from large load centers, investments in renewable energy will require substantial investment in electric transmission lines. Western states such as Wyoming are rich in wind power and are experiencing heightened interest from developers of new transmission lines. Wyoming has more than 50 percent of the best quality (Class 6 and 7) wind resources in the continental U.S., as well as significant coal and natural gas reserves.
Wyoming’s transmission system already supports significant power transfers to other load centers and significant wind generation development is planned or underway in the state. However, the power grid in Wyoming lacks sufficient spare capacity to support additional large power transfers. Therefore, if the wind potential in Wyoming is to be fully utilized for the benefit of citizens of Wyoming and the Western U.S., new high‐voltage transmission lines are needed to deliver this renewable source to distant load centers to the west and south.
Most of the proposed transmission lines in Wyoming will cross public lands administered by the Bureau of Land Management (BLM) or other federal agencies and therefore will require right‐of‐way (ROW) grants. Transmission line applicants for ROW grants in Wyoming have suggested varying separation distances (ranging up to 5 miles) between their proposed high voltage transmission lines and other lines to minimize the risk of simultaneous outages on multiple lines.
Chapter 2 of this report identifies the primary factors causing transmission line outages within the Western Electricity Coordinating Council (WECC) system. WECC is responsible for maintaining electric reliability in the western U.S. as well as rating and integrating new transmission projects into the existing power system. From the perspective of system reliability, it is desirable to place transmission lines farther apart, so they are less likely to experience outages due to the same events (e.g., storms or other natural disasters); however, as the separation distance increases, ROW acquisition costs and the impacts to the environment and land use also generally increase. This inherent conflict, demonstrates why justifying the separation distance for new transmission lines is critical for siting transmission lines.
Research conducted for this report did not identify one separation distance that fits all situations. Given the complexity of power system reliability, land acquisition and transmission costs, environmental and land use considerations, and other issues considered in siting transmission lines over long distances, a “one size fits all “ separation distance is not feasible. Therefore, ICF recommends a standardized
Executive Summary
ES‐2 Framework for Analyzing Separation Distances between Transmission Lines in Wyoming
framework, systematically applied to multiple regions, to determine an appropriate minimum separation distance between long‐distance high voltage transmission lines. Such a framework is currently lacking. This report describes a universally applicable analytic framework (Chapter 3) that provides the fundamental methodology for determining the minimum separation distance between high voltage transmission lines in Wyoming. Creating this framework involved analyzing various factors that impact line separation distance, then formulating the line separation distance problem, and deriving a process‐based solution.
The study developed (Chapter 4) specific analysis methods to determine the minimum separation distance for weather‐related factors where separation distance could mitigate the risk of a simultaneous outage of two transmission lines. Applying the analytic framework and analysis methods to available data for Wyoming, the report determines that the recommended minimum line separation distance for new transmission lines in eastern and southeastern Wyoming ranges from about 260 feet up to the longest span length (1,500 feet in this study) for parallel 500‐kV transmission lines. The lower value of the range is dependent on the height of the transmission tower and line sag length; the upper value encompasses the lower value and equals the longest span length of the two transmission lines. Using the framework and approach described in this report, these and other values can be calculated for high‐voltage transmission lines of various voltages, tower heights, and span lengths. While these values are based on logical mathematical formulations, robust methodologies, and detailed analyses of available data, changes in one or more of the assumptions or constraints identified in this report could substantially increase the minimum separation range.
In addition, the recommended minimum range of transmission line separation distance in this report is only one of several factors that should be used in determining the actual separation of transmission lines in Wyoming. The WECC path rating process, costs, environmental permitting, land use constraints, public and other stakeholder interests, and state, regional, and national interests should also be considered.
A greater redundancy of transmission will lead to a more stable energy network. Developing more than one backbone transmission corridor from the wind resource areas in Wyoming to load centers would help ensure system reliability. These backbone transmission corridors could be separated by tens if not hundreds of miles to avoid multiple line outages due to weather‐related factors that could cause significant damage and impair power system reliability. Each backbone transmission corridor could have multiple 500‐kV alternating current (AC) and high‐voltage direct current (DC) lines, and Wyoming could minimize the line separation within these backbone corridors based on the approaches identified in this study.
Chapter 1 – Introduction
Framework for Analyzing Separation Distances between Transmission Lines in Wyoming 1‐1
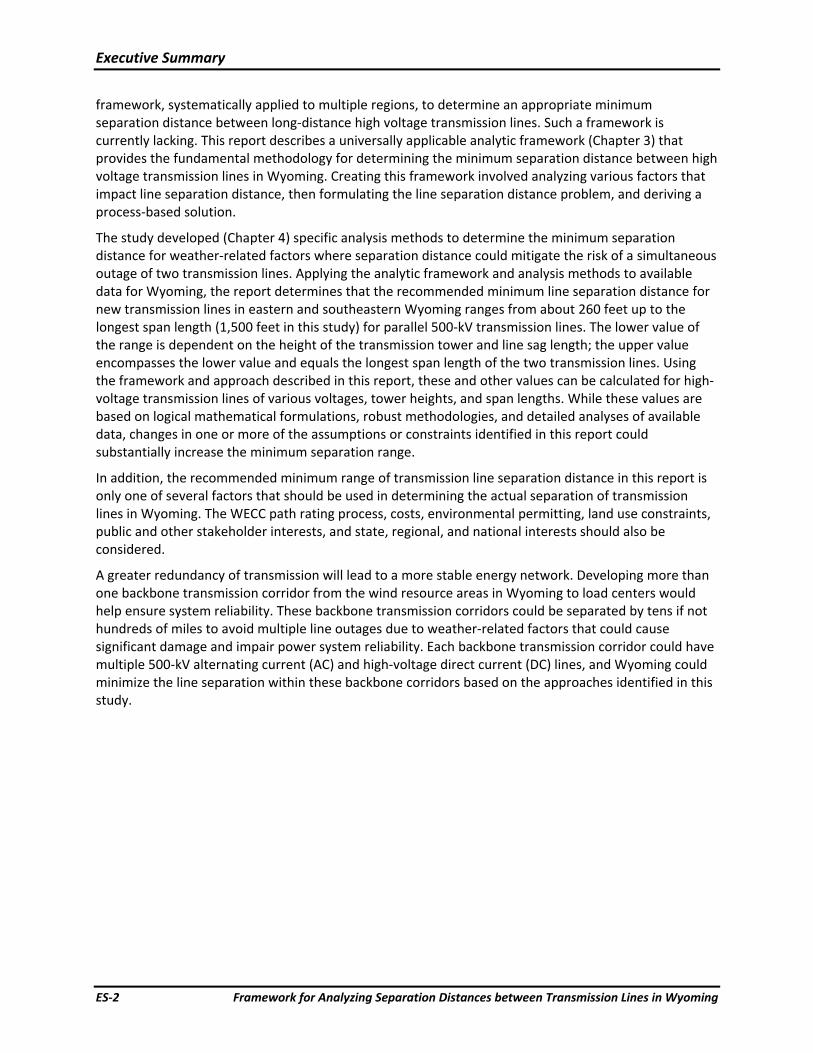
CHAPTER 1 – INTRODUCTION This chapter provides background information and an explanation of the need for this study; provides information about the nature of the electrical power system, demand, and generation for the Western Electricity Coordinating Council (WECC) system in general and for the State of Wyoming in particular; describes the need for multiple long‐distance transmission lines in the system to connect remote generation centers with load centers; and briefly describes each of the currently proposed high‐voltage interstate transmission lines in the State of Wyoming.
1.1 Project Background and Need Section 368 of the Energy Policy Act of 2005 (Public Law 109‐58) required “… the Secretaries of Agriculture, Commerce, Defense, Energy, and the Interior to designate, under their respective authorities, corridors for oil, gas, and hydrogen pipelines and electricity transmission and distribution facilities on Federal land in the 11 contiguous Western States …” The Department of the Interior (DOI) issued a Record of Decision (ROD) in January 2009 designating energy corridors on Bureau of Land Management (BLM) administered lands in the 11 contiguous Western States of Arizona, California, Colorado, Idaho, Montana, Nevada, New Mexico, Oregon, Utah, Washington, and Wyoming. The Final Programmatic Environmental Impact Statement, Designation of Energy Corridors on Federal Lands in the 11 Western States (DOE/EIS‐0386) (referred to hereinafter as the West‐wide Energy Corridor PEIS), identified the corridor locations and analyzed the effects on the environment associated with potential future projects within the corridors (DOE et al. 2008). The average width of energy corridors analyzed in Wyoming for the West‐wide Corridor PEIS was about 1,500 feet.
The Obama Administration has a comprehensive plan to reduce the Country’s dependence on foreign oil, address climate change, and invest in alternative and renewable energy. Investments in renewable energy (e.g., solar, wind, geothermal, biomass) will also require investment in electric transmission lines, especially in the West where lands capable of renewable energy generation are often distant from load centers. The American Recovery and Reinvestment Act of 2009 (Public Law 111‐5) provides supplemental appropriations for investment in infrastructure to support the development and transmission of renewable energy. For example, Public Law 111‐5 provides the Western Area Power Administration $3.25 billion for “… constructing, financing, facilitating, planning, operating, maintaining, or studying construction of new or upgraded electric power transmission lines and related facilities …” and “delivering or facilitating the delivery of power generated by renewable energy resources …” These federal investments, combined with state Renewables Portfolio Standards (RPS), serve to increase interest in development of electric transmission lines, especially in western states like Wyoming, which are rich in wind power. At present, at least seven major (345 or more kilovolts [kV]) transmission lines are under consideration in Wyoming, including the followed named projects:
• Gateway West
• Gateway South
• High Plains Express
• Overland Intertie
• TransWest Express
• Wyoming‐Colorado Intertie
• Zephyr
Most of the proposed transmission lines in Wyoming will cross public lands administered by the BLM or other federal agencies and therefore will require right‐of‐way (ROW) grants. Transmission line
Chapter 1 – Introduction
1‐2 Framework for Analyzing Separation Distances between Transmission Lines in Wyoming
applicants for ROW grants from the BLM in Wyoming have suggested varying separation distances (ranging up to 5 miles) between their proposed transmission lines and other electric transmission lines to minimize the risk of simultaneous outages on multiple lines. Separation distance between multiple transmission lines can affect power system reliability, which can in turn affect the WECC project rating process or the maximum capacity (power) in megawatts (MW) that the line is permitted to carry. The WECC is responsible for maintaining electric reliability in the western United States (U.S.) and the project rating process integrates new transmission projects into the existing power system with power ratings that are derived using North American Electric Reliability Corporation (NERC) reliability standards and WECC reliability criteria. This process also protects transfer capacities of existing facilities, meaning that path ratings on “grandfathered” transmission lines are protected even if they don’t meet current line separation requirements.
Power system reliability improves as the separation distance between parallel transmission lines in a common corridor increases to the point that failure of one line can not physically impact the adjacent line (Southwest Area Transmission Common Corridor Task Force 2009). From the perspective of improving power system reliability, it is therefore desirable to maximize the separation distance between proposed major transmission lines in Wyoming. However, increasing the separation distance between transmission lines generally increases the costs, and environmental and land use impacts associated with the transmission lines. This inherent conflict presents a challenge for the continued development of power‐system infrastructure to transfer power from renewable energy‐rich locations (like Wyoming) to electrical load centers to the south and west. With over 50 percent of the best quality (Class 6 and 7) wind resources in the continental U.S., significant coal and natural gas reserves, and at least seven proposed transmission lines, Wyoming elected to proactively address the separation distance issue. The Wyoming Infrastructure Authority (WIA) contracted for the independent analysis described in this report to determine the minimum separation distance between high‐voltage transmission lines in Wyoming necessary to maintain power system reliability.
1.2 Transmission Line Separation Factors and Study Approach Transmission line separation criteria discussed in this report do not apply to the last five span lengths of aboveground transmission circuits as they approach substations. In addition, underground transmission lines are not subject to the line separation criteria related to weather. Factors that primarily influence aboveground transmission line separation include power system reliability, costs, and environmental and land use considerations. In determining the minimum separation distance between aboveground transmission lines in Wyoming, this study analyzed factors affecting power system reliability that can be mitigated to some degree by separation distance (e.g., weather‐related factors). Factors such as human error and equipment failure also affect power system reliability; however, they are generally independent of the separation distance between transmission lines and are therefore not analyzed in this study. Costs are also a consideration in transmission line separation. In general, lower separation distances between transmission lines (e.g., minimum easement width) equate to lower costs for permitting, constructing, maintaining, and operating the lines which in turn equates to lower cost to rate payers. In addition, the cost of environmental compliance may increase as separation distance increases; however, determining the least cost option of transmission lines is not within the scope of this study.
Although environmental and land use considerations can influence transmission line separation distances, each new transmission line route may encounter different jurisdictions, regulations, environmental issues, land use constraints, and terrain. Therefore, environmental and land use considerations, as they affect separation distance, are project specific and are not analyzed in this study. However, it is generally accepted that consolidating facilities, minimizes environmental and land use
Chapter 1 – Introduction
Framework for Analyzing Separation Distances between Transmission Lines in Wyoming 1‐3
impacts. For transmission lines, minimizing the separation distance between parallel transmission lines may minimize impacts associated with a new line by sharing access roads to minimize surface disturbance, avoiding additional habitat fragmentation and visual impacts by sharing easements, and minimizing cumulative effects by minimizing the incremental impact of the new line (Southwest Area Transmission Common Corridor Task Force 2009).
This study develops a framework for analyzing those factors affecting system reliability that can be mitigated by the separation distance between transmission lines. This analytical framework is then applied to conditions in Wyoming to develop a recommended range of minimum transmission line separation distances for proposed transmission lines in Wyoming.
Chapter 2 describes data and information obtained through a literature survey, research, and interviews as the first step to obtaining data on factors that influence transmission line separation. Chapter 3 describes a framework developed for analyzing factors that influence line separation. A preliminary problem formulation and solution methodology for determining adequate transmission line separation distances are also described in Chapter 3. The process described in Chapter 3 is then applied in Chapter 4 for conditions in the State of Wyoming to determine the recommended minimum range for transmission line separation distances. Tables and figures developed by ICF for this report are not sourced.
1.3 The Western Electricity Coordinating Council (WECC) System The WECC System was formed on April 18, 2002, by the merger of the Western Systems Coordinating Council, the Southwest Regional Transmission Association, and the Western Regional Transmission Association. One of eight electric reliability councils in North America, WECC is responsible for coordinating the reliability of the bulk electric system in the Western Interconnection. In addition to promoting a reliable electric‐power system, WECC supports competitive power markets, provides for open and non‐discriminatory transmission access among members, creates a forum for resolving transmission access disputes, and provides an environment for coordinating members’ operational and planning activities.
The WECC system includes a geographic area of about 1.8 million square miles and is the most diverse and largest of the eight Regional Reliability Organizations (RROs) of the NERC. The WECC service area extends from the provinces of Alberta and British Columbia in Canada to the northern portion of Baja California in Mexico, and includes all or portions of the 14 western states between (WECC 2009).
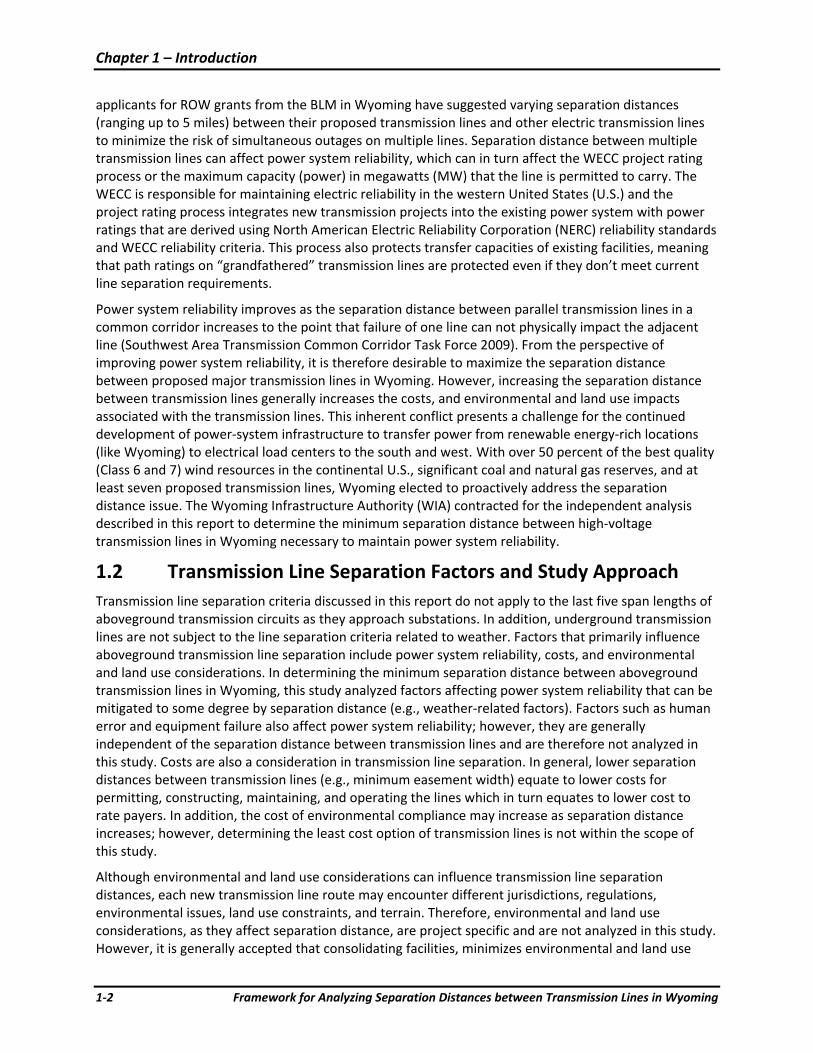
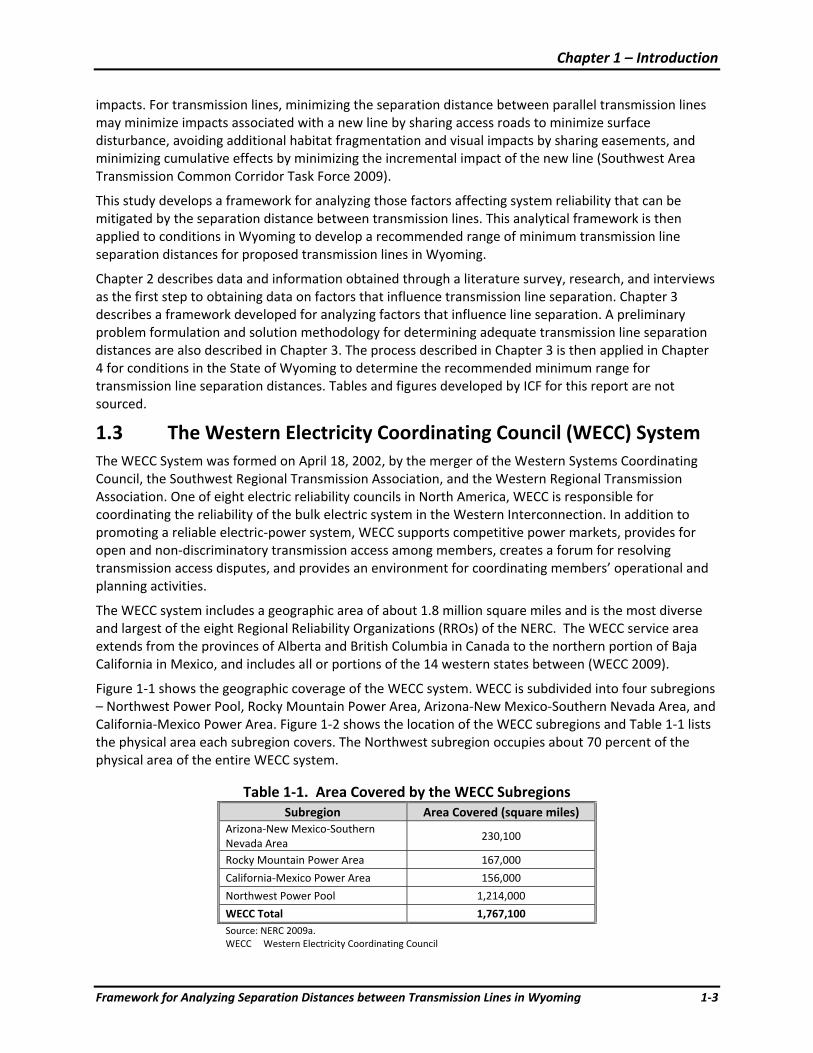
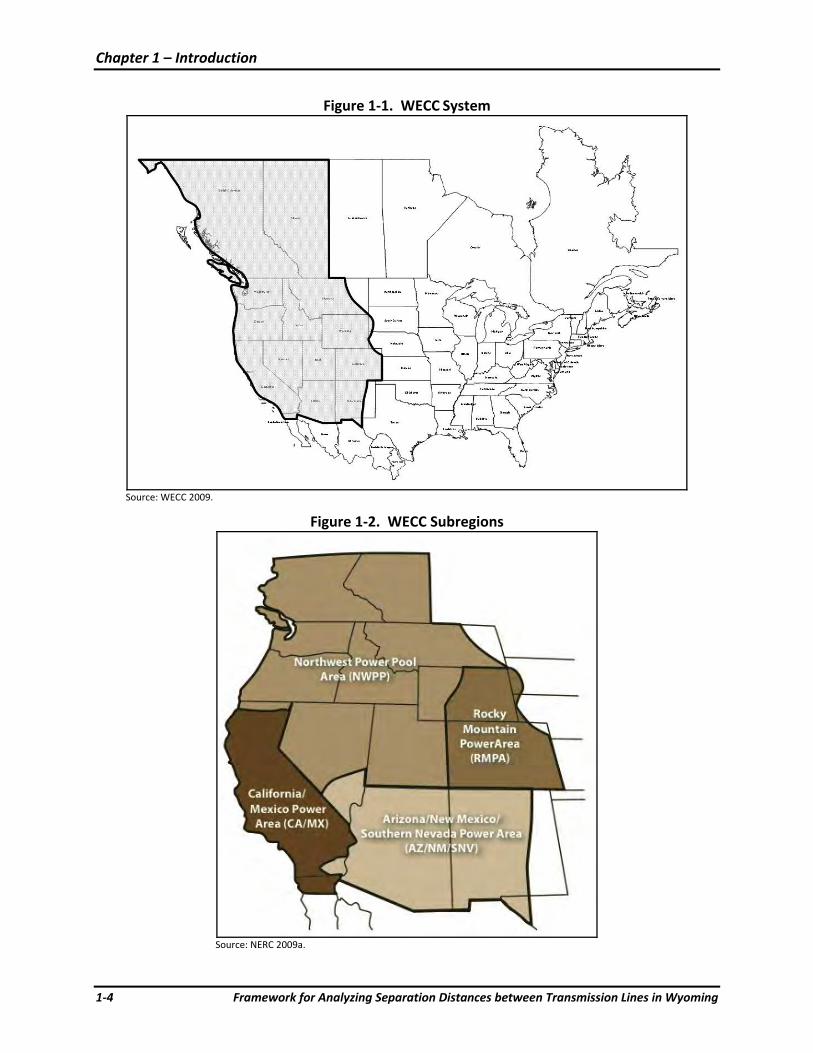
Figure 1‐1 shows the geographic coverage of the WECC system. WECC is subdivided into four subregions – Northwest Power Pool, Rocky Mountain Power Area, Arizona‐New Mexico‐Southern Nevada Area, and California‐Mexico Power Area. Figure 1‐2 shows the location of the WECC subregions and Table 1‐1 lists the physical area each subregion covers. The Northwest subregion occupies about 70 percent of the physical area of the entire WECC system.
Table 1‐1. Area Covered by the WECC Subregions Subregion Area Covered (square miles)
Arizona‐New Mexico‐Southern Nevada Area
230,100
Rocky Mountain Power Area 167,000
California‐Mexico Power Area 156,000
Northwest Power Pool 1,214,000
WECC Total 1,767,100 Source: NERC 2009a. WECC Western Electricity Coordinating Council
Chapter 1 – Introduction
1‐4 Framework for Analyzing Separation Distances between Transmission Lines in Wyoming
Figure 1‐1. WECC System
Source: WECC 2009.
Figure 1‐2. WECC Subregions
Source: NERC 2009a.
Chapter 1 – Introduction
Framework for Analyzing Separation Distances between Transmission Lines in Wyoming 1‐5
Coordination of the day‐to‐day interconnected system operation and establishing the procedures for long‐term planning processes are challenging for WECC because the region is large and its resources and members are diverse. The WECC system provides reliable electrical supply to more than 71 million people in the Western Interconnection.
At present, the WECC system has two operating Independent System Operators (ISOs) – the California Independent System Operator (CAISO) and the Alberta Electric System Operator.
1.3.1 Demand and Generation in the WECC System
Because of its geographic expanse, the WECC system has different peaking seasons between the subregions. The Northwest Power Pool is a winter‐peaking region and the Rocky Mountain Power Area peak occurs either in summer or winter. The Arizona‐New Mexico and California‐Mexico subregions are summer‐peaking.
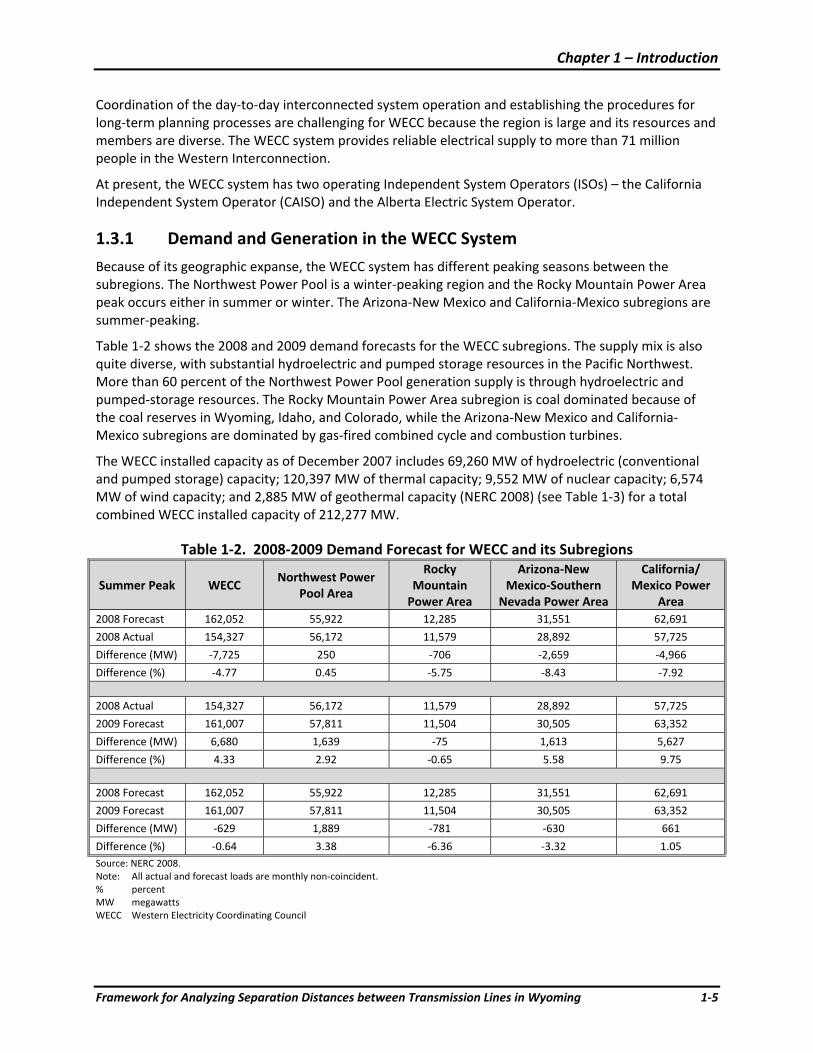
Table 1‐2 shows the 2008 and 2009 demand forecasts for the WECC subregions. The supply mix is also quite diverse, with substantial hydroelectric and pumped storage resources in the Pacific Northwest. More than 60 percent of the Northwest Power Pool generation supply is through hydroelectric and pumped‐storage resources. The Rocky Mountain Power Area subregion is coal dominated because of the coal reserves in Wyoming, Idaho, and Colorado, while the Arizona‐New Mexico and California‐Mexico subregions are dominated by gas‐fired combined cycle and combustion turbines.
The WECC installed capacity as of December 2007 includes 69,260 MW of hydroelectric (conventional and pumped storage) capacity; 120,397 MW of thermal capacity; 9,552 MW of nuclear capacity; 6,574 MW of wind capacity; and 2,885 MW of geothermal capacity (NERC 2008) (see Table 1‐3) for a total combined WECC installed capacity of 212,277 MW.
Table 1‐2. 2008‐2009 Demand Forecast for WECC and its Subregions
Summer Peak WECC Northwest Power
Pool Area
Rocky Mountain Power Area
Arizona‐New Mexico‐Southern
Nevada Power Area
California/Mexico Power
Area 2008 Forecast 162,052 55,922 12,285 31,551 62,691
2008 Actual 154,327 56,172 11,579 28,892 57,725
Difference (MW) ‐7,725 250 ‐706 ‐2,659 ‐4,966
Difference (%) ‐4.77 0.45 ‐5.75 ‐8.43 ‐7.92
2008 Actual 154,327 56,172 11,579 28,892 57,725
2009 Forecast 161,007 57,811 11,504 30,505 63,352
Difference (MW) 6,680 1,639 ‐75 1,613 5,627
Difference (%) 4.33 2.92 ‐0.65 5.58 9.75
2008 Forecast 162,052 55,922 12,285 31,551 62,691
2009 Forecast 161,007 57,811 11,504 30,505 63,352
Difference (MW) ‐629 1,889 ‐781 ‐630 661
Difference (%) ‐0.64 3.38 ‐6.36 ‐3.32 1.05 Source: NERC 2008. Note: All actual and forecast loads are monthly non‐coincident. % percent MW megawatts WECC Western Electricity Coordinating Council

Chapter 1 – Introduction
1‐6 Framework for Analyzing Separation Distances between Transmission Lines in Wyoming
Table 1‐3. WECC Capacity Mix Existing Resources as of 12/31/2007 Summer Ratings – Non Derated –
Northwest Power Pool
Area
Rocky Mountain Power Area
ArizonaNew Mexico
Southern Nevada Power Area
California Mexico
Power Area
WECC Total
Percent of Total
Hydro – Conventional & Pumped
49,126 1,426 4,700 14,008 69,260 30.2
Thermal 33,757 11,307 30,990 44,343 120,397 2.5
Nuclear 1,150 0 3,872 4,530 9,552 17.1
Geothermal 180 0 450 2,255 2,885 1.4
Internal Combustion 211 253 0 49 513 0.2
Biomass 639 2 58 1,120 1,819 0.9
Solar 0 8 49 458 515 0.2
Wind 3,243 662 295 2,374 6,574 3.1
Other 174 0 53 535 762 0.4
Total 88,480 13,658 40,467 69,672 212,277 100
Percent of WECC Total 41.7 6.4 19.1 32.8 100
Source: NERC 2008. WECC Western Electricity Coordinating Council
1.3.2 Transmission in the WECC System
Transmission lines are the backbone of the WECC energy system, spanning long distances and connecting the verdant Pacific Northwest with its abundant hydroelectric resources to the arid Southwest with its large coal‐fired and nuclear resources. The very basis for forming the RROs was that they would act as custodians of the electrical network and ensure reliable operation of the interconnected electrical system.
Each year, WECC performs a power‐supply assessment to identify major load zones and the possibility of load curtailment as a result of transmission constraints. WECC performs numerous operating studies, modeling the region under a number of load and resource scenarios, and develops appropriate operating procedures that allow safe and reliable operations. All the major power grid operators have their own internal processes for identifying and addressing local‐area resource limitations.
The major load centers in the Western Interconnection lie along the Pacific belt; the Southern California area is one of those major load centers. This area imports significant amounts of power and it is expected that transmission into this area and the other load centers of the Western Interconnection will be heavily utilized.
At present, WECC has eight back‐to‐back direct current ties to the Eastern Interconnection, with a combined transfer capability of almost 1,500 MW; only about 490 MW of net capacity imports were planned for the 2008 winter period. WECC has about 8,100 circuit miles of planned 230 to 500‐kV transmission line projects for the next 10‐year planning horizon. Transmission planners report these projects to WECC for inclusion in its Significant Additions Report. Table 1‐4 shows the existing and planned circuit miles of transmission in the WECC system.
Chapter 1 – Introduction
Framework for Analyzing Separation Distances between Transmission Lines in Wyoming 1‐7
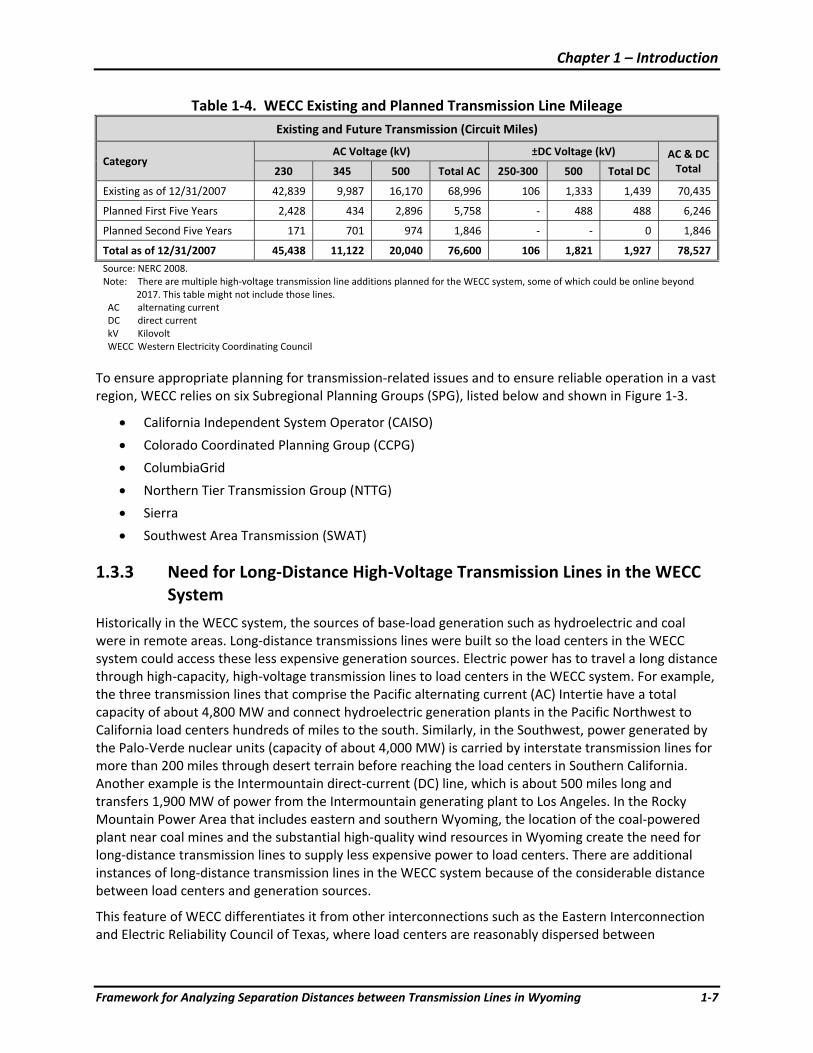
Table 1‐4. WECC Existing and Planned Transmission Line Mileage Existing and Future Transmission (Circuit Miles)
Category AC Voltage (kV) ±DC Voltage (kV) AC & DC
Total 230 345 500 Total AC 250‐300 500 Total DC
Existing as of 12/31/2007 42,839 9,987 16,170 68,996 106 1,333 1,439 70,435
Planned First Five Years 2,428 434 2,896 5,758 ‐ 488 488 6,246
Planned Second Five Years 171 701 974 1,846 ‐ ‐ 0 1,846
Total as of 12/31/2007 45,438 11,122 20,040 76,600 106 1,821 1,927 78,527
Source: NERC 2008. Note: There are multiple high‐voltage transmission line additions planned for the WECC system, some of which could be online beyond
2017. This table might not include those lines. AC alternating current DC direct current kV Kilovolt WECC Western Electricity Coordinating Council
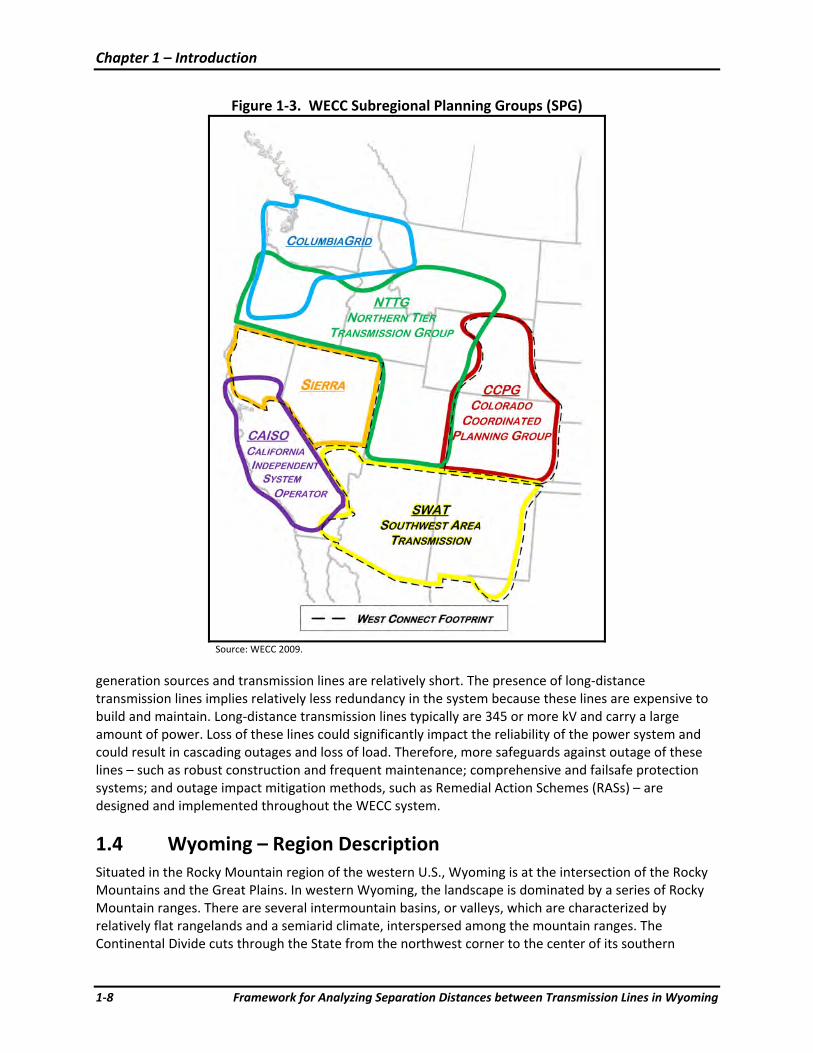
To ensure appropriate planning for transmission‐related issues and to ensure reliable operation in a vast region, WECC relies on six Subregional Planning Groups (SPG), listed below and shown in Figure 1‐3.
• California Independent System Operator (CAISO)
• Colorado Coordinated Planning Group (CCPG)
• ColumbiaGrid
• Northern Tier Transmission Group (NTTG)
• Sierra
• Southwest Area Transmission (SWAT)
1.3.3 Need for Long‐Distance High‐Voltage Transmission Lines in the WECC System
Historically in the WECC system, the sources of base‐load generation such as hydroelectric and coal were in remote areas. Long‐distance transmissions lines were built so the load centers in the WECC system could access these less expensive generation sources. Electric power has to travel a long distance through high‐capacity, high‐voltage transmission lines to load centers in the WECC system. For example, the three transmission lines that comprise the Pacific alternating current (AC) Intertie have a total capacity of about 4,800 MW and connect hydroelectric generation plants in the Pacific Northwest to California load centers hundreds of miles to the south. Similarly, in the Southwest, power generated by the Palo‐Verde nuclear units (capacity of about 4,000 MW) is carried by interstate transmission lines for more than 200 miles through desert terrain before reaching the load centers in Southern California. Another example is the Intermountain direct‐current (DC) line, which is about 500 miles long and transfers 1,900 MW of power from the Intermountain generating plant to Los Angeles. In the Rocky Mountain Power Area that includes eastern and southern Wyoming, the location of the coal‐powered plant near coal mines and the substantial high‐quality wind resources in Wyoming create the need for long‐distance transmission lines to supply less expensive power to load centers. There are additional instances of long‐distance transmission lines in the WECC system because of the considerable distance between load centers and generation sources.
This feature of WECC differentiates it from other interconnections such as the Eastern Interconnection and Electric Reliability Council of Texas, where load centers are reasonably dispersed between
Chapter 1 – Introduction
1‐8 Framework for Analyzing Separation Distances between Transmission Lines in Wyoming
Figure 1‐3. WECC Subregional Planning Groups (SPG)
Source: WECC 2009.
generation sources and transmission lines are relatively short. The presence of long‐distance transmission lines implies relatively less redundancy in the system because these lines are expensive to build and maintain. Long‐distance transmission lines typically are 345 or more kV and carry a large amount of power. Loss of these lines could significantly impact the reliability of the power system and could result in cascading outages and loss of load. Therefore, more safeguards against outage of these lines – such as robust construction and frequent maintenance; comprehensive and failsafe protection systems; and outage impact mitigation methods, such as Remedial Action Schemes (RASs) – are designed and implemented throughout the WECC system.
1.4 Wyoming – Region Description Situated in the Rocky Mountain region of the western U.S., Wyoming is at the intersection of the Rocky Mountains and the Great Plains. In western Wyoming, the landscape is dominated by a series of Rocky Mountain ranges. There are several intermountain basins, or valleys, which are characterized by relatively flat rangelands and a semiarid climate, interspersed among the mountain ranges. The Continental Divide cuts through the State from the northwest corner to the center of its southern
Chapter 1 – Introduction
Framework for Analyzing Separation Distances between Transmission Lines in Wyoming 1‐9
border with Colorado. The eastern one‐third of the State consists primarily of a vast high‐altitude prairie, the western extension of the Great Plains that stretches from Canada through the U.S. to Mexico.
Wyoming’s location at the intersection of the Rocky Mountains and Great Plains, coupled with its diverse topography, substantial public land ownership, weather conditions, relatively low population, and richness in conventional and renewable energy resources, contribute to its historic role as an energy exporter. These characteristics also contribute to the number of proposed transmission lines in the State and the issue of separation distances needed between lines to address power system reliability issues. Appendix A provides more information about Wyoming’s topography, land ownership, weather, and natural resources.
1.5 Demand and Generation in Wyoming Because of its relatively low population, Wyoming has a low domestic electricity demand and generally has surplus generation capacity available for export. Wyoming produces almost 40 percent of the Nation’s coal, so it is not surprising that coal fuels the generation of most of the electricity in Wyoming. Natural gas and wind are more recent additions to generation resources, and growth in renewable energy capacity is mostly from wind farms, small hydroelectric facilities, and solar‐power projects. Utilities own most of the generation capacity.
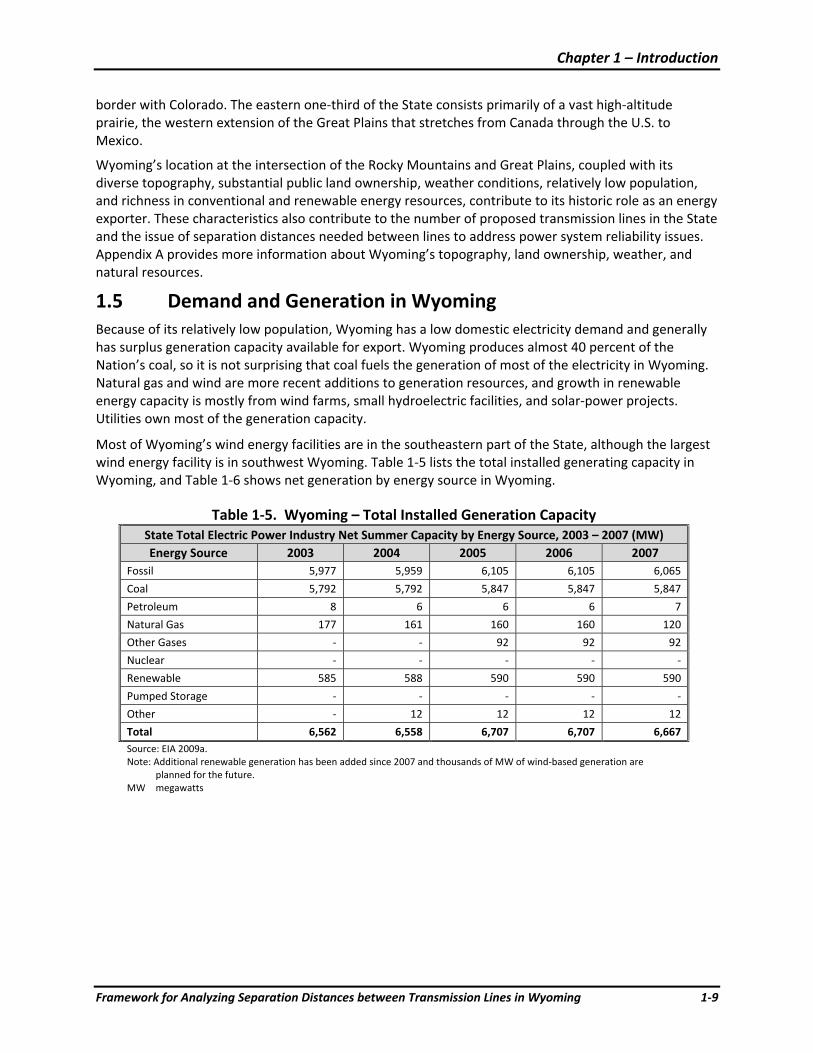
Most of Wyoming’s wind energy facilities are in the southeastern part of the State, although the largest wind energy facility is in southwest Wyoming. Table 1‐5 lists the total installed generating capacity in Wyoming, and Table 1‐6 shows net generation by energy source in Wyoming.
Table 1‐5. Wyoming – Total Installed Generation Capacity State Total Electric Power Industry Net Summer Capacity by Energy Source, 2003 – 2007 (MW) Energy Source 2003 2004 2005 2006 2007
Fossil 5,977 5,959 6,105 6,105 6,065
Coal 5,792 5,792 5,847 5,847 5,847
Petroleum 8 6 6 6 7
Natural Gas 177 161 160 160 120
Other Gases ‐ ‐ 92 92 92
Nuclear ‐ ‐ ‐ ‐ ‐
Renewable 585 588 590 590 590
Pumped Storage ‐ ‐ ‐ ‐ ‐
Other ‐ 12 12 12 12
Total 6,562 6,558 6,707 6,707 6,667 Source: EIA 2009a. Note: Additional renewable generation has been added since 2007 and thousands of MW of wind‐based generation are
planned for the future. MW megawatts
Chapter 1 – Introduction
1‐10 Framework for Analyzing Separation Distances between Transmission Lines in Wyoming
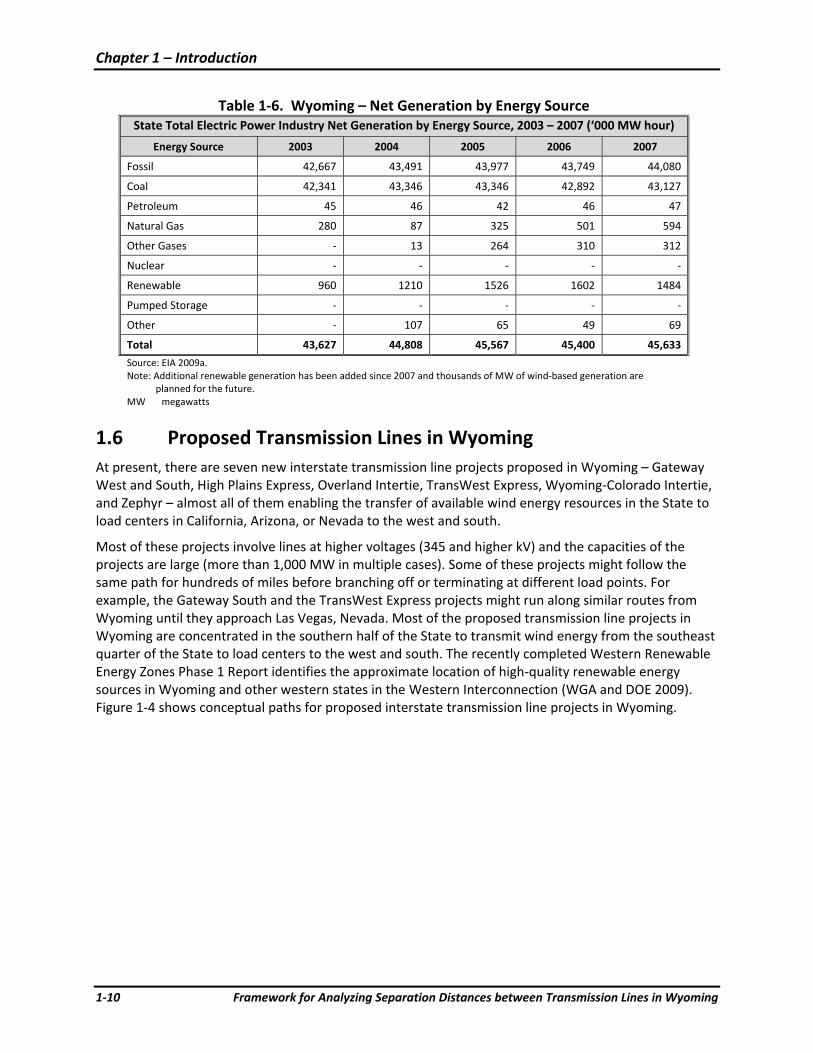
Table 1‐6. Wyoming – Net Generation by Energy Source State Total Electric Power Industry Net Generation by Energy Source, 2003 – 2007 (‘000 MW hour)
Energy Source 2003 2004 2005 2006 2007
Fossil 42,667 43,491 43,977 43,749 44,080
Coal 42,341 43,346 43,346 42,892 43,127
Petroleum 45 46 42 46 47
Natural Gas 280 87 325 501 594
Other Gases ‐ 13 264 310 312
Nuclear ‐ ‐ ‐ ‐ ‐
Renewable 960 1210 1526 1602 1484
Pumped Storage ‐ ‐ ‐ ‐ ‐
Other ‐ 107 65 49 69
Total 43,627 44,808 45,567 45,400 45,633
Source: EIA 2009a. Note: Additional renewable generation has been added since 2007 and thousands of MW of wind‐based generation are
planned for the future. MW megawatts
1.6 Proposed Transmission Lines in Wyoming At present, there are seven new interstate transmission line projects proposed in Wyoming – Gateway West and South, High Plains Express, Overland Intertie, TransWest Express, Wyoming‐Colorado Intertie, and Zephyr – almost all of them enabling the transfer of available wind energy resources in the State to load centers in California, Arizona, or Nevada to the west and south.
Most of these projects involve lines at higher voltages (345 and higher kV) and the capacities of the projects are large (more than 1,000 MW in multiple cases). Some of these projects might follow the same path for hundreds of miles before branching off or terminating at different load points. For example, the Gateway South and the TransWest Express projects might run along similar routes from Wyoming until they approach Las Vegas, Nevada. Most of the proposed transmission line projects in Wyoming are concentrated in the southern half of the State to transmit wind energy from the southeast quarter of the State to load centers to the west and south. The recently completed Western Renewable Energy Zones Phase 1 Report identifies the approximate location of high‐quality renewable energy sources in Wyoming and other western states in the Western Interconnection (WGA and DOE 2009). Figure 1‐4 shows conceptual paths for proposed interstate transmission line projects in Wyoming.

Chapter 1 – Introduction
Framework for Analyzing Separation Distances between Transmission Lines in Wyoming 1‐11
Figure 1‐4. Proposed Transmission Line Projects in Wyoming
Source: WIA 2009.
Routes shown are for illustrative purposes only and will be finalized following a comprehensive review process.
Chapter 1 – Introduction
1‐12 Framework for Analyzing Separation Distances between Transmission Lines in Wyoming
This page intentionally left blank.
Chapter 2 – Literature on Transmission Line Separation
Framework for Analyzing Separation Distances between Transmission Lines in Wyoming 2‐1
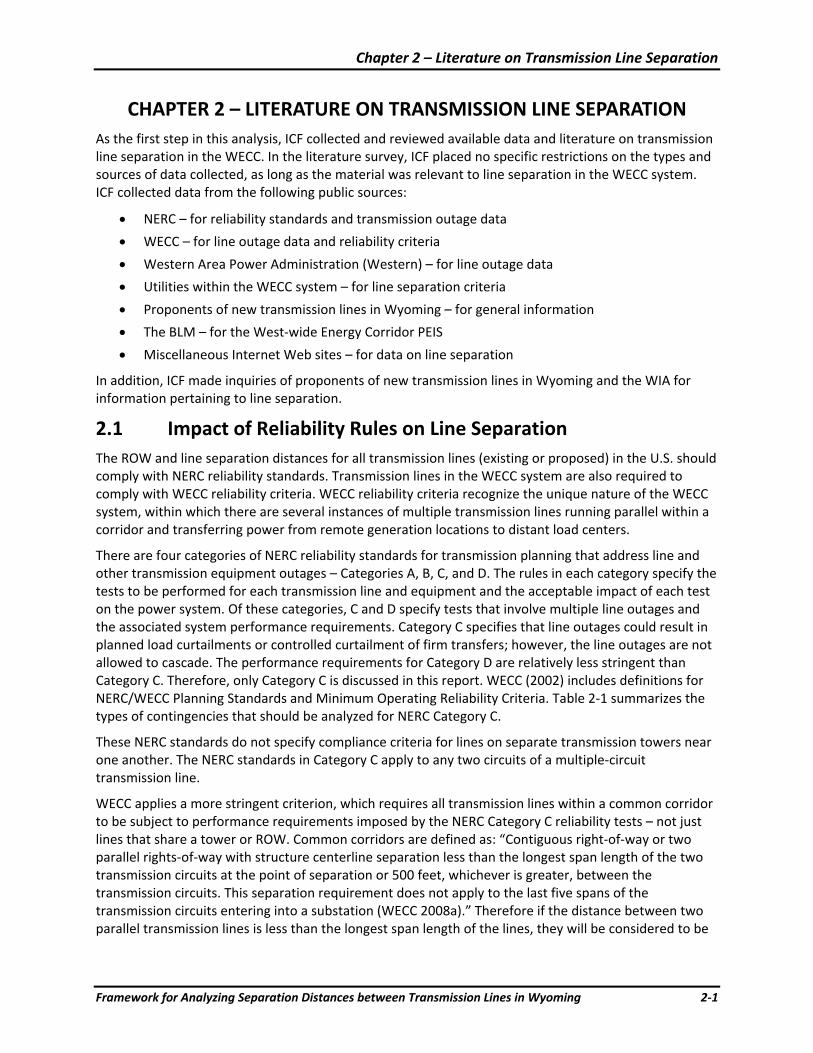
CHAPTER 2 – LITERATURE ON TRANSMISSION LINE SEPARATION As the first step in this analysis, ICF collected and reviewed available data and literature on transmission line separation in the WECC. In the literature survey, ICF placed no specific restrictions on the types and sources of data collected, as long as the material was relevant to line separation in the WECC system. ICF collected data from the following public sources:
• NERC – for reliability standards and transmission outage data
• WECC – for line outage data and reliability criteria
• Western Area Power Administration (Western) – for line outage data
• Utilities within the WECC system – for line separation criteria
• Proponents of new transmission lines in Wyoming – for general information
• The BLM – for the West‐wide Energy Corridor PEIS
• Miscellaneous Internet Web sites – for data on line separation
In addition, ICF made inquiries of proponents of new transmission lines in Wyoming and the WIA for information pertaining to line separation.
2.1 Impact of Reliability Rules on Line Separation The ROW and line separation distances for all transmission lines (existing or proposed) in the U.S. should comply with NERC reliability standards. Transmission lines in the WECC system are also required to comply with WECC reliability criteria. WECC reliability criteria recognize the unique nature of the WECC system, within which there are several instances of multiple transmission lines running parallel within a corridor and transferring power from remote generation locations to distant load centers.
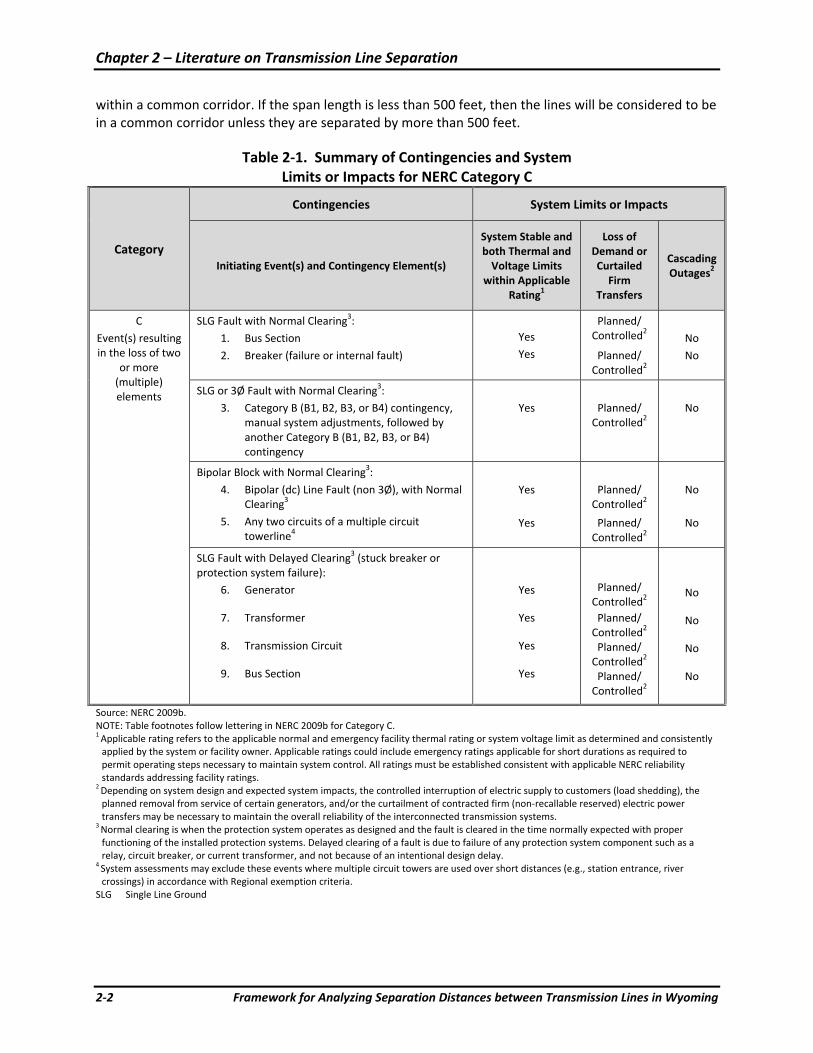
There are four categories of NERC reliability standards for transmission planning that address line and other transmission equipment outages – Categories A, B, C, and D. The rules in each category specify the tests to be performed for each transmission line and equipment and the acceptable impact of each test on the power system. Of these categories, C and D specify tests that involve multiple line outages and the associated system performance requirements. Category C specifies that line outages could result in planned load curtailments or controlled curtailment of firm transfers; however, the line outages are not allowed to cascade. The performance requirements for Category D are relatively less stringent than Category C. Therefore, only Category C is discussed in this report. WECC (2002) includes definitions for NERC/WECC Planning Standards and Minimum Operating Reliability Criteria. Table 2‐1 summarizes the types of contingencies that should be analyzed for NERC Category C.
These NERC standards do not specify compliance criteria for lines on separate transmission towers near one another. The NERC standards in Category C apply to any two circuits of a multiple‐circuit transmission line.
WECC applies a more stringent criterion, which requires all transmission lines within a common corridor to be subject to performance requirements imposed by the NERC Category C reliability tests – not just lines that share a tower or ROW. Common corridors are defined as: “Contiguous right‐of‐way or two parallel rights‐of‐way with structure centerline separation less than the longest span length of the two transmission circuits at the point of separation or 500 feet, whichever is greater, between the transmission circuits. This separation requirement does not apply to the last five spans of the transmission circuits entering into a substation (WECC 2008a).” Therefore if the distance between two parallel transmission lines is less than the longest span length of the lines, they will be considered to be
Chapter 2 – Literature on Transmission Line Separation
2‐2 Framework for Analyzing Separation Distances between Transmission Lines in Wyoming
within a common corridor. If the span length is less than 500 feet, then the lines will be considered to be in a common corridor unless they are separated by more than 500 feet.
Table 2‐1. Summary of Contingencies and System Limits or Impacts for NERC Category C
Category
Contingencies System Limits or Impacts
Initiating Event(s) and Contingency Element(s)
System Stable and both Thermal and Voltage Limits
within Applicable Rating1
Loss of Demand or Curtailed Firm
Transfers
Cascading Outages2
C
Event(s) resulting in the loss of two
or more (multiple) elements
SLG Fault with Normal Clearing3:
1. Bus Section
2. Breaker (failure or internal fault)
Yes
Yes
Planned/ Controlled2
Planned/ Controlled2
No
No
SLG or 3Ø Fault with Normal Clearing3:
3. Category B (B1, B2, B3, or B4) contingency, manual system adjustments, followed by another Category B (B1, B2, B3, or B4) contingency
Yes
Planned/ Controlled2
No
Bipolar Block with Normal Clearing3:
4. Bipolar (dc) Line Fault (non 3Ø), with Normal Clearing3
5. Any two circuits of a multiple circuit towerline4
Yes
Yes
Planned/ Controlled2
Planned/ Controlled2
No
No
SLG Fault with Delayed Clearing3 (stuck breaker or protection system failure):
6. Generator
7. Transformer
8. Transmission Circuit
9. Bus Section
Yes
Yes
Yes
Yes
Planned/ Controlled2
Planned/ Controlled2
Planned/ Controlled2
Planned/ Controlled2
No
No
No
No
Source: NERC 2009b. NOTE: Table footnotes follow lettering in NERC 2009b for Category C. 1 Applicable rating refers to the applicable normal and emergency facility thermal rating or system voltage limit as determined and consistently applied by the system or facility owner. Applicable ratings could include emergency ratings applicable for short durations as required to permit operating steps necessary to maintain system control. All ratings must be established consistent with applicable NERC reliability standards addressing facility ratings.
2 Depending on system design and expected system impacts, the controlled interruption of electric supply to customers (load shedding), the planned removal from service of certain generators, and/or the curtailment of contracted firm (non‐recallable reserved) electric power transfers may be necessary to maintain the overall reliability of the interconnected transmission systems.
3 Normal clearing is when the protection system operates as designed and the fault is cleared in the time normally expected with proper functioning of the installed protection systems. Delayed clearing of a fault is due to failure of any protection system component such as a relay, circuit breaker, or current transformer, and not because of an intentional design delay.
4 System assessments may exclude these events where multiple circuit towers are used over short distances (e.g., station entrance, river crossings) in accordance with Regional exemption criteria.
SLG Single Line Ground
Chapter 2 – Literature on Transmission Line Separation
Framework for Analyzing Separation Distances between Transmission Lines in Wyoming 2‐3
The WECC reliability criteria require that if transmission lines are in a common corridor, the lines should be analyzed for the simultaneous outage of the lines due to a single event. This is referred to as a common mode contingency analysis. WECC may allow an exception on a case‐by‐case basis if it is determined that the frequency of the initiating event is less than 1 in 30 years. WECC also has a safe harbor provision that states that the common mode contingency analysis requirement does not apply to lines that are not in a common corridor.
Specifically, WECC standards WRS1.1 and WRS 1.4 describe the common mode contingency analysis requirements and related issues (WECC 2008a).
WRS1.1 The NERC Category C.5 initiating event of a non‐three phase fault with normal clearing shall also apply to the common mode contingency of two Adjacent Transmission Circuits on separate towers unless the event frequency is determined to be less than one in thirty years.
WRS1.4 For contingencies involving existing or planned facilities, the Table W‐1 performance category can be adjusted based on actual or expected performance (e.g. event outage frequency and consideration of impact) after receiving Board approval to change the Performance Level Adjustment Record.
If the Mean Time Between Failures (MTBF) is less than 30 years and the lines share a corridor, NERC Category C tests should be performed. When conducting a common mode contingency analysis, particular attention should be given to events that could lead to cascading outages. The consequences of cascading outages can be severe; they can result in islanding of systems, loss of load, and blackouts. It is therefore important to analyze possible initiating events and implement mitigation measures.
If the common‐mode contingency analyses for a project shows that an event could have an unacceptable impact on the system, several mitigating measures can be applied. These include:
1) Reducing the ratings of the proposed lines (under normal system operations) until the analysis shows a tolerable impact to the system under common‐mode contingencies. This method would result in a WECC reduced path rating. For merchant power‐transmission companies, this reduction in path rating could have economic consequences since it would decrease the firm power transfer capability the transmission proponent could market to generation and load companies. For utilities, this could mean that based on load growth and other factors, more transmission in the region could be needed sooner than otherwise necessary because of the lower rating of the lines.
2) Formulating an Operating Procedure or a RAS to mitigate the impact of the common‐mode contingency. This usually requires changes to generation dispatch and/or installing additional transmission equipment such as volt ampere reactive (VAR) compensators. This could result in additional costs to the transmission proponents to maintain the initial path rating of the line.
3) Increasing the separation distance of the proposed line from other lines such that the distance equals 500 feet or the longest span length, whichever is greater. This action could result in increased costs to obtain ROWs and for construction infrastructure, because each line now will have a separate ROW, roads, and the like for construction and maintenance.
WECC has granted some exceptions to performing the common‐mode outage analysis when the separation distance did not meet the standard (WECC 2001). The exceptions are based on two categories – 1) events considered non‐credible and 2) credible events for which WECC granted exceptions to the criteria for various reasons. WECC addresses exceptions case‐by‐case. The candidates for exceptions are analyzed by WECC using multiple factors. One of the factors is compliance with the
Chapter 2 – Literature on Transmission Line Separation
2‐4 Framework for Analyzing Separation Distances between Transmission Lines in Wyoming
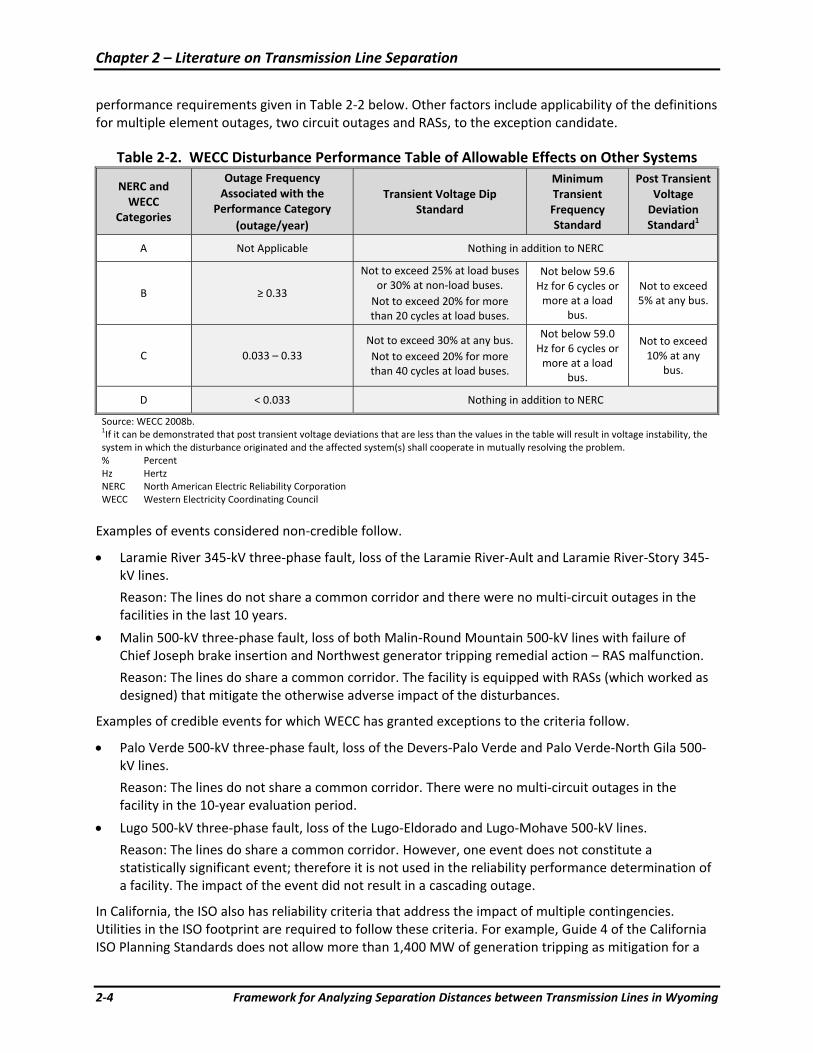
performance requirements given in Table 2‐2 below. Other factors include applicability of the definitions for multiple element outages, two circuit outages and RASs, to the exception candidate.
Table 2‐2. WECC Disturbance Performance Table of Allowable Effects on Other Systems
NERC and WECC
Categories
Outage Frequency Associated with the
Performance Category (outage/year)
Transient Voltage Dip Standard
Minimum Transient Frequency Standard
Post Transient Voltage Deviation Standard1
A Not Applicable Nothing in addition to NERC
B ≥ 0.33
Not to exceed 25% at load buses or 30% at non‐load buses. Not to exceed 20% for more than 20 cycles at load buses.
Not below 59.6 Hz for 6 cycles or more at a load
bus.
Not to exceed 5% at any bus.
C 0.033 – 0.33 Not to exceed 30% at any bus. Not to exceed 20% for more than 40 cycles at load buses.
Not below 59.0 Hz for 6 cycles or more at a load
bus.
Not to exceed 10% at any
bus.
D < 0.033 Nothing in addition to NERC
Source: WECC 2008b. 1If it can be demonstrated that post transient voltage deviations that are less than the values in the table will result in voltage instability, the system in which the disturbance originated and the affected system(s) shall cooperate in mutually resolving the problem. % Percent Hz Hertz NERC North American Electric Reliability Corporation WECC Western Electricity Coordinating Council
Examples of events considered non‐credible follow.
• Laramie River 345‐kV three‐phase fault, loss of the Laramie River‐Ault and Laramie River‐Story 345‐kV lines.
Reason: The lines do not share a common corridor and there were no multi‐circuit outages in the facilities in the last 10 years.
• Malin 500‐kV three‐phase fault, loss of both Malin‐Round Mountain 500‐kV lines with failure of Chief Joseph brake insertion and Northwest generator tripping remedial action – RAS malfunction.
Reason: The lines do share a common corridor. The facility is equipped with RASs (which worked as designed) that mitigate the otherwise adverse impact of the disturbances.
Examples of credible events for which WECC has granted exceptions to the criteria follow.
• Palo Verde 500‐kV three‐phase fault, loss of the Devers‐Palo Verde and Palo Verde‐North Gila 500‐kV lines.
Reason: The lines do not share a common corridor. There were no multi‐circuit outages in the facility in the 10‐year evaluation period.
• Lugo 500‐kV three‐phase fault, loss of the Lugo‐Eldorado and Lugo‐Mohave 500‐kV lines.
Reason: The lines do share a common corridor. However, one event does not constitute a statistically significant event; therefore it is not used in the reliability performance determination of a facility. The impact of the event did not result in a cascading outage.
In California, the ISO also has reliability criteria that address the impact of multiple contingencies. Utilities in the ISO footprint are required to follow these criteria. For example, Guide 4 of the California ISO Planning Standards does not allow more than 1,400 MW of generation tripping as mitigation for a
Chapter 2 – Literature on Transmission Line Separation
Framework for Analyzing Separation Distances between Transmission Lines in Wyoming 2‐5
double contingency. Accordingly, if a case‐specific analysis showed that a simultaneous outage of two adjacent circuits was credible, and the required mitigation for such an outage involved tripping more than 1,400 MW of generation, the planned adjacent transmission circuit would be in violation of applicable California ISO reliability criteria.
2.1.1 Individual Utility Criteria for Line Separation
Utilities in the WECC system also have line separation criteria. Regional utilities in the WECC system try to avoid the possibility of cascading outages by minimizing the likelihood of simultaneous failures of multiple transmission lines. The utilities base their line separation decisions on the likelihood of credible events that could cause common‐mode outage of the multiple lines in a single corridor.
For example, in the California desert regions, fires are relatively frequent; therefore, decisions about line separation distances need to consider the likelihood of a fire causing multiple line outages. A 1980 Southern California Edison article mentions desirable line separation for extra‐high‐voltage lines at 2,000 feet to avoid common mode impacts (Southern California Edison Company 1980). Because fires affect all lines in a common corridor, instead of increasing distance of separation, Southern California Edison recommends the use of fire breaks. For the transmission lines carrying power from Arizona and Nevada into California, lightning strikes, fires, and aircraft collisions with lines are among the causes of multi‐circuit outages. In September 1973, an airplane brought down two 500‐kV circuits, three 230‐kV circuits, and a 66‐kV circuit. Vandalism is also considered to be a risk – in October 1974, vandals dynamited 230‐ and 500‐kV Bonneville Power Administration systems. The article does not mention lightning as a cause of a significant number of double‐circuit outages.
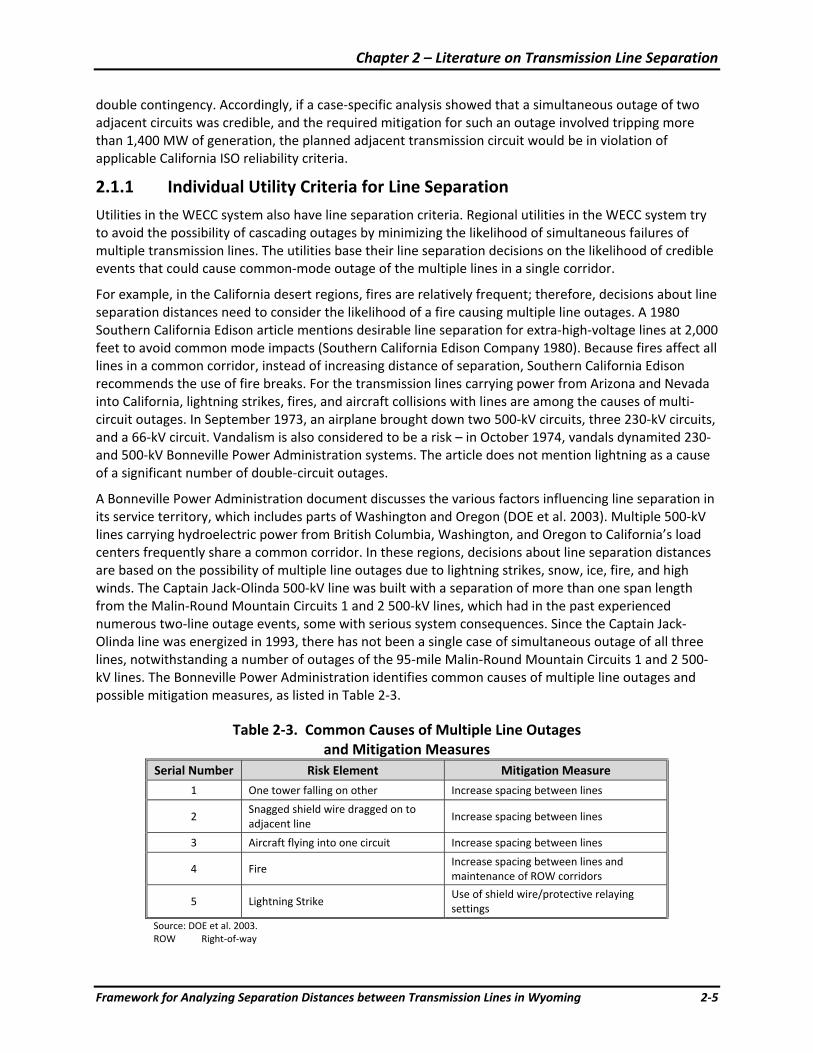
A Bonneville Power Administration document discusses the various factors influencing line separation in its service territory, which includes parts of Washington and Oregon (DOE et al. 2003). Multiple 500‐kV lines carrying hydroelectric power from British Columbia, Washington, and Oregon to California’s load centers frequently share a common corridor. In these regions, decisions about line separation distances are based on the possibility of multiple line outages due to lightning strikes, snow, ice, fire, and high winds. The Captain Jack‐Olinda 500‐kV line was built with a separation of more than one span length from the Malin‐Round Mountain Circuits 1 and 2 500‐kV lines, which had in the past experienced numerous two‐line outage events, some with serious system consequences. Since the Captain Jack‐Olinda line was energized in 1993, there has not been a single case of simultaneous outage of all three lines, notwithstanding a number of outages of the 95‐mile Malin‐Round Mountain Circuits 1 and 2 500‐kV lines. The Bonneville Power Administration identifies common causes of multiple line outages and possible mitigation measures, as listed in Table 2‐3.
Table 2‐3. Common Causes of Multiple Line Outages and Mitigation Measures
Serial Number Risk Element Mitigation Measure
1 One tower falling on other Increase spacing between lines
2 Snagged shield wire dragged on to adjacent line
Increase spacing between lines
3 Aircraft flying into one circuit Increase spacing between lines
4 Fire Increase spacing between lines and maintenance of ROW corridors
5 Lightning Strike Use of shield wire/protective relaying settings
Source: DOE et al. 2003. ROW Right‐of‐way

Chapter 2 – Literature on Transmission Line Separation
2‐6 Framework for Analyzing Separation Distances between Transmission Lines in Wyoming
The Bonneville Power Administration document also analyzed historical outage data for parallel lines in the same ROW within their system for the past 15 years. Figure 2‐1 summarizes that historical outage data.
Figure 2‐1. Outage Cause for Parallel Lines in Bonneville Power Administration Data 15‐Year History
Source: DOE et al. 2003.
The Bonneville Power Administration document observes that based on the analysis of outage data, it does not seem that increasing separation distance would translate into a lower outage rate of parallel lines. However, separating lines by the average span length or more significantly reduces the probability of common‐mode outage. Examples quoted in the report include the Captain Jack‐Olinda 500‐kV line, which is separated by one span length from the Round Mountain‐Malin 500‐kV line. Another example is construction of the third 500‐kV line, Los Banos‐Gates. The towers of the two circuits are 2,000 feet apart because there was an occurrence when a 500‐kV tower fell on another tower, leading to outage of power for 5 million people in the WECC system.
While discussing the reliability impact of the Los Banos‐Gates 500‐kV line, Pacific Gas & Electric mentions the criteria followed for line separation (California PUC 2001). Pacific Gas & Electric notes that a single 500‐kV transmission line is capable of carrying so much power that the interruption of only one such line could cause a significant disturbance to the stability of the entire regional electric system. For the bulk high‐voltage transmission additions, the project must be so defined that a credible three‐line outage cannot occur. To minimize the possibility of a simultaneous three‐line outage, Pacific Gas & Electric has adopted a minimum separation of approximately 2,000 feet between the two existing 500‐kV lines and the new 500‐kV line. In areas where a 2,000‐foot separation might not be possible, Pacific Gas & Electric suggests a case‐by‐case evaluation with appropriate improvements, such as extra strengthening of the new or existing towers.
A 1985 report described the line separation requirements for the California‐Oregon Transmission Project (Power Systems Studies Committee 1985). The report described how the minimum spacing for a single‐circuit 500‐kV line could be as low as 200 feet due to mountains and other geographical limitations. The
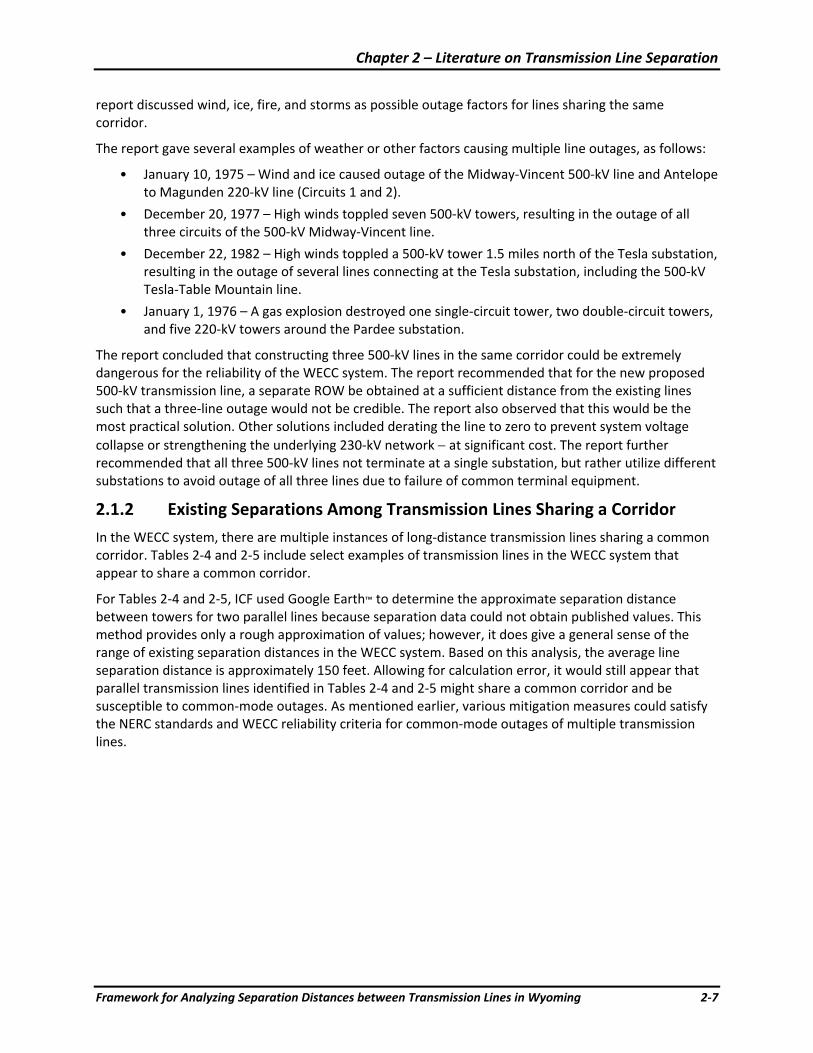
Chapter 2 – Literature on Transmission Line Separation
Framework for Analyzing Separation Distances between Transmission Lines in Wyoming 2‐7
report discussed wind, ice, fire, and storms as possible outage factors for lines sharing the same corridor.
The report gave several examples of weather or other factors causing multiple line outages, as follows:
• January 10, 1975 – Wind and ice caused outage of the Midway‐Vincent 500‐kV line and Antelope to Magunden 220‐kV line (Circuits 1 and 2).
• December 20, 1977 – High winds toppled seven 500‐kV towers, resulting in the outage of all three circuits of the 500‐kV Midway‐Vincent line.
• December 22, 1982 – High winds toppled a 500‐kV tower 1.5 miles north of the Tesla substation, resulting in the outage of several lines connecting at the Tesla substation, including the 500‐kV Tesla‐Table Mountain line.
• January 1, 1976 – A gas explosion destroyed one single‐circuit tower, two double‐circuit towers, and five 220‐kV towers around the Pardee substation.
The report concluded that constructing three 500‐kV lines in the same corridor could be extremely dangerous for the reliability of the WECC system. The report recommended that for the new proposed 500‐kV transmission line, a separate ROW be obtained at a sufficient distance from the existing lines such that a three‐line outage would not be credible. The report also observed that this would be the most practical solution. Other solutions included derating the line to zero to prevent system voltage collapse or strengthening the underlying 230‐kV network − at significant cost. The report further recommended that all three 500‐kV lines not terminate at a single substation, but rather utilize different substations to avoid outage of all three lines due to failure of common terminal equipment.
2.1.2 Existing Separations Among Transmission Lines Sharing a Corridor
In the WECC system, there are multiple instances of long‐distance transmission lines sharing a common corridor. Tables 2‐4 and 2‐5 include select examples of transmission lines in the WECC system that appear to share a common corridor.
For Tables 2‐4 and 2‐5, ICF used Google Earth™ to determine the approximate separation distance between towers for two parallel lines because separation data could not obtain published values. This method provides only a rough approximation of values; however, it does give a general sense of the range of existing separation distances in the WECC system. Based on this analysis, the average line separation distance is approximately 150 feet. Allowing for calculation error, it would still appear that parallel transmission lines identified in Tables 2‐4 and 2‐5 might share a common corridor and be susceptible to common‐mode outages. As mentioned earlier, various mitigation measures could satisfy the NERC standards and WECC reliability criteria for common‐mode outages of multiple transmission lines.
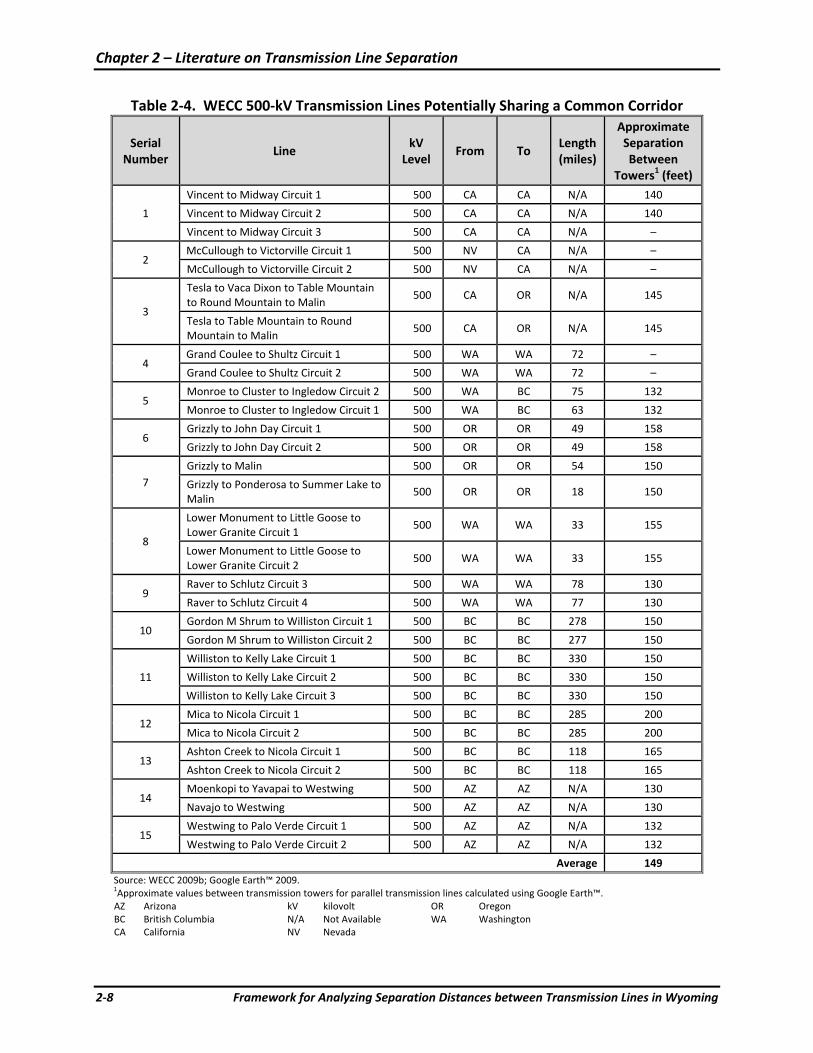
Chapter 2 – Literature on Transmission Line Separation
2‐8 Framework for Analyzing Separation Distances between Transmission Lines in Wyoming
Table 2‐4. WECC 500‐kV Transmission Lines Potentially Sharing a Common Corridor
Serial Number
Line kV
Level From To
Length (miles)
Approximate Separation Between
Towers1 (feet)
1
Vincent to Midway Circuit 1 500 CA CA N/A 140
Vincent to Midway Circuit 2 500 CA CA N/A 140
Vincent to Midway Circuit 3 500 CA CA N/A –
2 McCullough to Victorville Circuit 1 500 NV CA N/A –
McCullough to Victorville Circuit 2 500 NV CA N/A –
3
Tesla to Vaca Dixon to Table Mountain to Round Mountain to Malin
500 CA OR N/A 145
Tesla to Table Mountain to Round Mountain to Malin
500 CA OR N/A 145
4 Grand Coulee to Shultz Circuit 1 500 WA WA 72 –
Grand Coulee to Shultz Circuit 2 500 WA WA 72 –
5 Monroe to Cluster to Ingledow Circuit 2 500 WA BC 75 132
Monroe to Cluster to Ingledow Circuit 1 500 WA BC 63 132
6 Grizzly to John Day Circuit 1 500 OR OR 49 158
Grizzly to John Day Circuit 2 500 OR OR 49 158
7 Grizzly to Malin 500 OR OR 54 150
Grizzly to Ponderosa to Summer Lake to Malin
500 OR OR 18 150
8
Lower Monument to Little Goose to Lower Granite Circuit 1
500 WA WA 33 155
Lower Monument to Little Goose to Lower Granite Circuit 2
500 WA WA 33 155
9 Raver to Schlutz Circuit 3 500 WA WA 78 130
Raver to Schlutz Circuit 4 500 WA WA 77 130
10 Gordon M Shrum to Williston Circuit 1 500 BC BC 278 150
Gordon M Shrum to Williston Circuit 2 500 BC BC 277 150
11
Williston to Kelly Lake Circuit 1 500 BC BC 330 150
Williston to Kelly Lake Circuit 2 500 BC BC 330 150
Williston to Kelly Lake Circuit 3 500 BC BC 330 150
12 Mica to Nicola Circuit 1 500 BC BC 285 200
Mica to Nicola Circuit 2 500 BC BC 285 200
13 Ashton Creek to Nicola Circuit 1 500 BC BC 118 165
Ashton Creek to Nicola Circuit 2 500 BC BC 118 165
14 Moenkopi to Yavapai to Westwing 500 AZ AZ N/A 130
Navajo to Westwing 500 AZ AZ N/A 130
15 Westwing to Palo Verde Circuit 1 500 AZ AZ N/A 132
Westwing to Palo Verde Circuit 2 500 AZ AZ N/A 132
Average 149 Source: WECC 2009b; Google Earth™ 2009. 1Approximate values between transmission towers for parallel transmission lines calculated using Google Earth™. AZ Arizona kV kilovolt OR Oregon BC British Columbia N/A Not Available WA Washington CA California NV Nevada
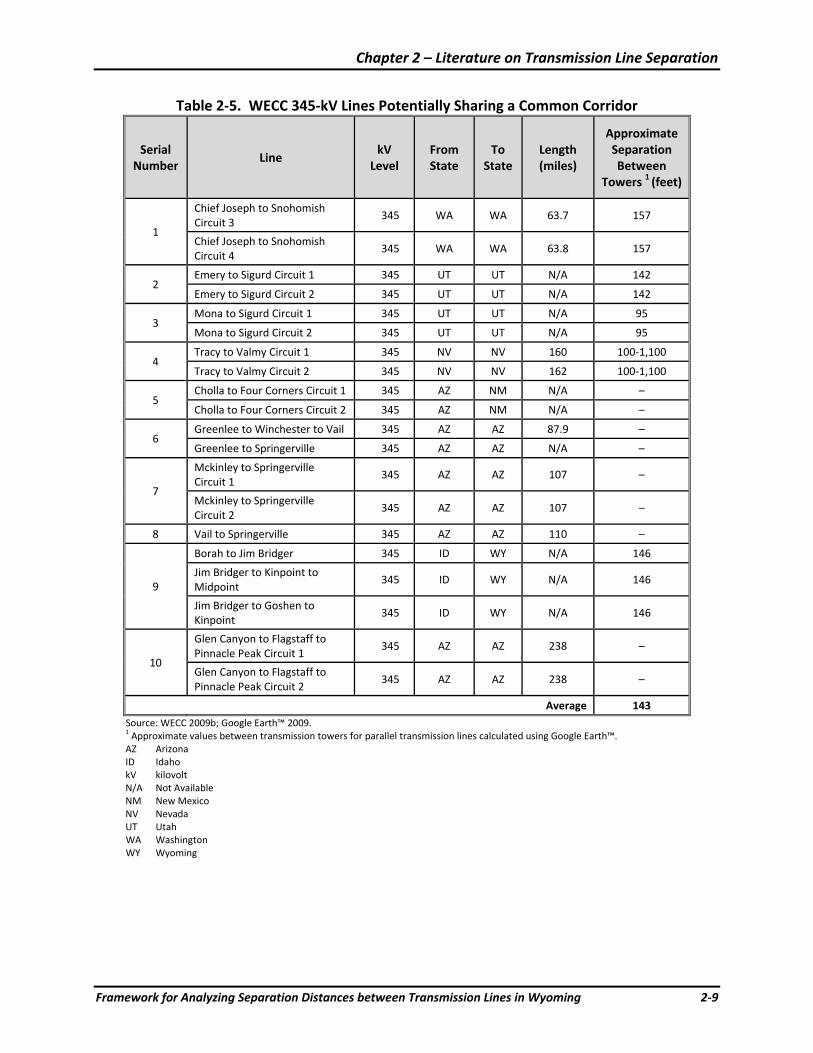
Chapter 2 – Literature on Transmission Line Separation
Framework for Analyzing Separation Distances between Transmission Lines in Wyoming 2‐9
Table 2‐5. WECC 345‐kV Lines Potentially Sharing a Common Corridor
Serial Number
Line kV
Level From State
To State
Length (miles)
Approximate Separation Between
Towers 1 (feet)
1
Chief Joseph to Snohomish Circuit 3
345 WA WA 63.7 157
Chief Joseph to Snohomish Circuit 4
345 WA WA 63.8 157
2 Emery to Sigurd Circuit 1 345 UT UT N/A 142
Emery to Sigurd Circuit 2 345 UT UT N/A 142
3 Mona to Sigurd Circuit 1 345 UT UT N/A 95
Mona to Sigurd Circuit 2 345 UT UT N/A 95
4 Tracy to Valmy Circuit 1 345 NV NV 160 100‐1,100
Tracy to Valmy Circuit 2 345 NV NV 162 100‐1,100
5 Cholla to Four Corners Circuit 1 345 AZ NM N/A –
Cholla to Four Corners Circuit 2 345 AZ NM N/A –
6 Greenlee to Winchester to Vail 345 AZ AZ 87.9 –
Greenlee to Springerville 345 AZ AZ N/A –
7
Mckinley to Springerville Circuit 1
345 AZ AZ 107 –
Mckinley to Springerville Circuit 2
345 AZ AZ 107 –
8 Vail to Springerville 345 AZ AZ 110 –
9
Borah to Jim Bridger 345 ID WY N/A 146
Jim Bridger to Kinpoint to Midpoint
345 ID WY N/A 146
Jim Bridger to Goshen to Kinpoint
345 ID WY N/A 146
10
Glen Canyon to Flagstaff to Pinnacle Peak Circuit 1
345 AZ AZ 238 –
Glen Canyon to Flagstaff to Pinnacle Peak Circuit 2
345 AZ AZ 238 –
Average 143 Source: WECC 2009b; Google Earth™ 2009. 1 Approximate values between transmission towers for parallel transmission lines calculated using Google Earth™. AZ Arizona ID Idaho kV kilovolt N/A Not Available NM New Mexico NV Nevada UT Utah WA Washington WY Wyoming
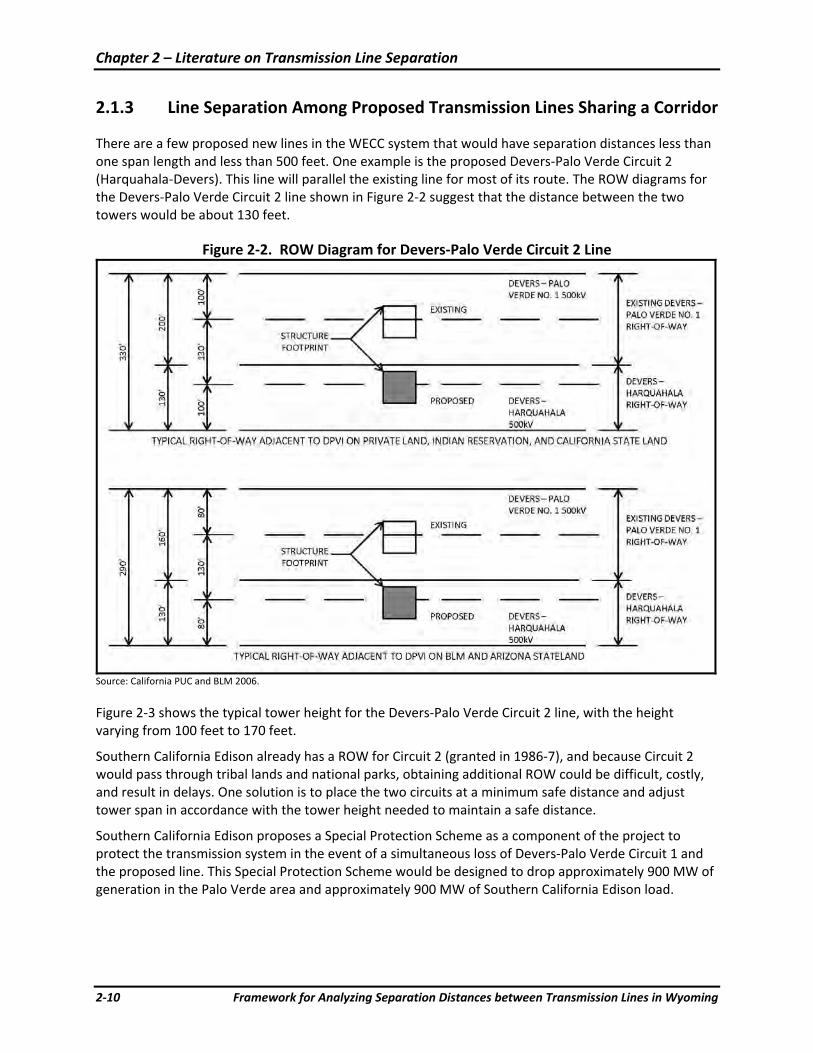
Chapter 2 – Literature on Transmission Line Separation
2‐10 Framework for Analyzing Separation Distances between Transmission Lines in Wyoming
2.1.3 Line Separation Among Proposed Transmission Lines Sharing a Corridor
There are a few proposed new lines in the WECC system that would have separation distances less than one span length and less than 500 feet. One example is the proposed Devers‐Palo Verde Circuit 2 (Harquahala‐Devers). This line will parallel the existing line for most of its route. The ROW diagrams for the Devers‐Palo Verde Circuit 2 line shown in Figure 2‐2 suggest that the distance between the two towers would be about 130 feet.
Figure 2‐2. ROW Diagram for Devers‐Palo Verde Circuit 2 Line
Source: California PUC and BLM 2006.
Figure 2‐3 shows the typical tower height for the Devers‐Palo Verde Circuit 2 line, with the height varying from 100 feet to 170 feet.
Southern California Edison already has a ROW for Circuit 2 (granted in 1986‐7), and because Circuit 2 would pass through tribal lands and national parks, obtaining additional ROW could be difficult, costly, and result in delays. One solution is to place the two circuits at a minimum safe distance and adjust tower span in accordance with the tower height needed to maintain a safe distance.
Southern California Edison proposes a Special Protection Scheme as a component of the project to protect the transmission system in the event of a simultaneous loss of Devers‐Palo Verde Circuit 1 and the proposed line. This Special Protection Scheme would be designed to drop approximately 900 MW of generation in the Palo Verde area and approximately 900 MW of Southern California Edison load.
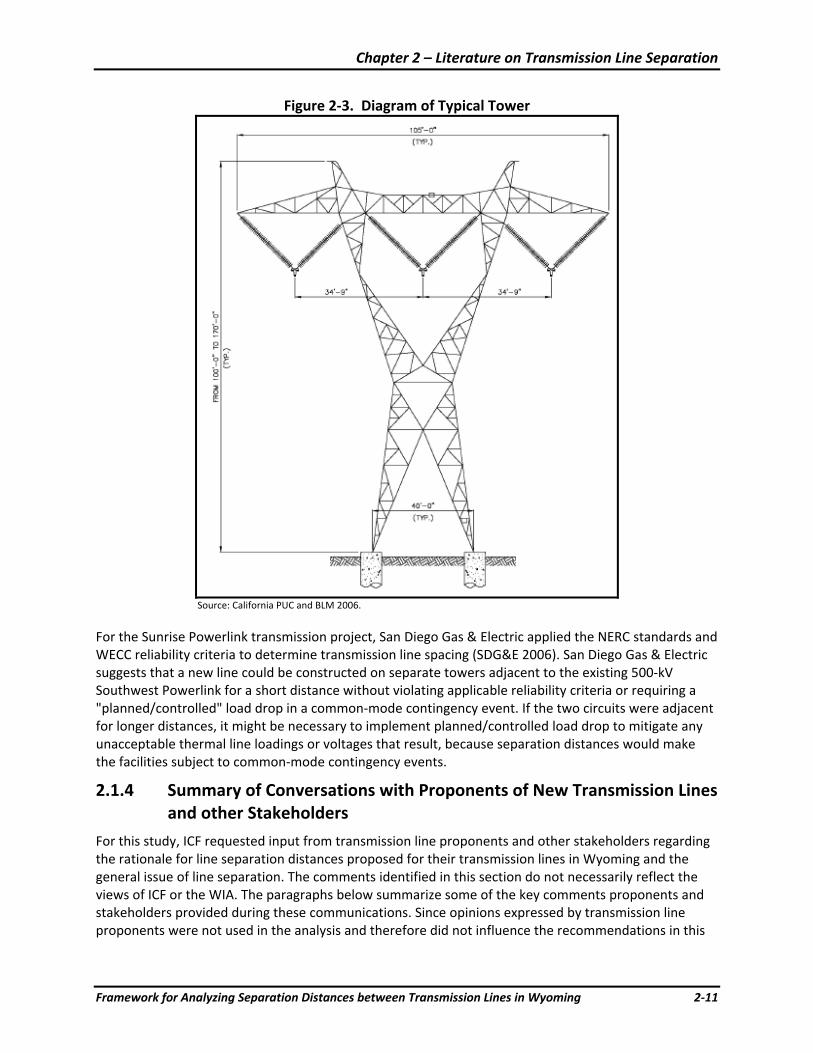
Chapter 2 – Literature on Transmission Line Separation
Framework for Analyzing Separation Distances between Transmission Lines in Wyoming 2‐11
Figure 2‐3. Diagram of Typical Tower
Source: California PUC and BLM 2006.
For the Sunrise Powerlink transmission project, San Diego Gas & Electric applied the NERC standards and WECC reliability criteria to determine transmission line spacing (SDG&E 2006). San Diego Gas & Electric suggests that a new line could be constructed on separate towers adjacent to the existing 500‐kV Southwest Powerlink for a short distance without violating applicable reliability criteria or requiring a "planned/controlled" load drop in a common‐mode contingency event. If the two circuits were adjacent for longer distances, it might be necessary to implement planned/controlled load drop to mitigate any unacceptable thermal line loadings or voltages that result, because separation distances would make the facilities subject to common‐mode contingency events.
2.1.4 Summary of Conversations with Proponents of New Transmission Lines and other Stakeholders
For this study, ICF requested input from transmission line proponents and other stakeholders regarding the rationale for line separation distances proposed for their transmission lines in Wyoming and the general issue of line separation. The comments identified in this section do not necessarily reflect the views of ICF or the WIA. The paragraphs below summarize some of the key comments proponents and stakeholders provided during these communications. Since opinions expressed by transmission line proponents were not used in the analysis and therefore did not influence the recommendations in this
Chapter 2 – Literature on Transmission Line Separation
2‐12 Framework for Analyzing Separation Distances between Transmission Lines in Wyoming
report, ICF did not independently verify the opinions expressed by transmission line proponents and summarized below.
Uniqueness of the WECC/Wyoming System and Regional Considerations
• Some transmission proponents opined that the existing WECC criterion specifying a minimum line separation of one span length is not defensible at this time. They compared the windy regions in the WECC system where wind speeds could reach 80 miles per hour (NOAA 2009) to places such as Chicago in the Eastern Interconnection. In the Eastern Interconnection, transmission lines do share corridors and separation distance may be limited to the ROW width between adjacent lines.
• The technical impact of multiple line outages in the WECC system is substantial and therefore should be mitigated by all means possible, including line separation. Multiple line outages in a single corridor in states with relatively little load and significant generation could lead to a system collapse. The transmission system in Wyoming is operating near or at its limit; therefore, there are not many mitigation options available in the event of multiple line outages in Wyoming.
• ICF’s study should be specific to Wyoming and address line separation based on the driving factors in Wyoming. The impact of line outages in Wyoming might not be as significant as other lines that have much higher utilization, such as the Las Vegas‐Los Angeles transmission lines. This is because the power that is expected to flow on the new transmission lines in Wyoming will be mostly wind‐based, with a capacity factor of 40 to 50 percent; therefore, the lines will not be fully utilized at all times.
• Because Wyoming has more tornadoes than any other state in the West, significant line separation is necessary.
• Line separation criteria should also be region specific. The Pacific AC Intertie might need more spacing based on weather conditions in the Northwest U.S.; however, lines could be placed closer together in places like Arizona, where the desert climate could reduce the risk factors that could lead to common‐corridor outages.
Technical and Engineering Issues and Concerns
• The technical and engineering analysis of the impact of the proposed lines on the existing WECC system is a difficult and challenging issue – more so than the implications of the line separation issue.
• At present, the single largest contingency in the WECC system would take out about 2,700 MW (Devers‐Palo Verde outage) and about 3,100 MW in the Northwest. Therefore, the effect on the system of the loss of 3,000 or more MW of transmission capacity could be substantial. As a result, there should be some consideration about limitation of total transmission capacity that can be built in a single corridor. If more than 3,000 MW of capacity were built in a single corridor, the effects of the loss of that corridor could significantly affect the reliability of the system.
• There might be situations in mountain valleys and other places where the separation could be less than one span length because of geographic and land use limitations.
• In some cases, proponents have also planned for installation of multiple RASs in the event of line outages.
Chapter 2 – Literature on Transmission Line Separation
Framework for Analyzing Separation Distances between Transmission Lines in Wyoming 2‐13
• There might be some confusion about the acceptable separation distance if a proposed line parallels lines of different voltage (with different span lengths) in various sections of the proposed route.
• There seems to be no engineering‐related concern about having a dc line close to an AC line.
WECC Criteria Interpretation and Compliance
• The WECC criterion on line separation is not mandatory; however, it is necessary to demonstrate compliance or outage impact mitigation to minimize the risk of reduction in path rating. There is room for interpretation of the line separation criterion based on various factors, such as outage frequency, land terrain, and other issues.
• Almost all the transmission line proponents plan to comply with the WECC criterion of one span length separation from adjacent lines. The WECC safe harbor provision is among the main factors considered for decisions about line separation distances to preserve the WECC‐assigned path rating.
WECC Planning Coordination Committee Discussion and Items of Interest
• In the WECC Planning Coordination Committee meeting on June 18, 2009, there was a proposal to investigate the possibility of either removing or changing the more restrictive WRS 1.1 criterion that applies NERC Category C5 performance tests to all circuits within a common corridor. However, the likelihood that NERC would agree to changes in this criterion is unknown; it has already been demonstrated to NERC that WRS 1.1 is needed because of the unique characteristics of the WECC system.
• The advantages of changing WRS 1.1 include potentially higher ratings on some WECC‐rated paths or total transfer capability limits for paths, potentially higher remote‐generation transfers, and allowing the placement of circuits within the current definition of a corridor without requirements.
• Possible disadvantages of changing WRS 1.1 include removing industry justification for having the criterion to keep separation and accommodating more circuits close together, which could result in a decrease in reliability.
• The WECC Reliability Subcommittee recommended a “Request to Revise or Develop a Standard” to start this process.
• Others at the WECC Planning Coordination Committee meeting observed that reliability might not necessarily be weakened if the WRS 1.1 was removed or changed. Changing this criterion is needed for development of long‐distance transmission line projects and renewable resources. Further, the reliability of the system could be maintained or improved by introducing additional criteria to compensate for removal of WRS 1.1 that will not restrict common corridors.
• There is a need to find balance between reliability, land use, and other environmental criteria.
Line Separation Risk Factors and Possible Concerns
• One of the biggest concerns for investors in proposed transmission lines will be the possibility of a derating risk after the line is built. If a cascading outage ever occurs after the line is in service (even with adequate line separation), WECC rules state that mitigation measures should be taken to ensure that such a cascading outage never happens again unless it can be shown that the MTBF between cascading outages will not be less than 300 years – a difficult task.
Chapter 2 – Literature on Transmission Line Separation
2‐14 Framework for Analyzing Separation Distances between Transmission Lines in Wyoming
• The WECC criterion of one span length separation is too low to avoid certain risk factors that could lead to common‐mode outages. Line separation by 1 to 5 miles could maximize the energy transfers through these corridors and help plan the transmission system in a robust way so as to reduce the frequency of requisitions for new corridors in the future. It would also reduce the risk of derating lines in the corridor for a substantial period.
• NERC Category D tests really do not require any specific actions, but only need a risk assessment for cascading outages. The concern is that it will be too late when cascading outages occur and then the line has to be derated.
• RASs are viewed as a mitigation tool to avoid the risk of line derating.
Historical Examples of Line Outages
• Following are three examples where common‐mode outages have caused significant disturbance to the reliability of the WECC system:
o The Pacific AC Intertie, where there are two 500‐kV lines within a single corridor.
o The Bridger generation‐transmission system in Wyoming, wherein the lines out of the Jim Bridger station (which are separated by about 120 feet) are in a common corridor (2,200‐MW path capacity). In the past, common‐mode causes (tornadoes, high wind, etc.) caused outages of this system. Multiple RASs are now in place to mitigate those line outages.
o Path C – Idaho‐Salt Lake City transmission path has been derated from 1,000 MW to 600 MW due to an outage. As a result of this outage, the transmission operator was required to implement a RAS. The path rating has now been increased to 800 MW. However, due to the history of that one outage, this path cannot regain the 1,000‐MW initial rating.
Other Issues, Concerns, and Suggestions
• Transmission line proponents are very sensitive to environmental issues and intend to ensure full compliance with all environmental concerns.
• Possible frequency of outages should be statistically analyzed to determine line separation.
• It is important to consider the whole issue as a “capacity in a corridor issue,” instead of treating it on the basis of individual lines. Because line separation cannot be a “one size fits all” (500 feet or the longest span length criterion might be too close for some, too far for others), there has to be a process framework to evaluate the maximum capacity that can be transferred in a designated corridor. There are also many existing corridors that are over built, so there is a need to consider grandfathering in existing corridors.
2.2 Influence of Other Factors on Line Separation2.2.1 Land Use and Environmental Constraints Some of the most important factors – apart from power system reliability – that influence line separation distances are land use and other environmental constraints. In Wyoming, one of the primary environmental issues is the potential impact to sage grouse. One of the most effective ways to reduce environmental impacts of transmission lines can be through consolidation of the facilities or placement of the facilities near one another (SWAT Common Corridor Task Force 2009). As noted earlier, this approach could be at odds with the WECC line separation criterion of one span length, which is based on maintaining power system reliability.
The Federal Government owns and the BLM manages a significant portion of the land in the western U.S. The Western Regional Corridor study recognizes the importance of corridors on public lands to
Chapter 2 – Literature on Transmission Line Separation
Framework for Analyzing Separation Distances between Transmission Lines in Wyoming 2‐15
long‐term utility planning (Michael Clayton and Associates 1992). The West‐wide Energy Corridor PEIS identified “energy corridors” for 11 contiguous western states, wherein applicants of proposed energy transportation projects (such as gas pipelines and transmission lines) could take advantage of an expedited application and permitting process compared to areas outside these energy corridors. The width of these energy corridors varies based on environmental characteristics and other factors. For example, in Wyoming the average width of energy corridors analyzed in the West‐wide Energy Corridor PEIS is approximately 3,500 feet. For this example, up to three parallel 500‐kV or less transmission lines (assuming a maximum span length of 1,500 feet for a 500 or less kV transmission line), could theoretically be accommodated in a 3,500 feet energy corridor and still meet the WECC safe harbor provision.
2.2.2 Construction and Maintenance Cost and Time Placing transmission lines closer to each other could increase shared utilization of construction‐related infrastructure such as roads and equipment. Transmission line construction costs are a function of various parameters (line materials, labor, tower design, land prices, and others). As lines are sited farther apart, separate construction and maintenance infrastructure might need to be developed, which typically increases the cost of the line and the time required for construction and maintenance. The increase in construction costs and time associated with greater separation distances between lines can be compared to the financial risk of a lower rating due to closer spacing of the lines.
Conversely, other requirements for ROW width might prevent sharing of the space between transmission lines. These include clearances required for line maintenance. Maintenance activities requiring cranes need to be considered while determining line separation to allow for their safe operation. Also, live‐line maintenance procedures require working clearances established by the National Electrical Safety Code (NESC) and the Occupational Safety and Health Administration (OSHA) that are functions of line voltage and the operational range of the equipment (SWAT Common Corridor Task Force 2009).
2.2.3 Electrical and Magnetic Fields Electrical and magnetic fields are naturally occurring phenomena associated with transmission lines. The electrical and magnetic fields from multiple transmission lines within a corridor can either add or subtract from each other to create higher or lower field levels. The separation distance between two parallel lines will affect the magnitude of the resultant electrical and magnetic fields. The Common Corridor Task Force of SWAT calculated parameters for electrical and magnetic fields for two configurations of parallel transmission lines (SWAT Common Corridor Task Force 2009). For both configurations, the results show that the peak electrical field, both inside and outside the ROW, decreases as separation distances increase. Although the changes as a function of separation distances can reach 30 percent in lower‐voltage lines, the absolute magnitude of the field is very small to start with; therefore, the changes are not significant. The task force also found that the differences in electric field with separation are not significant for 500‐kV lines (SWAT Common Corridor Task Force 2009).
For magnetic fields, the task force found that in terms of actual quantities, the decreases in magnetic‐field strength are not significant with the variation in separation distances. As with the electrical field, magnetic fields for lower‐voltage lines change more with separation distance, but the amount of change is small and therefore not significant (SWAT Common Corridor Task Force 2009).
2.2.4 Historical NERC, WECC, and Other Outage Data As mentioned earlier, various events can cause simultaneous outages of multiple lines. It is important to understand the causes of line outages to analyze whether changing transmission line separation
Chapter 2 – Literature on Transmission Line Separation
2‐16 Framework for Analyzing Separation Distances between Transmission Lines in Wyoming
distance could result in avoiding multiple outages in a common corridor. The first step was to gather historical data on the causes of transmission line outages – multiple or single. This section summarizes publicly available outage data from NERC, WECC, and utilities.
Information on outages and their causes for individual lines is not readily available in the public domain. NERC publishes outage data for lines in the U.S. based on reports from utilities and regional organizations such as WECC. Upon review of the NERC disturbance data for the WECC system, ICF observed that three events caused most of the disturbances – weather, equipment failure, or system‐operation issues (NERC 1992‐2007). Human error also caused a number of disturbances.
Figure 2‐4 shows the number of disturbances and their causes for each year from 1992 through 2007. ICF observes that the total number of disturbances reported increased over time. This could be due to several reasons. The number of disturbances reported to WECC and NERC could have increased over time, the actual number of disturbances themselves could have increased, or the rules for reporting disturbances could have changed, resulting in more events being reported in the latter years. Although the reason for a continuous increase in disturbances is not obvious, ICF observes that the disturbances caused by system‐operation issues have actually decreased, indicating a move toward an efficient and reliable system. Outages caused by weather‐related events over the years cannot be foreseen or planned for, and can be considered unusual occurrences. Proper remedial actions could minimize failures/disturbances caused by equipment failure; adapting efficient workplace practices and providing proper training and monitoring could minimize human errors.
Rocky Mountain Power Area Line Outage Data
Similar to WECC outage data, the Rocky Mountain Power Area also witnessed an increase in the number of instances under different categories of outages (see Figure 2‐5). The primary causes for the disturbances were either equipment‐related or weather‐related. Because detailed data on the causes of outages are not available for each event, ICF cannot determine if adequate line separation could have prevented multiple line failures due to weather‐related outages.
WECC 2007 and 2008 Transmission Reliability Data Reports
WECC transmission reliability data reports for 2006 (WECC 2007a) and 2007 (WECC 2008c) list all the possible risk categories for transmission line outages. WECC gathered historical information on line and transformer outages in the WECC system for 500‐kV, 345–kV, and 230‐kV systems. While single‐line outages were the most common form of outage reported, WECC also gathered data for multiple line outages. Table 2‐6 lists the extent of the response by individual utilities to the WECC line outage data request.
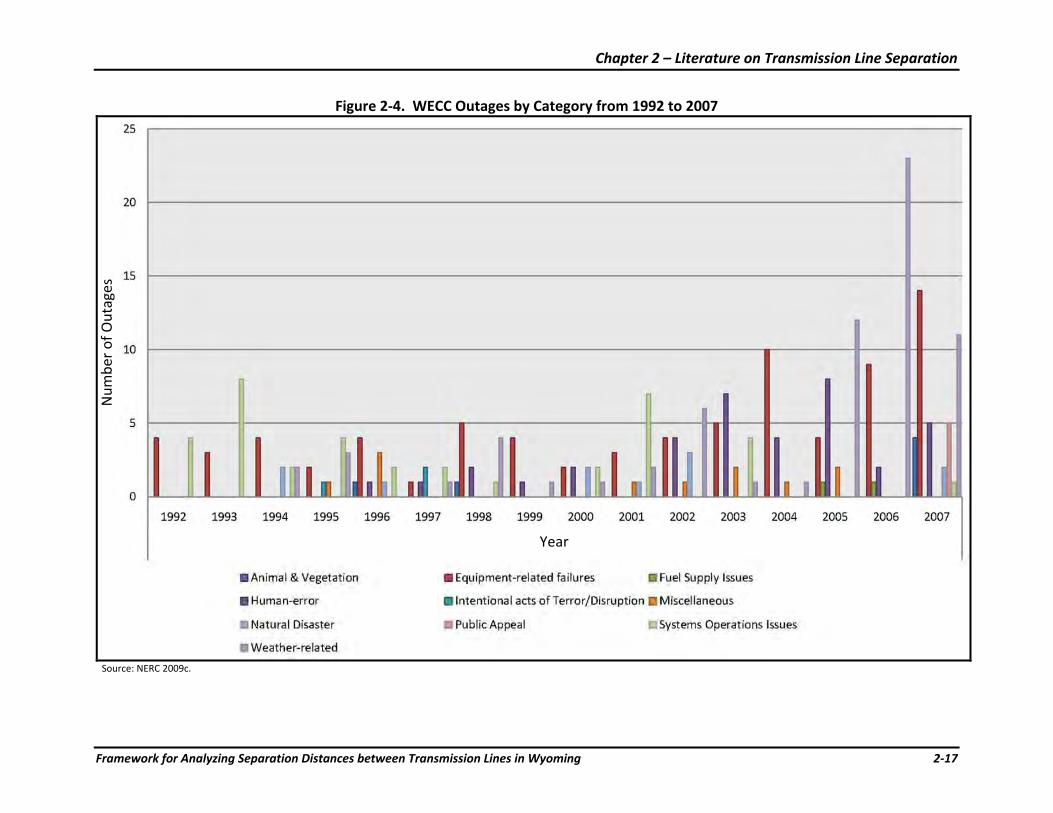
Chapter 2 – Literature on Transmission Line Separation
Framework for Analyzing Separation Distances between Transmission Lines in Wyoming 2‐17
Figure 2‐4. WECC Outages by Category from 1992 to 2007
Source: NERC 2009c.
Year
Num
ber o
f Outages
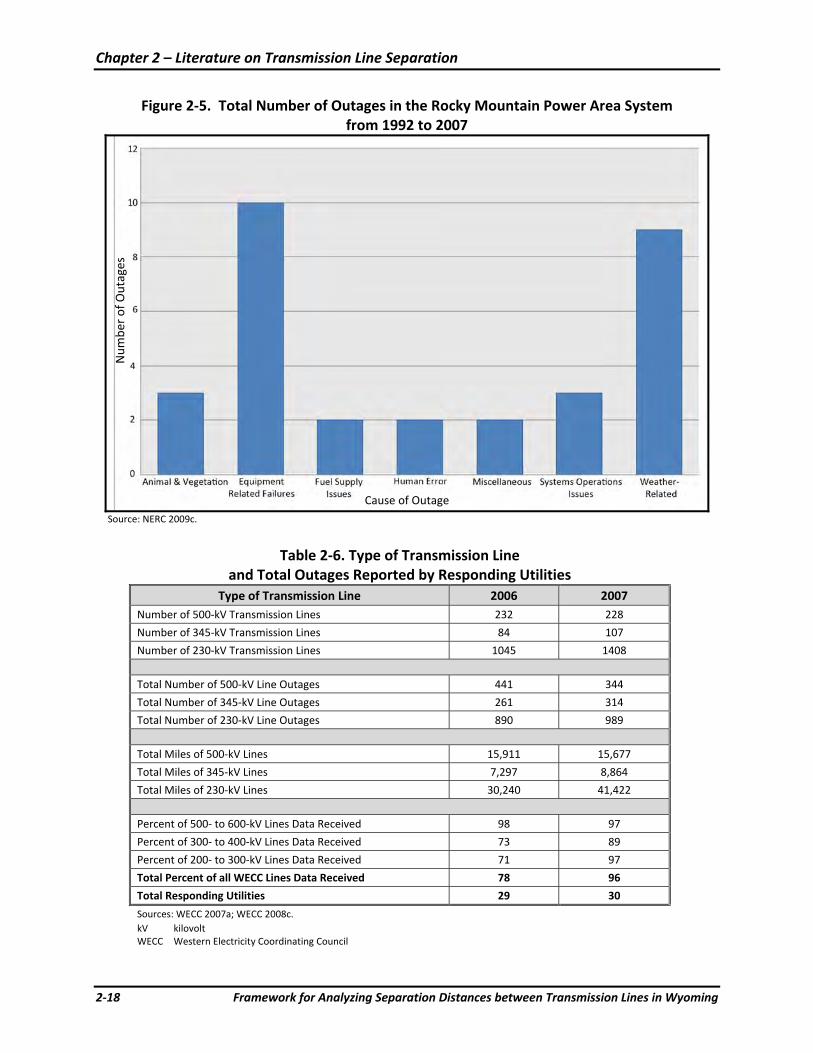
Chapter 2 – Literature on Transmission Line Separation
2‐18 Framework for Analyzing Separation Distances between Transmission Lines in Wyoming
Figure 2‐5. Total Number of Outages in the Rocky Mountain Power Area System from 1992 to 2007
Source: NERC 2009c.
Table 2‐6. Type of Transmission Line and Total Outages Reported by Responding Utilities
Type of Transmission Line 2006 2007 Number of 500‐kV Transmission Lines 232 228
Number of 345‐kV Transmission Lines 84 107
Number of 230‐kV Transmission Lines 1045 1408 Total Number of 500‐kV Line Outages 441 344
Total Number of 345‐kV Line Outages 261 314
Total Number of 230‐kV Line Outages 890 989 Total Miles of 500‐kV Lines 15,911 15,677
Total Miles of 345‐kV Lines 7,297 8,864
Total Miles of 230‐kV Lines 30,240 41,422 Percent of 500‐ to 600‐kV Lines Data Received 98 97
Percent of 300‐ to 400‐kV Lines Data Received 73 89
Percent of 200‐ to 300‐kV Lines Data Received 71 97
Total Percent of all WECC Lines Data Received 78 96
Total Responding Utilities 29 30
Sources: WECC 2007a; WECC 2008c. kV kilovolt WECC Western Electricity Coordinating Council
Num
ber o
f Outages
Cause of Outage
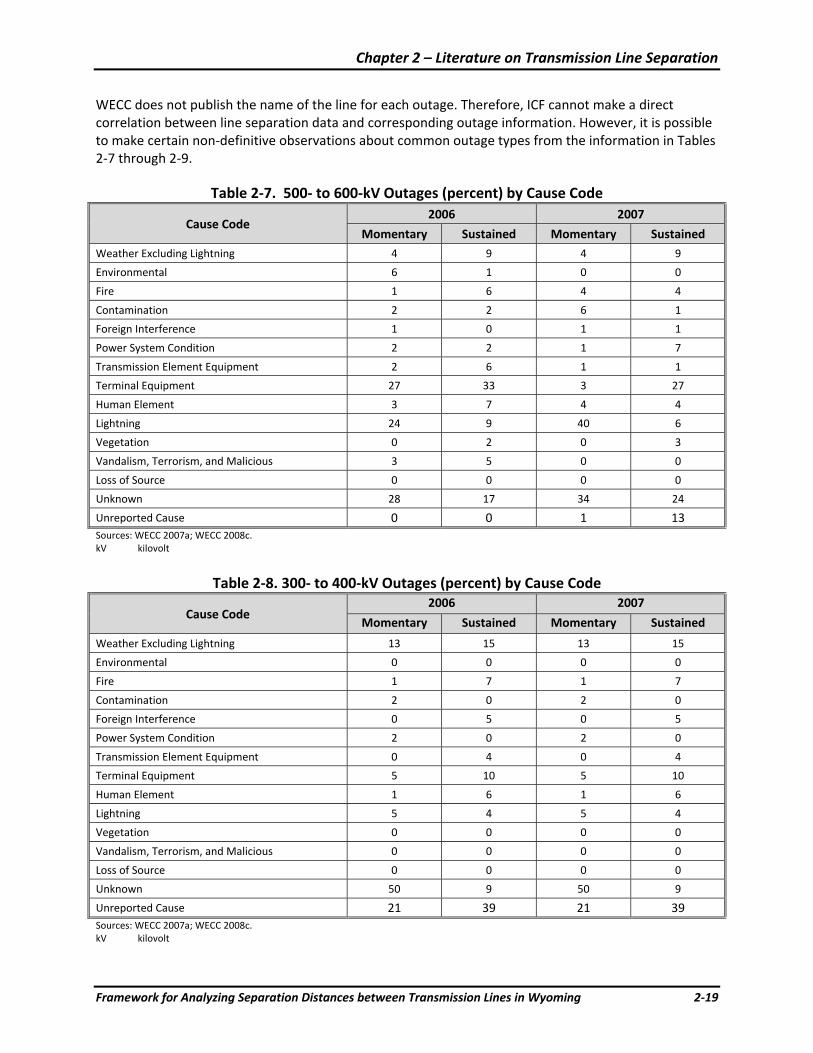
Chapter 2 – Literature on Transmission Line Separation
Framework for Analyzing Separation Distances between Transmission Lines in Wyoming 2‐19
WECC does not publish the name of the line for each outage. Therefore, ICF cannot make a direct correlation between line separation data and corresponding outage information. However, it is possible to make certain non‐definitive observations about common outage types from the information in Tables 2‐7 through 2‐9.
Table 2‐7. 500‐ to 600‐kV Outages (percent) by Cause Code
Cause Code 2006 2007
Momentary Sustained Momentary Sustained Weather Excluding Lightning 4 9 4 9
Environmental 6 1 0 0
Fire 1 6 4 4
Contamination 2 2 6 1
Foreign Interference 1 0 1 1
Power System Condition 2 2 1 7
Transmission Element Equipment 2 6 1 1
Terminal Equipment 27 33 3 27
Human Element 3 7 4 4
Lightning 24 9 40 6
Vegetation 0 2 0 3
Vandalism, Terrorism, and Malicious 3 5 0 0
Loss of Source 0 0 0 0
Unknown 28 17 34 24
Unreported Cause 0 0 1 13 Sources: WECC 2007a; WECC 2008c. kV kilovolt
Table 2‐8. 300‐ to 400‐kV Outages (percent) by Cause Code
Cause Code 2006 2007
Momentary Sustained Momentary Sustained
Weather Excluding Lightning 13 15 13 15
Environmental 0 0 0 0
Fire 1 7 1 7
Contamination 2 0 2 0
Foreign Interference 0 5 0 5
Power System Condition 2 0 2 0
Transmission Element Equipment 0 4 0 4
Terminal Equipment 5 10 5 10
Human Element 1 6 1 6
Lightning 5 4 5 4
Vegetation 0 0 0 0
Vandalism, Terrorism, and Malicious 0 0 0 0
Loss of Source 0 0 0 0
Unknown 50 9 50 9
Unreported Cause 21 39 21 39 Sources: WECC 2007a; WECC 2008c. kV kilovolt
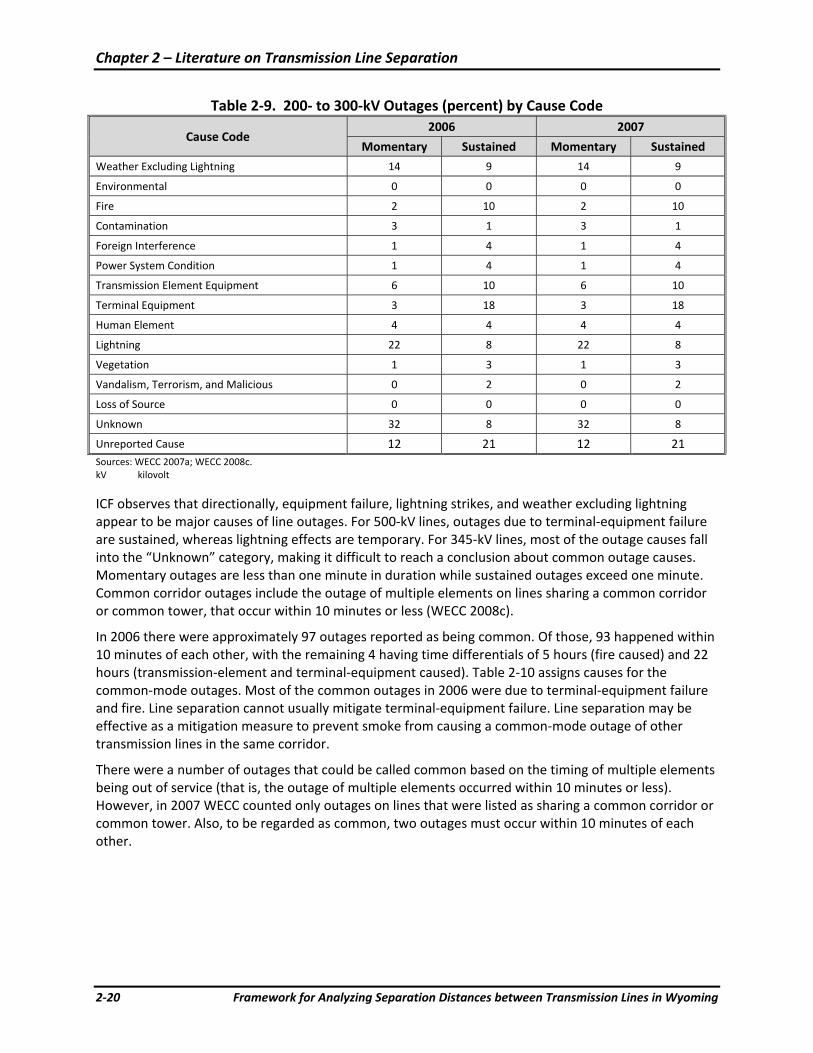
Chapter 2 – Literature on Transmission Line Separation
2‐20 Framework for Analyzing Separation Distances between Transmission Lines in Wyoming
Table 2‐9. 200‐ to 300‐kV Outages (percent) by Cause Code
Cause Code 2006 2007
Momentary Sustained Momentary Sustained
Weather Excluding Lightning 14 9 14 9
Environmental 0 0 0 0
Fire 2 10 2 10
Contamination 3 1 3 1
Foreign Interference 1 4 1 4
Power System Condition 1 4 1 4
Transmission Element Equipment 6 10 6 10
Terminal Equipment 3 18 3 18
Human Element 4 4 4 4
Lightning 22 8 22 8
Vegetation 1 3 1 3
Vandalism, Terrorism, and Malicious 0 2 0 2
Loss of Source 0 0 0 0
Unknown 32 8 32 8
Unreported Cause 12 21 12 21 Sources: WECC 2007a; WECC 2008c. kV kilovolt
ICF observes that directionally, equipment failure, lightning strikes, and weather excluding lightning appear to be major causes of line outages. For 500‐kV lines, outages due to terminal‐equipment failure are sustained, whereas lightning effects are temporary. For 345‐kV lines, most of the outage causes fall into the “Unknown” category, making it difficult to reach a conclusion about common outage causes. Momentary outages are less than one minute in duration while sustained outages exceed one minute. Common corridor outages include the outage of multiple elements on lines sharing a common corridor or common tower, that occur within 10 minutes or less (WECC 2008c).
In 2006 there were approximately 97 outages reported as being common. Of those, 93 happened within 10 minutes of each other, with the remaining 4 having time differentials of 5 hours (fire caused) and 22 hours (transmission‐element and terminal‐equipment caused). Table 2‐10 assigns causes for the common‐mode outages. Most of the common outages in 2006 were due to terminal‐equipment failure and fire. Line separation cannot usually mitigate terminal‐equipment failure. Line separation may be effective as a mitigation measure to prevent smoke from causing a common‐mode outage of other transmission lines in the same corridor.
There were a number of outages that could be called common based on the timing of multiple elements being out of service (that is, the outage of multiple elements occurred within 10 minutes or less). However, in 2007 WECC counted only outages on lines that were listed as sharing a common corridor or common tower. Also, to be regarded as common, two outages must occur within 10 minutes of each other.
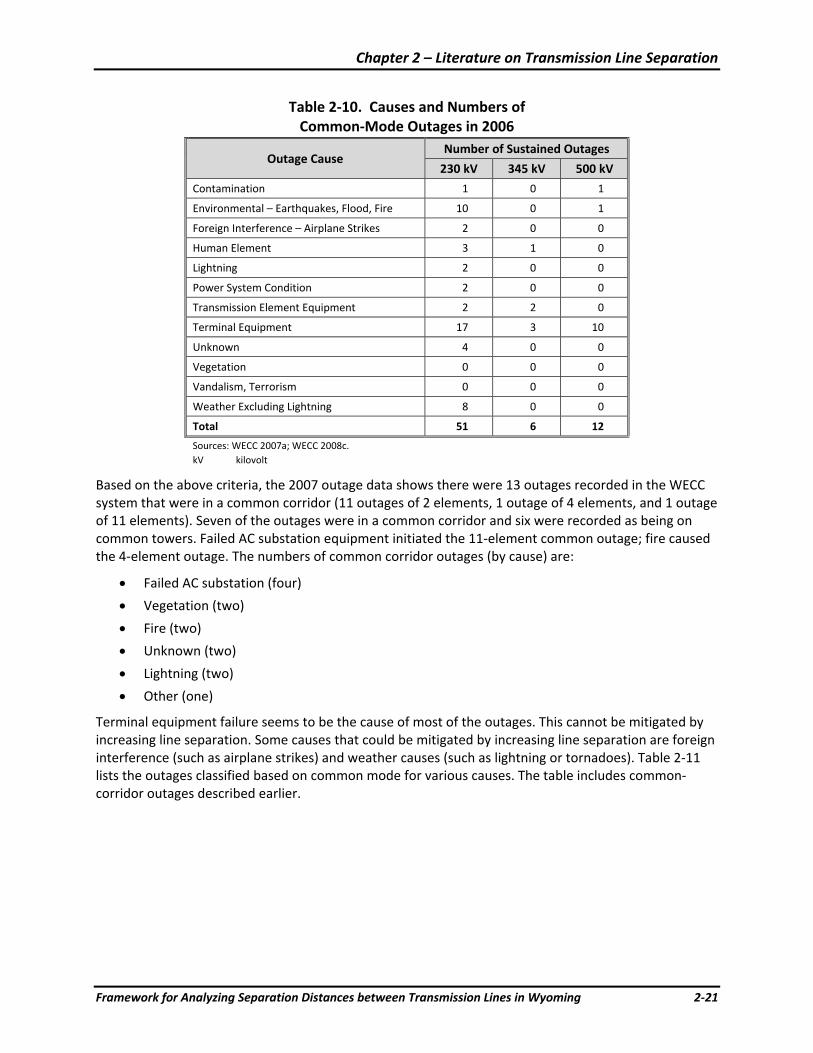
Chapter 2 – Literature on Transmission Line Separation
Framework for Analyzing Separation Distances between Transmission Lines in Wyoming 2‐21
Table 2‐10. Causes and Numbers of Common‐Mode Outages in 2006
Outage Cause Number of Sustained Outages
230 kV 345 kV 500 kV
Contamination 1 0 1
Environmental – Earthquakes, Flood, Fire 10 0 1
Foreign Interference – Airplane Strikes 2 0 0
Human Element 3 1 0
Lightning 2 0 0
Power System Condition 2 0 0
Transmission Element Equipment 2 2 0
Terminal Equipment 17 3 10
Unknown 4 0 0
Vegetation 0 0 0
Vandalism, Terrorism 0 0 0
Weather Excluding Lightning 8 0 0
Total 51 6 12
Sources: WECC 2007a; WECC 2008c. kV kilovolt
Based on the above criteria, the 2007 outage data shows there were 13 outages recorded in the WECC system that were in a common corridor (11 outages of 2 elements, 1 outage of 4 elements, and 1 outage of 11 elements). Seven of the outages were in a common corridor and six were recorded as being on common towers. Failed AC substation equipment initiated the 11‐element common outage; fire caused the 4‐element outage. The numbers of common corridor outages (by cause) are:
• Failed AC substation (four)
• Vegetation (two)
• Fire (two)
• Unknown (two)
• Lightning (two)
• Other (one)
Terminal equipment failure seems to be the cause of most of the outages. This cannot be mitigated by increasing line separation. Some causes that could be mitigated by increasing line separation are foreign interference (such as airplane strikes) and weather causes (such as lightning or tornadoes). Table 2‐11 lists the outages classified based on common mode for various causes. The table includes common‐corridor outages described earlier.
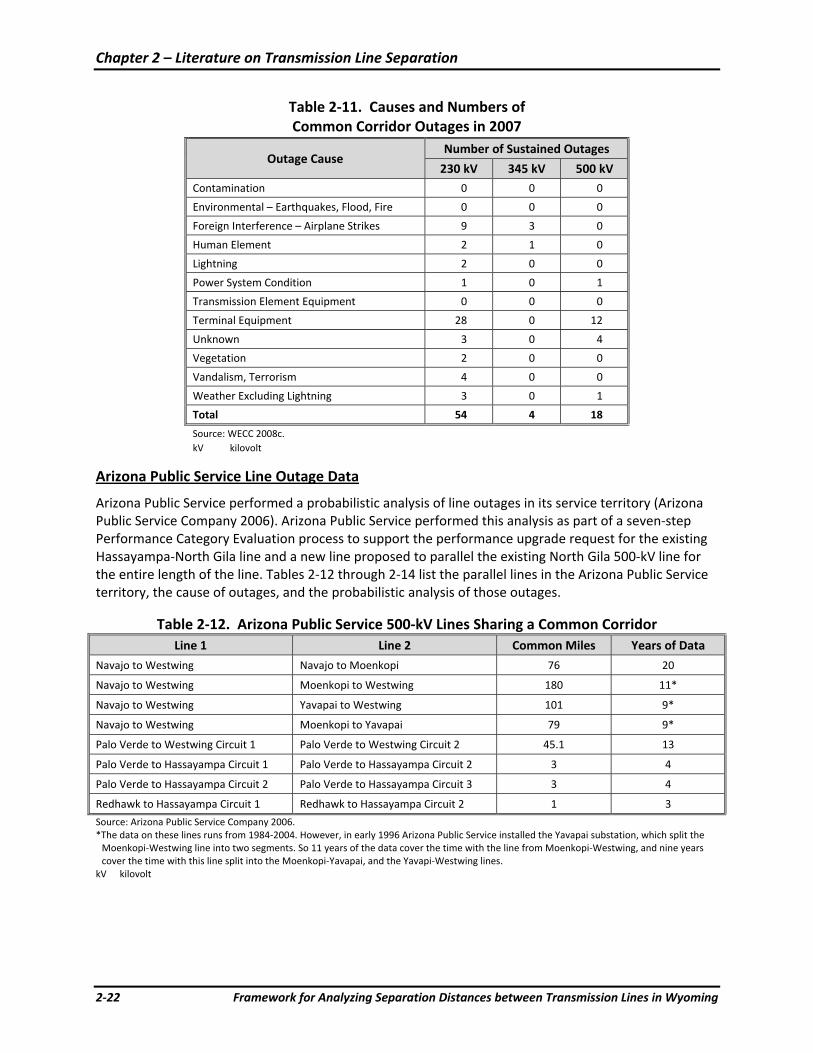
Chapter 2 – Literature on Transmission Line Separation
2‐22 Framework for Analyzing Separation Distances between Transmission Lines in Wyoming
Table 2‐11. Causes and Numbers of Common Corridor Outages in 2007
Outage Cause Number of Sustained Outages
230 kV 345 kV 500 kV Contamination 0 0 0
Environmental – Earthquakes, Flood, Fire 0 0 0
Foreign Interference – Airplane Strikes 9 3 0
Human Element 2 1 0
Lightning 2 0 0
Power System Condition 1 0 1
Transmission Element Equipment 0 0 0
Terminal Equipment 28 0 12
Unknown 3 0 4
Vegetation 2 0 0
Vandalism, Terrorism 4 0 0
Weather Excluding Lightning 3 0 1
Total 54 4 18
Source: WECC 2008c. kV kilovolt
Arizona Public Service Line Outage Data
Arizona Public Service performed a probabilistic analysis of line outages in its service territory (Arizona Public Service Company 2006). Arizona Public Service performed this analysis as part of a seven‐step Performance Category Evaluation process to support the performance upgrade request for the existing Hassayampa‐North Gila line and a new line proposed to parallel the existing North Gila 500‐kV line for the entire length of the line. Tables 2‐12 through 2‐14 list the parallel lines in the Arizona Public Service territory, the cause of outages, and the probabilistic analysis of those outages.
Table 2‐12. Arizona Public Service 500‐kV Lines Sharing a Common Corridor Line 1 Line 2 Common Miles Years of Data
Navajo to Westwing Navajo to Moenkopi 76 20
Navajo to Westwing Moenkopi to Westwing 180 11*
Navajo to Westwing Yavapai to Westwing 101 9*
Navajo to Westwing Moenkopi to Yavapai 79 9*
Palo Verde to Westwing Circuit 1 Palo Verde to Westwing Circuit 2 45.1 13
Palo Verde to Hassayampa Circuit 1 Palo Verde to Hassayampa Circuit 2 3 4
Palo Verde to Hassayampa Circuit 2 Palo Verde to Hassayampa Circuit 3 3 4
Redhawk to Hassayampa Circuit 1 Redhawk to Hassayampa Circuit 2 1 3
Source: Arizona Public Service Company 2006. *The data on these lines runs from 1984‐2004. However, in early 1996 Arizona Public Service installed the Yavapai substation, which split the Moenkopi‐Westwing line into two segments. So 11 years of the data cover the time with the line from Moenkopi‐Westwing, and nine years cover the time with this line split into the Moenkopi‐Yavapai, and the Yavapi‐Westwing lines.
kV kilovolt
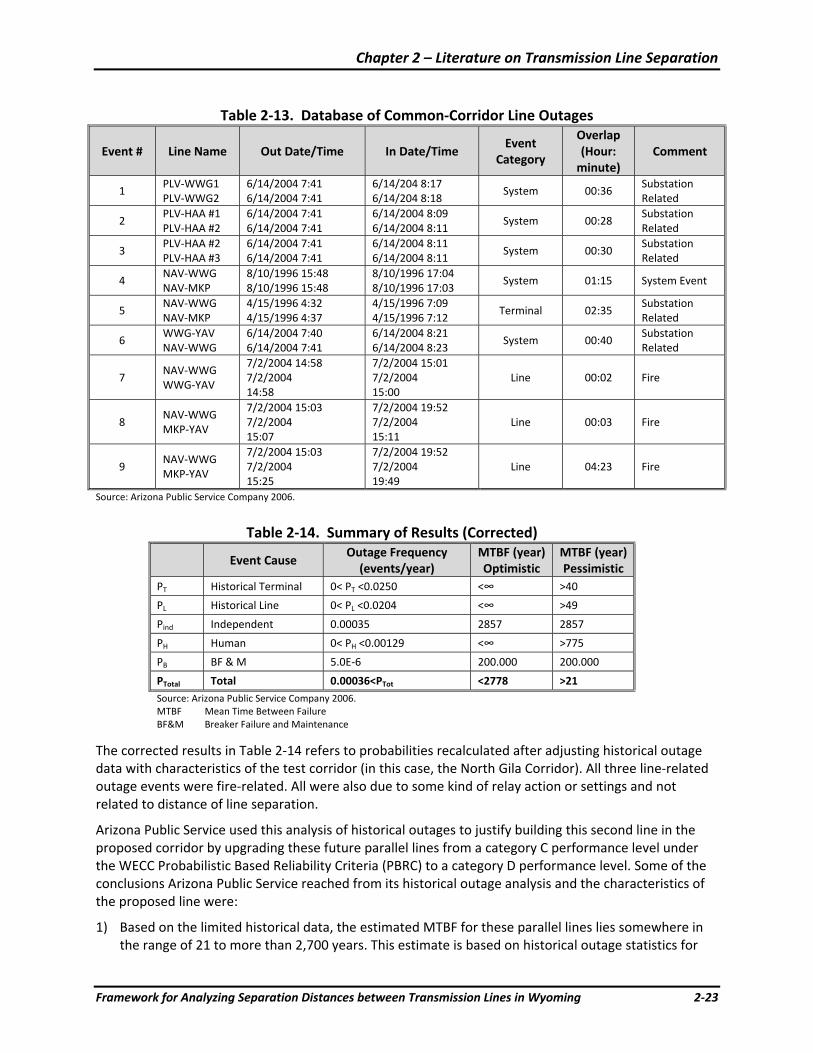
Chapter 2 – Literature on Transmission Line Separation
Framework for Analyzing Separation Distances between Transmission Lines in Wyoming 2‐23
Table 2‐13. Database of Common‐Corridor Line Outages
Event # Line Name Out Date/Time In Date/Time Event
Category
Overlap (Hour: minute)
Comment
1 PLV‐WWG1 PLV‐WWG2
6/14/2004 7:41 6/14/2004 7:41
6/14/204 8:17 6/14/204 8:18
System 00:36 Substation Related
2 PLV‐HAA #1 PLV‐HAA #2
6/14/2004 7:41 6/14/2004 7:41
6/14/2004 8:09 6/14/2004 8:11
System 00:28 Substation Related
3 PLV‐HAA #2 PLV‐HAA #3
6/14/2004 7:41 6/14/2004 7:41
6/14/2004 8:11 6/14/2004 8:11
System 00:30 Substation Related
4 NAV‐WWG NAV‐MKP
8/10/1996 15:48 8/10/1996 15:48
8/10/1996 17:04 8/10/1996 17:03
System 01:15 System Event
5 NAV‐WWG NAV‐MKP
4/15/1996 4:32 4/15/1996 4:37
4/15/1996 7:09 4/15/1996 7:12
Terminal 02:35 Substation Related
6 WWG‐YAV NAV‐WWG
6/14/2004 7:40 6/14/2004 7:41
6/14/2004 8:21 6/14/2004 8:23
System 00:40 Substation Related
7 NAV‐WWG WWG‐YAV
7/2/2004 14:58 7/2/2004 14:58
7/2/2004 15:01 7/2/2004 15:00
Line 00:02 Fire
8 NAV‐WWG MKP‐YAV
7/2/2004 15:03 7/2/2004 15:07
7/2/2004 19:52 7/2/2004 15:11
Line 00:03 Fire
9 NAV‐WWG MKP‐YAV
7/2/2004 15:03 7/2/2004 15:25
7/2/2004 19:52 7/2/2004 19:49
Line 04:23 Fire
Source: Arizona Public Service Company 2006.
Table 2‐14. Summary of Results (Corrected)
Event Cause Outage Frequency (events/year)
MTBF (year)Optimistic
MTBF (year) Pessimistic
PT Historical Terminal 0< PT <0.0250 <∞ >40
PL Historical Line 0< PL <0.0204 <∞ >49
Pind Independent 0.00035 2857 2857
PH Human 0< PH <0.00129 <∞ >775
PB BF & M 5.0E‐6 200.000 200.000
PTotal Total 0.00036<PTot <2778 >21 Source: Arizona Public Service Company 2006.MTBF Mean Time Between Failure BF&M Breaker Failure and Maintenance
The corrected results in Table 2‐14 refers to probabilities recalculated after adjusting historical outage data with characteristics of the test corridor (in this case, the North Gila Corridor). All three line‐related outage events were fire‐related. All were also due to some kind of relay action or settings and not related to distance of line separation.
Arizona Public Service used this analysis of historical outages to justify building this second line in the proposed corridor by upgrading these future parallel lines from a category C performance level under the WECC Probabilistic Based Reliability Criteria (PBRC) to a category D performance level. Some of the conclusions Arizona Public Service reached from its historical outage analysis and the characteristics of the proposed line were:
1) Based on the limited historical data, the estimated MTBF for these parallel lines lies somewhere in the range of 21 to more than 2,700 years. This estimate is based on historical outage statistics for
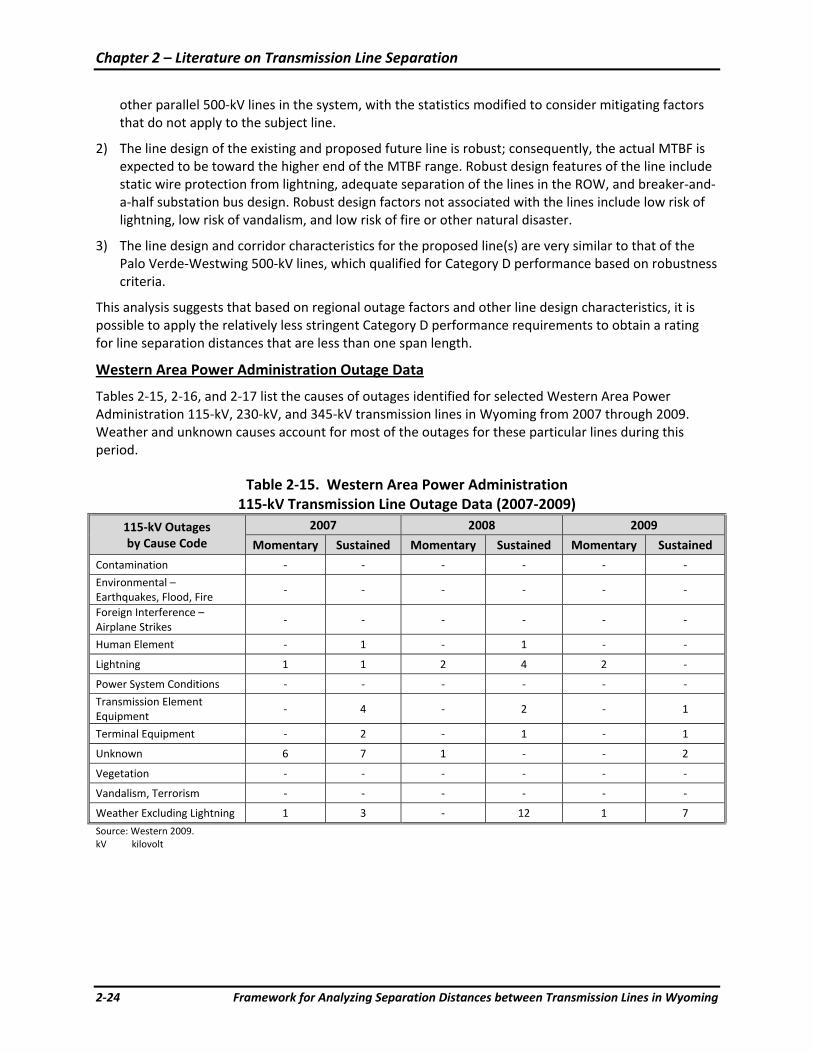
Chapter 2 – Literature on Transmission Line Separation
2‐24 Framework for Analyzing Separation Distances between Transmission Lines in Wyoming
other parallel 500‐kV lines in the system, with the statistics modified to consider mitigating factors that do not apply to the subject line.
2) The line design of the existing and proposed future line is robust; consequently, the actual MTBF is expected to be toward the higher end of the MTBF range. Robust design features of the line include static wire protection from lightning, adequate separation of the lines in the ROW, and breaker‐and‐a‐half substation bus design. Robust design factors not associated with the lines include low risk of lightning, low risk of vandalism, and low risk of fire or other natural disaster.
3) The line design and corridor characteristics for the proposed line(s) are very similar to that of the Palo Verde‐Westwing 500‐kV lines, which qualified for Category D performance based on robustness criteria.
This analysis suggests that based on regional outage factors and other line design characteristics, it is possible to apply the relatively less stringent Category D performance requirements to obtain a rating for line separation distances that are less than one span length.
Western Area Power Administration Outage Data
Tables 2‐15, 2‐16, and 2‐17 list the causes of outages identified for selected Western Area Power Administration 115‐kV, 230‐kV, and 345‐kV transmission lines in Wyoming from 2007 through 2009. Weather and unknown causes account for most of the outages for these particular lines during this period.
Table 2‐15. Western Area Power Administration 115‐kV Transmission Line Outage Data (2007‐2009)
115‐kV Outages by Cause Code
2007 2008 2009
Momentary Sustained Momentary Sustained Momentary Sustained
Contamination ‐ ‐ ‐ ‐ ‐ ‐
Environmental – Earthquakes, Flood, Fire
‐ ‐ ‐ ‐ ‐ ‐
Foreign Interference – Airplane Strikes
‐ ‐ ‐ ‐ ‐ ‐
Human Element ‐ 1 ‐ 1 ‐ ‐
Lightning 1 1 2 4 2 ‐
Power System Conditions ‐ ‐ ‐ ‐ ‐ ‐
Transmission Element Equipment
‐ 4 ‐ 2 ‐ 1
Terminal Equipment ‐ 2 ‐ 1 ‐ 1
Unknown 6 7 1 ‐ ‐ 2
Vegetation ‐ ‐ ‐ ‐ ‐ ‐
Vandalism, Terrorism ‐ ‐ ‐ ‐ ‐ ‐
Weather Excluding Lightning 1 3 ‐ 12 1 7
Source: Western 2009. kV kilovolt
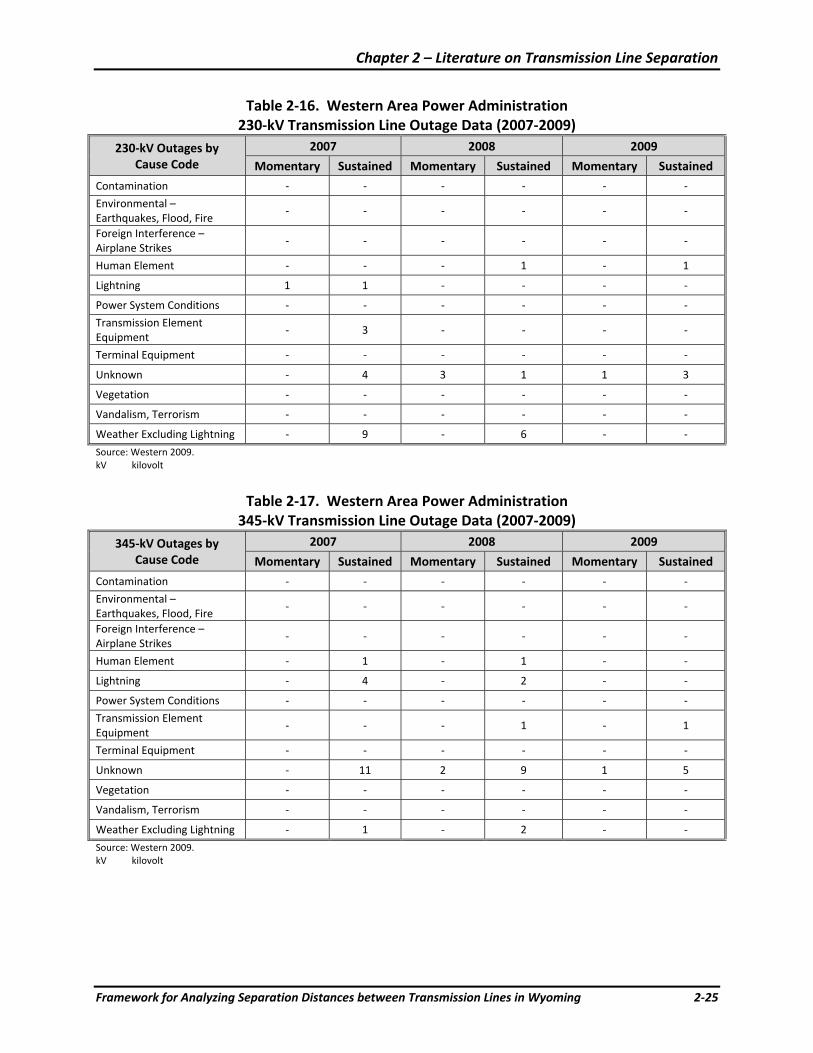
Chapter 2 – Literature on Transmission Line Separation
Framework for Analyzing Separation Distances between Transmission Lines in Wyoming 2‐25
Table 2‐16. Western Area Power Administration 230‐kV Transmission Line Outage Data (2007‐2009)
230‐kV Outages by Cause Code
2007 2008 2009
Momentary Sustained Momentary Sustained Momentary Sustained
Contamination ‐ ‐ ‐ ‐ ‐ ‐
Environmental – Earthquakes, Flood, Fire ‐ ‐ ‐ ‐ ‐ ‐
Foreign Interference – Airplane Strikes ‐ ‐ ‐ ‐ ‐ ‐
Human Element ‐ ‐ ‐ 1 ‐ 1
Lightning 1 1 ‐ ‐ ‐ ‐
Power System Conditions ‐ ‐ ‐ ‐ ‐ ‐
Transmission Element Equipment
‐ 3 ‐ ‐ ‐ ‐
Terminal Equipment ‐ ‐ ‐ ‐ ‐ ‐
Unknown ‐ 4 3 1 1 3
Vegetation ‐ ‐ ‐ ‐ ‐ ‐
Vandalism, Terrorism ‐ ‐ ‐ ‐ ‐ ‐
Weather Excluding Lightning ‐ 9 ‐ 6 ‐ ‐
Source: Western 2009. kV kilovolt
Table 2‐17. Western Area Power Administration 345‐kV Transmission Line Outage Data (2007‐2009)
345‐kV Outages by Cause Code
2007 2008 2009
Momentary Sustained Momentary Sustained Momentary Sustained
Contamination ‐ ‐ ‐ ‐ ‐ ‐
Environmental – Earthquakes, Flood, Fire
‐ ‐ ‐ ‐ ‐ ‐
Foreign Interference – Airplane Strikes
‐ ‐ ‐ ‐ ‐ ‐
Human Element ‐ 1 ‐ 1 ‐ ‐
Lightning ‐ 4 ‐ 2 ‐ ‐
Power System Conditions ‐ ‐ ‐ ‐ ‐ ‐
Transmission Element Equipment
‐ ‐ ‐ 1 ‐ 1
Terminal Equipment ‐ ‐ ‐ ‐ ‐ ‐
Unknown ‐ 11 2 9 1 5
Vegetation ‐ ‐ ‐ ‐ ‐ ‐
Vandalism, Terrorism ‐ ‐ ‐ ‐ ‐ ‐
Weather Excluding Lightning ‐ 1 ‐ 2 ‐ ‐
Source: Western 2009. kV kilovolt
Chapter 2 – Literature on Transmission Line Separation
2‐26 Framework for Analyzing Separation Distances between Transmission Lines in Wyoming
2.3 Summary WECC reliability criterion WRS 1.1 is a regionalized, more stringent version of the NERC Category C5 standard that requires the study of the outage of two or more lines sharing a common corridor. Two lines are said to share a common corridor if the line separation distance between them is less than either 500 feet or the longest span length, whichever is greater. All transmission lines need to show compliance with the WRS 1.1 criterion either by 1) ensuring adequate line separation to prevent common corridor outages, 2) implementing mitigation measures for a common‐corridor outage, 3) demonstrating that the MTBF for a common‐corridor outage is more than 30 years, or 4) considering the possible common‐corridor outages during the WECC rating process and accepting the granted path rating for the proposed project. WECC also provides non‐mandatory criteria for the line separation distance between two parallel transmission lines. This separation criterion is intended to minimize such causes for common‐corridor outages as airplane crashes, lightning strikes, and wind‐related damage. While utilities and other entities seem to make every effort to comply with the WECC minimum line separation criterion, there are other factors (such as availability of ROWs, costs, land use and environmental constraints, and geographical terrain features) that affect the line separation distance for some transmission projects.
Most of the proposed transmission line projects are designed to follow the WECC criteria for line separation to avoid the risk of derating the line. However some proposed projects recommend separation distances greater than the WECC criterion. The incremental benefit of line separation distances greater than the WECC criterion should be examined. For example, the SWAT Common Corridor Task Force white paper on corridor separation concludes that separation beyond the safety minimum might not measurably improve system reliability or operational limits, but might impose additional cost on ratepayers (SWAT Common Corridor Task Force 2009). One or more transmission line proponents identified the following justification for increasing line separation distance beyond the WECC criterion: 1) avoid the risk of reduction in system reliability that could be caused by very‐high‐capacity outages in a single corridor, 2) avoid the risk of derating the proposed lines and the resultant possible need for additional transmission lines in the future, and 3) ensure full utilization of transmission line capacity (increased line separation reduces the risk of de‐rating and less than full utilization). Some transmission line proponents also suggested developing line separation criteria for each region based on that region’s weather, geography, environment, and other characteristics. The WECC Reliability Subcommittee proposes to review WRS 1.1 and investigate the possibility of changing or removing the criterion to encourage more long‐distance transmission lines and associated remote generation such as renewable energy.
In the literature, examples of historical multiple line outages are given to demonstrate the importance of siting lines farther away from one another. However, what is not clear from the literature is whether even a few of those multiple line outages would have been avoided if the lines had been sited farther apart (at least one span length separation or greater).
Another way of stating the issue is, “Would weather and other factors that caused multiple line outages in historical examples be unable to cause multiple line outages if the line separation had been at least one span length or greater?” For some equipment failures, such as relay misoperation, it is unlikely that separation distances could influence the magnitude of line outages. However, as mentioned in the Southern California Edison paper, some insulator failures could be avoided with greater separation distances (Southern California Edison Company 1980). The Southern California Edison paper also identifies one incident involving wind and two incidents involving airplanes that could have been avoided with one span length line separation. However, it should be noted that these failures occurred
Chapter 2 – Literature on Transmission Line Separation
Framework for Analyzing Separation Distances between Transmission Lines in Wyoming 2‐27
more than 20 years ago and airplane security regulations and other protection schemes have improved since then.
The impact of weather in relation to line separation depends on weather severity and the terrain in which the transmission lines are located. Therefore, any weather‐related causes for common‐mode corridor outages are regional and need to be analyzed for each region in the power system. For example, if the probability of weather and other factors such as airplane strikes causing multiple line outages is very low in a particular region, then changing the line separation requirement (to equal the tower height separation distance rather than the single‐span‐length requirement) might be appropriate based on WECC approval. For this example, environmental constraints, line installation, maintenance, and ROW acquisition costs would all be expected to be less than a comparable situation with a greater line separation distance. However, care should also be taken to ensure that decreasing line separation does not reduce the reliability of the system. An analytical framework that considers the effects of line separation and regional causes of line outages on reliability would be useful. This framework can be applied to different regions within the WECC system to develop reasonable line separation recommendations that maintain or improve the reliability of the power system while facilitating the development of more transmission and renewable energy generation.
The goal of performing the literature survey described in this chapter was to understand the reasons for the existing line separation criterion, rationale for line separation distances proposed for transmission lines in Wyoming, and to collect data on existing and proposed line separation and causes for line outages. The next step is to use the results of this literature survey and the data collected to develop a framework for analyzing line separation issues related to reliability.
Chapter 2 – Literature on Transmission Line Separation
2‐28 Framework for Analyzing Separation Distances between Transmission Lines in Wyoming
This page intentionally left blank.
Chapter 3 – Line Separation Evaluation Framework
Framework for Analyzing Separation Distances between Transmission Lines in Wyoming 3‐1
CHAPTER 3 – LINE SEPARATION EVALUATION FRAMEWORK This chapter outlines a framework for determining and evaluating factors that influence transmission line separation. For purposes of this report, line separation distance refers to the horizontal distance between the centerline of one transmission tower and the centerline of an adjacent transmission tower for two parallel transmission lines. In addition, it is important to note that line separation distance estimates and requirements as discussed in this report do not apply to underground or aboveground lines as they approach substations.
3.1 Approach As the separation distance between two or more transmission lines decreases, there is a relative increase in the possibility of two or more lines experiencing a simultaneous outage due to a single event. The simultaneous outage of two or more lines could significantly harm the power system in terms of loss of load, loss of system reliability, and possible damage to power system equipment. For example, the simultaneous outage of two of the 345‐kV lines originating from the Jim Bridger substation in Wyoming initiated the WECC disturbance events of July 2 and 3, 1996 (NERC 2009c). A combination of tree flashover and relay misoperation caused these outages, which led to cascading outages that resulted in separation of the WECC system into five islands and caused significant load shedding.
Causes of transmission line outages vary among regions in their degree of influence. For example, while fires and lightning may be common causes of transmission line outages, these factors are not equally probable in all regions in the WECC system. The goal in this chapter is to create an analytical framework that applies regional reliability factors to estimate region‐specific transmission line separation distances for multiple parallel lines.
As discussed in Chapter 2, analysts need to consider a number of factors to determine the required separation distance between two or more parallel transmission lines. In general, increasing separation distance could increase the reliability of the system because there would be a relative reduction in the number and frequency of probable weather‐related events that could cause the simultaneous outage of multiple lines. This implies that the separation distance between parallel transmission lines needs to be as great as possible for maximum protection against weather‐related simultaneous multiple line outages. However, other factors could favor placing transmission lines closer together. These include ROW acquisition costs, ease and cost of maintenance, installation costs, and land use and environmental considerations. Therefore, determining the appropriate separation distance between parallel transmission lines often involves weighing electrical system reliability, land use and environmental considerations, and the costs of acquiring ROWs and installing and maintaining the transmission lines.
One of the observations in Chapter 2 is the regional nature of some causes (such as weather) of simultaneous multiple transmission outages. Any approach to developing a framework for determining appropriate line separation distances should include an evaluation methodology that can be customized to account for regional variability.
Chapter 3 – Line Separation Evaluation Framework
3‐2 Framework for Analyzing Separation Distances between Transmission Lines in Wyoming
3.2 Key Issues Based on results of the literature survey described in Chapter 2, the various causes for simultaneous multiple outages of transmission lines can be grouped into three main categories, as follows:
1) Weather
a) High winds
b) Storms (rain/ice/hail/snow)
c) Tornadoes
d) Lightning
e) Fire (fires can be ignited by lightning and can be the result of sabotage)
2) Power system
a) Relay misoperation
b) Substation equipment failure
c) Other hardware/software failures
d) System conditions
3) Miscellaneous
a) Airplane strikes
b) Human error
c) Sabotage
d) Vegetation
e) Animal management (birds, squirrels, etc.)
f) Contamination (industrial, mines, etc.)
Some of these factors are independent of line separation distance. For example, the potential for transmission line outages due to power system factors is generally independent of line separation distance. Human error, sabotage, vegetation, and animal management also are generally independent of line separation distance. However, line separation distances could influence the potential for outages caused by airplane strikes and all the factors in the weather category. These factors are therefore the focus of the evaluation framework described in this chapter and applied in Chapter 4.
The impact of a weather‐related event on multiple transmission lines is regional and it depends on weather severity and area affected. For example, if the average distance a tornado travels in a region is 10 miles, then having a line separation distance of 1,500 feet instead of 2 miles might not matter if tornadoes are a major cause of line outages in that region. However, if the average distance a tornado travels in a region is 1 mile, an argument could be made to separate lines by more than 1 mile to reduce the risk of multiple line outages due to a single tornado. Therefore, a framework for determining recommended transmission line separation distances should consider available weather information. Moreover, analyses of weather conditions and associated outages of multiple transmission lines should include data on the frequency of specific weather conditions.
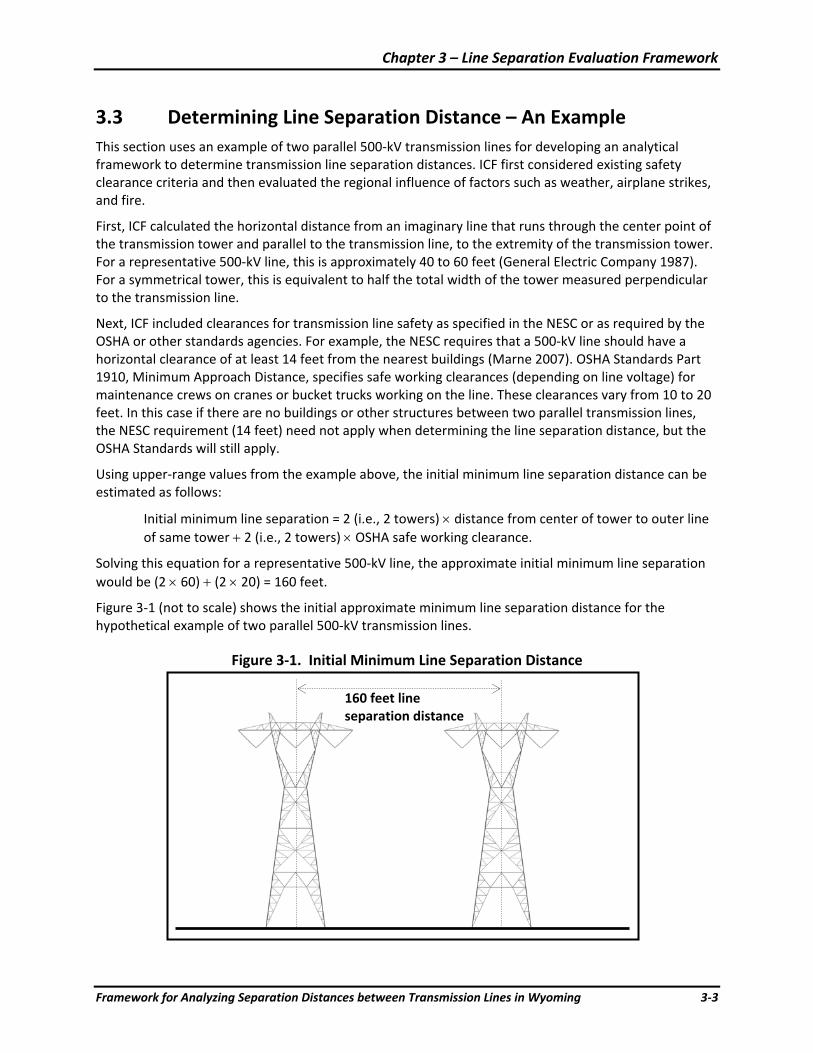
Chapter 3 – Line Separation Evaluation Framework
Framework for Analyzing Separation Distances between Transmission Lines in Wyoming 3‐3
3.3 Determining Line Separation Distance – An Example This section uses an example of two parallel 500‐kV transmission lines for developing an analytical framework to determine transmission line separation distances. ICF first considered existing safety clearance criteria and then evaluated the regional influence of factors such as weather, airplane strikes, and fire.
First, ICF calculated the horizontal distance from an imaginary line that runs through the center point of the transmission tower and parallel to the transmission line, to the extremity of the transmission tower. For a representative 500‐kV line, this is approximately 40 to 60 feet (General Electric Company 1987). For a symmetrical tower, this is equivalent to half the total width of the tower measured perpendicular to the transmission line.
Next, ICF included clearances for transmission line safety as specified in the NESC or as required by the OSHA or other standards agencies. For example, the NESC requires that a 500‐kV line should have a horizontal clearance of at least 14 feet from the nearest buildings (Marne 2007). OSHA Standards Part 1910, Minimum Approach Distance, specifies safe working clearances (depending on line voltage) for maintenance crews on cranes or bucket trucks working on the line. These clearances vary from 10 to 20 feet. In this case if there are no buildings or other structures between two parallel transmission lines, the NESC requirement (14 feet) need not apply when determining the line separation distance, but the OSHA Standards will still apply.
Using upper‐range values from the example above, the initial minimum line separation distance can be estimated as follows:
Initial minimum line separation = 2 (i.e., 2 towers) × distance from center of tower to outer line of same tower + 2 (i.e., 2 towers) × OSHA safe working clearance.
Solving this equation for a representative 500‐kV line, the approximate initial minimum line separation would be (2 × 60) + (2 × 20) = 160 feet.
Figure 3‐1 (not to scale) shows the initial approximate minimum line separation distance for the hypothetical example of two parallel 500‐kV transmission lines.
Figure 3‐1. Initial Minimum Line Separation Distance
160 feet line separation distance
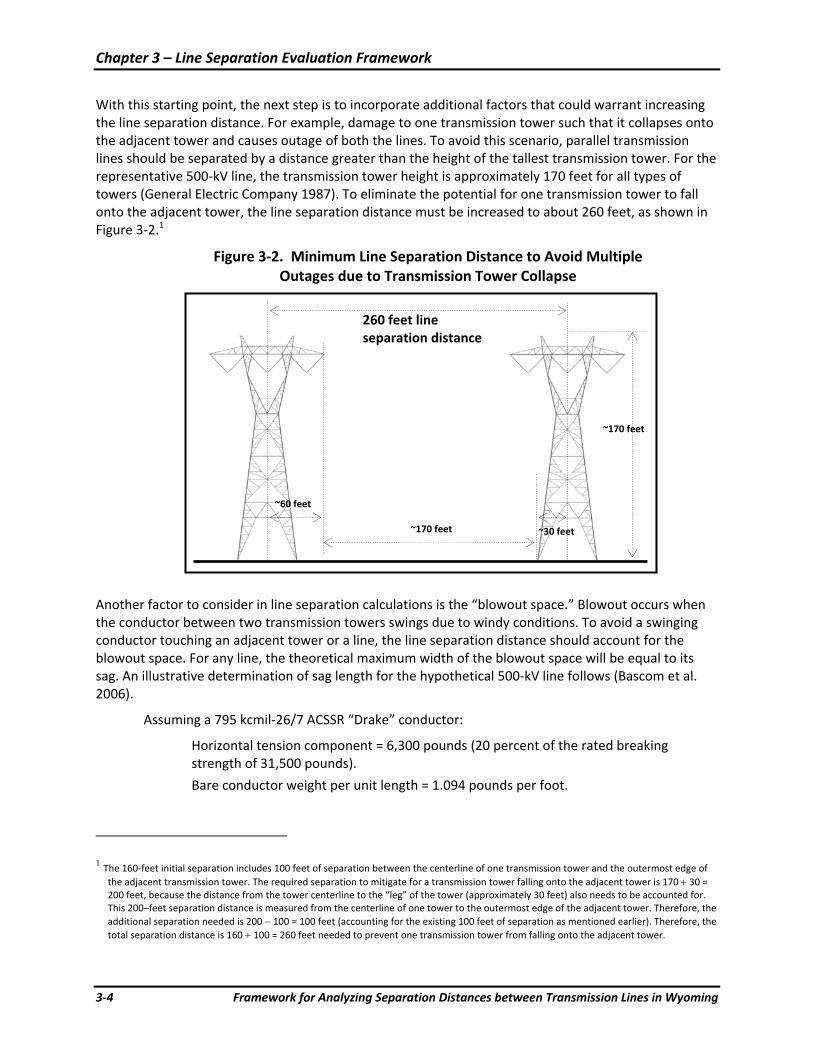
Chapter 3 – Line Separation Evaluation Framework
3‐4 Framework for Analyzing Separation Distances between Transmission Lines in Wyoming
With this starting point, the next step is to incorporate additional factors that could warrant increasing the line separation distance. For example, damage to one transmission tower such that it collapses onto the adjacent tower and causes outage of both the lines. To avoid this scenario, parallel transmission lines should be separated by a distance greater than the height of the tallest transmission tower. For the representative 500‐kV line, the transmission tower height is approximately 170 feet for all types of towers (General Electric Company 1987). To eliminate the potential for one transmission tower to fall onto the adjacent tower, the line separation distance must be increased to about 260 feet, as shown in Figure 3‐2.1
Figure 3‐2. Minimum Line Separation Distance to Avoid Multiple Outages due to Transmission Tower Collapse
Another factor to consider in line separation calculations is the “blowout space.” Blowout occurs when the conductor between two transmission towers swings due to windy conditions. To avoid a swinging conductor touching an adjacent tower or a line, the line separation distance should account for the blowout space. For any line, the theoretical maximum width of the blowout space will be equal to its sag. An illustrative determination of sag length for the hypothetical 500‐kV line follows (Bascom et al. 2006).
Assuming a 795 kcmil‐26/7 ACSSR “Drake” conductor:
Horizontal tension component = 6,300 pounds (20 percent of the rated breaking strength of 31,500 pounds).
Bare conductor weight per unit length = 1.094 pounds per foot.
1 The 160‐feet initial separation includes 100 feet of separation between the centerline of one transmission tower and the outermost edge of
the adjacent transmission tower. The required separation to mitigate for a transmission tower falling onto the adjacent tower is 170 + 30 = 200 feet, because the distance from the tower centerline to the “leg” of the tower (approximately 30 feet) also needs to be accounted for. This 200–feet separation distance is measured from the centerline of one tower to the outermost edge of the adjacent tower. Therefore, the additional separation needed is 200 − 100 = 100 feet (accounting for the existing 100 feet of separation as mentioned earlier). Therefore, the total separation distance is 160 + 100 = 260 feet needed to prevent one transmission tower from falling onto the adjacent tower.
260 feet line separation distance
~170 feet
~30 feet ~170 feet
~60 feet
Chapter 3 – Line Separation Evaluation Framework
Framework for Analyzing Separation Distances between Transmission Lines in Wyoming 3‐5
Compensated weight per unit length = 2.509 pounds per foot (after wind, ice loading, creep, and NESC considerations).
Assume 1,500‐foot span for a 500‐kV line:
The following formula for sag is from SWAT Common Corridor Task Force (2009):
Using the values above in this formula gives a sag of about 112 feet.
Therefore, the initial minimum line separation distance could be estimated as follows:
Initial minimum line separation = 2 × distance from center of tower to outer line of same tower + 2 × OSHA safe working clearance + blowout space − distance overlap between sag length and OSHA safe working clearance (because the line separation required to meet OSHA standards can be applied toward satisfying a portion of the line separation required to accommodate blowout space).
Therefore, for a 500‐kV line, an illustrative approximate initial minimum line separation would be (2 × 60) + (2 × 20) + 112 − (2 × 20) = 232 feet ~= 235 feet.
In this illustration, the two parallel lines are assumed to share the blowout space because wind cannot swing two conductors in opposite directions at the same time.
Because the line separation distance for mitigating the collapse of a transmission tower onto the adjacent tower is 260 feet, this distance also fulfills the line spacing requirement to account for blowout space. Therefore, if the line separation distance is about 260 feet, there is no need for a separate requirement for blowout space. Further, this 260 feet separation distance will mitigate line outages due to conductor blowout and transmission tower collapse for both parallel transmission lines with adjacent spans and parallel transmission lines with staggered spans.
The line separation estimates above also represent the ROW width for each transmission line in this example. Thus, a single 500‐kV line in this example would need approximately 260 feet total ROW, also known as the easement (130 feet on either side of the tower’s centerline). If it could be shown that there is minimal risk for a transmission tower to fall onto an adjacent tower and there are no high winds in the region (MTBF more than 30 years), then the easement width could be as narrow as 160 feet in this example (2 × 60 + 2 × 20). Because ROW acquisition costs for transmission lines are proportional to the amount of land acquired, reducing the required easement width would lower the cost of the line.
Other factors that could necessitate line separation of more than the 260 feet derived above include airplane strikes and weather‐related events. Airplane strikes are primarily a factor in regions where low‐flying aircraft such as crop dusters could inadvertently snag a transmission line and drag it across the corridor and into contact with another line running in the same corridor, resulting in simultaneous multiple outages. The risk of airplane strikes causing multiple line outages would appear to be greatest in regions frequented low‐flying aircraft, or in regions where transmission lines are routed near a major airport. Given the rarity of documented cases of airplane strikes causing multiple transmission line outages in Wyoming, the relatively few airplanes in Wyoming large enough to drag a severed EHV or UHV line across to contact another line, and the relatively low number of airports and low‐flying aircraft in Wyoming, a separate calculation to account for airplane strikes is not included in this example.
Fire and associated smoke can cause multiple transmission line outages. Sufficiently hot fires can ignite transmission structures and damage conductors. Smoke from fire introduces conductive agents to the
SPAN * SPAN * Weight/Ft 8 * Tension
SAG =
Chapter 3 – Line Separation Evaluation Framework
3‐6 Framework for Analyzing Separation Distances between Transmission Lines in Wyoming
transmission line’s electrical field and can result in flashover, thereby tripping the transmission line. The combination of terrain, wind, temperature, and humidity variables affect how fast wildland fires can spread (rate of spread). Depending on conditions, the rate of spread is highly variable; however, Pyne et al. (1996) provide rates of spread examples for the following conditions and habitats, which might be similar to conditions in Wyoming:
• Low sagebrush with a Santa Ana Wind – 250 feet per minute (2.84 miles per hour)
• Dry, short grass with high wind – 1,200 feet per minute (13.6364 miles per hour)
The National Interagency Fire Center (http://www.nifc.gov/fire_info/fire_stats.htm) provides fire statistics for Wyoming and other states (National Interagency Coordination Center 2009). Wyoming is part of the Rocky Mountain Interagency Coordination Center. There was only one large (100,000 or more acres) fire in Wyoming during the period 1997 through 2008 (the 136,700‐acre Kate’s Basin fire in 2000) (National Interagency Fire Center 2009). The Kates Basin Fatality Report (Bureau of Indian Affairs 2000) for the August 2000 fire indicates the fire was started by lightning and consisted primarily of grass and scattered sagebrush. The report also identifies the rate of spread ranged from 148 feet/minute to 967 feet/minute (2 to 11 miles/hour).
Methods of mitigating the risk of fire or smoke causing multiple transmission line outages includes:
• ROW maintenance to serve as fire break (e.g., managing fuels to slow or stop fire spread)
• Operational procedures (e.g., quickly identifying and reporting fires to facilitate rapid fire suppression and reduction of power transfer levels to avoid cascading outages)
• Increased separation between parallel lines to allow sufficient time to activate fire suppression activities and reduce transfer levels
• Separation of parallel lines by topographic features which can slow or stop fire rate of spread (e.g., rivers, ridge lines, etc.)
In windy regions, wind gusts could pose a threat to transmission lines. The Western Regional Climate Center (2009) describes the wind in Wyoming as having “frequent periods when the wind reaches 30‐40 miles per hour with gusts to 50 or 60.” However, the National Oceanic and Atmospheric Administration (NOAA) (2009) identifies the highest gusts for Wyoming as 127 miles per hour. A strong wind gust could snap a line from a tower and blow it across to contact with a parallel line, thus causing a multiple line outage. NESC criteria specify load cases that include impact of wind gusts on a transmission tower and conductors. Transmission lines are constructed to comply with the load cases and withstand high wind gusts. However, if it is determined that the MTBF for simultaneous outage of multiple transmission lines due to wind gusts is more than once in 30 years, the transmission lines should be separated by at least one span length. The rationale for this separation distance is that the maximum reach of a transmission line between two transmission towers would be equal to the span length. For a 500‐kV line, span lengths are approximately 1,500 feet; therefore, a line separation distance of 1,500 feet (or one span length, whichever is greater) would mitigate the simultaneous outage of multiple transmission lines due to wind gusts. It should be noted that the line separation distance of 1,500 feet to mitigate outages due to high winds is not additive to the 260 feet separation estimated earlier, because a total line separation distance of 1,500 feet would mitigate all the factors that were considered to estimate the 260‐foot line separation distance.
Mitigation measures need to be considered to avoid multiple line outages in regions where thunderstorms and ice storms are probable. There are a number of ways storms can cause multiple line outages. If storms are accompanied by wind gusts, it is possible that a line snapping from a tower will contact an adjacent transmission line. This possibility can be mitigated by separating parallel
Chapter 3 – Line Separation Evaluation Framework
Framework for Analyzing Separation Distances between Transmission Lines in Wyoming 3‐7
transmission lines by at least one span length, as described in the previous example for wind gusts. Of course, it is possible that a strong wind gust could snap a conductor in two separate lines simultaneously, causing a multiple line outage. Apart from ensuring that the insulator joints on each tower are built to withstand strong wind gusts, mitigating this event by increasing line separation distance is not reasonable, because storm impact areas are not predictable and could differ for each event.
Mitigating multiple line outages due to lightning strikes involves the separation of two lines by at least one span length (1,500 feet in the example) to avoid multiple line outages due to a combination of lightning and wind gusts. To reduce the probability of either single or multiple lines being taken down due to lightning strikes, shield wires and/or lightning arrestors can be installed on the transmission towers.
In regions where more severe weather conditions are possible, transmission lines might need to be separated more than one span length. For example, in regions with frequent tornadoes, line separation distances might need to be measured in miles to avoid multiple line outages due to a single tornado bringing down two parallel lines. In this case, an analysis is necessary to understand tornado characteristics, such as distance traveled, wind speeds, etc. The appropriate line separation distance can be calculated based on this analysis.
If the MTBF of simultaneous line outages due to the weather events described above is more than once in 30 years, then the necessary NERC Category C performance tests are required and potential impacts to the system analyzed. If the system meets all specified performance requirements, such as no cascading outages, then line separation of 1,500 feet for the example is adequate (NERC 2009b). However, if the Category C tests indicate a violation of system performance requirements under the multiple line outage case, then system impacts need to be mitigated, either by increasing line separation distance, accepting a lower rating for the line, or implementing an RAS.
It should be noted that once the lines are constructed, it is very difficult if not impossible to change line separation distances. Therefore, a comprehensive trade‐off analysis is necessary to understand the risks to system reliability, financial investment, environment, land use, line ratings, and other factors before determining a specific value for line separation distance.
3.4 Framework Development The example used in Section 3.3 to illustrate the various factors considered for determining line separation distances implies that some causes for simultaneous multiple line outages could be mitigated by increasing line separation distances. For the 500‐kV line example
NESC + OSHA + transmission tower contact separation ~= 160 feet separation distance.
Mitigate conductor blowout and/or tower collapse ~= 260 feet separation distance.
Mitigate wind gusts ~= 1,500 feet separation distance. (Also mitigates impact of lightning and rain/hail/snow/ice storms.)
Additional mitigation for impact of lightning = install shield wires and/or lightning arrestors.
Mitigate impact of tornadoes ~= possibly multiple miles of separation distance if no other mitigation measures are available.
Mitigate impact of fire = ROW maintenance, operational procedures, and possibly multiple miles of separation distance.
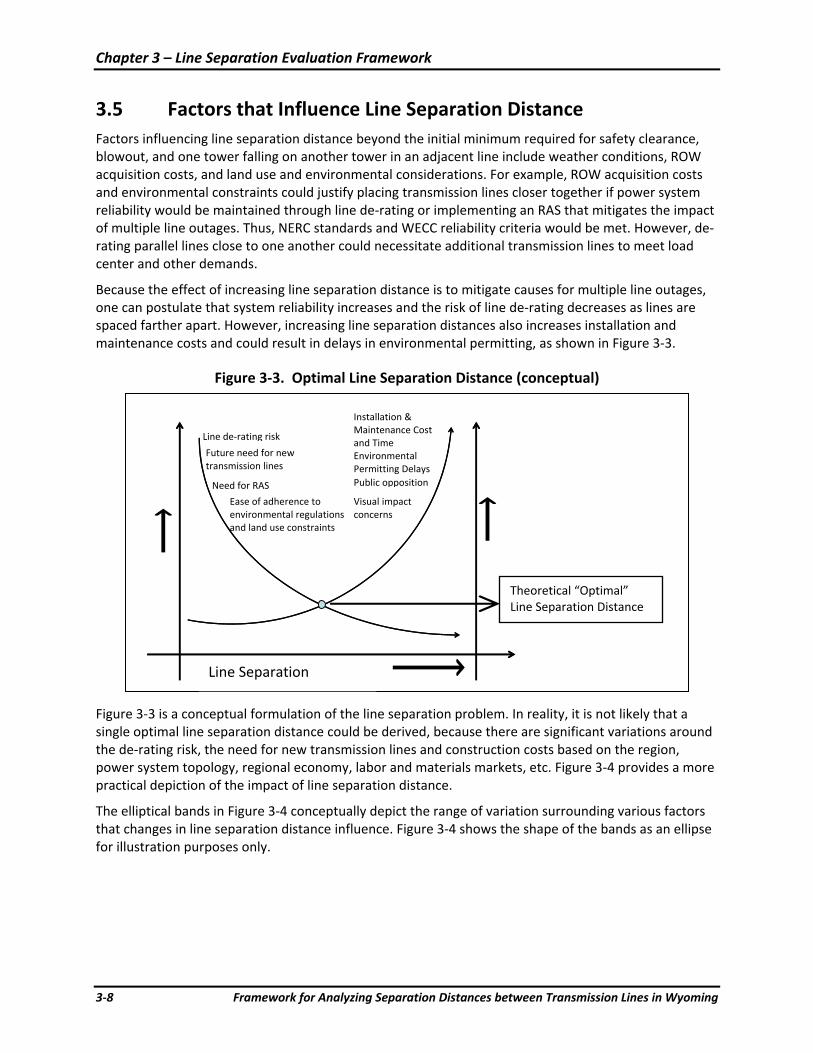
Chapter 3 – Line Separation Evaluation Framework
3‐8 Framework for Analyzing Separation Distances between Transmission Lines in Wyoming
3.5 Factors that Influence Line Separation Distance Factors influencing line separation distance beyond the initial minimum required for safety clearance, blowout, and one tower falling on another tower in an adjacent line include weather conditions, ROW acquisition costs, and land use and environmental considerations. For example, ROW acquisition costs and environmental constraints could justify placing transmission lines closer together if power system reliability would be maintained through line de‐rating or implementing an RAS that mitigates the impact of multiple line outages. Thus, NERC standards and WECC reliability criteria would be met. However, de‐rating parallel lines close to one another could necessitate additional transmission lines to meet load center and other demands.
Because the effect of increasing line separation distance is to mitigate causes for multiple line outages, one can postulate that system reliability increases and the risk of line de‐rating decreases as lines are spaced farther apart. However, increasing line separation distances also increases installation and maintenance costs and could result in delays in environmental permitting, as shown in Figure 3‐3.
Figure 3‐3. Optimal Line Separation Distance (conceptual)
Figure 3‐3 is a conceptual formulation of the line separation problem. In reality, it is not likely that a single optimal line separation distance could be derived, because there are significant variations around the de‐rating risk, the need for new transmission lines and construction costs based on the region, power system topology, regional economy, labor and materials markets, etc. Figure 3‐4 provides a more practical depiction of the impact of line separation distance.
The elliptical bands in Figure 3‐4 conceptually depict the range of variation surrounding various factors that changes in line separation distance influence. Figure 3‐4 shows the shape of the bands as an ellipse for illustration purposes only.
Installation & Maintenance Cost and Time Environmental Permitting Delays
Future need for new transmission lines
Line de‐rating risk
Line Separation Di
Theoretical “Optimal” Line Separation Distance
Need for RAS
Ease of adherence to environmental regulations and land use constraints
Public opposition
Visual impactconcerns

Chapter 3 – Line Separation Evaluation Framework
Framework for Analyzing Separation Distances between Transmission Lines in Wyoming 3‐9
Figure 3‐4. Range of Variation for Optimal Line Separation Distance
3.6 Problem Formulation The concepts outlined in previous sections can now be represented as an illustrative equation that describes the line separation problem, as follows as Equation (1):
Optimize SD = f {is, psr, er, luc, sf, psf} Where SD = line separation distance. is = industry standards (NESC, OSHA) and basic characteristics of the transmission line design. psr = power system reliability criteria, analyses and regional power system condition. er = environmental regulations. luc = land use constraints. sf = social factors (visual impact, public opposition). psf = project‐specific factors.
It is important to note that Equation (1) presents a consolidated representation of the parameters involved in determining line separation distance. Obviously, there is no closed‐form solution possible for this equation (and development of one is not likely) because there are no deterministic functions that relate the separation distance to all the various parameters in the equation.
Equation (1) does not include weather‐related factors because, as opposed to direct factors such as power system reliability performance requirements, weather by itself is an indirect factor.
Once line separation distance is determined, the following parameters can be estimated as a function of the separation distance and other factors:
Optimal Range for Line Separation Distance
Variation bands
Line Separation Distance
Installation & Maintenance Cost and Time
Environmental Permitting Delays
Future need for new transmission lines
Line de‐rating risk
Need for RAS
Ease of adherence to environmental regulations and land‐use constraints
Public opposition
Visual impact concern
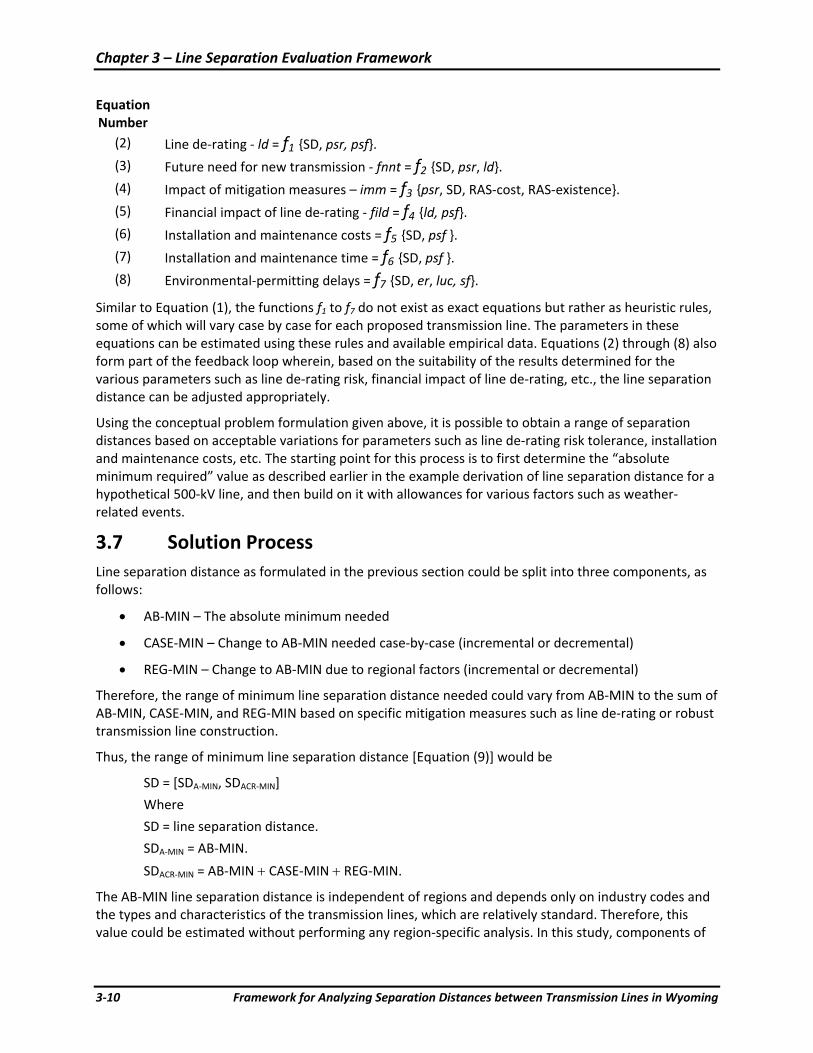
Chapter 3 – Line Separation Evaluation Framework
3‐10 Framework for Analyzing Separation Distances between Transmission Lines in Wyoming
Equation Number
(2) Line de‐rating ‐ ld = f1 {SD, psr, psf}. (3) Future need for new transmission ‐ fnnt = f2 {SD, psr, ld}. (4) Impact of mitigation measures – imm = f3 {psr, SD, RAS‐cost, RAS‐existence}. (5) Financial impact of line de‐rating ‐ fild = f4 {ld, psf}. (6) Installation and maintenance costs = f5 {SD, psf }. (7) Installation and maintenance time = f6 {SD, psf }. (8) Environmental‐permitting delays = f7 {SD, er, luc, sf}.
Similar to Equation (1), the functions f1 to f7 do not exist as exact equations but rather as heuristic rules, some of which will vary case by case for each proposed transmission line. The parameters in these equations can be estimated using these rules and available empirical data. Equations (2) through (8) also form part of the feedback loop wherein, based on the suitability of the results determined for the various parameters such as line de‐rating risk, financial impact of line de‐rating, etc., the line separation distance can be adjusted appropriately.
Using the conceptual problem formulation given above, it is possible to obtain a range of separation distances based on acceptable variations for parameters such as line de‐rating risk tolerance, installation and maintenance costs, etc. The starting point for this process is to first determine the “absolute minimum required” value as described earlier in the example derivation of line separation distance for a hypothetical 500‐kV line, and then build on it with allowances for various factors such as weather‐related events.
3.7 Solution Process Line separation distance as formulated in the previous section could be split into three components, as follows:
• AB‐MIN – The absolute minimum needed
• CASE‐MIN – Change to AB‐MIN needed case‐by‐case (incremental or decremental)
• REG‐MIN – Change to AB‐MIN due to regional factors (incremental or decremental)
Therefore, the range of minimum line separation distance needed could vary from AB‐MIN to the sum of AB‐MIN, CASE‐MIN, and REG‐MIN based on specific mitigation measures such as line de‐rating or robust transmission line construction.
Thus, the range of minimum line separation distance [Equation (9)] would be
SD = [SDA‐MIN, SDACR‐MIN]
Where
SD = line separation distance.
SDA‐MIN = AB‐MIN.
SDACR‐MIN = AB‐MIN + CASE‐MIN + REG‐MIN.
The AB‐MIN line separation distance is independent of regions and depends only on industry codes and the types and characteristics of the transmission lines, which are relatively standard. Therefore, this value could be estimated without performing any region‐specific analysis. In this study, components of
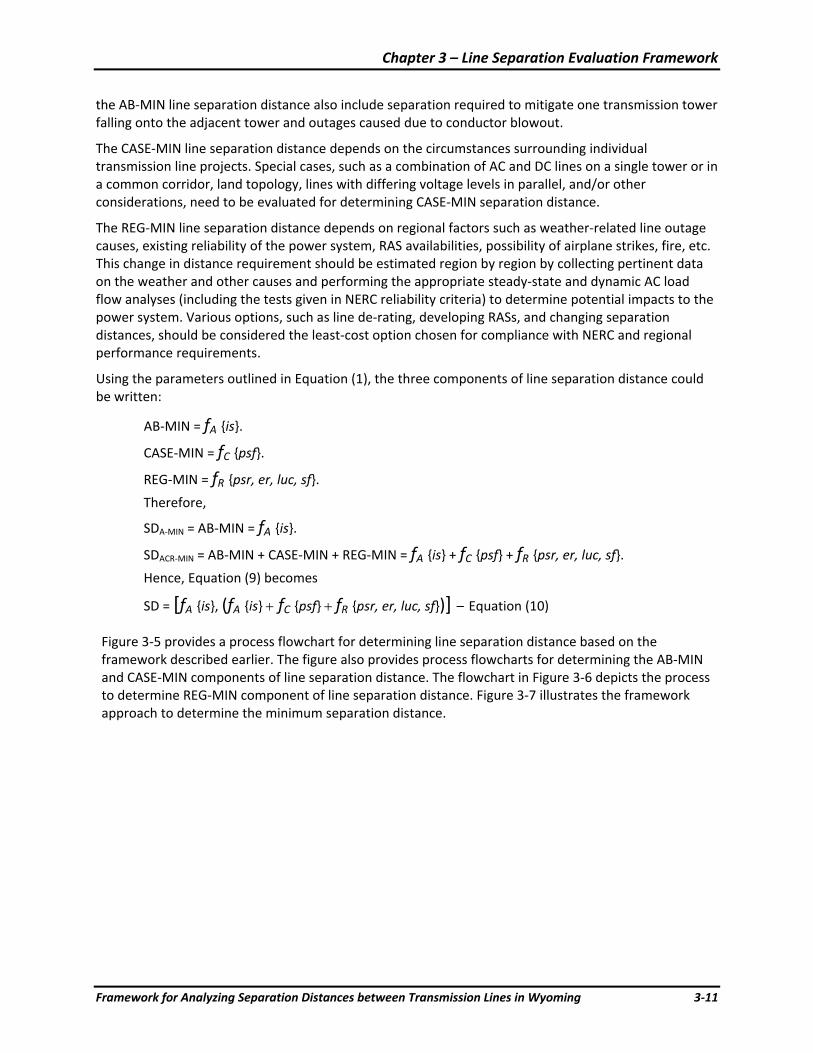
Chapter 3 – Line Separation Evaluation Framework
Framework for Analyzing Separation Distances between Transmission Lines in Wyoming 3‐11
the AB‐MIN line separation distance also include separation required to mitigate one transmission tower falling onto the adjacent tower and outages caused due to conductor blowout.
The CASE‐MIN line separation distance depends on the circumstances surrounding individual transmission line projects. Special cases, such as a combination of AC and DC lines on a single tower or in a common corridor, land topology, lines with differing voltage levels in parallel, and/or other considerations, need to be evaluated for determining CASE‐MIN separation distance.
The REG‐MIN line separation distance depends on regional factors such as weather‐related line outage causes, existing reliability of the power system, RAS availabilities, possibility of airplane strikes, fire, etc. This change in distance requirement should be estimated region by region by collecting pertinent data on the weather and other causes and performing the appropriate steady‐state and dynamic AC load flow analyses (including the tests given in NERC reliability criteria) to determine potential impacts to the power system. Various options, such as line de‐rating, developing RASs, and changing separation distances, should be considered the least‐cost option chosen for compliance with NERC and regional performance requirements.
Using the parameters outlined in Equation (1), the three components of line separation distance could be written:
AB‐MIN = fA {is}.
CASE‐MIN = fC {psf}.
REG‐MIN = fR {psr, er, luc, sf}. Therefore,
SDA‐MIN = AB‐MIN = fA {is}.
SDACR‐MIN = AB‐MIN + CASE‐MIN + REG‐MIN = fA {is} + fC {psf} + fR {psr, er, luc, sf}. Hence, Equation (9) becomes
SD = [fA {is}, (fA {is} + fC {psf} + fR {psr, er, luc, sf})] – Equation (10)
Figure 3‐5 provides a process flowchart for determining line separation distance based on the framework described earlier. The figure also provides process flowcharts for determining the AB‐MIN and CASE‐MIN components of line separation distance. The flowchart in Figure 3‐6 depicts the process to determine REG‐MIN component of line separation distance. Figure 3‐7 illustrates the framework approach to determine the minimum separation distance.
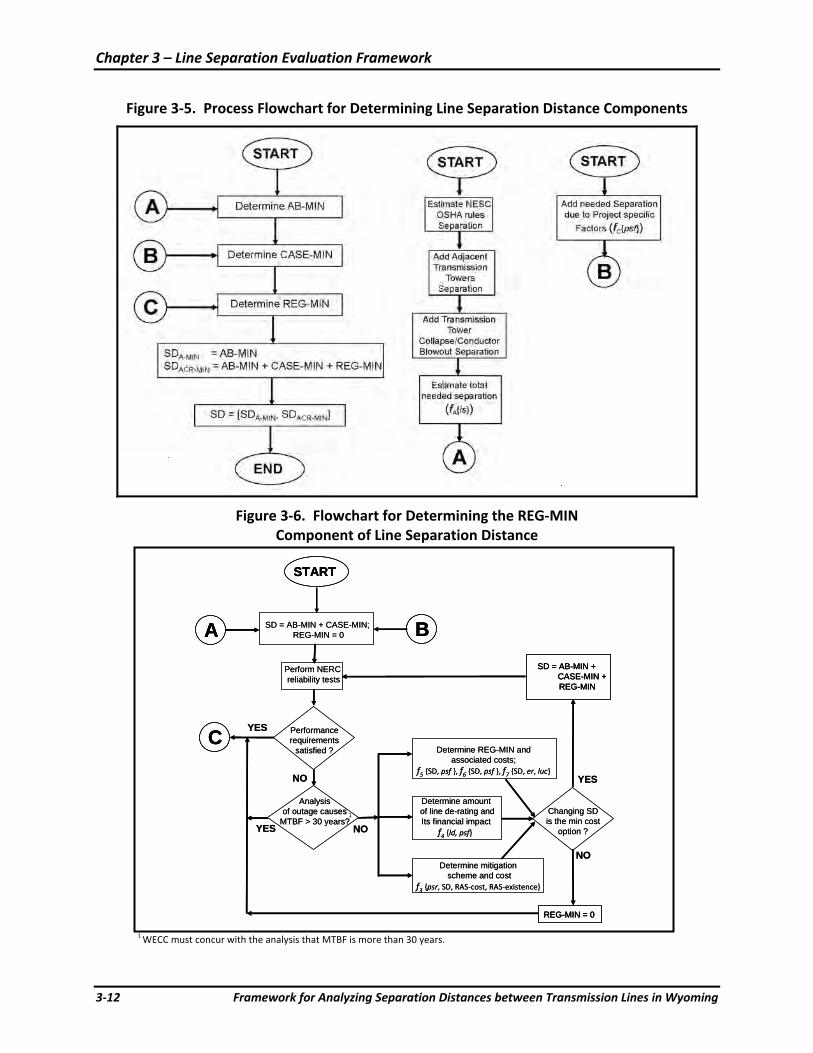
Chapter 3 – Line Separation Evaluation Framework
3‐12 Framework for Analyzing Separation Distances between Transmission Lines in Wyoming
Figure 3‐5. Process Flowchart for Determining Line Separation Distance Components
Figure 3‐6. Flowchart for Determining the REG‐MIN
Component of Line Separation Distance
1 WECC must concur with the analysis that MTBF is more than 30 years.
Perform NERC reliability tests
Determine REG-MIN and associated costs;
f5 {SD, psf }, f6 {SD, psf }, f7 {SD, er, luc}
C
START
A BSD = AB-MIN + CASE-MIN; REG-MIN = 0
Performancerequirements
satisfied ?
YES
NO
Analysisof outage causes
MTBF > 30 years?NOYES
Determine amountof line de-rating andIts financial impact
f4 {ld, psf}
Determine mitigation scheme and cost
f3 {psr, SD, RAS‐cost, RAS‐existence}
YES
NO
Changing SDis the min cost
option ?
SD = AB-MIN + CASE-MIN + REG-MIN
REG-MIN = 0
Perform NERC reliability tests
Determine REG-MIN and associated costs;
f5 {SD, psf }, f6 {SD, psf }, f7 {SD, er, luc}
CC
STARTSTART
AA BBSD = AB-MIN + CASE-MIN; REG-MIN = 0
Performancerequirements
satisfied ?
YES
NO
Analysisof outage causes
MTBF > 30 years?NOYES
Determine amountof line de-rating andIts financial impact
f4 {ld, psf}
Determine mitigation scheme and cost
f3 {psr, SD, RAS‐cost, RAS‐existence}
YES
NO
Changing SDis the min cost
option ?
SD = AB-MIN + CASE-MIN + REG-MIN
SD = AB-MIN + CASE-MIN + REG-MIN
REG-MIN = 0REG-MIN = 0
1
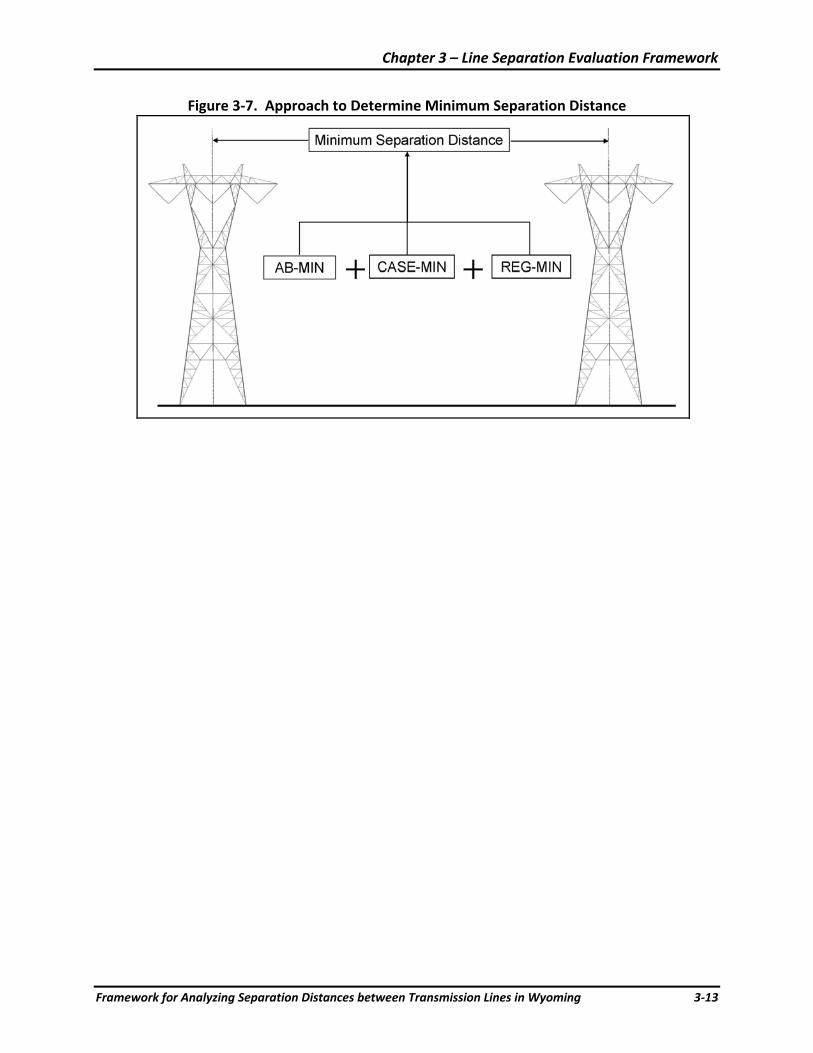
Chapter 3 – Line Separation Evaluation Framework
Framework for Analyzing Separation Distances between Transmission Lines in Wyoming 3‐13
Figure 3‐7. Approach to Determine Minimum Separation Distance
Chapter 3 – Line Separation Evaluation Framework
3‐14 Framework for Analyzing Separation Distances between Transmission Lines in Wyoming
This page intentionally left blank.
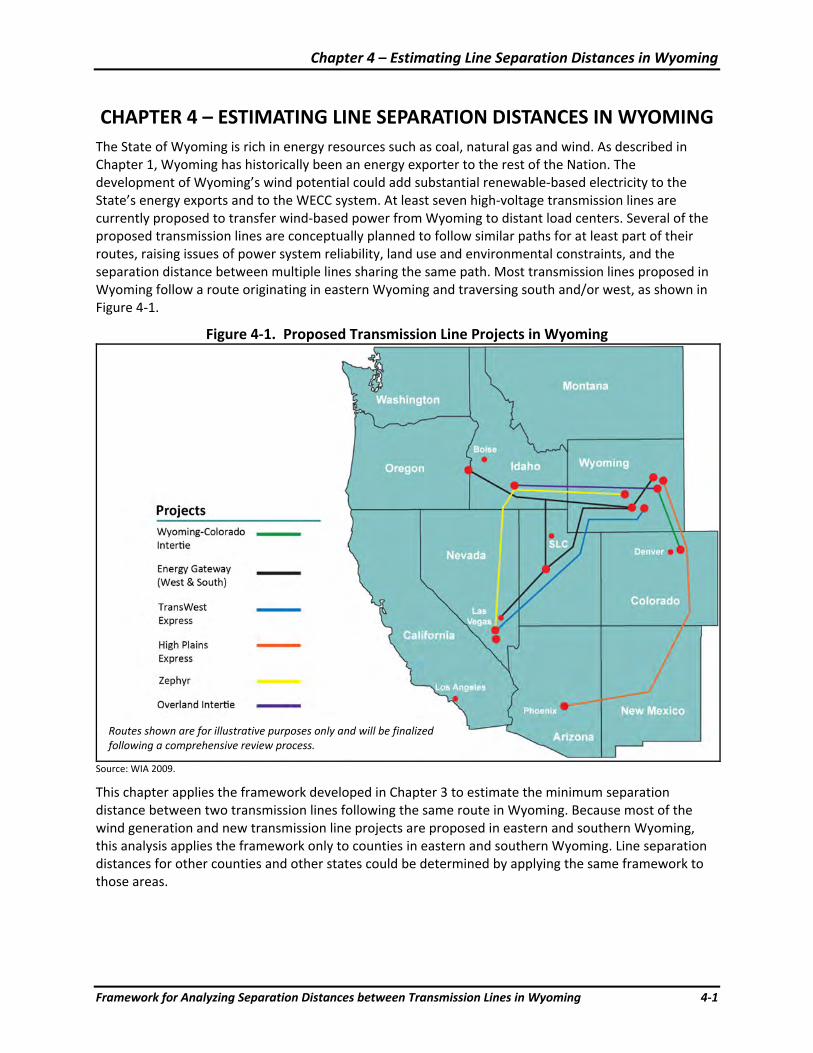
Chapter 4 – Estimating Line Separation Distances in Wyoming
Framework for Analyzing Separation Distances between Transmission Lines in Wyoming 4‐1
CHAPTER 4 – ESTIMATING LINE SEPARATION DISTANCES IN WYOMING The State of Wyoming is rich in energy resources such as coal, natural gas and wind. As described in Chapter 1, Wyoming has historically been an energy exporter to the rest of the Nation. The development of Wyoming’s wind potential could add substantial renewable‐based electricity to the State’s energy exports and to the WECC system. At least seven high‐voltage transmission lines are currently proposed to transfer wind‐based power from Wyoming to distant load centers. Several of the proposed transmission lines are conceptually planned to follow similar paths for at least part of their routes, raising issues of power system reliability, land use and environmental constraints, and the separation distance between multiple lines sharing the same path. Most transmission lines proposed in Wyoming follow a route originating in eastern Wyoming and traversing south and/or west, as shown in Figure 4‐1.
Figure 4‐1. Proposed Transmission Line Projects in Wyoming
Source: WIA 2009.
This chapter applies the framework developed in Chapter 3 to estimate the minimum separation distance between two transmission lines following the same route in Wyoming. Because most of the wind generation and new transmission line projects are proposed in eastern and southern Wyoming, this analysis applies the framework only to counties in eastern and southern Wyoming. Line separation distances for other counties and other states could be determined by applying the same framework to those areas.
Routes shown are for illustrative purposes only and will be finalized following a comprehensive review process.
Chapter 4 – Estimating Line Separation Distances in Wyoming
4‐2 Framework for Analyzing Separation Distances between Transmission Lines in Wyoming
4.1 Components of Line Separation Distance From Equation (9) in Chapter 3, the range of line separation distances is given by:
SD = [SDA‐MIN, SDACR‐MIN],
where
SD = minimum line separation distance;
SDA‐MIN = AB‐MIN;
SDACR‐MIN = AB‐MIN + CASE‐MIN + REG‐MIN;
and
AB‐MIN = Absolute minimum required separation distance;
CASE‐MIN = change in separation distance due to project specific case‐by‐case factors;
REG‐MIN = change in separation distance due to regional factors.
The process of determining minimum line separation distances for Wyoming starts with estimating each of these components separately. It is important to note that CASE‐MIN and REG‐MIN can be either negative or positive in value based on the specific situation.
4.1.1 Absolute Minimum Line Separation Distance
AB‐MIN should be the absolute minimum separation distance between two lines, irrespective of their regional location or other characteristics except for the design of the transmission‐tower and other components and the line voltage. The estimation of AB‐MIN is independent of regional or project‐specific factors.
As stated in Chapter 3, ICF calculated the AB‐MIN distance for a 500‐kV line to be about 260 feet, based on NESC and OSHA industry standards and transmission tower and conductor characteristics for a typical 500‐kV line. The estimate of 260 feet for AB‐MIN also includes mitigation for simultaneous line outages due to conductor blowout and transmission tower collapse and, could be increased or decreased if the tower height and other factors differ from values assumed in the example. However, because AB‐MIN is fairly independent of regional characteristics, an estimate of approximately 260 feet for the absolute minimum line separation distance is a reasonable starting point for calculating transmission line separation distances in Wyoming.
4.1.2 Case‐Specific Incremental Minimum Line Separation Distance
The case‐specific component of the minimum line separation distance calculation is based on characteristics specific to each transmission project. Case‐specific characteristics are generally independent of the types of transmission towers, kV level, etc., used for the project; these latter features determine the AB‐MIN value. Instead, project‐specific factors to consider in determining CASE‐MIN could include portions of a project route, such as passing through a valley between mountains, where line separation distances might need to be reduced due to topographical restrictions. In this example, CASE‐MIN would have a negative value. For a situation where two lines might be separated by a ridge to mitigate the impact of fire, CASE‐MIN would have a positive value. A constructability adder to address rough terrain is another example where CASE‐MIN would typically have a positive value.
This study analyzes the required line separation distances from a general perspective and is not intended to recommend separation distances for specific projects. Therefore, for this analysis ICF assumed CASE‐MIN to be zero. Using the framework developed in the Chapter 3, transmission line proponents could calculate the impacts of project‐specific characteristics on line separation distances.
Chapter 4 – Estimating Line Separation Distances in Wyoming
Framework for Analyzing Separation Distances between Transmission Lines in Wyoming 4‐3
4.1.3 Incremental Regional Minimum Line Separation Distance
REG‐MIN is the incremental (or decremental) value for minimum line separation distance based on factors that vary by region, such as the weather. The process flowchart in Figure 3‐6 lists the steps for estimating REG‐MIN.
To estimate REG‐MIN, it is necessary to understand the causes of simultaneous outages of multiple lines in Wyoming and to investigate the probability of these outages occurring. If the NERC Category C reliability performance requirements are not met and if it cannot be shown that the MTBF for the simultaneous outages of multiple lines is less than 1 in 30 years, then the options are 1) increase line separation distance, 2) accept a reduced line rating, or 3) develop and implement an RAS.
These options can be ranked based on least cost analysis and chosen accordingly. Further, involvement of WECC in this process and WECC’s approval of the option chosen are essential for all transmission projects to proceed successfully.
To determine the MTBF for the simultaneous outage of multiple transmission lines in Wyoming, the causes for line outages in the State need to be understood. While data regarding causes for individual line outages in Wyoming were not available for this study, WECC transmission outage reports (WECC 2007a, WECC 2008b) identify the most common causes for sustained transmission line outages (for 500‐600 kV lines) within the WECC system as terminal equipment, unknown, and weather excluding lightning (see Table 2‐7). Fire, lightning, human error, and vandalism also contributed to 5 percent or more of sustained outages of 500‐600 kV lines in 2006 or 2007 (see Table 2‐7). Equipment failure, unknown factors, and human error, typically cannot be mitigated by increasing the line separation distance. Given the percentage of outages (see Table 2‐7) attributed to these factors, they are obviously important to power system reliability; however, analysis of these factors is outside the scope of this separation study. Depending on the situation, vandalism (also includes sabotage and terrorism) may or may not be mitigated by separation distance; however, this complex factor is deemed outside the scope of this study and is therefore not included in the analysis.
Weather‐related outage factors (fire, lightning, and weather excluding lightning) accounted for about 24 (2006) and 19 (2007) percent of sustained line outages in the WECC system (WECC 2007a, 2008b). This chapter analyzes weather‐related risk factors, which can to some degree be mitigated by ensuring appropriate line separation distance. For the purposes of this report, fire is categorized as weather‐related. Lightning is a common ignition source of wildland fires in the west.
Given Wyoming’s climate and topography, the five primary weather‐related causes of line outages are high winds, storms (rain, ice, snow, and hail), tornadoes, lightning, and fires. Data are available from the National Climate Data Center (NCDC) for historical occurrences of weather events in Wyoming (NOAA 2009). However, there is more historical data for some causes, such as tornadoes, than is available for lightning. Based on available data, ICF analyzed the five primary weather‐related causes of line outages to determine the probability of simultaneous outages of multiple lines in Wyoming. The analysis determined the value of REG‐MIN necessary to mitigate the probability of line outages from these causes. The mathematical rigor employed in determining the likelihood of outages of multiple transmission lines outages due to any of these causes depended on the quantity and quality of available historical data on the occurrence and characteristics of that cause.
Chapter 4 – Estimating Line Separation Distances in Wyoming
4‐4 Framework for Analyzing Separation Distances between Transmission Lines in Wyoming
To calculate REG‐MIN:
REG‐MIN = max (REG‐MINW , REG‐MINSTORM , REG‐MINT , REG‐MINL , REG‐MINFIRE , REG‐MINOTHER). Where
REG‐MINW = incremental line separation to mitigate probability of high winds causing simultaneous outages of multiple lines.
REG‐MINSTORM = incremental line separation to mitigate probability of ice/snow/rain/hail storms causing simultaneous outages of multiple lines.
REG‐MINT = incremental line separation to mitigate probability of tornadoes causing simultaneous outages of multiple lines.
REG‐MINL = incremental line separation to mitigate probability of lightning causing simultaneous outages of multiple lines.
REG‐MINFIRE = incremental line separation to mitigate probability of fires causing simultaneous outages of multiple lines.
REG‐MINOTHER = incremental line separation to mitigate probability of other regional factors causing simultaneous outages of multiple lines.
Thus, the process is to 1) determine the individual incremental line separation distance to mitigate the impact of high winds, storms, tornadoes, lightning, and fires and 2) select the largest of these five values for REG‐MIN. The separation distances calculated for these five factors are not additive. An incremental separation distance equal to the largest value would mitigate the impact of the other four factors. A sixth cause (other) is included in the formula for REG‐MIN to account for other regional factors which may be mitigated by line separation distance. While REG‐MINOTHER is not used in the following application of the framework to Wyoming, it may be necessary for applications of this framework to other regions.
High Winds
Eastern and southeastern Wyoming counties experience both wind‐speed bursts and sustained high wind speeds. Figure 4‐2 shows statistics regarding maximum wind speeds in Wyoming during thunderstorms and high‐wind conditions.
For the hypothetical 500‐kV line, the total AB‐MIN line separation distance includes components for mitigation for line outages due to conductor blowout or transmission tower collapse due to high winds (see Chapter 3).
The next step in this example is to determine whether incremental line separation distance is needed to mitigate the probability of sustained high winds causing line outages. Sustained high winds could cause a transmission conductor to break free of the transmission tower and make contact with an adjacent transmission line that is closer than one span length of the transmission line with the broken conductor. This possibility must be analyzed and mitigated, especially in Wyoming, because of its high sustained wind speeds. There are two ways to mitigate the probability of a conductor snapping from the tower and a line contacting the adjacent transmission line:
1) Ensure that the line separation distance between two adjacent transmission lines is more than one span length of the line with the longest span.
2) Conclusively demonstrate that the transmission line, especially the joints in the transmission towers that support the conductors, will withstand sustained and momentary extreme wind gusts without the conductors breaking free of the transmission tower. A starting point for this demonstration is to ensure compliance with the NESC extreme wind loading scenarios and
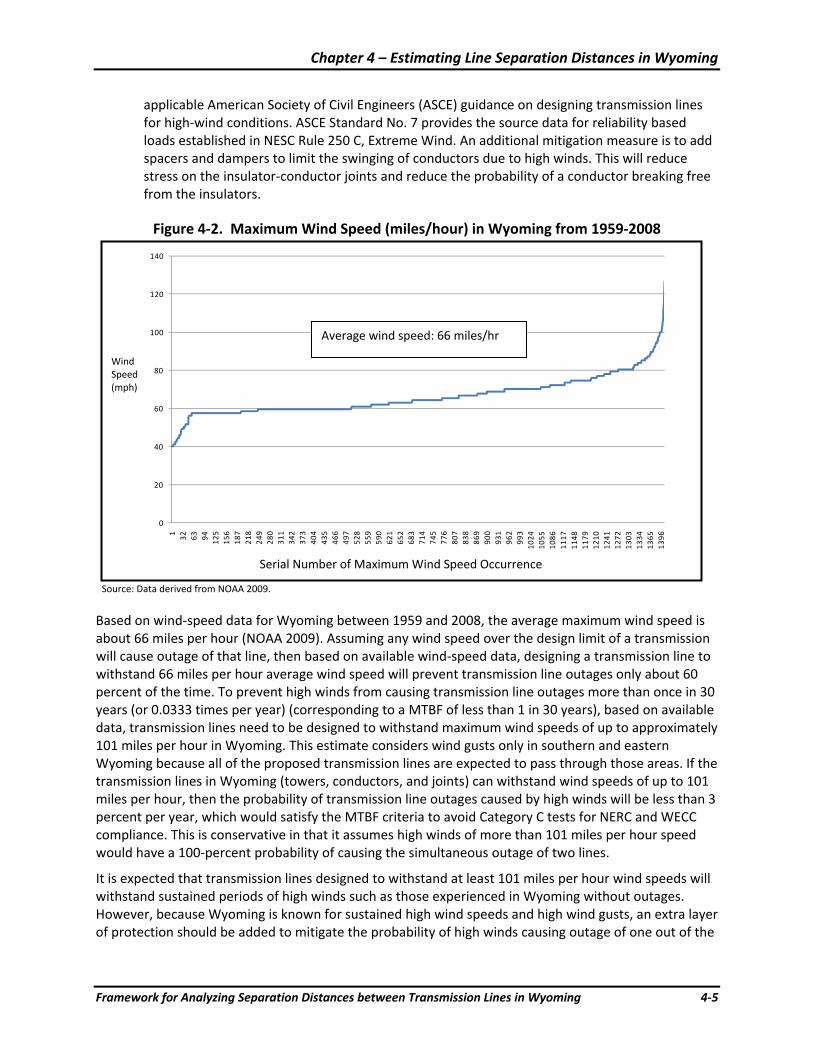
Chapter 4 – Estimating Line Separation Distances in Wyoming
Framework for Analyzing Separation Distances between Transmission Lines in Wyoming 4‐5
applicable American Society of Civil Engineers (ASCE) guidance on designing transmission lines for high‐wind conditions. ASCE Standard No. 7 provides the source data for reliability based loads established in NESC Rule 250 C, Extreme Wind. An additional mitigation measure is to add spacers and dampers to limit the swinging of conductors due to high winds. This will reduce stress on the insulator‐conductor joints and reduce the probability of a conductor breaking free from the insulators.
Figure 4‐2. Maximum Wind Speed (miles/hour) in Wyoming from 1959‐2008
0
20
40
60
80
100
120
140
1 32 63 94 125
156
187
218
249
280
311
342
373
404
435
466
497
528
559
590
621
652
683
714
745
776
807
838
869
900
931
962
993
1024
1055
1086
1117
1148
1179
1210
1241
1272
1303
1334
1365
1396
Source: Data derived from NOAA 2009.
Based on wind‐speed data for Wyoming between 1959 and 2008, the average maximum wind speed is about 66 miles per hour (NOAA 2009). Assuming any wind speed over the design limit of a transmission will cause outage of that line, then based on available wind‐speed data, designing a transmission line to withstand 66 miles per hour average wind speed will prevent transmission line outages only about 60 percent of the time. To prevent high winds from causing transmission line outages more than once in 30 years (or 0.0333 times per year) (corresponding to a MTBF of less than 1 in 30 years), based on available data, transmission lines need to be designed to withstand maximum wind speeds of up to approximately 101 miles per hour in Wyoming. This estimate considers wind gusts only in southern and eastern Wyoming because all of the proposed transmission lines are expected to pass through those areas. If the transmission lines in Wyoming (towers, conductors, and joints) can withstand wind speeds of up to 101 miles per hour, then the probability of transmission line outages caused by high winds will be less than 3 percent per year, which would satisfy the MTBF criteria to avoid Category C tests for NERC and WECC compliance. This is conservative in that it assumes high winds of more than 101 miles per hour speed would have a 100‐percent probability of causing the simultaneous outage of two lines.
It is expected that transmission lines designed to withstand at least 101 miles per hour wind speeds will withstand sustained periods of high winds such as those experienced in Wyoming without outages. However, because Wyoming is known for sustained high wind speeds and high wind gusts, an extra layer of protection should be added to mitigate the probability of high winds causing outage of one out of the
Average wind speed: 66 miles/hr
Wind Speed (mph)
Number of OccurrencesSerial Number of Maximum Wind Speed Occurrence
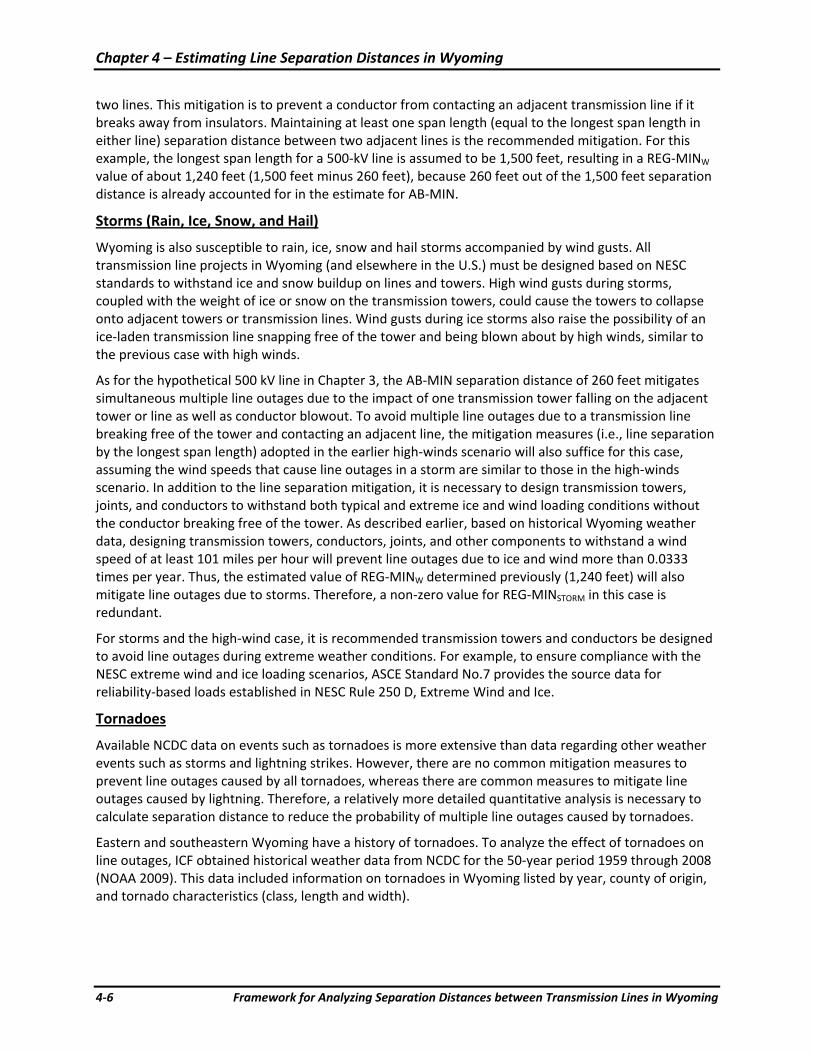
Chapter 4 – Estimating Line Separation Distances in Wyoming
4‐6 Framework for Analyzing Separation Distances between Transmission Lines in Wyoming
two lines. This mitigation is to prevent a conductor from contacting an adjacent transmission line if it breaks away from insulators. Maintaining at least one span length (equal to the longest span length in either line) separation distance between two adjacent lines is the recommended mitigation. For this example, the longest span length for a 500‐kV line is assumed to be 1,500 feet, resulting in a REG‐MINW value of about 1,240 feet (1,500 feet minus 260 feet), because 260 feet out of the 1,500 feet separation distance is already accounted for in the estimate for AB‐MIN.
Storms (Rain, Ice, Snow, and Hail)
Wyoming is also susceptible to rain, ice, snow and hail storms accompanied by wind gusts. All transmission line projects in Wyoming (and elsewhere in the U.S.) must be designed based on NESC standards to withstand ice and snow buildup on lines and towers. High wind gusts during storms, coupled with the weight of ice or snow on the transmission towers, could cause the towers to collapse onto adjacent towers or transmission lines. Wind gusts during ice storms also raise the possibility of an ice‐laden transmission line snapping free of the tower and being blown about by high winds, similar to the previous case with high winds.
As for the hypothetical 500 kV line in Chapter 3, the AB‐MIN separation distance of 260 feet mitigates simultaneous multiple line outages due to the impact of one transmission tower falling on the adjacent tower or line as well as conductor blowout. To avoid multiple line outages due to a transmission line breaking free of the tower and contacting an adjacent line, the mitigation measures (i.e., line separation by the longest span length) adopted in the earlier high‐winds scenario will also suffice for this case, assuming the wind speeds that cause line outages in a storm are similar to those in the high‐winds scenario. In addition to the line separation mitigation, it is necessary to design transmission towers, joints, and conductors to withstand both typical and extreme ice and wind loading conditions without the conductor breaking free of the tower. As described earlier, based on historical Wyoming weather data, designing transmission towers, conductors, joints, and other components to withstand a wind speed of at least 101 miles per hour will prevent line outages due to ice and wind more than 0.0333 times per year. Thus, the estimated value of REG‐MINW determined previously (1,240 feet) will also mitigate line outages due to storms. Therefore, a non‐zero value for REG‐MINSTORM in this case is redundant.
For storms and the high‐wind case, it is recommended transmission towers and conductors be designed to avoid line outages during extreme weather conditions. For example, to ensure compliance with the NESC extreme wind and ice loading scenarios, ASCE Standard No.7 provides the source data for reliability‐based loads established in NESC Rule 250 D, Extreme Wind and Ice.
Tornadoes
Available NCDC data on events such as tornadoes is more extensive than data regarding other weather events such as storms and lightning strikes. However, there are no common mitigation measures to prevent line outages caused by all tornadoes, whereas there are common measures to mitigate line outages caused by lightning. Therefore, a relatively more detailed quantitative analysis is necessary to calculate separation distance to reduce the probability of multiple line outages caused by tornadoes.
Eastern and southeastern Wyoming have a history of tornadoes. To analyze the effect of tornadoes on line outages, ICF obtained historical weather data from NCDC for the 50‐year period 1959 through 2008 (NOAA 2009). This data included information on tornadoes in Wyoming listed by year, county of origin, and tornado characteristics (class, length and width).
Chapter 4 – Estimating Line Separation Distances in Wyoming
Framework for Analyzing Separation Distances between Transmission Lines in Wyoming 4‐7
The key variable in analyzing this data is the expected number of tornadoes that could cause simultaneous outages of multiple lines in a single year. To aid in formulating a methodology for this analysis, ICF developed the following initial assumptions:
1) Consider only two 500‐kV lines per transmission corridor
2) Consider only one corridor per county in Wyoming
3) A single thunderstorm spawns only one tornado
4) The analysis of tornadoes is performed on a county by county basis within Wyoming
5) This analysis does not include the central and northwestern counties of Wyoming because the number of proposed transmission line routes and tornado potential are relatively less substantial in those counties.
Figure 4‐3 is a map of Wyoming showing all the counties and those selected for this analysis.
Figure 4‐3. Wyoming Counties Considered in the Tornado Analysis
Source: Digital‐topo‐maps.com 2005. Note: Counties not considered in tornado analysis are shaded.
The methodology could be extended to other counties in Wyoming, other states, additional corridors within a county, or for more than two lines within a corridor; however, such additional analyses are outside the scope of this study. Note that for the same line separation distance, more lines within a county (whether in single or multiple corridors) could increase the probability of line outages. The methodology also could be applied to a case in which a thunderstorm spawns more than one tornado.
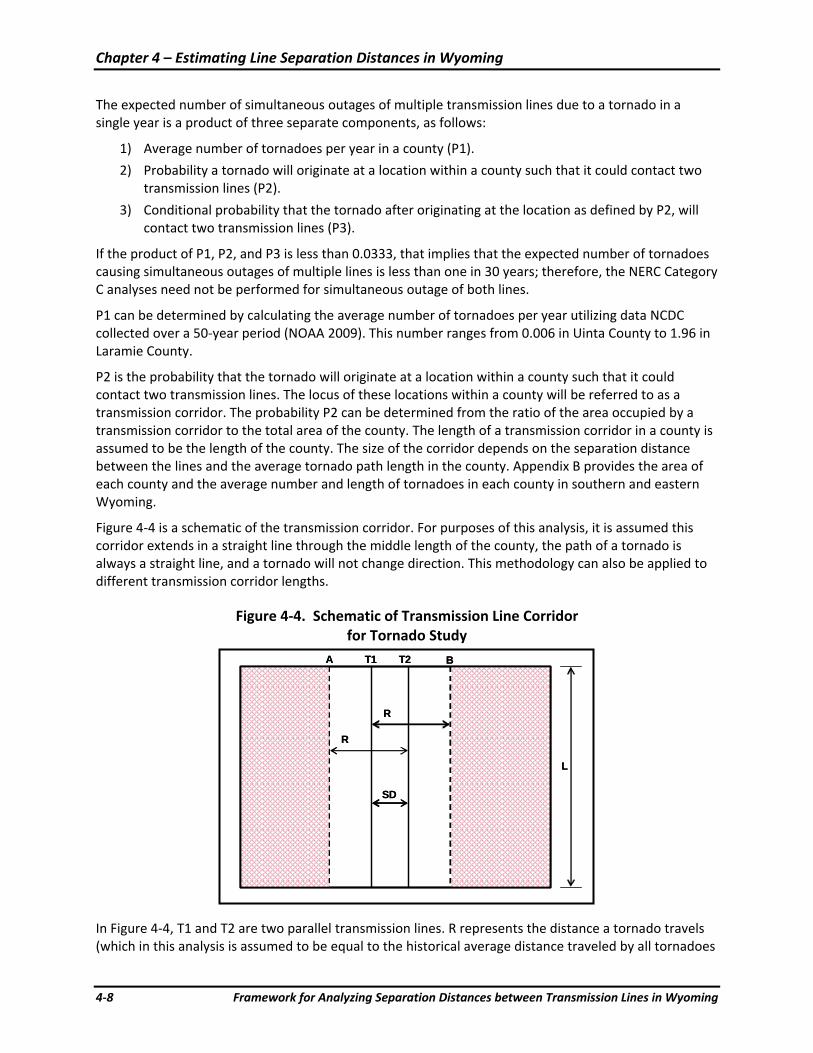
Chapter 4 – Estimating Line Separation Distances in Wyoming
4‐8 Framework for Analyzing Separation Distances between Transmission Lines in Wyoming
The expected number of simultaneous outages of multiple transmission lines due to a tornado in a single year is a product of three separate components, as follows:
1) Average number of tornadoes per year in a county (P1).
2) Probability a tornado will originate at a location within a county such that it could contact two transmission lines (P2).
3) Conditional probability that the tornado after originating at the location as defined by P2, will contact two transmission lines (P3).
If the product of P1, P2, and P3 is less than 0.0333, that implies that the expected number of tornadoes causing simultaneous outages of multiple lines is less than one in 30 years; therefore, the NERC Category C analyses need not be performed for simultaneous outage of both lines.
P1 can be determined by calculating the average number of tornadoes per year utilizing data NCDC collected over a 50‐year period (NOAA 2009). This number ranges from 0.006 in Uinta County to 1.96 in Laramie County.
P2 is the probability that the tornado will originate at a location within a county such that it could contact two transmission lines. The locus of these locations within a county will be referred to as a transmission corridor. The probability P2 can be determined from the ratio of the area occupied by a transmission corridor to the total area of the county. The length of a transmission corridor in a county is assumed to be the length of the county. The size of the corridor depends on the separation distance between the lines and the average tornado path length in the county. Appendix B provides the area of each county and the average number and length of tornadoes in each county in southern and eastern Wyoming.
Figure 4‐4 is a schematic of the transmission corridor. For purposes of this analysis, it is assumed this corridor extends in a straight line through the middle length of the county, the path of a tornado is always a straight line, and a tornado will not change direction. This methodology can also be applied to different transmission corridor lengths.
Figure 4‐4. Schematic of Transmission Line Corridor for Tornado Study
In Figure 4‐4, T1 and T2 are two parallel transmission lines. R represents the distance a tornado travels (which in this analysis is assumed to be equal to the historical average distance traveled by all tornadoes
T1 T2
SD
R
R
A B
L
T1 T2
SD
R
R
A B
L
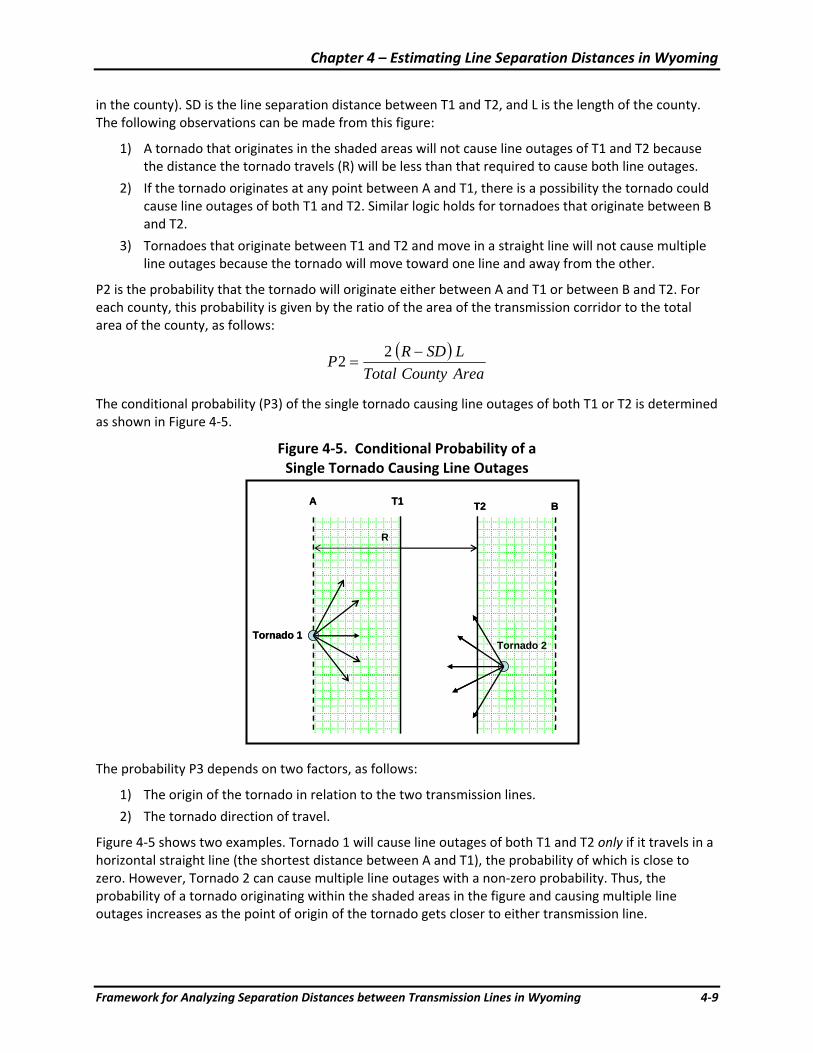
Chapter 4 – Estimating Line Separation Distances in Wyoming
Framework for Analyzing Separation Distances between Transmission Lines in Wyoming 4‐9
in the county). SD is the line separation distance between T1 and T2, and L is the length of the county. The following observations can be made from this figure:
1) A tornado that originates in the shaded areas will not cause line outages of T1 and T2 because the distance the tornado travels (R) will be less than that required to cause both line outages.
2) If the tornado originates at any point between A and T1, there is a possibility the tornado could cause line outages of both T1 and T2. Similar logic holds for tornadoes that originate between B and T2.
3) Tornadoes that originate between T1 and T2 and move in a straight line will not cause multiple line outages because the tornado will move toward one line and away from the other.
P2 is the probability that the tornado will originate either between A and T1 or between B and T2. For each county, this probability is given by the ratio of the area of the transmission corridor to the total area of the county, as follows:
( )AreaCountyTotalLSDRP −
=22
The conditional probability (P3) of the single tornado causing line outages of both T1 or T2 is determined as shown in Figure 4‐5.
Figure 4‐5. Conditional Probability of a Single Tornado Causing Line Outages
The probability P3 depends on two factors, as follows:
1) The origin of the tornado in relation to the two transmission lines.
2) The tornado direction of travel.
Figure 4‐5 shows two examples. Tornado 1 will cause line outages of both T1 and T2 only if it travels in a horizontal straight line (the shortest distance between A and T1), the probability of which is close to zero. However, Tornado 2 can cause multiple line outages with a non‐zero probability. Thus, the probability of a tornado originating within the shaded areas in the figure and causing multiple line outages increases as the point of origin of the tornado gets closer to either transmission line.
T1 T2
R
A B
Tornado 1Tornado 2
T1 T2
R
A B
Tornado 1Tornado 2
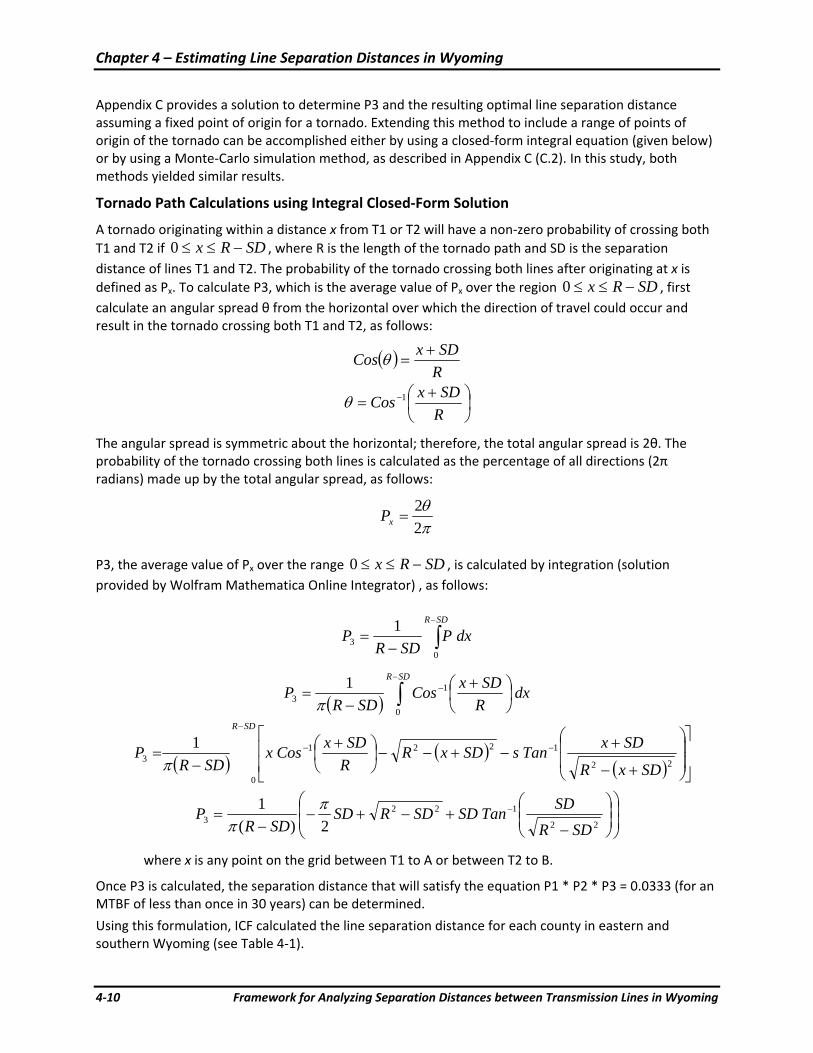
Chapter 4 – Estimating Line Separation Distances in Wyoming
4‐10 Framework for Analyzing Separation Distances between Transmission Lines in Wyoming
Appendix C provides a solution to determine P3 and the resulting optimal line separation distance assuming a fixed point of origin for a tornado. Extending this method to include a range of points of origin of the tornado can be accomplished either by using a closed‐form integral equation (given below) or by using a Monte‐Carlo simulation method, as described in Appendix C (C.2). In this study, both methods yielded similar results.
Tornado Path Calculations using Integral Closed‐Form Solution
A tornado originating within a distance x from T1 or T2 will have a non‐zero probability of crossing both T1 and T2 if SDRx −≤≤0 , where R is the length of the tornado path and SD is the separation distance of lines T1 and T2. The probability of the tornado crossing both lines after originating at x is defined as Px. To calculate P3, which is the average value of Px over the region SDRx −≤≤0 , first calculate an angular spread θ from the horizontal over which the direction of travel could occur and result in the tornado crossing both T1 and T2, as follows:
( )RSDxCos +
=θ
⎟⎠⎞
⎜⎝⎛ +
= −
RSDxCos 1θ
The angular spread is symmetric about the horizontal; therefore, the total angular spread is 2θ. The probability of the tornado crossing both lines is calculated as the percentage of all directions (2π radians) made up by the total angular spread, as follows:
πθ
22
=xP
P3, the average value of Px over the range SDRx −≤≤0 , is calculated by integration (solution provided by Wolfram Mathematica Online Integrator) , as follows:
∫−
−=
SDR
dxPSDR
P0
31
( ) dxRSDxCos
SDRP
SDR
∫−
− ⎟⎠⎞
⎜⎝⎛ +
−=
0
13
1π
( ) ( )( ) ⎥
⎥
⎦
⎤
⎢⎢
⎣
⎡
⎟⎟
⎠
⎞
⎜⎜
⎝
⎛
+−
+−+−−⎟
⎠⎞
⎜⎝⎛ +
−= −−
−
22
1221
0
31
SDxR
SDxTansSDxRRSDxCosx
SDRP
SDR
π
⎟⎟⎠
⎞⎜⎜⎝
⎛⎟⎟⎠
⎞⎜⎜⎝
⎛
−+−+−
−= −
22
1223 2)(
1SDR
SDTanSDSDRSDSDR
P ππ
where x is any point on the grid between T1 to A or between T2 to B.
Once P3 is calculated, the separation distance that will satisfy the equation P1 * P2 * P3 = 0.0333 (for an MTBF of less than once in 30 years) can be determined.
Using this formulation, ICF calculated the line separation distance for each county in eastern and southern Wyoming (see Table 4‐1).
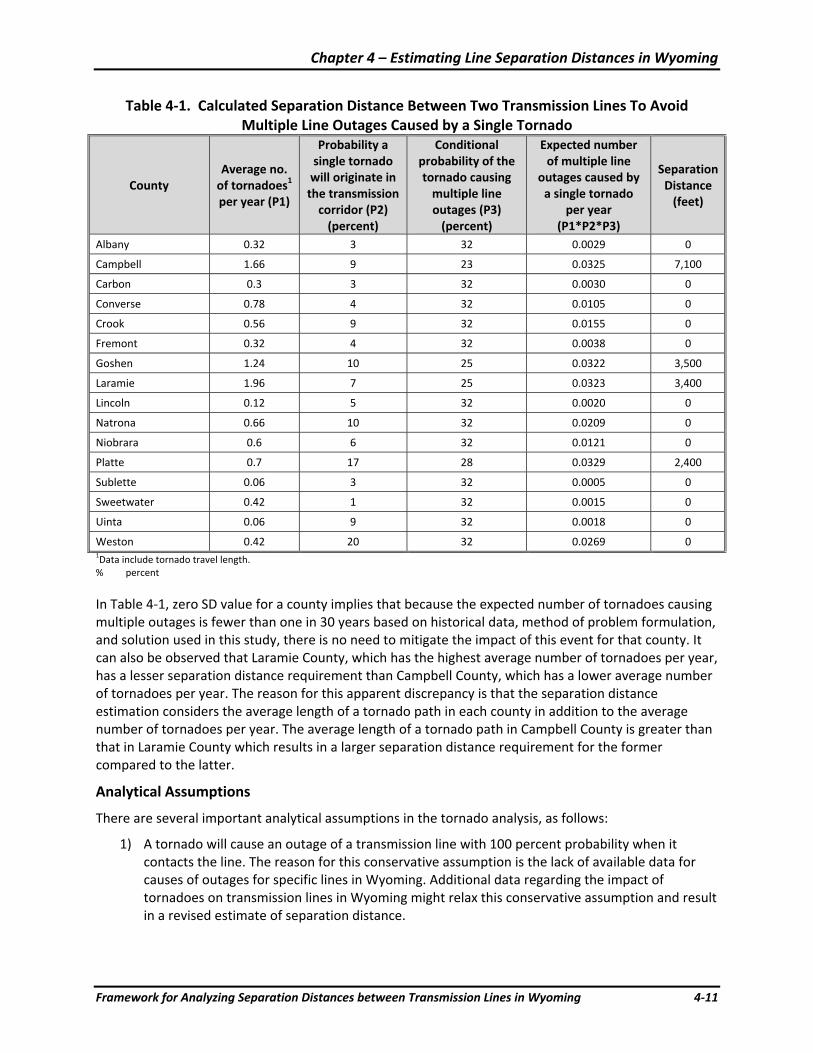
Chapter 4 – Estimating Line Separation Distances in Wyoming
Framework for Analyzing Separation Distances between Transmission Lines in Wyoming 4‐11
Table 4‐1. Calculated Separation Distance Between Two Transmission Lines To Avoid Multiple Line Outages Caused by a Single Tornado
County Average no. of tornadoes1 per year (P1)
Probability a single tornado will originate in the transmission corridor (P2) (percent)
Conditional probability of the tornado causing multiple line outages (P3) (percent)
Expected number of multiple line
outages caused by a single tornado
per year (P1*P2*P3)
Separation Distance (feet)
Albany 0.32 3 32 0.0029 0
Campbell 1.66 9 23 0.0325 7,100
Carbon 0.3 3 32 0.0030 0
Converse 0.78 4 32 0.0105 0
Crook 0.56 9 32 0.0155 0
Fremont 0.32 4 32 0.0038 0
Goshen 1.24 10 25 0.0322 3,500
Laramie 1.96 7 25 0.0323 3,400
Lincoln 0.12 5 32 0.0020 0
Natrona 0.66 10 32 0.0209 0
Niobrara 0.6 6 32 0.0121 0
Platte 0.7 17 28 0.0329 2,400
Sublette 0.06 3 32 0.0005 0
Sweetwater 0.42 1 32 0.0015 0
Uinta 0.06 9 32 0.0018 0
Weston 0.42 20 32 0.0269 0 1Data include tornado travel length. % percent
In Table 4‐1, zero SD value for a county implies that because the expected number of tornadoes causing multiple outages is fewer than one in 30 years based on historical data, method of problem formulation, and solution used in this study, there is no need to mitigate the impact of this event for that county. It can also be observed that Laramie County, which has the highest average number of tornadoes per year, has a lesser separation distance requirement than Campbell County, which has a lower average number of tornadoes per year. The reason for this apparent discrepancy is that the separation distance estimation considers the average length of a tornado path in each county in addition to the average number of tornadoes per year. The average length of a tornado path in Campbell County is greater than that in Laramie County which results in a larger separation distance requirement for the former compared to the latter.
Analytical Assumptions
There are several important analytical assumptions in the tornado analysis, as follows:
1) A tornado will cause an outage of a transmission line with 100 percent probability when it contacts the line. The reason for this conservative assumption is the lack of available data for causes of outages for specific lines in Wyoming. Additional data regarding the impact of tornadoes on transmission lines in Wyoming might relax this conservative assumption and result in a revised estimate of separation distance.
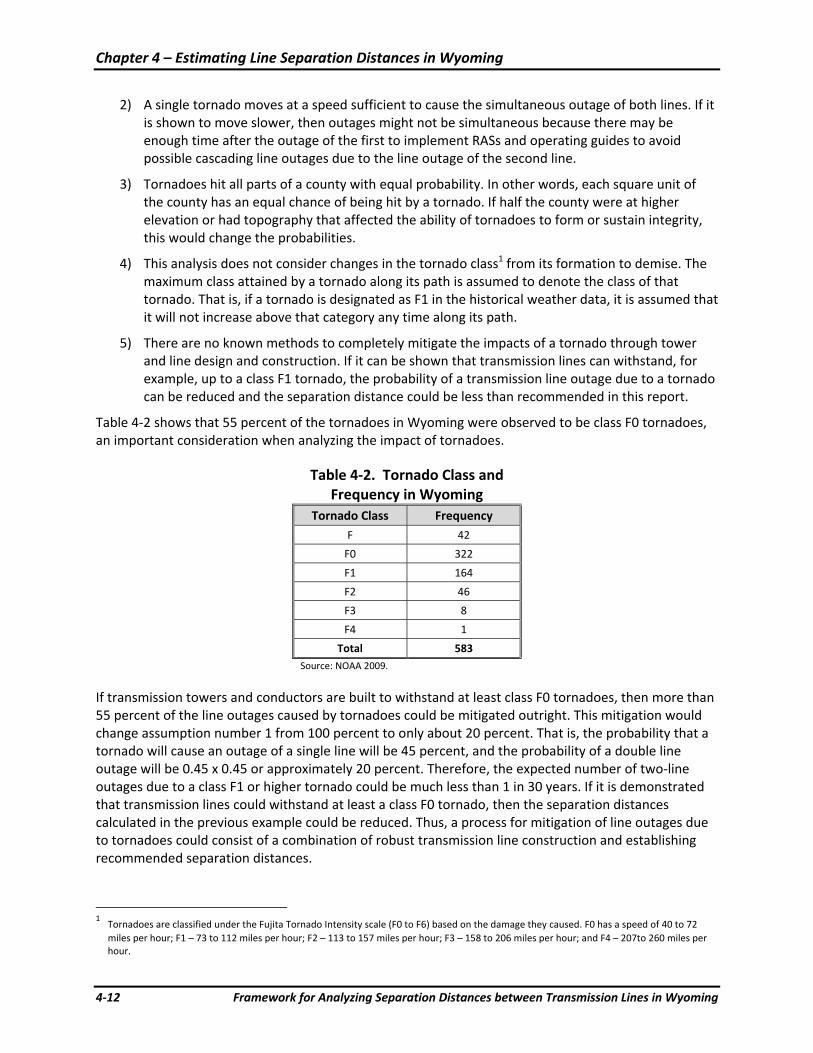
Chapter 4 – Estimating Line Separation Distances in Wyoming
4‐12 Framework for Analyzing Separation Distances between Transmission Lines in Wyoming
2) A single tornado moves at a speed sufficient to cause the simultaneous outage of both lines. If it is shown to move slower, then outages might not be simultaneous because there may be enough time after the outage of the first to implement RASs and operating guides to avoid possible cascading line outages due to the line outage of the second line.
3) Tornadoes hit all parts of a county with equal probability. In other words, each square unit of the county has an equal chance of being hit by a tornado. If half the county were at higher elevation or had topography that affected the ability of tornadoes to form or sustain integrity, this would change the probabilities.
4) This analysis does not consider changes in the tornado class1 from its formation to demise. The maximum class attained by a tornado along its path is assumed to denote the class of that tornado. That is, if a tornado is designated as F1 in the historical weather data, it is assumed that it will not increase above that category any time along its path.
5) There are no known methods to completely mitigate the impacts of a tornado through tower and line design and construction. If it can be shown that transmission lines can withstand, for example, up to a class F1 tornado, the probability of a transmission line outage due to a tornado can be reduced and the separation distance could be less than recommended in this report.
Table 4‐2 shows that 55 percent of the tornadoes in Wyoming were observed to be class F0 tornadoes, an important consideration when analyzing the impact of tornadoes.
Table 4‐2. Tornado Class and Frequency in Wyoming
Tornado Class Frequency F 42
F0 322
F1 164
F2 46
F3 8
F4 1
Total 583 Source: NOAA 2009.
If transmission towers and conductors are built to withstand at least class F0 tornadoes, then more than 55 percent of the line outages caused by tornadoes could be mitigated outright. This mitigation would change assumption number 1 from 100 percent to only about 20 percent. That is, the probability that a tornado will cause an outage of a single line will be 45 percent, and the probability of a double line outage will be 0.45 x 0.45 or approximately 20 percent. Therefore, the expected number of two‐line outages due to a class F1 or higher tornado could be much less than 1 in 30 years. If it is demonstrated that transmission lines could withstand at least a class F0 tornado, then the separation distances calculated in the previous example could be reduced. Thus, a process for mitigation of line outages due to tornadoes could consist of a combination of robust transmission line construction and establishing recommended separation distances.
1 Tornadoes are classified under the Fujita Tornado Intensity scale (F0 to F6) based on the damage they caused. F0 has a speed of 40 to 72
miles per hour; F1 – 73 to 112 miles per hour; F2 – 113 to 157 miles per hour; F3 – 158 to 206 miles per hour; and F4 – 207to 260 miles per hour.
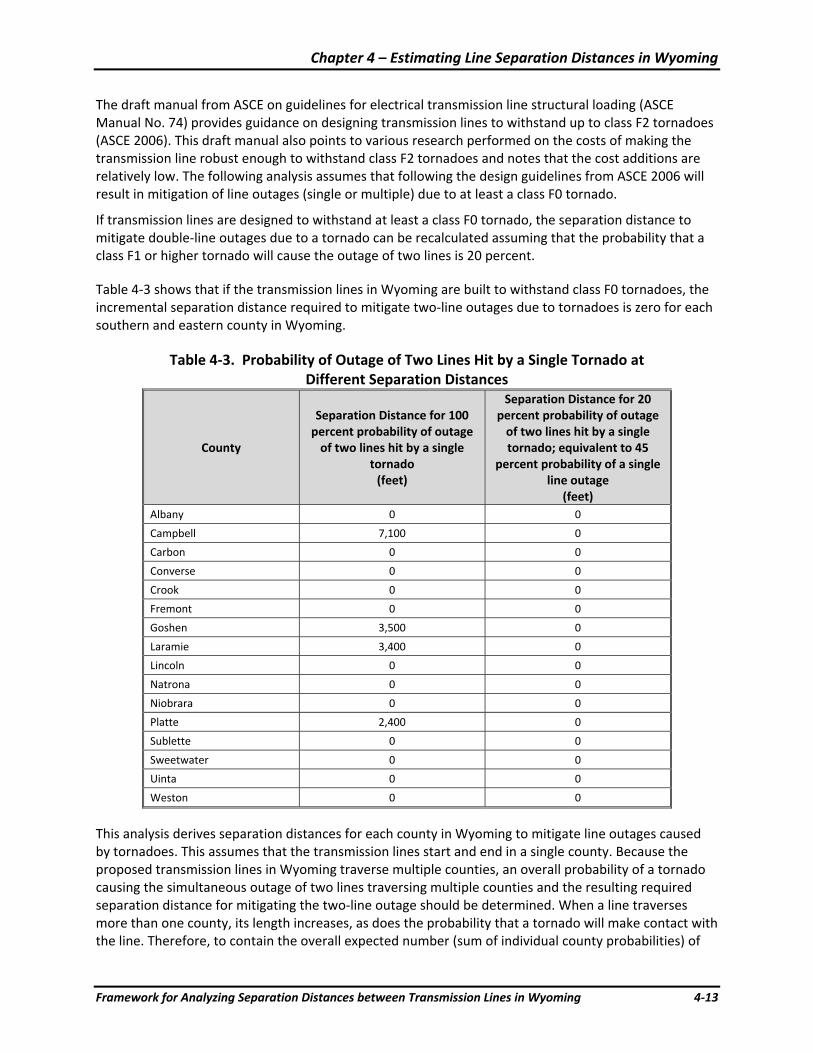
Chapter 4 – Estimating Line Separation Distances in Wyoming
Framework for Analyzing Separation Distances between Transmission Lines in Wyoming 4‐13
The draft manual from ASCE on guidelines for electrical transmission line structural loading (ASCE Manual No. 74) provides guidance on designing transmission lines to withstand up to class F2 tornadoes (ASCE 2006). This draft manual also points to various research performed on the costs of making the transmission line robust enough to withstand class F2 tornadoes and notes that the cost additions are relatively low. The following analysis assumes that following the design guidelines from ASCE 2006 will result in mitigation of line outages (single or multiple) due to at least a class F0 tornado.
If transmission lines are designed to withstand at least a class F0 tornado, the separation distance to mitigate double‐line outages due to a tornado can be recalculated assuming that the probability that a class F1 or higher tornado will cause the outage of two lines is 20 percent.
Table 4‐3 shows that if the transmission lines in Wyoming are built to withstand class F0 tornadoes, the incremental separation distance required to mitigate two‐line outages due to tornadoes is zero for each southern and eastern county in Wyoming.
Table 4‐3. Probability of Outage of Two Lines Hit by a Single Tornado at Different Separation Distances
County
Separation Distance for 100 percent probability of outage of two lines hit by a single
tornado (feet)
Separation Distance for 20 percent probability of outage of two lines hit by a single tornado; equivalent to 45
percent probability of a single line outage
(feet) Albany 0 0
Campbell 7,100 0
Carbon 0 0
Converse 0 0
Crook 0 0
Fremont 0 0
Goshen 3,500 0
Laramie 3,400 0
Lincoln 0 0
Natrona 0 0
Niobrara 0 0
Platte 2,400 0
Sublette 0 0
Sweetwater 0 0
Uinta 0 0
Weston 0 0
This analysis derives separation distances for each county in Wyoming to mitigate line outages caused by tornadoes. This assumes that the transmission lines start and end in a single county. Because the proposed transmission lines in Wyoming traverse multiple counties, an overall probability of a tornado causing the simultaneous outage of two lines traversing multiple counties and the resulting required separation distance for mitigating the two‐line outage should be determined. When a line traverses more than one county, its length increases, as does the probability that a tornado will make contact with the line. Therefore, to contain the overall expected number (sum of individual county probabilities) of
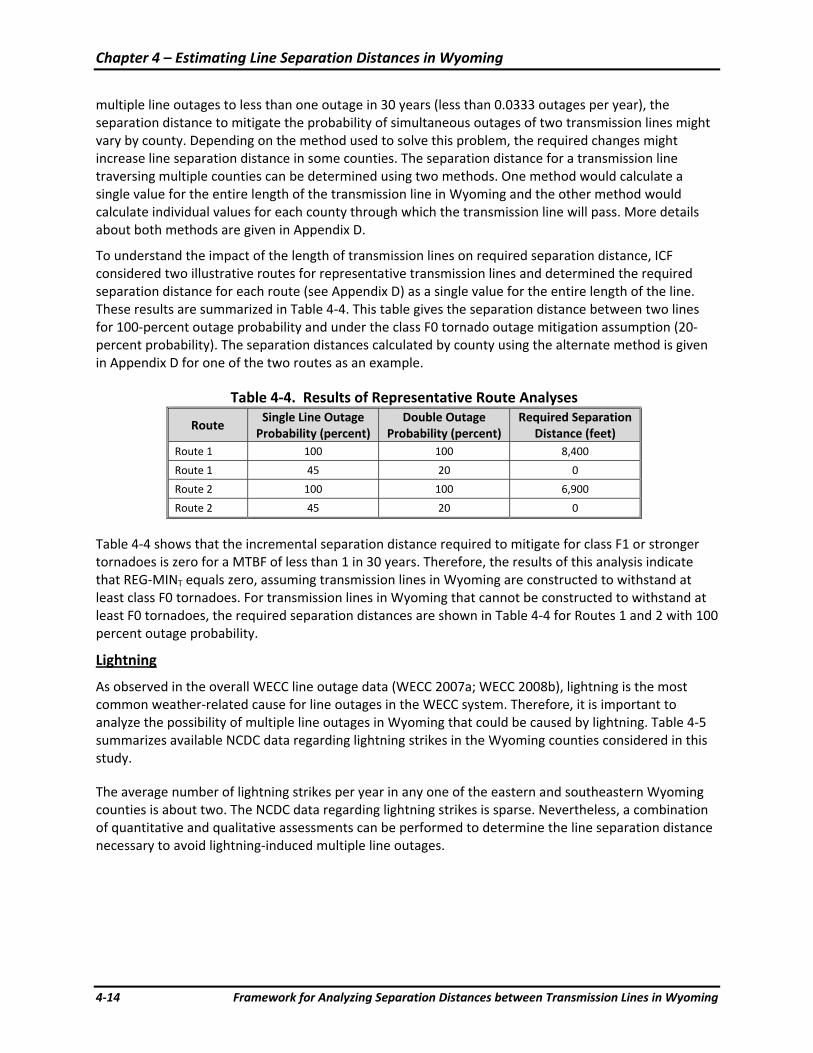
Chapter 4 – Estimating Line Separation Distances in Wyoming
4‐14 Framework for Analyzing Separation Distances between Transmission Lines in Wyoming
multiple line outages to less than one outage in 30 years (less than 0.0333 outages per year), the separation distance to mitigate the probability of simultaneous outages of two transmission lines might vary by county. Depending on the method used to solve this problem, the required changes might increase line separation distance in some counties. The separation distance for a transmission line traversing multiple counties can be determined using two methods. One method would calculate a single value for the entire length of the transmission line in Wyoming and the other method would calculate individual values for each county through which the transmission line will pass. More details about both methods are given in Appendix D.
To understand the impact of the length of transmission lines on required separation distance, ICF considered two illustrative routes for representative transmission lines and determined the required separation distance for each route (see Appendix D) as a single value for the entire length of the line. These results are summarized in Table 4‐4. This table gives the separation distance between two lines for 100‐percent outage probability and under the class F0 tornado outage mitigation assumption (20‐percent probability). The separation distances calculated by county using the alternate method is given in Appendix D for one of the two routes as an example.
Table 4‐4. Results of Representative Route Analyses
Route Single Line Outage Probability (percent)
Double Outage Probability (percent)
Required Separation Distance (feet)
Route 1 100 100 8,400
Route 1 45 20 0
Route 2 100 100 6,900
Route 2 45 20 0
Table 4‐4 shows that the incremental separation distance required to mitigate for class F1 or stronger tornadoes is zero for a MTBF of less than 1 in 30 years. Therefore, the results of this analysis indicate that REG‐MINT equals zero, assuming transmission lines in Wyoming are constructed to withstand at least class F0 tornadoes. For transmission lines in Wyoming that cannot be constructed to withstand at least F0 tornadoes, the required separation distances are shown in Table 4‐4 for Routes 1 and 2 with 100 percent outage probability.
Lightning
As observed in the overall WECC line outage data (WECC 2007a; WECC 2008b), lightning is the most common weather‐related cause for line outages in the WECC system. Therefore, it is important to analyze the possibility of multiple line outages in Wyoming that could be caused by lightning. Table 4‐5 summarizes available NCDC data regarding lightning strikes in the Wyoming counties considered in this study.
The average number of lightning strikes per year in any one of the eastern and southeastern Wyoming counties is about two. The NCDC data regarding lightning strikes is sparse. Nevertheless, a combination of quantitative and qualitative assessments can be performed to determine the line separation distance necessary to avoid lightning‐induced multiple line outages.
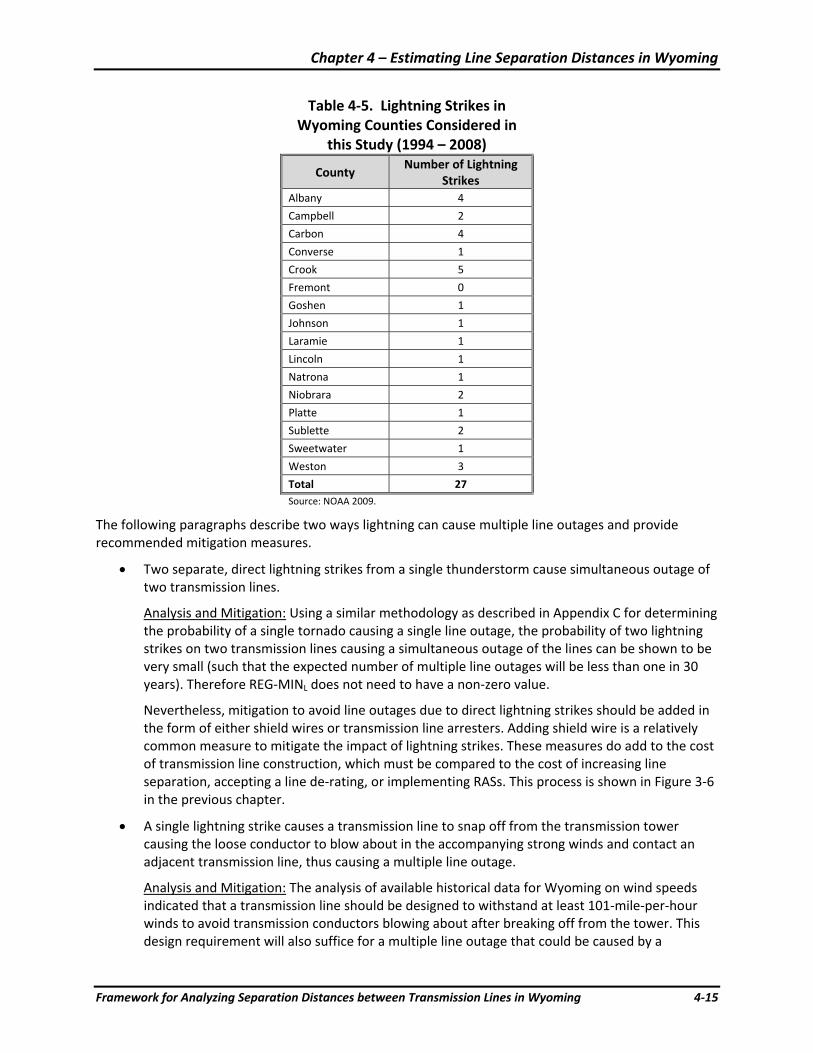
Chapter 4 – Estimating Line Separation Distances in Wyoming
Framework for Analyzing Separation Distances between Transmission Lines in Wyoming 4‐15
Table 4‐5. Lightning Strikes in Wyoming Counties Considered in
this Study (1994 – 2008)
County Number of Lightning
Strikes Albany 4
Campbell 2
Carbon 4
Converse 1
Crook 5
Fremont 0
Goshen 1
Johnson 1
Laramie 1
Lincoln 1
Natrona 1
Niobrara 2
Platte 1
Sublette 2
Sweetwater 1
Weston 3
Total 27 Source: NOAA 2009.
The following paragraphs describe two ways lightning can cause multiple line outages and provide recommended mitigation measures.
• Two separate, direct lightning strikes from a single thunderstorm cause simultaneous outage of two transmission lines.
Analysis and Mitigation: Using a similar methodology as described in Appendix C for determining the probability of a single tornado causing a single line outage, the probability of two lightning strikes on two transmission lines causing a simultaneous outage of the lines can be shown to be very small (such that the expected number of multiple line outages will be less than one in 30 years). Therefore REG‐MINL does not need to have a non‐zero value.
Nevertheless, mitigation to avoid line outages due to direct lightning strikes should be added in the form of either shield wires or transmission line arresters. Adding shield wire is a relatively common measure to mitigate the impact of lightning strikes. These measures do add to the cost of transmission line construction, which must be compared to the cost of increasing line separation, accepting a line de‐rating, or implementing RASs. This process is shown in Figure 3‐6 in the previous chapter.
• A single lightning strike causes a transmission line to snap off from the transmission tower causing the loose conductor to blow about in the accompanying strong winds and contact an adjacent transmission line, thus causing a multiple line outage.
Analysis and Mitigation: The analysis of available historical data for Wyoming on wind speeds indicated that a transmission line should be designed to withstand at least 101‐mile‐per‐hour winds to avoid transmission conductors blowing about after breaking off from the tower. This design requirement will also suffice for a multiple line outage that could be caused by a
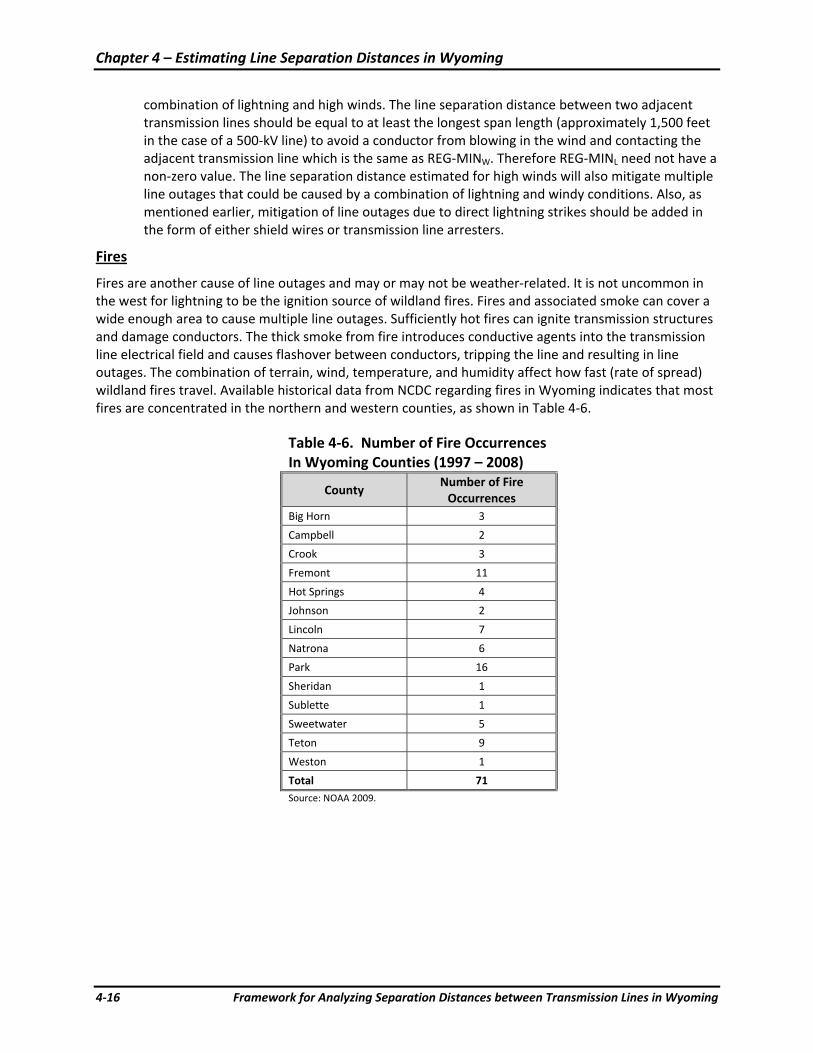
Chapter 4 – Estimating Line Separation Distances in Wyoming
4‐16 Framework for Analyzing Separation Distances between Transmission Lines in Wyoming
combination of lightning and high winds. The line separation distance between two adjacent transmission lines should be equal to at least the longest span length (approximately 1,500 feet in the case of a 500‐kV line) to avoid a conductor from blowing in the wind and contacting the adjacent transmission line which is the same as REG‐MINW. Therefore REG‐MINL need not have a non‐zero value. The line separation distance estimated for high winds will also mitigate multiple line outages that could be caused by a combination of lightning and windy conditions. Also, as mentioned earlier, mitigation of line outages due to direct lightning strikes should be added in the form of either shield wires or transmission line arresters.
Fires
Fires are another cause of line outages and may or may not be weather‐related. It is not uncommon in the west for lightning to be the ignition source of wildland fires. Fires and associated smoke can cover a wide enough area to cause multiple line outages. Sufficiently hot fires can ignite transmission structures and damage conductors. The thick smoke from fire introduces conductive agents into the transmission line electrical field and causes flashover between conductors, tripping the line and resulting in line outages. The combination of terrain, wind, temperature, and humidity affect how fast (rate of spread) wildland fires travel. Available historical data from NCDC regarding fires in Wyoming indicates that most fires are concentrated in the northern and western counties, as shown in Table 4‐6.
Table 4‐6. Number of Fire Occurrences In Wyoming Counties (1997 – 2008)
County Number of Fire Occurrences
Big Horn 3
Campbell 2
Crook 3
Fremont 11
Hot Springs 4
Johnson 2
Lincoln 7
Natrona 6
Park 16
Sheridan 1
Sublette 1
Sweetwater 5
Teton 9
Weston 1
Total 71 Source: NOAA 2009.
Chapter 4 – Estimating Line Separation Distances in Wyoming
Framework for Analyzing Separation Distances between Transmission Lines in Wyoming 4‐17
The data in Table 4‐6 are for the 12 years from 1997 through 2008, and although some fires occur in southern and eastern Wyoming counties, the frequency of fires in these counties is relatively low (a total of 20 out of 71), with an average of about two fires per year. From the description of causes of the fires provided by NCDC, lightning appears to be the most frequent cause in the eastern and southern counties, especially in Crook County. Mitigating the risk of fire or smoke causing outage of multiple transmission lines includes the following:
• ROW maintenance to serve as fire break (e.g., managing fuels to slow or stop fire spread). • Operational procedures (e.g., quickly identifying and reporting fires to facilitate rapid fire
suppression and reduction of power transfer levels to avoid cascading outages). • Increased separation between adjacent transmission lines to allow sufficient time to activate
fire suppression activities and reduce transfer levels. • Separation of parallel transmission lines by landscape features which can slow or stop the fire
rate of spread (e.g., rivers, ridge lines, etc.).
Key issues to consider in analyzing measure to mitigate fire‐related outages include the area, rate, and direction of spread of smoke related to the fire. Predicting the direction of smoke and the possibility of smoke causing outages of multiple lines is difficult with limited data, therefore the preferred mitigation measures include installing sufficient fire breaks and early detection (e.g., electronic or manual monitoring). Costs for mitigating fire‐related line outages include the cost of additional ROW and/or ROW maintenance to serve as fire breaks and the cost of installing and maintaining systems to detect fires early. Based on the probability of fires in the terrain the transmission line will traverse, the need for these mitigation measures can be evaluated.
As an illustration of the methodology to determine line separation distances to mitigate outages of multiple lines due to fires, consider the following example:
Given a 1,200‐feet‐per‐minute rate of spread for a fire over dry, short grass with high winds (Pyne et al. 1996), the line separation distance to avoid two single line outages within 10 minutes can be calculated as
1,200 × 10 minutes = 12,000 feet (assuming a double line outage caused by the same event within 10 minutes can be classified as a simultaneous multiple line outage).
This calculation assumes the following:
1) There is a 100‐percent probability of a fire (or smoke from a fire) to cause more than one line outage within 10 minutes.
2) Smoke from the fire travels at a constant rate of 1,200‐feet‐per‐minute in a direction that will cause multiple line outages.
3) There is enough smoke from the fire for both lines to experience outages due to arcing.
Changing these assumptions will likely change the separation distance requirement. Historical fire data is sparse – especially characteristics of smoke due to fires. Because of the uncertain nature of fires and the uncertainty of the direction and quantity of smoke from the fire, developing a robust and defendable mathematical model to estimate required line separation distances for mitigating outages of lines caused by fires is not practical for this study. Therefore, while the separation distance of 12,000 feet determined above is intended as a conservative example, it is not defendable given the sparse amount of historical information on fires in Wyoming. A more practical alternative to calculating a defendable separation distance for mitigating the possibility of outages of multiple lines due to fires might be to install fire breaks and a system to detect fires early, use natural topographic features as
Chapter 4 – Estimating Line Separation Distances in Wyoming
4‐18 Framework for Analyzing Separation Distances between Transmission Lines in Wyoming
natural fire breaks when routing adjacent proposed transmission lines, and implement appropriate operating guidelines, such as de‐rating of lines when a fire is observed to avoid cascading line outages.
For purposes of this analysis, ICF assumed that fire breaks and early detection are installed (in regions where the probability of fires is high) and operating guidelines are implemented as needed to prevent fire and smoke from causing outages of multiple lines. This assumed mitigation negates the need to increase the line separation distance to avoid fire‐related line outages. Therefore REG‐MINFIRE will be zero in this example.
4.2 Recommended Range for Minimum Line Separation Distance Based on the analyses of the impact of various weather‐related causes for line outages in Wyoming, the following conclusions were reached regarding the incremental separation distances needed to mitigate for these causes.
Recall,
REG‐MIN = Max (REG‐MINW , REG‐MINSTORM , REG‐MINT , REG‐MINL , REG‐MINFIRE , REG‐MINOTHER)
From the analyses,
REG‐MINW = 1,240 feet (in this example, or (one span length‐260 feet) in general).
REG‐MINSTORM = 0.
REG‐MINT = 0.
REG‐MINL = 0.
REG‐MINFIRE = 0.
REG‐MINOTHER = 0.
Therefore,
REG‐MIN = Max (1240,0,0,0,0,0) = 1,240 feet.
Figure 4‐6 summarizes the results for Wyoming from the analyses in the previous sections.
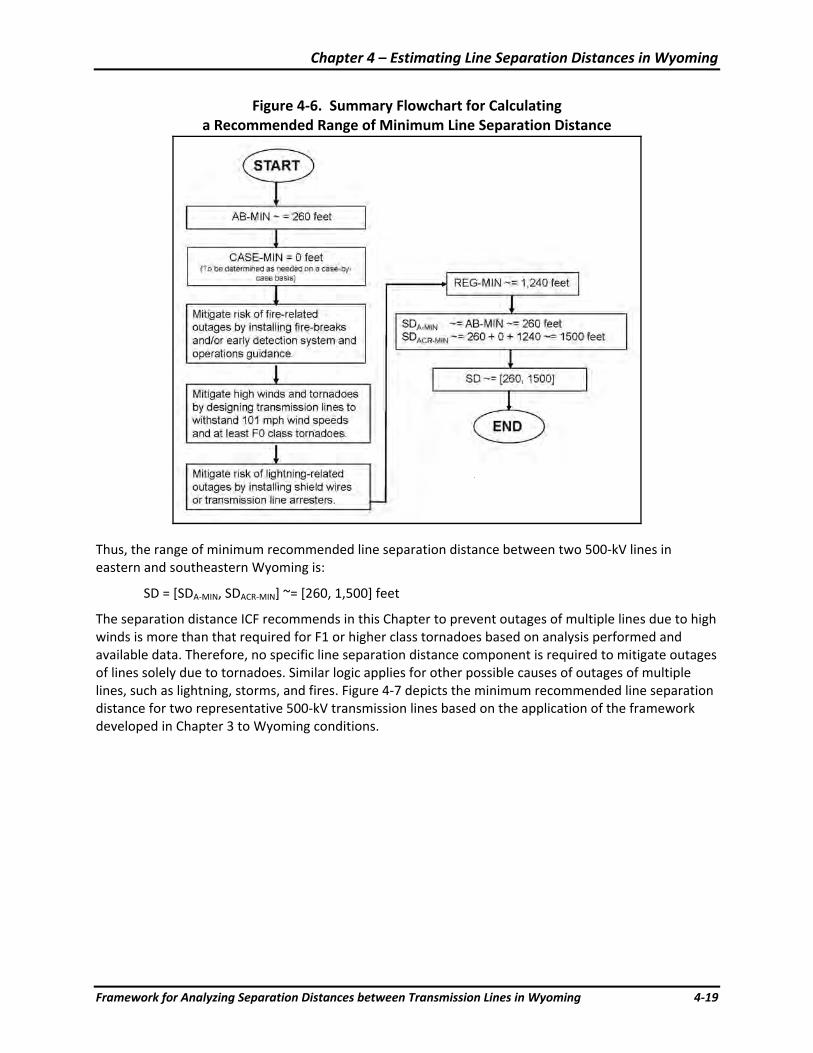
Chapter 4 – Estimating Line Separation Distances in Wyoming
Framework for Analyzing Separation Distances between Transmission Lines in Wyoming 4‐19
Figure 4‐6. Summary Flowchart for Calculating a Recommended Range of Minimum Line Separation Distance
Thus, the range of minimum recommended line separation distance between two 500‐kV lines in eastern and southeastern Wyoming is:
SD = [SDA‐MIN, SDACR‐MIN] ~= [260, 1,500] feet
The separation distance ICF recommends in this Chapter to prevent outages of multiple lines due to high winds is more than that required for F1 or higher class tornadoes based on analysis performed and available data. Therefore, no specific line separation distance component is required to mitigate outages of lines solely due to tornadoes. Similar logic applies for other possible causes of outages of multiple lines, such as lightning, storms, and fires. Figure 4‐7 depicts the minimum recommended line separation distance for two representative 500‐kV transmission lines based on the application of the framework developed in Chapter 3 to Wyoming conditions.
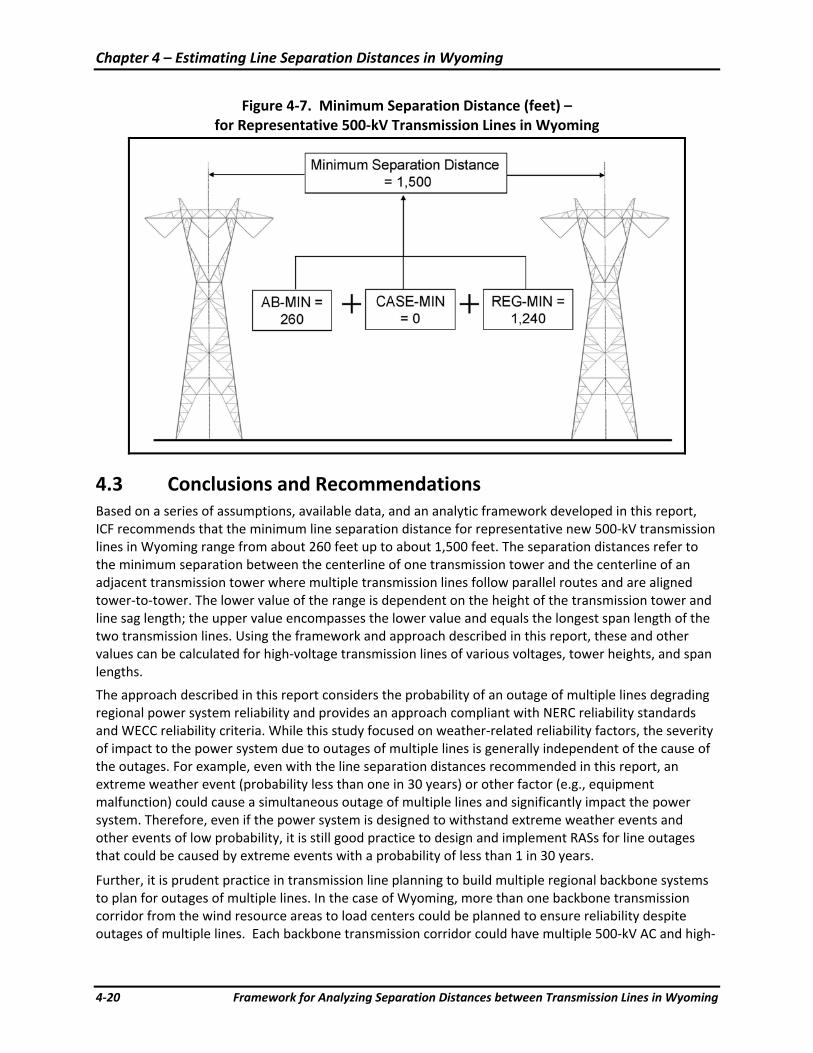
Chapter 4 – Estimating Line Separation Distances in Wyoming
4‐20 Framework for Analyzing Separation Distances between Transmission Lines in Wyoming
Figure 4‐7. Minimum Separation Distance (feet) – for Representative 500‐kV Transmission Lines in Wyoming
4.3 Conclusions and Recommendations Based on a series of assumptions, available data, and an analytic framework developed in this report, ICF recommends that the minimum line separation distance for representative new 500‐kV transmission lines in Wyoming range from about 260 feet up to about 1,500 feet. The separation distances refer to the minimum separation between the centerline of one transmission tower and the centerline of an adjacent transmission tower where multiple transmission lines follow parallel routes and are aligned tower‐to‐tower. The lower value of the range is dependent on the height of the transmission tower and line sag length; the upper value encompasses the lower value and equals the longest span length of the two transmission lines. Using the framework and approach described in this report, these and other values can be calculated for high‐voltage transmission lines of various voltages, tower heights, and span lengths.
The approach described in this report considers the probability of an outage of multiple lines degrading regional power system reliability and provides an approach compliant with NERC reliability standards and WECC reliability criteria. While this study focused on weather‐related reliability factors, the severity of impact to the power system due to outages of multiple lines is generally independent of the cause of the outages. For example, even with the line separation distances recommended in this report, an extreme weather event (probability less than one in 30 years) or other factor (e.g., equipment malfunction) could cause a simultaneous outage of multiple lines and significantly impact the power system. Therefore, even if the power system is designed to withstand extreme weather events and other events of low probability, it is still good practice to design and implement RASs for line outages that could be caused by extreme events with a probability of less than 1 in 30 years.
Further, it is prudent practice in transmission line planning to build multiple regional backbone systems to plan for outages of multiple lines. In the case of Wyoming, more than one backbone transmission corridor from the wind resource areas to load centers could be planned to ensure reliability despite outages of multiple lines. Each backbone transmission corridor could have multiple 500‐kV AC and high‐
Chapter 4 – Estimating Line Separation Distances in Wyoming
Framework for Analyzing Separation Distances between Transmission Lines in Wyoming 4‐21
voltage DC lines and each corridor could be separated by tens if not hundreds of miles to avoid outages of multiple transmission lines due to wide‐spread weather‐related factors that could cause significant damage and impair power system reliability. Line separation within the backbone corridors could be minimized based on the approaches identified in this study.
Limitations and Assumptions
While the recommended values for minimum line separation distance are based on logical mathematical formulations, robust methodologies and detailed analyses of available data, these values should only be used in the context of the framework, limitations, and assumptions described in this report and summarized here. Moreover, several factors could alter ICF’s conclusions and recommendations. First, although requested, sensitive historical outage data for specific transmission lines in Wyoming were not available and thus limited ICF’s analysis. Second, the probability of a tornado causing an outage upon contact with a transmission line is unknown, as is the certainty with which transmission lines can be designed to withstand certain classes of tornadoes. Third, the lack of historical quantitative data regarding the characteristics of fires and associated smoke in Wyoming prevented a rigorous analysis of the probability of fire/smoke causing simultaneous outages of multiple lines.
ICF performed rigorous mathematical modeling to determine the line separation distance required to mitigate the impact of tornadoes on transmission lines. This analysis assumed line separation was the only mitigation available to avoid tornadoes causing outages of multiple transmission lines. However, during the course of this study, ICF reviewed the draft ASCE Manual #74 (ASCE 2006) design criteria to address tornadoes and spoke with transmission engineers experienced with tornadoes. If the draft ASCE Manual #74 design criteria remain intact when it becomes final, we assume they will provide an additional mitigation measure for tornadoes.
The relatively rich historical data regarding tornado characteristics in Wyoming afforded a rigorous mathematical treatment of the probability of a tornado causing an outage of multiple lines. The lack of comparable data for other outage causes such as lightning and fires, precluded comparable mathematical analyses.
Another limitation to the minimum separation distances estimated in this study are that they do not apply to underground transmission lines, because weather conditions that could cause aboveground line outages do not usually cause underground line outages. Moreover, line separation distance requirements typically do not apply to the five spans of a transmission line proximate to a substation.
Mitigation
The recommended values for minimum line separation assume mitigation to reduce the probability of the following factors causing simultaneous outages of multiple lines:
• Installing either a shield wire or transmission line arresters to mitigate lightning strikes
• Maintaining fire breaks, installing an early fire detection system, and implementing operational procedures to avoid cascading outages due to fire/smoke
• Designing transmission lines to withstand wind speeds of at least 101 miles per hour
• Designing transmission lines to withstand at least F0 class tornadoes
• Designing transmission lines to comply with applicable NESC and AESC extreme wind and ice loading conditions
If transmission lines cannot be built with the mitigation identified in this report, then, depending on regional and project‐specific conditions, the separation distances recommended in this report to avoid outages of multiple lines may increase and in some cases, could be measured in thousands of feet or multiple miles.
Chapter 4 – Estimating Line Separation Distances in Wyoming
4‐22 Framework for Analyzing Separation Distances between Transmission Lines in Wyoming
Reliability Standards and Criteria
The NERC and WECC are the responsible authorities for regulating transfer capacity and reliability of high voltage transmission lines in Wyoming and other western states within the WECC system. The recommended values in this report do not absolve transmission developers from complying with NERC reliability standards and WECC’s path rating process and associated reliability criteria. Moreover, the recommended separation distances and framework described in this report do not assure transmission developers of a particular path rating. Instead, this study presents a possible approach and recommendations for achieving compliance with NERC and WECC reliability requirements while minimizing separation distance between transmission lines.
Questions and Considerations Outside the Scope of This Study
The recommended minimum range of transmission line separation distances in this report is only one component of the equation for determining separation distance between transmission lines in Wyoming. Once the minimum range of line separation distances to meet power system reliability criteria is estimated, the issue of maximum separation distance between two transmission lines becomes a function of cost, land use and environmental considerations, and future need for additional transmission lines. The framework developed in this report can serve as a basis for further discussion and analysis of these other components.
Quantifying the additional cost to fortify transmission lines to withstand tornadoes and other factors, while outside the scope of this study, should be performed and compared to the costs of alternatives such as increasing the separation distance or accepting a reduced line rating from WECC. Other alternatives to consider are the effects of increasing or decreasing separation distance on costs, potential environmental and land use impacts, line rating, and time required to permit and build the line. A process for determining the least cost alternative is depicted in Figure 3‐6 and is part of the overall framework for determining the appropriate line separation distance.
This study does not attempt to evaluate the consequences of an outage of multiple transmission lines; however, the study does assume, in estimating line separation distance, that an outage of multiple lines will result in system consequences that will violate NERC reliability standards and WECC reliability criteria. One could postulate that because the proposed transmission lines in Wyoming are likely to transfer wind power to a large extent, utilization of these lines will generally be inversely proportional to the system peak demand; therefore, the consequences of an outage of multiple lines during off‐peak hours (for example, during nighttime when the utilization would be high) may not cause a sufficiently adverse impact on the system to violate NERC reliability standards or WECC reliability criteria. However, this argument cannot be supported or dismissed without detailed power system reliability analyses that are outside the scope of this study.
There are multiple options for extending this study effort. One option is to weigh the effects of different future energy‐supply scenarios on line separation distances and the societal considerations involved. Another question is whether the impact of complying with reliability rules, although necessary, are at odds with the development of renewable energy in Wyoming, and more broadly, whether they are compatible with a goal of meeting a federally‐mandated Renewable Energy Standard at a national level. Alternatively, should environmental regulations be relaxed and/or should Section 368 energy corridors be broadened (in their extent and to include non‐federal land) to provide for maximum reliability (in terms of line separation) and meet a federal Renewable Energy Standard? Yet another extension to this study would be to determine the maximum range of line separation distances considering environmental and land use factors. Considering the regional, and potentially national, importance of Wyoming’s wind‐generation capacity, ICF recommends these and other questions on line separation issues be addressed in follow‐on study efforts.
Chapter 5 – References
Framework for Analyzing Separation Distances between Transmission Lines in Wyoming 5‐1
CHAPTER 5 – REFERENCES American Society of Civil Engineers (ASCE). 2006. ASCE Manual No. 74, Guidelines for Electrical
Transmission Line Structural Loading. Peer Review Draft, July 14, 2006.
Arizona Public Service Company. 2006. Performance Category Upgrade Request for Palo Verde Hub to North Gila Lines, Seven Step Process Document, August 2, 2006.
Bailey, R.G. 1995. Descriptions of the ecoregions of the United States. (2nd ed. rev. and expanded). USDA Forest Service, Washington, DC. Misc. Publ. No. 1391.
Bascom, E.C., III, Daconti, J.R. , Douglass, D.A., DioGioia, A.M., Grant, I.S., Mozer, J.D., Stewart, J.R., Williams, J.A. 2006. Section 14, Transmission Systems. Standards Handbook for Electrical Engineers. The McGraw‐Hill Companies. Available online: http://www.scribd.com/doc/7221453/0071490191ar014.
Bureau of Indian Affairs. 2000. Kates Basin Fatality Report August 11, 2000. Appendix 3 Fire Behavior Analysis.
Bureau of Land Management. 2009. Mineral Occurrence and Development Potential Report for the Buffalo Field Office. Department of the Interior. Available online: http://www.blm.gov/wy/st/en/programs/Planning/rmps/buffalo/docs.html.
California Public Utilities Commission (PUC). 2001. Supplemental Environmental Impact Report, Los Banos to Gates Transmission Project, Section B – Description of Proposed Project and Alternatives, October 2001. Available online: http://www.cpuc.ca.gov/Environment/info/aspen/path15/Draft%20SEIR.html.
California PUC and Bureau of Land Management. 2006. Devers ‐ Palo Verde No. 2 Transmission Line Project Draft EIR/EIS, Page B‐44 ‐ Description of the Proposed Project. Available online: http://www.cpuc.ca.gov/Environment/info/aspen/dpv2/toc‐deir.htm.
Department of Energy (DOE), Department of the Interior, and Department of Defense. 2003. Schultz Hanford Area Transmission Line Project, Final Environmental Impact Statement. DOE/EIS‐0325. Available online: http://www.efw.bpa.gov/environmental_services/Document_Library/Schultz_Hanford.
DOE, Department of the Interior Bureau of Land Management, Department of Agriculture, Forest Service, Department of Defense, and Department of the Interior Fish and Wildlife Service. 2008. Final Programmatic Environmental Impact Statement, Designation of Energy Corridors on Federal Lands in the 11 Western States (DOE/EIS‐0386). November 2008.
Digital‐Topo‐Maps.com. 2005. Wyoming County Map. Available online: http://county‐map.digital‐topo‐maps.com/wyoming.shtml. Accessed August 21, 2009.
Energy Information Administration (EIA). 2008a. Annual Coal Report for 2007: United States Department of Energy. Available online: http://www.eia.doe.gov/cneaf/coal/page/acr/acr_sum.html.
EIA. 2008b. U.S. Crude Oil, Natural Gas, and Natural Gas Liquids Reserves, 2007 Annual Report. Available online: http://www.eia.doe.gov/oil_gas/natural_gas/data_publications/crude_oil_natural_gas_ reserves/cr.html.
EIA. 2009a. State Renewable Electricity Profiles 2008, Released June 2009. Available online: http://www.eia.doe.gov/cneaf/solar.renewables/page/state_profiles/wyoming.pdf.
Chapter 5 – References
5‐2 Framework for Analyzing Separation Distances between Transmission Lines in Wyoming
EIA. 2009b. Annual Wyoming Crude Oil Proven Reserves. Available online: http://tonto.eia.doe.gov/dnav/pet/hist/rcrr01swy_1a.htm.
EIA. 2009c. Wyoming, State Energy Profiles. Available online: http://tonto.eia.doe.gov/state/state_energy_profiles.cfm?sid=WY.
ENSR Corporation and Sammons/Dutton, LLC. 2005. Task 3C Report for the Powder River Basin Coal Review Cumulative Social and Economic Effects: Casper, Wyo. Prepared for Bureau of Land Management, Casper Field Office.
Freme, Fred. 2007. U.S. Coal Supply and Demand 2007 Review: United States Energy Information Administration. Available online: http://www.eia.doe.gov/cneaf/coal/page/special/feature07.pdf.
General Electric Company. 1987. Transmission Line Reference Book, 345 kV and Above, 2nd Revised Edition. Palo Alto: Electric Power Research Institute.
Google Earth. 2009. ICF International Separation Distance Approximations for WECC 500‐kV Transmission Lines using Google Earth and WECC Powerflow Data. July 2009.
Marne, David J. 2007. National Electrical Safety Code 2007. New York: McGraw‐Hill. p. 293.
Michael Clayton and Associates. 1992. Western Regional Corridor Study. Prepared for Western Utility Group. Copyright 1992 Sierra Pacific Power Company.
National Interagency Coordination Center. 2009. Wildland Fire Summary and Statistics 2008.
National Interagency Fire Center. 2009. Available online: http://www.nifc.gov/fire_info/fire_stats.htm. Accessed August 15, 2009.
National Oceanic and Atmospheric Administration (NOAA). 2009. Weather Data. Available online: http://www.ncdc.noaa.gov.
North American Electric Reliability Corporation (NERC). 2008. Long Term Reliability Assessment 2008 – 2017. October 2008. Princeton, NJ. www.nerc.com.
NERC. 2009a. 2009 Summer Reliability Assessment. May 2009. Princeton, NJ. www.nerc.com.
NERC. 2009b. Reliability Standards for the Bulk Electric Systems of North America. May 2009. Available online: http://www.nerc.com/files/Reliability_Standards_Complete_Set_2009 May 20.pdf. Princeton, NJ. www.nerc.com.
NERC. 2009c. System Disturbance Reports for 1992‐2007. 1992‐2007. Available online: http://www.nerc.com/page.php?cid=5%7C66. www.nerc.com.
NREL. 2002. Wyoming Wind Power Resource Estimates Map. Available online: http://www.windpoweringamerica.gov/maps_template.asp?stateab=wy.
Office of the Governor of Wyoming. 2009. EPA Administrator Wraps up Two Day Tour of Wyoming Energy Production Sites. Available online: http://governor.wy.gov/press‐releases/epa‐administrator‐wraps‐up‐two‐day‐tour‐of‐wyoming‐energy‐production‐sites.html. Accessed July 24, 2009.
Power Systems Studies Committee. 1985. Corridor separation for the California‐Oregon Transmission Project. October 1985.
Pyne, S.J., P. L. Anderson, and R.D. Laven. 1996. Introduction to Wildland Fire, 2nd Edition. 808 Pages.
Chapter 5 – References
Framework for Analyzing Separation Distances between Transmission Lines in Wyoming 5‐3
San Diego Gas & Electric (SDG&E). 2006. Response to Data Request Number 1 on Sunrise Power Link Project (A.06‐08‐010), Submittal 2 of 3, October 31, 2006.
Southern California Edison Company. 1980. Statement on separation of EHV Transmission Circuits, March 1980.
Soutwest Area Transmission (SWAT) Common Corridor Task Force. 2009. White Paper on Structure Separation for Transmission Lines in Common Corridors. Final May 2009.
Western Area Power Administration (Western). 2009. Unpublished outage data for select Western transmission lines (115‐kV, 230‐kV, and 345‐kV) in Wyoming, 2007‐2009.
Western Electricity Coordinating Council (WECC). 2001. Reliability Performance Evaluation Work Group Phase I Probabilistic Based Reliability Criteria Evaluation of Exceptions List Facilities, February 2, 2001.
WECC. 2002. NERC/WECC Planning Standards and Minimum Operating Reliability Criteria. Definitions. Revised August 9, 2002.
WECC. 2007a. Reliability Performance Evaluation Work Group. First Annual Transmission Reliability Data Report, October 15, 2007.
WECC. 2007b. Transmission Reliability Database Task Force. General Cause Codes for Outages.
WECC. 2008a. TPL – (001 thru 004) – WECC – 1 CR ‐ System Performance Criteria. Effective date: April 18, 2008.
WECC. 2008b. WECC Line Siting and Rating Supporting Documents. TPL – (001 thru 004) – WECC – 1 – CR System Performance Criteria, Table W‐1, Page 50.
WECC. 2008c. Reliability Performance Evaluation Work Group. Second Annual WECC Transmission Reliability Data Report, October 15, 2008.
WECC. 2009a. About WECC. Available online: http://www.wecc.biz/about/Pages/default.aspx. Accessed August 10, 2009.
WECC. 2009b. WECC Powerflow data.
Western Governors’ Association and U.S. Department of Energy (DOE). 2009. Western Renewable Energy Zones Phase 1 Report. Mapping Concentrated, High Quality Resources to meet demand in Western Interconnection’s Distant Markets. http://www.westgov.org/wga/publicat/WREZ09.pdf June 2009.
Western Regional Climate Center. 2009. Climate of Wyoming. Available online: http://www.wrcc.dri.edu/narratives/WYOMING.htm.
Wolfram Mathematic Online Integrator. 2009. Solution for the integral problem. Available online: http://integrals.wolfram.com/.
Wyoming State Geological Survey (WSGS). 2009a. Wyoming Coal Fields. Available online: http://www.wsgs.uwyo.edu/coalweb/WyomingCoal/wyomingFields.aspx. Accessed July 24, 2009.
WSGS. 2009b. Location Map for Coalbed Methane Targets. Available online: http://www.wsgs.uwyo.edu/Topics/CBM/. Accessed July 24, 2009.
Chapter 5 – References
5‐4 Framework for Analyzing Separation Distances between Transmission Lines in Wyoming
WSGS Coalbed Natural Gas (CBNG) Group. 2009. Wyoming Coalbed Natural Gas. Available online: http://www.wsgs.uwyo.edu/WSGSgroups/CoalbedNaturalGas/Default.aspx. Accessed July 24, 2009.
Wyoming Infrastructure Authority (WIA). 2009. Map of the Current Projects Under Development. http://wyia.org/projects/ August 8, 2009.
Framework for Analyzing Separation Distances between Transmission Lines in Wyoming
Appendix A
Wyoming General Background Information

Appendix A – Wyoming General Background Information
Framework for Analyzing Separation Distances between Transmission Lines in Wyoming A‐1
APPENDIX A
A.1 Topography
Wyoming is part of four ecoregions, including the Great Plains, Intermountain Semidesert, Southern Rocky Mountains, and the Black Hills (Bailey 1995). As Bailey (1995) describes, the Great Plains region encompasses most of the eastern one‐third of Wyoming and is characterized by shortgrass/mixed‐grass prairie. Elevation in this region ranges from 3,200 feet near the northeastern border to 6,000 feet at the foot of the Front Range of the Rocky Mountains. The Intermountain Semidesert region includes valleys that range in elevation from 6,000 to 8,000 feet. Evaporation rates in this region are high and wind is a nearly constant element. The Southern Rocky Mountain region is composed of the major ranges of the Wyoming portion of the Rocky Mountains. More than surrounding states, the ranges of this province are widely separated by large intermountain basins. Valleys are typically semiarid, while annual precipitation in higher mountain ranges often exceeds 40 inches. The Black Hills region in northeast Wyoming consists of relatively low mountains ranging from 3,000 to 7,000 feet in elevation and receives 15 to 26 inches of annual precipitation. This region is split along the Wyoming and South Dakota state line.
Wyoming has the second highest mean elevation in the U.S. at 6,700 feet above sea level. Elevation ranges from 13,804 feet on the summit of Gannett Peak in the Wind River Mountain Range, to 3,125 feet in the Belle Fourche River valley.
There are several mountain ranges in Wyoming, including the Absaroka, Owl Creek, Gros Ventre, Wind River and Teton ranges in the northwest. The Big Horn Mountains in the north‐central part of the State are somewhat isolated from the western and southern mountain ranges; the Black Hills, which extend down from South Dakota are in the northeast part of the State; the Laramie, Snowy, and Sierra Madre ranges are in the southern part of Wyoming.
The Continental Divide runs through Wyoming from the northwest corner to the south‐central border of the State. Most of the drainages fall along the eastern side of the Divide. The North Platte, Wind, Big Horn, Powder, and Yellowstone Rivers all drain into the Missouri River Basin and eventually into the Gulf of Mexico. The Snake River and its tributaries drain into the Columbia River and eventually into the Pacific Ocean. The Green River joins the Colorado River before also draining into the Pacific Ocean. The Great Divide Basin in the south‐central portion of the state has no drainages; all precipitation that falls within the Great Divide Basin evaporates or percolates into the ground.
A.2 Land Ownership
With an area of 97,818 square miles, Wyoming is the tenth largest state by area. The Federal Government owns approximately 48 percent of the land in Wyoming; the State of Wyoming owns 6 percent; approximately 3 percent is Native American Trust land; and 42 percent is privately owned.
The BLM and U.S. Forest Service manage most of the federal land in Wyoming. The BLM administers the most federal land in Wyoming, about 18.4 million surface acres, primarily in the western two‐thirds of the State. In addition to surface management, the BLM also manages 41.6 million acres of subsurface mineral estate. The National Park Service also administers land in Wyoming, including well‐known attractions such as Yellowstone National Park, Grand Teton National Park, Bighorn Canyon National Recreation Area, and Devil’s Tower National Monument. Due to land ownership patterns, transmission line projects in southern and western Wyoming are more likely to cross federal land along their routes.
Appendix A – Wyoming General Background Information
A‐2 Framework for Analyzing Separation Distances between Transmission Lines in Wyoming
A.3 Weather
To a large extent, topography influences the climate in Wyoming. In general, the climate is semiarid continental, which is drier and windier than in other states in the region and therefore creating significant potential for generation of wind power. The State also experiences large temperature fluctuations; at lower elevations, summer is typified by high daytime temperatures followed by a rapid cool down. As altitude increases, temperatures fall. Winters in Wyoming are typically cold, although intermittent periods of extreme cold and mild temperatures are not uncommon. In some parts of the State, Chinook winds cause unusually warm temperatures in winter.
Wyoming’s climate is semiarid, but because of its topographical diversity, it is also varied. Annual precipitation varies from as few as 5 inches to as many as 45 inches per year. Much of the State receives fewer than 10 inches of precipitation per year. Portions of the Bighorn Basin in the northwest region of Wyoming receive as few as 5 to 8 inches of precipitation per year. The Bighorn Basin is a striking example of the effect of topography on Wyoming’s regional climates (Western Regional Climate Center 2009). Mountain ranges to the east, west, and south of the Bighorn Basin block the flow of moisture‐laden air from reaching the basin.
Overall, Wyoming experiences varied air‐flow patterns, temperature, and precipitation and humidity, primarily owing to its latitude, altitude, and local topography, which influence the weather systems that migrate eastward. In winter, Wyoming is typified by frequent strong winds and blasts of Arctic air. Wyoming generally receives more precipitation during winter due to the path of the jet stream during these months. During summer, the jet stream retreats northward to Canada, leaving the State's weather arid, mild, and pleasant.
Thunderstorm frequency varies across the State, with its southeastern plains typically experiencing the most thunderstorm activity. Thunderstorm activity is highest during late spring and early summer. The southeastern corner of the State is the most vulnerable to tornado activity.
A.4 Natural Resources Coal
Since 1988, Wyoming has been the largest coal‐producing state in the U.S. In 2007, Wyoming produced 453.6 million tons of coal (EIA 2008a). In 2008, Wyoming produced almost 39 percent of the Nation’s coal, 467.64 million tons. Coal production in Wyoming occurs in four areas, including the Powder River Basin in northeast Wyoming, which is the most productive coal region in the U.S. Coal from the Powder River Basin accounts for almost 97 percent of all coal mined in Wyoming. The Powder River Basin has some of the world’s thickest coal deposits. The thickness and relatively shallow surface depth of Powder River Basin coalbeds facilitate large surface‐mining operations (the Powder River Basin boasts the 10 largest coal mines in the U.S. [EIA 2008a]), making extraction efficient and relatively inexpensive.
The composition of Powder River Basin coal is highly desirable. On average, it contains 6 percent ash and less than 0.5 percent sulfur. Most of the coal mined in the Powder River Basin is part of the Fort Union Formation (Paleocene).
Coal production in the U.S. increased 11 percent from 1990 to 2007, from 1,029.1 million tons to 1,145.6 million tons (Freme 2007, p. 1). Wyoming coal production increased from 184 million tons in 1990 to 453.6 million tons in 2007, an increase of 147 percent (Freme 2007, p. 6). Wyoming’s domestic demand for coal is relatively low and most of the coal produced is shipped by rail to more than 30 states in the U.S. Wyoming’s internal consumption of coal is primarily for its coal‐fired power plants, which provide
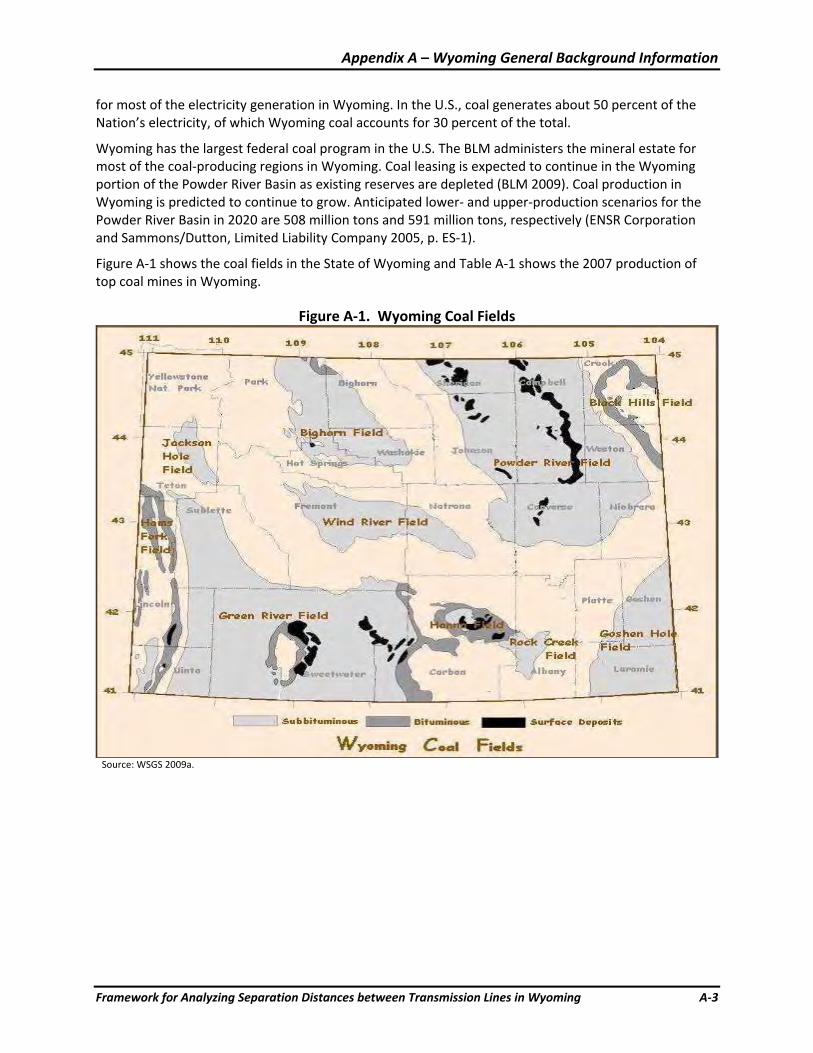
Appendix A – Wyoming General Background Information
Framework for Analyzing Separation Distances between Transmission Lines in Wyoming A‐3
for most of the electricity generation in Wyoming. In the U.S., coal generates about 50 percent of the Nation’s electricity, of which Wyoming coal accounts for 30 percent of the total.
Wyoming has the largest federal coal program in the U.S. The BLM administers the mineral estate for most of the coal‐producing regions in Wyoming. Coal leasing is expected to continue in the Wyoming portion of the Powder River Basin as existing reserves are depleted (BLM 2009). Coal production in Wyoming is predicted to continue to grow. Anticipated lower‐ and upper‐production scenarios for the Powder River Basin in 2020 are 508 million tons and 591 million tons, respectively (ENSR Corporation and Sammons/Dutton, Limited Liability Company 2005, p. ES‐1).
Figure A‐1 shows the coal fields in the State of Wyoming and Table A‐1 shows the 2007 production of top coal mines in Wyoming.
Figure A‐1. Wyoming Coal Fields
Source: WSGS 2009a.
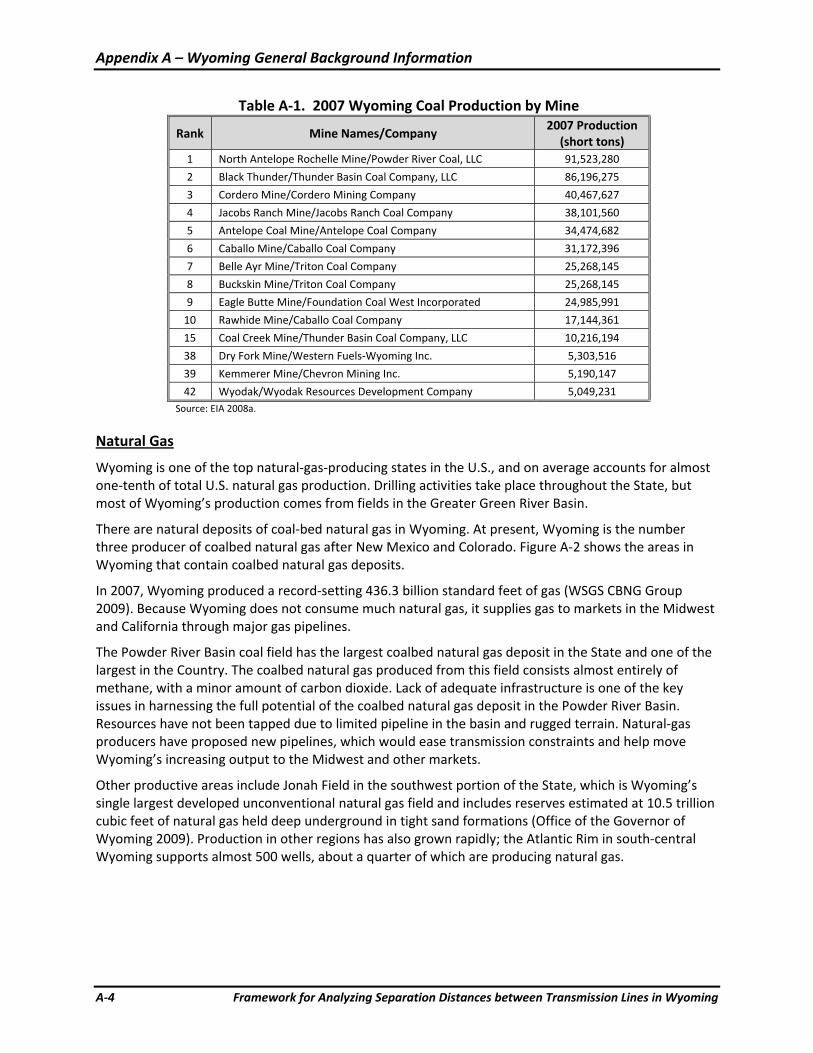
Appendix A – Wyoming General Background Information
A‐4 Framework for Analyzing Separation Distances between Transmission Lines in Wyoming
Table A‐1. 2007 Wyoming Coal Production by Mine
Rank Mine Names/Company 2007 Production (short tons)
1 North Antelope Rochelle Mine/Powder River Coal, LLC 91,523,280
2 Black Thunder/Thunder Basin Coal Company, LLC 86,196,275
3 Cordero Mine/Cordero Mining Company 40,467,627
4 Jacobs Ranch Mine/Jacobs Ranch Coal Company 38,101,560
5 Antelope Coal Mine/Antelope Coal Company 34,474,682
6 Caballo Mine/Caballo Coal Company 31,172,396
7 Belle Ayr Mine/Triton Coal Company 25,268,145
8 Buckskin Mine/Triton Coal Company 25,268,145
9 Eagle Butte Mine/Foundation Coal West Incorporated 24,985,991
10 Rawhide Mine/Caballo Coal Company 17,144,361
15 Coal Creek Mine/Thunder Basin Coal Company, LLC 10,216,194
38 Dry Fork Mine/Western Fuels‐Wyoming Inc. 5,303,516
39 Kemmerer Mine/Chevron Mining Inc. 5,190,147
42 Wyodak/Wyodak Resources Development Company 5,049,231 Source: EIA 2008a.
Natural Gas
Wyoming is one of the top natural‐gas‐producing states in the U.S., and on average accounts for almost one‐tenth of total U.S. natural gas production. Drilling activities take place throughout the State, but most of Wyoming’s production comes from fields in the Greater Green River Basin.
There are natural deposits of coal‐bed natural gas in Wyoming. At present, Wyoming is the number three producer of coalbed natural gas after New Mexico and Colorado. Figure A‐2 shows the areas in Wyoming that contain coalbed natural gas deposits.
In 2007, Wyoming produced a record‐setting 436.3 billion standard feet of gas (WSGS CBNG Group 2009). Because Wyoming does not consume much natural gas, it supplies gas to markets in the Midwest and California through major gas pipelines.
The Powder River Basin coal field has the largest coalbed natural gas deposit in the State and one of the largest in the Country. The coalbed natural gas produced from this field consists almost entirely of methane, with a minor amount of carbon dioxide. Lack of adequate infrastructure is one of the key issues in harnessing the full potential of the coalbed natural gas deposit in the Powder River Basin. Resources have not been tapped due to limited pipeline in the basin and rugged terrain. Natural‐gas producers have proposed new pipelines, which would ease transmission constraints and help move Wyoming’s increasing output to the Midwest and other markets.
Other productive areas include Jonah Field in the southwest portion of the State, which is Wyoming’s single largest developed unconventional natural gas field and includes reserves estimated at 10.5 trillion cubic feet of natural gas held deep underground in tight sand formations (Office of the Governor of Wyoming 2009). Production in other regions has also grown rapidly; the Atlantic Rim in south‐central Wyoming supports almost 500 wells, about a quarter of which are producing natural gas.
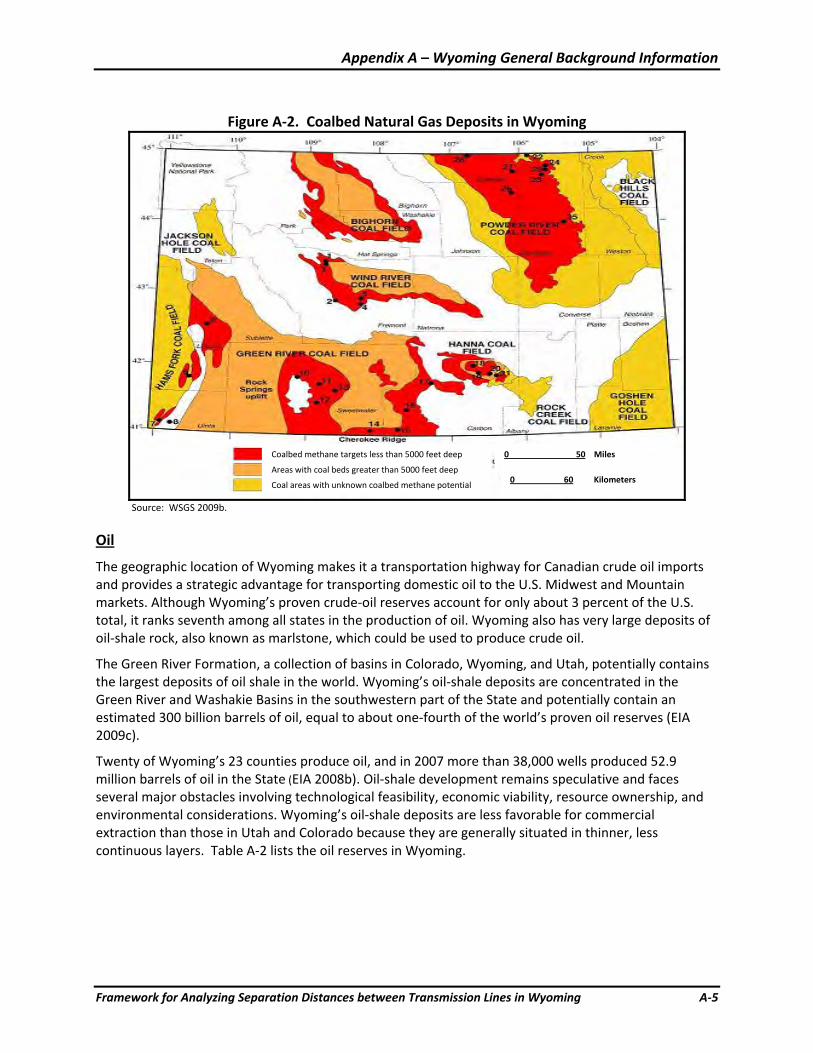
Appendix A – Wyoming General Background Information
Framework for Analyzing Separation Distances between Transmission Lines in Wyoming A‐5
Figure A‐2. Coalbed Natural Gas Deposits in Wyoming
Source: WSGS 2009b.
Oil
The geographic location of Wyoming makes it a transportation highway for Canadian crude oil imports and provides a strategic advantage for transporting domestic oil to the U.S. Midwest and Mountain markets. Although Wyoming’s proven crude‐oil reserves account for only about 3 percent of the U.S. total, it ranks seventh among all states in the production of oil. Wyoming also has very large deposits of oil‐shale rock, also known as marlstone, which could be used to produce crude oil.
The Green River Formation, a collection of basins in Colorado, Wyoming, and Utah, potentially contains the largest deposits of oil shale in the world. Wyoming’s oil‐shale deposits are concentrated in the Green River and Washakie Basins in the southwestern part of the State and potentially contain an estimated 300 billion barrels of oil, equal to about one‐fourth of the world’s proven oil reserves (EIA 2009c).
Twenty of Wyoming’s 23 counties produce oil, and in 2007 more than 38,000 wells produced 52.9 million barrels of oil in the State (EIA 2008b). Oil‐shale development remains speculative and faces several major obstacles involving technological feasibility, economic viability, resource ownership, and environmental considerations. Wyoming’s oil‐shale deposits are less favorable for commercial extraction than those in Utah and Colorado because they are generally situated in thinner, less continuous layers. Table A‐2 lists the oil reserves in Wyoming.
Coalbed methane targets less than 5000 feet deep
Areas with coal beds greater than 5000 feet deep
Coal areas with unknown coalbed methane potential
0 50 Miles
0 60 Kilometers
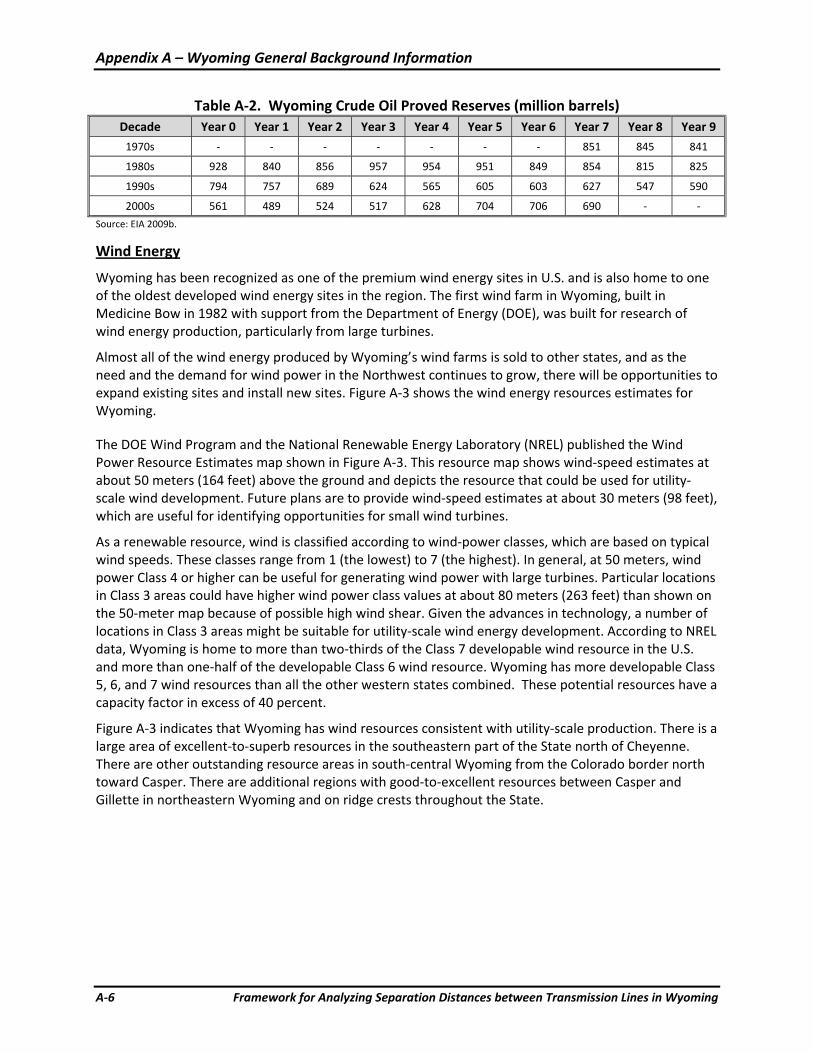
Appendix A – Wyoming General Background Information
A‐6 Framework for Analyzing Separation Distances between Transmission Lines in Wyoming
Table A‐2. Wyoming Crude Oil Proved Reserves (million barrels) Decade Year 0 Year 1 Year 2 Year 3 Year 4 Year 5 Year 6 Year 7 Year 8 Year 9
1970s ‐ ‐ ‐ ‐ ‐ ‐ ‐ 851 845 841
1980s 928 840 856 957 954 951 849 854 815 825
1990s 794 757 689 624 565 605 603 627 547 590
2000s 561 489 524 517 628 704 706 690 ‐ ‐
Source: EIA 2009b.
Wind Energy
Wyoming has been recognized as one of the premium wind energy sites in U.S. and is also home to one of the oldest developed wind energy sites in the region. The first wind farm in Wyoming, built in Medicine Bow in 1982 with support from the Department of Energy (DOE), was built for research of wind energy production, particularly from large turbines.
Almost all of the wind energy produced by Wyoming’s wind farms is sold to other states, and as the need and the demand for wind power in the Northwest continues to grow, there will be opportunities to expand existing sites and install new sites. Figure A‐3 shows the wind energy resources estimates for Wyoming.
The DOE Wind Program and the National Renewable Energy Laboratory (NREL) published the Wind Power Resource Estimates map shown in Figure A‐3. This resource map shows wind‐speed estimates at about 50 meters (164 feet) above the ground and depicts the resource that could be used for utility‐scale wind development. Future plans are to provide wind‐speed estimates at about 30 meters (98 feet), which are useful for identifying opportunities for small wind turbines.
As a renewable resource, wind is classified according to wind‐power classes, which are based on typical wind speeds. These classes range from 1 (the lowest) to 7 (the highest). In general, at 50 meters, wind power Class 4 or higher can be useful for generating wind power with large turbines. Particular locations in Class 3 areas could have higher wind power class values at about 80 meters (263 feet) than shown on the 50‐meter map because of possible high wind shear. Given the advances in technology, a number of locations in Class 3 areas might be suitable for utility‐scale wind energy development. According to NREL data, Wyoming is home to more than two‐thirds of the Class 7 developable wind resource in the U.S. and more than one‐half of the developable Class 6 wind resource. Wyoming has more developable Class 5, 6, and 7 wind resources than all the other western states combined. These potential resources have a capacity factor in excess of 40 percent.
Figure A‐3 indicates that Wyoming has wind resources consistent with utility‐scale production. There is a large area of excellent‐to‐superb resources in the southeastern part of the State north of Cheyenne. There are other outstanding resource areas in south‐central Wyoming from the Colorado border north toward Casper. There are additional regions with good‐to‐excellent resources between Casper and Gillette in northeastern Wyoming and on ridge crests throughout the State.
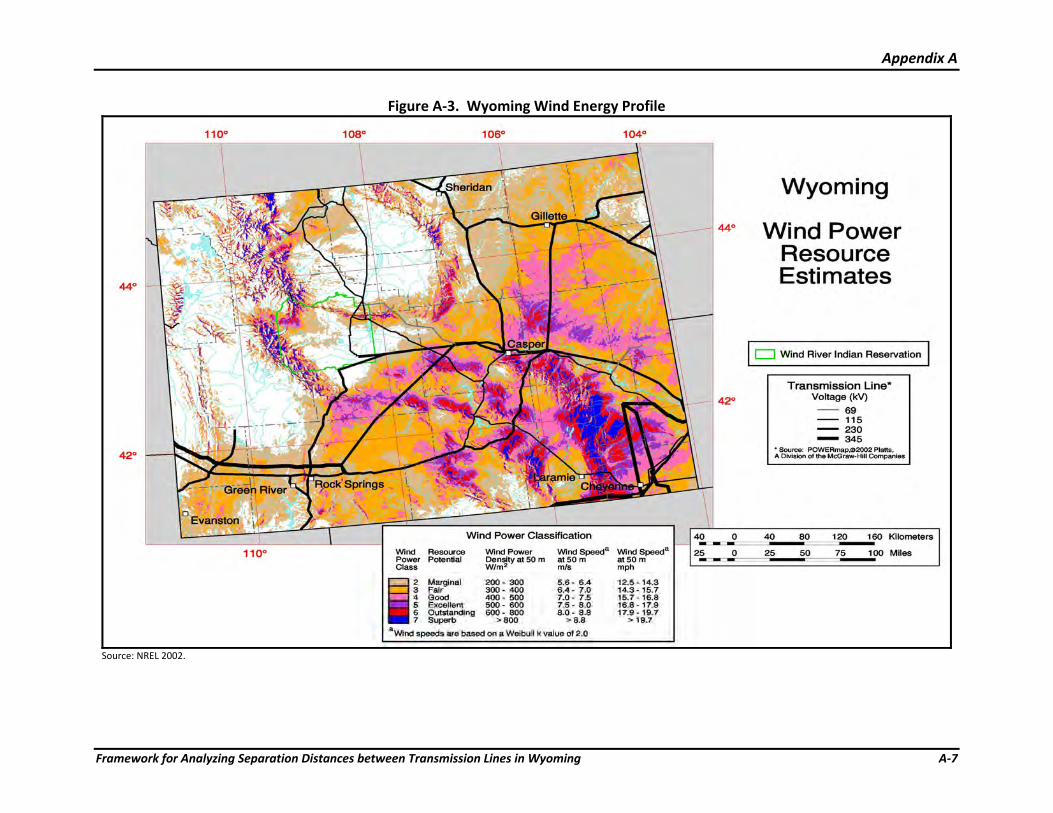
Appendix A
Framework for Analyzing Separation Distances between Transmission Lines in Wyoming A‐7
Figure A‐3. Wyoming Wind Energy Profile
Source: NREL 2002.
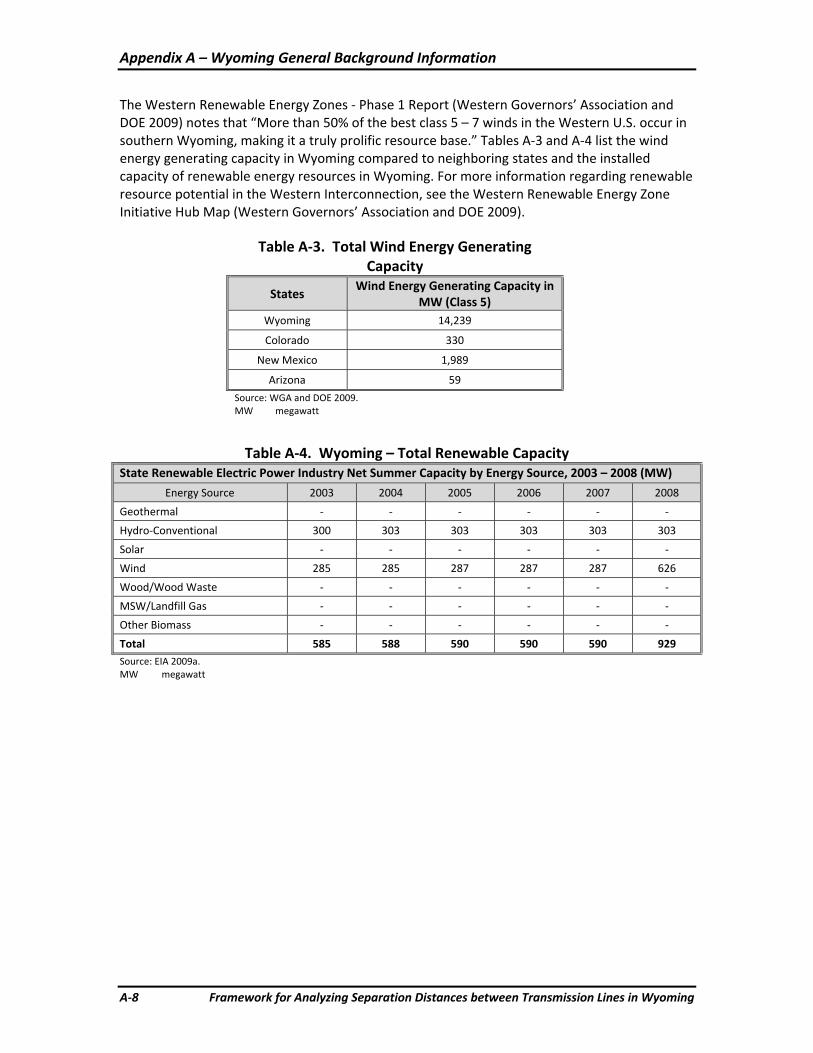
Appendix A – Wyoming General Background Information
A‐8 Framework for Analyzing Separation Distances between Transmission Lines in Wyoming
The Western Renewable Energy Zones ‐ Phase 1 Report (Western Governors’ Association and DOE 2009) notes that “More than 50% of the best class 5 – 7 winds in the Western U.S. occur in southern Wyoming, making it a truly prolific resource base.” Tables A‐3 and A‐4 list the wind energy generating capacity in Wyoming compared to neighboring states and the installed capacity of renewable energy resources in Wyoming. For more information regarding renewable resource potential in the Western Interconnection, see the Western Renewable Energy Zone Initiative Hub Map (Western Governors’ Association and DOE 2009).
Table A‐3. Total Wind Energy Generating Capacity
States Wind Energy Generating Capacity in
MW (Class 5) Wyoming 14,239
Colorado 330
New Mexico 1,989
Arizona 59
Source: WGA and DOE 2009.MW megawatt
Table A‐4. Wyoming – Total Renewable Capacity State Renewable Electric Power Industry Net Summer Capacity by Energy Source, 2003 – 2008 (MW)
Energy Source 2003 2004 2005 2006 2007 2008
Geothermal ‐ ‐ ‐ ‐ ‐ ‐
Hydro‐Conventional 300 303 303 303 303 303
Solar ‐ ‐ ‐ ‐ ‐ ‐
Wind 285 285 287 287 287 626
Wood/Wood Waste ‐ ‐ ‐ ‐ ‐ ‐
MSW/Landfill Gas ‐ ‐ ‐ ‐ ‐ ‐
Other Biomass ‐ ‐ ‐ ‐ ‐ ‐
Total 585 588 590 590 590 929 Source: EIA 2009a. MW megawatt
Framework for Analyzing Separation Distances between Transmission Lines in Wyoming
Appendix B
Summary of Historical Data on Tornadoes in Wyoming

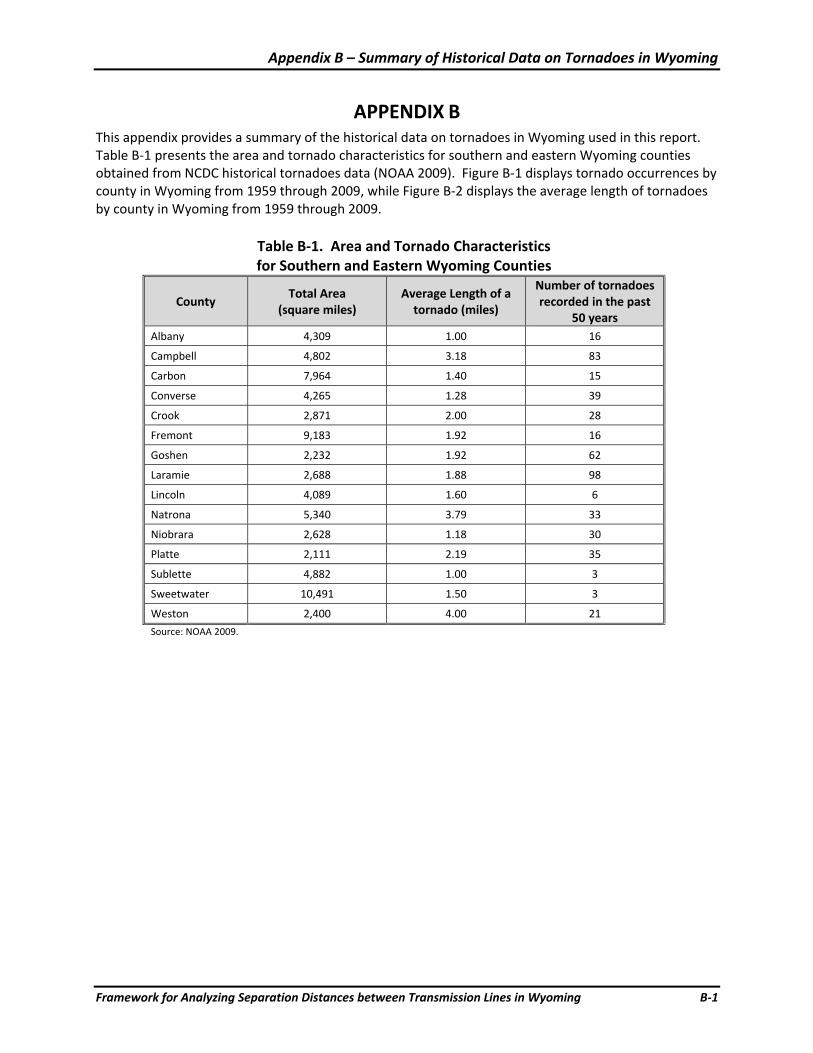
Appendix B – Summary of Historical Data on Tornadoes in Wyoming
Framework for Analyzing Separation Distances between Transmission Lines in Wyoming B‐1
APPENDIX B This appendix provides a summary of the historical data on tornadoes in Wyoming used in this report. Table B‐1 presents the area and tornado characteristics for southern and eastern Wyoming counties obtained from NCDC historical tornadoes data (NOAA 2009). Figure B‐1 displays tornado occurrences by county in Wyoming from 1959 through 2009, while Figure B‐2 displays the average length of tornadoes by county in Wyoming from 1959 through 2009.
Table B‐1. Area and Tornado Characteristics for Southern and Eastern Wyoming Counties
County Total Area
(square miles) Average Length of a tornado (miles)
Number of tornadoes recorded in the past
50 years Albany 4,309 1.00 16
Campbell 4,802 3.18 83
Carbon 7,964 1.40 15
Converse 4,265 1.28 39
Crook 2,871 2.00 28
Fremont 9,183 1.92 16
Goshen 2,232 1.92 62
Laramie 2,688 1.88 98
Lincoln 4,089 1.60 6
Natrona 5,340 3.79 33
Niobrara 2,628 1.18 30
Platte 2,111 2.19 35
Sublette 4,882 1.00 3
Sweetwater 10,491 1.50 3
Weston 2,400 4.00 21
Source: NOAA 2009.
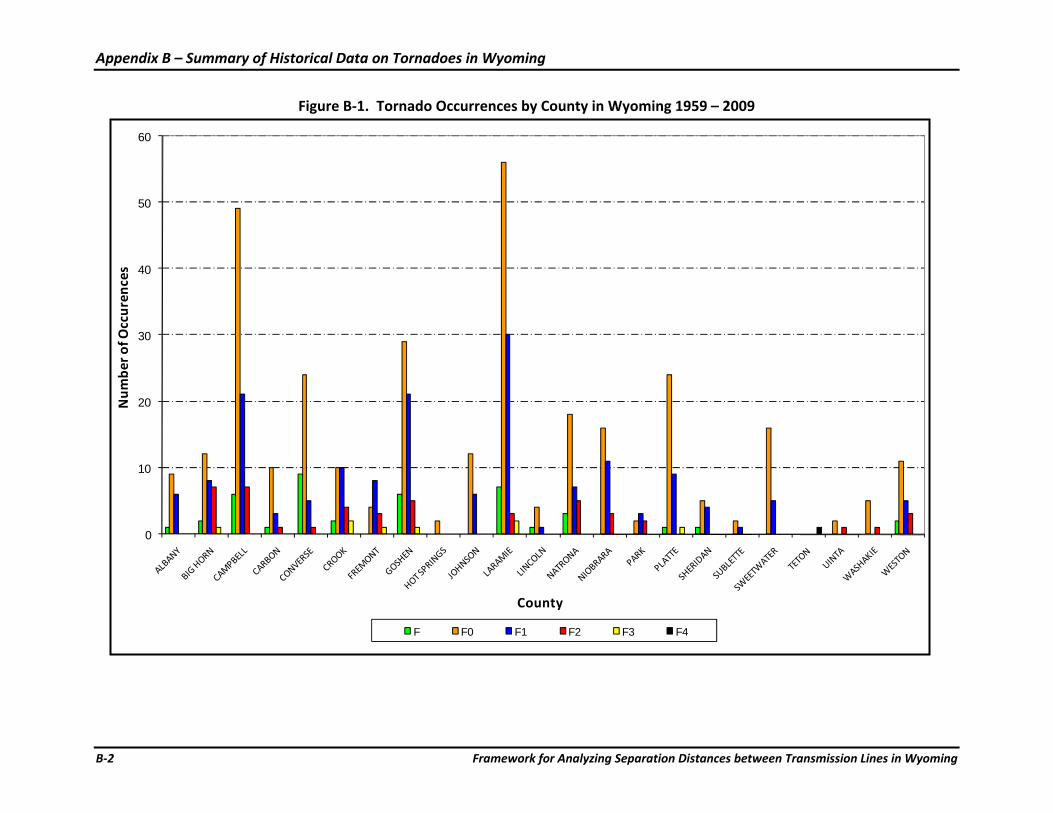
Appendix B – Summary of Historical Data on Tornadoes in Wyoming
B‐2 Framework for Analyzing Separation Distances between Transmission Lines in Wyoming
Figure B‐1. Tornado Occurrences by County in Wyoming 1959 – 2009
0
10
20
30
40
50
60Num
ber o
f Occuren
ces
County
F F0 F1 F2 F3 F4
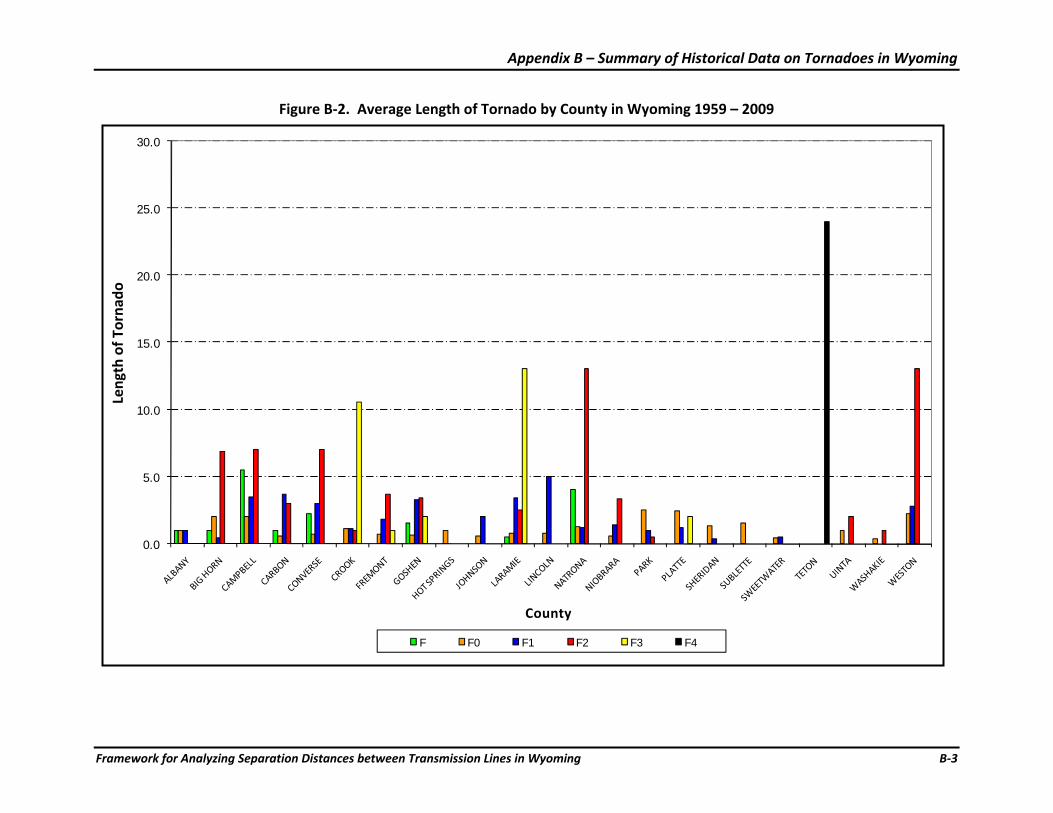
Appendix B – Summary of Historical Data on Tornadoes in Wyoming
Framework for Analyzing Separation Distances between Transmission Lines in Wyoming B‐3
Figure B‐2. Average Length of Tornado by County in Wyoming 1959 – 2009
0.0
5.0
10.0
15.0
20.0
25.0
30.0
Leng
th Of Torna
do
County
F F0 F1 F2 F3 F4
Length of T
orna
do
Appendix B – Summary of Historical Data on Tornadoes in Wyoming
B‐4 Framework for Analyzing Separation Distances between Transmission Lines in Wyoming
This page intentionally left blank.
Framework for Analyzing Separation Distances between Transmission Lines in Wyoming
Appendix C
Determining Probability of a Tornado Making Contact with Two Transmission Lines

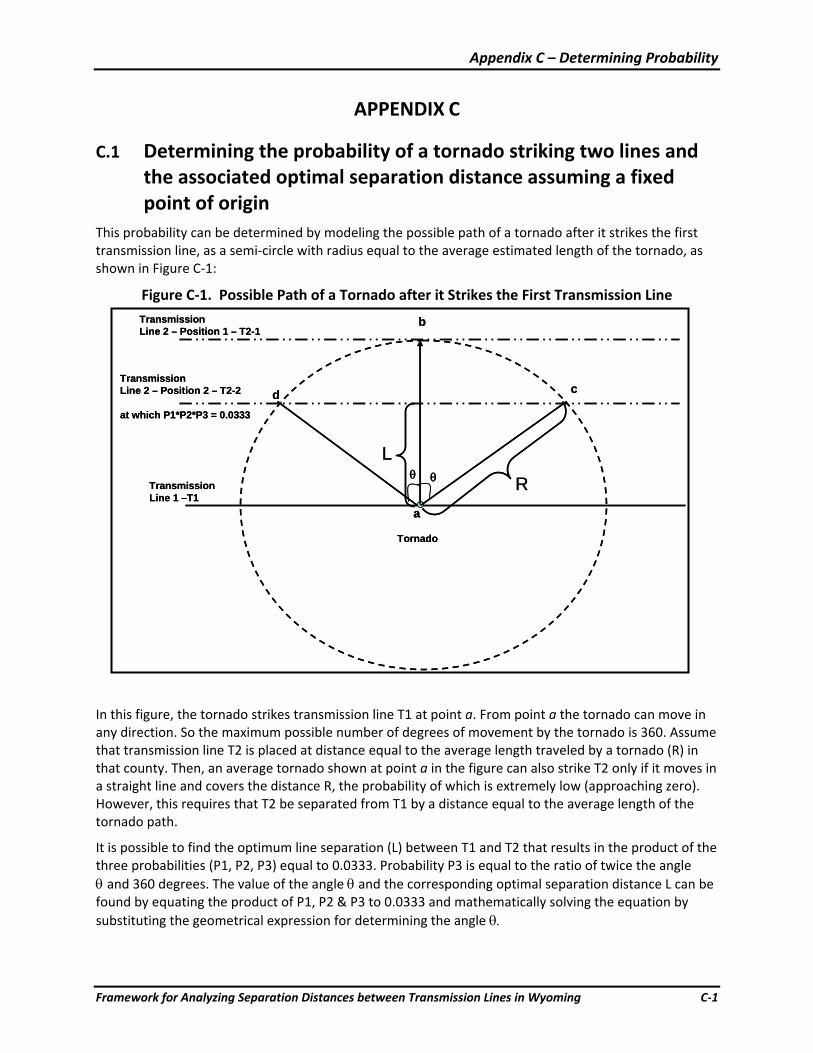
Appendix C – Determining Probability
Framework for Analyzing Separation Distances between Transmission Lines in Wyoming C‐1
APPENDIX C
C.1 Determining the probability of a tornado striking two lines and the associated optimal separation distance assuming a fixed point of origin
This probability can be determined by modeling the possible path of a tornado after it strikes the first transmission line, as a semi‐circle with radius equal to the average estimated length of the tornado, as shown in Figure C‐1:
Figure C‐1. Possible Path of a Tornado after it Strikes the First Transmission Line
In this figure, the tornado strikes transmission line T1 at point a. From point a the tornado can move in any direction. So the maximum possible number of degrees of movement by the tornado is 360. Assume that transmission line T2 is placed at distance equal to the average length traveled by a tornado (R) in that county. Then, an average tornado shown at point a in the figure can also strike T2 only if it moves in a straight line and covers the distance R, the probability of which is extremely low (approaching zero). However, this requires that T2 be separated from T1 by a distance equal to the average length of the tornado path.
It is possible to find the optimum line separation (L) between T1 and T2 that results in the product of the three probabilities (P1, P2, P3) equal to 0.0333. Probability P3 is equal to the ratio of twice the angle θ and 360 degrees. The value of the angle θ and the corresponding optimal separation distance L can be found by equating the product of P1, P2 & P3 to 0.0333 and mathematically solving the equation by substituting the geometrical expression for determining the angle θ.
TransmissionLine 1 –T1
TransmissionLine 2 – Position 1 – T2-1
Tornado
TransmissionLine 2 – Position 2 – T2-2
at which P1*P2*P3 = 0.0333
θ
L
Ra
c
b
θ
d
TransmissionLine 1 –T1
TransmissionLine 2 – Position 1 – T2-1
Tornado
TransmissionLine 2 – Position 2 – T2-2
at which P1*P2*P3 = 0.0333
θ
L
Ra
c
b
θ
d
Appendix C – Determining Probability
C‐2 Framework for Analyzing Separation Distances between Transmission Lines in Wyoming
Thus,
(C1) P1*P2*P3 = 0.0333
(C2) P3 = 2θ/360
P1 and P2 are known.
Let A = P1 * P2
Therefore, from (A1) and (A2),
(C3) θ = 180 * 0.0333/(2*A)
From the figure,
COS θ = L/R
Τherefore, L = R COS θ
Using (A3),
(C4) L = R COS (3600*0.0333/(2*A))
Because A and R are known, L can be calculated.
Once L is known, then θ and hence the probability of a single tornado striking two lines can be determined.
C.2 Tornado Path Calculations using Monte Carlo Method ICF also approximated the theoretical calculation for the probability P2*P3 using a Monte Carlo simulation, which yielded similar results.
ICF performed the Monte Carlo simulation by defining county dimensions and locations for transmission lines T1 and T2, and using a random‐number generator to create sets of tornado parameters. A tornado parameter set included a random origination location within the county and a random direction of travel. The tornados were assumed to travel in a straight line over a distance equal to the average tornado path length for the county. For each simulated tornado, ICF determined whether the path of the tornado crossed both T1 and T2.
Figure C‐2 is an illustration of random tornado paths being drawn within the boundaries of a county. As shown, two of the tornado paths cross both transmission lines.
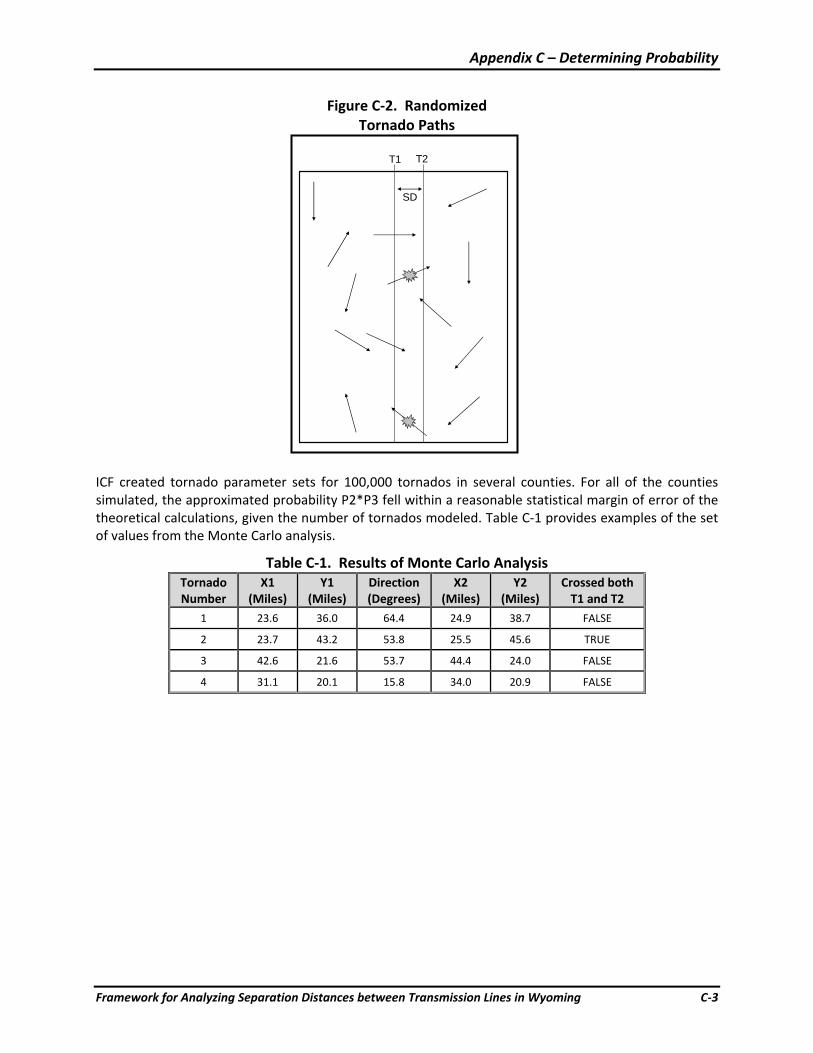
Appendix C – Determining Probability
Framework for Analyzing Separation Distances between Transmission Lines in Wyoming C‐3
Figure C‐2. Randomized Tornado Paths
ICF created tornado parameter sets for 100,000 tornados in several counties. For all of the counties simulated, the approximated probability P2*P3 fell within a reasonable statistical margin of error of the theoretical calculations, given the number of tornados modeled. Table C‐1 provides examples of the set of values from the Monte Carlo analysis.
Table C‐1. Results of Monte Carlo Analysis Tornado Number
X1 (Miles)
Y1(Miles)
Direction(Degrees)
X2(Miles)
Y2(Miles)
Crossed both T1 and T2
1 23.6 36.0 64.4 24.9 38.7 FALSE
2 23.7 43.2 53.8 25.5 45.6 TRUE
3 42.6 21.6 53.7 44.4 24.0 FALSE
4 31.1 20.1 15.8 34.0 20.9 FALSE
SD
T1 T2

Appendix C – Determining Probability
C‐4 Framework for Analyzing Separation Distances between Transmission Lines in Wyoming
This page intentionally left blank.
Framework for Analyzing Separation Distances Between Transmission Lines in Wyoming
Appendix D
Determining Line Separation Distances for Two Representative Transmission Line Routes in Wyoming

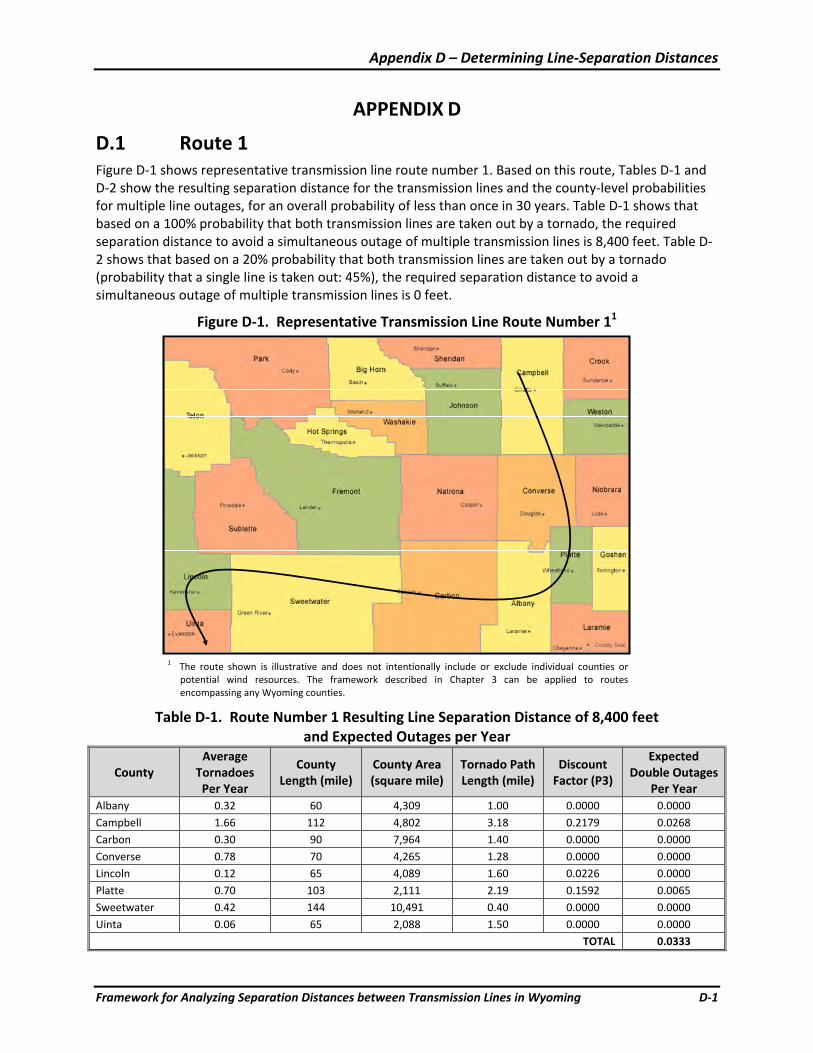
Appendix D – Determining Line‐Separation Distances
Framework for Analyzing Separation Distances between Transmission Lines in Wyoming D‐1
APPENDIX D
D.1 Route 1 Figure D‐1 shows representative transmission line route number 1. Based on this route, Tables D‐1 and D‐2 show the resulting separation distance for the transmission lines and the county‐level probabilities for multiple line outages, for an overall probability of less than once in 30 years. Table D‐1 shows that based on a 100% probability that both transmission lines are taken out by a tornado, the required separation distance to avoid a simultaneous outage of multiple transmission lines is 8,400 feet. Table D‐2 shows that based on a 20% probability that both transmission lines are taken out by a tornado (probability that a single line is taken out: 45%), the required separation distance to avoid a simultaneous outage of multiple transmission lines is 0 feet.
Figure D‐1. Representative Transmission Line Route Number 11
1 The route shown is illustrative and does not intentionally include or exclude individual counties or potential wind resources. The framework described in Chapter 3 can be applied to routes encompassing any Wyoming counties.
Table D‐1. Route Number 1 Resulting Line Separation Distance of 8,400 feet and Expected Outages per Year
County Average Tornadoes Per Year
County Length (mile)
County Area (square mile)
Tornado Path Length (mile)
Discount Factor (P3)
Expected Double Outages
Per Year Albany 0.32 60 4,309 1.00 0.0000 0.0000 Campbell 1.66 112 4,802 3.18 0.2179 0.0268 Carbon 0.30 90 7,964 1.40 0.0000 0.0000 Converse 0.78 70 4,265 1.28 0.0000 0.0000 Lincoln 0.12 65 4,089 1.60 0.0226 0.0000 Platte 0.70 103 2,111 2.19 0.1592 0.0065 Sweetwater 0.42 144 10,491 0.40 0.0000 0.0000 Uinta 0.06 65 2,088 1.50 0.0000 0.0000
TOTAL 0.0333
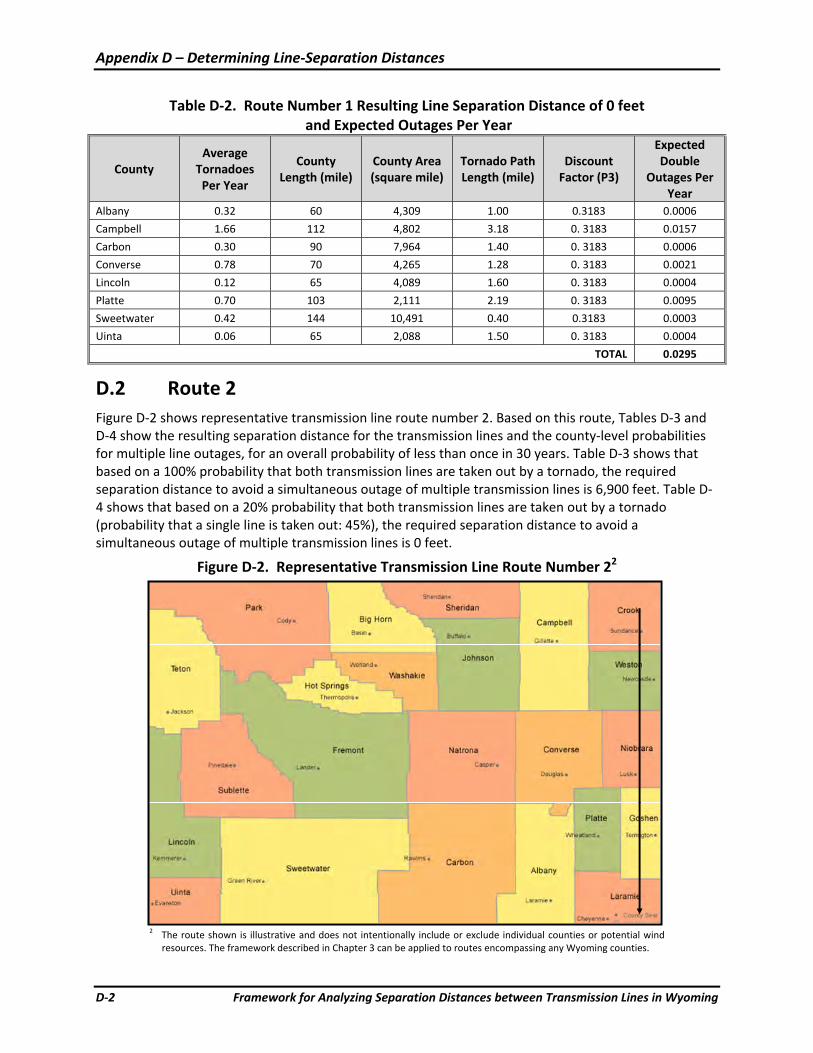
Appendix D – Determining Line‐Separation Distances
D‐2 Framework for Analyzing Separation Distances between Transmission Lines in Wyoming
Table D‐2. Route Number 1 Resulting Line Separation Distance of 0 feet and Expected Outages Per Year
County Average Tornadoes Per Year
County Length (mile)
County Area (square mile)
Tornado Path Length (mile)
Discount Factor (P3)
Expected Double
Outages Per Year
Albany 0.32 60 4,309 1.00 0.3183 0.0006
Campbell 1.66 112 4,802 3.18 0. 3183 0.0157
Carbon 0.30 90 7,964 1.40 0. 3183 0.0006
Converse 0.78 70 4,265 1.28 0. 3183 0.0021
Lincoln 0.12 65 4,089 1.60 0. 3183 0.0004
Platte 0.70 103 2,111 2.19 0. 3183 0.0095
Sweetwater 0.42 144 10,491 0.40 0.3183 0.0003
Uinta 0.06 65 2,088 1.50 0. 3183 0.0004
TOTAL 0.0295
D.2 Route 2 Figure D‐2 shows representative transmission line route number 2. Based on this route, Tables D‐3 and D‐4 show the resulting separation distance for the transmission lines and the county‐level probabilities for multiple line outages, for an overall probability of less than once in 30 years. Table D‐3 shows that based on a 100% probability that both transmission lines are taken out by a tornado, the required separation distance to avoid a simultaneous outage of multiple transmission lines is 6,900 feet. Table D‐4 shows that based on a 20% probability that both transmission lines are taken out by a tornado (probability that a single line is taken out: 45%), the required separation distance to avoid a simultaneous outage of multiple transmission lines is 0 feet.
Figure D‐2. Representative Transmission Line Route Number 22
2 The route shown is illustrative and does not intentionally include or exclude individual counties or potential wind
resources. The framework described in Chapter 3 can be applied to routes encompassing any Wyoming counties.

Appendix D – Determining Line‐Separation Distances
Framework for Analyzing Separation Distances between Transmission Lines in Wyoming D‐3
Table D‐3. Route Number 2 Resulting Line Separation Distance of 6,900 Feet and Expected Outages per Year
County Average Tornadoes Per Year
County Length (mile)
County Area (square mile)
Tornado Path Length (mile)
Discount Factor (P3)
Expected Double
Outages Per Year
Crook 0.56 62 2,871 2.00 0.1799 0.0030
Goshen 1.24 93 2,232 1.92 0.1725 0.0109
Laramie 1.96 50 2,688 1.88 0.1684 0.0070
Niobrara 0.60 70 2,628 1.18 0 0
Weston 0.42 50 2,400 4.00 0.2556 0.0120
TOTAL 0.0330
Table D‐4. Route Number 2 Resulting Line Separation Distance of 0 Feet
and Expected Outages per Year
County Average Tornadoes Per Year
County Length (mile)
County Area (square mile)
Tornado Path Length (mile)
Discount Factor (P3)
Expected Double
Outages Per Year
Crook 0.56 62 2,871 2.00 0.3183 0.0031
Goshen 1.24 93 2,232 1.92 0. 3183 0.0126
Laramie 1.96 50 2,688 1.88 0. 3183 0.0087
Niobrara 0.60 70 2,628 1.18 0.3183 0.0024
Weston 0.42 50 2,400 4.00 0. 3183 0.0045
TOTAL 0.0313
D.3 Results of Representative Route Analyses Table D‐5 summarizes the results of the analyses for representative routes 1 and 2.
Table D‐5. Results of Representative Route Analyses
Route Single Outage
Probability (percent) Double Outage
Probability (percent) Required Separation
Distance (feet) Route 1 100 100 8,400
Route 1 45 20 0
Route 2 100 100 6,900
Route 2 45 20 0
% percent
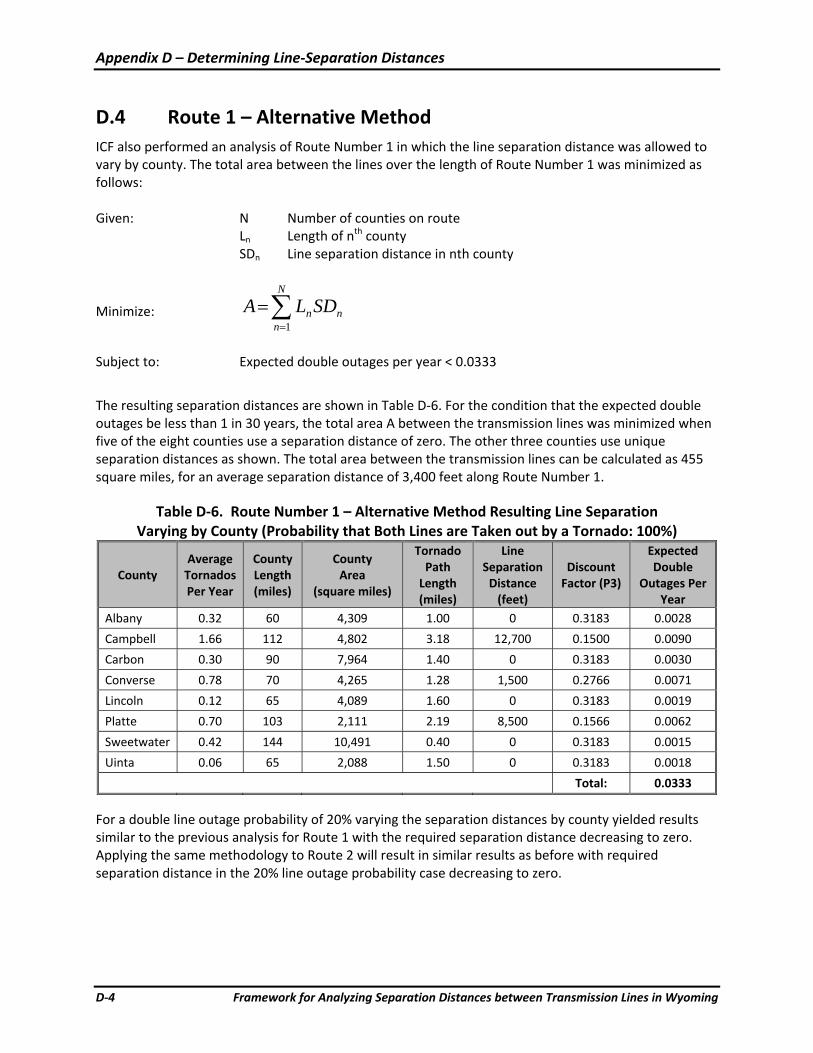
Appendix D – Determining Line‐Separation Distances
D‐4 Framework for Analyzing Separation Distances between Transmission Lines in Wyoming
D.4 Route 1 – Alternative Method ICF also performed an analysis of Route Number 1 in which the line separation distance was allowed to vary by county. The total area between the lines over the length of Route Number 1 was minimized as follows: Given: N Number of counties on route
Ln Length of nth county SDn Line separation distance in nth county
Minimize: ∑=
=N
nnnSDLA
1
Subject to: Expected double outages per year < 0.0333
The resulting separation distances are shown in Table D‐6. For the condition that the expected double outages be less than 1 in 30 years, the total area A between the transmission lines was minimized when five of the eight counties use a separation distance of zero. The other three counties use unique separation distances as shown. The total area between the transmission lines can be calculated as 455 square miles, for an average separation distance of 3,400 feet along Route Number 1.
Table D‐6. Route Number 1 – Alternative Method Resulting Line Separation Varying by County (Probability that Both Lines are Taken out by a Tornado: 100%)
County Average Tornados Per Year
County Length (miles)
County Area
(square miles)
Tornado Path Length (miles)
Line Separation Distance (feet)
Discount Factor (P3)
Expected Double
Outages Per Year
Albany 0.32 60 4,309 1.00 0 0.3183 0.0028
Campbell 1.66 112 4,802 3.18 12,700 0.1500 0.0090
Carbon 0.30 90 7,964 1.40 0 0.3183 0.0030
Converse 0.78 70 4,265 1.28 1,500 0.2766 0.0071
Lincoln 0.12 65 4,089 1.60 0 0.3183 0.0019
Platte 0.70 103 2,111 2.19 8,500 0.1566 0.0062
Sweetwater 0.42 144 10,491 0.40 0 0.3183 0.0015
Uinta 0.06 65 2,088 1.50 0 0.3183 0.0018
Total: 0.0333
For a double line outage probability of 20% varying the separation distances by county yielded results similar to the previous analysis for Route 1 with the required separation distance decreasing to zero. Applying the same methodology to Route 2 will result in similar results as before with required separation distance in the 20% line outage probability case decreasing to zero.