Embed Size (px)
Citation preview
8/10/2019 Fracture.&Amp;.Fatigue. .Fracture.mechanics. .Nasa
http://slidepdf.com/reader/full/fracturefatigue-fracturemechanics-nasa 1/29
November 2004
NASA/TM-2004-213499
A Hierarchical Approach to Fracture Mechanics
Erik Saether
Langley Research Center, Hampton, Virginia
Shlomo Ta'asanCarnegie Mellon University, Pittsburgh, Pennsylvania

8/10/2019 Fracture.&Amp;.Fatigue. .Fracture.mechanics. .Nasa
http://slidepdf.com/reader/full/fracturefatigue-fracturemechanics-nasa 2/29
The NASA STI Program Office . . . in Profile
Since its founding, NASA has been dedicated
to the advancement of aeronautics and space
science. The NASA Scientific and TechnicalInformation (STI) Program Office plays a key
part in helping NASA maintain this important
role.
The NASA STI Program Office is operated by
Langley Research Center, the lead center for NASA’s
scientific and technical information. The NASA STI
Program Office provides access to the NASA STI
Database, the largest collection of aeronautical and
space science STI in the world. The Program Office is
also NASA’s institutional mechanism for
disseminating the results of its research and
development activities. These results are published by NASA in the NASA STI Report Series, which
includes the following report types:
• TECHNICAL PUBLICATION. Reports of
completed research or a major significant phase
of research that present the results of NASA programs and include extensive data or
theoretical analysis. Includes compilations of
significant scientific and technical data and
information deemed to be of continuing
reference value. NASA counterpart of peer-
reviewed formal professional papers, but havingless stringent limitations on manuscript length
and extent of graphic presentations.
• TECHNICAL MEMORANDUM. Scientific
and technical findings that are preliminary or of
specialized interest, e.g., quick release reports,
working papers, and bibliographies that contain
minimal annotation. Does not contain extensive
analysis.
• CONTRACTOR REPORT. Scientific and
technical findings by NASA-sponsored
contractors and grantees.
• CONFERENCE PUBLICATION. Collected
papers from scientific and technical
conferences, symposia, seminars, or othermeetings sponsored or co-sponsored by NASA.
• SPECIAL PUBLICATION. Scientific,
technical, or historical information from NASA
programs, projects, and missions, often
concerned with subjects having substantial
public interest.
• TECHNICAL TRANSLATION. English-
language translations of foreign scientific and
technical material pertinent to NASA’s mission.
Specialized services that complement the STI
Program Office’s diverse offerings include creating
custom thesauri, building customized databases,
organizing and publishing research results ... even
providing videos.
For more information about the NASA STI Program
Office, see the following:
• Access the NASA STI Program Home Page at
http://www.sti.nasa.gov
• E-mail your question via the Internet [email protected]
• Fax your question to the NASA STI Help Desk
at (301) 621-0134
• Phone the NASA STI Help Desk at
(301) 621-0390
• Write to:
NASA STI Help Desk
NASA Center for AeroSpace Information
7121 Standard DriveHanover, MD 21076-1320
8/10/2019 Fracture.&Amp;.Fatigue. .Fracture.mechanics. .Nasa
http://slidepdf.com/reader/full/fracturefatigue-fracturemechanics-nasa 3/29
National Aeronautics andSpace Administration
Langley Research CenterHampton, Virginia 23681-2199
November 2004
NASA/TM-2004-213499
A Hierarchical Approach to Fracture Mechanics
Erik Saether
Langley Research Center, Hampton, Virginia
Shlomo Ta'asanCarnegie Mellon University, Pittsburgh, Pennsylvania

8/10/2019 Fracture.&Amp;.Fatigue. .Fracture.mechanics. .Nasa
http://slidepdf.com/reader/full/fracturefatigue-fracturemechanics-nasa 4/29
Available from:
NASA Center for AeroSpace Information (CASI) National Technical Information Service (NTIS)7121 Standard Drive 5285 Port Royal Road
Hanover, MD 21076-1320 Springfield, VA 22161-2171
(301) 621-0390 (703) 605-6000
8/10/2019 Fracture.&Amp;.Fatigue. .Fracture.mechanics. .Nasa
http://slidepdf.com/reader/full/fracturefatigue-fracturemechanics-nasa 5/29
8/10/2019 Fracture.&Amp;.Fatigue. .Fracture.mechanics. .Nasa
http://slidepdf.com/reader/full/fracturefatigue-fracturemechanics-nasa 6/29
2
nanoscale fracture mechanisms can be calculated using molecular dynamic (MD)
simulation methods and can be scaled in an implicitly bottom-up approach within ahierarchical fracture mechanics paradigm.
This report is divided into two parts. The first part details issues related to the
theoretical formulation of a new approach to fracture mechanics wherein basicdefinitions, mathematical modeling approaches, and material systems are discussed. A
fractal-based continuum strain energy release rate is defined. The second part describes a
practical implementation of the developed theoretical formulation in which damagemechanisms are related over length scales. Illustrative simulation results are presented
and future research directions are discussed in the conclusion.
2.0 Theoretical Development
The following subsections discuss fracture mechanics issues related to thehierarchical analysis of polycrystalline metals. These include a description of a
hierarchical fracture analysis, brittle and ductile material fracture behavior, and theenergetics of fracture. An introduction to fractal geometry is detailed which provides a
scale-independent approach for defining a strain energy release rate based on atomisticsimulation of fundamental fracture mechanisms that can be converted to a macroscopic
definition.
2.1 Overview of a Hierarchical Fracture Mechanics Approach
The overall theoretical framework consists of developing a hierarchical methodologyto simulate and link fracture phenomena exhibited at different characteristic length scales.
At the nanoscale (10-9
m - 10-7
m), computations involve atomistic simulation of voids, pores, intergranular and transgranular, and dislocation formation, while accounting for
grain size, orientation and boundary characteristics. For transitioning to the mesoscale
(10-7
m - 10-5
m), a continuum model of polycrystalline grain configurations is developedto simulate realistic cracks from which fracture statistics are generated. Material-specific
grain configurations are generated through Monte Carlo simulations and the response of
the model under applied loads is calculated using a discrete finite element procedure.
Material properties used in this model are obtained from parametric studies of graindeformation and grain boundary response using atomistic analysis. Three important
calculations are performed using the mesoscale continuum model: (i) Failure progression
caused by the development and coalescence of defects; (ii) the computation of statisticalcharacteristics of fracture such as number of crack segments, orientation of crack paths,
and lengths; and (iii) the development of probability density functions for grain boundary
misorientation angles and grain boundary orientation with respect to far-field appliedloads. The fractal properties of cracks are modeled by introducing spatial distribution
functions that represent the geometrical aspects characterizing fracture surfaces and allow
an accurate integration of energies along these rough surfaces. The separation energydensity is integrated using the statistical characterizations of the mesostructure and the
spatial distribution functions. The fractal dimension of the fracture surface provides a
scale factor resulting in a total energy measure valid at the macroscale (10-3
m – 100m).
8/10/2019 Fracture.&Amp;.Fatigue. .Fracture.mechanics. .Nasa
http://slidepdf.com/reader/full/fracturefatigue-fracturemechanics-nasa 7/29
3
2.2 Hierarchical Fracture Processes across Length Scales
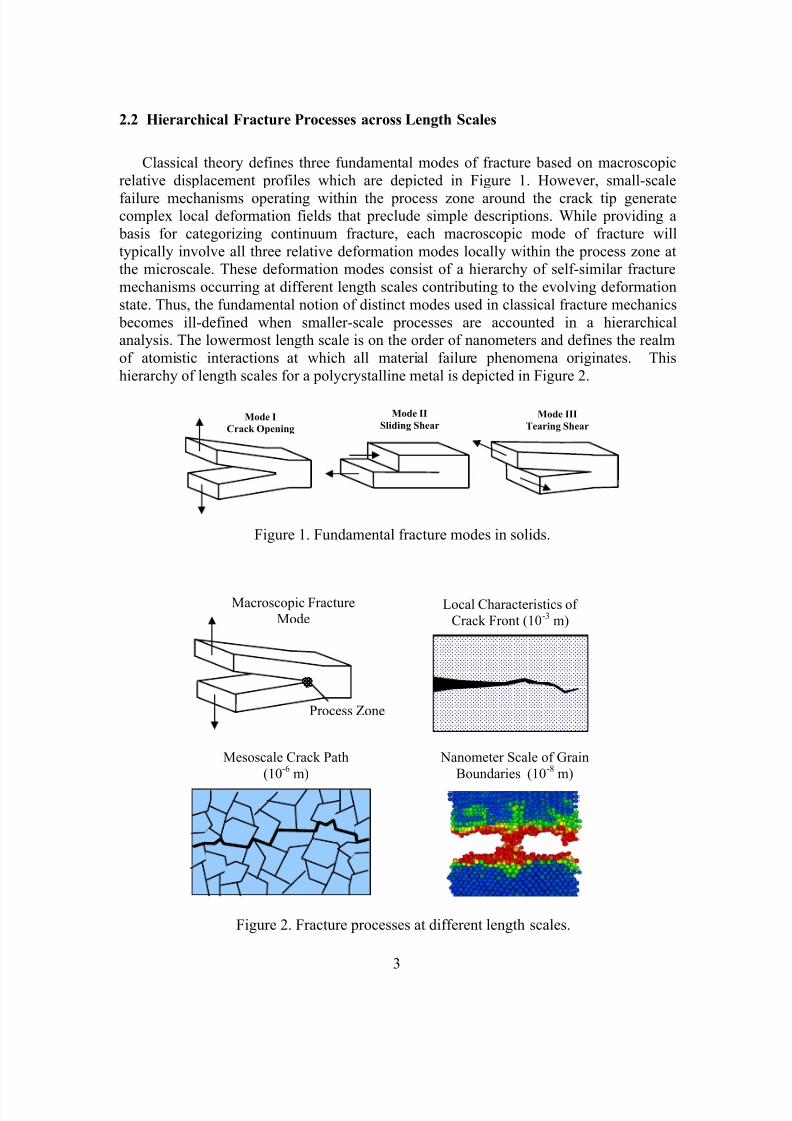
Classical theory defines three fundamental modes of fracture based on macroscopic
relative displacement profiles which are depicted in Figure 1. However, small-scale
failure mechanisms operating within the process zone around the crack tip generatecomplex local deformation fields that preclude simple descriptions. While providing a
basis for categorizing continuum fracture, each macroscopic mode of fracture will
typically involve all three relative deformation modes locally within the process zone atthe microscale. These deformation modes consist of a hierarchy of self-similar fracture
mechanisms occurring at different length scales contributing to the evolving deformation
state. Thus, the fundamental notion of distinct modes used in classical fracture mechanics
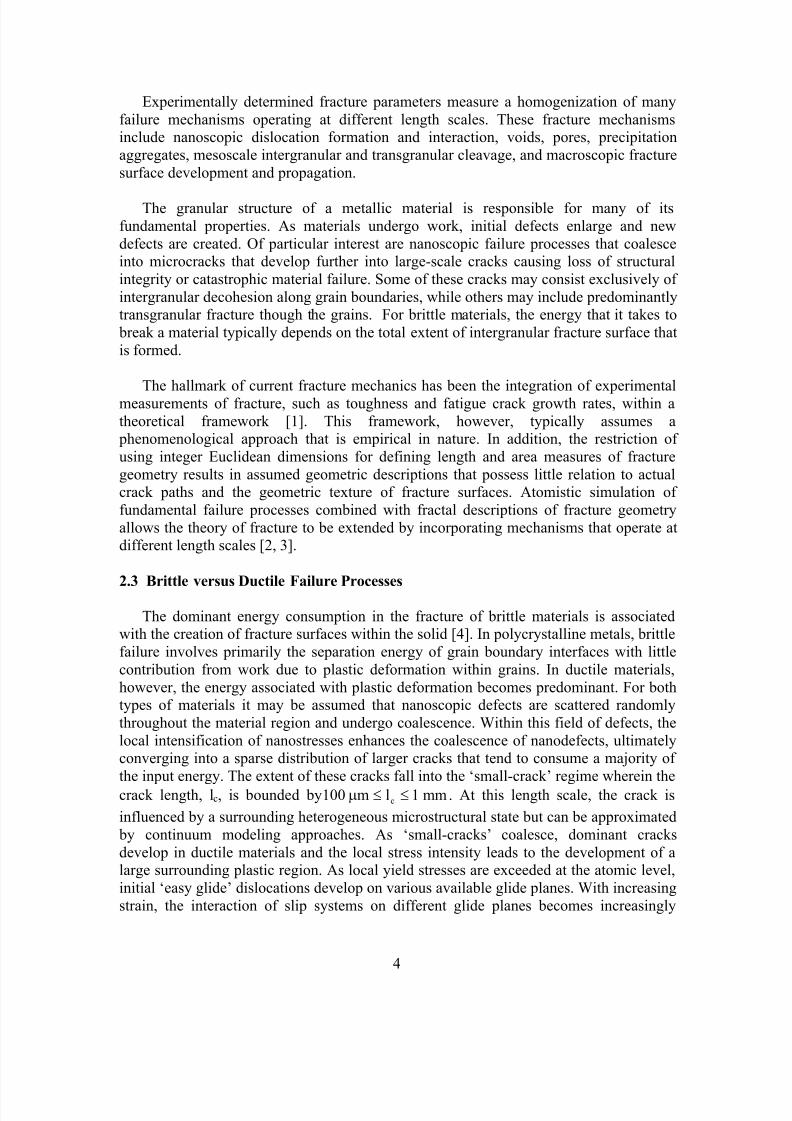
becomes ill-defined when smaller-scale processes are accounted in a hierarchicalanalysis. The lowermost length scale is on the order of nanometers and defines the realm
of atomistic interactions at which all material failure phenomena originates. This
hierarchy of length scales for a polycrystalline metal is depicted in Figure 2.
Figure 1. Fundamental fracture modes in solids.
Mode I
Crack Opening
Mode III
Tearing Shear
Mode II
Sliding Shear
Local Characteristics of
Crack Front (10-3 m)
Figure 2. Fracture processes at different length scales.
Macroscopic Fracture
Mode
Nanometer Scale of Grain
Boundaries (10-8 m)
Mesoscale Crack Path
(10-6 m)
Process Zone
8/10/2019 Fracture.&Amp;.Fatigue. .Fracture.mechanics. .Nasa
http://slidepdf.com/reader/full/fracturefatigue-fracturemechanics-nasa 8/29
4
Experimentally determined fracture parameters measure a homogenization of many
failure mechanisms operating at different length scales. These fracture mechanismsinclude nanoscopic dislocation formation and interaction, voids, pores, precipitation
aggregates, mesoscale intergranular and transgranular cleavage, and macroscopic fracture
surface development and propagation.
The granular structure of a metallic material is responsible for many of its
fundamental properties. As materials undergo work, initial defects enlarge and new
defects are created. Of particular interest are nanoscopic failure processes that coalesceinto microcracks that develop further into large-scale cracks causing loss of structural
integrity or catastrophic material failure. Some of these cracks may consist exclusively of
intergranular decohesion along grain boundaries, while others may include predominantlytransgranular fracture though the grains. For brittle materials, the energy that it takes to
break a material typically depends on the total extent of intergranular fracture surface that
is formed.
The hallmark of current fracture mechanics has been the integration of experimentalmeasurements of fracture, such as toughness and fatigue crack growth rates, within a
theoretical framework [1]. This framework, however, typically assumes a phenomenological approach that is empirical in nature. In addition, the restriction of
using integer Euclidean dimensions for defining length and area measures of fracture
geometry results in assumed geometric descriptions that possess little relation to actualcrack paths and the geometric texture of fracture surfaces. Atomistic simulation of
fundamental failure processes combined with fractal descriptions of fracture geometry
allows the theory of fracture to be extended by incorporating mechanisms that operate atdifferent length scales [2, 3].
2.3 Brittle versus Ductile Failure Processes
The dominant energy consumption in the fracture of brittle materials is associatedwith the creation of fracture surfaces within the solid [4]. In polycrystalline metals, brittle
failure involves primarily the separation energy of grain boundary interfaces with little
contribution from work due to plastic deformation within grains. In ductile materials,
however, the energy associated with plastic deformation becomes predominant. For bothtypes of materials it may be assumed that nanoscopic defects are scattered randomly
throughout the material region and undergo coalescence. Within this field of defects, the
local intensification of nanostresses enhances the coalescence of nanodefects, ultimatelyconverging into a sparse distribution of larger cracks that tend to consume a majority of
the input energy. The extent of these cracks fall into the ‘small-crack’ regime wherein the
crack length, lc, is bounded by mm1lm100 c ≤≤µ . At this length scale, the crack is
influenced by a surrounding heterogeneous microstructural state but can be approximated
by continuum modeling approaches. As ‘small-cracks’ coalesce, dominant cracks
develop in ductile materials and the local stress intensity leads to the development of alarge surrounding plastic region. As local yield stresses are exceeded at the atomic level,
initial ‘easy glide’ dislocations develop on various available glide planes. With increasing
strain, the interaction of slip systems on different glide planes becomes increasingly
8/10/2019 Fracture.&Amp;.Fatigue. .Fracture.mechanics. .Nasa
http://slidepdf.com/reader/full/fracturefatigue-fracturemechanics-nasa 9/29
5
complex and dictates the nature of overall plastic deformation within grains. The
presence of various forms of locking in interacting dislocation systems typically harden amaterial such that further deformation cannot be accommodated through the movement
of dislocations, thus leading to local failure. These phenomena need to be characterized
statistically and incorporated into the current model.
The overall crack path will be determined by the pattern of propagation along
minimum energy paths in the process zone which typically exhibits fractal characteristics.
Various models of grain deformation such as strain gradient plasticity [5] may proveideally suited for simulating ductile material response at mesoscopic length scales. The
current hierarchical model is limited to brittle failure but incorporates a mesoscale
continuum model that can be enhanced to include plasticity. This extension of the presentanalysis to model ductile material behavior is a topic for future research.
2.4 Mathematics of Fractal Geometry
Fractal geometry was originally developed by Mandelbrot [6] and has matured into a broad area of mathematics [7, 8]. These geometric concepts provide a rigorous
representation of irregular yet structured patterns of natural phenomena exhibited over asequence of length scales. Fractal geometries are generated iteratively and possess an
extent that is dependent on the length scale at which segments are measured. For
applications to fracture mechanics, the fractal properties of self-similarity, self-affinity,and multifractality are of particular utility in rigorously defining the texture of crack
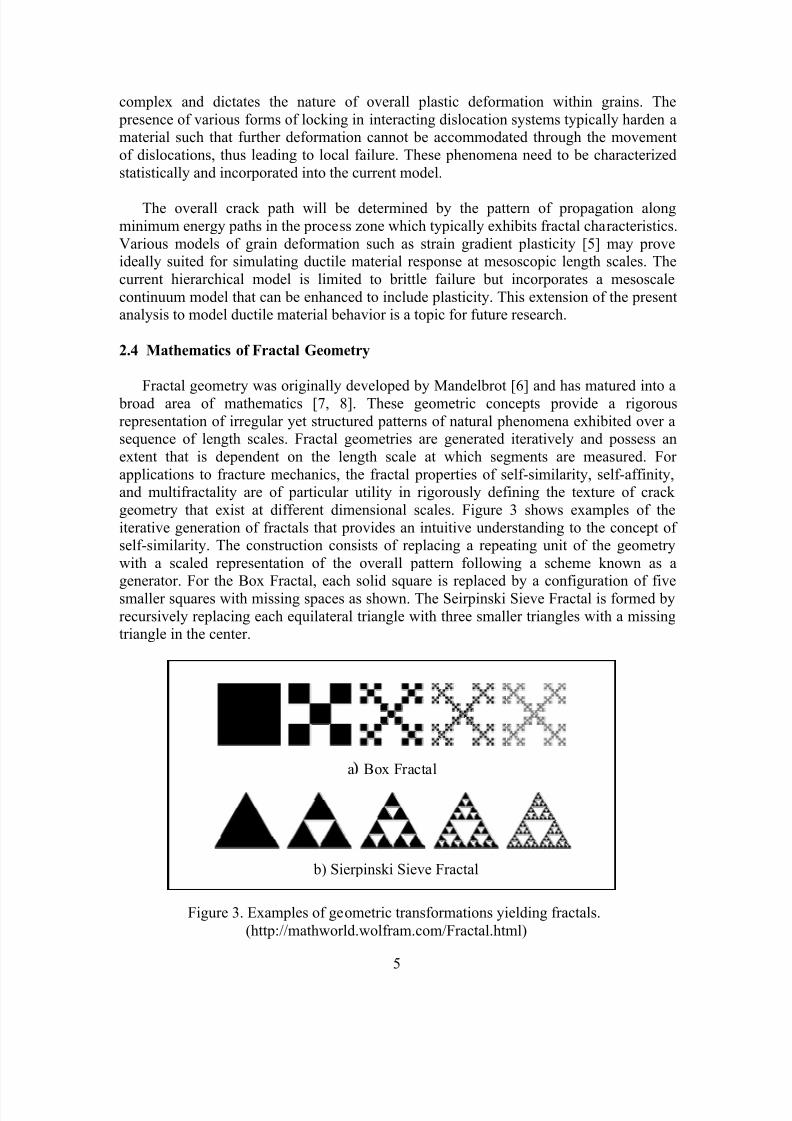
geometry that exist at different dimensional scales. Figure 3 shows examples of the
iterative generation of fractals that provides an intuitive understanding to the concept ofself-similarity. The construction consists of replacing a repeating unit of the geometry
with a scaled representation of the overall pattern following a scheme known as agenerator. For the Box Fractal, each solid square is replaced by a configuration of five
smaller squares with missing spaces as shown. The Seirpinski Sieve Fractal is formed by
recursively replacing each equilateral triangle with three smaller triangles with a missingtriangle in the center.
b) Sierpinski Sieve Fractal
a Box Fractal
Figure 3. Examples of geometric transformations yielding fractals.
(http://mathworld.wolfram.com/Fractal.html)
8/10/2019 Fracture.&Amp;.Fatigue. .Fracture.mechanics. .Nasa
http://slidepdf.com/reader/full/fracturefatigue-fracturemechanics-nasa 10/29
6
Self-affinity is related to self-similarity, differing only in a greater freedom by scaling
the geometry unequally at each iteration of the generator in creating the fractal geometry.Multifractility refers to another increase in modeling freedom by allowing different
generators to operate at different dimensional length scales.
The operations used to generate the fractals in Figure 3 can be expressed rigorously interms of linear transformations that define how one characteristic shape or generator can
be mapped between geometric iterations. In two-dimensions, the linear transformation
corresponding to the generation of a self-similar fractal object between the ith
and (i+1) st
iteration may be described as
β
β+
λ
λ=
+
+
)i(
2
)i(
1
)1i(
2
)1i(
1
x
x
0
0
x
x (1)
where λ and β are stretching and translation parameters, respectively. This transformation
generates a geometrically isotropic fractal where features are identical in both the x1 and x2 coordinates. A related construction yields a fractal with the property of self-affinity.
This transformation is given by
β
β+
λλ
λλ=
+
+
2
1
)i(
2
)i(
1
2221
1211
)1i(
2
)1i(
1
x
x
x
x (2)
which contains different scale factors for x1 and x2, leading to a general directional
dependence or anisotropy of the fractal object. A more general geometry exhibitingmultifractility can be given as a sequence of linear transformations such as Equations (1)
and (2) with mapping parameters that change with the iteration index i.
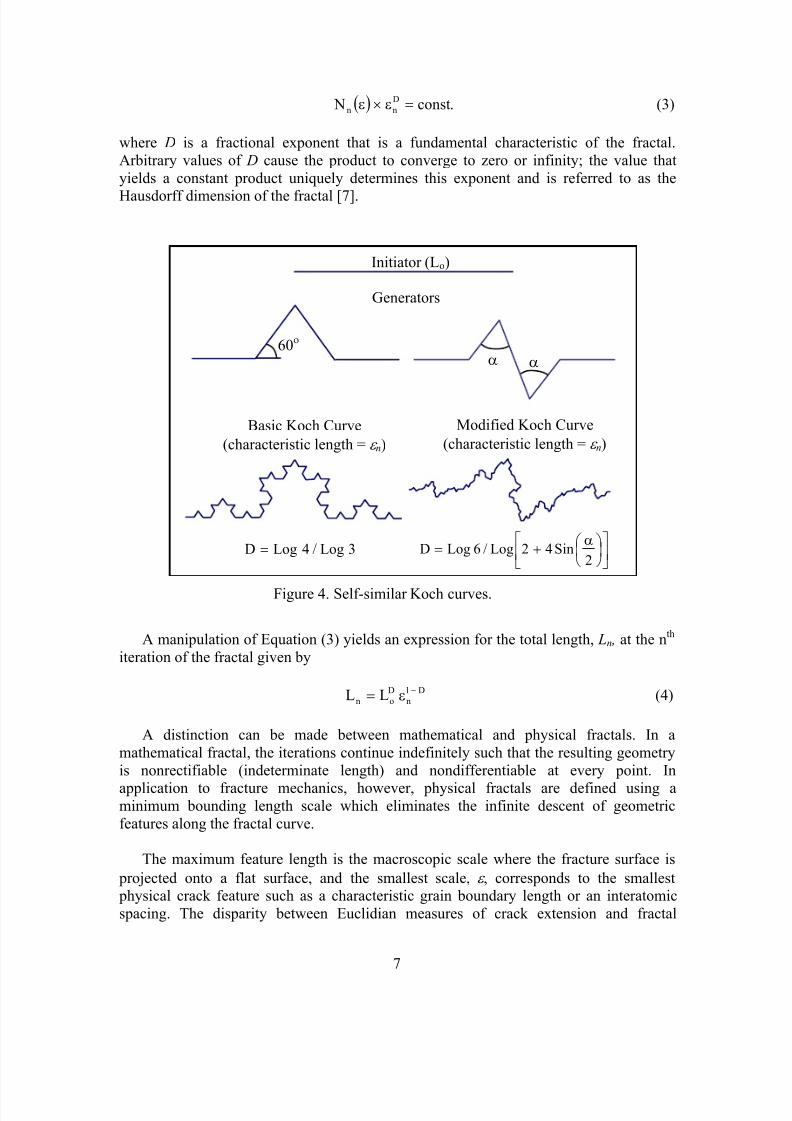
Figure 4 shows two variations of a self-similar fractal known as the Koch Curve [8].
This curve has a direct application to modeling two-dimensional crack paths and shows
how the geometry can be modified through the construction rules. The construction
begins with an initiator of length Lo shown at the top of Figure 4 which is thenrecursively modified by replacing each straight segment by the pattern of the generator.
For the Basic Koch Curve, each iteration, n, replaces a straight segment by four smaller
segments. Thus, at the nth
iteration, the total number of straight segments, N n, is equal to 4
n. Because the distance between the endpoints of the initiator is kept constant, the new
segment lengths, ε n, are equal to Lo /3n. For the Modified Koch Curve, the generator is
more complex such that at each iteration, N n is equal to 6 , and ε n is equal to
Lo /[2+4Sin( α /2)]. As shown graphically in the figure, modifications to the generator havea profound effect on the resulting fractal. While the Basic Koch Curve clearly shows self-
similar features with increasing refinement, the self-similarity of the Modified KochCurve is only discerned under scrutiny and the resulting geometry of the curve begins to
display a distinctly ‘crack-like’ appearance.
The product of the number of segments and the segment length yields a fundamental
relationship for self-similar fractals that can be expressed as:
8/10/2019 Fracture.&Amp;.Fatigue. .Fracture.mechanics. .Nasa
http://slidepdf.com/reader/full/fracturefatigue-fracturemechanics-nasa 11/29
7
( ) .const ND
nn =ε×ε (3)
where D is a fractional exponent that is a fundamental characteristic of the fractal.
Arbitrary values of D cause the product to converge to zero or infinity; the value that
yields a constant product uniquely determines this exponent and is referred to as the
Hausdorff dimension of the fractal [7].
A manipulation of Equation (3) yields an expression for the total length, Ln , at the nth
iteration of the fractal given by
D1
n
D
on LL −ε= (4)
A distinction can be made between mathematical and physical fractals. In a
mathematical fractal, the iterations continue indefinitely such that the resulting geometry
is nonrectifiable (indeterminate length) and nondifferentiable at every point. In
application to fracture mechanics, however, physical fractals are defined using aminimum bounding length scale which eliminates the infinite descent of geometric
features along the fractal curve.
The maximum feature length is the macroscopic scale where the fracture surface is
projected onto a flat surface, and the smallest scale, ε , corresponds to the smallest physical crack feature such as a characteristic grain boundary length or an interatomic
spacing. The disparity between Euclidian measures of crack extension and fractal
Initiator (Lo)
Basic Koch Curve
(characteristic length = ε n)
α+=
2Sin42Log/6LogD3Log/4LogD =
Figure 4. Self-similar Koch curves.
Modified Koch Curve
(characteristic length = ε n)
Generators
60ο
αα
8/10/2019 Fracture.&Amp;.Fatigue. .Fracture.mechanics. .Nasa
http://slidepdf.com/reader/full/fracturefatigue-fracturemechanics-nasa 12/29
8
measures can be significant. For example, if we look at the length magnification of the
modified Koch curve, taking o30=α and a characteristic length of 0.0358 times the
length of the initiator (taken as unity here), one obtains a fractal dimension of 1.6138 and,
from Equation (4), a length magnification of 7.733. Thus, utilizing a more realistic
geometry for surface texture, the total area of fracture surface creation is highly increased
compared to simple smooth crack geometry assumptions.
To determine fractal dimensions of fracture surfaces from experimental data, such asfractographic imaging, various methods may be applied. These methods include slit
island analysis (SIA) [9], fracture profile analysis (FPA) based on a Fourier analysis of
the fracture surface [10,11], vertical section method (VSM), and box counting or
variation method [12]. Experimental errors in determining fractal dimensions can besignificant. However, in the present analysis, fractal dimensions are determined using an
intermediate mesoscale model. This continuum model incorporates the basic physics of
grain formation and stability and defect distribution from which statistically valid fractaldimensions can be determined from a Monte Carlo simulation.
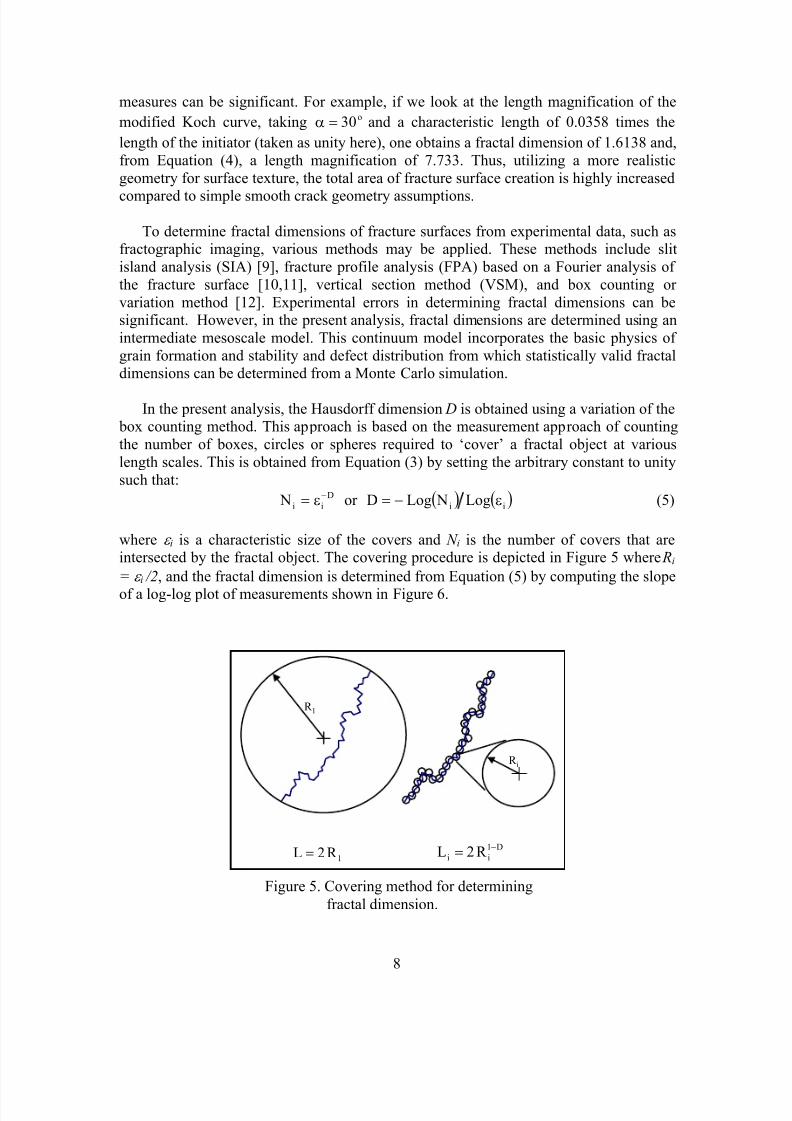
In the present analysis, the Hausdorff dimension D is obtained using a variation of the box counting method. This approach is based on the measurement approach of counting
the number of boxes, circles or spheres required to ‘cover’ a fractal object at various
length scales. This is obtained from Equation (3) by setting the arbitrary constant to unity
such that:
( ) ( )ii
D
ii Log NLogDor N ε−=ε= − (5)
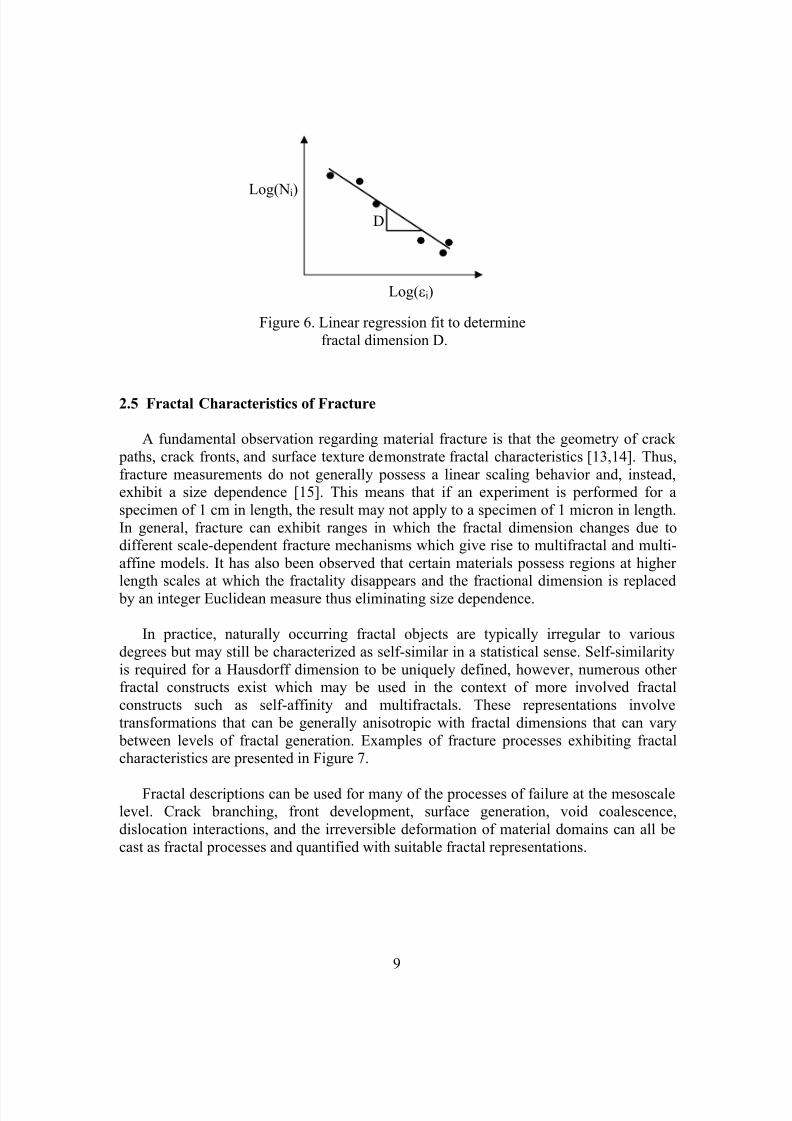
where ε i is a characteristic size of the covers and N i is the number of covers that areintersected by the fractal object. The covering procedure is depicted in Figure 5 where Ri
= ε i /2, and the fractal dimension is determined from Equation (5) by computing the slope
of a log-log plot of measurements shown in Figure 6.
Figure 5. Covering method for determining
fractal dimension.
R 1
R i
1R 2L = D1
ii R 2L −=
8/10/2019 Fracture.&Amp;.Fatigue. .Fracture.mechanics. .Nasa
http://slidepdf.com/reader/full/fracturefatigue-fracturemechanics-nasa 13/29
9
2.5 Fractal Characteristics of Fracture
A fundamental observation regarding material fracture is that the geometry of crack
paths, crack fronts, and surface texture demonstrate fractal characteristics [13,14]. Thus,
fracture measurements do not generally possess a linear scaling behavior and, instead,exhibit a size dependence [15]. This means that if an experiment is performed for a
specimen of 1 cm in length, the result may not apply to a specimen of 1 micron in length.
In general, fracture can exhibit ranges in which the fractal dimension changes due todifferent scale-dependent fracture mechanisms which give rise to multifractal and multi-
affine models. It has also been observed that certain materials possess regions at higherlength scales at which the fractality disappears and the fractional dimension is replaced
by an integer Euclidean measure thus eliminating size dependence.
In practice, naturally occurring fractal objects are typically irregular to various
degrees but may still be characterized as self-similar in a statistical sense. Self-similarity
is required for a Hausdorff dimension to be uniquely defined, however, numerous otherfractal constructs exist which may be used in the context of more involved fractal
constructs such as self-affinity and multifractals. These representations involve
transformations that can be generally anisotropic with fractal dimensions that can vary
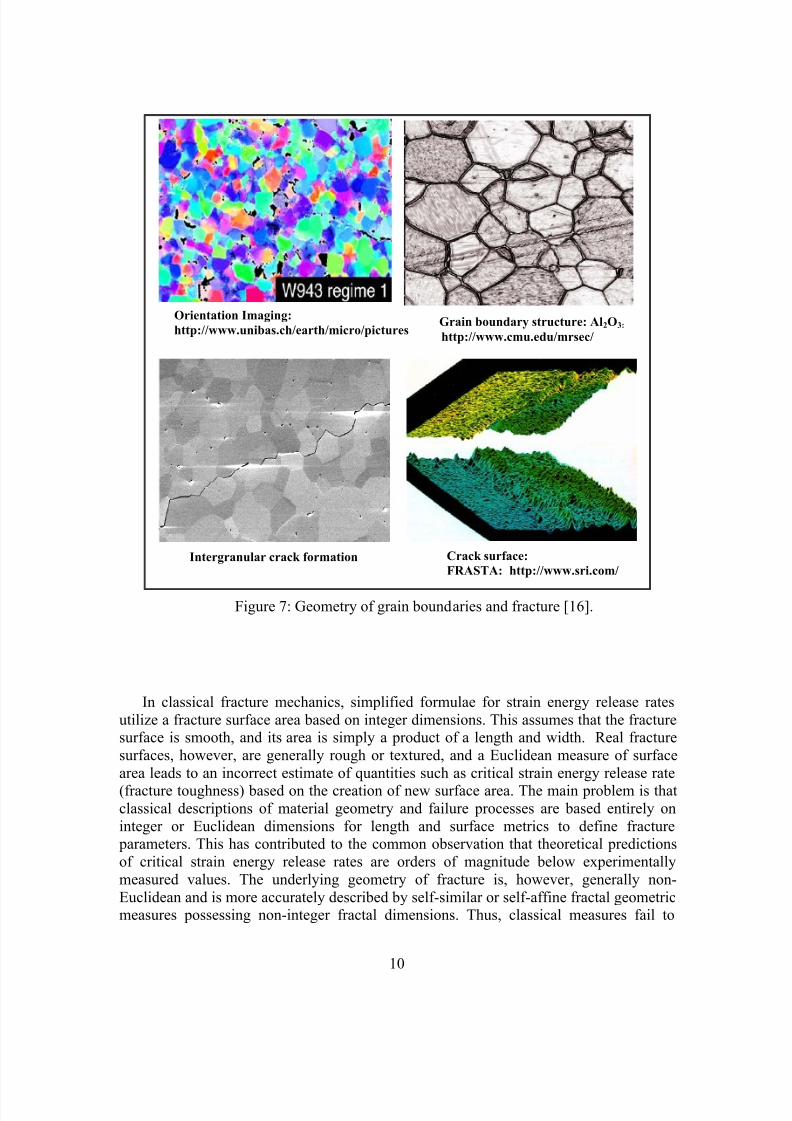
between levels of fractal generation. Examples of fracture processes exhibiting fractalcharacteristics are presented in Figure 7.
Fractal descriptions can be used for many of the processes of failure at the mesoscalelevel. Crack branching, front development, surface generation, void coalescence,
dislocation interactions, and the irreversible deformation of material domains can all be
cast as fractal processes and quantified with suitable fractal representations.
D
Log(Ni)
Log(εi)
Figure 6. Linear regression fit to determine
fractal dimension D.
8/10/2019 Fracture.&Amp;.Fatigue. .Fracture.mechanics. .Nasa
http://slidepdf.com/reader/full/fracturefatigue-fracturemechanics-nasa 14/29
10
In classical fracture mechanics, simplified formulae for strain energy release rates
utilize a fracture surface area based on integer dimensions. This assumes that the fracturesurface is smooth, and its area is simply a product of a length and width. Real fracture
surfaces, however, are generally rough or textured, and a Euclidean measure of surface
area leads to an incorrect estimate of quantities such as critical strain energy release rate
(fracture toughness) based on the creation of new surface area. The main problem is thatclassical descriptions of material geometry and failure processes are based entirely on
integer or Euclidean dimensions for length and surface metrics to define fracture parameters. This has contributed to the common observation that theoretical predictions
of critical strain energy release rates are orders of magnitude below experimentally
measured values. The underlying geometry of fracture is, however, generally non-
Euclidean and is more accurately described by self-similar or self-affine fractal geometricmeasures possessing non-integer fractal dimensions. Thus, classical measures fail to
Crack surface:
FRASTA: http://www.sri.com/
Orientation Imaging:
http://www.unibas.ch/earth/micro/picturesGrain boundary structure: Al2O3:
http://www.cmu.edu/mrsec/
Intergranular crack formation
Figure 7: Geometry of grain boundaries and fracture [16].
8/10/2019 Fracture.&Amp;.Fatigue. .Fracture.mechanics. .Nasa
http://slidepdf.com/reader/full/fracturefatigue-fracturemechanics-nasa 15/29
11
capture the microstructure of a fracture surface and the effective area relevant to energy
calculations.
Previous investigations have been published in which fractal geometry constructs
have been directly incorporated into classical continuum definitions of fracture
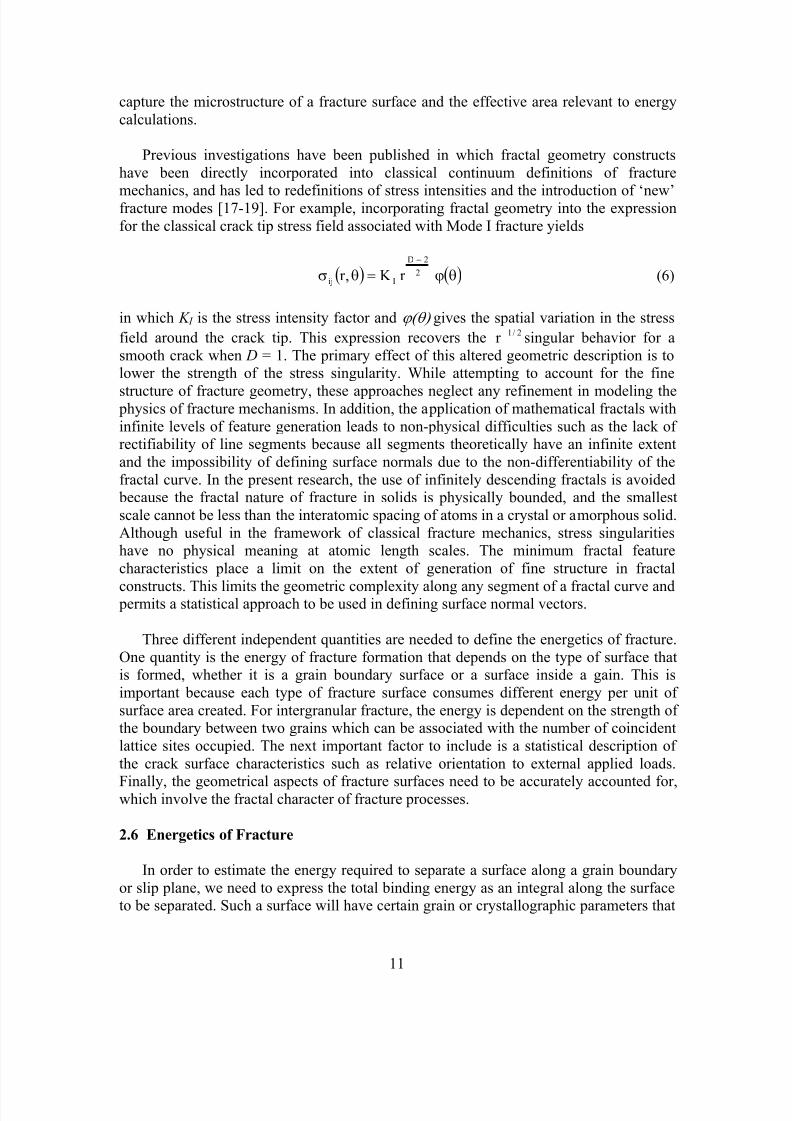
mechanics, and has led to redefinitions of stress intensities and the introduction of ‘new’fracture modes [17-19]. For example, incorporating fractal geometry into the expression
for the classical crack tip stress field associated with Mode I fracture yields
( ) ( )θϕ=θσ−
2
2D
Iij r K ,r (6)
in which K I is the stress intensity factor and ϕ(θ) gives the spatial variation in the stress
field around the crack tip. This expression recovers the 2/1r − singular behavior for a
smooth crack when D = 1. The primary effect of this altered geometric description is tolower the strength of the stress singularity. While attempting to account for the fine
structure of fracture geometry, these approaches neglect any refinement in modeling the physics of fracture mechanisms. In addition, the application of mathematical fractals with
infinite levels of feature generation leads to non-physical difficulties such as the lack ofrectifiability of line segments because all segments theoretically have an infinite extent
and the impossibility of defining surface normals due to the non-differentiability of the
fractal curve. In the present research, the use of infinitely descending fractals is avoided because the fractal nature of fracture in solids is physically bounded, and the smallest
scale cannot be less than the interatomic spacing of atoms in a crystal or amorphous solid.
Although useful in the framework of classical fracture mechanics, stress singularitieshave no physical meaning at atomic length scales. The minimum fractal feature
characteristics place a limit on the extent of generation of fine structure in fractal
constructs. This limits the geometric complexity along any segment of a fractal curve and permits a statistical approach to be used in defining surface normal vectors.
Three different independent quantities are needed to define the energetics of fracture.
One quantity is the energy of fracture formation that depends on the type of surface thatis formed, whether it is a grain boundary surface or a surface inside a gain. This is
important because each type of fracture surface consumes different energy per unit of
surface area created. For intergranular fracture, the energy is dependent on the strength ofthe boundary between two grains which can be associated with the number of coincident
lattice sites occupied. The next important factor to include is a statistical description of
the crack surface characteristics such as relative orientation to external applied loads.
Finally, the geometrical aspects of fracture surfaces need to be accurately accounted for,which involve the fractal character of fracture processes.
2.6 Energetics of Fracture
In order to estimate the energy required to separate a surface along a grain boundary
or slip plane, we need to express the total binding energy as an integral along the surfaceto be separated. Such a surface will have certain grain or crystallographic parameters that
8/10/2019 Fracture.&Amp;.Fatigue. .Fracture.mechanics. .Nasa
http://slidepdf.com/reader/full/fracturefatigue-fracturemechanics-nasa 16/29
12
describe it. For example, these nanostructural parameters include grain orientation,
mismatch angle and order of coincident lattice sites when dealing with an intergranularcrack, and the orientation and initiation of crystal slip systems when dealing with
transgranular fracture surfaces, etc. The values of these parameters may be defined as a
function of the normal to the surface of the crack. The orientation of the surface normal is
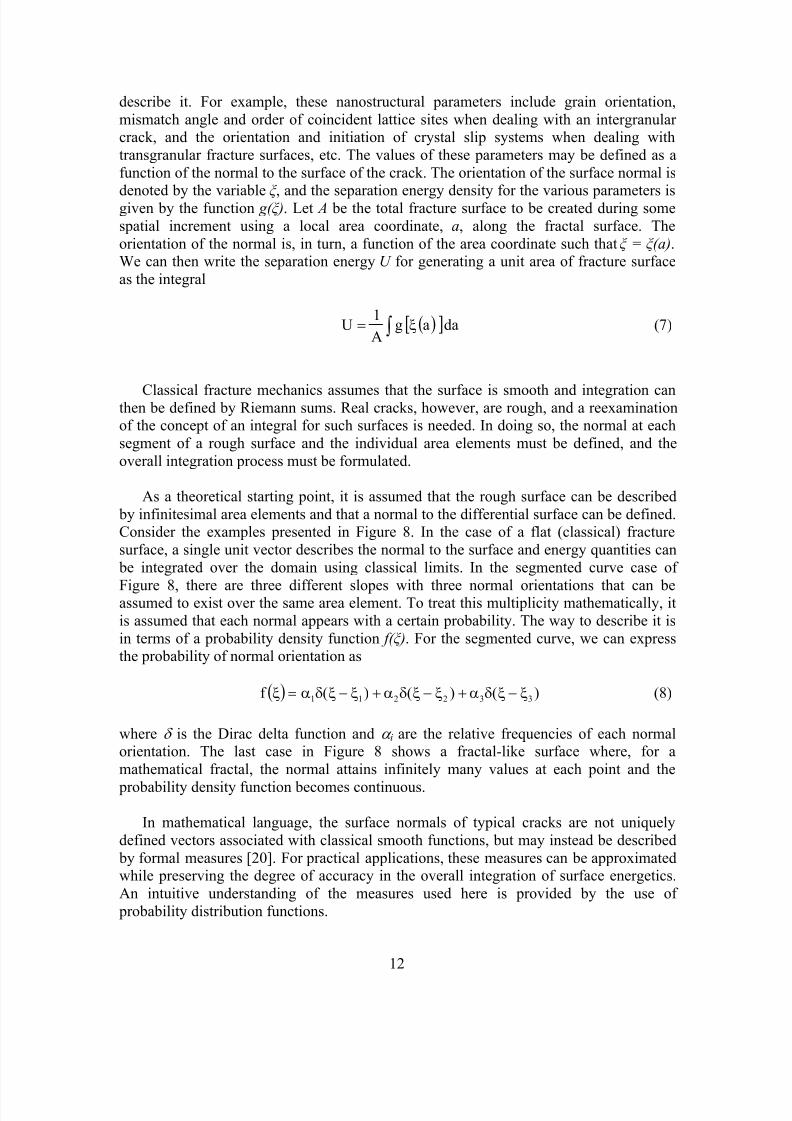
denoted by the variable ξ , and the separation energy density for the various parameters isgiven by the function g( ξ ). Let A be the total fracture surface to be created during some
spatial increment using a local area coordinate, a, along the fractal surface. The
orientation of the normal is, in turn, a function of the area coordinate such that ξ = ξ (a).We can then write the separation energy U for generating a unit area of fracture surface
as the integral
( )[ ]∫ ξ= daagA
1U (7)
Classical fracture mechanics assumes that the surface is smooth and integration canthen be defined by Riemann sums. Real cracks, however, are rough, and a reexaminationof the concept of an integral for such surfaces is needed. In doing so, the normal at each
segment of a rough surface and the individual area elements must be defined, and the
overall integration process must be formulated.
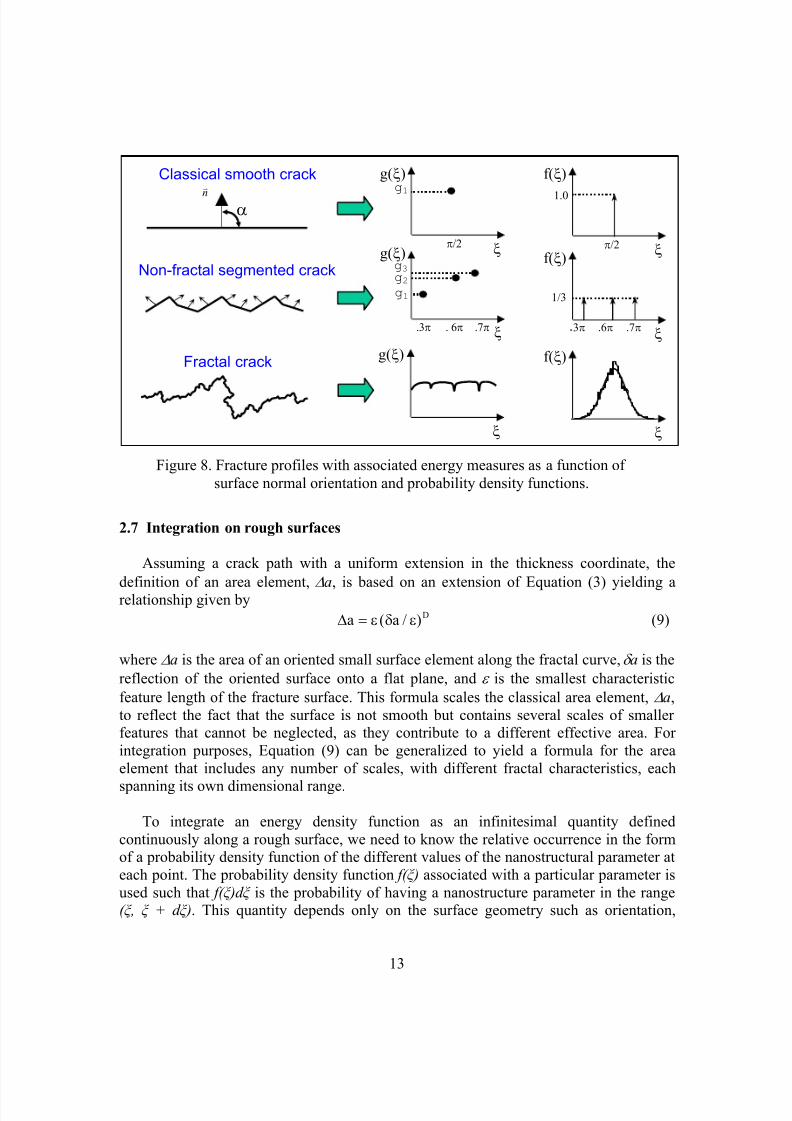
As a theoretical starting point, it is assumed that the rough surface can be described
by infinitesimal area elements and that a normal to the differential surface can be defined.Consider the examples presented in Figure 8. In the case of a flat (classical) fracture
surface, a single unit vector describes the normal to the surface and energy quantities can
be integrated over the domain using classical limits. In the segmented curve case of
Figure 8, there are three different slopes with three normal orientations that can beassumed to exist over the same area element. To treat this multiplicity mathematically, it
is assumed that each normal appears with a certain probability. The way to describe it is
in terms of a probability density function f( ξ ). For the segmented curve, we can expressthe probability of normal orientation as
( ) )()()(f 332211 ξ−ξδα+ξ−ξδα+ξ−ξδα=ξ (8)
where δ is the Dirac delta function and α i are the relative frequencies of each normalorientation. The last case in Figure 8 shows a fractal-like surface where, for a
mathematical fractal, the normal attains infinitely many values at each point and the
probability density function becomes continuous.
In mathematical language, the surface normals of typical cracks are not uniquely
defined vectors associated with classical smooth functions, but may instead be described
by formal measures [20]. For practical applications, these measures can be approximatedwhile preserving the degree of accuracy in the overall integration of surface energetics.
An intuitive understanding of the measures used here is provided by the use of
probability distribution functions.
8/10/2019 Fracture.&Amp;.Fatigue. .Fracture.mechanics. .Nasa
http://slidepdf.com/reader/full/fracturefatigue-fracturemechanics-nasa 17/29
13
2.7 Integration on rough surfaces
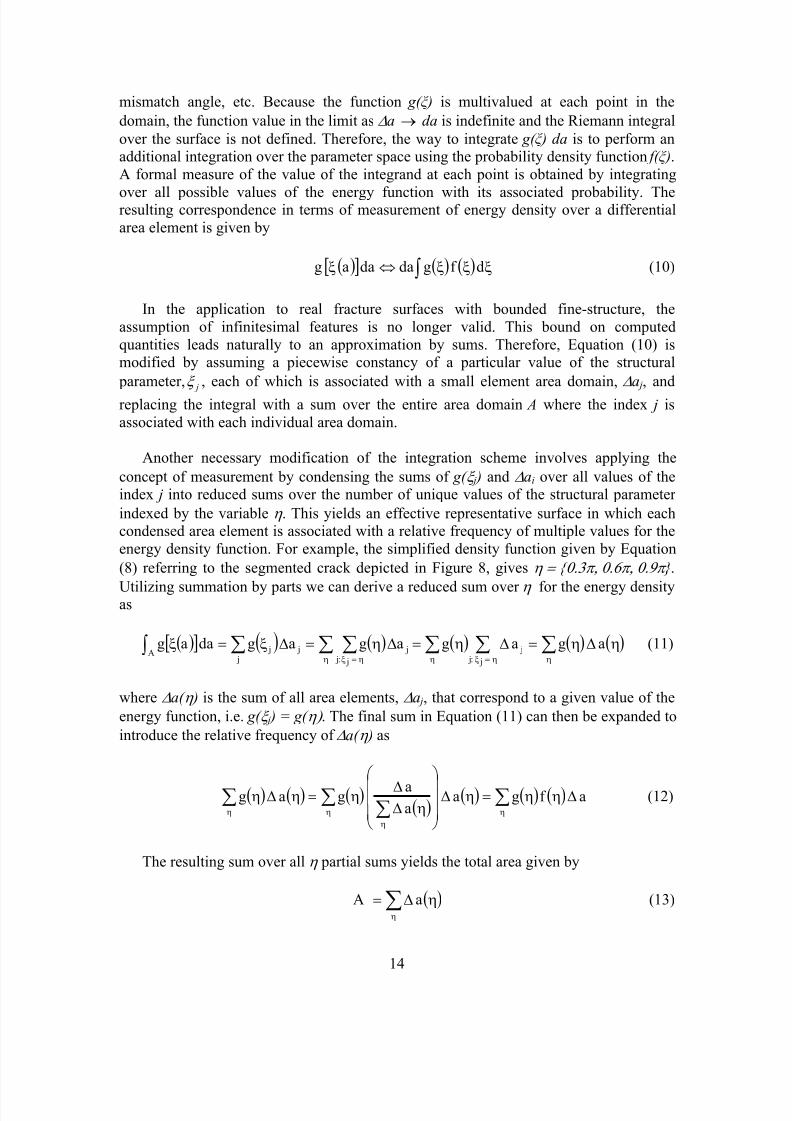
Assuming a crack path with a uniform extension in the thickness coordinate, the
definition of an area element, ∆a, is based on an extension of Equation (3) yielding arelationship given byD)/a(a εδε=∆ (9)
where ∆a is the area of an oriented small surface element along the fractal curve, δ a is the
reflection of the oriented surface onto a flat plane, and ε is the smallest characteristic
feature length of the fracture surface. This formula scales the classical area element, ∆a,
to reflect the fact that the surface is not smooth but contains several scales of smallerfeatures that cannot be neglected, as they contribute to a different effective area. For
integration purposes, Equation (9) can be generalized to yield a formula for the area
element that includes any number of scales, with different fractal characteristics, each
spanning its own dimensional range.
To integrate an energy density function as an infinitesimal quantity defined
continuously along a rough surface, we need to know the relative occurrence in the formof a probability density function of the different values of the nanostructural parameter at
each point. The probability density function f( ξ ) associated with a particular parameter is
used such that f( ξ )d ξ is the probability of having a nanostructure parameter in the range( ξ , ξ + d ξ ). This quantity depends only on the surface geometry such as orientation,
g(ξ)π/2
1.0
ξ
f(ξ)
3π
1/3
ξ
f(ξ)
.6π .7π
ξ
f(ξ)
n
v
α
Classical smooth crack
Non-fractal segmented crack
Fractal crack
ξ
π/2 ξ
g(ξ)
.3π . 6π .7π
ξ
g(ξ)
g3 g2g1
g1
Figure 8. Fracture profiles with associated energy measures as a function of
surface normal orientation and probability density functions.
8/10/2019 Fracture.&Amp;.Fatigue. .Fracture.mechanics. .Nasa
http://slidepdf.com/reader/full/fracturefatigue-fracturemechanics-nasa 18/29
14
mismatch angle, etc. Because the function g( ξ ) is multivalued at each point in the
domain, the function value in the limit as ∆a → da is indefinite and the Riemann integral
over the surface is not defined. Therefore, the way to integrate g( ξ ) da is to perform anadditional integration over the parameter space using the probability density function f( ξ ).
A formal measure of the value of the integrand at each point is obtained by integrating
over all possible values of the energy function with its associated probability. Theresulting correspondence in terms of measurement of energy density over a differential
area element is given by
( )[ ] ( ) ( )∫ ξξξ⇔ξ df gdadaag (10)
In the application to real fracture surfaces with bounded fine-structure, the
assumption of infinitesimal features is no longer valid. This bound on computed
quantities leads naturally to an approximation by sums. Therefore, Equation (10) ismodified by assuming a piecewise constancy of a particular value of the structural
parameter, jξ , each of which is associated with a small element area domain, ∆a j, and
replacing the integral with a sum over the entire area domain A where the index j is
associated with each individual area domain.
Another necessary modification of the integration scheme involves applying the
concept of measurement by condensing the sums of g( ξ j ) and ∆ai over all values of theindex j into reduced sums over the number of unique values of the structural parameter
indexed by the variable η . This yields an effective representative surface in which eachcondensed area element is associated with a relative frequency of multiple values for the
energy density function. For example, the simplified density function given by Equation
(8) referring to the segmented crack depicted in Figure 8, gives η = {0.3π, 0.6π, 0.9π }.
Utilizing summation by parts we can derive a reduced sum over η for the energy densityas
( )[ ] ( ) ( ) ( ) ( ) ( )∑ ∑ ∑∑ ∑ ∑∫η η=ξ ηη η=ξ
η∆η=∆η=∆η=∆ξ=ξ agagagagdaag j: j
j j
j
j: j j jA
(11)
where ∆a( η ) is the sum of all area elements, ∆a j, that correspond to a given value of the
energy function, i.e. g( ξ j ) = g( η) . The final sum in Equation (11) can then be expanded to
introduce the relative frequency of ∆a( η ) as
( ) ( ) ( )( )
( ) ( ) ( ) af gaaagag ∆ηη=η∆
η∆∆η=η∆η ∑∑∑∑
ηη
ηη
(12)
The resulting sum over all η partial sums yields the total area given by
( )∑η
η∆= aA (13)
8/10/2019 Fracture.&Amp;.Fatigue. .Fracture.mechanics. .Nasa
http://slidepdf.com/reader/full/fracturefatigue-fracturemechanics-nasa 19/29
15
and the probability density function )(η f for the η th
value of the energy density is given
by
( ) ( )
( )∑η
η∆η∆
=ηa
af (14)
This ratio represents the relative occurrences of ∆aη for which the nanostructural
parameter ξ η attains a distinct value with respect to the local area, ∆a. Thus, we may nowwrite the final relationship between the integrated value of the function g( ξ ) over the
physical domain, A, in terms of discretized measures as
( )[ ] ( ) ( )∑∫η
ηη=ξ f gAdaagA
(15)
This yields a constructive way for obtaining the relative frequency of the value g(η )
given in Equation (15). Thus, the integral of the energy density function with multivaluedfunctions expressed in terms of probabilities is a directly computable quantity, obtained by a simple consideration of the surface geometry.
2.8 Strain Energy Release Rate
The application of these ideas can now be used to define a strain energy release rate.
In the hierarchical model developed here, information must be combined across severaldimensional scales. At the nanoscale, the complete material energetics defined by several
nanostructural variables may be characterized by a multivariate separation energy density
function, g [χ ι (ξ )], obtained from atomistic simulation. At mesoscale dimensions, the
crack surface characterization may be described by a density function of relevant valuesof nanostrutural parameters, f [χ ι (ξ )]. The density function is obtained from a mesoscopic percolation model in which a sequence of random grain structures and crack propagation
is repeatedly analyzed to accumulate the statistics of crack profiles causing material
separation. The progression of a particular ‘realized’ crack through the material domaincausing complete separation of the model is referred to as crack percolation. Performing
meso-to-macroscale transformation of crack energy is accomplished by scaling using the
fractal dimension that persists over several orders of magnitude. This scaling is expressed by an area definition given by
∫
−ε=A
D1D
oAda (16)
where Ao is the projection of the total fracture surface onto a flat plane.
Putting all these together, the standard definition of strain energy release for a solid
based on surface energy γ s [4] and plastic deformation energy γ p [21] given by
8/10/2019 Fracture.&Amp;.Fatigue. .Fracture.mechanics. .Nasa
http://slidepdf.com/reader/full/fracturefatigue-fracturemechanics-nasa 20/29
16
ps
c
c 2A
UG γ+γ=
∂∂
= (17)
can be replaced with a definition that accounts for the fractal nature of the surface andatomistic mechanisms of energy consumption along the surface given by
( )[ ]( ) ( ) ( ) ( )∑∫
∫∫
=
−−−− ξξε=ξξξε=ξ
== N
1iii
1DD
o
1DD
o
A
A f gAdf gAda
daaggG (18)
where N is the number of unique values in the discrete spectrum of the nanostructural
parameters. Equation (18) constitutes a replacement of the empirical definition of
classical strain energy release by relating the probability density of nanoscale unit energymeasures of fracture surface creation obtained by atomistic simulation to macroscopic
length scales. This relationship is rigorously quantified by the use of the fractal
dimension which constitutes a magnification factor that yields a true measure of created
fracture surface areas. The present formulation is focused on brittle fracture in which γ s is
the predominant contributor to crack energetics. The treatment of dislocation mechanisms
and associated energy dissipation contributing to the plastic work, γ p, which predominate
in the fracture of ductile materials remains a topic of future work.
3.0 Practical Implementation
A computational framework is introduced for incorporating the results of atomisticsimulations into a mesoscopic percolation model of fracture in polycrystalline metals
from which macroscopic fracture parameters can be predicted.
The theoretical approach presented in Sections 2.0 to 2.8 for estimating strain energy
release rate incorporates several physical and geometric quantities. Specifically,
information is needed regarding separation energies, g( ξ ), fracture characterization, f( ξ ),and fractal dimension, D. To find a relation between g( ξ ), f( ξ ), and D, a mesoscopic
simulation procedure is developed using a percolation model of crack formation and
propagation.
3.1 A Computational Framework
In order to achieve a realistic estimate of macroscopic fracture parameters of interest,failure phenomena must be modeled over several dimensional scales. Atomistic
simulation can give realistic approximations of intergranular and transgranular separation
energies at the nanoscale. These simulations need to be performed for the full spectrumof grain orientations, boundary mismatch angles, etc. such that the parameter space is
fully sampled. At the grain level, the energy of grain boundary separation and dislocation
evolution must be calculated as a result of mechanical and thermal stresses. At themesoscale level, a large network of grains needs to be modeled in order to simulate the
8/10/2019 Fracture.&Amp;.Fatigue. .Fracture.mechanics. .Nasa
http://slidepdf.com/reader/full/fracturefatigue-fracturemechanics-nasa 21/29
17
formation of complex crack structures. The result of these Monte Carlo-type simulations
can then be applied to develop statistics of fracture formation and propagation.
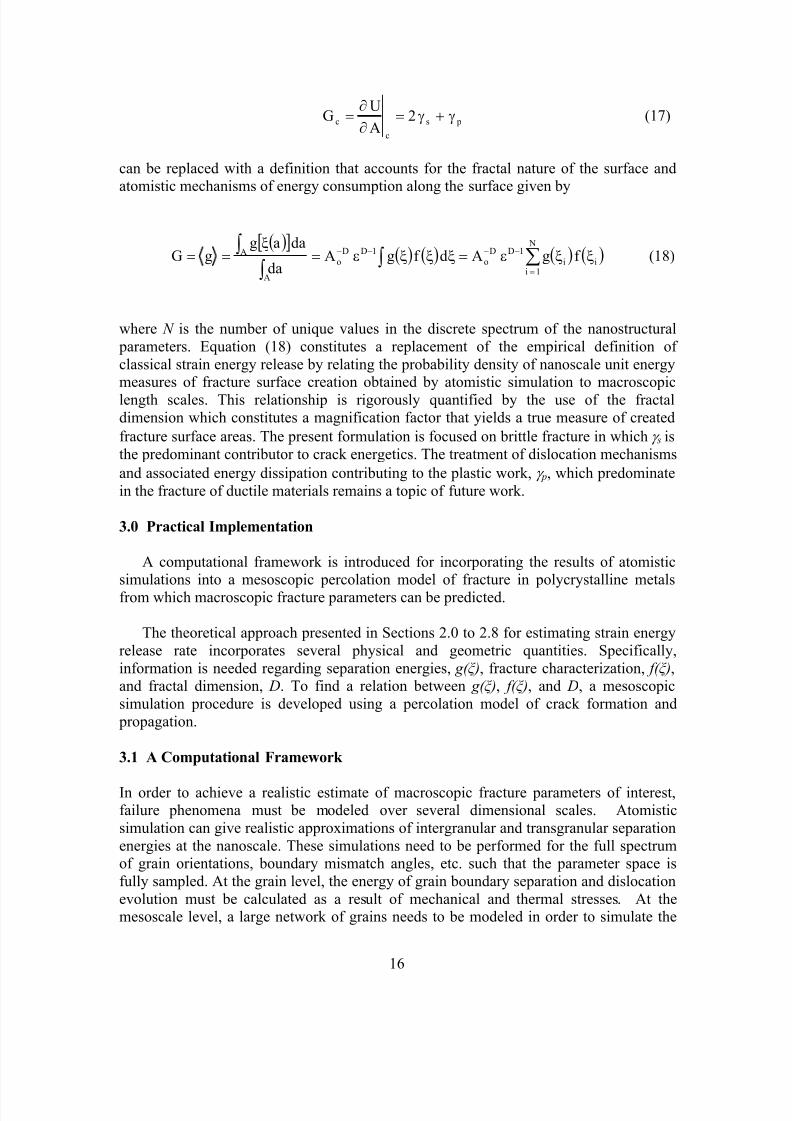
3.2 Atomistic Simulation of Fracture
Nanoscale simulation of fracture phenomena is performed using molecular dynamicmethods for calculating atomic trajectories and interaction energies [22,23]. Basic
phenomena of intragranular dislocation formation and progression, and separation along
grain boundaries can be simulated such that the relevant physical quantities of separation
energy can be determined. These quantities are calculated for a range of parametric
values that are then integrated using appropriate probabilistic distributions to obtain astatistical summation such as given by Equation (18). These simulations provide
predictions of grain boundary strength based on relative angular orientation of adjacent
grains and the energy consumed in the coalescence of voids in an idealized grain field.
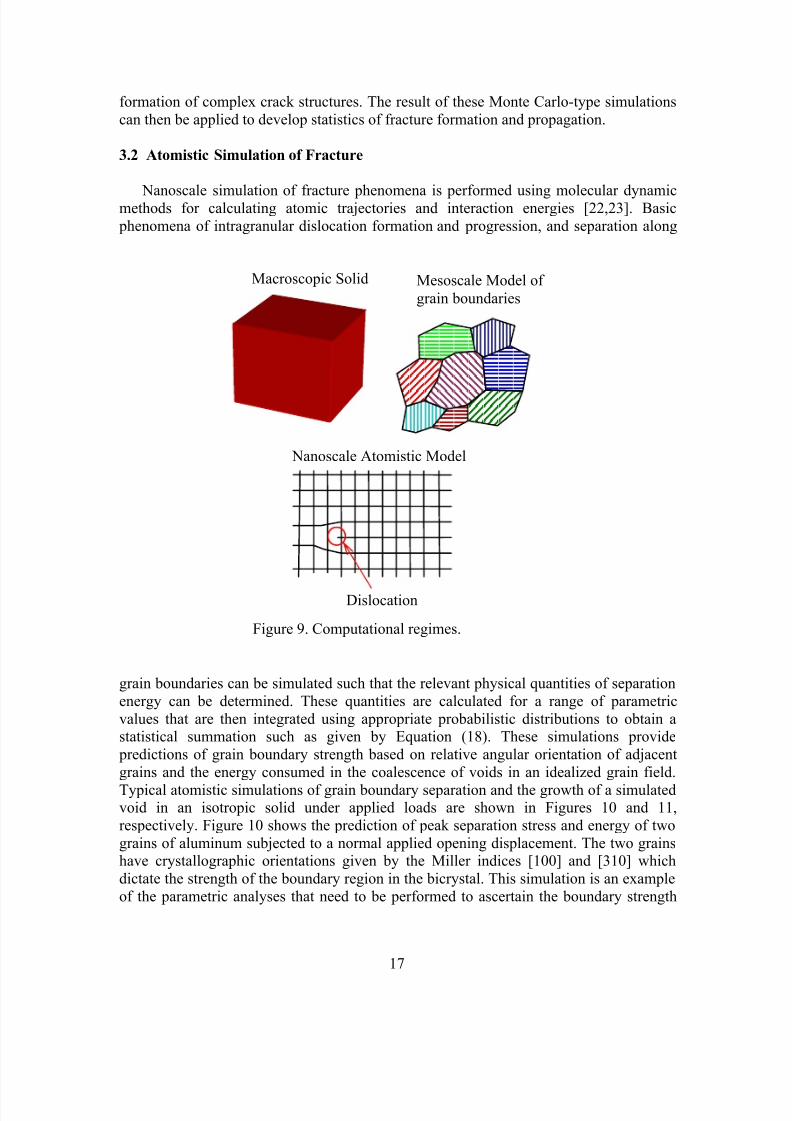
Typical atomistic simulations of grain boundary separation and the growth of a simulatedvoid in an isotropic solid under applied loads are shown in Figures 10 and 11,
respectively. Figure 10 shows the prediction of peak separation stress and energy of two
grains of aluminum subjected to a normal applied opening displacement. The two grainshave crystallographic orientations given by the Miller indices [100] and [310] which
dictate the strength of the boundary region in the bicrystal. This simulation is an example
of the parametric analyses that need to be performed to ascertain the boundary strength
Macroscopic Solid
Dislocation
Nanoscale Atomistic Model
Mesoscale Model of
grain boundaries
Figure 9. Computational regimes.
8/10/2019 Fracture.&Amp;.Fatigue. .Fracture.mechanics. .Nasa
http://slidepdf.com/reader/full/fracturefatigue-fracturemechanics-nasa 22/29
18
A v e r a g e n o r m a l s t r e s s ( G P a )
Far-field normal displacement (Å)
10.0
-5.0
0.0
5.0
10.0
15.0
0.0 1.0 2.0 3.0 4.0 5.0 6.0 7.0 8.0 9.0 10
σ yy
σ yy
σ yy
σ yy
σ yy
σ yy
Stress wave oscillationsafter grain separation
Maximum normal stressat boundary separation
[100]
[310]
σ yy
σ yy
A v e r a g e n o r m a l s t r e s s ( G P a )
Far-field normal displacement (Å)
10.0
-5.0
0.0
5.0
10.0
15.0
0.0 1.0 2.0 3.0 4.0 5.0 6.0 7.0 8.0 9.0 10
σ yy
σ yy
σ yy
σ yy
σ yy
σ yy
Stress wave oscillationsafter grain separation
Maximum normal stressat boundary separation
[100]
[310]
σ yy
σ yy
σ yy
σ yy
Figure 10: Atomistic simulation of separation between [100] and [310] planes of Al.
between grains of different relative orientation. These types of simulations can be used to
predict the energetics of brittle intergranular fracture.
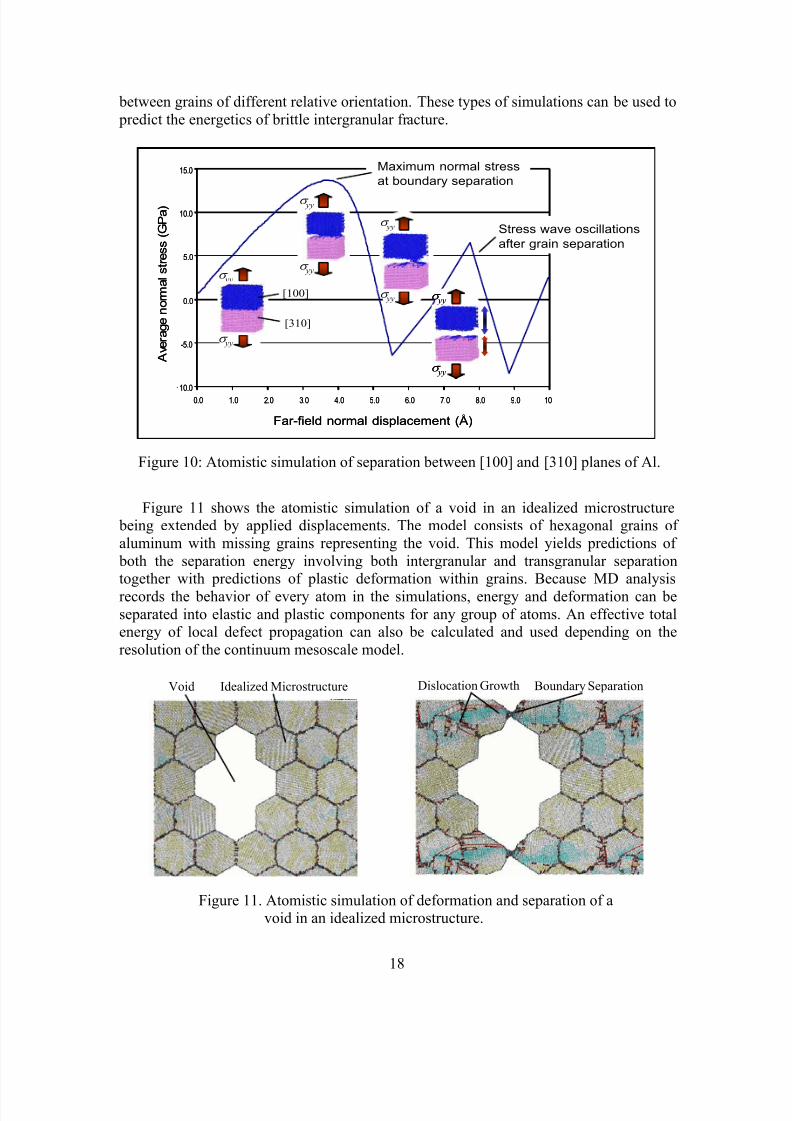
Figure 11 shows the atomistic simulation of a void in an idealized microstructure being extended by applied displacements. The model consists of hexagonal grains of
aluminum with missing grains representing the void. This model yields predictions of
both the separation energy involving both intergranular and transgranular separationtogether with predictions of plastic deformation within grains. Because MD analysis
records the behavior of every atom in the simulations, energy and deformation can be
separated into elastic and plastic components for any group of atoms. An effective totalenergy of local defect propagation can also be calculated and used depending on the
resolution of the continuum mesoscale model.
Figure 11. Atomistic simulation of deformation and separation of avoid in an idealized microstructure.
Void Idealized Microstructure Dislocation Growth Boundary Separation
8/10/2019 Fracture.&Amp;.Fatigue. .Fracture.mechanics. .Nasa
http://slidepdf.com/reader/full/fracturefatigue-fracturemechanics-nasa 23/29
19
The parametrically calculated energies of fracture formation obtained fromnanoscopic models of atomistic mechanisms are used as input to a mesoscale model of
fracture development. Computing crack propagation due to intergranular and
transgranular fracture constitutes a general percolation sequence and, for that reason, the
mesoscale representation is labeled a Percolation Model. The inputs to this model aregrain structure, grain boundary strengths, and intergranular separation energy used to
efficiently simulate a multitude of simulated fracture profiles for statistical interpretation.
In the current study, mechanisms associated with plasticity are neglected.
3.3 A Percolation Model of Crack Coalescence
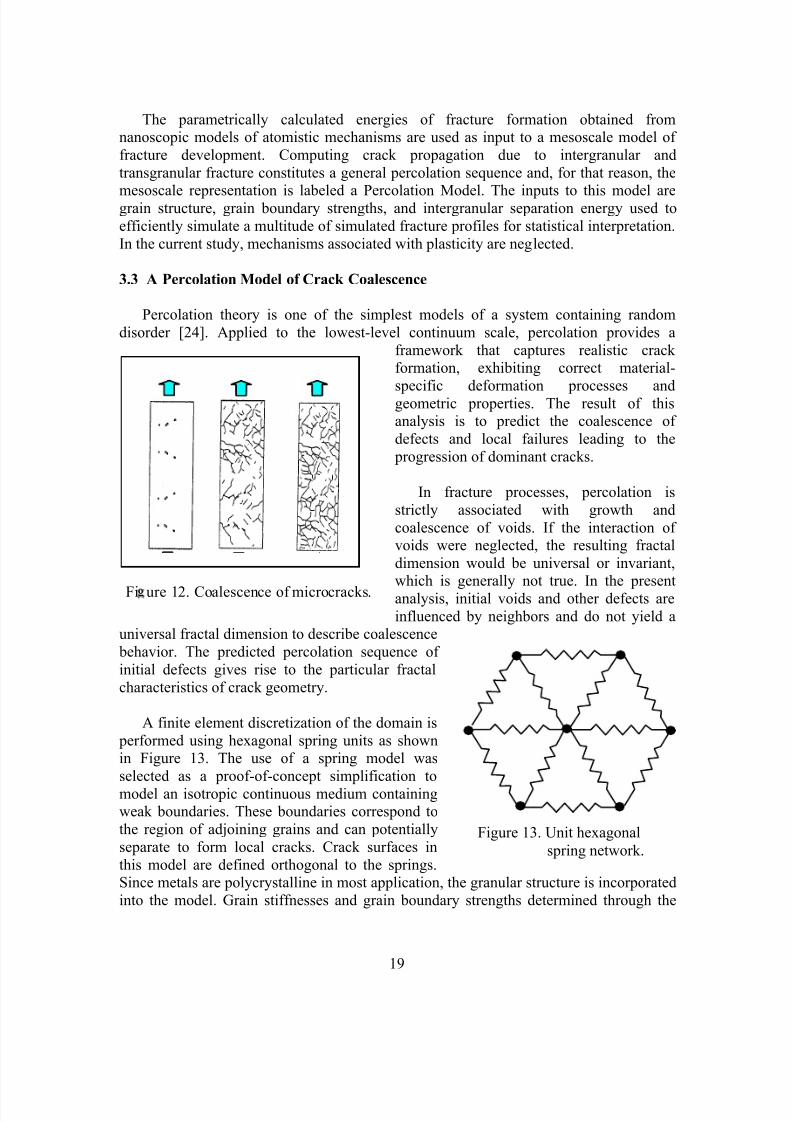
Percolation theory is one of the simplest models of a system containing random
disorder [24]. Applied to the lowest-level continuum scale, percolation provides a
framework that captures realistic crackformation, exhibiting correct material-
specific deformation processes andgeometric properties. The result of thisanalysis is to predict the coalescence of
defects and local failures leading to the
progression of dominant cracks.
In fracture processes, percolation is
strictly associated with growth and
coalescence of voids. If the interaction ofvoids were neglected, the resulting fractal
dimension would be universal or invariant,which is generally not true. In the present
analysis, initial voids and other defects are
influenced by neighbors and do not yield auniversal fractal dimension to describe coalescence
behavior. The predicted percolation sequence of
initial defects gives rise to the particular fractal
characteristics of crack geometry.
A finite element discretization of the domain is
performed using hexagonal spring units as shownin Figure 13. The use of a spring model was
selected as a proof-of-concept simplification to
model an isotropic continuous medium containingweak boundaries. These boundaries correspond to
the region of adjoining grains and can potentially
separate to form local cracks. Crack surfaces in
this model are defined orthogonal to the springs.Since metals are polycrystalline in most application, the granular structure is incorporated
into the model. Grain stiffnesses and grain boundary strengths determined through the
Figure 13. Unit hexagonal
spring network.
Fi ure 12. Coalescence of microcracks.
8/10/2019 Fracture.&Amp;.Fatigue. .Fracture.mechanics. .Nasa
http://slidepdf.com/reader/full/fracturefatigue-fracturemechanics-nasa 24/29
20
atomistic simulations are input as effective spring properties. This simplified mesoscalae
model is the first step towards a more computationally intense finite elementrepresentation using two- three-dimensional continuum element formulations and
cohesive zone elements to model mixed-mode separation along boundaries [25].
Simulations begin by establishing a realistic grain structure. This structure is obtainedfrom a Monte Carlo simulation that incorporates grain boundary physics such as the
Mullins equation of curvature driven growth, enforcement of the Herring condition at
triple junctions, and von Neumann conditions for grain stability [26]. A sample of suchgrain configuration is shown in Figure 14. A uniform network of springs having
hexagonal connectivity is projected onto the network of grains. Springs that cross a grain
boundary are assigned spring constants representing the effective stiffness of the boundary. The spring model, therefore, does not represent individual atomistic
interactions, but simulates an anisotropic mesoscale continuum based on aggregate
atomic behavior.
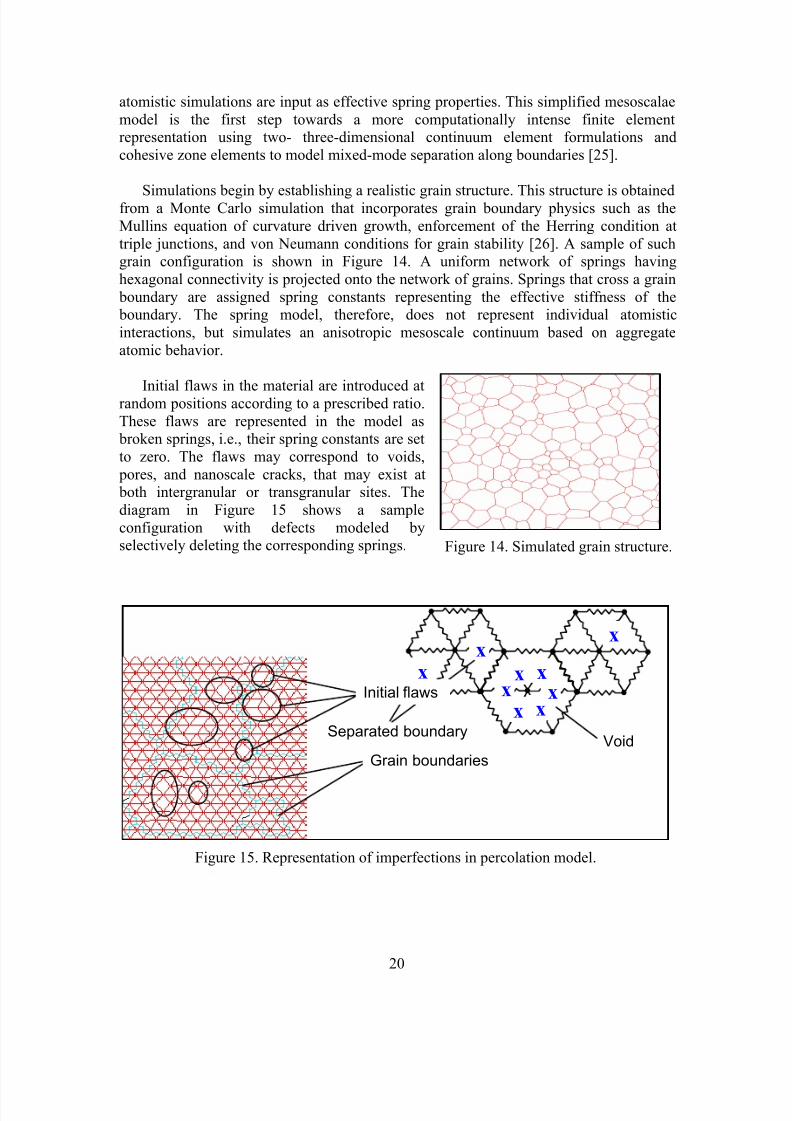
Initial flaws in the material are introduced atrandom positions according to a prescribed ratio.
These flaws are represented in the model as broken springs, i.e., their spring constants are set
to zero. The flaws may correspond to voids,
pores, and nanoscale cracks, that may exist at both intergranular or transgranular sites. The
diagram in Figure 15 shows a sample
configuration with defects modeled byselectively deleting the corresponding springs. Figure 14. Simulated grain structure.
x
x x
x
x
x x
x
x
VoidSeparated boundary
Initial flaws
Grain boundaries
Figure 15. Representation of imperfections in percolation model.
8/10/2019 Fracture.&Amp;.Fatigue. .Fracture.mechanics. .Nasa
http://slidepdf.com/reader/full/fracturefatigue-fracturemechanics-nasa 25/29
21
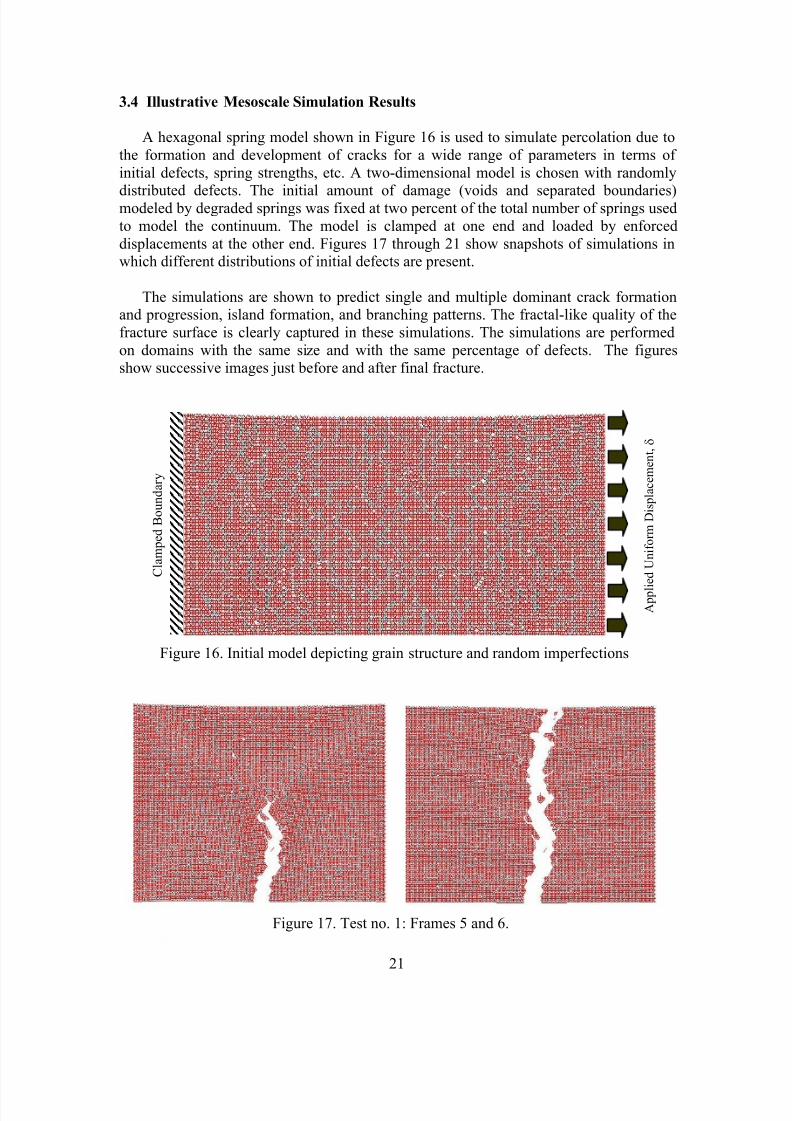
3.4 Illustrative Mesoscale Simulation Results
A hexagonal spring model shown in Figure 16 is used to simulate percolation due to
the formation and development of cracks for a wide range of parameters in terms of
initial defects, spring strengths, etc. A two-dimensional model is chosen with randomly
distributed defects. The initial amount of damage (voids and separated boundaries)modeled by degraded springs was fixed at two percent of the total number of springs used
to model the continuum. The model is clamped at one end and loaded by enforced
displacements at the other end. Figures 17 through 21 show snapshots of simulations inwhich different distributions of initial defects are present.
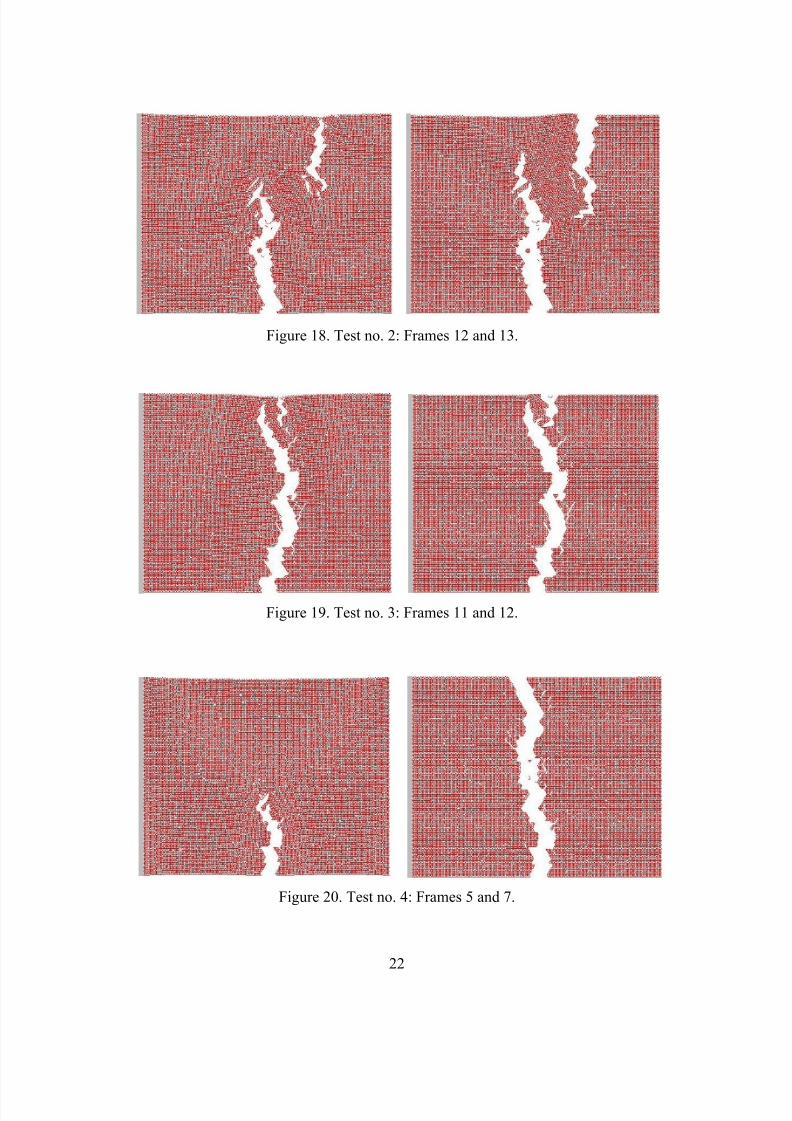
The simulations are shown to predict single and multiple dominant crack formationand progression, island formation, and branching patterns. The fractal-like quality of the
fracture surface is clearly captured in these simulations. The simulations are performed
on domains with the same size and with the same percentage of defects. The figuresshow successive images just before and after final fracture.
Figure 17. Test no. 1: Frames 5 and 6.
Figure 16. Initial model depicting grain structure and random imperfections
A p p l i e d U n i f o r m D
i s p l a c e m e n t , δ
C l a m p e d B o u n d a r y
8/10/2019 Fracture.&Amp;.Fatigue. .Fracture.mechanics. .Nasa
http://slidepdf.com/reader/full/fracturefatigue-fracturemechanics-nasa 26/29
22
Figure 18. Test no. 2: Frames 12 and 13.
Figure 20. Test no. 4: Frames 5 and 7.
Figure 19. Test no. 3: Frames 11 and 12.
8/10/2019 Fracture.&Amp;.Fatigue. .Fracture.mechanics. .Nasa
http://slidepdf.com/reader/full/fracturefatigue-fracturemechanics-nasa 27/29
23
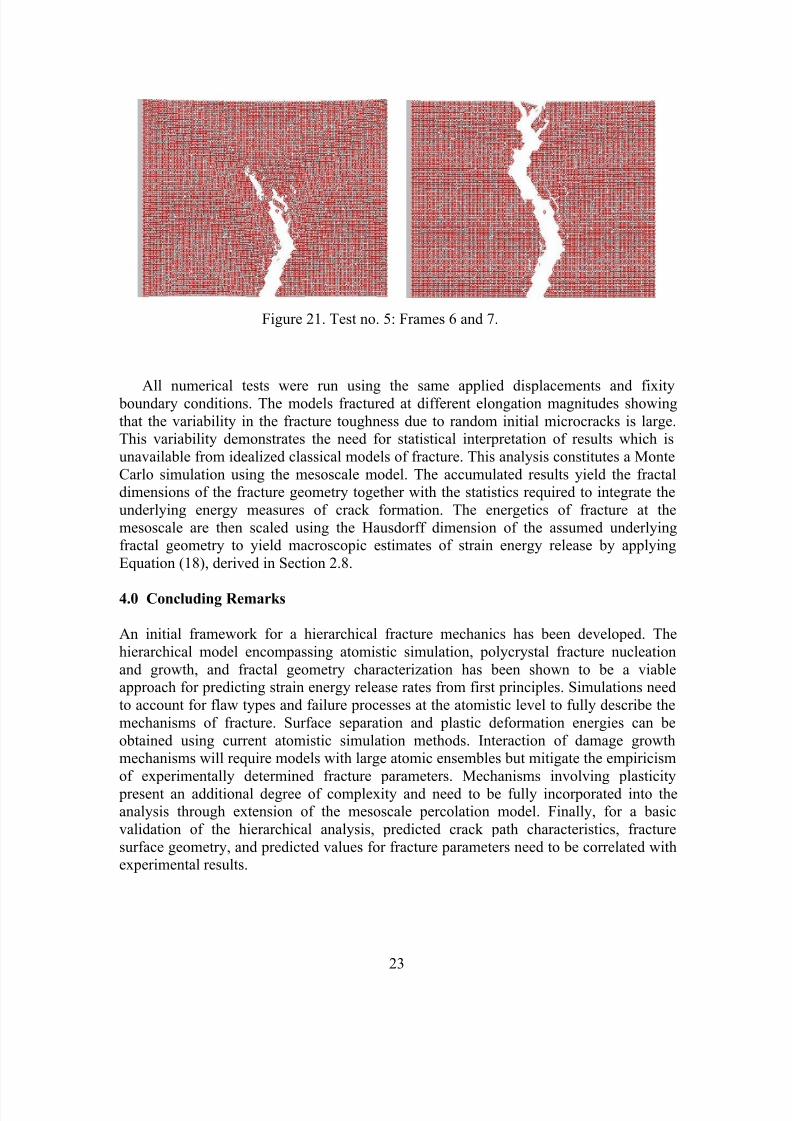
All numerical tests were run using the same applied displacements and fixity boundary conditions. The models fractured at different elongation magnitudes showing
that the variability in the fracture toughness due to random initial microcracks is large.This variability demonstrates the need for statistical interpretation of results which is
unavailable from idealized classical models of fracture. This analysis constitutes a Monte
Carlo simulation using the mesoscale model. The accumulated results yield the fractaldimensions of the fracture geometry together with the statistics required to integrate the
underlying energy measures of crack formation. The energetics of fracture at the
mesoscale are then scaled using the Hausdorff dimension of the assumed underlyingfractal geometry to yield macroscopic estimates of strain energy release by applying
Equation (18), derived in Section 2.8.
4.0 Concluding Remarks
An initial framework for a hierarchical fracture mechanics has been developed. The
hierarchical model encompassing atomistic simulation, polycrystal fracture nucleation
and growth, and fractal geometry characterization has been shown to be a viableapproach for predicting strain energy release rates from first principles. Simulations need
to account for flaw types and failure processes at the atomistic level to fully describe the
mechanisms of fracture. Surface separation and plastic deformation energies can be
obtained using current atomistic simulation methods. Interaction of damage growthmechanisms will require models with large atomic ensembles but mitigate the empiricism
of experimentally determined fracture parameters. Mechanisms involving plasticity
present an additional degree of complexity and need to be fully incorporated into theanalysis through extension of the mesoscale percolation model. Finally, for a basic
validation of the hierarchical analysis, predicted crack path characteristics, fracture
surface geometry, and predicted values for fracture parameters need to be correlated withexperimental results.
Figure 21. Test no. 5: Frames 6 and 7.
8/10/2019 Fracture.&Amp;.Fatigue. .Fracture.mechanics. .Nasa
http://slidepdf.com/reader/full/fracturefatigue-fracturemechanics-nasa 28/29
24
5.0 References
1. Hutchinson, J.W. and Evans, A.G., “Mechanics of Materials: Top-Down Approaches to
Fracture,” Acta. Mater. ,48, pp. 125-135, 2000.
2. Hafner, J., “Atomic-Scale Computational Materials Science,” Acta. Mater., 48, pp.71-92,
2000.
3. Needleman, A., “Computational Mechanics at the Mesoscale,” Acta. Mater., 48, pp.105-124,2000.
4. Griffith, A.A., “The Phenomenon of Rupture and Flow in Solids,” Philos. Trans. R. Soc.
London, Ser. A, A221, pp. 163-198, 1924.
5. Fleck, N.A. and Hutchinson, J.W., "Strain Gradient Plasticity," Adv. Appl. Mech., 33, pp.
295-361, 1997.
6. Mandelbrot, B.B. The Fractal Geometry of Nature, New York: W.H. Freeman, 1982.
7. Schroeder, M., Fractals, Chaos, Power Laws, New York, W.H. Freeman, 1999.
8. Barnsley, M.F., Fractals Everywhere, Mogan Kaufmann, 1993.
9. Mandelbrot, B.B., “Self-Affine Fractals and Fractal Dimension,” Physical Scripta, 32, pp.
257-260, 1985.
10. Mandelbrot, B.B., Passoja, D.E., and Paullay, A.J., “Fractal Character of Fracture Surfaces of
Metals,” Nature, 308, pp. 721-722, 1984.11. Passoja, D.E., and Amborski, D.J., “Fracture Profile Analysis by Fourier Transform
Methods,” Microstruct. Sci., 6 , pp.143-148, 1978.
12. Charkaluk, E., Bigerelle, M., and Iost, A., “Fractals and Fracture,” Eng. Fract. Mech., 61, pp.
119-139, 1998.
13. Dougan, L.T., Addison, P.S., and McKenzie, W.M.C., “Fractal Analysis of Fracture: A
Comparison of Dimension Estimates,” Mech. Res. Commun., 27, pp. 383-392, 2000.
14. Hornbogen, E., “Fractals in Microstructure of Metals,” Int. Mat. Rev., 34, pp.277-296, 1989.
15. Carpinteri, A., Chiaia, B., and Cornetti, P., “A Scale-Invariant Cohesive Crack Model for
Quasi-Brittle Materials,” Eng. Fract. Mech., 69, pp. 207-217, 2002.
16. Ta'asan, S. "Mathematics of Fractals," NASA Final Report, PO No. L-17941, Carnegie
Mellon University, Oct. 2003.
17. Yavari, A., Hockett, K.G., and Sarkani, S., “The Fourth Mode of Fracture in Fractal FractureMechanics,” Int. J. of Fract., 101, pp. 365-384, 2000.
18. Yavari, A., Sarkani, S., and Moyer, E.T., “The Mechanics of Self-Similar and Self-Affine
Fractal Cracks,” Int. J. of Fract., 114, pp. 1 - 27, 2002.
19. Cherepanov, G.P., Balankin, A.S., and Ivanova, V.S., “Fractal Fracture Mechanics – A
Review,” Eng. Fract. Mech., 51, pp. 997-1033, 1995.
20. Allen, M.J. and Yen, W.M., Introduction to Measurement Theory, Waveland Pr Inc., 2001.
21. Orowan, E., “Fracture and Strength in Solids,” Reports on Progress in Physics, XII, p. 185,
1948.
22. Allen, M.P., and Tildesley, D.J, Computer Simulation of Liquids, Clarendon Press, Oxford,
1987.
23. Haile, J.M., Molecular Dynamics Simulation, Elementary Methods, John Wiley & Sons, Inc.
1991.24. Stauffer, D. and Aharony, A., Introduction to Percolation Theory, 2nd. ed. (Taylor and
Francis, London, 1992).
25. Jin, Z.H., Paulino, G.H., and Dodds, R.H., Jr. “Finite Element Investigation of Quasi-Static
Crack Growth in Functionally Graded Materials Using a Novel Cohesive Zone Fracture
Model,” J. Appl’d Mech., 69, pp. 370-379, 2002.
26. Anderson, M.P., Srolovitz D.J. et al, “Computer Simulation of Grain Growth I. Kinetics,” Acta Metallurgica, 32, pp. 783-791, 1985.
8/10/2019 Fracture.&Amp;.Fatigue. .Fracture.mechanics. .Nasa
http://slidepdf.com/reader/full/fracturefatigue-fracturemechanics-nasa 29/29
REPORT DOCUMENTATION PAGEForm Approved
OMB No. 0704-0188
2. REPORT TYPE
Technical Memorandum 4. TITLE AND SUBTITLE
A Hierarchical Approach to Fracture Mechanics
5a. CONTRACT NUMBER
6. AUTHOR(S)
Saether, Erik; and Ta'asan, Shlomo
7. PERFORMING ORGANIZATION NAME(S) AND ADDRESS(ES)
NASA Langley Research Center Hampton, VA 23681-2199
9. SPONSORING/MONITORING AGENCY NAME(S) AND ADDRESS(ES)
National Aeronautics and Space AdministrationWashington, DC 20546-0001
8. PERFORMING ORGANIZATION
REPORT NUMBER
L-19061
10. SPONSOR/MONITOR'S ACRONYM(S)
NASA
13. SUPPLEMENTARY NOTESSaether: Langley Research Center; Ta'asan: Canegie Mellon University.An electronic version can be found at http://techreports.larc.nasa.gov/ltrs/ or http://ntrs.nasa.gov
12. DISTRIBUTION/AVAILABILITY STATEMENT
Unclassified - UnlimitedSubject Category 39
Availability: NASA CASI (301) 621-0390
19a. NAME OF RESPONSIBLE PERSON
STI Help Desk (email: [email protected])
14. ABSTRACT
Recent research conducted under NASA LaRC's Creativity and Innovation Program has led to the development of an initialapproach for a hierarchical fracture mechanics. This methodology unites failure mechanisms occurring at different lengthscales and provides a framework for a physics-based theory of fracture. At the nanoscale, parametric molecular dynamicsimulations are used to compute the energy associated with atomic level failure mechanisms. This information is used in amesoscale percolation model of defect coalescence to obtain statistics of fracture paths and energies through Monte Carlosimulations. The mathematical structure of predicted crack paths is described using concepts of fractal geometry. The non-integer fractal dimension relates geometric and energy measures between meso- and macroscales. For illustration, a fractal- based continuum strain energy release rate is derived for inter- and transgranular fracture in polycrystalline metals.
15. SUBJECT TERMS
Fracture mechanics; Strain energy release rate; Fractal geometry
18. NUMBER OF
PAGES
29
19b. TELEPHONE NUMBER (Include area code)
(301) 621-0390
a. REPORT
U
c. THIS PAGE
U
b. ABSTRACT
U
17. LIMITATION OFABSTRACT
UU
St d d F 298 (R 8 98)
3. DATES COVERED (From - To)
5b. GRANT NUMBER
5c. PROGRAM ELEMENT NUMBER
5d. PROJECT NUMBER
5e. TASK NUMBER
5f. WORK UNIT NUMBER
23-762-55-LC
11. SPONSOR/MONITOR'S REPORT NUMBER(S)
NASA/TM-2004-213499
16. SECURITY CLASSIFICATION OF:
The public reporting burden for this collection of information is estimated to average 1 hour per response, including the time for reviewing instructions, searching existing data sources,gathering and maintaining the data needed, and completing and reviewing the collection of information. Send comments regarding this burden estimate or any other aspect of thiscollection of information, including suggestions for reducing this burden, to Department of Defense, Washington Headquarters Services, Directorate for Information Operations andReports (0704-0188), 1215 Jefferson Davis Highway, Suite 1204, Arlington, VA 22202-4302. Respondents should be aware that notwithstanding any other provision of law, no personshall be subject to any penalty for failing to comply with a collection of information if it does not display a currently valid OMB control number.PLEASE DO NOT RETURN YOUR FORM TO THE ABOVE ADDRESS.
1. REPORT DATE (DD-MM-YYYY)
11 - 200401-