Embed Size (px)
Citation preview
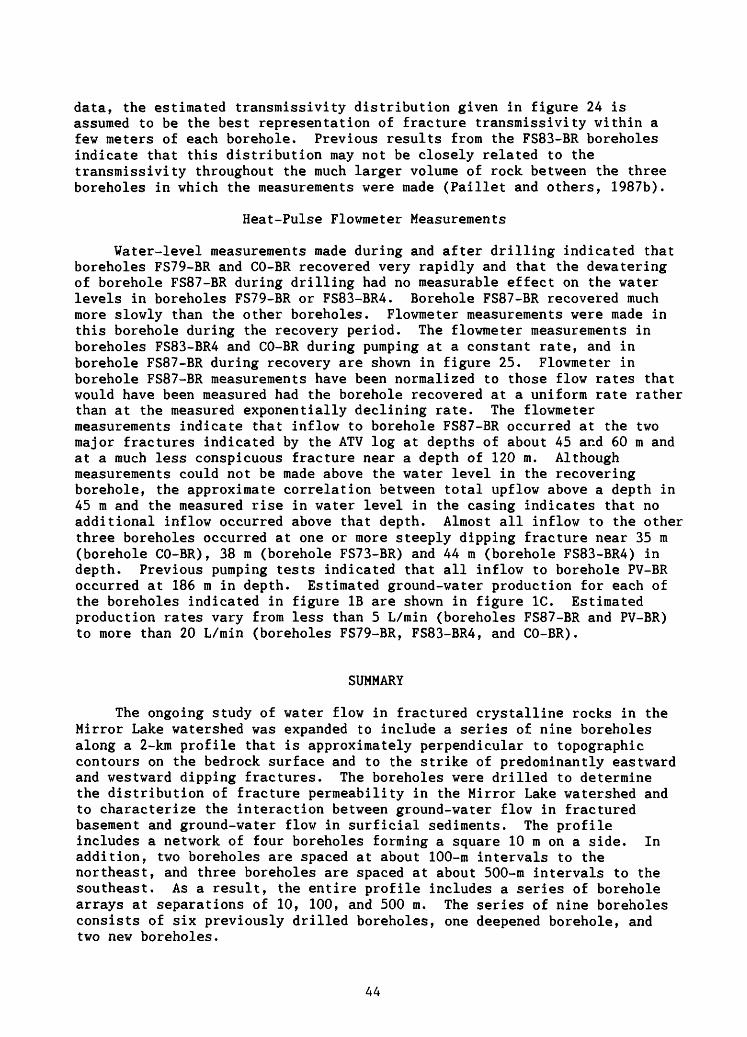
FRACTURE CHARACTERIZATION AND FRACTURE-PERMEABILITY ESTIMATES FROM GEOPHYSICAL LOGS IN THE MIRROR LAKE WATERSHED, NEW HAMPSHIRE
1 2By F.L. Paillet and Kemal Kapucu
U.S. GEOLOGICAL SURVEY
Water Resources Investigations Report 89-4058
U.S. Geological Survey, Denver, Colorado2 Mineral Research and Exploration Institute, Ankara, Turkey
Lake wood, Colorado
1989
DEPARTMENT OF THE INTERIOR
MANUEL LUJAN, JR., Secretary
U.S. GEOLOGICAL SURVEY
Dallas L. Peck, Director
For additional information, write to:
U.S. Geological Survey U.S. Geological SurveyMail Stop 403, Box 25046 Books and Open-File ReportsDenver Federal Center Denver Federal CenterDenver, CO 80225-0046 Denver, CO 80225-0046
CONTENTS
Introduction
o t*iif1\7 01 t*_a____________ _____________ __ ___________O l» VIVA V O J. U C
Results of previous fracture permeability tests at the FS83-BR
Geophysical logging equipment In-situ measurements of fracture permeability
Fracture characterization and fracture permeability estimatesFracture characterization at boreholes FS83-BR, FS87-BR, KHL-BR,
CO-BR, and PV-BR by use of acoustic televiewer and other conventional geophysical logs
Tube-wave attenuation estimates of fracture permeability Heat-pulse flowmeter measurements
Ciimmav*\7___ __ _________________________________ ____________ _________ij UlllllICi J, V " " "" «»«»__
Page1 j_
10_^
A"T
101317
173644/t A*.f _*
A7 +/
Figure 1.
FIGURES
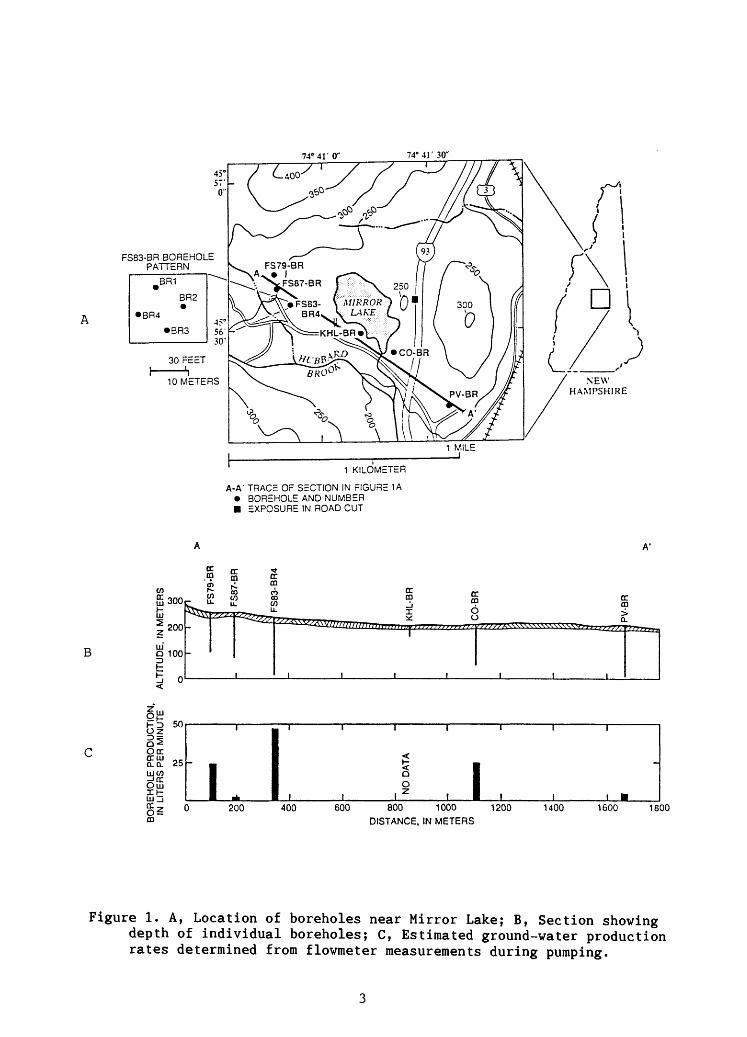
A, Map showing location of boreholes near Mirror Lake; B, Section showing depth of individual boreholes; C, Estimated ground-water production rates determined from flowmeter measurements during pumping
4.
5.
6.
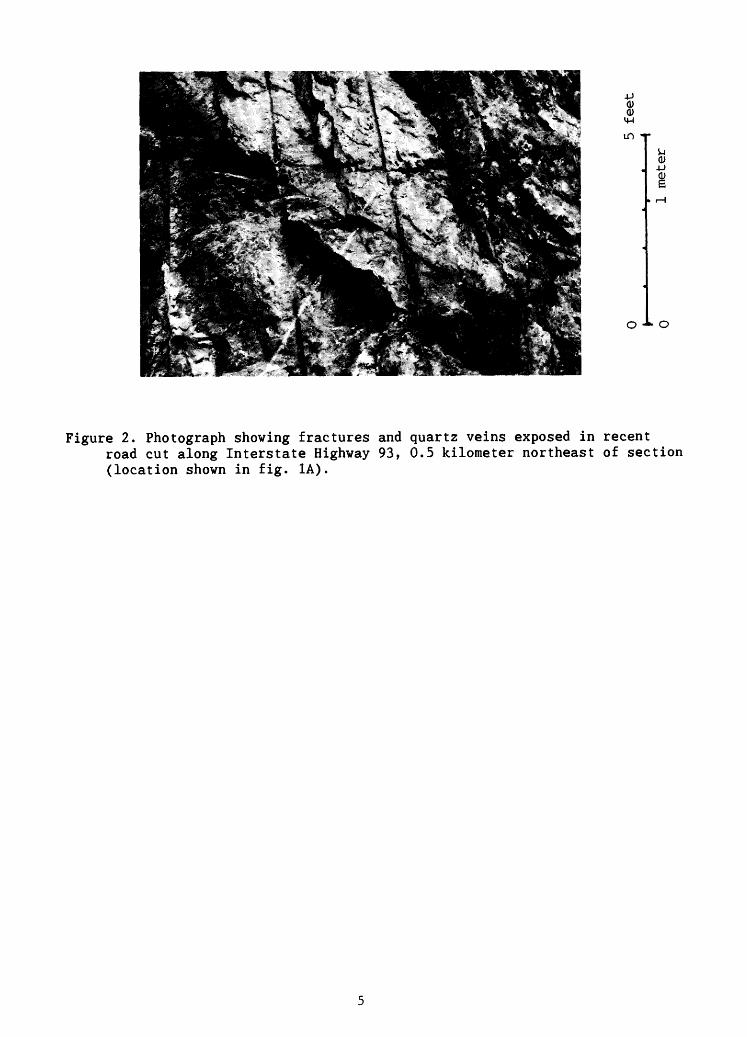
Photograph showing fractures and quartz veins exposed in recent road cut along Interstate Highway 93, 0.5 kilometer northeast of section (location shown in fig. 1A)
Section through the FS83-BR boreholes, indicating projection of fractures identified on acoustic televiewer and indicating results of cross-hole pumping tests. Vertical-scale projection decreases apparent dip of fracture planes (modified from Paillet and others,
Graphs showing acoustic-tube-wave-attenuation indication of fracture permeability compared to permeability indication using packer-isolation and injections for borehole FS83-BR4 (modified from Paillet, and others,
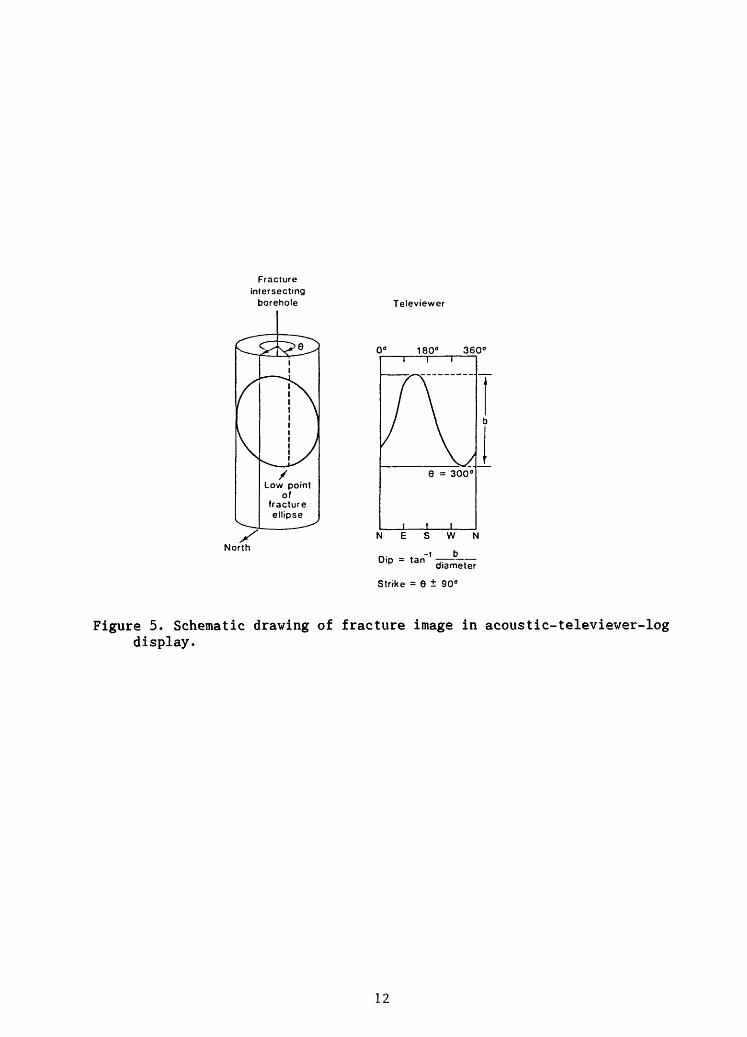
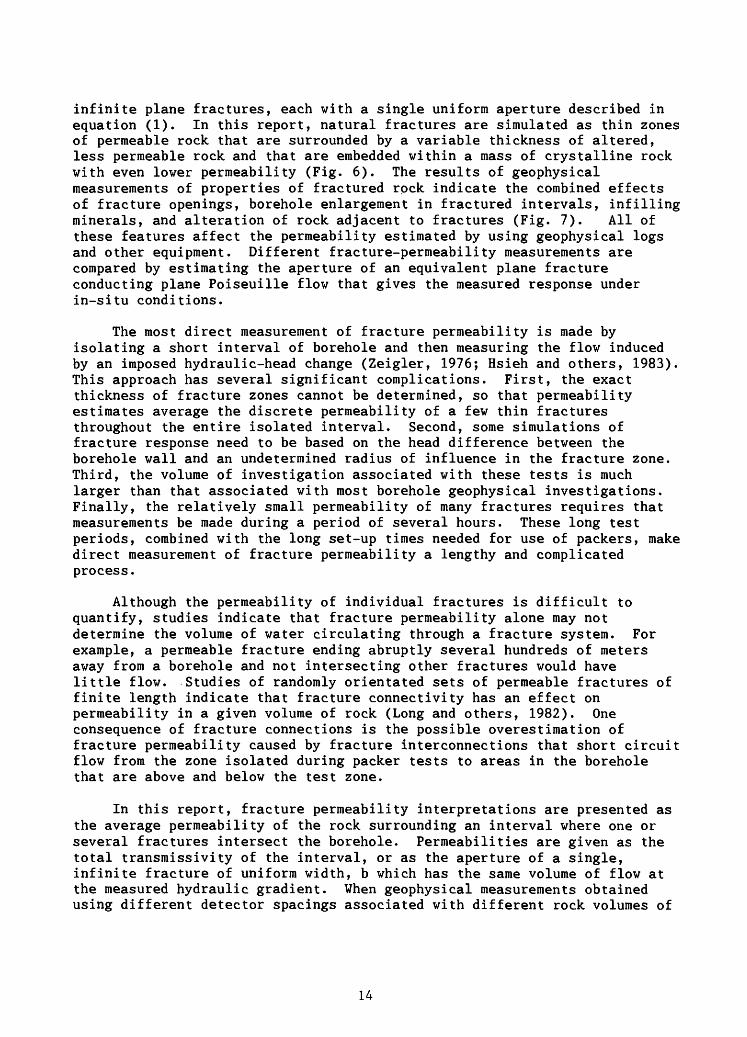
Schematic drawing of fracture image in acoustic- televiewer-log display
Fracture model illustrating asperities, infilling minerals, and alteration -
12
15
7. Diagram showing fracture sampling with a geophysical logging tool, illustrating typical proportions of the geophysical sample volume associated with open fracture and altered rock 16
8. Caliper, acoustic-transit-time, single-point-resistance, and epithermal-neutron logs compared to lithology of recovered cuttings and acoustic-televiewer-log interpretation for borehole FS79-BR 18
9. Caliper, acoustic-transit-time, single-point-resistance, and epithermal-neutron logs compared to lithology of recovered cuttings and acoustic-televiewer-log interpretation for borehole FS87-BR 19
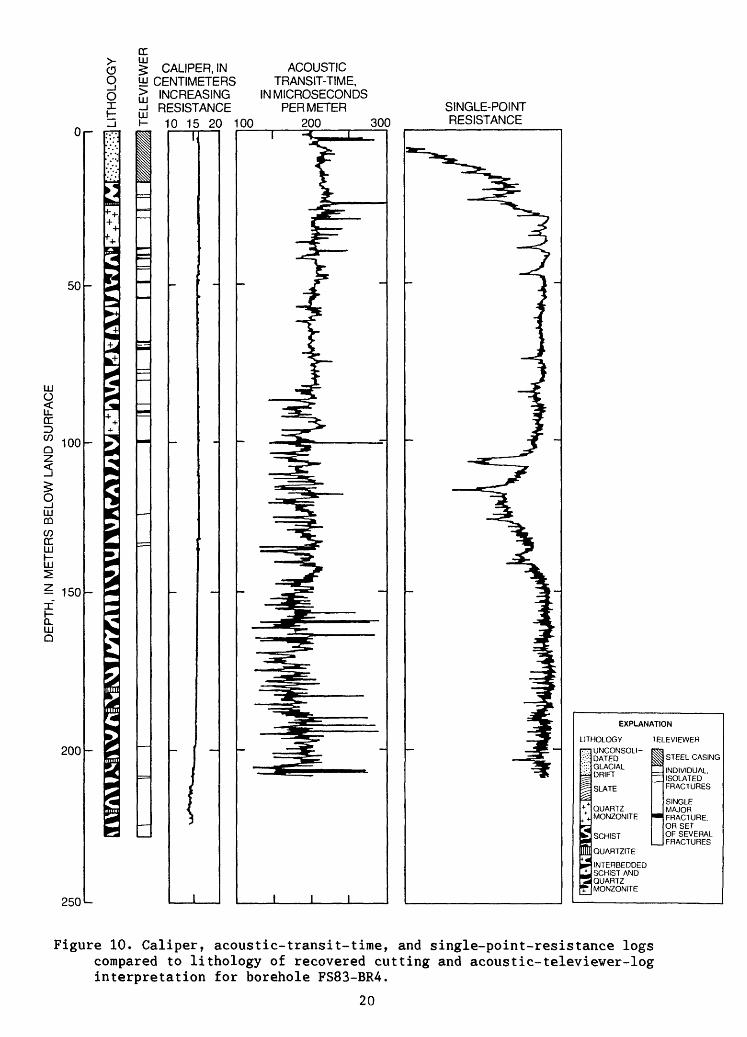
10. Caliper, acoustic-transit-time, andsingle-point-resistance logs compared to lithology ofrecovered cutting and acoustic-televiewer-loginterpretation for borehole FS83-BR4 20
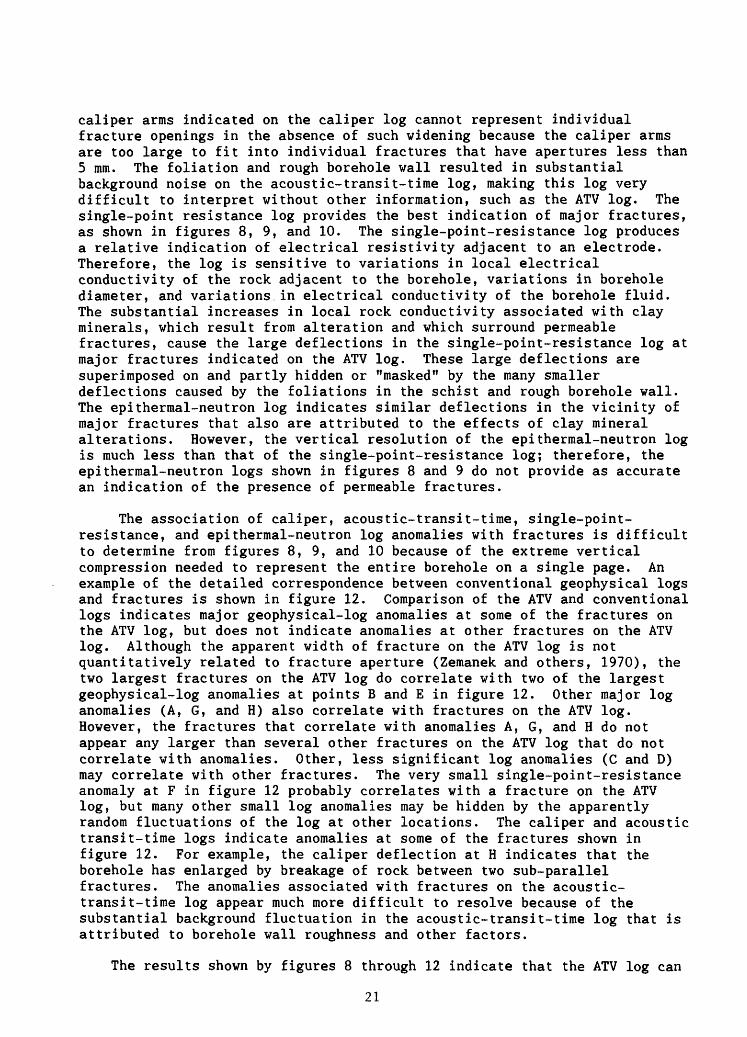
11. Geophysical logs compared to lithology andacoustic-televiewer-log data for borehole KHL-BR 22
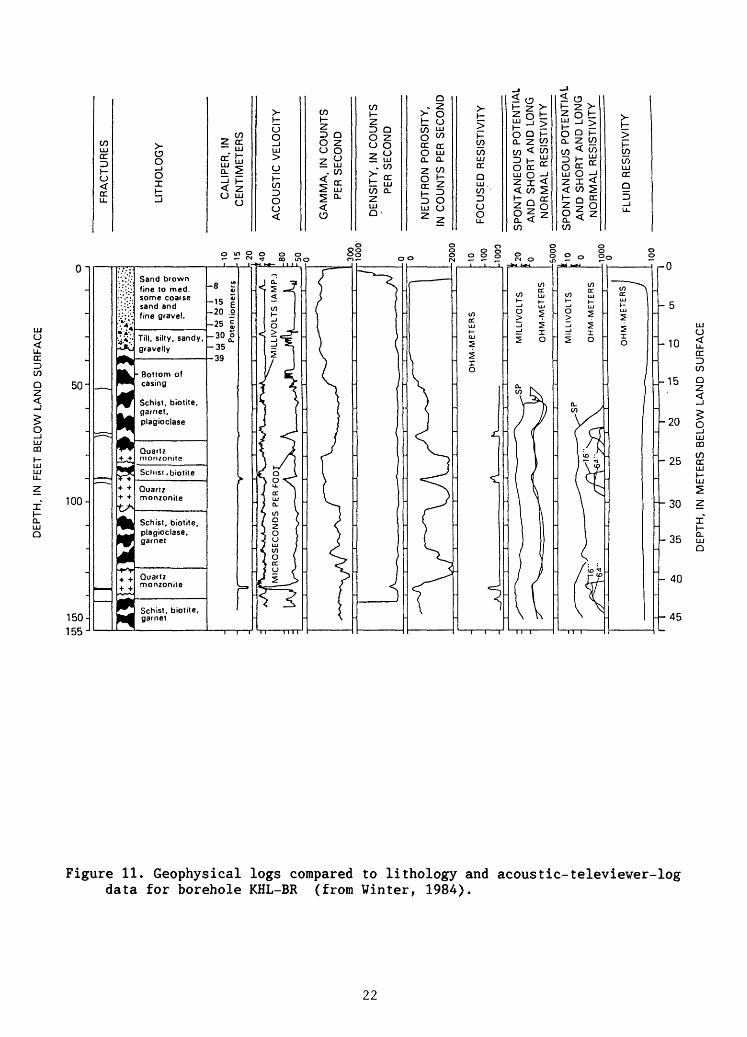
12. Detailed section of a geophysical log for the depthinterval from 50 to 90 meters in borehole FS87-BR showing typical fracture anomalies 23
13. Acoustic-televiewer log showing interpretation forborehole FS79-BR 25
14. Acoustic-televiewer log showing interpretation forborehole FS87-BR 26
15. Acoustic-televiewer log showing interpretation forborehole FS83-BR4 27
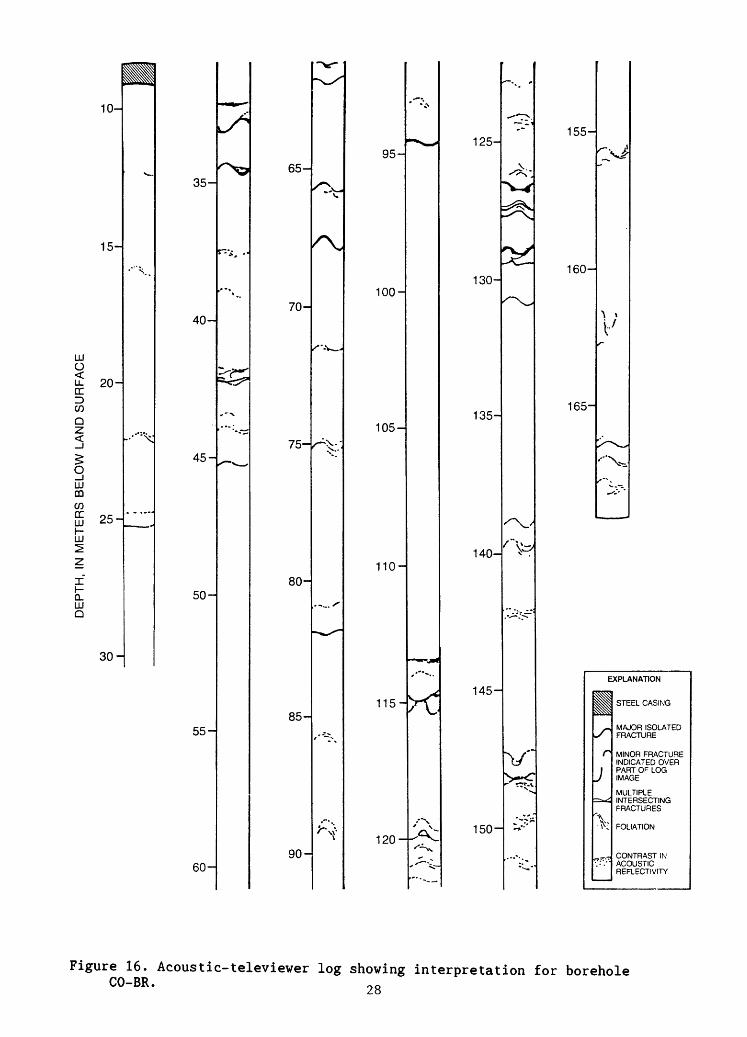
16. Acoustic-televiewer log showing interpretation forborehole CO-BR 28
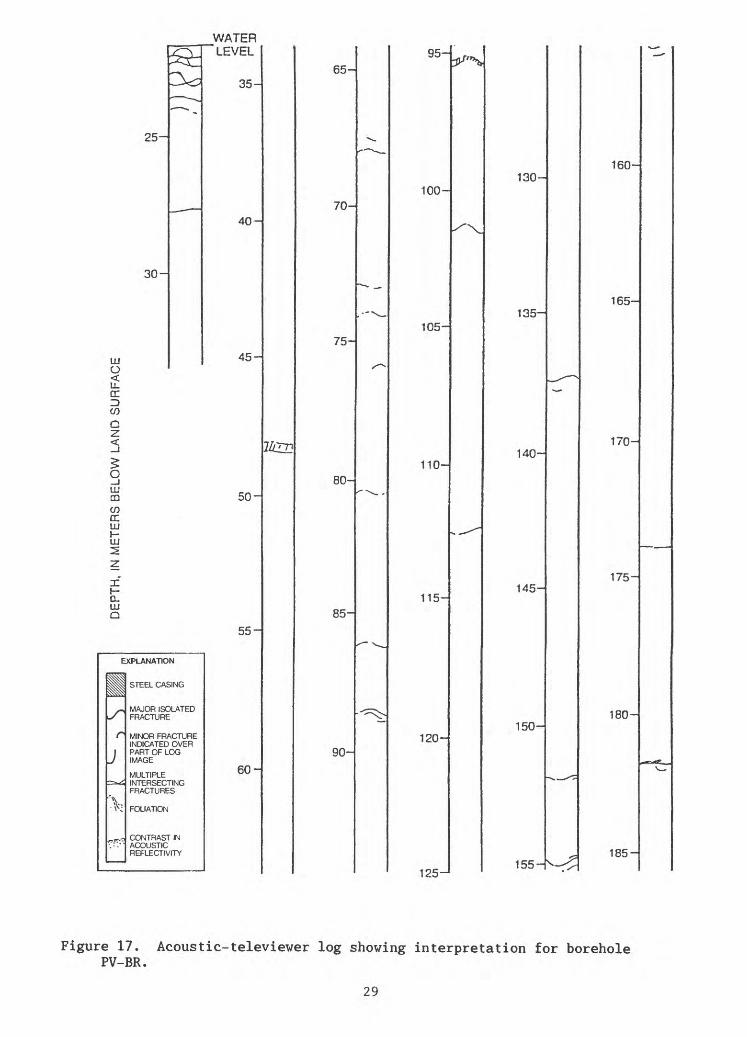
17. Acoustic-televiewer log showing interpretation forborehole PV-BR 29
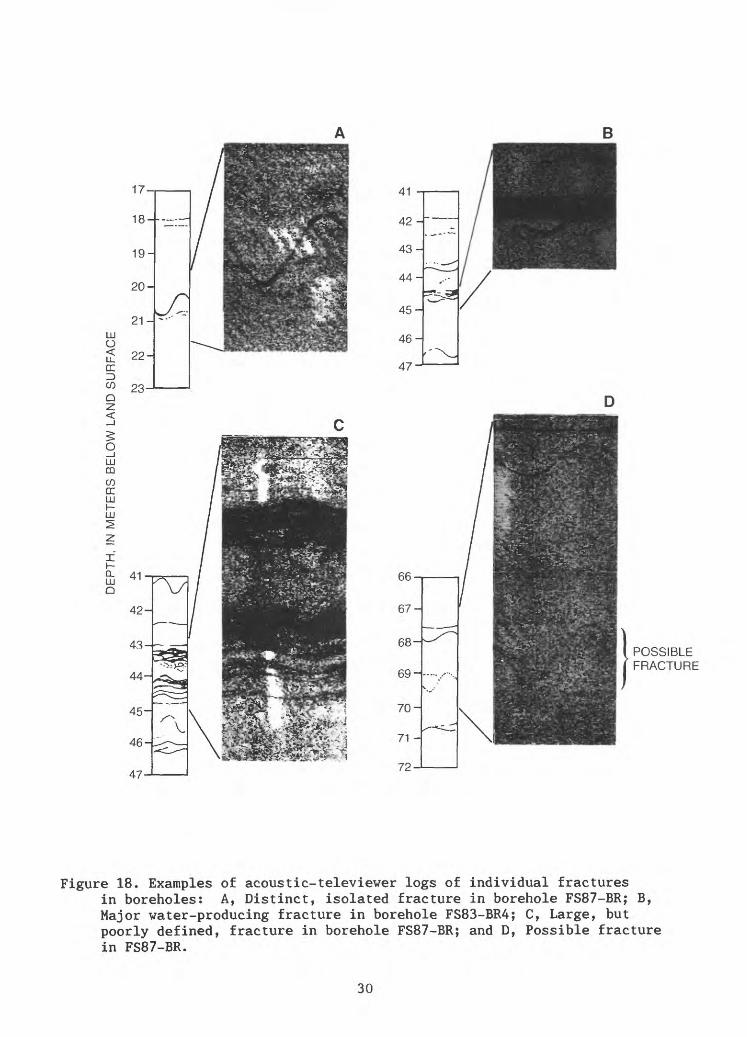
18. Examples of acoustic-televiewer logs of individualfractures in boreholes: A, Distinct, isolated fracturein borehole FS87-BR; B, Major water-producing fracturein borehole FS83-BR4; C, Large, but poorly defined,fracture in borehole FS87-BR; and D, Possible fracturein borehole FS87-BR 30
19. Diagram showing fracture distribution in boreholesFS79-BR, FS87-BR, FS83-BR4, CO-BR, and PV-BR 31
20. Diagram showing acoustic-televiewer fracture score summed over 5-meter intervals for boreholes FS79-BR, FS87-BR, FS83-BR4, CO-BR, and PV-BR 32
21. Diagram showing fracture alteration scores determined from geophysical logs summed over 5-meter intervals for boreholes FS79-BR, FS87-BR, and FS83-BR4 33
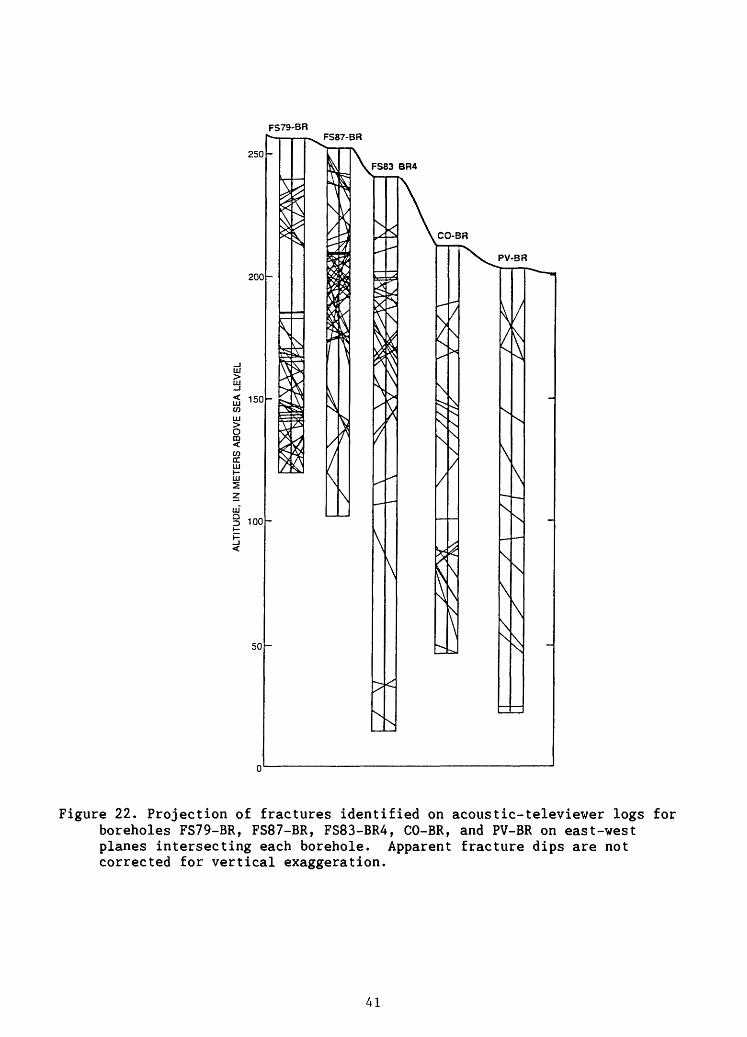
22. Diagram showing projection of fractures identified onacoustic-televiewer logs for boreholes FS79-BR, FS87-BR,FS83-BR4, CO-BR, and PV-BR on east-west planesintersecting each borehole. Apparent fracture dips arenot corrected for vertical exaggeration 41
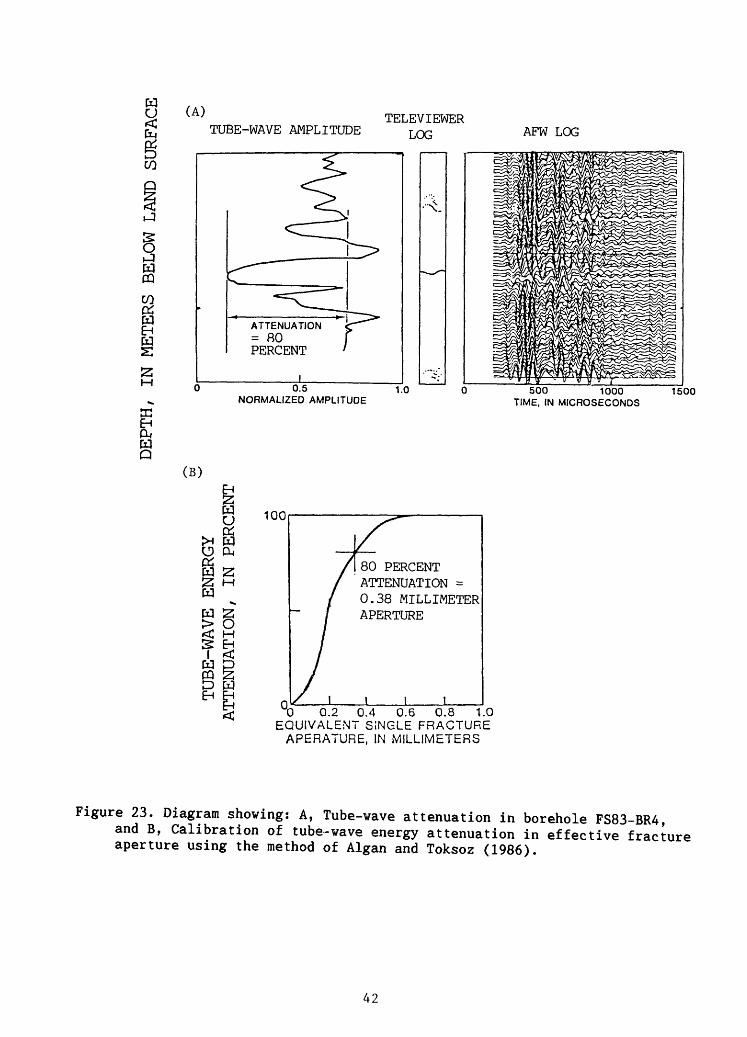
23. Diagram showing: A, Tube-wave attenuation in borehole FS83-BR4, and B, Calibration of tube-wave energy attenuation in effective fracture aperture using the method of Algan and Toksoz (1986) 42
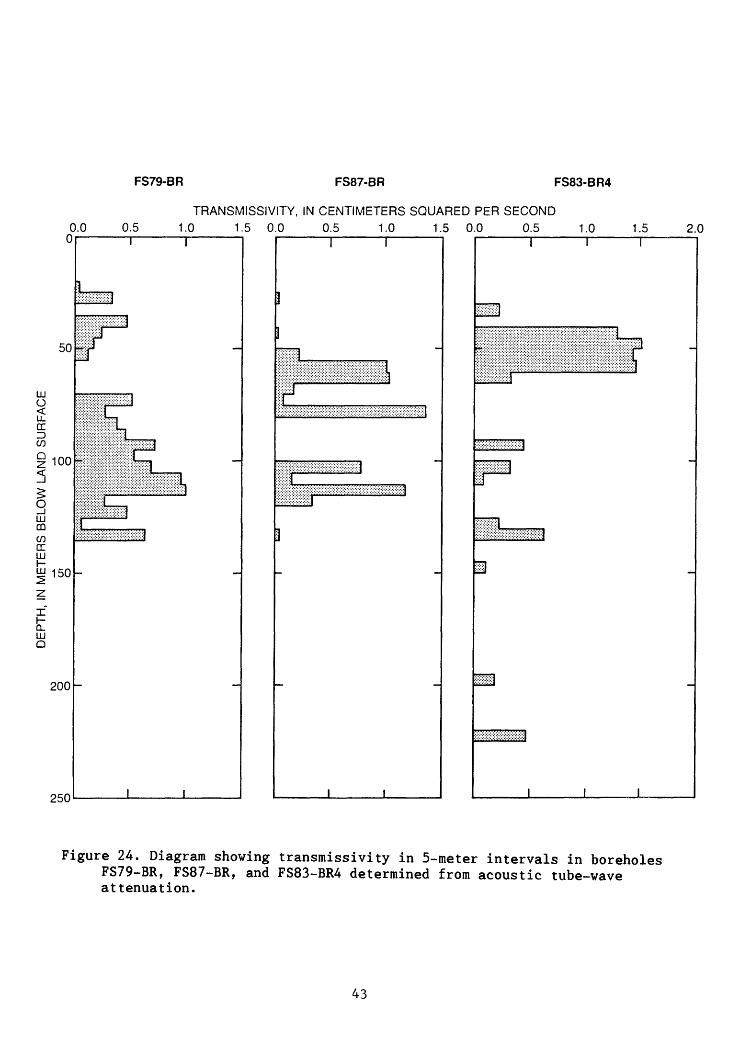
24. Diagram showing transmissivity in 5-meter intervals inboreholes FS79-BR, FS87-BR, and FS83-BR4 determined from acoustic tube-wave attenuation 43
25. Normalized flow in borehole FS87-BR during recovery after drilling and flow in boreholes FS79-BR, FS83-BR4, and CO-BR during steady pumping 45
TABLES
Table 1. Boreholes at Mirror Lake, New Hampshire 62. Summary of geophysical logs and other measurements in the
Mirror Lake boreholes 113. Definition of televiewer score for qualitative fracture
or\^v*^iiT*o_ _ _ _____________ _ _ _______________ *\/Ld^Jd-Lvii."" "" "" "" " j«-t
4. Definition of geophysical log score for extent ofalteration adjacent to fracture 35
5. Listing of fractures identified on the acoustic-televiewerlogs for boreholes FS-79BR, FS87-BR, and FS83-BR4 37
t H
CONVERSION FACTORS
For readers who may prefer to use inch-pound units rather than the metric (International System) units used in this report, the following conversion factors may be used:
Multiply metric (SI) units By To obtain inch-pound units
meter (m) 3.281 foot
centimeter (cm) 0.3937 inch
kilometer (km) 0.6214 mile
liter per minute (L/min) 0.000589 cubic foot per second
The following units are listed to define abbreviations:
kilohertz (kHz)
Sea level: In this report "sea level" refers to the National Geodetic Vertical Datum of 1929 (NGVD of 1929) a geodetic datum derived from a general adjustment of the first order level nets of both the United States and Canada, formerly called "Sea Level Datum of 1929".
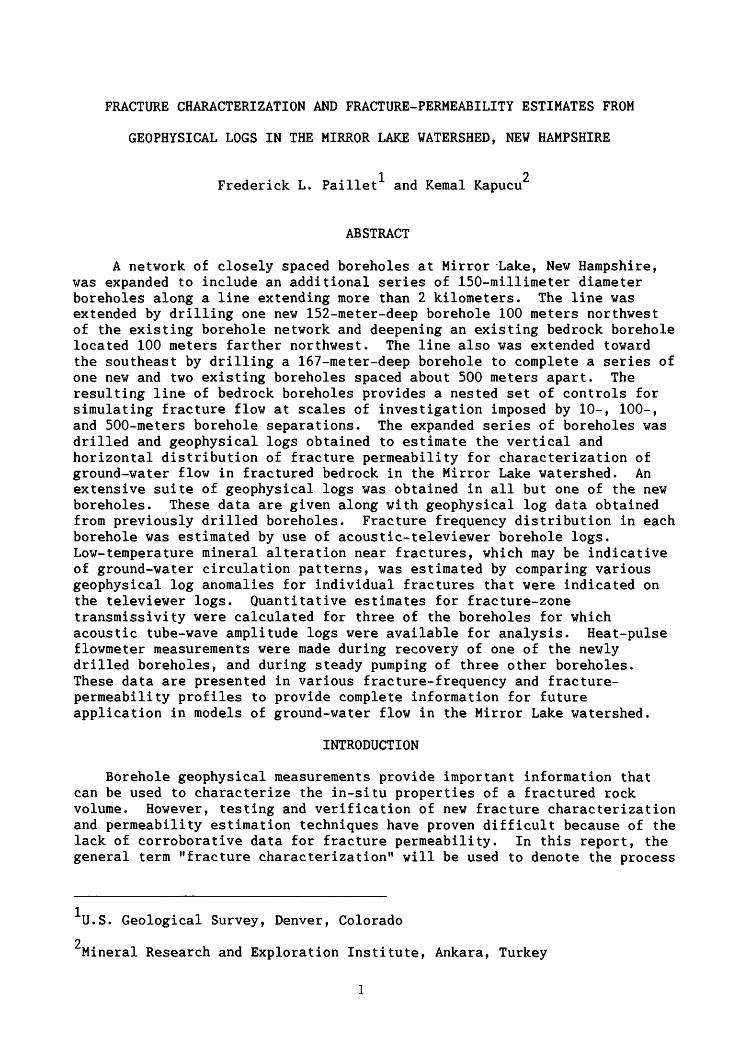
FRACTURE CHARACTERIZATION AND FRACTURE-PERMEABILITY ESTIMATES FROM
GEOPHYSICAL LOGS IN THE MIRROR LAKE WATERSHED, NEW HAMPSHIRE
1 2 Frederick L. Paillet and Kemal Kapucu
ABSTRACT
A network of closely spaced boreholes at Mirror Lake, New Hampshire, was expanded to include an additional series of 150-millimeter diameter boreholes along a line extending more than 2 kilometers. The line was extended by drilling one new 152-meter-deep borehole 100 meters northwest of the existing borehole network and deepening an existing bedrock borehole located 100 meters farther northwest. The line also was extended toward the southeast by drilling a 167-meter-deep borehole to complete a series of one new and two existing boreholes spaced about 500 meters apart. The resulting line of bedrock boreholes provides a nested set of controls for simulating fracture flow at scales of investigation imposed by 10-, 100-, and 500-meters borehole separations. The expanded series of boreholes was drilled and geophysical logs obtained to estimate the vertical and horizontal distribution of fracture permeability for characterization of ground-water flow in fractured bedrock in the Mirror Lake watershed. An extensive suite of geophysical logs was obtained in all but one of the new boreholes. These data are given along with geophysical log data obtained from previously drilled boreholes. Fracture frequency distribution in each borehole was estimated by use of acoustic-televiewer borehole logs. Low-temperature mineral alteration near fractures, which may be indicative of ground-water circulation patterns, was estimated by comparing various geophysical log anomalies for individual fractures that were indicated on the televiewer logs. Quantitative estimates for fracture-zone transmissivity were calculated for three of the boreholes for which acoustic tube-wave amplitude logs were available for analysis. Heat-pulse flowmeter measurements were made during recovery of one of the newly drilled boreholes, and during steady pumping of three other boreholes. These data are presented in various fracture-frequency and fracture- permeability profiles to provide complete information for future application in models of ground-water flow in the Mirror Lake watershed.
INTRODUCTION
Borehole geophysical measurements provide important information that can be used to characterize the in-situ properties of a fractured rock volume. However, testing and verification of new fracture characterization and permeability estimation techniques have proven difficult because of the lack of corroborative data for fracture permeability. In this report, the general term "fracture characterization" will be used to denote the process
U.S. Geological Survey, Denver, Colorado
2 Mineral Research and Exploration Institute, Ankara, Turkey
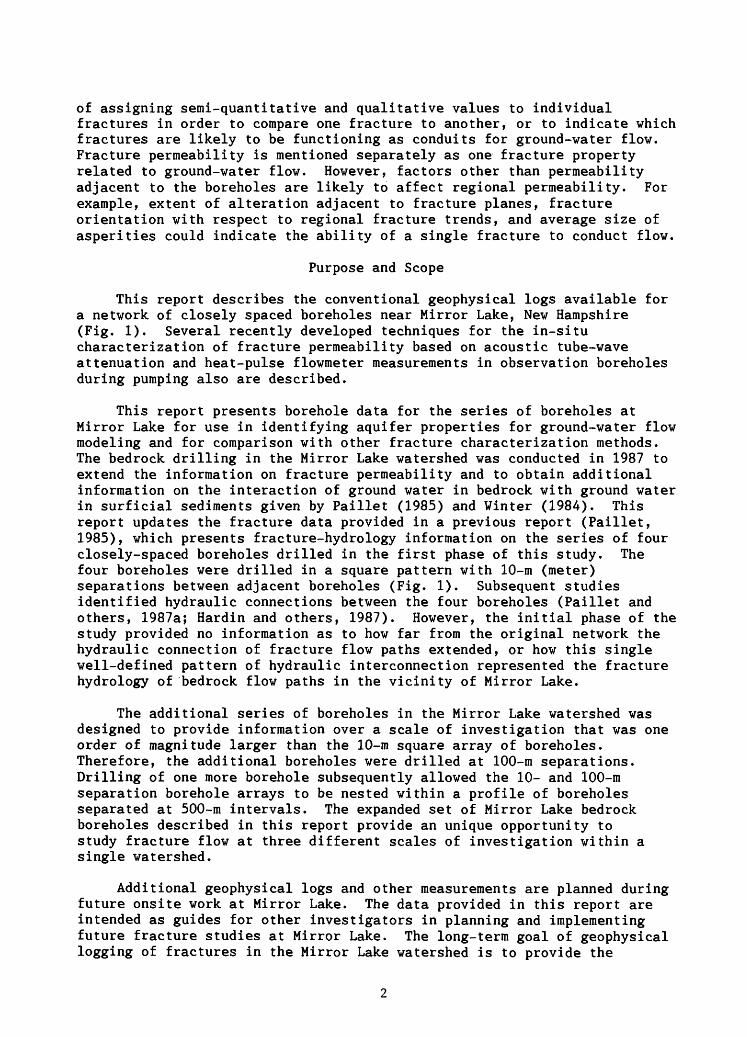
of assigning semi-quantitative and qualitative values to individual fractures in order to compare one fracture to another, or to indicate which fractures are likely to be functioning as conduits for ground-water flow. Fracture permeability is mentioned separately as one fracture property related to ground-water flow. However, factors other than permeability adjacent to the boreholes are likely to affect regional permeability. For example, extent of alteration adjacent to fracture planes, fracture orientation with respect to regional fracture trends, and average size of asperities could indicate the ability of a single fracture to conduct flow.
Purpose and Scope
This report describes the conventional geophysical logs available for a network of closely spaced boreholes near Mirror Lake, New Hampshire (Fig. 1). Several recently developed techniques for the in-situ characterization of fracture permeability based on acoustic tube-wave attenuation and heat-pulse flowmeter measurements in observation boreholes during pumping also are described.
This report presents borehole data for the series of boreholes at Mirror Lake for use in identifying aquifer properties for ground-water flow modeling and for comparison with other fracture characterization methods. The bedrock drilling in the Mirror Lake watershed was conducted in 1987 to extend the information on fracture permeability and to obtain additional information on the interaction of ground water in bedrock with ground water in surficial sediments given by Paillet (1985) and Winter (1984). This report updates the fracture data provided in a previous report (Paillet, 1985), which presents fracture-hydrology information on the series of four closely-spaced boreholes drilled in the first phase of this study. The four boreholes were drilled in a square pattern with 10-m (meter) separations between adjacent boreholes (Fig. 1). Subsequent studies identified hydraulic connections between the four boreholes (Paillet and others, 1987a; Hardin and others, 1987). However, the initial phase of the study provided no information as to how far from the original network the hydraulic connection of fracture flow paths extended, or how this single well-defined pattern of hydraulic interconnection represented the fracture hydrology of bedrock flow paths in the vicinity of Mirror Lake.
The additional series of boreholes in the Mirror Lake watershed was designed to provide information over a scale of investigation that was one order of magnitude larger than the 10-m square array of boreholes. Therefore, the additional boreholes were drilled at 100-m separations. Drilling of one more borehole subsequently allowed the 10- and 100-m separation borehole arrays to be nested within a profile of boreholes separated at 500-m intervals. The expanded set of Mirror Lake bedrock boreholes described in this report provide an unique opportunity to study fracture flow at three different scales of investigation within a single watershed.
Additional geophysical logs and other measurements are planned during future onsite work at Mirror Lake. The data provided in this report are intended as guides for other investigators in planning and implementing future fracture studies at Mirror Lake. The long-term goal of geophysical logging of fractures in the Mirror Lake watershed is to provide the
74° 41' 0
FS83-BR BOREHOLE PATTERN
1 MILE
1 KILOMETER
A- TRACE OF SECTION IN FIGURE 1A BOREHOLE AND NUMBER EXPOSURE IN ROAD CUT
B
fc 300|200
of Q 100ID
P _
nr oo pW C/) o
t**v«. L^*45J ^f-r-f
I
i 2 ? s^ I 0 >V/»xl^Hr i_i_i \ti \\)jjjjj lj, /r ii lu/l ,.^j ,/jj, ,,,,,,,, /7f. . ji i ^^. m v - i i i i i i « i i i i . Ch.
1 1 1 1 1 I 1
5REHOLE PRODUCT N LITERS PER MINI
fO Uui c
1.3 200
1.400
i
1600
i
io
800
1
11000
II
1
1200
i
11400
1
1 1600 18
DISTANCE, IN METERS
Figure 1. A, Location of boreholes near Mirror Lake; B, Section showing depth of individual boreholes; C, Estimated ground-water production rates determined from flowmeter measurements during pumping.
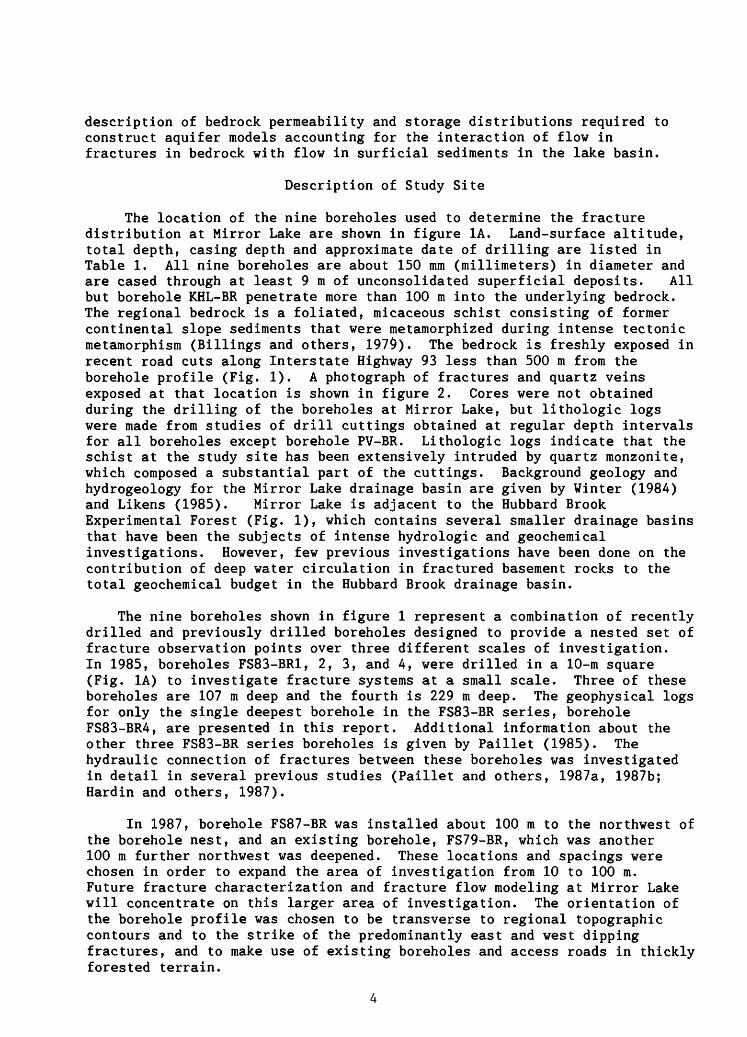
description of bedrock permeability and storage distributions required to construct aquifer models accounting for the interaction of flow in fractures in bedrock with flow in surficial sediments in the lake basin.
Description of Study Site
The location of the nine boreholes used to determine the fracture distribution at Mirror Lake are shown in figure 1A. Land-surface altitude, total depth, casing depth and approximate date of drilling are listed in Table 1. All nine boreholes are about 150 mm (millimeters) in diameter and are cased through at least 9 m of unconsolidated superficial deposits. All but borehole KHL-BR penetrate more than 100 m into the underlying bedrock. The regional bedrock is a foliated, micaceous schist consisting of former continental slope sediments that were metamorphized during intense tectonic metamorphism (Billings and others, 197$). The bedrock is freshly exposed in recent road cuts along Interstate Highway 93 less than 500 m from the borehole profile (Fig. 1). A photograph of fractures and quartz veins exposed at that location is shown in figure 2. Cores were not obtained during the drilling of the boreholes at Mirror Lake, but lithologic logs were made from studies of drill cuttings obtained at regular depth intervals for all boreholes except borehole PV-BR. Lithologic logs indicate that the schist at the study site has been extensively intruded by quartz monzonite, which composed a substantial part of the cuttings. Background geology and hydrogeology for the Mirror Lake drainage basin are given by Winter (1984) and Likens (1985). Mirror Lake is adjacent to the Hubbard Brook Experimental Forest (Fig. 1), which contains several smaller drainage basins that have been the subjects of intense hydrologic and geochemical investigations. However, few previous investigations have been done on the contribution of deep water circulation in fractured basement rocks to the total geochemical budget in the Hubbard Brook drainage basin.
The nine boreholes shown in figure 1 represent a combination of recently drilled and previously drilled boreholes designed to provide a nested set of fracture observation points over three different scales of investigation. In 1985, boreholes FS83-BR1, 2, 3, and 4, were drilled in a 10-m square (Fig. 1A) to investigate fracture systems at a small scale. Three of these boreholes are 107 m deep and the fourth is 229 m deep. The geophysical logs for only the single deepest borehole in the FS83-BR series, borehole FS83-BR4, are presented in this report. Additional information about the other three FS83-BR series boreholes is given by Paillet (1985). The hydraulic connection of fractures between these boreholes was investigated in detail in several previous studies (Paillet and others, 1987a, 1987b; Hardin and others, 1987).
In 1987, borehole FS87-BR was installed about 100 m to the northwest of the borehole nest, and an existing borehole, FS79-BR, which was another 100 m further northwest was deepened. These locations and spacings were chosen in order to expand the area of investigation from 10 to 100 m. Future fracture characterization and fracture flow modeling at Mirror Lake will concentrate on this larger area of investigation. The orientation of the borehole profile was chosen to be transverse to regional topographic contours and to the strike of the predominantly east and west dipping fractures, and to make use of existing boreholes and access roads in thickly forested terrain.
o * o
Figure 2. Photograph showing fractures and quartz veins exposed in recentroad cut along Interstate Highway 93, 0.5 kilometer northeast of section (location shown in fig. 1A).
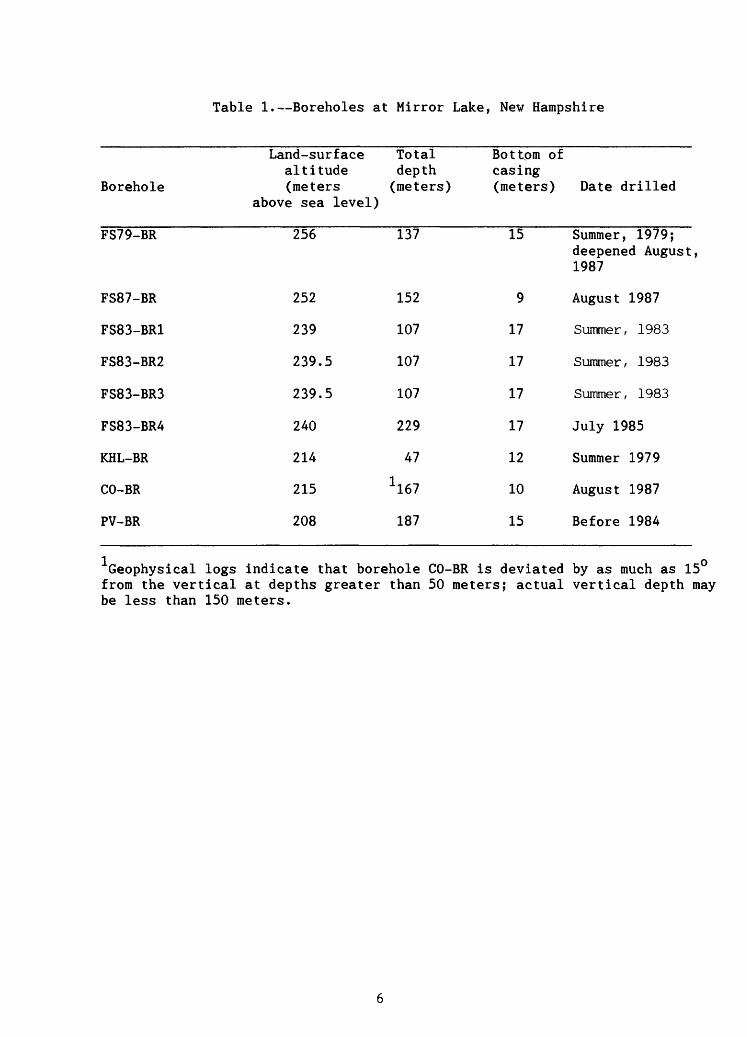
Table 1. Boreholes at Mirror Lake, New Hampshire
Borehole
Land-surface Total altitude depth (meters (meters)
above sea level)
Bottom ofcasing(meters) Date drilled
FS79-BR
FS87-BR
FS83-BR1
FS83-BR2
FS83-BR3
FS83-BR4
KHL-BR
CO-BR
PV-BR
256
252
239
239.5
239.5
240
214
215
208
137
152
107
107
107
229
47
X 167
187
15
9
17
17
17
17
12
10
15
Summer, 1979; deepened August 1987
August 1987
Summer, 1983
Summer, 1983
Summer, 1983
July 1985
Summer 1979
August 1987
Before 1984
Geophysical logs indicate that borehole CO-BR is deviated by as much as 15° from the vertical at depths greater than 50 meters; actual vertical depth may be less than 150 meters.
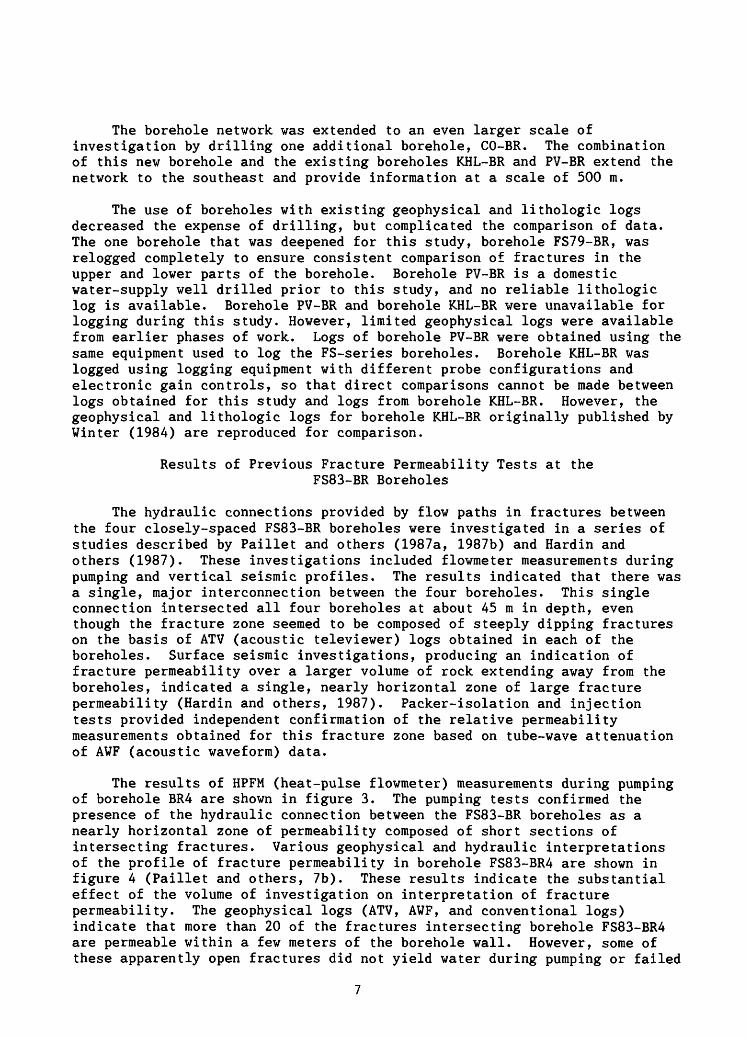
The borehole network was extended to an even larger scale of investigation by drilling one additional borehole, CO-BR. The combination of this new borehole and the existing boreholes KHL-BR and PV-BR extend the network to the southeast and provide information at a scale of 500 m.
The use of boreholes with existing geophysical and lithologic logs decreased the expense of drilling, but complicated the comparison of data. The one borehole that was deepened for this study, borehole FS79-BR, was relogged completely to ensure consistent comparison of fractures in the upper and lower parts of the borehole. Borehole PV-BR is a domestic water-supply well drilled prior to this study, and no reliable lithologic log is available. Borehole PV-BR and borehole KHL-BR were unavailable for logging during this study. However, limited geophysical logs were available from earlier phases of work. Logs of borehole PV-BR were obtained using the same equipment used to log the FS-series boreholes. Borehole KHL-BR was logged using logging equipment with different probe configurations and electronic gain controls, so that direct comparisons cannot be made between logs obtained for this study and logs from borehole KHL-BR. However, the geophysical and lithologic logs for borehole KHL-BR originally published by Winter (1984) are reproduced for comparison.
Results of Previous Fracture Permeability Tests at theFS83-BR Boreholes
The hydraulic connections provided by flow paths in fractures between the four closely-spaced FS83-BR boreholes were investigated in a series of studies described by Paillet and others (1987a, 1987b) and Hardin and others (1987). These investigations included flowmeter measurements during pumping and vertical seismic profiles. The results indicated that there was a single, major interconnection between the four boreholes. This single connection intersected all four boreholes at about 45 m in depth, even though the fracture zone seemed to be composed of steeply dipping fractures on the basis of ATV (acoustic televiewer) logs obtained in each of the boreholes. Surface seismic investigations, producing an indication of fracture permeability over a larger volume of rock extending away from the boreholes, indicated a single, nearly horizontal zone of large fracture permeability (Hardin and others, 1987). Packer-isolation and injection tests provided independent confirmation of the relative permeability measurements obtained for this fracture zone based on tube-wave attenuation of AWF (acoustic waveform) data.
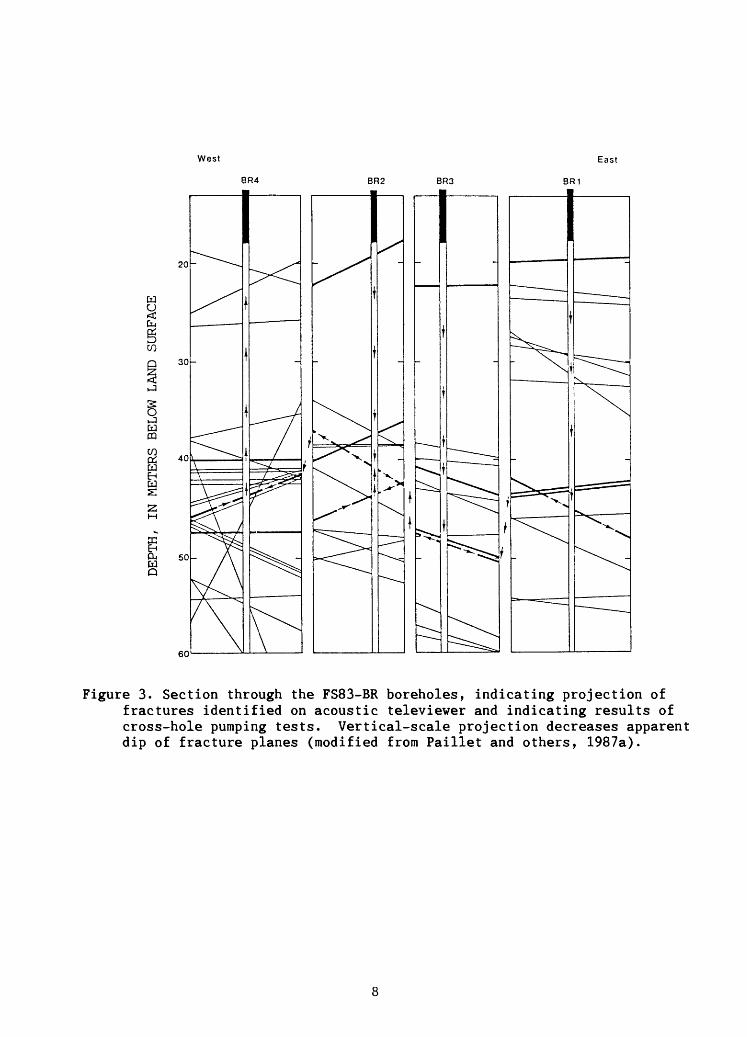
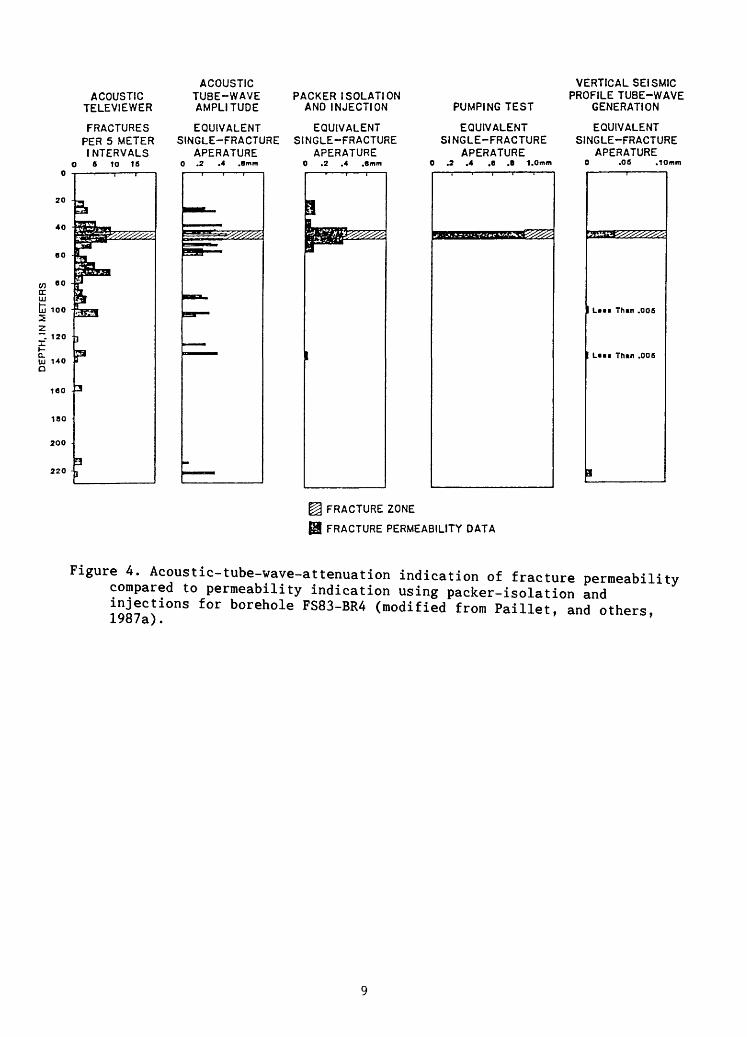
The results of HPFM (heat-pulse flowmeter) measurements during pumping of borehole BR4 are shown in figure 3. The pumping tests confirmed the presence of the hydraulic connection between the FS83-BR boreholes as a nearly horizontal zone of permeability composed of short sections of intersecting fractures. Various geophysical and hydraulic interpretations of the profile of fracture permeability in borehole FS83-BR4 are shown in figure 4 (Paillet and others, 7b). These results indicate the substantial effect of the volume of investigation on interpretation of fracture permeability. The geophysical logs (ATV, AWF, and conventional logs) indicate that more than 20 of the fractures intersecting borehole FS83-BR4 are permeable within a few meters of the borehole wall. However, some of these apparently open fractures did not yield water during pumping or failed
West East
8R4 BR2 BR3 BR1
aCu
aCQ
C/}QS aEHa
DC EH CU W P
Figure 3. Section through the FS83-BR boreholes, indicating projection of fractures identified on acoustic televiewer and indicating results of cross-hole pumping tests. Vertical-scale projection decreases apparent dip of fracture planes (modified from Paillet and others, 1987a).
ACOUSTIC TELEVIEWER
FRACTURESPER 5 METERINTERVALS
ACOUSTIC TUBE-WAVE AMPLITUDE
EQUIVALENTSINGLE-FRACTURE
APERATURE0 .2 .4 .8mm
PACKER ISOLATION AND INJECTION
EQUIVALENTSINGLE-FRACTURE
APERATURE0 .2 .4 .8mm
PUMPING TEST
EQUIVALENTSINGLE-FRACTURE
APERATURE0 .2 .4 .8 .6 1.0mm
FRACTURE ZONE
FRACTURE PERMEABILITY DATA
VERTICAL SEISMICPROFILE TUBE-WAVE
GENERATION
EQUIVALENTSINGLE-FRACTURE
APERATURE
L«it Th*n .006
Th*n .006
Figure 4. Acoustic-tube-wave-attenuation indication of fracture permeability compared to permeability indication using packer-isolation and injections for borehole FS83-BR4 (modified from Paillet, and others, j. "o / a )
to accept water during packer-isolation and injection testing. Comparison of the distribution of apparently open fractures obtained from geophysical logs with the single zone of fracture connection between boreholes inferred from pumping tests demonstrates the substantial difference between permeability that is measured a few meters and tens of meters around borehole FS83-BR4. This dependence of fracture permeability on rock volume of investigation in the vicinity of borehole FS83-BR4 raises questions whether the hydraulic connection between the four FS83-BR boreholes bears any relation to the larger scale circulation of ground water in the crystalline basement rocks beneath Mirror Lake.
One additional result of the investigation of the FS83-BR boreholes was obtained during this study after publication of the results discussed by Paillet and others (1987a) and Hardin and others (1987). During recovery after pumping, the water level in borehole FS83-BR4 seemed to recover slightly faster than the water level in the other three boreholes. Analysis of the measured recovery rates indicates that flow from one or more deeper fractures in borehole FS83-BR4 caused this difference. This was determined when borehole FS83-BR4 was observed to recover fully within 24 hours after pumping stopped. Flow from a deeper fracture zone was inferred to travel upwards in borehole FS83-BR4 to exit at the main fracture zone, allowing flow into the other FS83-BR boreholes. The inferred volume of flow was less than the 0.005 L/min (liter per minute) resolution limit of the heat-pulse flowmeter. However, this small flow was large enough to result in a measurable hydraulic gradient between borehole FS83-BR4 and the other boreholes after a full day of recovery. Subsequent measurements of interval pressures during packer-isolation and injection tests indicated that the flow from the deeper part of borehole FS83-BR4 was being produced by an isolated fracture at about 140 m in depth (P.A. Hsieh, U.S. Geological Survey, written comm., 1987).
APPROACH
Geophysical Logging Equipment
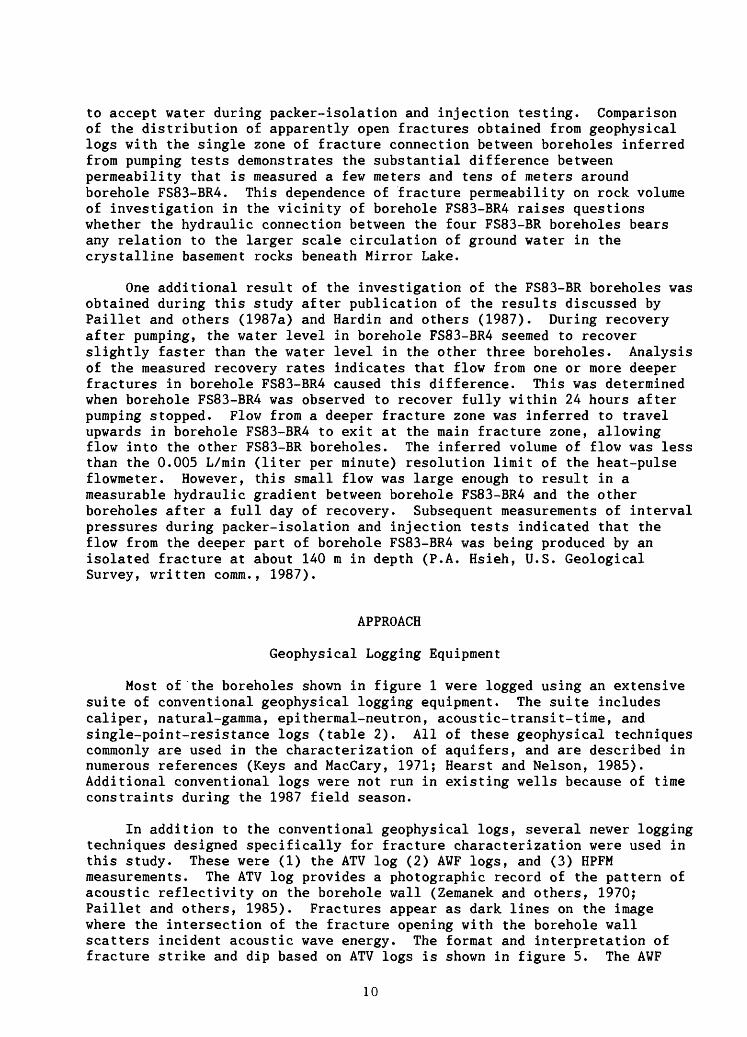
Most of the boreholes shown in figure 1 were logged using an extensive suite of conventional geophysical logging equipment. The suite includes caliper, natural-gamma, epithermal-neutron, acoustic-transit-time, and single-point-resistance logs (table 2). All of these geophysical techniques commonly are used in the characterization of aquifers, and are described in numerous references (Keys and MacCary, 1971; Hearst and Nelson, 1985). Additional conventional logs were not run in existing wells because of time constraints during the 1987 field season.
In addition to the conventional geophysical logs, several newer logging techniques designed specifically for fracture characterization were used in this study. These were (1) the ATV log (2) AWF logs, and (3) HPFM measurements. The ATV log provides a photographic record of the pattern of acoustic reflectivity on the borehole wall (Zemanek and others, 1970; Paillet and others, 1985). Fractures appear as dark lines on the image where the intersection of the fracture opening with the borehole wall scatters incident acoustic wave energy. The format and interpretation of fracture strike and dip based on ATV logs is shown in figure 5. The AWF
10
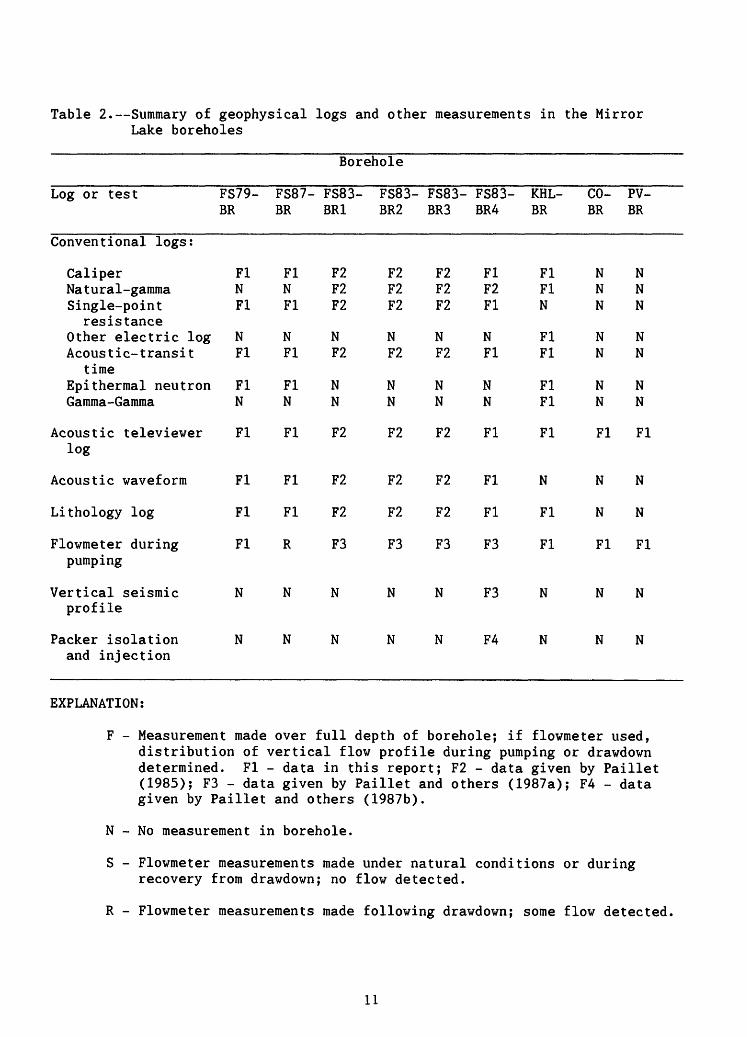
Table 2. Summary of geophysical logs and other measurements in the Mirror Lake boreholes
Borehole
Log or test
Conventional logs:
Caliper Natural-gamma Single-point
resistanceOther electric log Acoustic- transit
timeEpi thermal neutron Gamma-Gamma
Acoustic televiewerlog
Acoustic waveform
Lithology log
Flowmeter during
FS79- BR
Fl N Fl
N Fl
Fl N
Fl
Fl
Fl
Fl
FS87- BR
Fl N Fl
N Fl
Fl N
Fl
Fl
Fl
R
FS83- BR1
F2 F2 F2
N F2
N N
F2
F2
F2
F3
FS83- BR2
F2 F2 F2
N F2
N N
F2
F2
F2
F3
FS83- BR3
F2 F2 F2
N F2
N N
F2
F2
F2
F3
FS83- BR4
Fl F2 Fl
N Fl
N N
Fl
Fl
Fl
F3
KHL- BR
Fl Fl N
Fl Fl
Fl Fl
Fl
N
Fl
Fl
CO- BR
N N N
N N
N N
Fl
N
N
Fl
PV- BR
N N N
N N
N N
Fl
N
N
Flpumping
Vertical seismic NNN NNF3N NN profile
Packer isolation NNN NNF4N NN and injection
EXPLANATION:
F - Measurement made over full depth of borehole; if flowmeter used, distribution of vertical flow profile during pumping or drawdown determined. Fl - data in this report; F2 - data given by Paillet (1985); F3 - data given by Paillet and others (1987a); F4 - data given by Paillet and others (1987b).
N - No measurement in borehole.
S - Flowmeter measurements made under natural conditions or during recovery from drawdown; no flow detected.
R - Flowmeter measurements made following drawdown; some flow detected,
11
Televiewer
360"
W N
Dip = tandiameter
Strike = 6 ± 90°
Figure 5. Schematic drawing of fracture image in acoustic-televiewer-log display.
12
logging technique records the complete pressure signal received by a conventional acoustic logging probe (Paillet and White, 1982; Paillet 1983). A part of this signal correlates closely with fracture permeability. This part of the signal is the tube-wave mode a guided wave that travels along the borehole (Biot, 1952; Cheng and Toksoz, 1981; Paillet and White, 1982). The estimation of fracture permeability using tube-wave attenuation in AWF data is described by Paillet (1983) and Hardin and others, (1987). The method relates that part of tube-wave attenuation associated with viscous dissipation of fluid motions induced in the fracture with fracture permeabilities. The HPFM provides extremely sensitive measurements of vertical flow in boreholes (Hess, 1982), and can be used to identify specific fractures producing flow during pumping tests (Hess, 1986; Paillet and others, 1987a). All of these measurement techniques were used during previous studies of the FS83-BR boreholes and are planned for use in future studies to define fracture permeability along the expanded borehole network shown in figure 1.
In-Situ Measurements of Fracture Permeability
Fracture characterization methods involve various physical models for fractures in the vicinity of boreholes. Difference in the volume of rock surrounding the borehole investigated by individual methods needs to be considered in comparing different geophysical logs obtained in the same borehole. The term "rock volume of investigation" is used to denote the roughly spherical volume of rock over which a specific geophysical measurement averages rock properties. Fracture characterization at Mirror Lake has been based on a simple model for fracture permeability that permits comparison of measurements made using geophysical equipment that effectively average rock properties over different vertical intervals around the depth point nominally associated with the measurements. For example, one log may have a small rock volume of investigations providing a single measurement averaging the properties of several adjacent fractures. Fracture flow is simulated as plane Poiseuille flow in a uniform opening of width between two infinite rock bodies. The discharge per unit width of the opening in the simulation is related to the pressure gradient and fracture thickness according to the equation (Witherspoon and others, 1981):
P'b3
Q = (1)
2 where Q is the measured discharge per unit width (cm /s), P' is the pressuregradient (pascal/cm), b is the fracture aperture (cm), and fi is the viscosity of water (g/cm«s). For thin confined aquifers, the fracture plane may be considered to be a single aquifer the transmissivity, T (cm/s), of which is given by the equation:
T = Kb = pgb3/12n (2)
where g is the acceleration of gravity, p is the density of water (g/cm), and K is the hydraulic conductivity of the fracture (cm/s).
Although naturally occurring fractures are not characterized by a single, uniform aperture, fractures at Mirror Lake may be related to
13
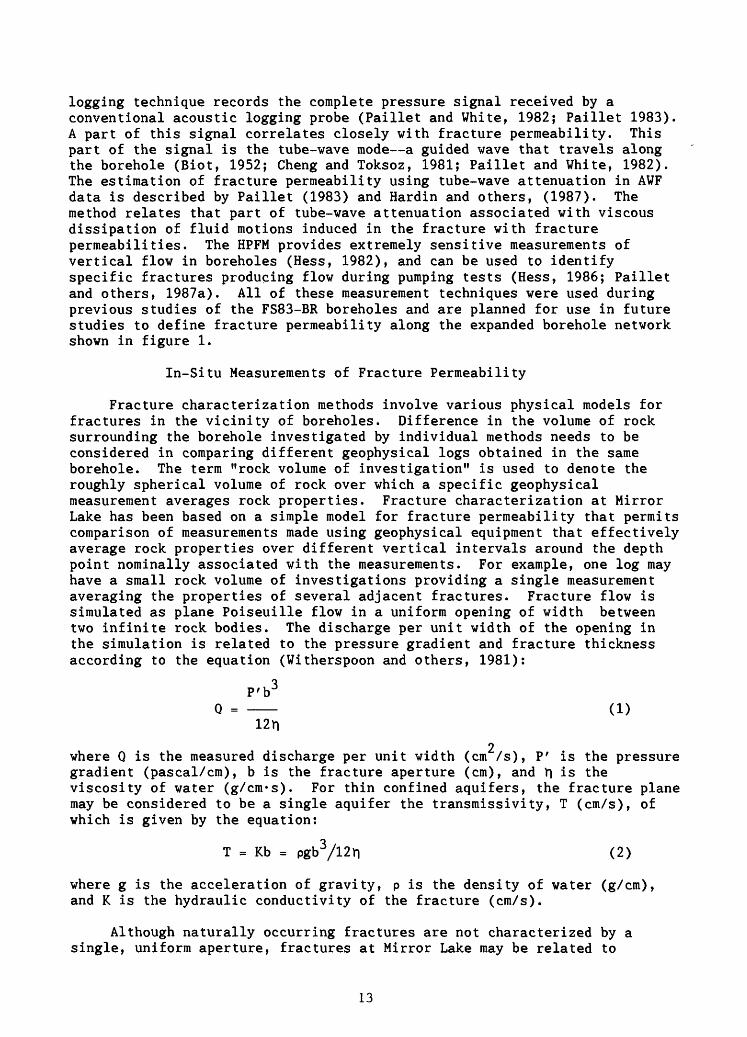
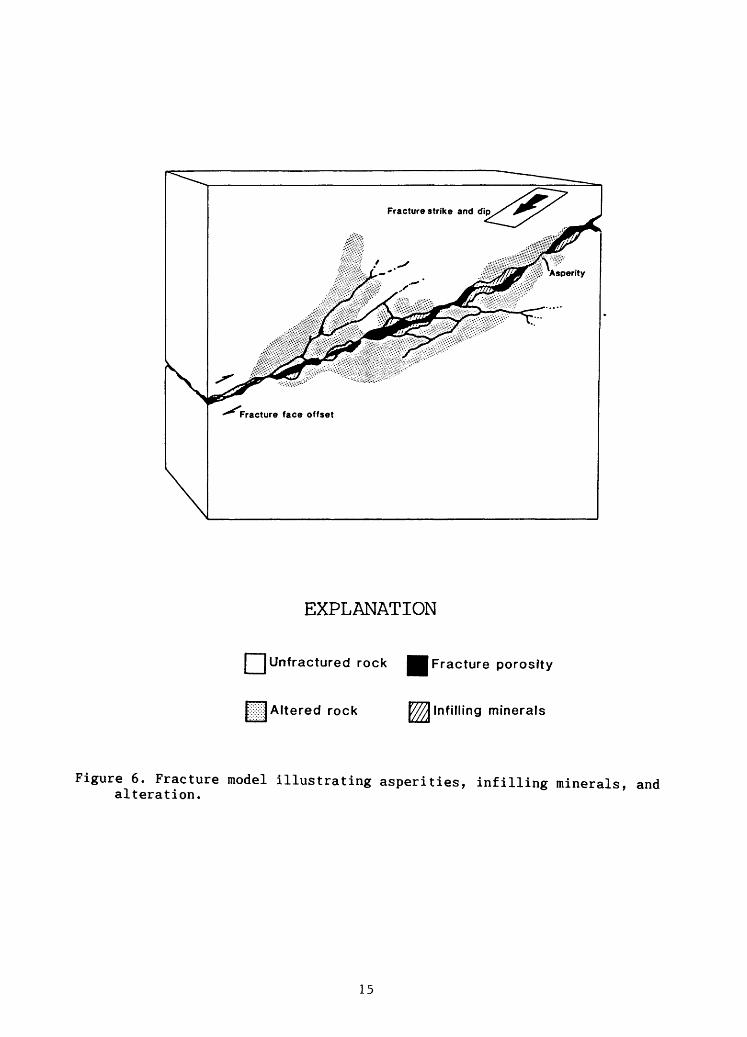
infinite plane fractures, each with a single uniform aperture described in equation (1). In this report, natural fractures are simulated as thin zones of permeable rock that are surrounded by a variable thickness of altered, less permeable rock and that are embedded within a mass of crystalline rock with even lower permeability (Fig. 6). The results of geophysical measurements of properties of fractured rock indicate the combined effects of fracture openings, borehole enlargement in fractured intervals, infilling minerals, and alteration of rock adjacent to fractures (Fig. 7). All of these features affect the permeability estimated by using geophysical logs and other equipment. Different fracture-permeability measurements are compared by estimating the aperture of an equivalent plane fracture conducting plane Poiseuille flow that gives the measured response under in-situ conditions.
The most direct measurement of fracture permeability is made by isolating a short interval of borehole and then measuring the flow induced by an imposed hydraulic-head change (Zeigler, 1976; Hsieh and others, 1983). This approach has several significant complications. First, the exact thickness of fracture zones cannot be determined, so that permeability estimates average the discrete permeability of a few thin fractures throughout the entire isolated interval. Second, some simulations of fracture response need to be based on the head difference between the borehole wall and an undetermined radius of influence in the fracture zone. Third, the volume of investigation associated with these tests is much larger than that associated with most borehole geophysical investigations. Finally, the relatively small permeability of many fractures requires that measurements be made during a period of several hours. These long test periods, combined with the long set-up times needed for use of packers, make direct measurement of fracture permeability a lengthy and complicated process.
Although the permeability of individual fractures is difficult to quantify, studies indicate that fracture permeability alone may not determine the volume of water circulating through a fracture system. For example, a permeable fracture ending abruptly several hundreds of meters away from a borehole and not intersecting other fractures would have little flow. Studies of randomly orientated sets of permeable fractures of finite length indicate that fracture connectivity has an effect on permeability in a given volume of rock (Long and others, 1982). One consequence of fracture connections is the possible overestimation of fracture permeability caused by fracture interconnections that short circuit flow from the zone isolated during packer tests to areas in the borehole that are above and below the test zone.
In this report, fracture permeability interpretations are presented as the average permeability of the rock surrounding an interval where one or several fractures intersect the borehole. Permeabilities are given as the total transmissivity of the interval, or as the aperture of a single, infinite fracture of uniform width, b which has the same volume of flow at the measured hydraulic gradient. When geophysical measurements obtained using different detector spacings associated with different rock volumes of
14
EXPLANATION
QJUnfractured rock Fracture porosity
Altered rock Infilling minerals
Figure 6. Fracture model illustrating asperities, infilling minerals, and alteration.
15
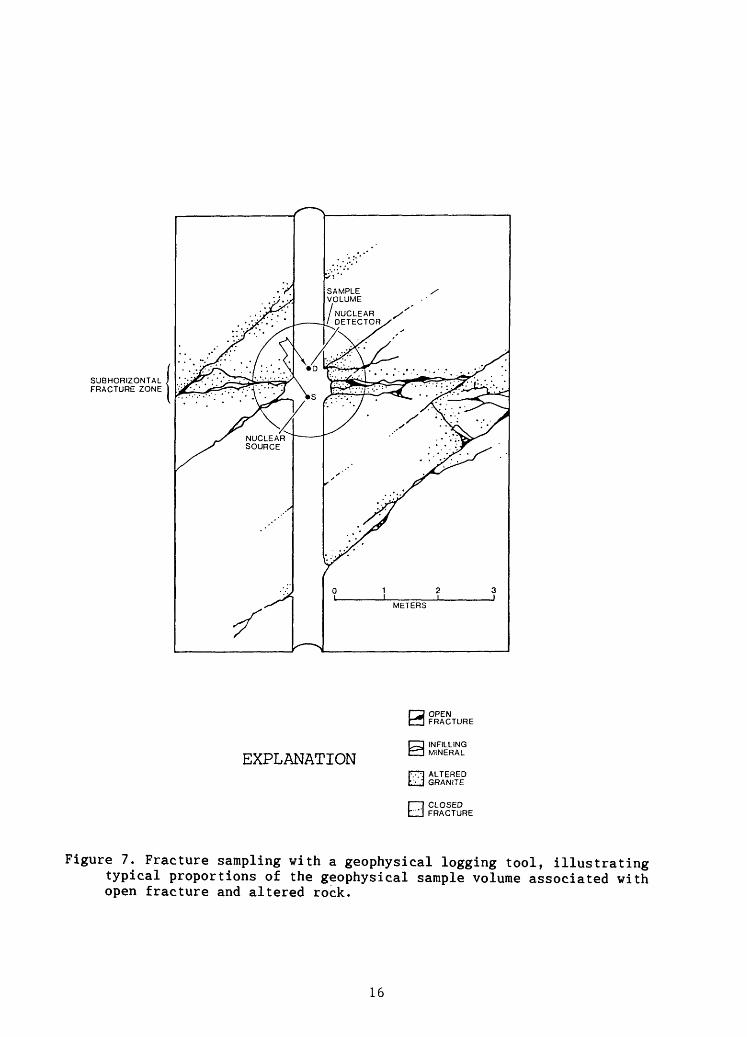
SUBHORIZONTAL FRACTURE ZONE
EXPLANATION
OPEN FRACTURE
INFILLING MINERAL
ALTERED GRANITE
CLOSED FRACTURE
Figure 7. Fracture sampling with a geophysical logging tool, illustrating typical proportions of the geophysical sample volume associated with open fracture and altered rock.
16
investigation are compared with each other, or with the results of packer-isolation tests, permeabilities averaged over different intervals surrounding the measurement point need to be compared. Because these differing intervals may correspond to different numbers of fractures, the permeabilities of more than one fracture set need to be combined to give the transmissivity or equivalent single fracture aperture that has the same average permeability as the combined set of fractures. In that case, the transmissivity values of individual fractures are summed to yield the transmissivity of a single equivalent fracture:
Tc - Tl + T2' < 3 >
where T- and T« are the transmissivity values of the individual fractures having an equivalent single fracture transmissivity of T . Where fracture permeabilities are expressed in single equivalent fracture apertures, the permeabilities are combined using the cubic law (Witherspoon and others, 1981):
2 bc = (bx z + b2
where b- and b« are the apertures of each of the fractures, and b is the aperture of a single fracture conducting the same flow as the two fractures together (Paillet and others, 1987).
FRACTURE CHARACTERIZATION AND FRACTURE PERMEABILITY ESTIMATES
Fracture Characterization at Boreholes FS83-BR, FS87-BR, KHL-BR, CO-BR and PV-BR by Use of Acoustic Televiewer Logs and
other Conventional Geophysical Logs
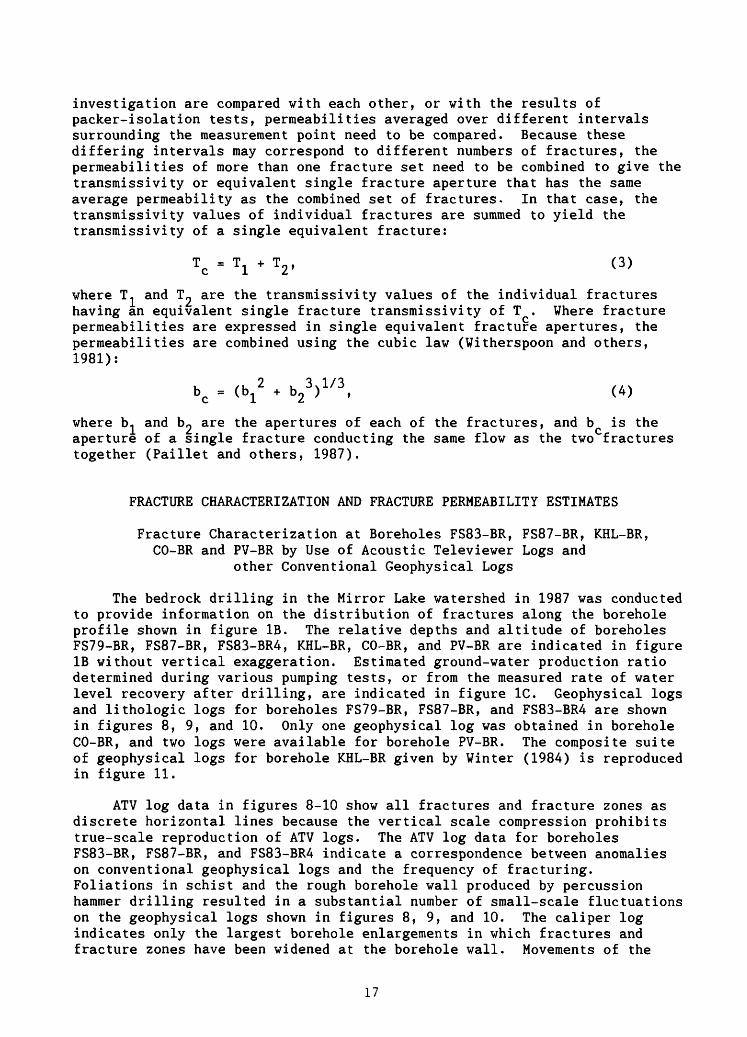
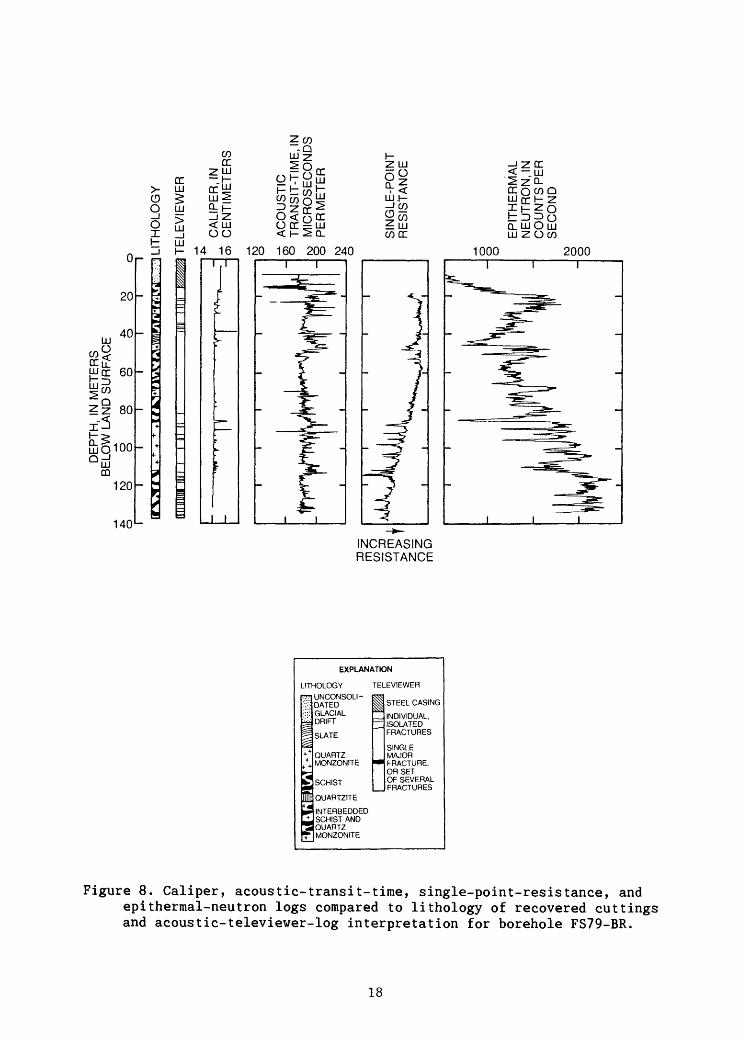
The bedrock drilling in the Mirror Lake watershed in 1987 was conducted to provide information on the distribution of fractures along the borehole profile shown in figure IB. The relative depths and altitude of boreholes FS79-BR, FS87-BR, FS83-BR4, KHL-BR, CO-BR, and PV-BR are indicated in figure IB without vertical exaggeration. Estimated ground-water production ratio determined during various pumping tests, or from the measured rate of water level recovery after drilling, are indicated in figure 1C. Geophysical logs and lithologic logs for boreholes FS79-BR, FS87-BR, and FS83-BR4 are shown in figures 8, 9, and 10. Only one geophysical log was obtained in borehole CO-BR, and two logs were available for borehole PV-BR. The composite suite of geophysical logs for borehole KHL-BR given by Winter (1984) is reproduced in figure 11.
ATV log data in figures 8-10 show all fractures and fracture zones as discrete horizontal lines because the vertical scale compression prohibits true-scale reproduction of ATV logs. The ATV log data for boreholes FS83-BR, FS87-BR, and FS83-BR4 indicate a correspondence between anomalies on conventional geophysical logs and the frequency of fracturing. Foliations in schist and the rough borehole wall produced by percussion hammer drilling resulted in a substantial number of small-scale fluctuations on the geophysical logs shown in figures 8, 9, and 10. The caliper log indicates only the largest borehole enlargements in which fractures and fracture zones have been widened at the borehole wall. Movements of the
17
>- o o
Or- m
20-
LJJ 40
£< ujcc 60 HZ>
c/)LJJ
_ 4 _
DQ
120
140
C/)cc
JU Ofkj ^ LJJ^ LJJ 5; H
£ 1
I
=
< LJJoo
4 161
|
l
|
H Z LJJ6"°. < LJJ!
-O
120 160 200 240
±. LJJ C/DGC
-Q. LJJ O LJJ LJJ ZOC/)
1000 2000
INCREASING RESISTANCE
EXPLANATION
LITHOLOGYUNCONSOLI- DATED GLACIAL DRIFT
SLATE
QUARTZ MONZONITE
SCHIST
QUARTZITE
INTERBEDDED SCHIST AND QUARTZ MONZONITE
TELEVIEWER
STEEL CASING
INDIVIDUAL.ISOLATEDFRACTURES
SINGLEMAJORFRACTURE,OR SETOF SEVERALFRACTURES
Figure 8. Caliper, acoustic-transit-time, single-point-resistance, andepithermal-neutron logs compared to lithology of recovered cuttings and acoustic-televiewer-log interpretation for borehole FS79-BR.
18
gLU Qj
C/DDC
\± I _l Z < LLJr x r x
-"1-14 18 120r~ rm R« III I i T
LU
LLJ C/D
20
40
60
80
100
120
140
160i i
ZC/D ufilOrr
y^aS §«8^ R?5iODC^LLJ < I-20.
200 280
H Z LLJ
OzCL ^
LLJ? -I C/D
^W 2 LLJW DC
LLJ"
CL LLJ O Dj LLJZO W
1000 2000
INCREASING RESISTANCE
EXPLANATION
LITHOLOGY TELEVIEWER~
i;
^^-i- 4
4- t +
5it«+
+
UNCONSOLI- DATEDGLACIAL DRIFT
SLATE
QUARTZMONZONITE
SCHIST
i
STEEL CASING
INDIVIDUAL, ISOLATEDFRACTURES
SINGLEMAJORFRACTURE,OR SETOF SEVERAL FRACTURES
QUARTZITE
INTERBEDDEDSCHIST ANDQUARTZMONZONITE
Figure 9. Caliper, acoustic-transit-time, single-point-resistance, and epithermal-neutron logs compared to lithology of recovered cuttings and acoustic-televiewer-log interpretation for borehole FS87-BR.
19
CD
3 oX
CC
:> CALIPER, IN y CENTIMETERS > INCREASINGUJ
RESISTANCE»- 10 15 20 100
ACOUSTICTRANSIT-TIME,
IN MICROSECONDSPER METER
200 300SINGLE-POINT RESISTANCE
50
100
LU O <Ll- CC
"
3LUCDCOCC LU
UJ
^ 150 I£L UJ Q
200
250 L
EXPLANATION
LITHOLOGYUNCONSOLI- DATED GLACIAL DRIFT
SLATE
QUARTZ MONZONITE
SCHIST
QUARTZITE
INTERBEDDED SCHIST AND QUARTZ MONZONITE
TELEVIEWER
STEEL CASING
INDIVIDUAL.ISOLATEDFRACTURES
SINGLEMAJORFRACTURE.OR SETOF SEVERALFRACTURES
Figure 10. Caliper, acoustic-transit-time, and single-point-resistance logs compared to lithology of recovered cutting and acoustic-televiewer-log interpretation for borehole FS83-BR4.
20
caliper arms indicated on the caliper log cannot represent individual fracture openings in the absence of such widening because the caliper arms are too large to fit into individual fractures that have apertures less than 5 mm. The foliation and rough borehole wall resulted in substantial background noise on the acoustic-transit-time log, making this log very difficult to interpret without other information, such as the ATV log. The single-point resistance log provides the best indication of major fractures, as shown in figures 8, 9, and 10. The single-point-resistance log produces a relative indication of electrical resistivity adjacent to an electrode. Therefore, the log is sensitive to variations in local electrical conductivity of the rock adjacent to the borehole, variations in borehole diameter, and variations in electrical conductivity of the borehole fluid. The substantial increases in local rock conductivity associated with clay minerals, which result from alteration and which surround permeable fractures, cause the large deflections in the single-point-resistance log at major fractures indicated on the ATV log. These large deflections are superimposed on and partly hidden or "masked" by the many smaller deflections caused by the foliations in the schist and rough borehole wall. The epithermal-neutron log indicates similar deflections in the vicinity of major fractures that also are attributed to the effects of clay mineral alterations. However, the vertical resolution of the epithermal-neutron log is much less than that of the single-point-resistance log; therefore, the epithermal-neutron logs shown in figures 8 and 9 do not provide as accurate an indication of the presence of permeable fractures.
The association of caliper, acoustic-transit-time, single-point- resistance, and epithermal-neutron log anomalies with fractures is difficult to determine from figures 8, 9, and 10 because of the extreme vertical compression needed to represent the entire borehole on a single page. An example of the detailed correspondence between conventional geophysical logs and fractures is shown in figure 12. Comparison of the ATV and conventional logs indicates major geophysical-log anomalies at some of the fractures on the ATV log, but does not indicate anomalies at other fractures on the ATV log. Although the apparent width of fracture on the ATV log is not quantitatively related to fracture aperture (Zemanek and others, 1970), the two largest fractures on the ATV log do correlate with two of the largest geophysical-log anomalies at points B and E in figure 12. Other major log anomalies (A, G, and H) also correlate with fractures on the ATV log. However, the fractures that correlate with anomalies A, G, and H do not appear any larger than several other fractures on the ATV log that do not correlate with anomalies. Other, less significant log anomalies (C and D) may correlate with other fractures. The very small single-point-resistance anomaly at F in figure 12 probably correlates with a fracture on the ATV log, but many other small log anomalies may be hidden by the apparently random fluctuations of the log at other locations. The caliper and acoustic transit-time logs indicate anomalies at some of the fractures shown in figure 12. For example, the caliper deflection at H indicates that the borehole has enlarged by breakage of rock between two sub-parallel fractures. The anomalies associated with fractures on the acoustic- transit-time log appear much more difficult to resolve because of the substantial background fluctuation in the acoustic-transit-time log that is attributed to borehole wall roughness and other factors.
The results shown by figures 8 through 12 indicate that the ATV log can
21
DE
PT
H,
IN F
EET
BE
LOW
LA
ND
SU
RF
AC
E
K3
K3
OQ
>-J n>
hh
O
C
D -$
n> o
fl>
Mcr
M.
o o
ffi o
t-'O
Q
I CO
w » n
o 3
x^
T3
l-
h
0)
»1
H
O
fl>
3
O.
s rt-
MfD
H
->1
rt
--
cr
oH-
» M
V
O O
00 O
q n o c CO rt-
M« n i rt-
FR
AC
TU
RE
S
LIT
HO
LOG
Y
CA
LIP
ER
, IN
C
EN
TIM
ET
ER
S
AC
OU
ST
IC V
ELO
CIT
Y
GA
MM
A.
IN C
OU
NT
S
PER
SE
CO
ND
DE
NS
ITY
, IN
CO
UN
TS
PE
R S
EC
ON
D
NE
UT
RO
N P
OR
OS
ITY
, IN
CO
UN
TS
PER
SE
CO
ND
FO
CU
SE
D R
ES
IST
IVIT
Y
SP
ON
TA
NE
OU
S P
OT
EN
TIA
LA
ND
SH
OR
T A
ND
LO
NG
NO
RM
AL
RE
SIS
TIV
ITY
SP
ON
TA
NE
OU
S P
OT
EN
TIA
L A
ND
SH
OR
T A
ND
LO
NG
N
OR
MA
L R
ES
IST
IVIT
Y
FLU
ID R
ES
IST
IVIT
Y
100
DE
PT
H,
IN M
ETE
RS
BE
LOW
LA
ND
SU
RF
AC
E
trLLJ
5UJ
>UJ_JUJ
50
60UJ
Lit C/D
70
UJOuJCD
80
CALIPER, IN CENTIMETERS
16 18 20 100
ACOUSTIC TRANSIT-TIME, IN MICROSECONDS
PER METER
200 300 400
SINGLE- POINT
RESISTANCE
EPITHERMALNEUTRON, INCOUNTS PER
SECOND
1000 2000
90 1- u
H
l I T
I I I
INCREASING RESISTANCE
EXPLANATION
LITHOLOGY TELEVIEWERUNCONSOLI- DATEDGLACIAL DRIFT
SLATE
QUARTZ MONZONITE
SCHIST
QUARTZITE
INTERBEDDED SCHIST AND QUARTZ MONZONITE
ISTEE:L CASINGINDIVIDUAL,ISOLATEDFRACTURES
SINGLEMAJORFRACTURE,OR SETOF SEVERALFRACTURES
Figure 12. Detailed section of a geophysical log for the depth interval from 50 to 90 meters in borehole FS87-BR showing typical fracture anomalies.
23
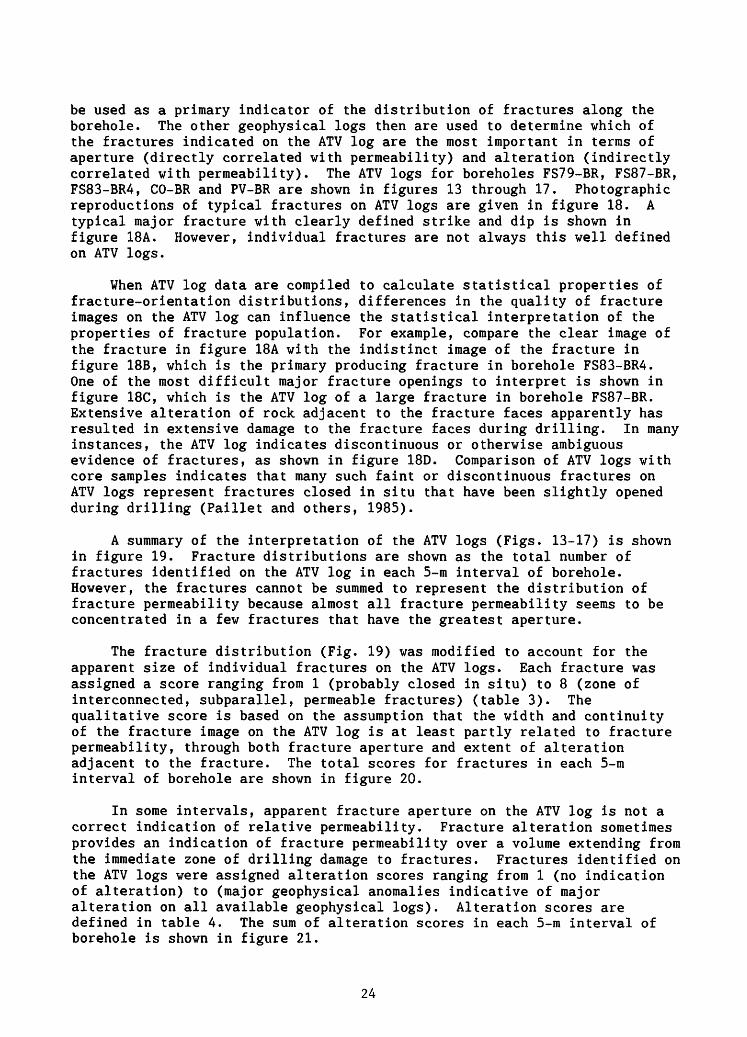
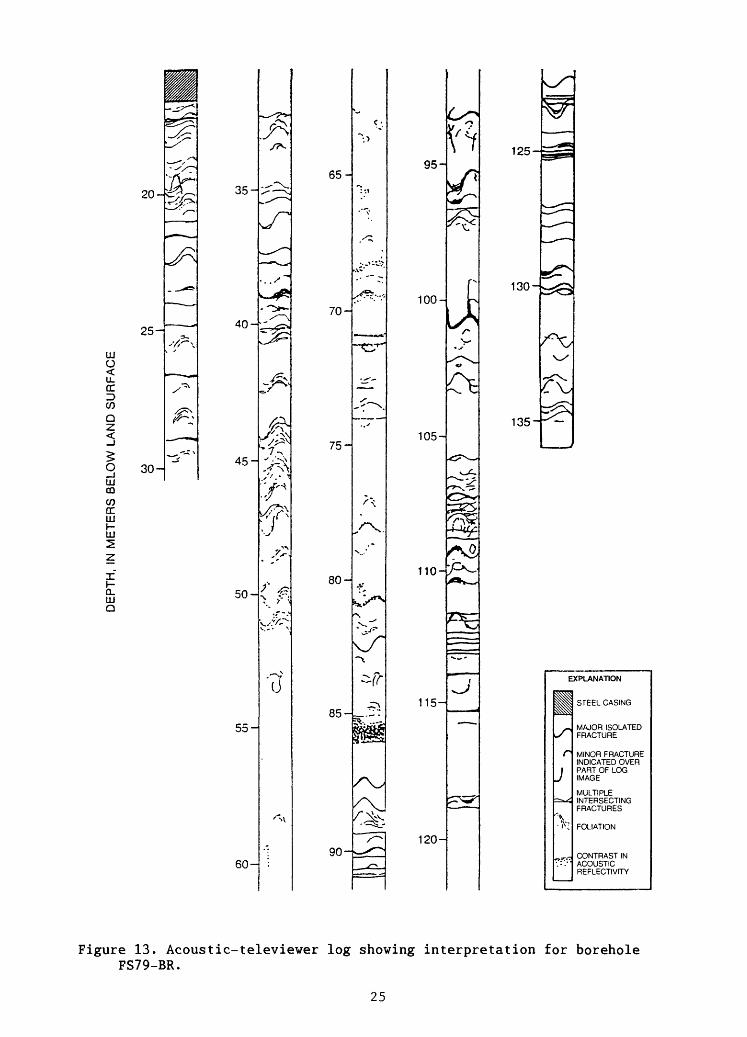
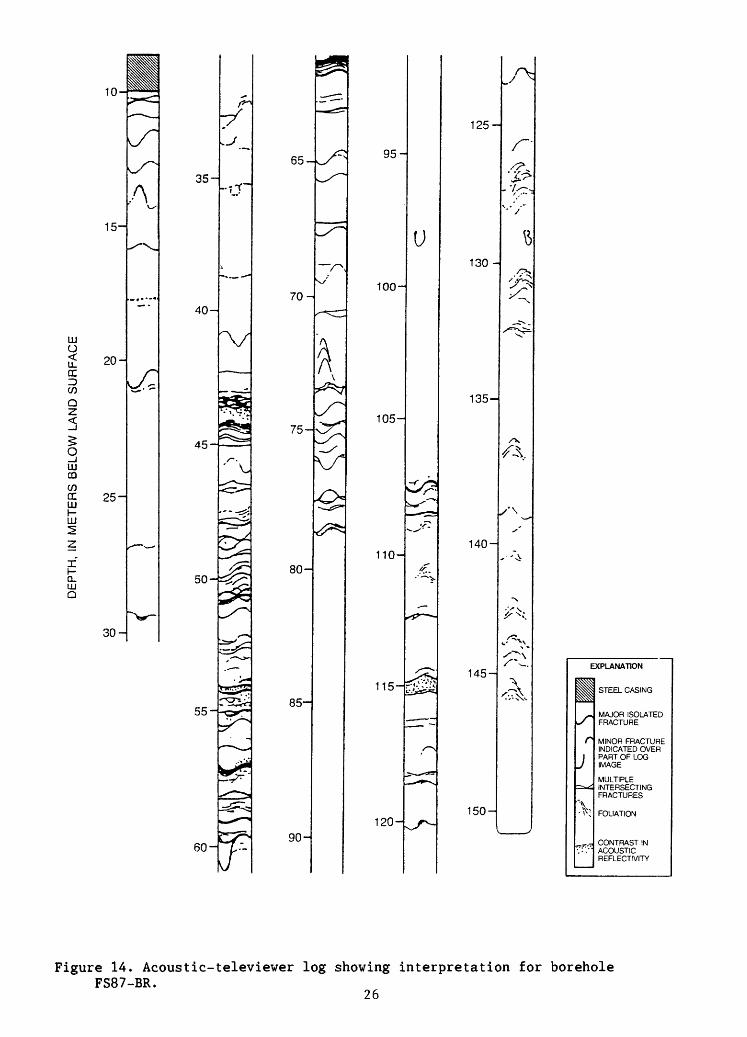
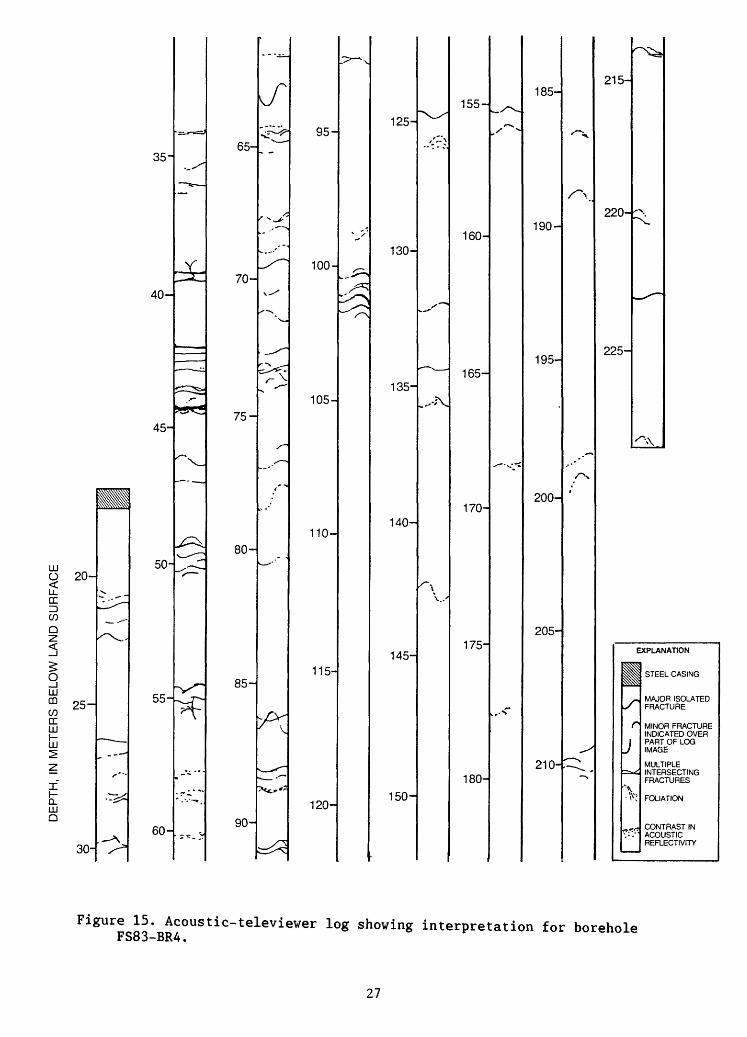
be used as a primary indicator of the distribution of fractures along the borehole. The other geophysical logs then are used to determine which of the fractures indicated on the ATV log are the most important in terms of aperture (directly correlated with permeability) and alteration (indirectly correlated with permeability). The ATV logs for boreholes FS79-BR, FS87-BR, FS83-BR4, CO-BR and PV-BR are shown in figures 13 through 17. Photographic reproductions of typical fractures on ATV logs are given in figure 18. A typical major fracture with clearly defined strike and dip is shown in figure 18A. However, individual fractures are not always this well defined on ATV logs.
When ATV log data are compiled to calculate statistical properties of fracture-orientation distributions, differences in the quality of fracture images on the ATV log can influence the statistical interpretation of the properties of fracture population. For example, compare the clear image of the fracture in figure 18A with the indistinct image of the fracture in figure 18B, which is the primary producing fracture in borehole FS83-BR4. One of the most difficult major fracture openings to interpret is shown in figure 18C, which is the ATV log of a large fracture in borehole FS87-BR. Extensive alteration of rock adjacent to the fracture faces apparently has resulted in extensive damage to the fracture faces during drilling. In many instances, the ATV log indicates discontinuous or otherwise ambiguous evidence of fractures, as shown in figure 18D. Comparison of ATV logs with core samples indicates that many such faint or discontinuous fractures on ATV logs represent fractures closed in situ that have been slightly opened during drilling (Paillet and others, 1985).
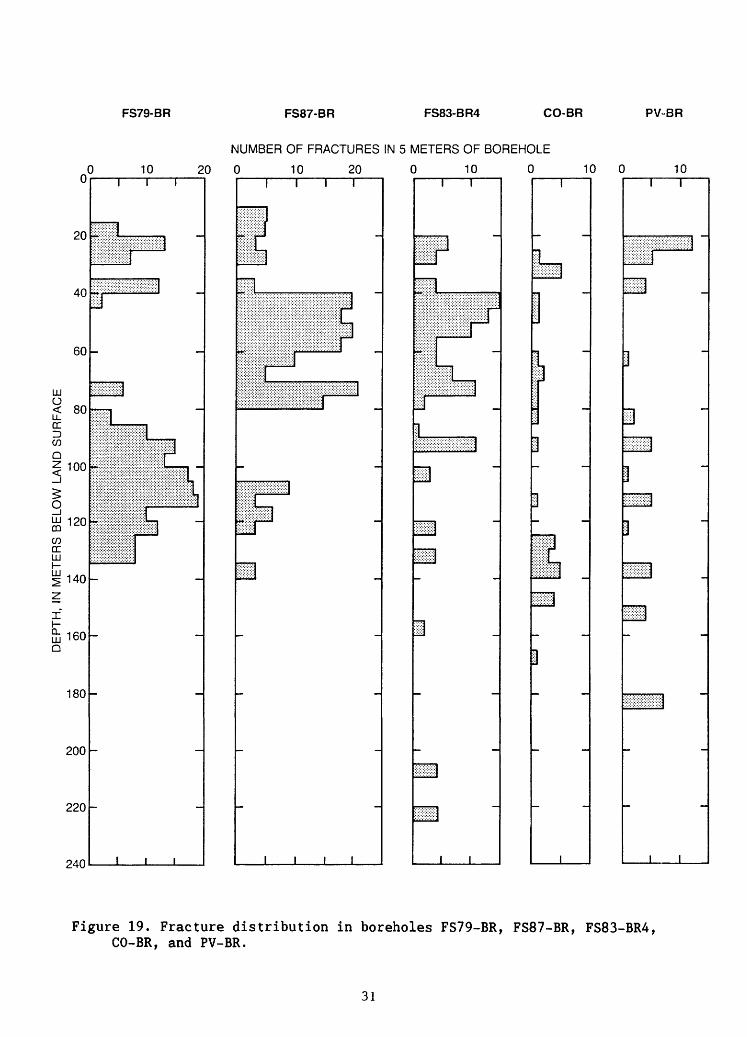
A summary of the interpretation of the ATV logs (Figs. 13-17) is shown in figure 19. Fracture distributions are shown as the total number of fractures identified on the ATV log in each 5-m interval of borehole. However, the fractures cannot be summed to represent the distribution of fracture permeability because almost all fracture permeability seems to be concentrated in a few fractures that have the greatest aperture.
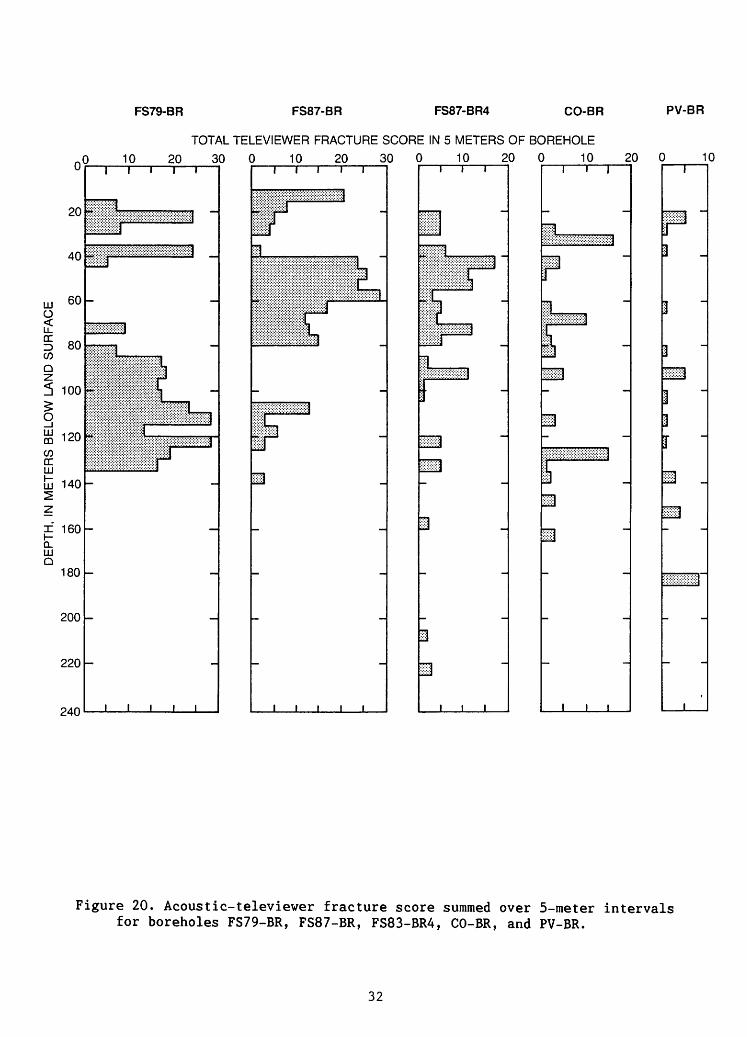
The fracture distribution (Fig. 19) was modified to account for the apparent size of individual fractures on the ATV logs. Each fracture was assigned a score ranging from 1 (probably closed in situ) to 8 (zone of interconnected, subparallel, permeable fractures) (table 3). The qualitative score is based on the assumption that the width and continuity of the fracture image on the ATV log is at least partly related to fracture permeability, through both fracture aperture and extent of alteration adjacent to the fracture. The total scores for fractures in each 5-m interval of borehole are shown in figure 20.
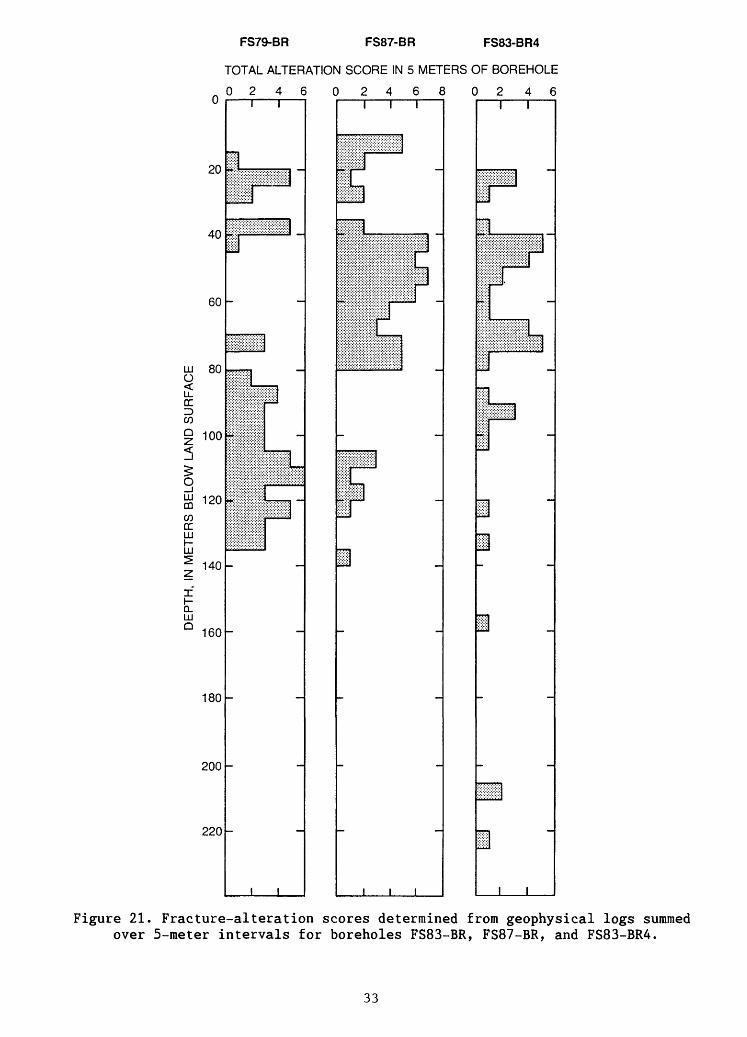
In some intervals, apparent fracture aperture on the ATV log is not a correct indication of relative permeability. Fracture alteration sometimes provides an indication of fracture permeability over a volume extending from the immediate zone of drilling damage to fractures. Fractures identified on the ATV logs were assigned alteration scores ranging from 1 (no indication of alteration) to (major geophysical anomalies indicative of major alteration on all available geophysical logs). Alteration scores are defined in table 4. The sum of alteration scores in each 5-m interval of borehole is shown in figure 21.
24
25-
UJ 0 < UL OC D (f)QZ
O _J LU CO</> OC LU
LU
DLLU Q
COo
35-
40-
45-
50-
55-
60-
0
65-
70-
75-
80-
85 -J
95-
100-
105-
110-
115
120-
W
125
130-
135
EXPLANATION
Br
J
. *k
Vtt
STEEL CASING
MAJOR ISOLATED FRACTURE
MINOR FRACTURE INDICATED OVER PART OF LOG IMAGE
MULTIPLE INTERSECTING FRACTURES
FOLIATION
CONTRAST IN ACOUSTIC REFLECTIVITY
Figure 13. Acoustic-televiewer log showing interpretation for borehole FS79-BR.
25
UJo u_OC
cnQ
UJCOen ccUJ
UJ
Q. UJ Q
15-
20-
25-
30-
35-
40-
55-
7T
70-
75-
80-
85-
90-
95-
100-
105-
110-
115-
120-
125-
130-
135-
140-
145-
150-
S\
EXPLANATION
H^r
j.>c
*??
STEEL CASING
MAJOR ISOLATED FRACTURE
MINOR FRACTURE INDICATED OVER PART OF LOG IMAGE
MULTIPLE INTERSECTING FRACTURES
FOLIATION
CONTRAST IN ACOUSTIC REFLECTIVITY
Figure 14. Acoustic-televiewer log showing interpretation for boreholeFS87-BR.
26
35-
40-
45-
UJ O
u_ cr=>C/D
Q
gUJmC/DcrUJ
UJ
CL UJ Q
20-
25-
30-
50-
55-
60-
65-
70-
75-
80-
85-
90-
95-
100-
105-
110-
115-
120-
125-
130-
135-
140-
145-
150-
155-
160-
165-
170-
175-
180-
185-
190-
195-
200-
205-
210-
215-
220
225-
EXPLANATION
B
j V
STEEL CASING
MAJOR ISOLATED FRACTURE
MINOR FRACTURE INDICATED OVER PART OF LOG IMAGE
MULTIPLE INTERSECTING FRACTURES
FOLIATION
CONTRAST IN ACOUSTIC REFLECTIVITY
Figure 15. Acoustic-televiewer log showing interpretation for borehole FS83 BR4.
27
LLJ O
GCID CO
Q
LLJ COCO
LLJ h- LLJ
CL LLJ Q
10-
15-
20-
30-
35-
40-
45-
50-
55-
60-
65-
70
75-
80-
85-
90-
95-
100-
105-
110-
115-
120
125-
130-
135-
140-
145-
150-
155-
160-
165-
^ »
EXPLANATION
P
J
ff^\\
STEEL CASING
MAJOR ISOLATED FRACTURE
MINOR FRACTURE INDICATED OVER PART OF LOG IMAGE
MULTIPLE INTERSECTING FRACTURES
FOLIATION
CONTRAST IN ACOUSTIC REFLECTIVITY
Figure 16. Acoustic-televiewer log showing interpretation for boreholeCO-BR. 28
25-^
30-
UJ O <u_<r13 CO
QZ
gUJmCOccUJI-UJ
ICL UJQ
WATER'LEVEL
35-
40-
45-
50
55-
EXPLANATION
Hr
j
\
STEEL CASING
MAJOR ISOLATED FRACTURE
MINOR FRACTURE INDICATED OVER PART OF LOG IMAGE
MULTIPLE INTERSECTING FRACTURES
FOLIATION
CONTRAST IN ACOUSTIC REFLECTIVITY
60-
65-
70-
75-
80-
85-
90-
95-
100-
105-
110-
120-
125-1
130-
135-
140-
145-
150-
155-
160-
165-
170-
175-
180-
185-
Figure 17. Acoustic-televiewer log showing interpretation for borehole PV-BR.
29
POSSIBLE FRACTURE
Figure 18. Examples of acoustic-televiewer logs of individual fracturesin boreholes: A, Distinct, isolated fracture in borehole FS87-BR; B, Major water-producing fracture in borehole FS83-BR4; C, Large, but poorly defined, fracture in borehole FS87-BR; and D, Possible fracture in FS87-BR.
30
FS79-BR FS87-BR FS83-BR4 CO-BR PV-BR
0
20
40
60
LU
< 80
NUMBER OF FRACTURES IN 5 METERS OF BOREHOLE
0 10 20 0 10 20 0 10 0 10 0 10
C/D
Q100
g S 120C/Dcc LLJ
^140
h- w 160Q
180
200
220
240
T I I
i i i
I i l r
i i i
i r
i i
1
1
1
1
I I
J___I
Figure 19. Fracture distribution in boreholes FS79-BR, FS87-BR, FS83-BR4, CO-BR, and PV-BR.
31
FS79-BR FS87-BR FS87-BR4 CO-BR PV-BR
0
20
40
in 60O<LL
§ 80 coQZ
TOTAL TELEVIEWER FRACTURE SCORE IN 5 METERS OF BOREHOLE
0 10 20 30 0 10 20 30 0 10 20 0 10 20 0____10
3
CO DC LU
100
120
140
x 160a.LU Q
180
200
220
240
1 1 i i r
j__i
i i i T
i i
1
1
1
i t i
i n
1
3Hi11r13
m
Figure 20. Acoustic-televiewer fracture score summed over 5-meter intervals for boreholes FS79-BR, FS87-BR, FS83-BR4, CO-BR, and PV-BR.
32
FS79-BR FS87-BR FS83-BR4
TOTAL ALTERATION SCORE IN 5 METERS OF BOREHOLE
0246 02468 0246u
20
40
60
LU 800 <UL DCID CO
§ 100
5 <Z
g£ 120COccLUI-LJLJ
| 140
IDL LJJ
° 160
180
200
220
i I
Hijilisjiissssil
-
:-:-:':-::::::: ::::::::::l:':':' :''':: ' ' ' ' ''
^^^^
iiiiiiSijli
s^^^
Illlllpiiiiiiiv
llillliii| ~
i i
T
I
1
Figure 21. Fracture-alteration scores determined from geophysical logs summed over 5-meter intervals for boreholes FS83-BR, FS87-BR, and FS83-BR4.
33
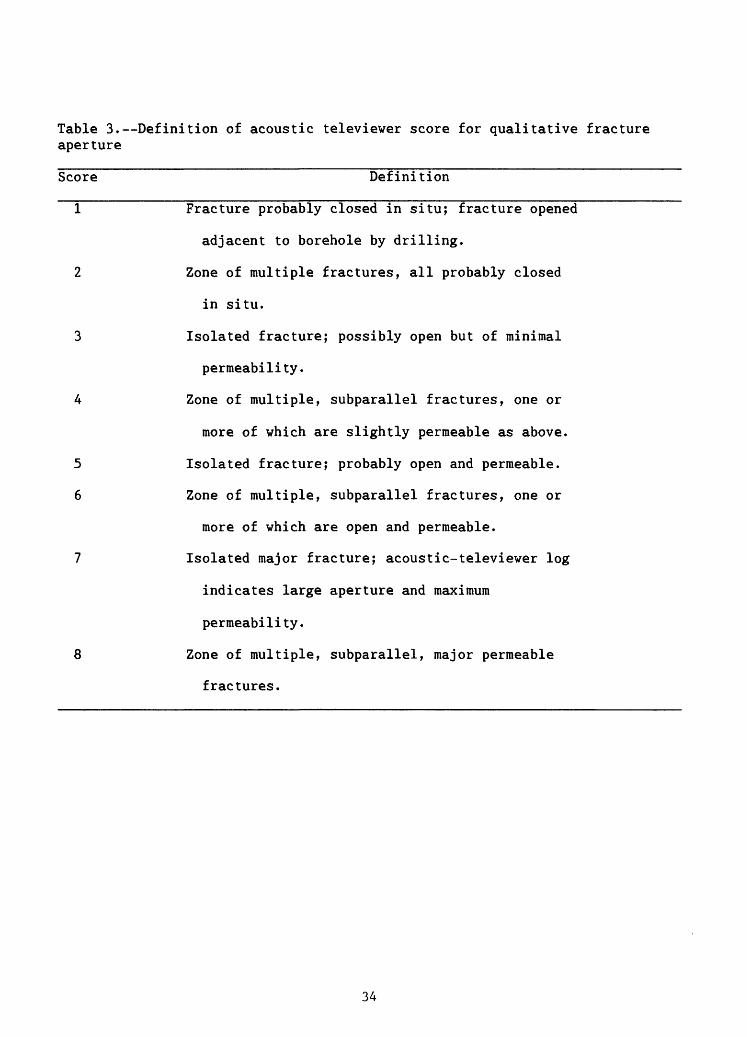
Table 3. Definition of acoustic televiewer score for qualitative fracture aperture
Score Definition
1 Fracture probably closed in situ; fracture opened
adjacent to borehole by drilling.
2 Zone of multiple fractures, all probably closed
in situ.
3 Isolated fracture; possibly open but of minimal
permeability.
4 Zone of multiple, subparallel fractures, one or
more of which are slightly permeable as above.
5 Isolated fracture; probably open and permeable.
6 Zone of multiple, subparallel fractures, one or
more of which are open and permeable.
7 Isolated major fracture; acoustic-televiewer log
indicates large aperture and maximum
permeability.
8 Zone of multiple, subparallel, major permeable
fractures.
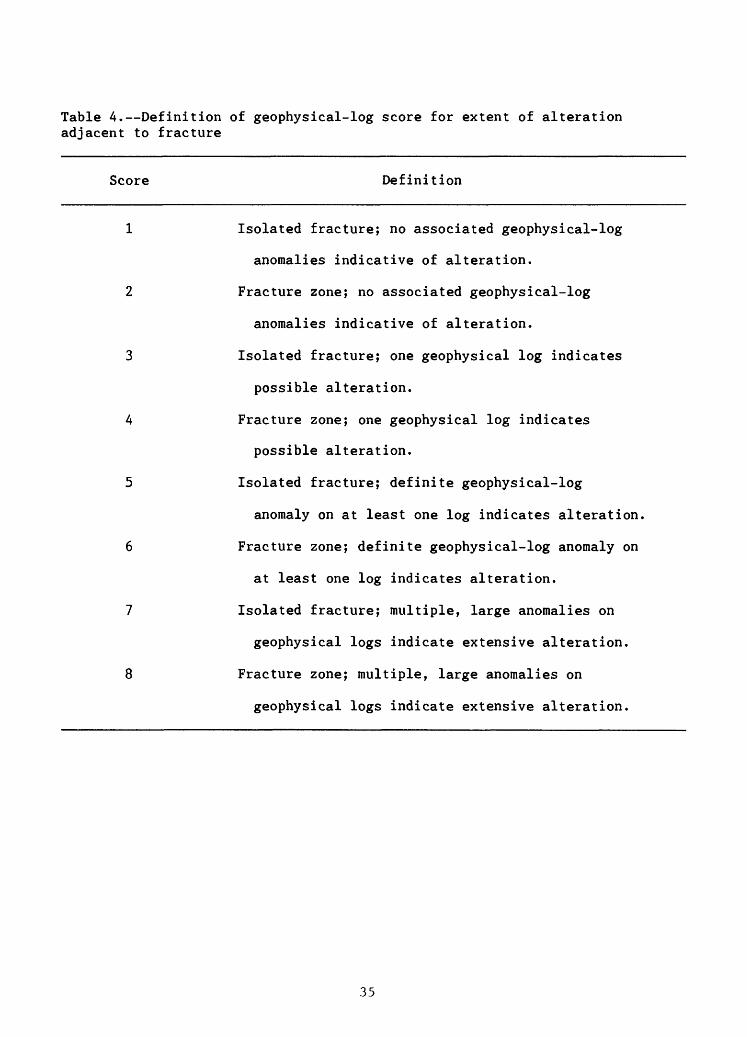
Table 4. Definition of geophysical-log score for extent of alteration adjacent to fracture
Score Definition
1 Isolated fracture; no associated geophysical-log
anomalies indicative of alteration.
2 Fracture zone; no associated geophysical-log
anomalies indicative of alteration.
3 Isolated fracture; one geophysical log indicates
possible alteration.
4 Fracture zone; one geophysical log indicates
possible alteration.
5 Isolated fracture; definite geophysical-log
anomaly on at least one log indicates alteration,
6 Fracture zone; definite geophysical-log anomaly on
at least one log indicates alteration.
7 Isolated fracture; multiple, large anomalies on
geophysical logs indicate extensive alteration.
8 Fracture zone; multiple, large anomalies on
geophysical logs indicate extensive alteration.
35
The permeability of a volume of rock containing multiple intersecting fractures depends upon orientation and interconnection of fractures in addition to fracture aperture. Although distribution of fractures with depth is shown in figure 19 through 21, no indication of fracture orientation is given. Fracture orientations can be determined from the ATV log data in figures 13 through 17; these data are listed in Table 5. A clearer indication of fracture orientation is shown in figure 22. All fractures identified on the ATV logs for boreholes FS78-BR, FS87-BR, FS83-BR4, CO-BR and PV-BR are shown as lines projected onto the east-west plane containing the borehole axis. This plane was chosen for the projection instead of the northwest-southwest plane through the borehole profile (Fig. IB) because most fractures seem to dip steeply to either the east or the west. Although the fracture distributions indicated in figures 19, 20, and 21 seem to vary substantially from borehole to borehole, the fracture orientations shown in figure 22 indicate that a network of intersecting fractures could provide fracture flow paths along the profile of boreholes extending from FS83-BR to PV-BR.
Tube-Wave Attenuation Estimates of Fracture Permeability
The only geophysical log obtained at the Mirror Lake study site that has consistently resulted in direct, quantitative estimations of fracture permeability in previous studies is the tube-wave attenuation log generated from AWF data. However, these results indicate that the tube-wave method only provides estimates of the permeability of fractures in the immediate vicinity of the borehole (Algan and Toksoz, 1986). Effective fracture permeability depends on fracture interconnectivity as much as local fracture aperture (Witherspoon and others, 1981), so that local fracture permeability determined from tube-wave attenuation may not provide an accurate estimate the permeability of the entire volume of rock.
The tube-wave attenuation is modeled as direct viscous dissipation of acoustic energy produced when the oscillatory tube wave travels past a permeable fracture (Rosenbaum, 1974; Paillet, 1983; Algan and Toksoz, 1986). Tube-wave attenuation is related to the aperture of an equivalent infinite-plane fracture by calculating the attenuation of a pressure oscillation of specified frequency and initial energy (Mathieu and Toksoz, 1984; Pascal, 1986). An example of tube-wave attenuation for a fracture in borehole FS83-BR4 is shown in figure 23A. The percent attenuation given in the figure can be related to equivalent single-fracture aperture using the curves given by Algan and Toksoz (1986), The interpretation curve used in the case of 15 kHz (kilohertz) tube waves in a 150-mm-diameter borehole is given in figure 23B. The interpretation is complicated because the composite tube-wave attenuation includes additional wave modes that are sensitive to borehole wall roughness and other effects in addition to fracture permeability. This complication was resolved by using the ATV log to indicate which of the observed minima in acoustic amplitude tube-wave amplitude were associated with fractures.
Estimates of total fracture transmissivity based on AWF tube-wave attenuation for each 5-m interval in boreholes FS83-BR, FS87-BR, and FS83-BR are shown in figure 24. All AWF data were obtained using the same 15 kHz acoustic source and digital recording system described by Paillet and others (1987b) and Hardin and others (1987). In the absence of additional
36
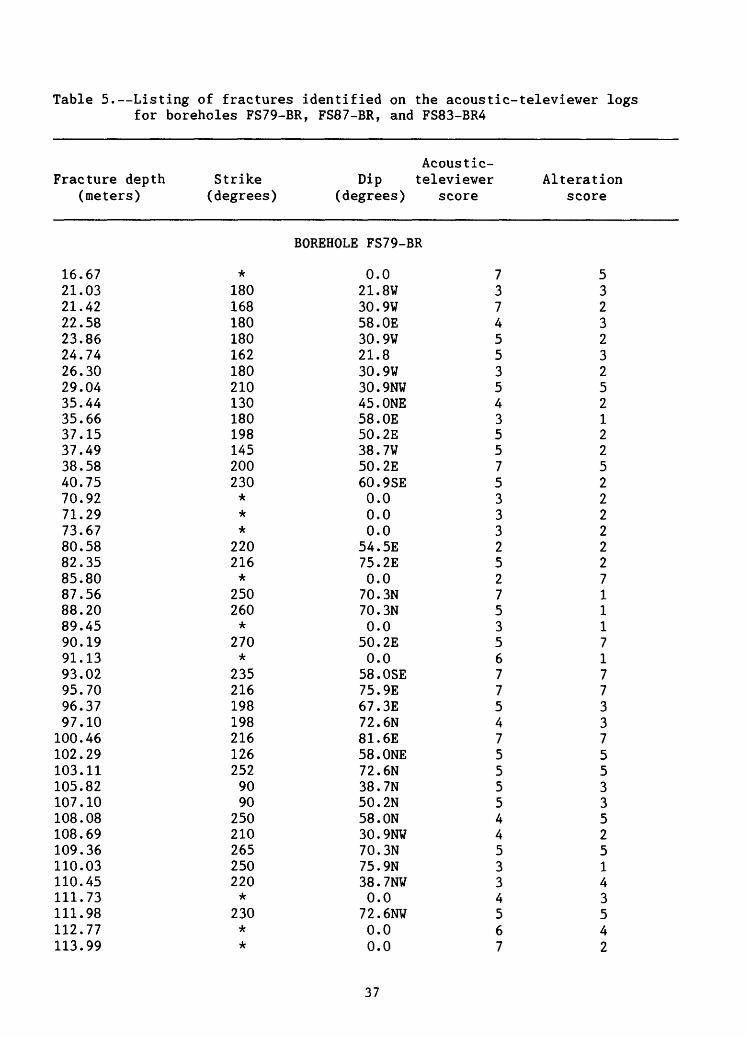
Table 5. Listing of fractures identified on the acoustic-televiewer logs for boreholes FS79-BR, FS87-BR, and FS83-BR4
Fracture depth (meters)
Strike (degrees)
Acoustic- Dip televiewer
(degrees) scoreAlteration
score
16.6721.0321.4222.5823.8624.7426.3029.0435.4435.6637.1537.4938.5840.7570.9271.2973.6780.5882.3585.8087.5688.2089.4590.1991.1393.0295.7096.3797.10100.46102.29103.11105.82107.10108.08108.69109.36110.03110.45111.73111.98112.77113.99
BOREHOLE FS79-BR
* 0.0180 21.8W168 30.9W180 58.OE180 30.9W162 21.8180 30.9W210 30.9NW130 45.ONE180 58.OE198 50.2E145 38.7W200 50.2E230 60.9SE* 0.0* 0.0* 0.0
220 54.5E216 75.2E* 0.0
250 70.3N260 70.3N* 0.0270 50.2E* 0.0
235 58.0SE216 75.9E198 67.3E198 72.6N216 81.6E126 58.ONE252 72.6N90 38.7N90 50.2N
250 58.ON210 30.9NW265 70.3N250 75.9N220 38.7NW* 0.0
230 72.6NW* 0.0* 0.0
37
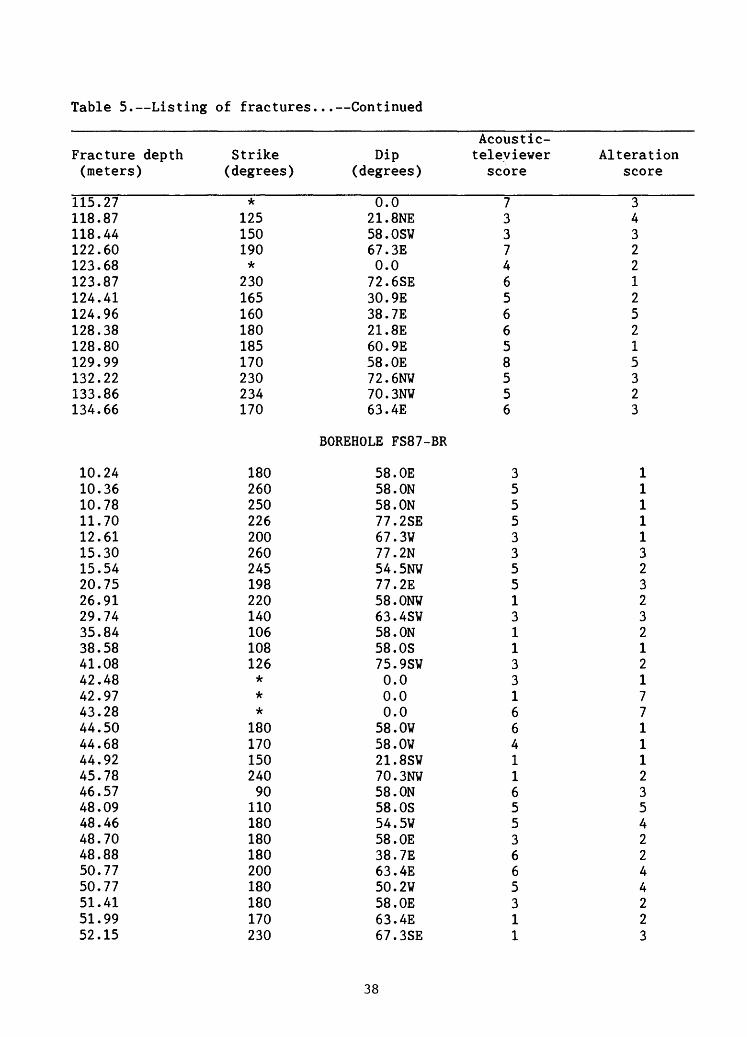
Table 5. Listing of fractures... Continued
Fracture depth (meters)
115.27 118.87118.44122.60123.68123.87124.41124.96128.38128.80129.99132.22133.86134.66
Strike (degrees)
* 125150190*
230165160180185170230234170
Dip (degrees)
0.0 21.8NE58.0SW67. 3E0.072.6SE30. 9E38. 7E21. 8E60. 9E58. OE72.6NV70.3NW63. 4E
Acoustic- televiewer score
7 3374656658556
Alteration score
3 4322125215323
10.2410.3610.7811.7012.6115.3015.5420.7526.9129.7435.8438.5841.0842.4842.9743.2844.5044.6844.9245.7846.5748.0948.4648.7048.8850.7750.7751.4151.9952.15
BOREHOLE FS87-BR
180 58. OE260 58.ON250 58.ON226 77.2SE200 67.3W260 77.2N245 54.5NW198 77.2E220 58.0N¥140 63.4SW106 58.ON108 58.OS126 75.9SW* 0.0* 0.0* 0.0180 58.OW170 58.OW150 21.8SW240 70.3NV90 58.ON
110 58.OS180 54.5W180 58. OE180 38.7E200 63.4E180 50.2W180 58.OE170 63.4E230 67.3SE
38
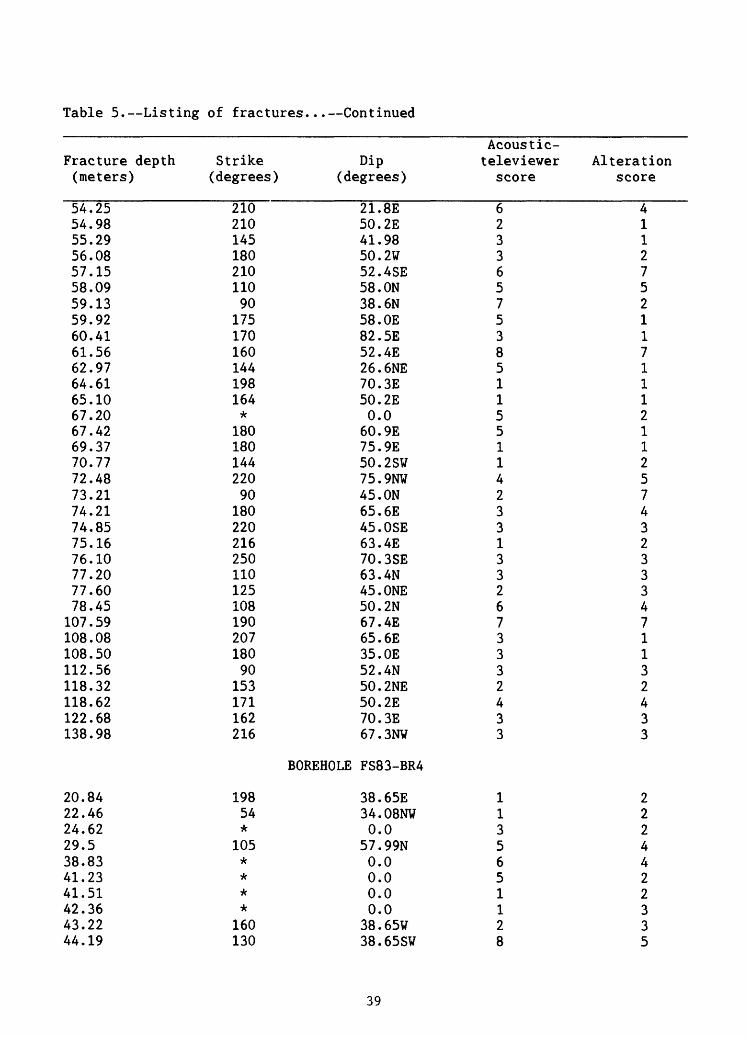
Table 5. Listing of fractures... Continued
Fracture depth (meters)
54.25 54.9855.2956.0857.1558.0959.1359.9260.4161.5662.9764.6165.1067.2067.4269.3770.7772.4873.2174.2174.8575.1676.1077.2077.6078.45107.59108.08108.50112.56118.32118.62122.68138.98
20.8422.4624.6229.538.8341.2341.5142.3643.2244.19
Strike (degrees)
210 21014518021011090
175170160144198164*
18018014422090
18022021625011012510819020718090
153171162216
19854*
105****
160130
Dip (degrees)
21. 8E 50. 2E41.9850. 2W52.4SE58. ON38. 6N58. OE82. 5E52. 4E26 . 6NE70. 3E50. 2E0.0
60. 9E75. 9E50.2SW75.9NW45. ON65. 6E45.0SE63. 4E70.3SE63. 4N45. ONE50. 2N67. 4E65. 6E35. OE52. 4N50.2NE50. 2E70. 3E67.3NV
BOREHOLE FS83-BR4
38.65E34.08NW0.0
57.99N0.00.00.00.038.65W38.65SW
Acoustic- televiewer score
6 233657538511551142331332673332433
1135651128
Alteration score
4 112752117111211257432333471132433
2224422335
39
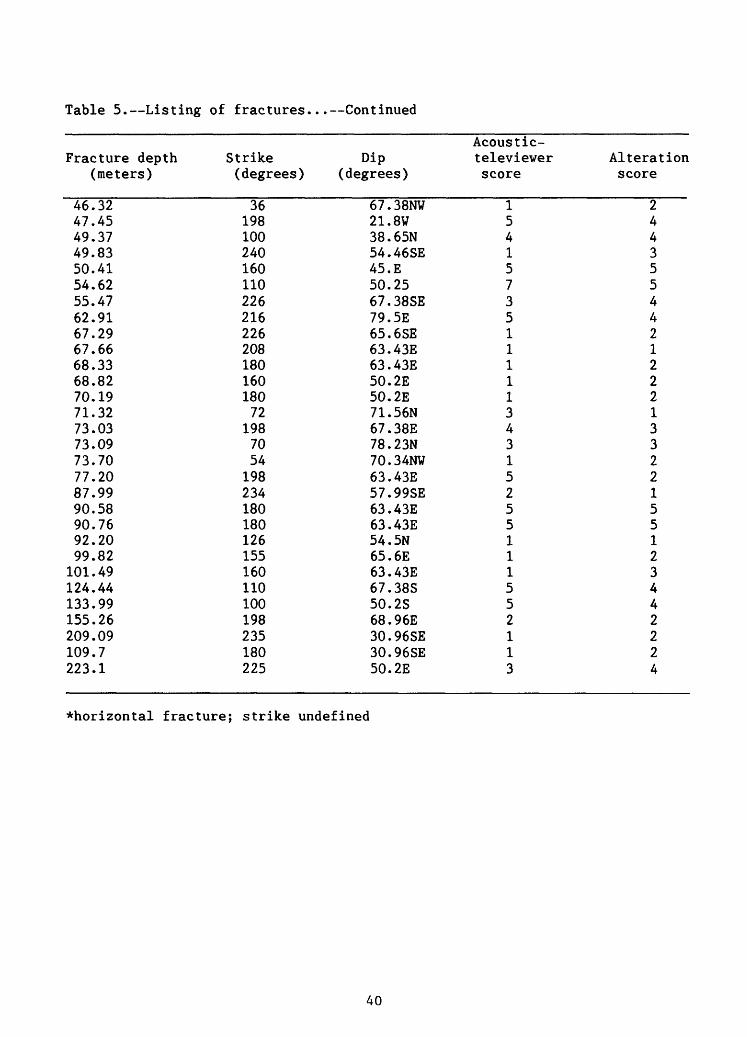
Table 5. Listing of fractures... Continued
Fracture depth (meters)
46.32 47.4549.3749.8350.4154.6255.4762.9167.2967.6668.3368.8270.1971.3273.0373.0973.7077.2087.9990.5890.7692.2099.82101.49124.44133.99155.26209.09109.7223.1
Strike (degrees)
36 19810024016011022621622620818016018072
1987054
198234180180126155160110100198235180225
Dip (degrees)
67.38NW 21. 8W38.65N54.46SE45. E50.2567.38SE79. 5E65.6SE63.43E63.43E50. 2E50. 2E71.56N67.38E78.23N70.34NW63.43E57.99SE63.43E63.43E54. 5N65. 6E63.43E67.38S50. 2S68.96E30.96SE30.96SE50. 2E
Acoustic- televiewer score
1 54157351111134315255111552113
Alteration score
2 44355442122213322155123442224
*horizontal fracture; strike undefined
40
FS79-BRFS87-BR
250 -FS83 BR4
Figure 22. Projection of fractures identified on acoustic-televiewer logs for boreholes FS79-BR, FS87-BR, FS83-BR4, CO-BR, and PV-BR on east-west planes intersecting each borehole. Apparent fracture dips are not corrected for vertical exaggeration.
41
(A)
rcEH
TUBE-WAVE AMPLITUDETELEVIEWER
LOG AFW LOG
ATTENUATION = 80 PERCENT
-L0.5
NORMALIZED AMPLITUDE1.0 500 1000
TIME. IN MICROSECONDS1500
Q(B)
100
80 PERCENT ATTENUATION = 0.38 MILLIMETER APERTURE
_L0 0.2 0.4 0.6 0.8 1.0
EQUIVALENT SINGLE FRACTURE APERATURE, IN MILLIMETERS
Figure 23. Diagram showing: A, Tube-wave attenuation in borehole FS83-BR4,and B, Calibration of tube-wave energy attenuation in effective fracture aperture using the method of Algan and Toksoz (1986).
42
FS79-BR FS87-BR FS83-BR4
0.0
50
UJo <LJL (T Z) CO
§100
gUJ CDCOccUJ
k 150
IQ. UJ Q
200
250
0.5TRANSMISSIVITY, IN CENTIMETERS SQUARED PER SECOND
1.0 1.5 0.0 0.5 1.0 1.5 0.0 0.5 1.0 1.5 2.0I
]
I
Figure 24. Diagram showing transmissivity in 5-meter intervals in boreholes FS79-BR, FS87-BR, and FS83-BR4 determined from acoustic tube-wave attenuation.
43
data, the estimated transmissivity distribution given in figure 24 is assumed to be the best representation of fracture transmissivity within a few meters of each borehole. Previous results from the FS83-BR boreholes indicate that this distribution may not be closely related to the transmissivity throughout the much larger volume of rock between the three boreholes in which the measurements were made (Paillet and others, 1987b).
Heat-Pulse Flowmeter Measurements
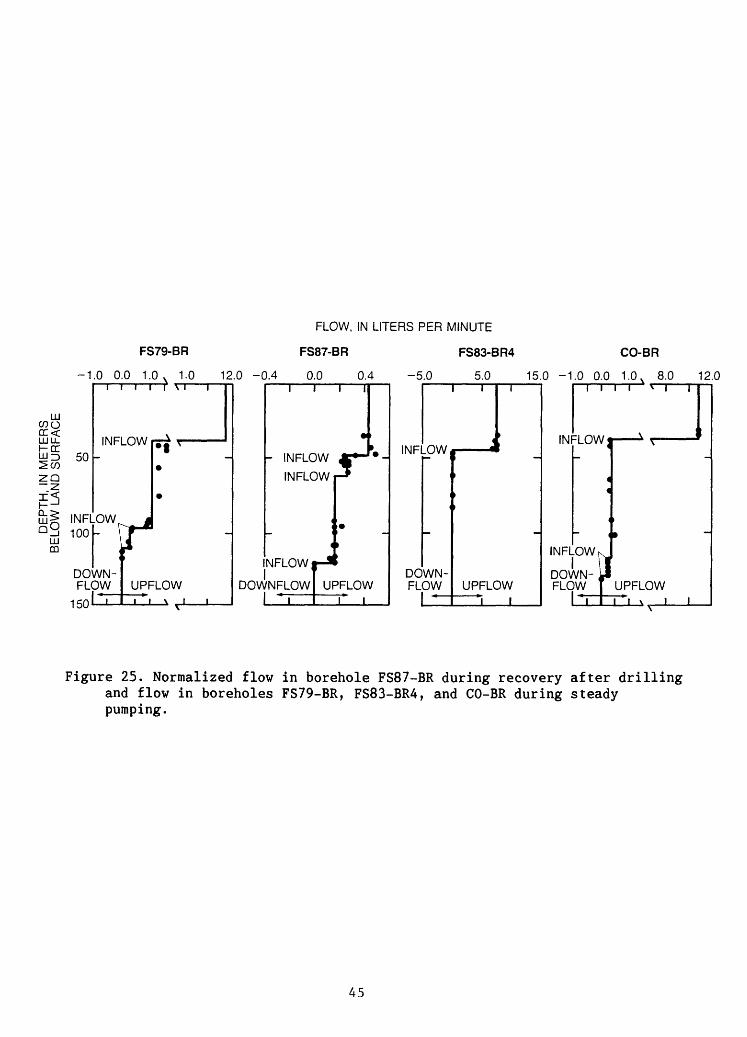
Water-level measurements made during and after drilling indicated that boreholes FS79-BR and CO-BR recovered very rapidly and that the dewatering of borehole FS87-BR during drilling had no measurable effect on the water levels in boreholes FS79-BR or FS83-BR4. Borehole FS87-BR recovered much more slowly than the other boreholes. Flowmeter measurements were made in this borehole during the recovery period. The flowmeter measurements in boreholes FS83-BR4 and CO-BR during pumping at a constant rate, and in borehole FS87-BR during recovery are shown in figure 25. Flowmeter in borehole FS87-BR measurements have been normalized to those flow rates that would have been measured had the borehole recovered at a uniform rate rather than at the measured exponentially declining rate. The flowmeter measurements indicate that inflow to borehole FS87-BR occurred at the two major fractures indicated by the ATV log at depths of about 45 and 60 m and at a much less conspicuous fracture near a depth of 120 m. Although measurements could not be made above the water level in the recovering borehole, the approximate correlation between total upflow above a depth in 45 m and the measured rise in water level in the casing indicates that no additional inflow occurred above that depth. Almost all inflow to the other three boreholes occurred at one or more steeply dipping fracture near 35 m (borehole CO-BR), 38 m (borehole FS73-BR) and 44 m (borehole FS83-BR4) in depth. Previous pumping tests indicated that all inflow to borehole PV-BR occurred at 186 m in depth. Estimated ground-water production for each of the boreholes indicated in figure IB are shown in figure 1C. Estimated production rates vary from less than 5 L/min (boreholes FS87-BR and PV-BR) to more than 20 L/min (boreholes FS79-BR, FS83-BR4, and CO-BR).
SUMMARY
The ongoing study of water flow in fractured crystalline rocks in the Mirror Lake watershed was expanded to include a series of nine boreholes along a 2-km profile that is approximately perpendicular to topographic contours on the bedrock surface and to the strike of predominantly eastward and westward dipping fractures. The boreholes were drilled to determine the distribution of fracture permeability in the Mirror Lake watershed and to characterize the interaction between ground-water flow in fractured basement and ground-water flow in surficial sediments. The profile includes a network of four boreholes forming a square 10 m on a side. In addition, two boreholes are spaced at about 100-m intervals to the northeast, and three boreholes are spaced at about 500-m intervals to the southeast. As a result, the entire profile includes a series of borehole arrays at separations of 10, 100, and 500 m. The series of nine boreholes consists of six previously drilled boreholes, one deepened borehole, and two new boreholes.
44
FLOW, IN LITERS PER MINUTE
FS79-BR FS87-BR FS83-BR4 CO-BR
-1.0 0.0 1.0 v 1.0 12.0 -0.4 0.0 0.4 -5.0 5.0 15.0 -1.0 0.0 1.0, 8.0 12.0
UJCOQ GC< LULLhcc
CD
50
INFL 100
DO FL(
i i i i
INFLOW
.OW
iMM- DW UPF
i \ i i
v 1 '
'LOWDOV
I i
- INFLOW
INFLOW
NFLOWi
INFLOW
(
(
<
i I
r
UPFLOW
INF
DO FL
PW (
WN- OW
i
4A
i
ii
UPFLOWi I
INI
INFl
DOV FLC
i i
:LOW
OWK
VN- ,r )W
i
i i * i i
\
»
UPFLOW1 "l V 1 1
Figure 25. Normalized flow in borehole FS87-BR during recovery after drilling and flow in boreholes FS79-BR, FS83-BR4, and CO-BR during steady pumping.
45
Acoustic televiewer (ATV) logs were used as the primary means for dentifying and characterizing fractures in the nine boreholes. ATV log data are used to determine fracture distribution with depth in each borehole. However, ATV and conventional geophysical logs indicate that a few especially large fractures probably contribute almost all of the transmissivity of the fracture flow system. Although fracture distributions in the boreholes seem irregular and vary greatly among the individual boreholes, graphical representations of fracture geometry as determined from ATV log interpretation indicate that intersections among steeply dipping fractures could provide flow paths within the rock volumes separating the boreholes along the study profile. The ATV log data can provide insight on the correspondence between anomalies on conventional geophysical logs and the frequency and size of fractures. The amplitude and width of the anomalies were used to construct a qualitative estimate of the extent of alteration adjacent to fractures, which might be indicative of ground-water circulation. The fracture data and characterization of fracture permeability provided in this report provide a qualitative and semi-quantitative illustration of the horizontal and vertical distribution of fracture permeability in basement rocks underlying the Mirror Lake watershed.
The tube-wave amplitude attenuation log constructed from acoustic- waveform log data was useful in making semi-quantitative estimates of fracture permeability at Mirror Lake. Previous interpretation of fracture permeability in the FS-BR boreholes yielded results that agreed with other independent estimates of fracture permeability when the effects of fracture interconnection and lateral variability of fracture aperture were taken into account. Profiles of fracture permeability in boreholes FS79-BR, FS87-BR, FS83-BR4, and PV-BR generated from analysis of tube-wave attenuation were consistent with other estimates based on assigning fracture size scores to acoustic-televiewer logs and other conventional geophysical logs. These results indicate that the tube-wave amplitude attenuation method provides a consistent means for weighting the relative permeability of individual fractures or groups of fractures intersecting the borehole.
Flowmeter measurements were made in borehole FS87-BR during water level recovery after drilling, and during steady pumping in boreholes FS79-BR, FS83-BR4, CO-BR, and PV-BR. Ground-water production from these boreholes was estimated to vary from less than 5 to nearly 50 L/min on the basis of these measurements. The three boreholes for which ground-water production was estimated to be greater than 20 L/min were boreholes FS79-BR, FS83-BR4, and CO-BR. In all three of these boreholes, ground- water inflow during pumping was associated with isolated, steeply dipping fractures identified on the televiewer log in the depth interval from 35 to 45 m below ground level.
46
REFERENCES CITED
Algan, U., and Toksoz, M.N., 1986, Depth of fluid penetration into a porous permeable formation due to a sinusoidal pressure source in a borehole: The Log Analyst, v. 27, no. 6, p. 30-37.
Billings, M.P., Fowler-Billings, Katherine,Chapman, C.A., Chapman, R.W., and Goldthwait, R.P., 1979, The geology of the Mt. Washington Quadrangle, New Hampshire: Concord, New Hampshire Department of Resources and Economic Development, 44 p.
Biot, M.A., 1952, Propagation of elastic waves in a cylindrical bore containing a fluid: Journal of Applied Physics, v. 23, no. 9, p. 997-1009.
Cheng, C.H., and Toksoz, M.N., 1981, Elastic wave propagation in afluid-filled borehole and synthetic acoustic logs: Geophysics, v. 46, no. 7, p. 1042-1053.
Doveton, John, 1986, Log analysis of subsurface geology: New York, Wiley- Interscience, 273 p.
Hardin, E.L., Cheng, C.H., Paillet, F.L., and Mendelson, J.D., 1987,Fracture characterization by means of attenuation and generation of tube waves in fractured crystalline rock at Mirror Lake, New Hampshire: Journal of Geophysical Research, B, v. 92, no. 8, p. 7989-8006.
Hearst, J.R. and Nelson, P.H., 1985, Well logging for physical properties: New York, McGraw-Hill, 571 p.
Hess, A.E., 1982, A heat-pulse flowmeter for measuring low velocities in boreholes: U.S. Geological Survey Open-File Report 82-699, 40 p.
1986, Identifying hydraulically-conductive fractures with alow-velocity borehole flowmeter: Canadian Geotechnical Journal, v. 23, no. 1, p. 69-78.
Hsieh, P.A., Neuman, S.P., and Simpson, E.S., 1983, Pressure testing offractured rocks a methodology employing three-dimensional hole tests: Washington, D.C., U.S. Nuclear Regulatory Commission, NUREG/CR-3213, 176 p.
Keys, W.S., 1979, Borehole geophysics in igneous and metamorphic rocks: Society of Professional Well Log Analysts Annual Logging Symposium, 20th, Tulsa, Okla., 1979, Transactions, p. 001-26.
Keys, W.S., and MacCary, L.M., 1971, Application of borehole geophysics towater-resources investigations: U.S. Geological Survey Techniques ofWater-Resources Investigations, Book. 2, Chapter El, 126 p.
Likens, G.E., ed., 1985, An ecosystem approach to aquatic ecology - Mirror Lake and its environment: New York, Springer-Verlag, 444 p.
47
Long, J.C.S., Remer, J.S., Wilson, C.R., and Witherspoon, P.A., 1982, Porous media equivalents for networks of discontinuous fractures: Water Resources Research, v. 18, no. 3, p. 645-658.
Mathieu, Frederic, and Toksoz, M.N., 1984, Application of acoustic fullwaveform data to the estimation of reservoir permeability: Society of Exploration Geophysicists International Meeting, 54th, Atlanta, Ga., Proceedings, p. 9-12.
Paillet, F.L., 1983, Acoustic characterization of fracture permeability at Chalk River, Ontario: Canadian Geotechnical Journal, v. 20, no. 3, p. 468-476.
1985, Geophysical well log data for study of water flow in fractures in bedrock near Mirror Lake, West Thornton, New Hampshire: U.S. Geological Survey Open-File Report 85-340, 27 p.
Paillet, F.L. and Hess, A.E., 1986, Geophysical well log analysis offractured crystalline rocks at East Bull Lake, Ontario, Canada: U.S. Geological Survey Water Resources Investigations Report 86-4052, 37 p.
Paillet, F.L., Cheng, C.H., and Hsieh, Paul, 1987a, Experimentalverification of acoustic waveform and vertical seismic profile measurements of fracture permeability: Society of Professional Well Log Analysts Annual Logging Symposium, 28th, London, 1987, Proceedings, p. PP1-21.
Paillet, F.L., Hess, A.E., Cheng, C.H., and Hardin, E.L., 1987b,Characterization of fracture permeability with high-resolution vertical flow measurements during pumping: Ground Water, v. 25, no. 1, p. 28-40.
Paillet, F.L., Keys, W.S., and Hess, A.E., 1985, Effects of lithology on acoustic televiewer log quality and fracture interpretation: Society of Professional Well Log Analysts Annual logging Symposium, 26th, Dallas,Tex., 1985, Transactions, P. JJJl-31.
Paillet, F.L., and White, J.E., 1982, Acoustic modes of propagation in the borehole and their relationship to rock properties: Geophysics, v. 47, no. 8, p. 1215-1228.
Pascal, Henri, 1986, Pressure wave propagation in a fluid flowing through a porous medium and problems related to interpretation of Stoneley's wave attenuation in acoustic well logging: International Journal of Engineering Science, v. 24, no. 9, p. 1553-1570.
Rosenbaum, J.H., 1974, Synthetic seismograms Logging in porous formations: Geophysics, v. 39, no. 1, p. 14-32.
Winter, T.C., 1984, Geohydrologic setting of Mirror Lake, West Thornton, New Hampshire: U.S. Geological Survey Water-Resources Investigations Report 84-4266, 61 p.
48
Witherspoon, P.A., Tsang, Y.W., Long, J.C.S., and Jahandar, Norrishad, 1981, New approaches to problems of fluid flow in fractured rock masses: Symposium on Rock Mechanics, 22d, Cambridge, Mass., 1981, Proceedings, p. 3-22.
Zemanek, Joseph, Glenn, E., Norton, L.J., and Caldwell, R.L., 1970, Formation evaluation by inspection with the borehole televiewer: Geophysics, v. 35, no. 2, p. 254-269.
Ziegler, T.W., 1976, Determination of rock mass permeability: Vicksburg, Miss., U.S. Army Engineer Waterways Experiment Station, Technical Report S-76-2.
49
*U.S. GOVERNMENT PRINTING OFFICE: 1989-0-673-196/00021