Embed Size (px)
Citation preview


UNIVERSITY OF GOTHENBURG Department of Earth Sciences Geovetarcentrum/Earth Science Centre
ISSN 1400-3821 B609 Bachelor of Science thesis Göteborg 2011
Mailing address Address Telephone Telefax Geovetarcentrum Geovetarcentrum Geovetarcentrum 031-786 19 56 031-786 19 86 Göteborg University S 405 30 Göteborg Guldhedsgatan 5A S-405 30 Göteborg SWEDEN
Fractionation of trace elements in the
Rävsön Ulvö gabbro, central Sweden
Mattias Ek

Abstracts Abstract The concentrations of strontium, vanadium, cerium and barium are analysed in whole
rock samples and plagioclase crystals in the exposed ~90m thick middle and upper
zone of the Rävsön Ulvö gabbro. The plagioclase composition was used to calculate
a supernatant liquid composition through the stratigraphy. Strontium shows a ~50%
decrease in the supernatant liquid concentration towards the sandwich horizon and,
vanadium decreases ~80% towards the sandwich horizon. The supernatant liquid
concentration of cerium remained relatively stable throughout crystallisation while
barium was enriched by ~80%. The calculated liquid composition is used to evaluate
several models for fractionation crystallisation. A modified version of the diffusion-
driven fractionation model could potentially explain the observed fractionation. A
thinner crystallisation zone increases the gradient of incompatible elements in the
crystallisation zone. This allows for diffusive exchange between the magma chamber
and the crystallisation zone for barium, which has higher tracer diffusion rate than
cerium due to smaller ionic charge. However, further studies are needed to assess this
modification.
Sammanfattning Koncentrationen av strontium, vanadin, cerium och barium bestäms i hela
bergartsprover och i plagioklaskristaller i en ~90 meter tjock stratigrafi genom Rävsön
Ulvö gabbron. Sammansättningen av plagioklas används för att räkna ut en primitiv
magmasammansättning genom stratigrafin. Strontiumhalten i magman minskade
med ~50% mot sandwich horisonten, och vanadin visar en ~80% minskning under
samma sträcka. Ceriumhalten är stabil igenom hela stratigrafin medan halten av
barium ökar med ~80% mot sandwich horizonten. Den uträknade
magmasammansättningen används för att evaluera olika modeller för
fraktioneringskristallisation och en modifierad version av den diffusionsdrivna
fraktionerings modellen kan potentiellt resultera i den observerade fraktioneringen.
Modifikationen utgörs av att man förkortar kristallisationszonen och därmed ökar
gradienten för de inkompatibla ämnerna. Denna modifkation tillåter en ökning av
barium i magmakammaren genom diffusion, men inte av cerium. Ytterligare studier
behövs för att fastställa om denna modifikation ensamt kan skapa den observerade
fraktioneringen.
Keywords Ulvö Gabbro Complex, partitioning coefficients, laser ablation, plagioclase, layered
intrusions, mafic sills, diffusion-driven fractionation.

Index Abstracts ................................................................................................................................ 1
Abstract ................................................................................................................................... 1
Sammanfattning .................................................................................................................... 1
Keywords ................................................................................................................................. 1
Index ...................................................................................................................................... 2
Introduction ........................................................................................................................... 1
Geological Setting ................................................................................................................. 1
Previous Work .......................................................................................................................... 1
Partition Coefficients .............................................................................................................. 2
Fractionation Models ............................................................................................................. 2
Redistribution of Phenocrysts ............................................................................................ 2
Compositional Convection ............................................................................................... 2
Compaction ........................................................................................................................ 2
Diffusion Driven Fractionation ........................................................................................... 3
Methods ................................................................................................................................. 4
Results .................................................................................................................................... 5
Whole Rock Composition...................................................................................................... 5
Plagioclase Composition ...................................................................................................... 7
Supernatant Liquid Composition ......................................................................................... 8
Discussion .............................................................................................................................. 8
Selection of Primitive Plagioclase ........................................................................................ 9
Evaluation of Fractionation Models ................................................................................... 10
Partition Coefficients ............................................................................................................ 11
Conclusion ........................................................................................................................... 11
Acknowledgements ........................................................................................................... 12
References ........................................................................................................................... 12
Appendix ............................................................................................................................. 13
~ 1 ~
Introduction The aim of this study is twofold; firstly the
fractionation of compatible and
incompatible elements in whole rock
samples and plagioclase crystals in the
Rävsön Ulvö gabbro will be described.
Secondly the study will evaluate several
fractionation models that could
potentially explain the fractionation seen
in the Rävsön Ulvö Gabbro.
Focus will be on the stratigraphic
variations of compatible and
incompatible elements in whole rock,
plagioclase crystals and a calculated
liquid composition. The liquid composition
is calculated from the most primitive
plagioclase crystals using partition
coefficients to give an estimate of the
supernatant liquid composition from
which the plagioclase crystallised.
Strontium and vanadium will represent the
compatible elements, and cerium and
barium represent the incompatible
elements in this study.
Redistribution of phenocrysts model,
compositional convection model and the
compaction model are the most popular
models currently used to describe the
fractionation seen in many mafic sills, and
together with the diffusion-driven
fractionation model they are briefly
described and evaluated for their
potential in explaining the fractionation
observed in the Rävsön Ulvö Gabbro.
Geological Setting The Rävsön Ulvö gabbro (RUG) is a part of
the Ulvö gabbro complex (Fig. 1), a series
of saucer shaped alkali gabbroic sills that
intruded the Nordingrå formation at ~1.26
Ga (Gorbatschev et al., 1979; Larson,
1980, Hogmalm et al. 2006). The UGC is
included in the larger Central
Scandinavian Dolerite Group (CSDG)
believed to be related to the break-up of
Baltica and Laurentia (Gorbatschev et al.
1979; Hogmalm et al. 2006). Emplacement
depth is estimated to have been ~3 km,
and the sills are typically ~300 m thick
(Larson, 1980; Lundqvist et al. 1990).
The RUG is exposed on the eastern
shoreline of the Rävsön peninsula in a ~90
m thick sequence of layered igneous
rocks. The exposed stratigraphy is thought
to represent the upper two thirds of the
total thickness (Larson, 1980). The
stratigraphy dips beneath the Nordingrå
anorthosite at the upper contact.
Previous Work The UGC has been the subject to
numerous petrological studies during the
last 160 years, however only a few of
these studies have focused on the
stratigraphic variations within the Ulvö
gabbro complex (Larson, 1973; Lundqvist
& Samuelsson, 1973; Larson, 1980; Larson
et al., 2008; Hogmalm et al., Submitted a;
Hogmalm et al., Submitted b;). The
diffusion-driven fractionation model used
in this article, was developed on the Norra
Ulvön gabbro located in the Ulvö gabbro
complex (Hogmalm et al., Submitted a).
The Ulvö gabbro complex is also the type
locality of the mineral ulvöspinel, a
Figure 1. Location of the Rävsön Ulvö Gabbro.
Modified from Claeson et al. (2007).

~ 2 ~
titanium-iron oxide (Morgensen, 1946). The
sampled stratigraphy used in this study
was originally collected as part of a
different study (Larson, 1980).
Partition Coefficients Partition coefficients are often used to
calculate the liquid from which a certain
mineral crystallised, and are defined as
the equilibrium concentration ratio of an
element in a mineral to that in a liquid (Eq.
1). Plagioclase is the most common
mineral used in petrology as it occurs in all
mafic sills and is usually the first mineral to
crystallise.
Equation 1.
The partition coefficients for the
plagioclase-melt system have been
determined to be variable depending of
the anorthite concentration (Bindeman et
al., 1998), as seen in Eq. 2 for strontium,
cerium and barium whereas vanadium
uses the simplified formula seen in Eq. 3. R
is the gas constant, T is the temperature
(Kelvin) and An is the anorthite
concentration.
Equation 2. Equation 3.
The partition coefficients for
plagioclase are empirically determined
and are thus subject to a large
uncertainty. To better appreciate the
uncertainty, partition coefficients from
two different articles are used in this study
(Table 1).
Fractionation Models The following section will briefly describe
the most popular fractionation models in
use today, in addition to the newly
developed diffusion-driven fractionation
model.
Redistribution of Phenocrysts
The redistribution of phenocrysts model
(Marsh, 1980; Marsh, 1989; Marsh 1996)
states that all changes in composition
within a sill are the result of the
introduction of a phenocryst-rich magma
from a different mush column, that then
settles onto the floor of the intrusion
through crystal settling (Fig. 2a). The
magma chamber is stagnant and goes
through no convection meaning that the
intrusion is incapable of fractionation
without the introduction of phenocrysts.
This results in a stratigraphy that has a step
like change in mineral composition rather
than a continuous change (Fig. 2a).
Compositional Convection
In the compositional convection model
(Jaupart & Tait, 1995; Tait & Jaupart, 1996;
Latypov, 2003) the magma chamber is
constantly convecting, due to thermal
and chemical gradients that occur in the
magma chamber. This results in a
crystallisation front that is continuously
replenished by more primitive magma,
resulting in a depletion of compatible
elements, while the incompatible
elements will become enriched in the
magma as crystallisation progresses (Fig.
2b).
Compaction
The compaction model (Meurer &
Boudreau, 1998a; Meurer & Boudreau,
Table 1. The X and Y values used with Eq.1 and Eq.2 to calculate partition coefficients for
strontium (Sr), vanadium (V), cerium (Ce) and Ba (Ba) for Bédard (2006) and Bindeman et
al. (1998). Examples of calculated partition coefficients are included for An60 and An40 for
each element.
Bédard (2006)
Bindeman et al. (1998)
X Y An60 An40
X Y An60 An40
Sr -20,71 23,85 2,69 4,79
-30,4 28,5 2,42 5,16
V 0,09 0,08 0,034 0,052
Ce -33,82 -3,68 0,123 0,175
-17,5 -12,4 0,135 0,141
Ba -35,20 10,14 0,380 0,668
-55 19,1 0,292 0,738

~ 3 ~
1998b) predicts that the magma chamber
crystallises as a large mush column, with
cumulus mineral crystals containing the
same composition throughout the
stratigraphy. The cryptic layering is formed
as compaction with related extension
occurs within the mush column. The
extended portion of the mush column is
infiltrated by more evolved magma which
recrystallises the existing crystals in
addition to growing new ones, resulting in
compatible elements becoming depleted
and incompatible elements becoming
enriched (Fig. 3a). However the
fractionation is not as extreme as seen in
the Compositional convection model due
to the fact that the more evolved liquid is
diluted into a less evolved partially
crystallized mush, thus complete
fractionation is very difficult to achieve.
Diffusion Driven Fractionation
The diffusion-driven fractionation model
(Hogmalm et al. Submitted a), like the
compositional convection model, invokes
a convecting magma chamber.
However, there is no direct interaction
between the convecting magma
chamber and the crystallisation zone as
seen in the compositional convection
model. The movement of elements
between the magma chamber and the
crystallisation zone is instead controlled by
diffusion. The chemical gradient
developed by the depletion of
compatible elements in the crystallisation
zone results in a diffusive flux from the
overlying magma chamber. There is not a
significant increase of incompatible
elements within the crystallisation zone
until the distance between the enriched
Figure 2. The expected evolution of incompatible (dash-dash line) and compatible (dash-dot line)
in the supernatant liquid, with increasing concentration to the right of the figures. The grey scale
represents the chemical variation within the mush column. a) The redistribution of phenocrysts
model. The hollow arrow represents input of phenocryst rich magma from a different mush column.
The thin solid arrows represent the settling of phenocrysts onto the floor of the chamber. b) The
compositional convection model. The large arrows demonstrate the convection in the magma
chamber, which continuously replenishes the crystallisation front.

~ 4 ~
liquid and the convecting magma
chamber is too large for effective
diffusion. This results in a depletion of
compatible elements while the
incompatible elements remain
unaffected as crystallisation progresses
(Fig. 3b).
Methods The whole rock major element analyses
were determined using X-ray fluorescence
by Larson (1980).
The trace elements compositions of
whole rock samples were determined
using inductively coupled plasma mass
spectrometry (ICP-MS) on an Agilent 7500,
at the University of Gothenburg. The
samples were prepared using the
following procedures: approximately 0.1 g
of rock powder was dissolved in one part
HF and four parts HNO3, and left to dry on
a hotplate. The sample was then re-
dissolved in HNO3, and 15 ppb indium and
15 ppb rhenium was added as an internal
standard. This resulted in a dilution factor
of approximately 3800. Four multi-element
standards (Merck and Agilent) each at
10, 0.1 and 0.01 ppb concentration levels
were used for calibration, while drift was
monitored by analysing the JB-1 rock
standard every fifth sample. JB-1 was
analysed as an unknown sample to
determine accuracy, which is 10% for all
elements used in this study.
The major element composition of
plagioclase was determined using an
Oxford Instruments energy dispersive
spectrometer detector connected to a
Hitatchi S-3400N scanning electron
Figure 3. The expected evolution of incompatible (dash-dash line) and compatible (dash-dot line)
in the supernatant liquid, with increasing concentration to the right of the figures. The grey scale
represents the chemical variation within the mush column. a) The compaction model. Showing the
migration of magma (thin black arrows) due to compaction (thick white arrows), to areas
affected by of extension (thick black arrows) in the mush column. b) The diffusion-driven
fractionation model where compatible elements (thin black arrows) diffuse from the convecting
magma chamber (big arrows) into the crystallisation zone.

~ 5 ~
microscope, using the Inca platform. The
analyses were carried out at the University
of Gothenburg.
The trace element composition of
plagioclase was determined by laser
ablation (LA) ICP-MS on thin sections
(~100 µm in thickness) of each sample,
using a Cetac ASX-200 Nd-YAG UV laser
for sampling and an Agilent 7500 ICP-MS
for analysis. A spot size of 200µm, energy
at 7,5mJ, and a repetition rate of 4Hz
were used for the analyses. NIST 612 was
used as a standard and the raw data was
reduced using an in-house program. The
precision is estimated to be better than
10% for all elements analysed in this study.
Results The Rävsön stratigraphy is divided into two
units, the upper zone and the middle zone
(Fig. 4a). A lower zone is most likely
present underneath the middle zone
however it is not exposed on the Rävsön
peninsula.
The upper zone consists of plagioclase,
oxides and olivine as cumulus phases and
clinopyroxene occurs as a poikilitic post
cumulus phase (Fig. 4b). The middle zone
is divided into the following groups from
the floor upwards; the rhythmically
layered zone a and the rhythmically
layered zone b. The contact between the
upper zone and middle zone is called the
sandwich horizon, and is defined as the
zone where the upper and lower
solidification fronts meet, and contains the
lowest anorthite concentrations in
plagioclase and highest concentration of
incompatible elements in whole rock. The
rhythmically layered zone a contains rocks
with cumulus plagioclase, oxides and
olivine, and interstitial poikilitic
clinopyroxene, while the rhythmically
layered zone b contains rocks where
plagioclase, oxides, clinopyroxene and
olivine occur as cumulus phases.
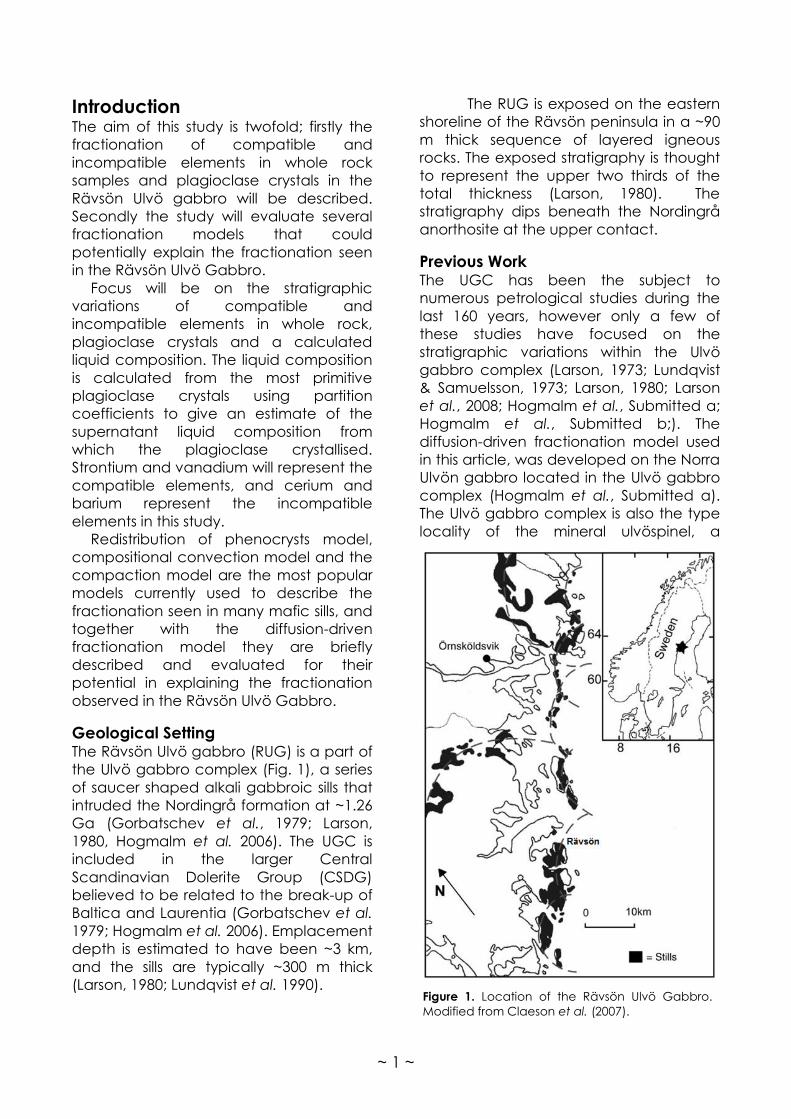
Whole Rock Composition The concentration of phosphorus (Fig. 5a)
in the upper zone remains stable at ~900
ppm. In the middle zone the
concentration remains stable at ~1000
ppm between the lower sample and 50
m, increasing to ~4000 ppm at the
sandwich horizon. The concentration of
phosphorus in whole rock corresponds
well with the modal abundance of
apatite in the stratigraphy.
The strontium concentrations (Fig. 4b)
decrease from ~500 ppm at the lower
sample to ~375 ppm at 20 m, then
increases to ~410 ppm at the sample
below the sandwich horizon. The
sandwich horizon sample has a
concentration of ~310 ppm. In the upper
zone the concentration decreases from
~600 ppm at the upper sample to ~450
ppm above the sandwich horizon.
Figure 4. a) The stratigraphic position of the upper
zone (UZ), sandwich horizon (SH), middle zone (MZ),
rhythmically layered zone a (RZa) and b (RZb). b)
Shows where plagioclase (Pl), clinopyroxene (Cpx),
olivine (Ol) and oxides (Ox) occur in cumulus (solid
line) or as an interstitial (dash-dash line) phase. c)
The variation of anorthite (An%) in the RUG
stratigraphy.
~ 6 ~
Figure 5. The Whole rock concentrations plotted
against height in the RUG for a) phosphorus (P),
b) strontium (Sr), c) vanadium (V), d) cerium
(Ce), and e) barium (Ba).
The concentration of vanadium (Fig 5c)
increases from ~350 ppm at the lower
sample to ~550 ppm at 20 m, then
decreases to ~100 ppm at the sandwich
horizon. In the upper zone an increase
from ~250 ppm at the upper sample to
~400 ppm above the sandwich horizon is
observed.
The cerium concentration (Fig. 5d)
in the middle zone increase from ~35 ppm
at the lower sample to ~80 ppm just
below the sandwich horizon, the
sandwich horizon has a cerium
concentration of ~70 ppm. In the upper

~ 7 ~
zone an increase from ~30 ppm at the
upper sample to ~50 ppm above the
sandwich horizon is observed.
The barium concentrations (Fig. 5e) in
the upper zone increase from ~500 ppm
at the upper sample to ~700 ppm above
to sandwich horizon. In the middle zone
an increase from ~500 ppm at the lower
sample to ~850 ppm at the sample below
the sandwich horizon. The sandwich
horizon has a concentration of ~700 ppm.
Plagioclase Composition The most ‘primitive’ plagioclase
analyses were selected (see appendix) for
each sample using the following criteria:
1) the analysed spot is located in a
plagioclase core, defined by the crystal
displaying twinning. 2) The core shows no
signs of recrystallisation in either the
polarising microscope or in backscatter
images from the SEM. 3) Has the highest
concentration of calcium and strontium
and the lowest concentration of barium in
the data acquired from the laser ablation
ICP-MS. Analyses with abnormally high
concentrations of rare earth elements is
usually associated with inclusions of trace
phases in the analysed area. Reasons for
selecting the most primitive plagioclase
analyses will be discussed below.
Figure 6. The concentration plotted against stratigraphic height in the RUG for all plagioclase
analyses (diamonds) and the earliest crystallised plagioclase (circles) for a) strontium (Sr), b)
vanadium (V), c) cerium (Ce), and d) barium (Ba).
~ 8 ~
The anorthite concentration (An%) (Fig.
4c) of plagioclase in the middle zone
decreases from ~58 An% at the lower
sample to ~39 An% at the sandwich
horizon. In the upper zone the An%
decreases from ~58% to ~48% above the
sandwich horizon.
The strontium concentration (Fig. 6a) of
the middle zone initially decreases from
~1000 ppm at the lower sample to ~800
ppm at 10 m, increasing to ~1000 ppm at
the sandwich horizon. In the upper zone
the concentration decreases from ~900
ppm at the upper sample to ~800 ppm
above the sandwich horizon.
The vanadium concentration (Fig. 6b)
in the middle zone remains stable at ~3.25
ppm between the lower sample and 10
m, then decreasing to ~0.6 ppm at the
sandwich horizon. In the upper sample
the concentration decreases from ~2.5
ppm at the upper sample to ~2 ppm
above the sandwich horizon.
The cerium concentration (Fig. 6c)
in the middle zone decreases from ~2.2
ppm at the lower sample to ~1.9 ppm at
50 m where it increases to ~2.75 ppm at
the sandwich horizon. In the upper zone
the concentration remains stable at ~2.4
ppm.
The barium concentration (Fig. 6d) in
the upper zone increases from ~200 ppm
at The upper sample to ~500 ppm above
the sandwich horizon. In the middle zone
the concentration increases from ~400
ppm at the lower sample to ~1100 ppm at
the sandwich horizon.
Supernatant Liquid Composition The supernatant liquid compositions are
calculated for the most primitive
plagioclase analyses using partition
coefficients from Bédard (2006) and
Bindeman et al. (1998), except for
vanadium where only the data from
Bédard (2006) is available. The
concentration of strontium (Fig. 7a) in the
upper zone decreases from ~490 ppm
(Bindeman) and ~410 ppm (Bédard) at
the upper sample to ~280 ppm
(Bindeman & Bédard) above the
sandwich horizon. In the middle zone
there is a decrease from ~390 ppm
(Bindeman) and ~350 ppm (Bédard) to
~210 ppm (Bindeman & Bédard) at the
sandwich horizon.
The vanadium concentrations (Fig. 7b)
in the middle zone remain stable at ~90
ppm (Bédard) between the lower sample
and 10m, and then decrease to ~10 ppm
(Bédard) at the sandwich horizon. In the
upper zone the concentration decreases
from ~90 ppm (Bédard) at the upper
sample to ~50 ppm (Bédard) above the
sandwich horizon.
The cerium concentrations (Fig. 7c)
decrease from ~19 ppm (Bédard) and
~17 ppm (Bindeman) at the lower sample
to ~13 ppm (Bédard) and ~15 ppm
(Bindeman) at 50 m. The cerium
concentrations then increase to ~17 ppm
(Bédard) and ~20 ppm (Bindeman) at the
sandwich horizon. In the upper zone the
concentrations decrease from ~22 ppm
(Bédard) and 18 ppm (Bindeman) at the
upper sample to ~16 ppm (Bédard) and
~16 ppm (Bindeman) above the
sandwich horizon.
The barium concentrations (Fig. 7d) in
the upper zone increase from ~600 ppm
(Bédard) and ~800 ppm (Bindeman) at
the upper sample to ~1050 ppm (Bédard)
and ~1150 ppm (Bindeman) above the
sandwich horizon. In the middle zone the
concentrations increase from ~900 ppm
(Bédard) and ~1100 ppm (Bindeman) at
the lower sample to ~1700 ppm (Bédard)
and ~1600 ppm (Bindeman) at the
sandwich horizon.
Discussion The discussion is divided into three parts;
the first part discusses the reasoning
behind selecting the most primitive
plagioclase analyses for calculation of the
liquid composition. The second part will
evaluate the different models presented
earlier based on the liquid composition
calculated from the plagioclase
composition. The final part discusses the

~ 9 ~
Figure 7. The calculated supernatant liquid concentration plotted against the height in the RUG.
Black Cricles represents concentrations calculated using partition coefficients by Bédard (2006)
and hollow diamonds use partition coefficients by Bindeman et al. (1998) for a) strontium (Sr), b)
vanadium (V), c) cerium (Ce), and d) barium (Ba).
use of partition coefficients to calculate
liquid composition.
Selection of Primitive Plagioclase An average of nine plagioclase crystals
were analysed for each sample within the
stratigraphy and the analyses show
considerable scatter (Fig. 3). Reasons for
this scatter can be attributed to several
factors: a few of the analyses were
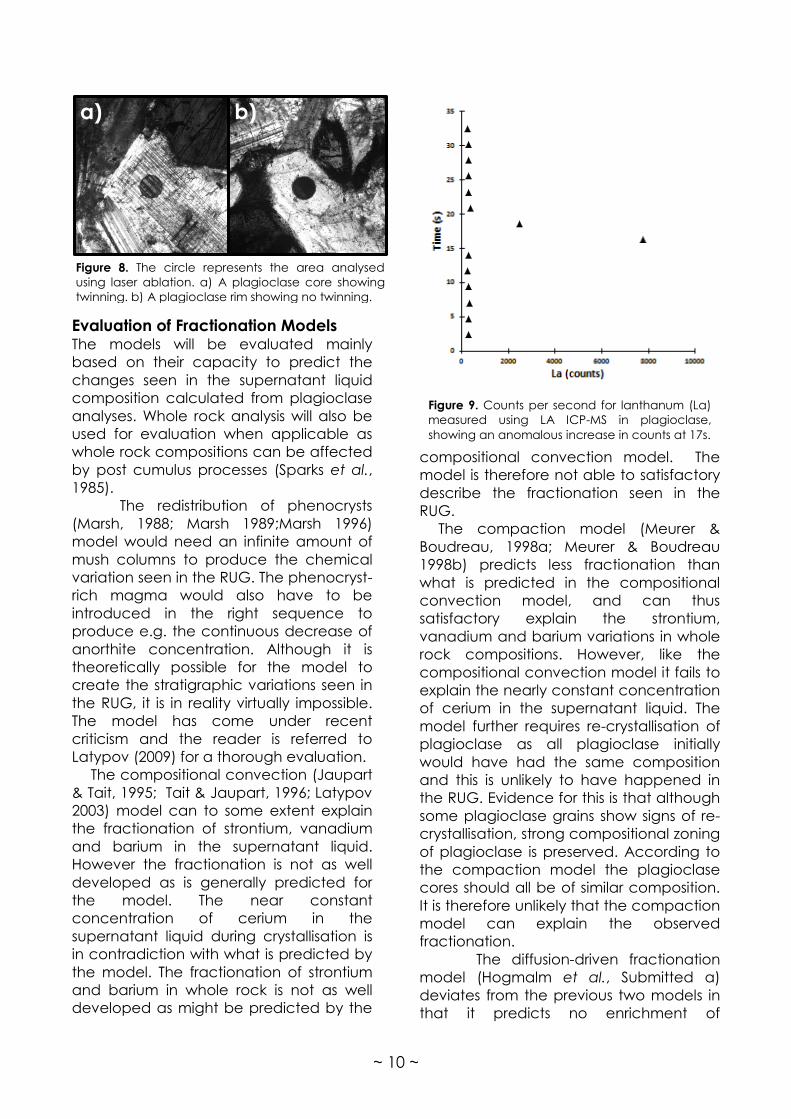
analysed on plagioclase rims (Fig. 8),
which would have crystallised from a
more evolved liquid thus having higher or
lower concentration of certain elements.
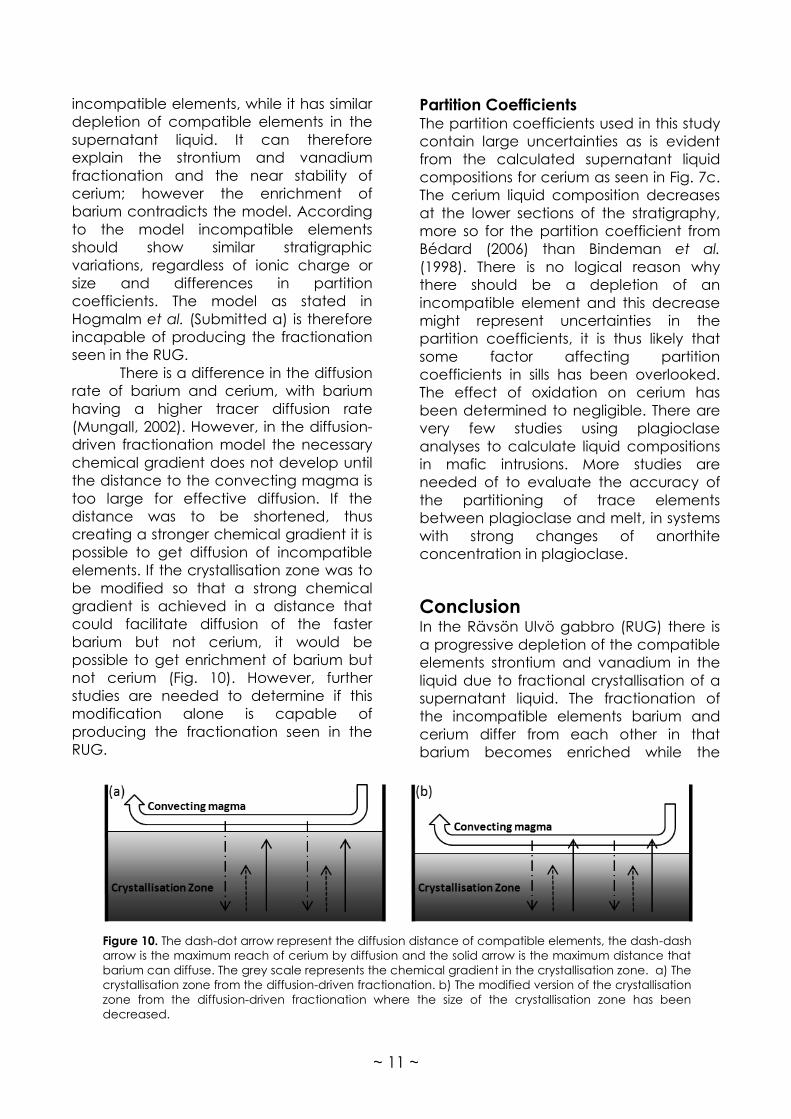
Small inclusions of other minerals in the
plagioclase crystals will generate
anomalous peaks in concentration during
LA ICP-MS analysis (Fig. 9), inclusion of e.g.
apatite increases the concentration of
the rare earth elements as their partition
coefficients for apatite is high (Watson &
Green, 1981). Several crystals show signs
of post cumulus re-crystallisation as can
be seen in SEM backscatter images and
polarising microscope analysis, which
would alter the original composition.
~ 10 ~
Evaluation of Fractionation Models The models will be evaluated mainly
based on their capacity to predict the
changes seen in the supernatant liquid
composition calculated from plagioclase
analyses. Whole rock analysis will also be
used for evaluation when applicable as
whole rock compositions can be affected
by post cumulus processes (Sparks et al.,
1985).
The redistribution of phenocrysts
(Marsh, 1988; Marsh 1989;Marsh 1996)
model would need an infinite amount of
mush columns to produce the chemical
variation seen in the RUG. The phenocryst-
rich magma would also have to be
introduced in the right sequence to
produce e.g. the continuous decrease of
anorthite concentration. Although it is
theoretically possible for the model to
create the stratigraphic variations seen in
the RUG, it is in reality virtually impossible.
The model has come under recent
criticism and the reader is referred to
Latypov (2009) for a thorough evaluation.
The compositional convection (Jaupart
& Tait, 1995; Tait & Jaupart, 1996; Latypov
2003) model can to some extent explain
the fractionation of strontium, vanadium
and barium in the supernatant liquid.
However the fractionation is not as well
developed as is generally predicted for
the model. The near constant
concentration of cerium in the
supernatant liquid during crystallisation is
in contradiction with what is predicted by
the model. The fractionation of strontium
and barium in whole rock is not as well
developed as might be predicted by the
compositional convection model. The
model is therefore not able to satisfactory
describe the fractionation seen in the
RUG.
The compaction model (Meurer &
Boudreau, 1998a; Meurer & Boudreau
1998b) predicts less fractionation than
what is predicted in the compositional
convection model, and can thus
satisfactory explain the strontium,
vanadium and barium variations in whole
rock compositions. However, like the
compositional convection model it fails to
explain the nearly constant concentration
of cerium in the supernatant liquid. The
model further requires re-crystallisation of
plagioclase as all plagioclase initially
would have had the same composition
and this is unlikely to have happened in
the RUG. Evidence for this is that although
some plagioclase grains show signs of re-
crystallisation, strong compositional zoning
of plagioclase is preserved. According to
the compaction model the plagioclase
cores should all be of similar composition.
It is therefore unlikely that the compaction
model can explain the observed
fractionation.
The diffusion-driven fractionation
model (Hogmalm et al., Submitted a)
deviates from the previous two models in
that it predicts no enrichment of
Figure 8. The circle represents the area analysed
using laser ablation. a) A plagioclase core showing
twinning. b) A plagioclase rim showing no twinning.
a) b)
Figure 9. Counts per second for lanthanum (La)
measured using LA ICP-MS in plagioclase,
showing an anomalous increase in counts at 17s.
~ 11 ~
incompatible elements, while it has similar
depletion of compatible elements in the
supernatant liquid. It can therefore
explain the strontium and vanadium
fractionation and the near stability of
cerium; however the enrichment of
barium contradicts the model. According
to the model incompatible elements
should show similar stratigraphic
variations, regardless of ionic charge or
size and differences in partition
coefficients. The model as stated in
Hogmalm et al. (Submitted a) is therefore
incapable of producing the fractionation
seen in the RUG.
There is a difference in the diffusion
rate of barium and cerium, with barium
having a higher tracer diffusion rate
(Mungall, 2002). However, in the diffusion-
driven fractionation model the necessary
chemical gradient does not develop until
the distance to the convecting magma is
too large for effective diffusion. If the
distance was to be shortened, thus
creating a stronger chemical gradient it is
possible to get diffusion of incompatible
elements. If the crystallisation zone was to
be modified so that a strong chemical
gradient is achieved in a distance that
could facilitate diffusion of the faster
barium but not cerium, it would be
possible to get enrichment of barium but
not cerium (Fig. 10). However, further
studies are needed to determine if this
modification alone is capable of
producing the fractionation seen in the
RUG.
Partition Coefficients The partition coefficients used in this study
contain large uncertainties as is evident
from the calculated supernatant liquid
compositions for cerium as seen in Fig. 7c.
The cerium liquid composition decreases
at the lower sections of the stratigraphy,
more so for the partition coefficient from
Bédard (2006) than Bindeman et al.
(1998). There is no logical reason why
there should be a depletion of an
incompatible element and this decrease
might represent uncertainties in the
partition coefficients, it is thus likely that
some factor affecting partition
coefficients in sills has been overlooked.
The effect of oxidation on cerium has
been determined to negligible. There are
very few studies using plagioclase
analyses to calculate liquid compositions
in mafic intrusions. More studies are
needed of to evaluate the accuracy of
the partitioning of trace elements
between plagioclase and melt, in systems
with strong changes of anorthite
concentration in plagioclase.
Conclusion In the Rävsön Ulvö gabbro (RUG) there is
a progressive depletion of the compatible
elements strontium and vanadium in the
liquid due to fractional crystallisation of a
supernatant liquid. The fractionation of
the incompatible elements barium and
cerium differ from each other in that
barium becomes enriched while the
Figure 10. The dash-dot arrow represent the diffusion distance of compatible elements, the dash-dash
arrow is the maximum reach of cerium by diffusion and the solid arrow is the maximum distance that
barium can diffuse. The grey scale represents the chemical gradient in the crystallisation zone. a) The
crystallisation zone from the diffusion-driven fractionation. b) The modified version of the crystallisation
zone from the diffusion-driven fractionation where the size of the crystallisation zone has been
decreased.

~ 12 ~
cerium concentration of the liquid
remains the same throughout the
stratigraphy. The redistribution of
phenocrysts, compositional convection
and compaction model all fail to
satisfactorily explain the observed
fractionation. A modified version of the
diffusion-driven fractionation model could
potentially be able to reproduce the
fractionation seen in the RUG, although
further studies are needed.
Acknowledgements This study was carried out as a Bachelor of
Science thesis at the University of
Gothenburg under the supervision of
Johan Hogmalm (PhD), and Prof. David
Cornell served as the thesis examiner. The
assistance by A Firozaan and J Andersson
during thin section preparation was
greatly appreciated. The manuscript was
improved by comments from J Andersson,
DH Cornell, A Robijn and an anonymous
reviewer. The work was supported by a
grant awarded to S.Å. Larson by the
Swedish Research Council (60-1159/2002).
References Bédard, J. H. (2006). Trace element
partition in plagioclase feldspar.
Geochimica et Cosmochimica Acta
70, 3717-3742.
Bindeman, I. N., Davis, A. M. & Drake, M. J.
(1998). Ion microprobe study of
plagioclase-basalt partition
experiments at natural concentration
levels of trace elements Geochimica et
Cosmochimica Acta 62, 1175-1193.
Claeson, D. T., Meurer, W. P., Hogmalm, K.
J. & Larson, S. Å. (2007). Using LA-ICPMS
mapping and sector zonation to
understand growth and trace-element
partition in sector-zoned clinopyroxene
oikocrysts from the Norra Ulvö Gabbro,
Sweden. Journal of Petrology 48, 711-
728.
Gorbatschev, R., Solyom, Z. & Johansson,
I. (1979). The Central Scandinavian
Dolerite Group in Jämtland, central
Sweden. Geologiska Föreningen i
Stockholm Förhandlingar 101, 177-190.
Hogmalm, K. J., Meurer, W. P., Claeson, D.
T. & Larson, S. Å. (Submitted a).
Diffusion-driven decoupling of major
and incompatiable elements during
fractionation in hte layered alkali
gabbro, Norra Ulvön Gabbro, Sweden.
Journal of Petrology.
Hogmalm, K. J., Meurer, W. P., Claeson, D.
T. & Larson, S. Å. (Submitted b).
Development of model layering by
interaction between convection adn
crystalization, and compaction-control
enhancement of layering - evidence
from the Norra Ulvön Gabbro, Sweden.
Journal of Petrology.
Hogmalm, K. J., Söderlund, U., Larson, S.
Å., Meurer, W. P., Hellström, F. A. &
Claeson, D. T. (2006). The Ulvö Gabbro
Complex of the 1.27-1.25 Ga Central
Scandinavian Dolerite Group (CSDG):
Intrusive age, magmatic setting and
metamorphic history. Geologiska
Föreningen i Stockholm Förhandlingar
128, 1-6.
Jaupart, C. & Tait, S. (1995). Dynamics of
differentiation in magma reservoirs.
Journal of Geophysical Research-Solid
Earth 100, 17615-17636.
Larson, S. Å. (1980). Layered intrusions of
the Ulvö Dolerite Complex,
Angermanland, Sweden. Geological
Department. Göteborg: Chalmers
Tekniska Högskola och Göteborgs
Universitet, 213.
Larson, S. Å., Hogmalm, K. J. & Meurer, W.
P. (2008). Character and significance
of spectacular layering features
developed in the thin, alkali-basaltic sills
of the Ulvo Gabbro Complex, Sweden.
Mineralogy and Petrology 92, 427-452.
Larson, S. Å. (1973). Igneous layering in the
Ulvö dolerite, Ångermanland, Central
Sweden. Geologiska Föreningen i
Stockholm Förhandlingar 95, 407 - 409.
Latypov, R. (2009). Testing the Validity of
the Petrological Hypothesis 'No
Phenocrysts, No Post-emplacement
Differentiation'. Journal of Petrology 50,
1047-1069.

~ 13 ~
Latypov, R. M. (2003). The origin of basic-
ultrabasic sills with S-, D-, and I-shaped
compositional profiles by in situ
crystallisation of a single input of
phenocryst-poor parental magma.
Journal of Petrology 44, 1619-1656.
Lundqvist, T., Gee, D. G., Kumpulainen, R.
& Karis, L. (1990). Explanation to
bedrock map of Västernorrlands
Region (in Sweden). SGU Ba31, 175-198.
Lundqvist, T. & Samuelsson, L. (1973). The
differentiation of dolerite at Nordingrå,
central Sweden. SGU C692, 1-62.
Marsh, B. D. (1988). Crystal capture,
sorting, and retention in convecting
magma. Geological Society of
America Bulletin 100, 1720-1737.
Marsh, B. D. (1989). On convective style
and vigor in sheet-like magma
chambers. Journal of Petrology 30, 479-
530.
Marsh, B. D. (1996). Solidification fronts
and magmatic evolution.
Mineralogical Magazine 60, 5-40.
Meurer, W. P. & Boudreau, A. E. (1998a).
Compaction of igneous cumulates Part
I: Geochemical consequences for
cumulates and liquid fractionation
trends. Journal of Geology 106, 281-
292.
Meurer, W. P. & Boudreau, A. E. (1998b).
Compaction of igneous cumulates Part
II: Compaction and the development
of igneous foliations. Journal of
Geology 106, 293-304.
Mogensen, F. (1946). A ferro-ortho-
titanate ore from Södra Ulvön.
Geologiska Föreningen i Stockholm
Förhandlingar 68, 578 - 587.
Mungall, J. E. (2002). Empirical models
relating viscosity and tracer diffusion in
magmatic silicate melts. Geochimica
et Cosmochimica Acta 66, 125-143.
Sparks, R. S. J., Huppert, H. E., Kerr, R. C.,
McKenzie, D. P. & Tait, S. R. (1985).
Postcumulus processes in layered
intrusions. Geological Magazine 122,
555-568.
Tait, S. R. & Jaupart, C. (1996). The
production of chemically stratified and
adcumulate plutonic igneous rocks.
Mineralogical Magazine 60, 99-114.
Watson, E. B. & Green, T. H. (1981).
Apatite/liquid partition coefficients for
the rare earth elements and strontium.
Earth and Planetary Science Letters 56,
405-421.

~ 14 ~
Appendix
Sample Height An% Sr D B1 D B2 V D B1 Ce D B1 D B2 Ba D B1 D B2
235 Pl2 - 1 88 67,2 982 2,32 1,98 2,75 0,0281 2,48 0,107 0,129 173 0,318 0,220
236 Pl - 6 77 59,4 1005 2,75 2,49 3,29 0,0351 2,53 0,125 0,136 268 0,390 0,305
237 Pl2 - 1b 74 49,9 907 3,53 3,47 2,19 0,0437 2,47 0,147 0,139 530 0,500 0,459
131 Pl2 - 2b 66 41,4 1000 4,65 4,96 0,61 0,0514 2,85 0,169 0,139 1111 0,642 0,693
238 Pl2 - 3 63 43,0 836 4,47 4,69 N/A 0,0499 2,49 0,161 0,136 956 0,607 0,634
240 Pl2 - 4b 49 46,1 976 4,15 4,23 N/A 0,0471 1,91 0,147 0,130 815 0,545 0,536
121 Pl - 10 23 48,2 850 3,73 3,72 2,63 0,0452 2,12 0,150 0,138 541 0,522 0,494
122 Pl2 - 1 19 54,3 816 3,12 2,95 2,45 0,0398 1,95 0,137 0,139 409 0,446 0,380
124 Pl - 2 11 56,4 789 2,95 2,74 3,31 0,0378 2,06 0,132 0,138 379 0,422 0,346
125 Pl2 - 2 9 57,6 845 2,87 2,64 3,33 0,0368 2,19 0,129 0,137 340 0,409 0,330
126 Pl - 12 0 59,7 962 2,73 2,47 3,26 0,0349 2,34 0,124 0,136 352 0,387 0,302
Table 1: The concentration of strontium (Sr), vanadium (V), cerium (Ce) and barium (Ba) in ppm
for the most primitive plagioclase crystals in each sample, used to calculate a supernatant
liquid composition. Sample is the name of the analysed plagioclase crystal, Height is the
stratigraphic height in metres, An% is the anorthite concentration (Ca/(Ca+Na+K)), D B1 is the
partition coefficient calculated from Bedard (2006) and D B2 is the partition coefficients
calculated from Bindeman et al. (1998).