Embed Size (px)
Citation preview
Fourth Quarter Report 2017

KONGSBERG AUTOMOTIVE 4TH QUARTER REPORT 2017 Page 2 on 28
CONTENTS
Highlights .................................................................................................................. 3
Group Financials ........................................................................................................ 4
Segment Reporting ................................................................................................... 8
Interior Systems ................................................................................................... 8
Powertrain & Chassis Products ............................................................................. 9
Specialty Products ................................................................................................ 10
Condensed Consolidated Financial Statements ........................................................ 11
Alternative Performance Measures (APM) ................................................................. 15
Notes ......................................................................................................................... 18
Other Company Information ...................................................................................... 27

KONGSBERG AUTOMOTIVE 4TH QUARTER REPORT 2017 Page 3 on 28
HIGHLIGHTS 4TH QUARTER 2017 • Revenues were MEUR 267.4 in the fourth quarter, MEUR 17.6 (+7.1%)
above the fourth quarter last year, including negative currency translation effects of MEUR 9.8.
• Adjusted EBIT amounted to MEUR 13.0 in the fourth quarter, MEUR 5.6 above the fourth quarter last year.
• During the fourth quarter, KA announced the sale of the ePower business unit.
• Annualized business wins in the fourth quarter amounted to MEUR 122.3 bringing the total annualized business wins for the last twelve months to MEUR 291.3.
• The adjusted gearing ratio (NIBD/EBITDA) was 2.4 for the full year 2017.
KEY FIGURES (MEUR) Q 4 201 7 Q 4 201 6 FY 201 7 FY 201 6
Revenues 267 .4 249.8 1 056.6 985.7
E BITD A 1 5.3 1 2.9 69.2 63.4
in % Revenues 5.7 % 5.2 % 6.5 % 6.4 %
Adjus ted EBIT* 1 3.0 7 .4 49.8 28.3in % Revenues 4.8 % 3.0 % 4.7 % 2.9 %
E BIT 3.3 1 .6 23.8 1 8.3
in % Revenues 1 .2 % 0.6 % 2.3 % 1 .9 %
Net (Los s ) / profit (1 1 .3) (7 .4) (8.0) 1 .3
Adjus ted N IBD / E BITD A (LTM) 2.4 2.8 2.4 2.8
E quity ratio (%) 26.4% 30.2% 26.4% 30.2%
* Adjusted for restructuring costs, see section APM for the reconciliation.
0
50
100
150
200
250
300
Q42016
Q12017
Q22017
Q32017
Q42017
Revenues (MEUR)
0.0%
2.0%
4.0%
6.0%
8.0%
0
3
6
9
12
15
Q42016
Q12017
Q22017
Q32017
Q42017
Adjusted EBIT(MEUR and % rev enue)
-10-505
1015202530354045
Q42016
Q12017
Q22017
Q32017
Q42017
Operating Cash Flow(MEUR)

KONGSBERG AUTOMOTIVE 4TH QUARTER REPORT 2017 Page 4 on 28
GROUP FINANCIALS CONDENSED CONSOLIDATED STATEMENT OF PROFIT AND LOSS
(MEUR) Q 4 201 7 Q 4 201 6 FY 201 7 FY 201 6
Revenues 267 .4 249.8 1 056.6 985.7
O pex (252.1 ) (236.9) (987 .4) (922.3)
EBITDA 1 5.3 1 2.9 69.2 63.4in % Revenues 5.7 % 5.2 % 6.5 % 6.4 %
D eprec iation, amortizationand impairment
(1 2 .1 ) (1 1 .3) (45.4) (45.1 )
E BIT 3.3 1 .6 23.8 1 8.3in % Revenues 1 .2 % 0.6 % 2.3 % 1 .9 %
Adjus ted EBIT* 1 3.0 7 .4 49.8 28.3in % Revenues 4.8 % 3.0 % 4.7 % 2.9 %
N et financia l items (1 0.5) (9.8) (1 7 .4) 1 .0
(Los s ) / P r ofit befor e tax es (7 .2) (8.2) 6.4 1 9.3
Income taxes (4.1 ) 0.8 (1 4.4) (1 7 .9)
Net (Los s ) / pr ofit (1 1 .3) (7 .4) (8.0) 1 .3
* See section APM for the reconciliation.
SALE OF THE HEADREST/ARMREST BUSINESS Different from Q1 – Q3 reports, but in line with our audited annual report 2017, the sale of the North American Headrest-Armrest business in Q1 2017 will not be reported as „discontinued business“ and the HR/AR figures are included in our 2017 actual and 2016 comparative figures. In total 2016, HR/AR accounted for revenues of MEUR 41,9 (Q4: MEUR 9,1) and EBIT adjusted MEUR 0,6 (Q4: MEUR 1,0).
REVENUES Revenues for the Group amounted to MEUR 267.4 in the fourth quarter of 2017. The revenues were MEUR 17.6 (7.1%) above the comparable period last year, including negative currency translation effects of MEUR 9.8. The revenue growth was driven by both Powertrain & Chassis Products and Specialty Products.
In the Interior segment, which serves the passenger car end market, revenues decreased by MEUR -2.7 (3.8%) compared to the fourth quarter of 2016, including negative currency translation effects of MEUR 1.1. The growth of both the European and Chinese Comfort business was offset by lower sales in the North American Light Duty Cable and Comfort business. The sale of the North American Headrest and Armrest business in Q1 2017 also contributed to the revenue decrease.
In the Powertrain & Chassis Products segment, which serves the passenger car and commercial vehicle end markets, revenues increased by MEUR 10.9 (11.6%) compared to the same quarter in 2016, including negative
currency translation effects of MEUR 4.2. The revenue increase came from the European, American and the Chinese business. In Europe, the sales growth is mainly related to programs for shift systems in the passenger car business, the vehicle dynamics business and commercial vehicle business. The sales growth in China is mainly associated with new programs for shift systems for the passenger car business.
In the Specialty Products segment, which serves the passenger car, commercial vehicle end markets and general industry customers, revenues increased by MEUR 9.4 (10.8%) compared to the same quarter in 2016, including negative currency translation effects of MEUR 4.5. All business units contributed to the revenue growth with strong coupling sales in Europe and China as well as fluid handling systems sales in Europe for the automotive, commercial vehicle business and industrial business.
ADJUSTED EBIT / EBIT Adjusted EBIT for the Group was MEUR 13.0 in the fourth quarter of 2017, an increase of MEUR 5.6 compared to the fourth quarter of 2016. The effects of higher volumes and lower R&D costs (decrease of MEUR 5.0 compared to 2016 Q4) were partially offset by increased raw material costs, production relocation costs and start-up costs.
Including restructuring cost of MEUR 9.7, EBIT in Q4 2017 amounted to MEUR 3.3, compared to MEUR 1.6 in Q4 2016.

KONGSBERG AUTOMOTIVE 4TH QUARTER REPORT 2017 Page 5 on 28
NET FINANCIAL ITEMS Net financial items (see note 5) were negative at MEUR 10.5 in the fourth quarter of 2017, compared to negative at MEUR 9.8 in the same period in 2016. The main drivers were the currency effects, both unrealized (MEUR 7.5) and realized, and the increase of interest expenses due to the new bank waiver.
PROFIT BEFORE TAX / NET PROFIT Loss before tax amounted to MEUR 7.2 in the fourth quarter of 2017, an improvement of MEUR 1.0 compared to the same quarter in 2016. The positive change in EBIT was partially offset by the negative change in net finanitems.
For the full year 2017, the total income tax expense was MEUR 14.4 down from MEUR 17.9 in 2016 and was heavily impacted by a significant write-off (MEUR 8.0) of existing US deferred tax assets due to the new US tax legislation valid as per January 1, 2018.

KONGSBERG AUTOMOTIVE 4TH QUARTER REPORT 2017 Page 6 on 28
GROUP FINANCIALS
CONDENSED STATEMENT OF CASH FLOW
(MEUR) Q 4 201 7 Q 4 201 6 FY 201 7 FY 201 6
C as h flow from operating activities 1 3.5 40.6 38.3 7 0.8
C as h flow from inves ting activities (1 7 .1 ) (22.3) (49.3) (50.5)
C as h flow from financing activities 8.9 (1 6.2) 1 8.2 (26.4)
C urrency effects on cas h (0.3) 1 .0 (2.3) 0.8
C hange in cas h 5.0 3.1 4.9 (5.3)
C as h at beginning period 34.5 31 .5 34.6 39.9
C as h at period end 39.5 34.6 39.5 34.6O f this, restricted cash 1 .6 0.4 1 .6 0.4
CASH FLOW FROM OPERATING ACTIVITIES Cash flow from operating activities decreased by MEUR 27.1 in comparison with the same quarter last year. The decrease was primarily driven by the increase of working capital due to restructuring activities, tax payments, but was partially offset by the increase in EBITDA.
Restructuring had a cash effect of MEUR 10.6 in the quarter.
CASH FLOW FROM INVESTING ACTIVITIES Cash flow from investing activities amounted to MEUR -17.1 in the fourth quarter of 2017, MEUR 5.2 more than the comparable quarter last year. Investments were made in capacity expansions to accommodate current and future manufacturing requirements, maintenance investments as well as intangible assets.
CASH FLOW FROM FINANCING ACTIVITIES Cash flow from financing activities was MEUR 8.9 in the fourth quarter, compared to MEUR -16.2 in the comparable quarter last year. The change was primarily driven by net
borrowing partially offset by the purchase of treasury shares, and higher interest payments.
Net borrowing amounted to MEUR 14.1 in the fourth quarter, compared to net repayment of MEUR 14.1 in the same period last year. Interest payments in the fourth quarter amounted to MEUR 2.9, an increase of MEUR 1.3 compared to MEUR 1.5 during the same period last year. The increased interest margins due to the new bank waiver drove the change in interest payments. Purchase of treasury shares amounted to MEUR 2.4 compared to sale of treasury shares of MEUR 0.4 in the fourth quarter last year.
CHANGE IN CASH Cash increased by MEUR 4.9 during the fourth quarter, resulting in a cash position of MEUR 39.5 at the end of the quarter.
LIQUIDITY RESERVE The liquidity reserve was MEUR 105.4 at the end of the fourth quarter, compared to MEUR 140.8 at year-end 2016. The negative currency effects on undrawn cash facilities amounted to MEUR 6.5. See note 4.4 for more information.
KONGSBERG AUTOMOTIVE 4TH QUARTER REPORT 2017 Page 7 on 28
GROUP FINANCIALS
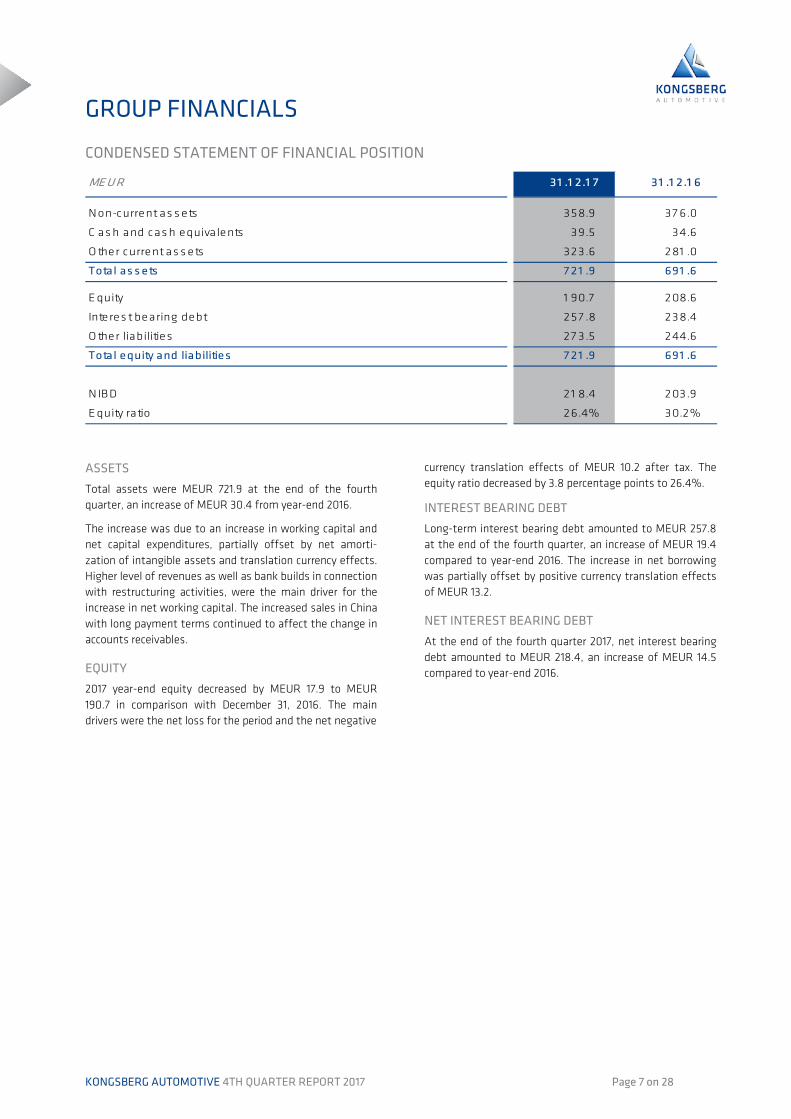
CONDENSED STATEMENT OF FINANCIAL POSITION
ME U R 31 .1 2.1 7 31 .1 2.1 6
N on-current as s ets 358.9 37 6.0
C as h and cas h equivalents 39.5 34.6
O ther current as s ets 323.6 281 .0
Total as s ets 7 21 .9 691 .6
E quity 1 90.7 208.6
Interes t bearing debt 257 .8 238.4
O ther liabilities 27 3.5 244.6
Total equity and liabilities 7 21 .9 691 .6
N IBD 21 8.4 203.9
E quity ratio 26.4% 30.2%
ASSETS Total assets were MEUR 721.9 at the end of the fourth quarter, an increase of MEUR 30.4 from year-end 2016.
The increase was due to an increase in working capital and net capital expenditures, partially offset by net amorti-zation of intangible assets and translation currency effects. Higher level of revenues as well as bank builds in connection with restructuring activities, were the main driver for the increase in net working capital. The increased sales in China with long payment terms continued to affect the change in accounts receivables.
EQUITY 2017 year-end equity decreased by MEUR 17.9 to MEUR 190.7 in comparison with December 31, 2016. The main drivers were the net loss for the period and the net negative
currency translation effects of MEUR 10.2 after tax. The equity ratio decreased by 3.8 percentage points to 26.4%.
INTEREST BEARING DEBT Long-term interest bearing debt amounted to MEUR 257.8 at the end of the fourth quarter, an increase of MEUR 19.4 compared to year-end 2016. The increase in net borrowing was partially offset by positive currency translation effects of MEUR 13.2.
NET INTEREST BEARING DEBT At the end of the fourth quarter 2017, net interest bearing debt amounted to MEUR 218.4, an increase of MEUR 14.5 compared to year-end 2016.

KONGSBERG AUTOMOTIVE 4TH QUARTER REPORT 2017 Page 8 on 28
25%404550556065707580
Q42016
Q12017
Q22017
Q32017
Q42017
0.01.02.03.04.05.06.07.0
Q42016
Q12017
Q22017
Q32017
Q42017
INTERIOR
SEGMENT REPORTING Interior Systems is a global leader in the development, design and manufacture of seat comfort systems and mechanical and electro-mechanical light-duty motion controls to Tier 1 and OEM customers. The product range includes seat adjuster cables and other cabling systems, lumbar support and side bolsters, seat heating, ventilation and massage systems and head restraints.
Interior Systems addresses the passenger car market, with particularly strong positions on premium car platforms in Europe
and North America. The product penetration for products such as seat heating, seat ventilation and massage systems are especially high in medium to higher end cars, while headrests and light duty cables are found in all ranges of cars. Customers include all major European and North American car and seat manufacturers and most premium OEMs such as Adient, Magna, Faurecia, Lear, Jaguar, Land Rover, Audi, Volvo Cars, Daimler and BMW.
KEY FIGURES (MEUR) Q 4 201 7 Q 4 201 6 FY 201 7 FY 201 6
Revenues 66.5 69.2 263.9 27 7 .8
Adjus ted E BITD A 4.0 4.3 20.4 24.1
in % Revenues 6.0 % 6.3 % 7 .7 % 8.7 %
Adjus ted EBIT 1 .2 1 .9 1 0.1 1 2.1in % Revenues 1 .9 % 2.8 % 3.8 % 4.4 %
R es tructuring (0.8) (0.5) (1 .5) (0.7 )
EBIT 0.4 1 .5 8.6 1 1 .4in % Revenues 0.7 % 2.1 % 3.2 % 4.1 %
Inves tments 2 (8.6) (1 0.0) (22.7 ) (1 9.3)
C apita l E mployed * 1 61 .3 1 47 .1 1 61 .3 1 47 .1
* Includes PP&E, intangible assets, inventories, trade receivables and trade payables
FINANCIAL UPDATE The year-over-year comparison is obviously impacted by the sale of the North American Headrest and Armrest business in Q1 2017. Due to this effect, revenues in Interior Systems decreased by MEUR 2.7 (-3.8%) to MEUR 66.5 in the fourth quarter 2017 compared to the same quarter in 2016, including negative currency effects of MEUR 1.1. Revenues grew by MEUR 2.5 excluding the HR/AR business. The revenue growth in both the European and Chinese Comfort business was offset by a decrease in the North American Light Duty Cable and Comfort businesses.
Adjusted EBIT was MEUR 1.2 in the fourth quarter, a decrease of MEUR 0.7 compared to the fourth quarter 2016. The adjusted EBIT margin for the fourth quarter decreased by 0.9 percentage point to 1.9%. The negative change in EBIT was
related to continuing industrialization costs of new pro-duction lines, negative changes in the raw material prices, as well as negative transactional FX effects. It was partially offset by the higher sales volume, operational improvements and lower R&D expenses (MEUR -1.4).
Adjusted EBIT for the full year decreased by MEUR 2.1 (-17.1%) compared to last year. The adjusted EBIT margin for the full year decreased from 4.4% to 3.8%.
COMMERCIAL & OPERATIONAL UPDATE The business wins for the fourth quarter amounted to MEUR 28.5 in annual sales for the Interior Systems segment. Notably Interior Comfort Systems was awarded a significant contract from a Chinese car manufacturer.
Share of Group Q4 2017 revenues Revenues (MEUR) Adjusted EBIT (MEUR)

KONGSBERG AUTOMOTIVE 4TH QUARTER REPORT 2017 Page 9 on 28
39%
60
70
80
90
100
110
Q42016
Q12017
Q22017
Q32017
Q42017
-1.5-1.0-0.50.00.51.01.52.0
Q42016
Q12017
Q22017
Q32017
Q42017
POWERTRAIN & CHASSIS PRODUCTS SEGMENT REPORTING Powertrain & Chassis Products is a global Tier 1 supplier of driver control and driveline products into the passenger and commercial vehicle automotive markets. The portfolio includes custom-engineered cable controls and complete shift systems, clutch actuation systems, vehicle dynamics, shift cables and shift towers for transmissions.
Powertrain & Chassis Products serves the passenger car and the commercial vehicle market, with particularly strong positions in Europe and the Americas. With a global footprint, Powertrain & Chassis is able to support customers worldwide. Key customers include Ford, General Motors, FCA, Volvo, Scania, DAF, John Deere, PSA and Renault-Nissan.
KEY FIGURES MEUR Q 4 201 7 Q 4 201 6 FY 201 7 FY 201 6
Revenues 1 04.8 93.9 407 .4 350.4
Adjus ted E BITD A 5.8 5.3 1 8.4 1 4.2
in % Revenues 5.5 % 5.7 % 4.5 % 4.0 %
Adjus ted EBIT 1 .6 0.4 1 .5 (3.2)in % Revenues 1 .5 % 0.4 % 0.4 % -0.9 %
R es tructuring (5.8) (0.9) (1 3.1 ) (4.7 )
EBIT (4.2) (0.5) (1 1 .5) (7 .9)in % Revenues -4.0 % -0.5 % -2.8 % -2.3 %
Inves tments 2 (3.2) (5.4) (1 9.1 ) (1 9.6)
C apita l E mployed * 1 54.2 1 44.7 1 54.2 1 44.7
* Includes PP&E, intangible assets, inventories, trade receivables and trade payables
FINANCIAL UPDATE Revenues in Powertrain & Chassis increased by MEUR 10.9 (+11.6%) to MEUR 104.8 in the fourth quarter 2017 compared to the same quarter in 2016, including a negative currency effect of MEUR 4.2. The revenue increase came from the European, American and Chinese business. The sales growth in Europe is mainly related to programs for shift systems in the passenger car business, the vehicle dynamics business and commercial vehicle business. The sales growth in China is mainly driven by new programs on shift systems for the passenger car business. Revenues for the full year amounted to MEUR 407.4, an increase of MEUR 57.0 in comparison with 2016. Adjusted EBIT was MEUR 1.6 in the fourth quarter, an increase of MEUR 1.2 compared to the fourth quarter 2016. The fourth quarter adjusted EBIT margin increased by 1.1 percentage points to 1.5%. The main drivers for the increase were higher sales volumes, lower R&D costs (MEUR -2.4) partially offset by production start-up costs and increased raw material prices.
Adjusted EBIT for the full year increased by MEUR 4.8 over last year. The adjusted EBIT margin for the full year increased by 1.3 percentage points to 0.4%.
COMMERCIAL & OPERATIONAL UPDATE Overall project activities continue on a high level with strong new business win opportunities. Business wins for the fourth quarter amounted to MEUR 44.2 in annual sales. Engineering activities remain high to support upcoming product launches as it has been for all 2017. The main focus remains on the preparation of product introductions along with operational efficiency improvement measures and fixed cost reductions. The process to close the Heiligenhaus facility (Germany) has been finalized during the fourth quarter. The closure of the Rollag facility (Norway) is progressing and is now expected to be completed by Q2 2018. Those closures will sustainably enhance efficiency and reduce fixed cost levels.
Share of Group Q4 2017 revenues Revenues (MEUR) Adjusted EBIT (MEUR)

KONGSBERG AUTOMOTIVE 4TH QUARTER REPORT 2017 Page 10 on 28
36%
20
40
60
80
100
120
Q42016
Q12017
Q22017
Q32017
Q42017
0.0
3.0
6.0
9.0
12.0
15.0
18.0
Q42016
Q12017
Q22017
Q32017
Q42017
SPECIALTY PRODUCTS SEGMENT REPORTING The Specialty Products segment designs and manufactures fluid handling systems for both the automotive and commercial vehicle markets, couplings systems for compressed-air circuits in heavy-duty vehicles, operator control systems for power sports construction, agriculture, outdoor power equipment, power electronics and MRF
technology based products. Key customers include Volvo Trucks/Group, Scania, Navistar, Paccar/DAF, Ford, Jaguar Land Rover, Club Car, John Deere, CAT, Husqvarna, CNH and BRP and several Tier 1 customers in addition to an industrial customer base.
KEY FIGURES MEUR Q 4 201 7 Q 4 201 6 FY 201 7 FY 201 6
Revenues 96.1 86.7 385.3 357 .5
Adjus ted E BITD A 1 6.2 1 3.1 65.5 50.5
Adjus ted EBIT D A (%) 1 6.9 % 1 5.1 % 1 7 .0 % 1 4.1 %
Adjus ted EBIT 1 2.7 9.6 51 .1 36.0Adjus ted EBIT (%) 1 3.2 % 1 1 .1 % 1 3.3 % 1 0.1 %
R es tructuring (2.0) (4.3) (8.7 ) (4.4)
EBIT 1 0.7 5.3 42.4 31 .6EBIT (%) 1 1 .1 % 6.1 % 1 1 .0 % 8.8 %
Inves tments 2 (3.6) (5.4) (8.3) (9.9)
C apita l E mployed * 1 7 1 .5 1 7 5.0 1 7 1 .5 1 7 5.0
* Includes PP&E, intangible assets, inventories, trade receivables and trade payables FINANCIAL UPDATE Revenues in Specialty Products increased by MEUR 9.4 (+10.8%) to MEUR 96.1 in the fourth quarter 2017 compared to the same quarter in 2016, including a negative currency effect of MEUR 4.5. The revenue increase was driven by growth in Coupling sales, especially in the European and Chinese business. Furthermore, the sales increase in Europe of FTS products commercial vehicle business and industrial business, as well as the strength of the North American industrial business contributed to the revenue development. This was partially offset by a modestly negative change in the North American automotive business for FTS products, and a slight decrease of off-highway sales due to divestments related to the Basildon closure. Revenues for the full year amounted to MEUR 385.3, an increase of 7.8% from 2016.
Adjusted EBIT was MEUR 12.7 in the fourth quarter, an increase of MEUR 3.0 compared to the fourth quarter 2016. The fourth quarter adjusted EBIT margin increased by 2.1 percentage points to 13.2%. This change was driven by higher sales volumes and lower R&D costs (MEUR -1.2), partially
offset by increased material costs and freight costs. Adjusted EBIT for the full year increased by MEUR 15.1 (+42.0%) over last year. The adjusted EBIT margin for the full year increased by 3.2 percentage points to 13.3% due to higher sales volume and lower R&D costs (MEUR -2.8), this was partially offset by increased raw material and freight costs.
COMMERCIAL & OPERATIONAL UPDATE During the fourth quarter total business awards amounted to MEUR 49.6 in annual sales, the majority of the business wins was within the Fluid business unit. Sales opportunities and quoting activities remain robust. The closure of the Heiligenhaus facility (Germany) has been finalized by the end of 2017. The closure of Easley (USA) announced during the third quarter is progressing and the transfer to the new facility in Mexico is planned to be finalized in 2018. This relocation will increase efficiency and reduce costs.
Share of Group Q3 2017 revenues Revenues (MEUR) Adjusted EBIT (MEUR)

KONGSBERG AUTOMOTIVE 4TH QUARTER REPORT 2017 Page 11 on 28
CONDENSED CONSOLIDATED FINANCIAL STATEMENT STATEMENT OF COMPREHENSIVE INCOME
(MEUR) Q 4 201 7 Q 4 201 6 FY 201 7 FY 201 6
Revenues 267 .4 249.8 1 056.6 985.7
O pex (252.1 ) (236.9) (987 .4) (922.3)
EBITDA 1 5.3 1 2.9 69.2 63.4in % Revenues 5.7 % 5.2 % 6.5 % 6.4 %
D eprec iation, amortizationand impairment
(1 2 .1 ) (1 1 .3) (45.4) (45.1 )
E BIT 3.3 1 .6 23.8 1 8.3in % Revenues 1 .2 % 0.6 % 2.3 % 1 .9 %
Adjus ted EBIT* 1 3.0 7 .4 49.8 28.3in % Revenues 4.8 % 3.0 % 4.7 % 2.9 %
N et financia l items (1 0.5) (9.8) (1 7 .4) 1 .0
(Los s ) / P r ofit befor e tax es (7 .2) (8.2) 6.4 1 9.3
Income taxes (4.1 ) 0.8 (1 4.4) (1 7 .9)
Net (Los s ) / pr ofit (1 1 .3) (7 .4) (8.0) 1 .3
O ther comprehensive income (Items that may b e rec lassified to profit or loss in sub sequent periods):
Trans lation differences on fore ign operations
8.5 1 2.9 (3.8) (1 3.6)
Tax on trans lation differences (1 .9) (4.6) 2.8 1 .5
O ther comprehensive income (Items that will not b e rec lassified to profit or loss in sub sequent periods):Trans lation differences on non-fore ign operations
(2.9) (1 .2) (6.4) 5.1
R emeas urement of the net P BO (0.1 ) (1 .2) (0.1 ) (1 .2)
Tax on remeas urement of the net P BO 0.0 0.3 0.0 0.3
O ther comphrehens ive income 3.6 6.2 (7 .5) (7 .8)
Total c omprehens ive inc ome (7 .7 ) (1 .3) (1 5.4) (6.5)
N et profit attributable to:
E quity holders (parent comp) (1 1 .4) (7 .5) (8.0) 1 .3
N on-controlling interes ts 0.0 0.0 0.0 0.1
Total (1 1 .3) (7 .4) (8.0) 1 .3
Total comprehens ive income attributable to:
E quity holders (parent comp)2 (7 .7 ) (1 .3) (1 5.5) (6.6)
N on-controlling interes ts 2 0.0 0.0 0.0 0.1
Total2 (7 .7 ) (1 .3) (1 5.4) (6.5)
E arnings per s hare :
Bas ic earnings per s hare , E U R (0.03) (0.02) (0.02) 0.00
D iluted earnings per s hare , E U R (0.03) (0.02) (0.02) 0.00 * Adjusted for restructuring costs, see section APM for the reconciliation.

KONGSBERG AUTOMOTIVE 4TH QUARTER REPORT 2017 Page 12 on 28
CONDENSED CONSOLIDATED FINANCIAL STATEMENT STATEMENT OF FINANCIAL POSITION
(MEUR) 31 .1 2.1 7 31 .1 2.1 6
D eferred tax as s ets 23.7 32.4
Intangible as s ets 1 62.0 1 82.3
P roperty, plant and equipment 1 69.7 1 60.2
O ther non-current as s ets 3.5 1 .1
Non-c ur r ent as s ets 358.9 37 6.0
Inventories 1 04.7 7 8.6
Accounts rece ivable 1 80.0 1 59.5
O ther s hort term rece ivables 38.9 42.9
C as h and cas h equivalents 39.5 34.6
C ur r ent as s ets 363.1 31 5.6
Total as s ets 7 21 .9 691 .6
S hare capita l 20.7 22.4
S hare premium res erve 1 7 1 .4 1 85.6
O ther equity (4.9) (3.1 )
N on-controlling interes ts 3.6 3.8
Total equity 1 90.7 208.6
Interes t bearing loans and borrowings 257 .8 238.4
D eferred tax liabilities 1 9.5 27 .1
O ther long term liabilities 1 9.5 20.7
Non-current liabilities 296.8 286.2
Bank overdraft (0.0) 0.0
O ther s hort term liabilities , interes t bearing 0.1 0.0
Accounts payable 1 30.6 1 1 1 .0
O ther s hort term liabilities 1 03.7 85.8
C urrent liabilities 234.5 1 96.8
Total liabilities 531 .2 483.0
Total equity and liabilities 7 21 .9 691 .6

KONGSBERG AUTOMOTIVE 4TH QUARTER REPORT 2017 Page 13 on 28
CONDENSED CONSOLIDATED FINANCIAL STATEMENT STATEMENT OF CHANGE IN EQUITY
(MEUR) 31 .1 2.1 7 31 .1 2.1 6
Equity as of s tar t of per iod 208.6 21 4.2
N et profit for the period (8.0) 1 .3
Trans lation differences (1 0.2) (8.5)
Tax on trans lation differences 2.8 1 .5
R emeas urement of the net pens ion benefit obligation (0.1 ) (1 .2)
Tax on remeas urement of the net pens ion benefit obligation 0.0 0.3
Total comprehens ive income (1 5.4) (6.5)
O ptions contracts (employees ) 0.1 0.5
Treas ury s hares (2.5) 0.4
O ther changes in non-controlling interes ts 0.0 0.0
O ther changes in equity 0.0 (0.0)
Equity as of end of per iod 1 90.7 208.6
KONGSBERG AUTOMOTIVE 4TH QUARTER REPORT 2017 Page 14 on 28
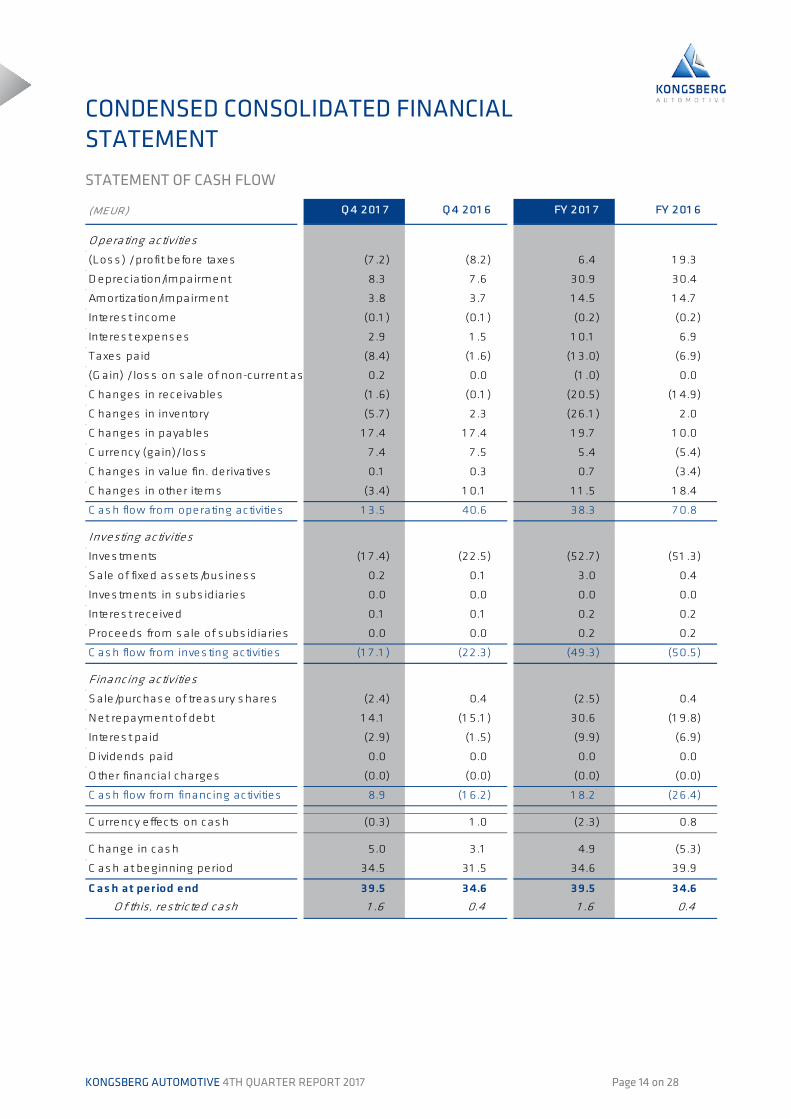
CONDENSED CONSOLIDATED FINANCIAL STATEMENT STATEMENT OF CASH FLOW
(MEUR) Q 4 201 7 Q 4 201 6 FY 201 7 FY 201 6
O perating activities
(Los s ) / profit before taxes (7 .2) (8.2) 6.4 1 9.3
D eprec iation/impairment 8.3 7 .6 30.9 30.4
Amortization/impairment 3.8 3.7 1 4.5 1 4.7
Interes t income (0.1 ) (0.1 ) (0.2) (0.2)
Interes t expens es 2.9 1 .5 1 0.1 6.9
Taxes paid (8.4) (1 .6) (1 3.0) (6.9)
(G ain) / los s on s ale of non-current as 0.2 0.0 (1 .0) 0.0
C hanges in rece ivables (1 .6) (0.1 ) (20.5) (1 4.9)
C hanges in inventory (5.7 ) 2 .3 (26.1 ) 2 .0
C hanges in payables 1 7 .4 1 7 .4 1 9.7 1 0.0
C urrency (gain)/ los s 7 .4 7 .5 5.4 (5.4)
C hanges in value fin. derivatives 0.1 0.3 0.7 (3.4)
C hanges in other items (3.4) 1 0.1 1 1 .5 1 8.4
C as h flow from operating activities 1 3.5 40.6 38.3 7 0.8
Investing activities
Inves tments 1 (1 7 .4) (22.5) (52.7 ) (51 .3)
S ale of fixed as s ets /bus ines s 0.2 0.1 3.0 0.4
Inves tments in s ubs idiaries 0.0 0.0 0.0 0.0
Interes t rece ived 0.1 0.1 0.2 0.2
P roceeds from s ale of s ubs idiaries 0.0 0.0 0.2 0.2
C as h flow from inves ting activities (1 7 .1 ) (22.3) (49.3) (50.5)
Financing activities
S ale/purchas e of treas ury s hares (2.4) 0.4 (2.5) 0.4
N et repayment of debt 1 4.1 (1 5.1 ) 30.6 (1 9.8)
Interes t paid (2.9) (1 .5) (9.9) (6.9)
D ividends paid 0.0 0.0 0.0 0.0
O ther financia l charges (0.0) (0.0) (0.0) (0.0)
C as h flow from financing activities 8.9 (1 6.2) 1 8.2 (26.4)
C urrency effects on cas h (0.3) 1 .0 (2.3) 0.8
C hange in cas h 5.0 3.1 4.9 (5.3)
C as h at beginning period 34.5 31 .5 34.6 39.9
C as h at period end 39.5 34.6 39.5 34.6O f this, restricted cash 1 .6 0.4 1 .6 0.4

KONGSBERG AUTOMOTIVE 4TH QUARTER REPORT 2017 Page 15 on 28
ALTERNATIVE PERFORMANCE MEASURES (APM) This section describes the non-GAAP financial measures that are used in this report and in the quarterly presentation.
The following measures are not defined or specified in the applicable financial reporting framework of the IFRS GAAP. They may be considered as non-GAAP financial measures that may include or exclude amounts that are calculated and presented according to the IFRS GAAP.
EBIT/Adjusted EBIT EBITDA/Adjusted EBITDA Restructuring per segment Free Cash Flow
NIBD Capital Employed ROCE Gearing Ratio/Adjusted Gearing Ratio
EBIT/Adjusted EBIT EBIT, earnings before interest and tax, is defined as the earnings excluding the effects from how the operations were financed, taxed and excluding foreign exchange gains & losses. EBIT adjusted is defined as EBIT excluding restructuring. Restructuring costs is defined as any incurred costs of an unusual or non-recurring nature in connection with the contemplated restructuring of the activities of the Group.
EBIT is used as a measure to view the Group’s operational profitability. In order to measure the running business, as usual, the Group also lists the adjusted EBIT, the EBIT excluding restructuring costs.
Adjusted EBIT reconciliation
(MEUR) Q 4 201 7 Q 4 201 6 FY 201 7 FY 201 6
E BIT (1 ) 3.3 1 .6 23.8 1 8.3
R es tructuring cos ts (2) 9.7 5.8 26.0 1 0.0
Adjus ted E BIT, (1 ) + (2) 1 3.0 7 .4 49.8 28.3
EBITDA/Adjusted EBITDA Earnings before interest expenses and interest income, tax, depreciation, amortization and excluding foreign exchange gains and losses. EBITDA adjusted is defined as EBITDA excluding restructuring costs.
EBITDA is used as an additional measure the view the Group’s operational profitability, excluding the impact from depreciations and amortizations. Adjusted EBITDA reconciliation
(MEUR) Q 4 201 7 Q 4 201 6 FY 201 7 FY 201 6
E BITD A (1 ) 1 5.3 1 2.9 69.2 63.4
R es tructuring cos ts (2)* 8.3 5.4 23.2 9.6
Adjus ted E BITD A, (1 ) + (2) 23.7 1 8.4 92.4 7 3.0
* Excluding impairment, depreciation and amortization.
Restructuring costs per segment
(MEUR) Q 4 201 7 Q 4 201 6 FY 201 7 FY 201 6
Interior (0.8) (0.5) (1 .5) (0.7 )
P owertra in & C has s is P roducts (5.8) (0.9) (1 3.1 ) (4.7 )
S pecia lty P roducts (2.0) (4.3) (8.7 ) (4.4)
O thers (1 .1 ) (0.1 ) (2 .7 ) (0.2)
G roup total (9.7 ) (5.8) (26.0) (1 0.0)
The restructuring costs in 2017 mainly relate to the closure and transfer of activities in the Heiligenhaus facility and Rollag facility within the Powertrain & Chassis and Specialty Products segments, as well as the Easley facility in the Specialty Product segment.

KONGSBERG AUTOMOTIVE 4TH QUARTER REPORT 2017 Page 16 on 28
ALTERNATIVE PERFORMANCE MEASURES (APM) Free Cash Flow Free cash flow is measured based on cash flow from operations, investments and financing excluding debt repayments.
Free Cash Flow is used in order to measure the Group’s ability to generate cash. It allows the Group to view how much cash it generates from its operations after subtracting the cash flow from investing activities and financing excluding debt repayments. The Group considers that this measurement illustrates the amount of cash the Group has at its disposal to pursue additional investments or to repay debt.
(MEUR) 31 .1 2.1 7 31 .1 2.1 6
C as h flow from operating activities 38.3 7 0.8
C as h flow from inves ting activities (49.3) (50.5)
C as h flow from financing activities 1 8.2 (26.4)
N et repayment of debt (30.6) 1 9.8
Free C as h Flow (23.4) 1 3.7
NIBD Net interesting bearing debt (NIBD), consists of interest-bearing liabilities less cash and cash equivalents.
The Group risk of default and financial strength is measured by the net interesting bearing debt. It shows the Group’s financial position and leverage. As cash and cash equivalents can be used to repay debt, this measurement shows the net overall financial position of the Group.
(MEUR) 31 .1 2.1 7 31 .1 2.1 6
Interes t bearing loans and borrowings 257 .8 238.4
O ther s hort term liabilities , interes t bearing 0.1 0.0
Bank overdraft (0.0) 0.0
C as h and cas h equivalents (39.5) (34.6)
Net Interes ting Bearing D ebt 21 8.4 203.9
Capital Employed Capital Employed (CE) is equal to operating assets less operating liabilities. Operating assets and liabilities are items which are involved in the process of producing and selling goods and services. Financial assets and obligations are excluded, these assets are involved in raising cash for operations and disbursing excess cash from operations.
Capital employed is measured in order to assess how much capital is needed for the operations/business to function and evaluate if the capital employed can be utilized more efficiently or/and if operations should be discontinued.
(MEUR) 31 .1 2.1 7 31 .1 2.1 6
Total as s ets 7 21 .9 691 .6
D eferred tax liabilities (1 9.5) (27 .1 )
O ther long term liabilities (1 9.5) (20.7 )
C urrent liabilities inc l. other s hort-term interes t bearing liabilities (234.5) (1 96.8)
C apital E mployed 448.5 447 .0

KONGSBERG AUTOMOTIVE 4TH QUARTER REPORT 2017 Page 17 on 28
ALTERNATIVE PERFORMANCE MEASURES (APM) ROCE (Last twelve Months) Return on Capital Employed (ROCE) is based on EBIT for the last twelve months divided by the average of capital employed at beginning period and period end.
Return on Capital Employed is used to measure the return on the capital employed without taking into consideration the way the operations and assets are financed during the period under review. The Group considers this ratio as appropriate to measure the return of the period.
(MEUR) 31 .1 2.1 7
C apita l E mployed at period beginning (1 ) 31 .1 2.1 6 447 .0
C apita l E mployed at period end (2) 31 .1 2.1 7 448.5
Adjus ted E BIT las t twelve months (3) 49.8
R O C E , (3) / ((1 ) +( 2)) * 2 1 1 .1 % Gearing ratio / Adjusted Gearing Ratio Gearing ratio is calculated as the net interest bearing debt divided by the last twelve months EBITDA, adjusted for restructuring
costs.
Gearing ratio is a covenant from the Group’s lenders, which sets the interest margin on the Group’s debt. It is based on the EBITDA of the continuing business only and set a limit for restructuring costs (MEUR 21.0 for 2017 full year)
Adjusted Gearing ratio - according to bank covenants on restructuring costs limit and excluding discontinued business
(MEUR) 31 .1 2.1 7
E BITD A las t twelve months exc luding dis continued bus ines s (1 ) 7 2.3
R es tructuring cos ts las t twelve months - covenant limit (2)* 21 .0
EBITDA las t tw elve months adjus ted for res truc turing c os ts (3), (1 ) + (2) 93.3
N IBD (4) 21 8.4
Adjus ted G earing R atio (4)/(3) 2.34
* Excluding impairment, depreciation and amortization.
The Group also considers this ratio as an appropriate measurement of the Group financial gearing and financial position but including all business and restructuring costs without limit.
Adjusted Gearing ratio - including all restructuring costs of the last twelve months and discontinued business
(MEUR) 31 .1 2.1 7
E BITD A las t twelve months (1 ) 69.2
R es tructuring cos ts las t twelve months (2)* 23.2
EBITDA las t tw elve months adjus ted for res truc turing c os ts (3), (1 ) + (2) 92.4
N IBD (4) 21 8.4
Adjus ted G earing R atio (4)/(3) 2.36
* Excluding impairment, depreciation and amortization.
Please refer to the annual report for further information on covenants.
KONGSBERG AUTOMOTIVE 4TH QUARTER REPORT 2017 Page 18 on 28
NOTES TO THE CONSOLIDATED FINANCIAL STATEMENT NOTE 1 – DISCLOSURES GENERAL INFORMATION
Kongsberg Automotive ASA and its subsidiaries develop, manufacture and sell products to the automotive industry globally. Kongsberg Automotive ASA is a limited liability company which is listed on the Oslo Stock Exchange. The consolidated interim financial statements are not audited.
BASIS OF PREPARATION
This condensed consolidated interim financial information, ended December 31, 2017, and has been prepared in accordance with IAS 34 “Interim financial reporting”. The condensed consolidated interim financial information should be read in conjunction with the annual financial statements for the year-ended December 31, 2017, which have been prepared in accordance with IFRS.
ACCOUNTING POLICIES
The accounting policies are consistent with those of the annual financial statements for the year-ended December 31, 2017, as described in those annual financial statements. Taxes on income in the interim periods are accrued using the estimated effective tax rate.
RISK
Kongsberg Automotive continuously monitors its risk factors. Our activities are exposed to different types of risk.
The single most important risk that Kongsberg Automotive is exposed to is the development of demand in the end markets for light duty and commercial vehicles worldwide. Some of the most important additional risk factors are foreign-exchange rates, interest rates, raw material prices, and credit risks. As we operate in many countries, we are vulnerable to currency risk. The most significant currency exposure for Kongsberg Automotive is associated with EUR and USD exchange rate. The greatest raw material exposures are for copper, zinc, aluminum and steel. As most of our revenues are earned from automotive OEMs and automotive tier-1 and -2 customers, the financial health of these automotive companies is critical to our credit risk.
SEASONALITY
The Group quarterly results are to some extent influenced by seasonality. The seasonality is mainly driven by the vacation period in the third quarter and December each year having lower sales. Also, year-over-year seasonality differences may occur as a result of varying number of working days in each quarter.
KONGSBERG AUTOMOTIVE 4TH QUARTER REPORT 2017 Page 19 on 28
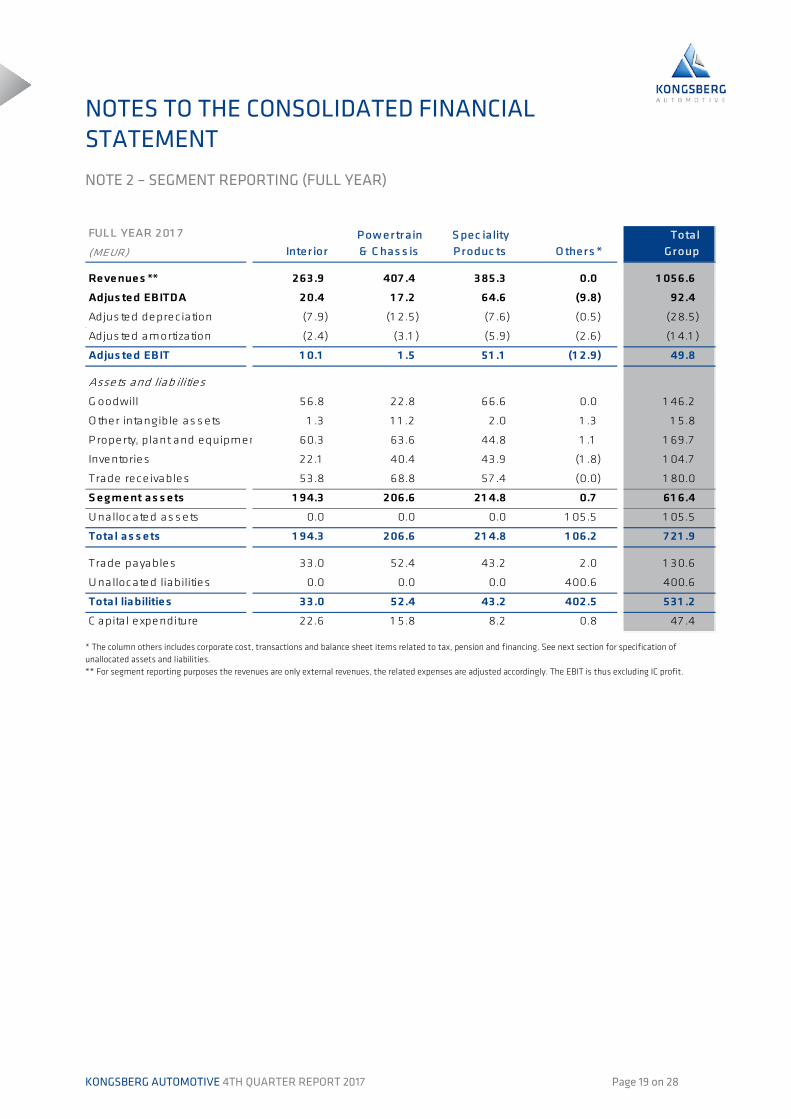
NOTES TO THE CONSOLIDATED FINANCIAL STATEMENT NOTE 2 – SEGMENT REPORTING (FULL YEAR)
FULL YEAR 201 7 P ow er tr ain S pec iality Total(MEUR) Inter ior & C has s is P r oduc ts O ther s * Gr oup
Revenues ** 263.9 407 .4 385.3 0.0 1 056.6
Adjus ted EBITDA 20.4 1 7 .2 64.6 (9.8) 92.4
Adjus ted deprec iation (7 .9) (1 2 .5) (7 .6) (0.5) (28.5)
Adjus ted amortization (2.4) (3.1 ) (5.9) (2 .6) (1 4.1 )
Adjus ted EBIT 1 0.1 1 .5 51 .1 (1 2.9) 49.8
Assets and liab ilities
G oodwill 56.8 22.8 66.6 0.0 1 46.2
O ther intangible as s ets 1 .3 1 1 .2 2.0 1 .3 1 5.8
P roperty, plant and equipmen 60.3 63.6 44.8 1 .1 1 69.7
Inventories 22.1 40.4 43.9 (1 .8) 1 04.7
Trade rece ivables 53.8 68.8 57 .4 (0.0) 1 80.0
S egment as s ets 1 94.3 206.6 21 4.8 0.7 61 6.4
U nallocated as s ets 0.0 0.0 0.0 1 05.5 1 05.5
Total as s ets 1 94.3 206.6 21 4.8 1 06.2 7 21 .9
Trade payables 33.0 52.4 43.2 2.0 1 30.6
U nallocated liabilities 0.0 0.0 0.0 400.6 400.6
Total liabilities 33.0 52.4 43.2 402.5 531 .2
C apita l expenditure 22.6 1 5.8 8.2 0.8 47 .4
* The column others includes corporate cost, transactions and balance sheet items related to tax, pension and financing. See next section for specification of unallocated assets and liabilities. ** For segment reporting purposes the revenues are only external revenues, the related expenses are adjusted accordingly. The EBIT is thus excluding IC profit.
KONGSBERG AUTOMOTIVE 4TH QUARTER REPORT 2017 Page 20 on 28
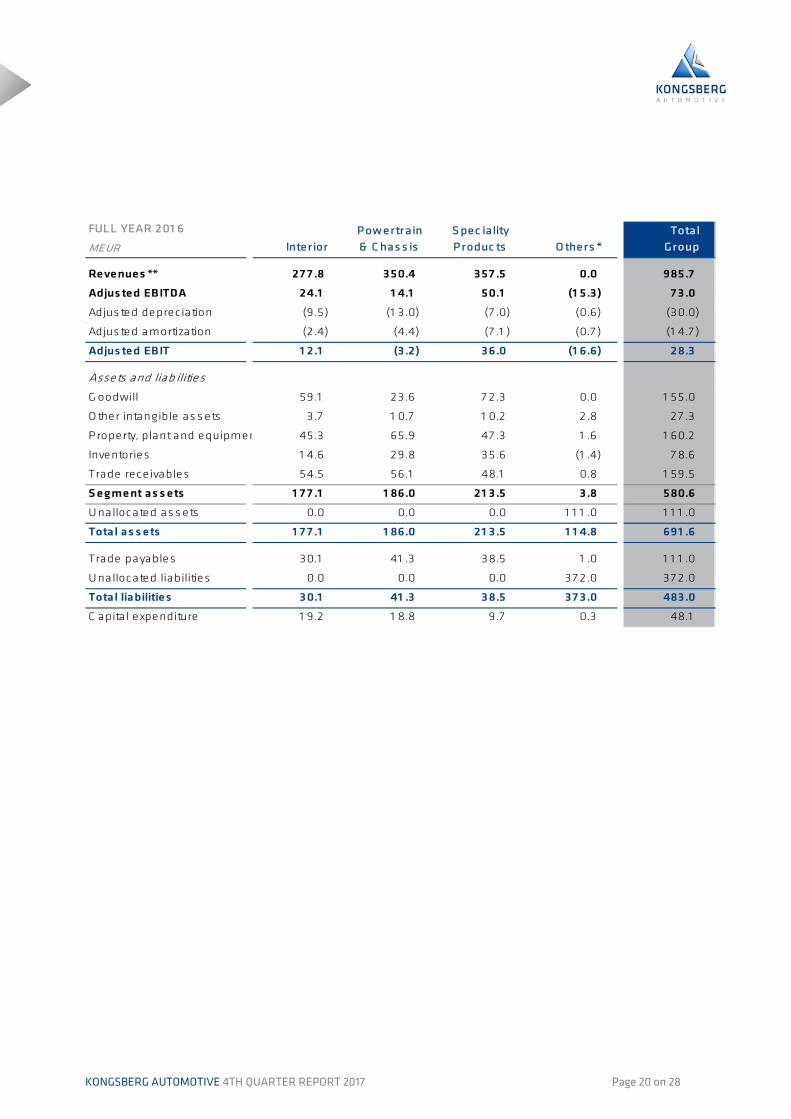
FULL YEAR 201 6 P ow er tr ain S pec iality TotalMEUR Inter ior & C has s is P r oduc ts O ther s * Gr oup
Revenues ** 27 7 .8 350.4 357 .5 0.0 985.7
Adjus ted EBITDA 24.1 1 4.1 50.1 (1 5.3) 7 3.0
Adjus ted deprec iation (9.5) (1 3.0) (7 .0) (0.6) (30.0)
Adjus ted amortization (2.4) (4.4) (7 .1 ) (0.7 ) (1 4.7 )
Adjus ted EBIT 1 2.1 (3.2) 36.0 (1 6.6) 28.3
Assets and liab ilities
G oodwill 59.1 23.6 7 2.3 0.0 1 55.0
O ther intangible as s ets 3.7 1 0.7 1 0.2 2.8 27 .3
P roperty, plant and equipmen 45.3 65.9 47 .3 1 .6 1 60.2
Inventories 1 4.6 29.8 35.6 (1 .4) 7 8.6
Trade rece ivables 54.5 56.1 48.1 0.8 1 59.5
S egment as s ets 1 7 7 .1 1 86.0 21 3.5 3.8 580.6
U nallocated as s ets 0.0 0.0 0.0 1 1 1 .0 1 1 1 .0
Total as s ets 1 7 7 .1 1 86.0 21 3.5 1 1 4.8 691 .6
Trade payables 30.1 41 .3 38.5 1 .0 1 1 1 .0
U nallocated liabilities 0.0 0.0 0.0 37 2.0 37 2.0
Total liabilities 30.1 41 .3 38.5 37 3.0 483.0
C apita l expenditure 1 9.2 1 8.8 9.7 0.3 48.1
KONGSBERG AUTOMOTIVE 4TH QUARTER REPORT 2017 Page 21 on 28
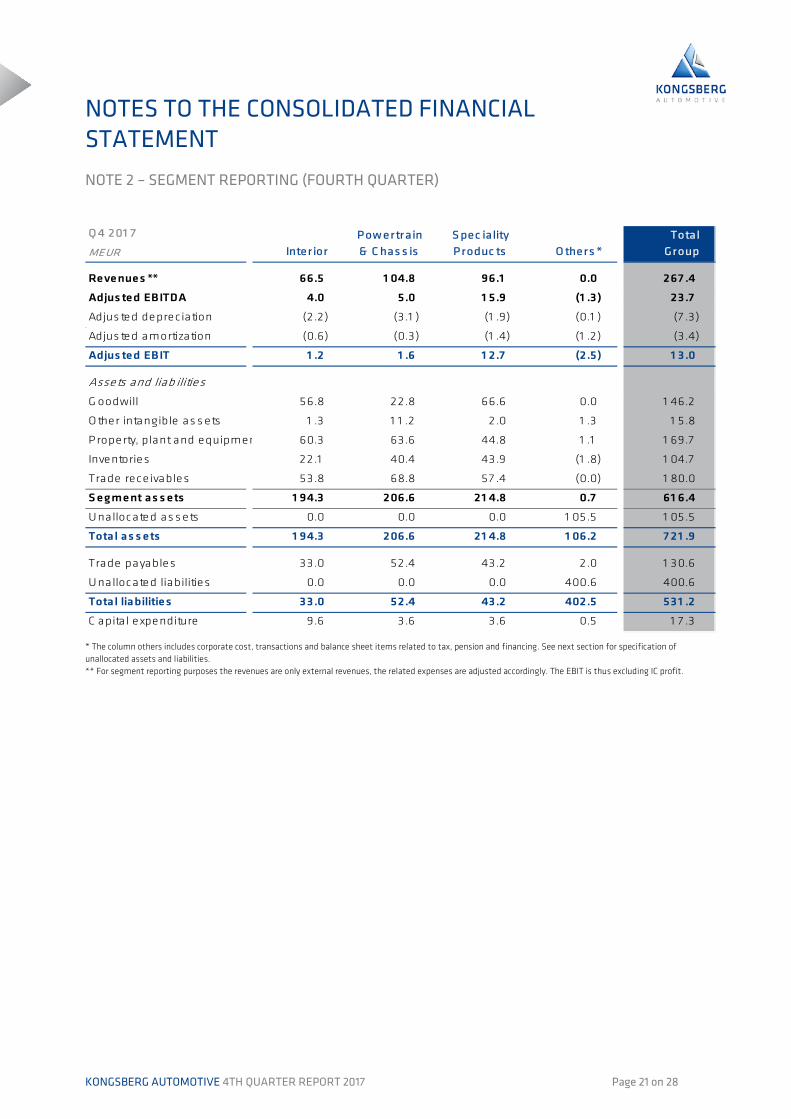
NOTES TO THE CONSOLIDATED FINANCIAL STATEMENT NOTE 2 – SEGMENT REPORTING (FOURTH QUARTER)
Q 4 201 7 P ow er tr ain S pec iality TotalMEUR Inter ior & C has s is P r oduc ts O ther s * Gr oup
Revenues ** 66.5 1 04.8 96.1 0.0 267 .4
Adjus ted EBITDA 4.0 5.0 1 5.9 (1 .3) 23.7
Adjus ted deprec iation (2.2) (3.1 ) (1 .9) (0.1 ) (7 .3)
Adjus ted amortization (0.6) (0.3) (1 .4) (1 .2) (3.4)
Adjus ted EBIT 1 .2 1 .6 1 2.7 (2.5) 1 3.0
Assets and liab ilities
G oodwill 56.8 22.8 66.6 0.0 1 46.2
O ther intangible as s ets 1 .3 1 1 .2 2.0 1 .3 1 5.8
P roperty, plant and equipmen 60.3 63.6 44.8 1 .1 1 69.7
Inventories 22.1 40.4 43.9 (1 .8) 1 04.7
Trade rece ivables 53.8 68.8 57 .4 (0.0) 1 80.0
S egment as s ets 1 94.3 206.6 21 4.8 0.7 61 6.4
U nallocated as s ets 0.0 0.0 0.0 1 05.5 1 05.5
Total as s ets 1 94.3 206.6 21 4.8 1 06.2 7 21 .9
Trade payables 33.0 52.4 43.2 2.0 1 30.6
U nallocated liabilities 0.0 0.0 0.0 400.6 400.6
Total liabilities 33.0 52.4 43.2 402.5 531 .2
C apita l expenditure 9.6 3.6 3.6 0.5 1 7 .3
* The column others includes corporate cost, transactions and balance sheet items related to tax, pension and financing. See next section for specification of unallocated assets and liabilities. ** For segment reporting purposes the revenues are only external revenues, the related expenses are adjusted accordingly. The EBIT is thus excluding IC profit.

KONGSBERG AUTOMOTIVE 4TH QUARTER REPORT 2017 Page 22 on 28
Q 4 201 6 P ow er tr ain S pec iality TotalMEUR Inter ior & C has s is P r oduc ts O ther s * Gr oup
Revenues ** 69.2 93.9 86.7 0.0 249.8
Adjus ted EBITDA 4.3 5.3 1 2.7 (4.0) 1 8.4
Adjus ted deprec iation (1 .8) (3.9) (1 .6) (0.1 ) (7 .3)
Adjus ted amortization (0.6) (1 .1 ) (1 .5) (0.4) (3.7 )
Adjus ted EBIT 1 .9 0.4 9.6 (4.6) 7 .4
Assets and liab ilities
G oodwill 59.1 23.6 7 2.3 0.0 1 55.0
O ther intangible as s ets 3.7 1 0.7 1 0.2 2.8 27 .3
P roperty, plant and equipmen 45.3 65.9 47 .3 1 .6 1 60.2
Inventories 1 4.6 29.8 35.6 (1 .4) 7 8.6
Trade rece ivables 54.5 56.1 48.1 0.8 1 59.5
S egment as s ets 1 7 7 .1 1 86.0 21 3.5 3.8 580.6
U nallocated as s ets 0.0 0.0 0.0 1 1 1 .0 1 1 1 .0
Total as s ets 1 7 7 .1 1 86.0 21 3.5 1 1 4.8 691 .6
Trade payables 30.1 41 .3 38.5 1 .0 1 1 1 .0
U nallocated liabilities 0.0 0.0 0.0 37 2.0 37 2.0
Total liabilities 30.1 41 .3 38.5 37 3.0 483.0
C apita l expenditure 1 0.0 5.1 5.2 0.2 20.6

KONGSBERG AUTOMOTIVE 4TH QUARTER REPORT 2017 Page 23 on 28
NOTES TO THE CONSOLIDATED FINANCIAL STATEMENT NOTE 3 - SALES AND NON-CURRENT ASSETS BY GEOGRAPHICAL LOCATION 3.1 Sales to customers by geographical location
Full year % Full year %
E urope 554.1 52.4% 485.8 49.3%
N orthern America 341 .6 32.3% 385.3 39.1 %
S outhern America 22.9 2.2% 1 6.5 1 .7 %
As ia 1 1 6.7 1 1 .0% 89.7 9.1 %
O ther 21 .3 2.0% 8.3 0.8%
Total operating revenues 1 056.6 985.7
(MEUR)201 7 201 6
Q 4 % Q 4 %
E urope 1 48.8 55.7 % 1 1 5.6 46.3%
N orthern America 82.9 31 .0% 98.4 39.4%
S outhern America 5.0 1 .9% 3.1 1 .3%
As ia 1 9.3 7 .2% 26.1 1 0.5%
O ther 1 1 .4 4.3% 6.5 2.6%
Total operating revenues 267 .4 249.8
(MEUR)201 7 201 6
3.2 Intangible assets and PP&E by geographical location
Dec % Dec %
E urope 1 94.3 58.6% 1 91 .0 55.8%
N orthern America 1 09.9 33.1 % 1 26.5 36.9%
As ia 25.9 7 .8% 22.9 6.7 %
O ther 1 .5 0.5% 2.1 0.6%
Total non-c urrent as s ets 331 .7 342.5
(MEUR)201 7 201 6
KONGSBERG AUTOMOTIVE 4TH QUARTER REPORT 2017 Page 24 on 28
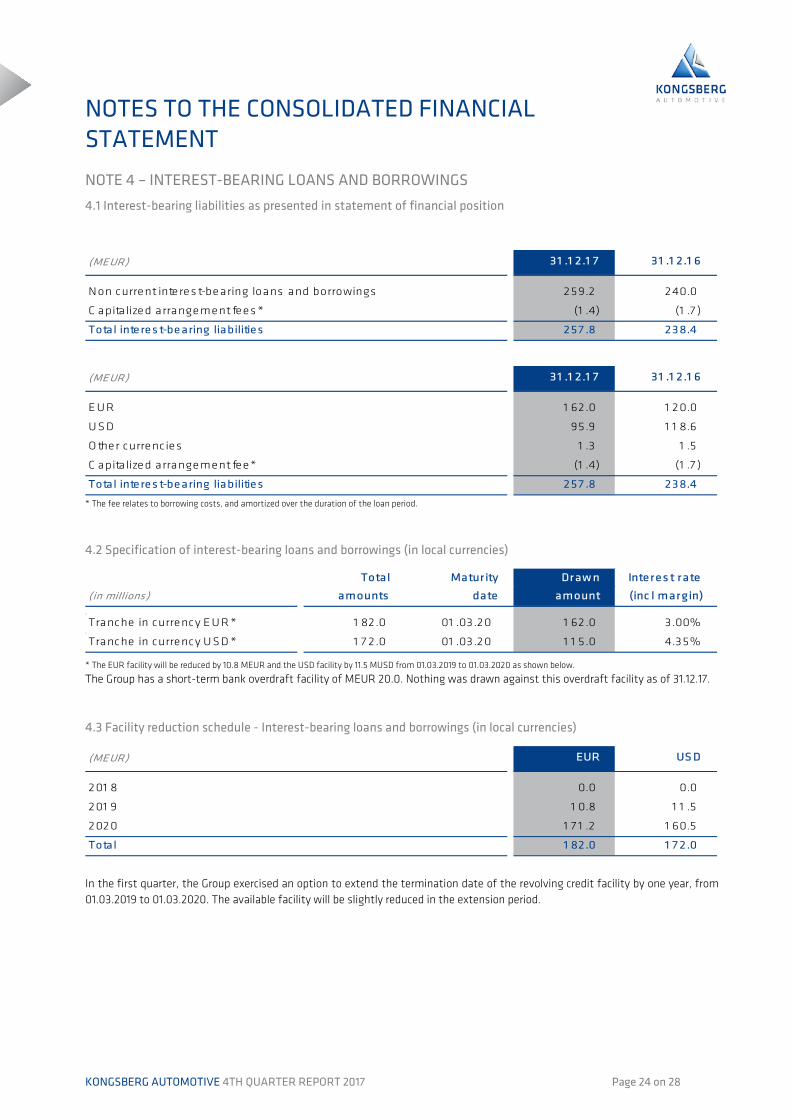
NOTES TO THE CONSOLIDATED FINANCIAL STATEMENT NOTE 4 – INTEREST-BEARING LOANS AND BORROWINGS 4.1 Interest-bearing liabilities as presented in statement of financial position
(MEUR) 31 .1 2.1 7 31 .1 2.1 6
N on current interes t-bearing loans and borrowings 259.2 240.0
C apitalized arrangement fees * (1 .4) (1 .7 )
Total interes t-bearing liabilities 257 .8 238.4 (MEUR) 31 .1 2.1 7 31 .1 2.1 6
E U R 1 62.0 1 20.0
U S D 95.9 1 1 8.6
O ther currenc ies 1 .3 1 .5
C apita lized arrangement fee* (1 .4) (1 .7 )
Total interes t-bearing liabilities 257 .8 238.4 * The fee relates to borrowing costs, and amortized over the duration of the loan period.
4.2 Specification of interest-bearing loans and borrowings (in local currencies)
Total Matur ity Dr aw n Inter es t r ate
(in millions) amounts date amount (inc l mar gin)
Tranche in currency E U R * 1 82.0 01 .03.20 1 62.0 3.00%
Tranche in currency U S D * 1 7 2.0 01 .03.20 1 1 5.0 4.35% * The EUR facility will be reduced by 10.8 MEUR and the USD facility by 11.5 MUSD from 01.03.2019 to 01.03.2020 as shown below.
The Group has a short-term bank overdraft facility of MEUR 20.0. Nothing was drawn against this overdraft facility as of 31.12.17. 4.3 Facility reduction schedule - Interest-bearing loans and borrowings (in local currencies)
(MEUR) EUR US D
201 8 0.0 0.0
201 9 1 0.8 1 1 .5
2020 1 7 1 .2 1 60.5
Total 1 82.0 1 7 2.0
In the first quarter, the Group exercised an option to extend the termination date of the revolving credit facility by one year, from 01.03.2019 to 01.03.2020. The available facility will be slightly reduced in the extension period.
KONGSBERG AUTOMOTIVE 4TH QUARTER REPORT 2017 Page 25 on 28
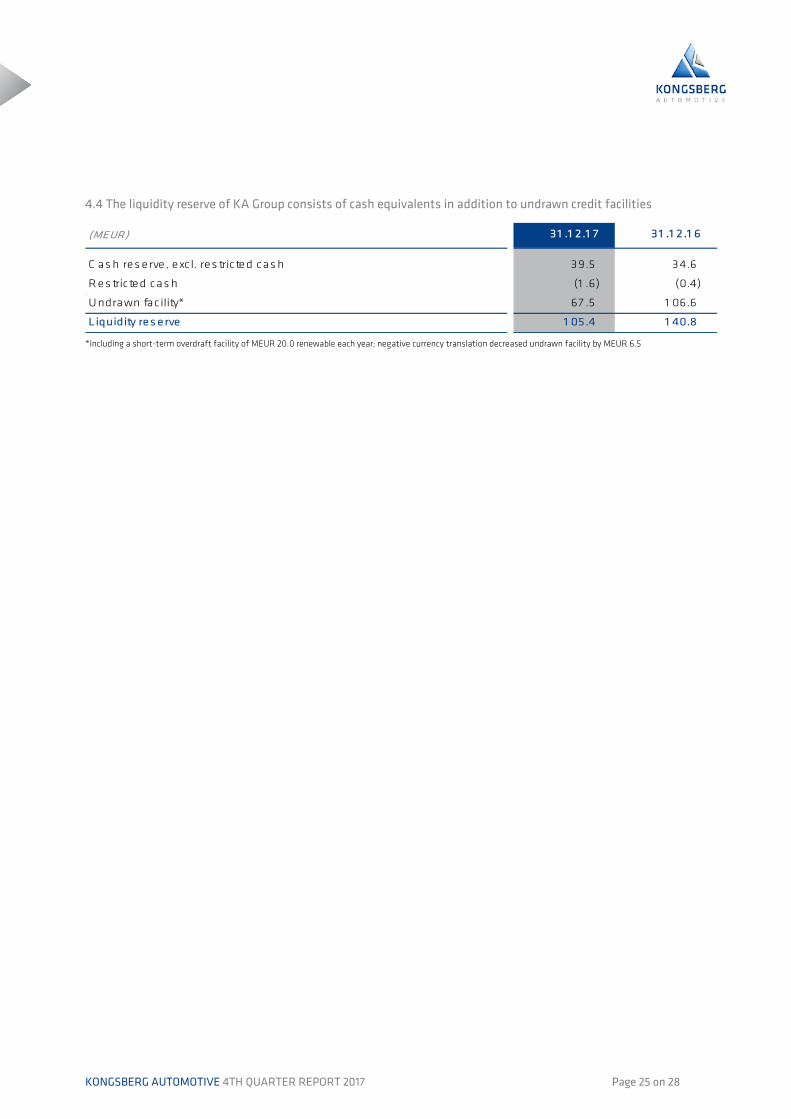
4.4 The liquidity reserve of KA Group consists of cash equivalents in addition to undrawn credit facilities
(MEUR) 31 .1 2.1 7 31 .1 2.1 6
C as h res erve , exc l. res tricted cas h 39.5 34.6
R es tricted cas h (1 .6) (0.4)
U ndrawn fac ility* 67 .5 1 06.6
Liquidity res erve 1 05.4 1 40.8
*Including a short-term overdraft facility of MEUR 20.0 renewable each year; negative currency translation decreased undrawn facility by MEUR 6.5

KONGSBERG AUTOMOTIVE 4TH QUARTER REPORT 2017 Page 26 on 28
NOTES TO THE CONSOLIDATED FINANCIAL STATEMENT NOTE 5 – NET FINANCIAL ITEMS
(MEUR) Q 4 201 7 Q 4 201 6 FY 201 7 FY 201 6
Interes t income 0.1 0.1 0.2 0.2
Interes t expens es (2.9) (1 .6) (1 0.1 ) (6.9)
Fore ign currency gains (los s es )* (7 .4) (7 .5) (5.4) 5.4
C hange in valuation currency contracts (0.1 ) (0.3) (0.7 ) 3.4
O ther financia l items ** (0.3) (0.5) (1 .5) (1 .2)
N et financia l items (1 0.5) (9.8) (1 7 .4) 1 .0
* Includes unrealized currency loss of MEUR 7.8 and realized currency gain of MEUR 0.4 in Q4 2017 (Q4 2016: unrealized loss of MEUR 7.2 and realized losses of MEUR 0.3) ** Other financial items include arrangement fees, interest component on pension liability, and other fees and charges.
NOTE 6 – OTHER EVENTS Burton restructuring On October 5, 2017, KA announced that the Burton plant in the UK will be under consideration as one of the six production facilities that could be closed, and that operations at the plant could potentially cease from April 2018.
E-power On November 24, Kongsberg Automotive and Preh GmbH announced that agreement had been reached to sell the ePower business unit from Kongsberg Automotive to Preh GmbH for an undisclosed price. The transaction was concluded.on 15 January 2018. There is no material financial effect on the group accounts from the sale.

KONGSBERG AUTOMOTIVE 4TH QUARTER REPORT 2017 Page 27 on 28
OTHER COMPANY INFORMATION THE BOARD OF DIRECTORS
Bruce E. Taylor Chairman Thomas Falck Shareholder elected Gunilla Nordstrom Shareholder elected Ellen M. Hanetho Shareholder elected Ernst Kellermann Shareholder elected Jon Ivar Jørnby Employee elected Bjørn Ivan Ødegård Employee elected Kari Brænden Aaslund Employee elected
EXECUTIVE COMMITTEE
Henning E. Jensen President & CEO Norbert Loers Executive Vice President & CFO Anders Nyström Executive Vice President, Interior Systems Bob Riedford Executive Vice President, Powertrain & Chassis Henning E. Jensen Executive Vice President, Specialty Products (acting) Lovisa Söderholm Executive Vice President, Purchasing Virginia Grando Executive Vice President, Quality Marcus von Pock Executive Vice President, Human Resources & Communications Jon Munthe General Counsel
CORPORATE COMMUNICATIONS
Anke Niemann +41 43 508 65 61 Hallstein Kvam Oma Investor relations +41 43 508 89 63
FINANCIAL CALENDAR
Publication of the quarterly financial statements: Interim reports Presentation 4th quarter 2017 28 February 2018 28 February 2018 1st quarter 2018 8 May 2018 8 May 2018 2nd quarter 2018 27 July 2018 27 July 2018 3rd quarter 2018 7 November 2018 7 November 2018
Kongsberg Automotive ASA Operational Headquarters KA Group AG Dyrmyrgata 48 Europaallee 39 3601 Kongsberg, Norway 8004 Zürich, Switzerland Phone +47 32 77 05 00 Phone +41 43 508 65 60 www.kongsbergautomotive.com

Kongsberg Automotive ASA
Dyrmyrgata 483601 KongsbergNorwayTelephone: +47 32 77 05 00
www.kongsbergautomotive.com
Operational HeadquartersKA Group AGEuropaallee 398004 ZürichSwitzerlandTelephone: +41 43 508 65 60