Embed Size (px)
Citation preview
Contacts in Mexico City: Contacts in New York: Francisco Martinez Maria Barona / Rafael Borja Investor Relations Officer i-advize Corporate Communications, Inc. Tel: +52 (55) 5279-8107 Tel: +1 (212) 406-3691 / (212) 406-3691 E-mail: [email protected] E-mail: [email protected] / [email protected]
1
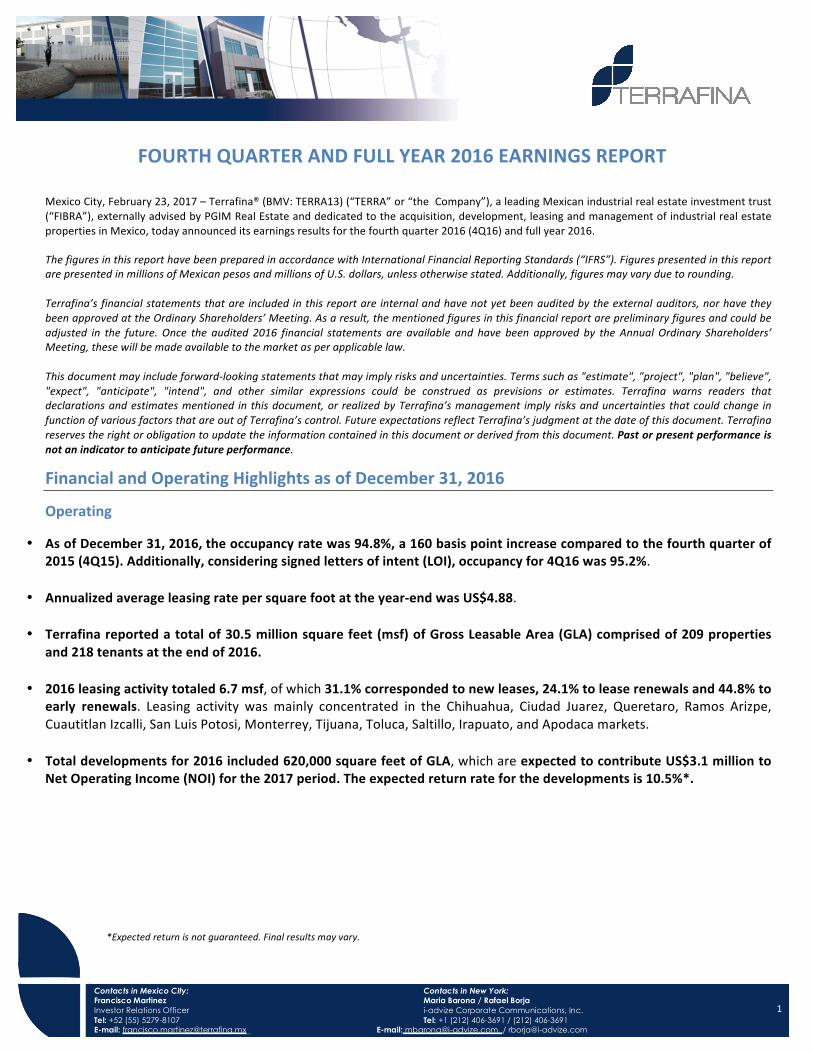
FOURTHQUARTERANDFULLYEAR2016EARNINGSREPORT
MexicoCity,February23,2017–Terrafina®(BMV:TERRA13)(“TERRA”or“theCompany”),aleadingMexicanindustrialrealestateinvestmenttrust(“FIBRA”),externallyadvisedbyPGIMRealEstateanddedicatedtotheacquisition,development,leasingandmanagementofindustrialrealestatepropertiesinMexico,todayannounceditsearningsresultsforthefourthquarter2016(4Q16)andfullyear2016.ThefiguresinthisreporthavebeenpreparedinaccordancewithInternationalFinancialReportingStandards(“IFRS”).FigurespresentedinthisreportarepresentedinmillionsofMexicanpesosandmillionsofU.S.dollars,unlessotherwisestated.Additionally,figuresmayvaryduetorounding.Terrafina’sfinancialstatementsthatare includedinthisreportare internalandhavenotyetbeenauditedbytheexternalauditors,norhavetheybeenapprovedattheOrdinaryShareholders’Meeting.Asaresult,thementionedfiguresinthisfinancialreportarepreliminaryfiguresandcouldbeadjusted in the future. Once the audited 2016 financial statements are available and have been approved by the AnnualOrdinary Shareholders’Meeting,thesewillbemadeavailabletothemarketasperapplicablelaw.Thisdocumentmayincludeforward-lookingstatementsthatmayimplyrisksanduncertainties.Termssuchas"estimate","project","plan","believe","expect", "anticipate", "intend", and other similar expressions could be construed as previsions or estimates. Terrafina warns readers thatdeclarationsandestimatesmentioned in thisdocument,or realizedbyTerrafina’smanagement implyrisksanduncertainties thatcouldchange infunctionofvariousfactorsthatareoutofTerrafina’scontrol.FutureexpectationsreflectTerrafina’sjudgmentatthedateofthisdocument.Terrafinareservestherightorobligationtoupdatetheinformationcontainedinthisdocumentorderivedfromthisdocument.Pastorpresentperformanceisnotanindicatortoanticipatefutureperformance.
FinancialandOperatingHighlightsasofDecember31,2016
Operating
• AsofDecember31,2016,theoccupancyratewas94.8%,a160basispointincreasecomparedtothefourthquarterof2015(4Q15).Additionally,consideringsignedlettersofintent(LOI),occupancyfor4Q16was95.2%.
• Annualizedaverageleasingratepersquarefootattheyear-endwasUS$4.88.
• Terrafinareportedatotalof30.5millionsquarefeet(msf)ofGrossLeasableArea(GLA)comprisedof209propertiesand218tenantsattheendof2016.
• 2016leasingactivitytotaled6.7msf,ofwhich31.1%correspondedtonewleases,24.1%toleaserenewalsand44.8%toearly renewals. Leasing activity wasmainly concentrated in the Chihuahua, Ciudad Juarez, Queretaro, Ramos Arizpe,CuautitlanIzcalli,SanLuisPotosi,Monterrey,Tijuana,Toluca,Saltillo,Irapuato,andApodacamarkets.
• Totaldevelopmentsfor2016included620,000squarefeetofGLA,whichareexpectedtocontributeUS$3.1milliontoNetOperatingIncome(NOI)forthe2017period.Theexpectedreturnrateforthedevelopmentsis10.5%*.
*Expectedreturnisnotguaranteed.Finalresultsmayvary.

2
Financial• FY2016rentalrevenuesreachedUS$131.7million,ofwhichUS$33.4millionweregeneratedduring4Q16;a5.9%or
US$1.9millionincreasecomparedto4Q15.
• FY2016NOIwasUS$131.8million,ofwhichUS$33.1millionweregeneratedduring4Q16;a7.5%orUS$2.3millionincreasecomparedto4Q15.
• TheNOImarginreached92.1%forFY2016and92.9%in4Q16,a180basispointincreasecomparedto4Q15.• FY2016EBITDAreachedUS$118.2million,ofwhichUS$29.6millionweregeneratedin4Q16,anincreaseof9.7%or
US$2.6millioncomparedto4Q15.
• TheEBITDAmarginfor2016was82.5%and82.9%for4Q16,a306basispointincreasecomparedto4Q15.• FY2016adjustedfundsforoperations(AFFO)reachedUS$74.5million,ofwhichUS$20.4millionweregeneratedin
4Q16,anincreaseof23.4%orUS$3.9millioncomparedto4Q15.
• TheAFFOmarginfor2016was52.7%and56.8%in4Q16,a877basispointincreasecomparedto4Q15.• FY2016 distributions totaled US$74.5 million while distributions per CBFI totaled US$0.1227; considering the
averagesharepricefor2016ofUS$1.62(Ps.30.16),Terrafina’sdividendyieldfortheyearwas7.6%.
• 4Q16distributionstotaledUS$20.4million.Asaresult,TerrafinawilldistributePs.0.6593perCBFI (US$0.0355perCBFI)fortheOctober1toDecember31,2016period;consideringtheaveragesharepricefor4Q16ofUS$1.49(Ps.29.48),Terrafina’sdividendyieldfor4Q16was8.9%.

FiguresindollarsintheIncomeStatementwereconvertedintopesosusingtheaverageexchangeratefortheperiod;fortheBalanceSheettheexchangerateforthecloseoftheperiodwasused.(1)Millionsofsquarefeet.(2)IncludesexpansionsandBuilt-to-Suits(BTS).(3)Occupancyattheendoftheperiod.(4)Indicatestheleaserenewalrateof the leases, includesearly renewals. (5)Excludingaccrued incomeas it isanon-cash item (6)Earningsbefore interest, taxes,depreciationandamortization. (7)CertificadosBursátilesFiduciariosInmobiliarios-RealEstateInvestmentCertificates.FiguresindollarsintheBalanceSheetwereconvertedusingtheclosingexchangerateoftheperiod. (*)Revenuesandexpenseshavebeenadjustedforthecalculationoftheabovementionedmetrics.Pleaserefertothe“2016FinancialPerformance"and"Appendices"sectionavailableinthisdocument.Source:PGIMRealEstate–AssetManagement–FundAccounting
3
OperatingandFinancialHighlights
Operating Mar16 Jun16 Sep16 Dec16 Dec15 NumberofDevelopedProperties 209 208 209 209 209 GrossLeasableArea(GLA)(msf)
1 30.1 30.0 30.1 30.1 29.9 NewDevelopments2(msf) 0.25 0.20 0.43 0.62 0.88 LandReserves(msf) 6.40 6.40 6.40 6.40 6.40 OccupancyRate3 93.3% 93.2% 92.8% 94.8% 93.2% Avg.LeasingRent/SquareFoot(dollars) 4.89 4.88 4.89 4.88 4.88 WeightedAverageRemainingLeaseTerm(years) 3.65 3.51 3.49 3.49 3.67 RenewalRate4 87.7% 87.7% 85.5% 85.0% 93.7%
AccumulatedFinancial Mar16 Jun16 Sep16 Dec16 Dec15 Mar16 Jun16 Sep16 Dec16 Dec15
fx 18.0667 18.0677 18.2853 18.6672 15.8469
(millionsofpesosunlessotherwisestated) (millionsofdollarsunlessotherwisestated)
RentalRevenues5 589.0 1,183.9 1,799.4 2,460.2 2,032.5 32.6 65.5 98.4 131.7 128.3OtherOperatingIncome 75.0 132.7 173.2 208.1 166.6 4.2 7.3 9.5 11.3 10.7NetRevenues 675.0 1,336.4 2,000.0 2,703.0 2,197.2
37.4 74.0 109.4 145.0 138.9
NetOperatingIncome(NOI)* 573.9 1,170.6 1,805.3 2,459.7 1,957.8
31.8 64.8 98.7 131.8 123.6NOIMargin 87.0% 88.5% 89.5% 92.1% 89.9% 87.0% 88.5% 89.5% 92.1% 89.9%
EBITDA6* 516.1 1,049.2 1,620.0 2,204.4 1,734.7 28.5 58.1 88.6 118.2 109.7EBITDAMargin 78.2% 79.2% 79.7% 82.5% 79.8% 78.2% 79.2% 79.7% 82.5% 79.8%FundsfromOperations(FFO)* 355.7 728.6 1,132.2 1,549.5 1,327.8 19.6 40.3 61.9 83.0 84.0FFOMargin 53.8% 61.4% 62.2% 58.0% 61.1% 53.8% 61.4% 62.2% 58.0% 61.1%AdjustedFundsfromOperations(AFFO)* 300.8 644.0 990.4 1,390.8 1,159.2
16.6 35.6 54.1 74.5 73.4
AFFOMargin 45.1% 55.8% 54.6% 52.7% 53.1%
45.1% 55.8% 54.6% 52.7% 53.1%Distributions 300.8 644.0 990.4 1,390.8 1,159.2 16.6 35.6 54.1 74.5 73.4DistributionsperCBFI7 0.4951 1.0601 1.6303 2.2904 1.9090 0.0273 0.0586 0.0891 0.1227 0.1210
QuarterlyFinancial 1Q16 2Q16 3Q16 4Q16 4Q15 1Q16 2Q16 3Q16 4Q16 4Q15
fx 18.0667 18.0687 18.7204 19.8128 16.7515
(millionsofpesosunlessotherwisestated) (millionsofdollarsunlessotherwisestated)
RentalRevenues 589.0 594.9 615.5 660.8 527.5 32.6 32.9 32.9 33.4 31.5OtherOperatingIncome 75.0 57.7 40.5 52.1 43.5
4.2 3.2 2.2 2.8 2.6
NetRevenues 675.0 661.5 663.5 720.3 575.6
37.4 36.6 35.5 36.5 34.4NetOperatingIncome(NOI)* 573.9 596.7 634.8 654.3 516.0 31.8 33.0 33.9 33.1 30.8NOIMargin 87.0% 94.3% 94.3% 92.9% 91.1% 87.0% 94.3% 94.3% 92.9% 91.1%EBITDA* 516.1 533.2 570.7 584.4 451.9 28.5 29.6 30.5 29.6 27.0EBITDAMargin 78.2% 84.3% 84.8% 82.9% 79.9% 78.2% 84.3% 84.8% 82.9% 79.9%FundsfromOperations(FFO)* 355.7 372.9 403.7 417.3 326.3
19.6 20.7 21.6 21.1 19.5
FFOMargin 53.8% 59.0% 60.0% 59.2% 57.7%
53.8% 59.0% 60.0% 59.2% 57.7%AdjustedFundsfromOperations(AFFO)* 300.8 343.3 346.4 400.4 275.7 16.6 19.0 18.5 20.4 16.4AFFOMargin 45.1% 53.9% 52.9% 56.8% 48.1% 45.1% 53.9% 52.9% 56.8% 48.1%Distributions 300.8 343.3 346.4 400.4 275.7 16.6 19.0 18.5 20.4 16.5DistributionsperCBFI 0.4951 0.5650 0.5703 0.6593 0.4541 0.0273 0.0313 0.0305 0.0335 0.0271

FiguresindollarsintheBalanceSheetwereconvertedusingtheclosingexchangerateoftheperiod.Source:PGIMRealEstate–AssetManagement–FundAccounting
F 4
BalanceSheet Mar16 Jun16 Sep16 Dec16 Dec15 Mar16 Jun16 Sep16 Dec16 Dec15
fx 17.4015 18.9113 19.5002 20.6640 17.2065
(millionsofpesosunlessotherwisestated) (millionsofdollarsunlessotherwisestated)
Cash&CashEquivalents 4,454.8 4,661.8 4,838.8 4,297.1 4,467.9 256.0 246.5 248.1 208.0 259.7InvestmentProperties 28,906.1 31,423.9 32,316.6 34,719.7 28,678.7 1,661.1 1,661.6 1,657.2 1,680.2 1,666.7LandReserves 827.2 924.4 955.7 1,041.5 827.2 47.5 48.9 49.0 50.4 48.1TotalDebt 12,276.7 13,616.1 14,146.4 14,561.5 12,215.6 705.5 720.0 725.5 704.7 709.9NetDebt 7,821.8 8,954.4 9,307.6 10,264.4 7,747.8 449.5 473.5 477.3 496.7 450.3

F
5
CommentbyAlbertoChretin,ChiefExecutiveOfficerandChairmanoftheBoardDearInvestors,
Terrafina achieved solid operating and financial results that were in line with our growth objectives for 2016. Wereachedanall-timehighoccupancylevelsof94.8%,whilemaintainingstableaverageleasingratesofUS$4.88persquarefoot.Leasingactivityfor2016reached6.7millionsquarefeet,whichwasthedirectresultofthededicationofourteamof property managers who are focused on offering top service to our tenants. Additionally, the strength of ouroperationswasreflectedinthehighrenewalvolumethatreachedatotalof4.6millionsquarefeetatanaverageannualrenewal rate of 86.5%. Despite a weakening macroeconomic environment, Terrafina has successfully prevailed. TheCompanyhasdemonstrateditsforemostexecutioncapabilitiesbyclosingnewleasingcontractsandearlyrenewalswithmultinational companies in the major business sectors geared towards export manufacturing such as aviation,automotiveandindustrialaswellasthelogisticsanddistributionsector.
Intermsofoccupancyandaverage leasingratesbymarketfor2016,thenorthernregionreached levelsof96.0%andUS$4.78persquarefoot,mainlydrivenbythemarketsofChihuahua,CiudadJuarez,RamosArizpe,Monterrey,Tijuana,Saltillo,andApodaca.IntheBajioregion,occupancywas92.3%withanaverageleasingratepersquarefootofUS$4.94withhighactivity in themarketsofQueretaro,SanLuisPotosi, and Irapuato.Finally, in thecentral region,occupancyreached94.6%withanaverageleasingrateofUS$5.08drivenbythemarketsofCuautitlanIzcalliandToluca.
Amongthemainfinancialmetricsfor2016IwanttohighlightrentalrevenuesofUS$131.7million,NetOperatingIncomeofUS$131.8millionwithanNOImarginof92.1%,EBITDAofUS$118.2millionwithanEBITDAmarginof82.5%,aswellasan AFFO of US$74.5million. CBFI distribution levels for 2016 reached 2.2904 peso cents per certificate, that is US$0.1227percertificateandadividendyieldof7.6%,consideringtheaverageCBFIpriceduring2016.
Intermsofacquisitions,in2016weconcludedtheadministrativeprocessesnecessarytoclosethetransactionthatwasannouncedinJanuary2017,foratotalofUS$422million.Thistransactionincluded51ClassAindustrialpropertieswith100%dollar-denominatedcontractsandtriple-netstructures.ThesepropertieswillstrengthenTerrafina’spositioningbyincreasing occupancy and average leasing levels as well as distributions. Looking ahead, the Company will continueevaluatingpotentialacquisitionsforthecomingyearstofurtherconsolidateourleadershippositionintheindustrialrealestatemarketinMexico.Aspartofthefinancingstrategy,duringthefourthquarterof2016,theCompanyconcludedthefirstrefinancingphaseforUS$150millionofanunsecuredcredit line,whichwillgeneratesavingswithamorecompetitive interestrate.TheCompanywasalsoabletoclosethesecondrefinancingphaseforanadditionalUS$150millioninFebruary2017;thesenegotiationstookplaceduringthelastpartof2016andareevidenceoftheconfidencegrantedbyfinancialinstitutionsinTerrafina’soperations.
I wish to conclude by stating that we will continue to work diligently on behalf of our investors during 2017,preservingapositiveoutlookintermsofacquisitionopportunitiesaswellasinstrengtheningtenantrelationshipsbyoffering themoptions to expand their operations.With this, allowme to reiterate our commitment to generatinggreaterprofitabilityforTerrafinawhilemaintainingoperatingstabilityinthelongterm.
OnbehalfofTerrafina,wethankyouforyourcontinuoussupport.Sincerely,AlbertoChretin
ChiefExecutiveOfficerandChairmanoftheBoard

6
OperatingHighlights
HighlightsbyRegion
(asofDecember31,2016) North Bajio Central Total
#Buildings 133 47 29 209
#Tenants 133 48 38 218
GLA(msf) 16.5 7.5 6.1 30.1
NewDevelopments1(msf) 0.3 0.3 0.0 0.6
LandReserves(msf) 3.0 0.1 3.3 6.4
OccupancyRate 96.0% 92.3% 94.6% 94.8%
AverageLeasingRent/SquareFoot(dollars) 4.78 4.94 5.08 4.88
AnnualizedRentalBase% 54.2% 24.7% 21.1% 100.0%
(1)IncludesexpansionsandBuilt-to-Suit(BTS).Source:PGIMRealEstate-AssetManagement
LeasingActivity 4Q16 4Q15 Var.
OperatingPortfolio(msf): Renewals 0.6 1.1 -0.5
EarlyRenewals 1.1 1.9 -0.8
NewLeases 0.7 0.3 0.4
TotalSquareFeetofLeasesSigned 2.4 3.3 -0.9Source:PGIMRealEstate-AssetManagement
NORTH - BajaCalifornia- Sonora- Chihuahua- Coahuila- NuevoLeón- Tamaulipas- Durango
BAJIO - SanLuisPotosí- Jalisco- Aguascalientes- Guanajuato- Querétaro
CENTRAL - EstadodeMéxico- MexicoCity- Puebla- Tabasco
Terrafina’soperations4Q16.
29.6%
70.4%
ComposieonbyAssetTypeasof4Q16
(asa%oftotalGLA)
Distribunon Manufacturing

7
OperatingHighlights(continued)OccupancyandRentsbyRegion MaturitiesandRenewalsbyRegion
0
Consolidated
(AsofDecember31,2016)
OccupancyRate
Avg.LeasingRent/SquareFoot(dollars) (AsofDecember31,2016)
Maturities(numberofcontracts)
%ofTotalMaturities
Renewals(numberofcontracts)
%ofTotal
RenewalsNorth 96.0% 4.78 North 15 78.9% 11 73.3%BajaCalifornia 100.0% 4.69 BajaCalifornia 1 0.0% 1 100.0%Tijuana 100.0% 4.69 Tijuana 1 0.0% 1 100.0%
Sonora 86.3% 4.19 Sonora 1 0.0% 1 100.0%Hermosillo 86.3% 4.19 Hermosillo 1 0.0% 1 100.0%
Chihuahua 96.7% 4.94 Chihuahua 9 47.4% 6 66.7%Chihuahua 96.7% 5.47 Chihuahua 5 26.3% 3 60.0%CiudadJuarez 96.4% 4.50 CiudadJuarez 3 15.8% 3 100.0%Delicias 100.0% 5.59 Delicias 0 0.0% 0 0.0%GomezFarias 100.0% 3.34 GomezFarias 0 0.0% 0 0.0%Camargo 100.0% 3.78 Camargo 1 0.0% 0 0.0%CasasGrandes 100.0% 4.09 CasasGrandes 0 0.0% 0 0.0%
Coahuila 96.0% 4.46 Coahuila 2 10.5% 1 50.0%CiudadAcuña 100.0% 5.99 CiudadAcuña 0 0.0% 0 0.0%Monclova 100.0% 5.33 Monclova 0 0.0% 0 0.0%RamosArizpe 96.6% 4.13 RamosArizpe 2 10.5% 1 50.0%Saltillo 91.0% 5.30 Saltillo 0 0.0% 0 0.0%SanPedrodelasColinas 89.3% 1.00 SanPedrodelasColinas 0 0.0% 0 0.0%Torreon 100.0% 4.10 Torreon 0 0.0% 0 0.0%
NuevoLeon 90.0% 5.11 NuevoLeon 2 10.5% 2 100.0%Apodaca 86.8% 5.95 Apodaca 1 0.0% 1 100.0%Monterrey 91.2% 4.80 Monterrey 1 5.3% 1 100.0%
Tamaulipas 88.6% 4.45 Tamaulipas 0 0.0% 0 0.0%Reynosa 88.6% 4.45 Reynosa 0 0.0% 0 0.0%
Durango 100.0% 3.90 Durango 0 0.0% 0 0.0%Durango 100.0% 4.04 Durango 0 0.0% 0 0.0%GomezPalacio 100.0% 3.09 GomezPalacio 0 0.0% 0 0.0%
Bajio 92.3% 4.94 Bajio 3 15.8% 2 66.7%SanLuisPotosi 89.5% 4.93 SanLuisPotosi 0 0.0% 0 0.0%SanLuisPotosi 89.5% 4.93 SanLuisPotosi 0 0.0% 0 0.0%
Jalisco 100.0% 5.52 Jalisco 2 10.5% 1 50.0%Guadalajara 100.0% 5.52 Guadalajara 2 10.5% 1 50.0%
Aguascalientes 100.0% 4.61 Aguascalientes 0 0.0% 0 0.0%Aguascalientes 100.0% 4.61 Aguascalientes 0 0.0% 0 0.0%
Guanajuato 95.9% 5.06 Guanajuato 0 0.0% 0 0.0%Celaya 100.0% 5.07 Celaya 0 0.0% 0 0.0%Irapuato 86.5% 5.59 Irapuato 0 0.0% 0 0.0%Silao 100.0% 4.81 Silao 0 0.0% 0 0.0%
Queretaro 87.0% 4.63 Queretaro 1 5.3% 1 100.0%Queretaro 87.0% 4.63 Queretaro 1 5.3% 1 100.0%
Central 94.6% 5.08 Central 1 5.3% 1 100.0%EstadodeMexico 93.7% 5.36 EstadodeMexico 1 5.3% 1 100.0%CuautitlanIzcalli 100.0% 5.35 CuautitlanIzcalli 0 0.0% 0 0.0%Toluca 88.8% 5.40 Toluca 1 5.3% 1 100.0%
MexicoCity 100.0% 8.80 MexicoCity 0 0.0% 0 0.0%Azcapotzalco 100.0% 8.80 Azcapotzalco 0 0.0% 0 0.0%
Puebla 100.0% 2.89 Puebla 0 0.0% 0 0.0%Puebla 100.0% 2.89 Puebla 0 0.0% 0 0.0%
Tabasco 100.0% 3.50 Tabasco 0 0.0% 0 0.0%Villahermosa 100.0% 3.50 Villahermosa 0 0.0% 0 0.0%
Total 94.8% 4.88 Total 19 100.0% 14 73.7%Source:PGIMRealEstate-AssetManagement
Source:PGIMRealEstate-AssetManagement
*Overthenumberofmaturedleasesinthequarter

8
2016OperationalPerformanceCompositionbyGeographicalDiversificationThe geographical diversification of Terrafina’s properties at the close of 2016 (based on GLA per square foot) was asfollows:theNorthernregionofMexicorepresented54.7%oftheGLA,whiletheBajioandCentralregionsrepresented25.0%and20.3%oftheGLA,respectively.
GeographicDistributionbyRegionandState
4Q16 asa%ofTotal
GLA4Q16 4Q15 asa%ofTotalGLA4Q15
North 16.47 54.7% 15.79 55.9%BajaCalifornia 1.13 3.7% 1.13 4.0%Tijuana 1.13 3.7% 1.13 4.0%
Sonora 0.28 0.9% 0.28 1.0%Hermosillo 0.28 0.9% 0.28 1.0%
Chihuahua 9.61 31.9% 9.41 33.3%Chihuahua 4.13 13.7% 4.13 14.6%CiudadJuarez 5.00 16.6% 4.80 17.0%Delicias 0.29 1.0% 0.29 1.0%GomezFarias 0.08 0.3% 0.08 0.3%Camargo 0.02 0.1% 0.02 0.1%CasasGrandes 0.09 0.3% 0.09 0.3%
Coahuila 3.49 11.6% 3.38 12.0%CiudadAcuña 0.24 0.8% 0.24 0.9%Monclova 0.34 1.1% 0.34 1.2%RamosArizpe 2.00 6.6% 1.89 6.7%Saltillo 0.62 2.1% 0.62 2.2%SanPedrodelasColinas 0.15 0.5% 0.15 0.5%Torreon 0.13 0.4% 0.13 0.5%
NuevoLeon 1.16 3.9% 0.77 2.7%Apodaca 0.32 1.1% 0.00 0.0%CienegadeFlores 0.00 0.0% 0.00 0.0%Monterrey 0.84 2.8% 0.77 2.7%
Tamaulipas 0.34 1.1% 0.34 1.2%Reynosa 0.34 1.1% 0.34 1.2%
Durango 0.46 1.5% 0.46 1.6%Durango 0.40 1.3% 0.40 1.4%GomezPalacio 0.07 0.2% 0.07 0.2%
Bajio 7.55 25.0% 6.45 22.9%SanLuisPotosi 2.75 9.1% 1.89 6.7%SanLuisPotosi 2.75 9.1% 1.89 6.7%
Jalisco 1.29 4.3% 1.29 4.6%Guadalajara 1.29 4.3% 1.29 4.6%
Aguascalientes 0.75 2.5% 0.75 2.6%Aguascalientes 0.75 2.5% 0.75 2.6%
Guanajuato 0.78 2.6% 0.54 1.9%Celaya 0.12 0.4% 0.12 0.4%Irapuato 0.24 0.8% 0.00 0.0%Silao 0.42 1.4% 0.42 1.5%
Queretaro 1.98 6.6% 1.98 7.0%Queretaro 1.98 6.6% 1.98 7.0%
Central 6.12 20.3% 6.00 21.2%EstadodeMexico 5.26 17.5% 5.14 18.2%CuautitlanIzcalli 4.12 13.7% 4.00 14.2%Huehuetoca 0.91 3.0% 0.23 0.8%Toluca 0.23 0.8% 0.91 3.2%
MexicoCity 0.02 0.1% 0.02 0.1%Azcapotzalco 0.02 0.1% 0.02 0.1%
Puebla 0.18 0.6% 0.18 0.7%Puebla 0.18 0.6% 0.18 0.7%
Tabasco 0.65 2.2% 0.65 2.3%Tabasco 0.65 2.2% 0.65 2.3%
Total 30.14 100.0% 28.24 100.0%TotalGrossLeasableArea/millionsquarefeet.Potentialleasableareaoflandreservesarenotincluded.
Source:PGIMRealEstate-AssetManagement
9
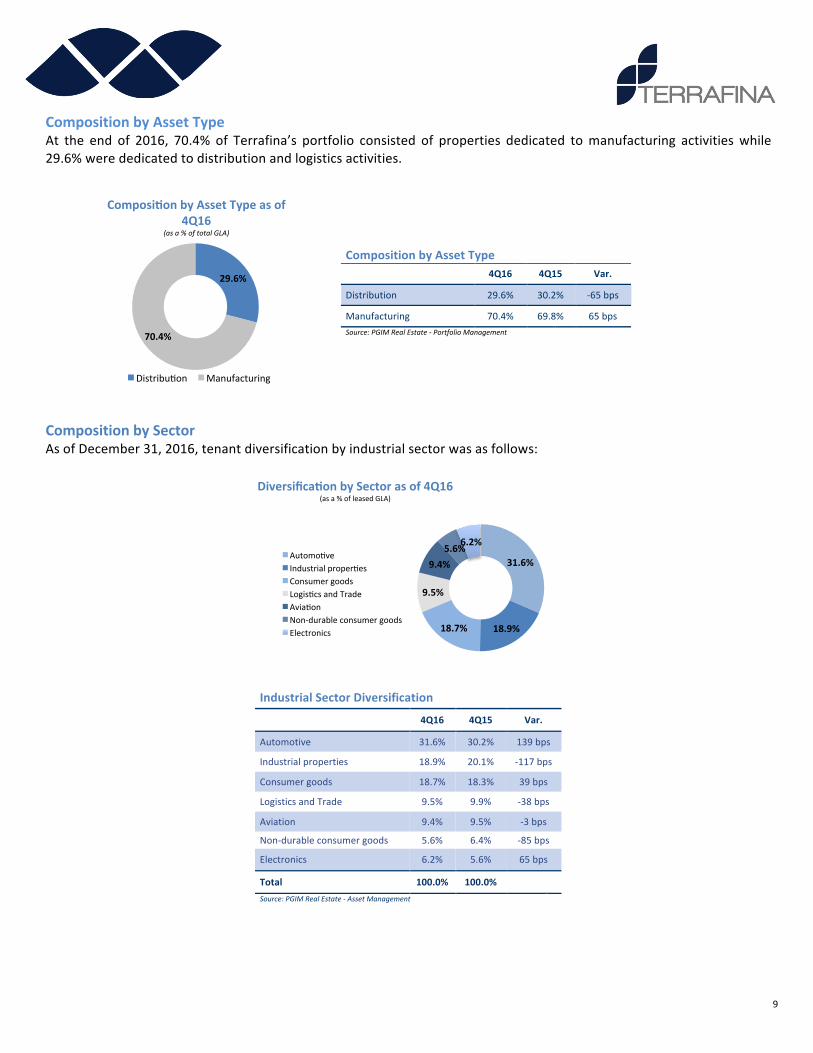
CompositionbyAssetTypeAt the end of 2016, 70.4% of Terrafina’s portfolio consisted of properties dedicated tomanufacturing activitieswhile29.6%werededicatedtodistributionandlogisticsactivities.
CompositionbySectorAsofDecember31,2016,tenantdiversificationbyindustrialsectorwasasfollows:
IndustrialSectorDiversification 4Q16 4Q15 Var.
Automotive 31.6% 30.2% 139bps
Industrialproperties 18.9% 20.1% -117bps
Consumergoods 18.7% 18.3% 39bps
LogisticsandTrade 9.5% 9.9% -38bps
Aviation 9.4% 9.5% -3bps
Non-durableconsumergoods 5.6% 6.4% -85bps
Electronics 6.2% 5.6% 65bps
Total 100.0% 100.0%
Source:PGIMRealEstate-AssetManagement
CompositionbyAssetType
4Q16 4Q15 Var.
Distribution 29.6% 30.2% -65bps
Manufacturing 70.4% 69.8% 65bpsSource:PGIMRealEstate-PortfolioManagement
29.6%
70.4%
ComposieonbyAssetTypeasof4Q16
(asa%oftotalGLA)
Distribunon Manufacturing
31.6%
18.9%18.7%
9.5%
9.4%5.6%6.2%
DiversificaeonbySectorasof4Q16(asa%ofleasedGLA)
AutomonveIndustrialpropernesConsumergoodsLogisncsandTradeAvianonNon-durableconsumergoodsElectronics

10
CompositionofTopClientsTerrafinahasawidelydiversifiedtenantbasethatleaseindustrialpropertiesthroughoutseveralofMexico’smaincities.Attheendof2016,Terrafina’stopclient,top10clientsandtop20clients,represented4.4%,21.9%and33.3%oftotalrevenues,respectively.
TopClients
(asofDecember31,2016) LeasedSquareFeet(millions)
%TotalGLA %TotalRevenues
TopClient 1.24 4.3% 4.4%
Top10Clients 6.19 21.7% 21.9%
Top20Clients 9.54 33.4% 33.3%Source:PGIMRealEstate-AssetManagement
OccupancyFY2016occupancyratewas94.8%,a160basispoint increasecomparedto4Q15.IncludingsignedLOIsforthequarter,theoccupancyratewas95.2%.Itisimportanttonotethatoccupancyrateindicatorspresentedinthisreportreflectonlythequarterlyclosingrate.For 4Q16, Terrafina’s leasing activity reached 2.4msf, ofwhich 30.3% correspond to new leasing contracts (includingexpansions),23.0%forcontractrenewalsand46.7%forearlyrenewals.
LeasingactivitymainlytookplaceintheChihuahua,CuautitlanIzcalli,Queretaro,SanLuisPotosi,Saltillo,CiudadJuarez,Tijuana, Toluca, Monterrey, Ramos Arizpe, Apodaca, Guadalajara and Hermosillo markets. In addition to this leasingactivity,Terrafinasignedanadditional101,000squarefeetinLOIs.
LeaseMaturitiesTerrafinahad218tenantsunderleasingcontractsattheendof2016.Theleasingcharacteristicsofthesecontractshavean average maturity of three to five years for logistics and distribution properties and of five to seven years formanufacturingproperties.Annualaveragematurities(asapercentageofannualbaserents)remainatlevelsofbetween11%to20%forthenextfiveyears.
94.8%
4.8%0.3%
Occupancyasof4Q16(as%ofTotalGLA)
LeasedGLAVacantGLASignedLerersofIntent
4Q16 4Q15 Var.
LeasedGLA 94.8% 93.2% 162bps
VacantGLA 4.8% 6.1% -128bps
SignedLettersofIntent 0.3% 0.7% -34bps
Total 100.0% 100.0%
Source:PGIMRealEstate-AssetManagement

11
ThefollowingtablebreaksdownTerrafina’sleasingmaturityschedulefortheupcomingyears:
Annual
BaseRent(millionsofdollars)
%ofTotalOccupiedSq.Ft(millions) %ofTotal
2017 14.2 10.3% 3.25 11.5%2018 20.5 14.8% 4.12 14.6%2019 26.4 19.1% 5.59 19.7%2020 29.6 21.4% 5.86 20.7%2021 20.0 14.5% 3.99 14.1%Thereafter 27.5 19.9% 5.49 19.4%Source:PGIMRealEstate–AssetManagement
CapitalDeploymentNewDevelopmentsInFY2016,Terrafinacompleted620,000squarefeetofnewdevelopments.Thesenewdevelopmentsweredistributedasfollows:51.0%inthenorthernregionand49.0%intheBajioregion.These new developments will contribute US$3.1 million to 2017 NOI, with a 10.5% estimated development yield,consideringatotalexpectedinvestmentofUS$29.4million.
((1)NetOperatingIncomeforthenexttwelvemonths.(2)ProformaNOIdividedbythetotalexpectedinvestment.Proformafiguresarenotaguaranteeoffutureresults.Source:PGIMRealEstate–AssetManagement
January-December2016
SquareFeet(millions)
TotalExpectedInvestment
(millionsofpesos)
TotalExpected
Investment3(millionsofdollars)
CostperSquareFeet
(dollars)
%PayingRentbyEndofthePeriod
North 0.32 323.9 15.7 49.61 0.0%
Bajio 0.30 283.5 13.7 45.25 0.0%
Central 0.00 0.0 0.0 0.00 0.0%
Total 0.62 607.4 29.4 47.47 0.0%
ProformaNOI1(millionsofdollars) 3.1
EstimatedStabilizedYield2 10.5%
ProjectsUnderDevelopment 4Q16 4Q15
DevelopedProperties 99.1% 97.8%
PropertiesUnderDevelopment 0.9% 2.2%
Total 100.0% 100.0%
Source:PGIMRealEstate-PortfolioManagement

12
CapitalExpenditures(CAPEX)Terrafina’sCAPEXisclassifiedasrecurringexpensesthattookplacebasedonupcomingleasingmaturitiesandpropertyimprovements. The main goal of these expenses is the renewal of leasing contracts as well as the improvement ofpropertyconditionstakingintoaccounttenantrequirements.TerrafinaexpectstoapplyCAPEXtowardsvacantpropertiesaswellastowardsthedevelopmentofnewGLAbymeansofexpansionsand/ornewdevelopments.
Additionally,itisimportanttoconsiderthatCAPEXintendedforexpansionsandnewdevelopmentsarenotfinancedwithTerrafina’soperatingcashflowandthereforedonotpassthroughtheincomestatement.
Capitalexpendituresaccountsarecomprisedasfollows:1) TenantimprovementsresourcesaswellasrecurringmaintenanceCAPEX.2) Brokerandadministratorfees.3) CAPEXfornewdevelopments,whichduetotheirnature,aregenerallycapitalized.InFY2016,Terrafina’stenantimprovementsandrecurringCAPEXwasUS$6.2million.TotalCAPEXbreakdownfor2016isshowninthefollowingtable:
CapitalExpenditures 4Q16 4Q16 2016 2016
(millionsofpesos)
(millionsofdollars)
(millionsofpesos)
(millionsofdollars)
TenantImprovements&RecurringCapex 33.6 1.7 116.0 6.2LeasingCommissions 15.6 0.8 64.3 3.5DevelopmentCapex1 73.8 3.7 286.0 15.3
TotalCapitalExpenditures 123.0 6.2 466.4 25.0
MaintenanceexpensesforvacantpropertiesareincludedintheTenantImprovements&RecurringCapexfigures.
(1)Capexforexpansions/newdevelopments.Source:PGIMRealEstate-AssetManagement
LandReservesTerrafina’slandreserveasofDecember31,2016wascomprisedof11landreserveproperties,equivalentto6.4msfofpotentialGLAforthedevelopmentoffutureindustrialproperties.AsofDecember31,2016,Terrafina’slandreservesweredistributedasfollows:
AsofDecember31,2016
SquareFeet
(millions)
LandatCost
(millionsofpesos)
LandatCost
(millionsofdollars)
AppraisalValue
(millionsofpesos)
MarketValue
(millionsofdollars)
North 3.0 570.7 27.6 582.5 28.2Bajio 0.1 14.7 0.7 15.3 0.7Central 3.3 767.5 37.1 443.7 21.5
TotalLandPortfolio 6.4 1,352.9 65.4 1,041.5 50.4Source:PGIMRealEstate-AssetManagementandFundAccounting

13
2016FinancialPerformanceFinancialResultsandCalculationsTerrafina’s financial resultsarepresented inMexicanpesosandU.S.dollars.Figuresonthe incomestatement foreachperiodwereconverted todollarsusing theaverageexchange rate for2016,while for thebalancesheet, theexchangerateatthecloseofDecember31,2016wasapplied.Terrafina has in place best accounting practices for measuring the FIBRA’s (REIT) performance results by providingrelevant metrics to the financial community. Throughout the following financial performance section, additionalcalculations are available. It is important to note that these metrics must not be considered individually to evaluateTerrafina’sresults.ItisrecommendedtousethemincombinationwithotherInternationalFinancialReportingStandardsmetricstomeasuretheCompany’sperformance.Terrafina presents in this earnings report additional metrics such as Net Operating Income (NOI), Earnings BeforeInterests, Taxes, Depreciation and Amortization (EBITDA), Funds from Operations (FFO), and Adjusted Funds fromOperations(AFFO).Eachbreakdowncalculationisavailableinthisdocument.
Inaddition,TerrafinarecommendsreviewingtheAppendicesasareferenceoftheintegrationofdifferentitemsof
Terrafina’sfinancialstatement.Thisinformationisavailableinthelastsectionofthisdocument.
Pastperformanceisnotaguaranteeorreliableindicatoroffutureresults.

14
RentalRevenuesDuring 2016, Terrafina reported rental revenues of US$131.7million. In 4Q16, Terrafina registeredUS$33.4million inrentalrevenues,a5.9%orUS$1.9millionincreasecomparedto4Q15.Rentalrevenuesdonotincludeaccruedrevenuesastheseareanon-cashitem.OtherOperatingIncomeFor2016,otheroperatingincometotaledUS$11.3million.During4Q16,otheroperatingincometotaledUS$2.8million,a6.3%orUS$0.2millionincreasecomparedto4Q15.Other operating income mainly stems from leasing contract deposits and refunds from triple-net leases. ExpensesreimbursabletoTerrafinamainlyincludedelectricity,propertytaxes,insurancecostsandmaintenanceactivities.
Net revenues reachedUS$145.0million for 2016 andUS$36.5million in 4Q16, an increase ofUS$2.1million, or 6.2%comparedtothe4Q15figure.
Revenues 2016 2015 Var.% 4Q16 4Q15 Var.% 2016 2015 Var.% 4Q16 4Q15 Var.%
(millionsofpesos) (millionsofdollars)
RentalRevenue 2,460.2 2,032.5 21.0% 660.8 527.5 25.3% 131.7 128.3 2.7% 33.4 31.5 5.9%
AccruedIncome1 34.7 -1.9 - 7.4 4.6 60.6% 1.9 -0.2 - 0.4 0.3 34.3%
OtherOperatingRevenues 208.1 166.6 24.9% 52.1 43.5 19.7% 11.3 10.7 5.7% 2.8 2.6 6.3%
ReimbursableExpensesasRevenues2 154.4 143.6 7.5% 39.6 39.1 1.2% 8.4 9.2 -8.1% 2.1 2.3 -11.1%
ReimbursableTenantImprovements 23.5 14.9 58.1% 7.4 4.4 69.5% 1.3 0.9 34.1% 0.4 0.3 45.2%
Othernon-cashincome 30.1 8.1 270.1% 5.1 0.0 - 1.7 0.6 166.8% 0.3 0.0 -
NetRevenue 2,703.0 2,197.2 23.0% 720.3 575.6 25.1% 145.0 138.9 4.4% 36.5 34.4 6.2%(1)Straightlinerentadjustment;non-cashitem.(2)TriplenetleasesexpensesreimbursedtoTerrafinafromitstenants.Source:PGIMRealEstate-FundAccounting
Foradditionalinformationregardingtherevenuebreakdownusedtocalculateadditionalmetricspresentedinthisearningsreport,pleaserefertoAppendix1inthelastsectionofthisdocument.
RealEstateExpensesIn2016,realestateexpensestotaledUS$29.8million.Theseexpensesmainlycorrespondedtorepairandmaintenance,propertytaxesandinsurance.In4Q16,realestateexpensestotaledUS$7.7million,anincreaseofUS$1.5million,or24.9%comparedto4Q15.It is important todifferentiatebetweenexpenses that aredirectly related to theoperationand those that are for themaintenanceoftheindustrialportfolio;thelatterareusedintheNOIcalculation.
Theremainderoftheaccountsincludedinrealestateexpensesareconsiderednon-recurringexpensesandareusedtocalculateEBITDAandAFFO.

15
Foradditionalinformationregardingtherealestateexpensesbreakdown,pleaserefertoAppendix2inthelast
sectionofthisdocument.NetOperatingIncome(NOI)In2016NetOperatingIncome(NOI)totaledUS$131.8million,withanNOImarginof92.1%.During4Q16,NOItotaledUS$33.1million,a7.5%orUS$2.3millionincreasecomparedwith4Q15.NOImarginincreased180basispointsreaching92.9%comparedto91.1%in4Q15.ThefollowingtabledisplaysthecalculationofNOIforthefullyear2016and4Q16:
NetOperatingIncome 2016 2015 Var.% 4Q16 4Q15 Var.% 2016 2015 Var.% 4Q16 4Q15 Var.%
(millionsofpesosunlessotherwisestated) (millionsofdollarsunlessotherwisestated)
RentalRevenues1 2,460.2 2,032.5 21.0% 660.8 527.5 25.3% 131.7 128.3 2.7% 33.4 31.5 5.9%
OtherOperatingincome2 209.8 143.6 46.1% 44.0 39.1 12.4% 11.4 9.2 24.3% 2.3 2.3 -1.9%
NetRevenuesforNOICalculation 2,670.0 2,176.1 22.7% 704.8 566.6 24.4% 143.1 137.5 4.1% 35.6 33.8 5.4%
RepairandMaintenance -27.3 -45.3 -39.6% -6.6 -6.2 6.5% -1.5 -2.9 -49.8% -0.3 -0.4 -9.9%
PropertyTaxes -50.2 -50.3 -0.2% -0.2 -5.7 -96.1% -2.8 -3.3 -15.9% 0.0 -0.3 -96.6%
PropertyManagementFees -56.7 -54.2 4.8% -14.7 -14.0 4.7% -3.0 -3.4 -10.7% -0.7 -0.8 -11.5%
Electricity -27.0 -27.5 -1.7% -8.4 -7.1 18.3% -1.4 -1.7 -17.3% -0.4 -0.4 -1.8%
PropertyInsurance -20.9 -17.3 20.3% -13.4 -11.3 18.6% -1.1 -1.1 2.6% -0.7 -0.7 1.3%
Security -12.3 -11.0 11.8% -3.0 -3.1 -3.1% -0.7 -0.7 -5.0% -0.2 -0.2 -18.6%
OtherOperationalExpenses -15.8 -12.7 24.3% -4.3 -3.2 31.3% -0.8 -0.8 4.8% -0.2 -0.2 9.7%
RealEstateOperatingExpensesforNOICalculation -210.3 -218.3 -3.6% -50.4 -50.6 -0.3% -11.3 -13.9 -18.8% -2.5 -3.0 -15.9%
NetOperatingIncome3 2,459.7 1,957.8 25.6% 654.3 516.0 26.8% 131.8 123.6 6.7% 33.1 30.8 7.5%
NOIMargin 92.1% 89.9% 223bps 92.9% 91.1% 180bps 92.1% 89.9% 223bps 92.9% 91.1% 180bps
(1)Excludesaccruedincomefromstraightlinerentadjustmentsasitisanon-cashitem.(2)Excludestenantimprovementsreimbursementswhichareincludedin'AFFO'(3)Theincomecalculationgeneratedbytheoperationoftheproperty,independentofexternalfactorssuchasfinancingandincometaxes.NOIistheresultofNetRevenues(includesrentalincomeandtriplenetleasesexpensesreimbursements)minusRealEstateOperatingExpenses(costsincurredduringtheoperationandmaintenanceoftheindustrialportfolio).Source:PGIMRealEstate-FundAccounting
FeesandAdministrativeExpenses(G&A)G&A for FY2016 totaledUS$17.6million andUS$5.4million in 4Q16, a 7.7%, orUS$0.5milliondecrease compared to4Q15.ThefollowingtableshowstotalG&A:
G&A
2016 2015 Var.% 4Q16 4Q15 Var.% 2016 2015 Var.% 4Q16 4Q15 Var.%
(millionsofpesosunlessotherwisestated) (millionsofdollarsunlessotherwisestated)
ExternalAdvisorFees1 -157.4 -121.8 29.2% -43.2 -31.8 36.0% -8.3 -7.5 9.6% -2.1 -1.9 12.8%
ProfessionalandConsultingServices -35.6 -41.0 -13.2% -12.2 -11.2 8.7% -2.1 -2.7 -23.4% -0.7 -0.7 1.0%
Payroll,Admin.FeesandOtherExpenses -136.2 -275.4 -50.5% -50.7 -55.5 -8.8% -7.3 -17.6 -58.8% -2.6 -3.3 -21.4%
TotalG&A2 -329.3 -438.2 -24.9% -106.1 -98.6 7.7% -17.6 -27.8 -36.8% -5.4 -5.8 -7.7%
(1)PLAAdministradoraIndustrial,S.deR.L.deC.V.,isaMexicanaffiliateofPGIMRealEstate,andAdvisoraspertheAdvisoryContract.Source:PGIMRealEstate-FundAccounting
16
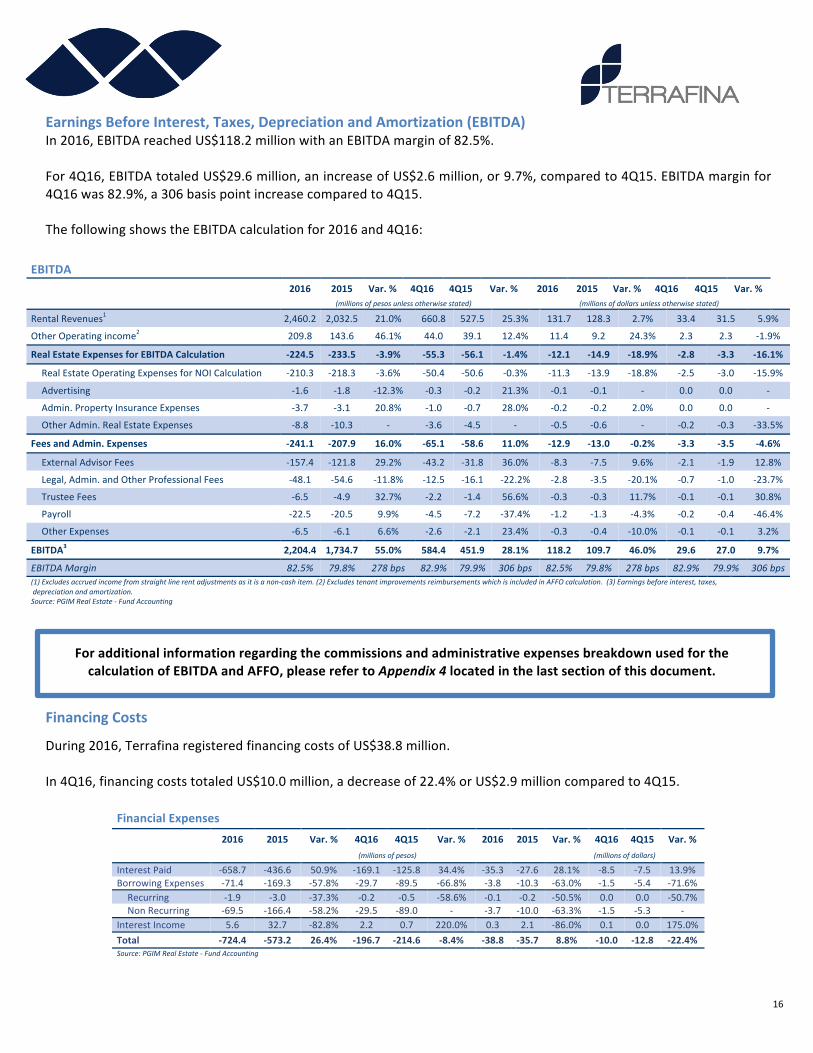
EarningsBeforeInterest,Taxes,DepreciationandAmortization(EBITDA)In2016,EBITDAreachedUS$118.2millionwithanEBITDAmarginof82.5%.For4Q16,EBITDAtotaledUS$29.6million,anincreaseofUS$2.6million,or9.7%,comparedto4Q15.EBITDAmarginfor4Q16was82.9%,a306basispointincreasecomparedto4Q15.ThefollowingshowstheEBITDAcalculationfor2016and4Q16:
EBITDA 2016 2015 Var.% 4Q16 4Q15 Var.% 2016 2015 Var.% 4Q16 4Q15 Var.%
(millionsofpesosunlessotherwisestated) (millionsofdollarsunlessotherwisestated)
RentalRevenues1 2,460.2 2,032.5 21.0% 660.8 527.5 25.3% 131.7 128.3 2.7% 33.4 31.5 5.9%
OtherOperatingincome2 209.8 143.6 46.1% 44.0 39.1 12.4% 11.4 9.2 24.3% 2.3 2.3 -1.9%
RealEstateExpensesforEBITDACalculation -224.5 -233.5 -3.9% -55.3 -56.1 -1.4% -12.1 -14.9 -18.9% -2.8 -3.3 -16.1%
RealEstateOperatingExpensesforNOICalculation -210.3 -218.3 -3.6% -50.4 -50.6 -0.3% -11.3 -13.9 -18.8% -2.5 -3.0 -15.9%
Advertising -1.6 -1.8 -12.3% -0.3 -0.2 21.3% -0.1 -0.1 - 0.0 0.0 -
Admin.PropertyInsuranceExpenses -3.7 -3.1 20.8% -1.0 -0.7 28.0% -0.2 -0.2 2.0% 0.0 0.0 -
OtherAdmin.RealEstateExpenses -8.8 -10.3 - -3.6 -4.5 - -0.5 -0.6 - -0.2 -0.3 -33.5%
FeesandAdmin.Expenses -241.1 -207.9 16.0% -65.1 -58.6 11.0% -12.9 -13.0 -0.2% -3.3 -3.5 -4.6%
ExternalAdvisorFees -157.4 -121.8 29.2% -43.2 -31.8 36.0% -8.3 -7.5 9.6% -2.1 -1.9 12.8%
Legal,Admin.andOtherProfessionalFees -48.1 -54.6 -11.8% -12.5 -16.1 -22.2% -2.8 -3.5 -20.1% -0.7 -1.0 -23.7%
TrusteeFees -6.5 -4.9 32.7% -2.2 -1.4 56.6% -0.3 -0.3 11.7% -0.1 -0.1 30.8%
Payroll -22.5 -20.5 9.9% -4.5 -7.2 -37.4% -1.2 -1.3 -4.3% -0.2 -0.4 -46.4%
OtherExpenses -6.5 -6.1 6.6% -2.6 -2.1 23.4% -0.3 -0.4 -10.0% -0.1 -0.1 3.2%
EBITDA3 2,204.4 1,734.7 55.0% 584.4 451.9 28.1% 118.2 109.7 46.0% 29.6 27.0 9.7%
EBITDAMargin 82.5% 79.8% 278bps 82.9% 79.9% 306bps 82.5% 79.8% 278bps 82.9% 79.9% 306bps(1)Excludesaccruedincomefromstraightlinerentadjustmentsasitisanon-cashitem.(2)ExcludestenantimprovementsreimbursementswhichisincludedinAFFOcalculation.(3)Earningsbeforeinterest,taxes,depreciationandamortization.Source:PGIMRealEstate-FundAccounting
ForadditionalinformationregardingthecommissionsandadministrativeexpensesbreakdownusedforthecalculationofEBITDAandAFFO,pleaserefertoAppendix4locatedinthelastsectionofthisdocument.
FinancingCosts
During2016,TerrafinaregisteredfinancingcostsofUS$38.8million.In4Q16,financingcoststotaledUS$10.0million,adecreaseof22.4%orUS$2.9millioncomparedto4Q15.
FinancialExpenses 2016 2015 Var.% 4Q16 4Q15 Var.% 2016 2015 Var.% 4Q16 4Q15 Var.%
(millionsofpesos) 0
(millionsofdollars) 0
InterestPaid -658.7 -436.6 50.9% -169.1 -125.8 34.4% -35.3 -27.6 28.1% -8.5 -7.5 13.9%BorrowingExpenses -71.4 -169.3 -57.8% -29.7 -89.5 -66.8% -3.8 -10.3 -63.0% -1.5 -5.4 -71.6%Recurring -1.9 -3.0 -37.3% -0.2 -0.5 -58.6% -0.1 -0.2 -50.5% 0.0 0.0 -50.7%NonRecurring -69.5 -166.4 -58.2% -29.5 -89.0 - -3.7 -10.0 -63.3% -1.5 -5.3 -
InterestIncome 5.6 32.7 -82.8% 2.2 0.7 220.0% 0.3 2.1 -86.0% 0.1 0.0 175.0%Total -724.4 -573.2 26.4% -196.7 -214.6 -8.4% -38.8 -35.7 8.8% -10.0 -12.8 -22.4%Source:PGIMRealEstate-FundAccounting

17
FundsfromOperations(FFO)/AdjustedFundsfromOperations(AFFO)For the full year 2016, Terrafina’s FFO reached US$83.0 million and a 58.0% FFO margin. Terrafina’s AFFO reachedUS$74.5million,witha52.7%AFFOmargin.
In4Q16,Terrafina’sFFOincreasedbyUS$1.7million,or8.5%comparedto4Q15,reachingUS$21.1million.FFOMarginwas59.2%,a150basispointincreasecomparedto4Q15.Additionally,TerrafinareportedanAFFOofUS$20.4million,anincreaseofUS$3.9million,or24.0%comparedto4Q15.AFFOmarginwas56.8%,anincreaseof877basispointsversus4Q15.
FundsfromOperations(FFO) 2016 2015 Var.% 4Q16 4Q15 Var.% 2016 2015 Var.% 4Q16 4Q15 Var.%
(millionsofpesosunlessotherwisestated) (millionsofdollarsunlessotherwisestated)
EBITDA 2,204.4 1,734.7 27.1% 584.4 451.9 29.3% 118.2 109.7 7.7% 29.6 27.0 9.7%FinanceCost1 -654.9 -406.8 61.0% -167.2 -125.6 33.1% -35.1 -25.7 36.9% -8.4 -7.5 12.8%FundsfromOperations(FFO) 1,549.5 1,327.8 16.7% 417.3 326.3 27.9% 83.0 84.0 -1.2% 21.1 19.5 8.5%FFOMargin 58.0% 61.1% -311bps 59.2% 57.7% 153bps 58.0% 61.1% -311bps 59.2% 57.7% 150bpsTenantImprovements -116.0 -95.6 21.4% -33.6 -26.2 28.1% -6.2 -5.9 5.2% -1.7 -1.6 9.2%LeasingCommissions -64.3 -52.3 23.1% -15.6 -18.1 -13.6% -3.5 -3.3 6.1% -0.8 -1.1 -26.7%OtherNonRecurring3 21.6 -20.7 - 32.3 -6.3 - 1.2 -1.4 - 1.7 -0.4 -AdjustedFundsfromOperations(AFFO) 1,390.8 1,159.2 20.0% 400.4 275.7 45.2% 74.5 73.4 1.4% 20.4 16.4 24.0%AFFOMargin 52.7% 53.1% -38bps 56.8% 48.1% 877bps 52.7% 53.1% -38bps 56.8% 48.1% 877bps(1)NetOperationalInterestExpensescomprisedbyinterestpaid,recurringborrowingexpensesandotherinterestincome.(2)Capexreserveformaintenanceactivities.(3)Relatedtoacquisitions,dispositions,legalandotherexpenses.
Source:PGIMRealEstate-FundAccounting
ComprehensiveIncomeComprehensiveIncomeforFY2016reachedUS$272.8million.For4Q16,thisfigurereachedUS$103.6million,comparedtotheUS$43.4millionin4Q15.
ThefollowingtablepresentsthecalculationofComprehensiveIncomefor2016and4Q16:
ComprehensiveIncome 2016 2015 Var.% 4Q16 4Q15 Var.% 2016 2015 Var.% 4Q16 4Q15 Var.%
(millionsofpesosunlessotherwisestated) (millionsofdollarsunlessotherwisestated)
NetRevenues 2,703.0 2,197.2 23.0% 720.3 575.6 25.1% 145.0 138.9 4.4% 36.5 34.4 6.2%RealEstateExpenses -555.7 -477.6 16.4% -152.2 -104.2 46.0% -29.8 -30.2 -1.2% -7.7 -6.2 24.9%FeesandOtherExpenses -329.3 -438.2 -24.9% -106.1 -98.6 7.7% -17.6 -27.8 -36.7% -5.4 -5.8 -7.7%Gain(Loss)fromSalesofRealEstateProperties 56.5 -0.3 - 47.1 0.0 - 3.0 0.0 - 2.4 0.0 -NetIncome(Loss)fromFairValueAdjustmentonInvestmentProperties -235.9 162.0
-245.6% -44.9 154.4
-129.1% -12.6 10.2
-223.9% -2.3 9.2
-124.6%
NetIncome(Loss)fromFairValueAdjustmentonDerivativeFinancialInstruments
0.0 -0.5 -96.4% 0.0 -0.9 - 0.0 0.0 - 0.0 -0.1 -
NetIncome(Loss)fromFairValueAdjustmentonBorrowings 55.2 66.4 - 409.0 180.6 126.4% 3.0 4.2 - 20.6 10.8 91.2%
NetIncome(Loss)fromFairValueAdjustmentonBankInvestments 0.0 19.5 - 0.0 0.0 - 0.0 1.2 - 0.0 0.0 -
ForeignExchangeGain(loss) -67.8 -217.3 -68.8% -0.1 -5.0 -97.2% -3.6 -13.7 -73.5% 0.0 -0.3 -97.6%OperatingProfit 1,626.1 1,311.3 24.0% 873.1 702.0 - 87.3 82.7 0.1 44.2 42.0% -FinancialIncome 5.6 32.7 -82.8% 2.2 0.7 220.0% 0.3 2.1 -85.8% 0.1 0.0 -FinancialExpenses -730.1 -606.0 20.5% -198.9 -215.3 -7.6% -39.1 -38.2 2.4% -10.1 -12.9 -21.8%NetFinancialCost -724.4 -573.2 26.4% -196.7 -214.6 -8.4% -38.8 -36.2 7.2% -10.0 -12.8 -22.4%ShareofProfitfromEquityAccountedInvestments 47.6 0.0 - 4.2 0.0 - 2.5 0.0 - 1.2 0.0 -
NetProfit(Loss) 949.2 738.0 28.6% 680.7 487.4 39.7% 51.0 46.6 0.1 35.4 29.2 0.2ItemsReclassifiedafterNetProfit(Loss)-CurrencyTranslationAdjustments 4,143.8 3,017.6 37.3% 1,371.2 237.0 478.4% 222.0 190.4 16.6% 73.5 14.2 417.3%
ComprehensiveIncome 5,093.1 3,755.6 35.6% 2,051.8 724.4 183.2% 272.8 237.0 0.2 103.6 43.4 138.6%Source:PGIMRealEstate-FundAccounting

18
DistributionsperCBFIsIn 2016, Terrafina distributedUS$74.5million, orUS$0.1227 per CBFI. For 4Q16,US$20.4millionwere distributed, orUS$0.0335perCBFI.
Furthermore,itisimportanttomentionthatthetaxresultfortheperiodregisteredafiscalloss;therefore,andforfiscalpurposes,distributionsperCBFIshouldbeconsideredasacapitalreimbursementfortaxpurposes.
Distributions(millionsofpesosunlessotherwisestated) 1Q16 2Q16 3Q16 4Q16 2016 2015 Var.%
TotalOutstandingCBFIs1(millionsofCBFIs) 607.2 607.4 607.4 607.2 607.2 607.2 0.0%
CBFIPrice2 29.39 30.84 30.84 29.48 30.16 30.72 -1.8%
Distributions 300.8 343.3 346.4 400.4 1,390.8 1,159.2 20.0%
DistributionsPerCBFI 0.4951 0.5650 0.5703 0.6593 2.2904 1.9090 20.0%
FXRateUSD/MXN(averageclosingperiod) 18.07 18.07 18.72 19.81 18.67 15.85 17.8%
Distributions(milliondollars) 16.6 19.0 18.5 20.4 74.5 73.5 1.4%
DistributionsPerCBFI(dollars) 0.0273 0.0313 0.0305 0.0335 0.1227 0.1210 1.4%
AnnualizedDistributionYield3 6.7% 7.3% 7.4% 8.9% 7.6% 6.2% 138bps(1)In2Q16,167,094CBFIswereaddedaspartofTerrafina´scompensationplan.NumberofCBFIsattheendofeachperiod(2)Averageclosingpricefortheperiod.(3)AnnualizeddistributionpersharedividedbytheaverageCBFIpriceofthequarter.Quarterlydistributionyieldcalculationhasbeenannualized.Source:PGIMRealEstate-FundAccounting
TotalDebtAsofDecember31, 2016, Terrafina’s total debt reachedUS$704.7million. Theaverage cost of Terrafina’s long-termdebtwas4.63%.AllofTerrafina’sdebtisdenominatedinU.S.dollars.Additionally,itisimportanttonotethatTerrafina’svariableinterestrateloansarehedgedwithinterestratecapsandfixedrateoptions.
OutstandingDebt
(asofDecember31,2016)Currency
Millionsofpesos
Millionsofdollars
InterestRate Terms Maturity
ExtensionOption
LongTermDebt
Citibank1 Dollars 0.0 0.0 Libor+2.40% InterestOnly Aug2018 Aug2019
BRE2,3 Dollars 2,472.8 119.7 Libor+3.75% Interest+Principal Sep2018 Sep2020
Metlife4 Dollars 453.7 22.0 5.09% Interest+Principal Nov2016 -
BancomerBBVA Dollars 3,099.6 150.0 Libor+2.00% InterestOnly Sep2021 -
SeniorNotes Dollars 8,535.4 413.1 5.25% InterestOnly Nov2022 -
TotalDebt 14,561.5 704.7 NetCash 4,297.1 208.0 NetDebt 10,264.4 496.7 (1)Unsecuredsyndicatedloanfacilitywithsevenbanks.(2)Securedsyndicatedloanfacilitywithfourbanks.(3)One-yearinterestonlygraceperiod.4)Debtassumed
fromportfolioacquisitionclosedinNovember2015.
Source:PGIMRealEstate-FundAccountingandCapitalMarkets
38.3%
61.7%
InterestRateBreakdown(asofDecember31,2016)
VariableRate FixedRate

19
The following tables show leverage anddebt service coverage as ofDecember 31, 2016 aswell as Terrafina’sprojectionsforthefollowingsixquarters:
Loan-to-Value(LTV)
(asofDecember31,2016)
(millionsofpesos)
(millionsofdollars)
TotalAssets 39,882.2 1,930.0
TotalDebt 14,561.5 704.7
Loan-to-Value(LTV)1 36.5%(1)TotalDebtdividedbyTotalAssetsasdefinedbytheNationalSecurities
andBankingCommission(CNBV)
Source:PGIMRealEstate-FundAccountingandCapitalMarkets
DebtServiceCoverageRatio(DSCR)
period (millionsofpesos) (millionsofdollars)
Cash&CashEquivalents December31,2016 4,297.1 208.0
RecoverableTaxes Σnext6quarters 149.8 7.2
EBIT1afterdistributions Σnext6quarters 1,535.5 74.3
AvailableCreditLine December31,2016 7,749.0 375.0
period (millonesdepesos) (millonesdedólares)
InterestPayments Σnext6quarters 1051.8 50.9
PrincipalPayments Σnext6quarters 800.7 38.8
RecurringCAPEX Σnext6quarters 345.1 16.7
DevelopmentExpenses Σnext6quarters 206.6 10.0
DebtServiceCoverageRatio
(DSCR)2 5.7x
(1)EarningsBeforeInterestandTaxes
(2)(Cash&CashEquivalents+RecoverableTaxes+EBITAfterDistributions+AvailableCreditLine)/(InterestPayments+PrincipalPayments+RecurringCAPEX+DevelopmentExpenses)
Source:PGIMRealEstate-FundAccountingandCapitalMarkets
Moreover,asofDecember31,2016TerrafinawasinfullcompliancewithitsdebtcovenantsrelatedtotheUS$425millionbondissuance,asfollows:
UnsecuredBondCovenants (asofDecember31,2016) Terrafina BondCovenants
Loan-to-Value(LTV)1 36.5% ≤60%
DebtServiceCoverageRatio(DSCR)2 2.4x ≥1.5x
SecuredDebttoGrossAssetsLimitation 7.3% ≤40%UnencumberedAssetstoUnsecuredDebtLimitation 240% ≥150%
(1)TotalDebtdividedbyTotalAssets.(2)(NetIncome/Loss+InterestonDebt+UnrealizedGain/Lossoffairvaluechanges)/(allinterestandprincipalpaymentsonDebt)
Source:PGIMRealEstate-Transactions

20
AnalystCoverageThefollowingisalistofbanksandinstitutionsthatregularlypublishresearchreportsonTerrafina:-Barclays -Invex-BBVABancomer -Interacciones-BofAML -Invex-BTGPactual -ItaúBBA-BX+ -JPMorgan-CitiBanamex -Monex-CreditSuisse -MorganStanley-GBM -NAUSecurities-HSBC -Scotiabank-UBS -Vector

21
AboutTerrafinaTerrafina (BMV:TERRA13) is a Mexican real estate investment trust formed primarily to acquire, develop, lease andmanage industrial real estate properties in Mexico. Terrafina’s portfolio consists of attractive, strategically locatedwarehousesandotherlightmanufacturingpropertiesthroughouttheCentral,BajioandNorthernregionsofMexico.Itisinternallymanagedbyhighly-qualifiedindustryspecialistsandexternallyadvisedbyPGIMRealEstate.Terrafina owns 271 real estate properties, including 260 developed industrial facilities with a collective GLA ofapproximately36.4millionsquarefeetand11landreserveparcels,designedtopreservetheorganicgrowthcapabilityoftheportfolio.Terrafina’s objective is to provide attractive risk-adjusted returns for the holders of its certificates through stabledistributionsandcapitalappreciations.Terrafinaaimstoachievethisobjective throughasuccessfulperformanceof itsindustrialrealestateandcomplementaryproperties,strategicacquisitions,accesstoahighlevelofinstitutionalsupport,andtoitsmanagementandcorporategovernancestructure.Formoreinformation,pleasevisitwww.terrafina.mxPGIMRealEstatePGIMReal Estate is the real estate investment business of PGIM Inc., the global investmentmanagement business ofPrudentialFinancial, Inc. (NYSE:PRU). Redefining therealestate investing landscapesince1970,PGIMRealEstatehasprofessionals in 18 cities in theAmericas, EuropeandAsiaPacificwithdeep local knowledgeandexpertise, andgrossassetsundermanagementofUS$66.0billion(US$47.6billionnet)asofDecember31,2016.PGIMRealEstate’stenuredteamofferstoitsglobalclientbaseabroadrangeofrealestateinvestmentvehiclesthatspantherisk-returnspectrumacross core, core plus, value-add, debt, securities, and specialized investment strategies. For more information, visitwww.pgimrealestate.comAboutPrudentialFinancial,Inc.Prudential Financial, Inc. (NYSE:PRU), a financial services leader with more than US$1.0 trillion of assets undermanagementasofDecember31,2016,hasoperationsintheUnitedStates,Asia,Europe,andLatinAmerica.Prudential’sdiverseandtalentedemployeesarecommittedtohelpingindividualandinstitutionalcustomersgrowandprotecttheirwealththroughavarietyofproductsandservices,includinglifeinsurance,annuities,retirement-relatedservices,mutualfundsandinvestmentmanagement.IntheU.S.,Prudential’siconicRocksymbolhasstoodforstrength,stability,expertiseandinnovationformorethanacentury.Formoreinformation,pleasevisitwww.news.prudential.comForwardLookingStatementsThisdocumentmayincludeforward-lookingstatementsthatmayimplyrisksanduncertainties.Termssuchas"estimate","project", "plan", "believe", "expect", "anticipate", "intend", and other similar expressions could be construed asprevisionsorestimates.Terrafinawarnsreadersthatdeclarationsandestimatesmentionedinthisdocument,orrealizedbyTerrafina’smanagementimplyrisksanduncertaintiesthatcouldchangeinfunctionofvariousfactorsthatareoutofTerrafina’scontrol.FutureexpectationsreflectTerrafina’sjudgmentatthedateofthisdocument.Terrafinareservestherightorobligationtoupdatetheinformationcontainedinthisdocumentorderivedfromthisdocument.Pastorpresentperformanceisnotanindicatortoanticipatefutureperformance.
22
ConferenceCall
(BMV:TERRA13)Cordiallyinvitesyoutoparticipateinits
FourthQuarter2016Results
Friday,February24,201711:00a.m.EasternTime10:00a.m.CentralTime
PresentingforTerrafina:
AlbertoChretin,ChiefExecutiveOfficer
EnriqueLavin,InterimChiefFinancialOfficer
***Toaccessthecall,pleasedial:
fromwithintheU.S.1-800-311-9404fromoutsidetheU.S.1-334-323-7224
ConferenceIDNumber:34974
AudioWebcastLink:https://www.webcaster4.com/Webcast/Page/1111/19319
ConferenceReplayUS1-877-919-4059
International(outsidetheUS)1-334-323-0140Passcode:85873057

23
AppendixAppendix1–RevenuesTerrafina’srevenuesaremainlyclassifiedasrentalrevenuesandotheroperatingreimbursablerevenues.Additionally,thereareaccountingrevenuesthatmustberegisteredaccordingwithIFRS;however,theseareconsideredasnon-cashitemsandthereforeareexcludedinsomecalculations.ReimbursabletenantimprovementsareincludedinthetenantimprovementexpensesfortheAFFOcalculation.
Revenues
2016 2015 4Q16 4Q15 2016 2015 4Q16 4Q15
(millionsofpesos) (millionsofdollars)
NOIcalculation RentalRevenue 2,460.2 2,032.5 660.8 527.5 131.7 128.3 33.4 31.5
NonCash AccruedIncome1 34.7 -1.9 7.4 4.6 1.9 -0.2 0.4 0.3
OtherOperatingRevenues 208.1 166.6 52.1 43.5 11.3 10.7 2.8 2.6
NOIcalculation ReimbursableExpensesasRevenues2 154.4 143.6 39.6 39.1 8.4 9.2 2.1 2.3
AFFOcalculation ReimbursableTenantImprovements 23.5 14.9 7.4 4.4 1.3 0.9 0.4 0.3
NonCash Othernon-cashincome 30.1 8.1 5.1 0.0 1.7 0.6 0.3 0.0
NetRevenue 2,703.0 2,197.2 720.3 575.6 145.0 138.9 36.5 34.4
NOIcalculation ShareofProfitfromEquityAccountedInvestments 55.4 0.0 4.4 0.0 3.0 0.0 0.2 0.0
(1)Straightlinerentadjustment.(2)TriplenetleasesexpensesreimbursedtoTerrafinafromitstenants.
Source:PGIMRealEstate-FundAccounting

24
Appendix2–RealEstateExpensesReal estate expenses are comprised of recurring figures relatedwith the operation (used for theNetOperating Profitcalculation) as well as non-recurring figures used for metric calculations such as Earnings Before Interests, Taxes,DepreciationandAmortization(EBITDA),FundsfromOperations(FFO),AdjustedFundsfromOperations(AFFO).Thefollowingtablepresentstherealestateexpenses’breakdown,whichareusedforthecalculationofseveralmetrics.
RealEstateExpenses
2016 2015 4Q16 4Q15 2016 2015 4Q16 4Q15
(millionofpesos) (millionofdollars)
RepairandMaintenance -166.9 -155.7 -47.5 -36.7 -8.9 -9.8 -2.4 -2.2
NOIcalculation Recurring -27.3 -45.3 -6.6 -6.2 -1.5 -2.9 -0.3 -0.4
AFFOcalculation NonRecurring -139.6 -110.5 -41.0 -30.6 -7.5 -6.9 -2.1 -1.8
PropertyTaxes -107.8 -82.1 -29.0 -6.9 -5.9 -5.4 -1.5 -0.4
NOIcalculation Operating -50.2 -50.3 -0.2 -5.7 -2.8 -3.3 0.0 -0.3
NonCash NonOperating -57.6 -31.7 -28.7 -1.1 -3.1 -2.1 -1.5 -0.1
NOIcalculation PropertyManagementFees -56.7 -54.2 -14.7 -14.0 -3.0 -3.4 -0.7 -0.8
NOIcalculation Electricity -27.0 -27.5 -8.4 -7.1 -1.4 -1.7 -0.4 -0.4
AFFOcalculation BrokersFees -64.3 -52.3 -15.6 -18.1 -3.5 -3.3 -0.8 -1.1
PropertyInsurance -24.6 -20.4 -14.3 -12.0 -1.3 -1.3 -0.7 -0.7
NOIcalculation Operating -20.9 -17.3 -13.4 -11.3 -1.1 -1.1 -0.7 -0.7EBITDA
calculation Administrative -3.7 -3.1 -1.0 -0.7 -0.2 -0.2 0.0 0.0
NOIcalculation Security -12.3 -11.0 -3.0 -3.1 -0.7 -0.7 -0.2 -0.2EBITDA
calculationAdvertising -1.6 -1.8 -0.3 -0.2 -0.1 -0.1 0.0 0.0
OtherExpenses -59.0 -22.9 -10.3 -7.7 -3.2 -1.4 -0.5 -0.5
NOIcalculation OperationalRelated -15.8 -12.7 -4.3 -3.2 -0.8 -0.8 -0.2 -0.2
NonCash NonOperationalRelated -34.4 0.0 -2.5 0.0 -1.9 0.0 -0.1 0.0EBITDA
calculationAdministrative -8.8 -10.3 -3.6 -4.5 -0.5 -0.6 -0.2 -0.3
NonCash BadDebtExpense -35.3 -48.7 -9.1 1.6 -1.9 -3.1 -0.5 0.1
NonCash TransactionExpense 0.0 -0.9 0.0 0.0 0.0 -0.1 0.0 0.0
TotalRealEstateExpenses -555.7 -477.6 -152.2 -104.2 -29.8 -30.2 -7.7 -6.2
Source:PGIMRealEstate-FundAccounting
25
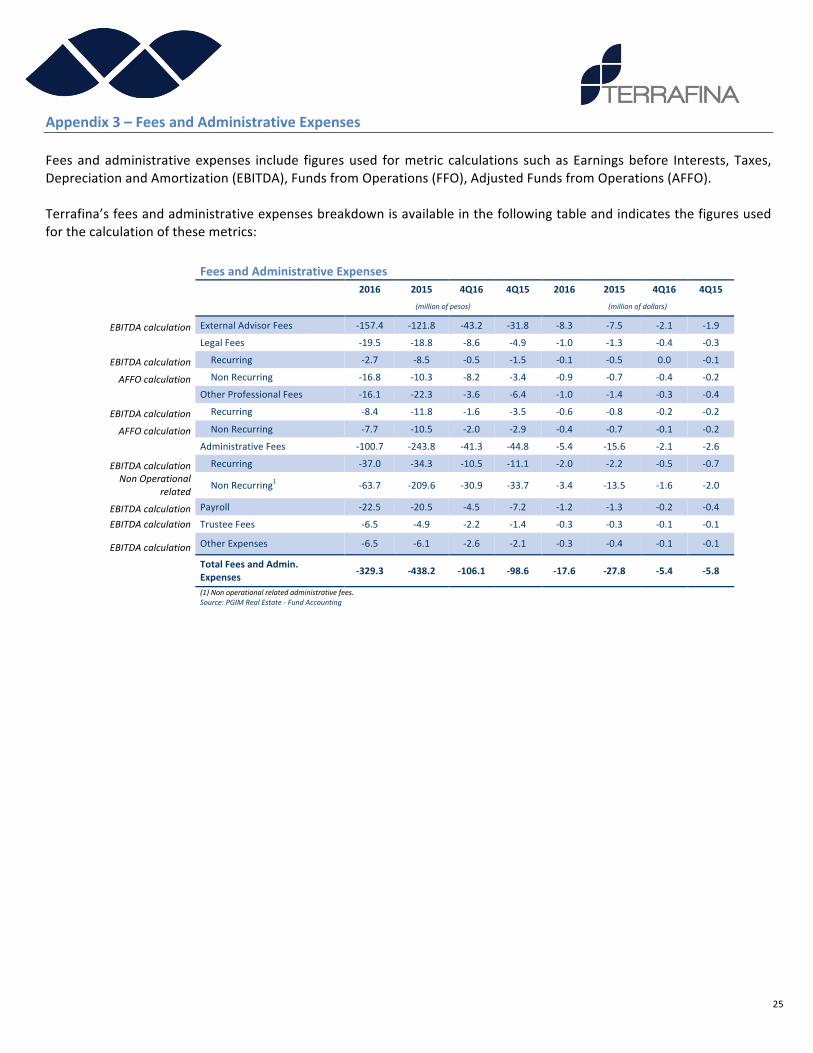
Appendix3–FeesandAdministrativeExpensesFeesandadministrativeexpenses include figuresused formetric calculations suchasEarningsbefore Interests, Taxes,DepreciationandAmortization(EBITDA),FundsfromOperations(FFO),AdjustedFundsfromOperations(AFFO).Terrafina’sfeesandadministrativeexpensesbreakdownisavailableinthefollowingtableandindicatesthefiguresusedforthecalculationofthesemetrics:
FeesandAdministrativeExpenses
2016 2015 4Q16 4Q15 2016 2015 4Q16 4Q15
(millionofpesos) (millionofdollars)
EBITDAcalculation ExternalAdvisorFees -157.4 -121.8 -43.2 -31.8 -8.3 -7.5 -2.1 -1.9
LegalFees -19.5 -18.8 -8.6 -4.9 -1.0 -1.3 -0.4 -0.3
EBITDAcalculation Recurring -2.7 -8.5 -0.5 -1.5 -0.1 -0.5 0.0 -0.1
AFFOcalculation NonRecurring -16.8 -10.3 -8.2 -3.4 -0.9 -0.7 -0.4 -0.2
OtherProfessionalFees -16.1 -22.3 -3.6 -6.4 -1.0 -1.4 -0.3 -0.4
EBITDAcalculation Recurring -8.4 -11.8 -1.6 -3.5 -0.6 -0.8 -0.2 -0.2
AFFOcalculation NonRecurring -7.7 -10.5 -2.0 -2.9 -0.4 -0.7 -0.1 -0.2
AdministrativeFees -100.7 -243.8 -41.3 -44.8 -5.4 -15.6 -2.1 -2.6
EBITDAcalculation Recurring -37.0 -34.3 -10.5 -11.1 -2.0 -2.2 -0.5 -0.7NonOperational
related NonRecurring1 -63.7 -209.6 -30.9 -33.7 -3.4 -13.5 -1.6 -2.0
EBITDAcalculation Payroll -22.5 -20.5 -4.5 -7.2 -1.2 -1.3 -0.2 -0.4
EBITDAcalculation TrusteeFees -6.5 -4.9 -2.2 -1.4 -0.3 -0.3 -0.1 -0.1
EBITDAcalculation OtherExpenses -6.5 -6.1 -2.6 -2.1 -0.3 -0.4 -0.1 -0.1
TotalFeesandAdmin.Expenses -329.3 -438.2 -106.1 -98.6 -17.6 -27.8 -5.4 -5.8
(1)Nonoperationalrelatedadministrativefees.
Source:PGIMRealEstate-FundAccounting

26
Appendix4–ReconciliationReconciliationofNetProfit(Loss)toFFO,EBITDAandNOI
2016 4Q16 2016 4Q16 (millionsofpesos) (millionsofdollars)
ComprehensiveIncome(Loss) 5,093.1 2,051.8 272.8 103.6Add(deduct)CurrencyTranslationAdjustment: CurrencyTranslationAdjustment -4,143.8 -1371.2 -222.0 -69.2
Add(deduct)CostofFinancingAdjustment: NonRecurringBorrowingExpenses 69.5 29.5 3.7 1.5
Add(deduct)Non-CashAdjustment: 0.0 0.0ForeignExchangeAdjustments 67.8 0.1 3.6 0.0FairValueAdjustmentonBankInvestment 0.0 0.0 0.0 0.0FairValueAdjustmentonBorrowings -55.2 -409.0 -3.0 -20.6FairValueAdjustmentonDerivativeFinancialInstruments 0.0 0.0 0.0 0.0FairValueAdjustmentonLoansReceivable 0.0 0.0 0.0 0.0FairValueAdjustmentonInvestmentProperties 235.9 44.9 12.6 2.3Gain(Loss)fromSalesofRealEstateProperties -56.5 -47.1 -3.0 -2.4
Add(deduct)ExpensesAdjustment: NonRecurringRepairandMaintenance 139.6 41.0 7.5 2.1NonOperatingPropertyTaxes 57.6 28.7 3.1 1.5BrokersFees 64.3 15.6 3.4 0.8BadDebtExpense 35.3 9.1 1.9 0.5OtherNonOperationalRelatedExpenses 34.4 2.5 1.8 0.1NonRecurringLegalFees 16.8 8.2 0.9 0.4NonRecurringOtherProfessionalFees 7.7 2.0 0.4 0.1
Add(deduct)RevenuesAdjustment: AccruedIncome -34.7 -7.4 -1.9 -0.4OtherNon-CashIncome -30.1 -5.1 -1.6 -0.3ReimbursableTenantImprovements -23.5 -7.4 -1.3 -0.4
Add(deduct)NonOperationalAdministrativeFees NonOperationalAdministrativeFees 71.4 30.9 3.8 1.6
FFO 1,549.6 417.3 83.0 21.1Add(deduct)CostofFinancingAdjustment: InterestPaid 658.7 169.1 35.3 8.5RecurringBorrowingExpenses 1.9 0.2 0.1 0.0InterestIncome -5.6 -2.2 -0.3 -0.1
EBITDA 2,204.5 584.4 118.1 29.6Add(deduct)ExpensesAdjustment: ExternalAdvisorFees 157.4 43.2 8.4 2.2RecurringLegalFees 2.7 0.5 0.1 0.0RecurringOtherProfessionalFees 8.4 1.6 0.4 0.1AdministrativeFees 37.0 10.5 2.0 0.5Payroll 22.5 4.5 1.2 0.2TrusteeFees 6.5 2.2 0.4 0.1OtherExpenses 6.5 2.6 0.3 0.1Advertising 1.6 0.3 0.1 0.0AdministrativePropertyinsurance 3.7 1.0 0.2 0.0OtherAdministrativeExpenses 8.8 3.6 0.5 0.2
NOI 2,459.7 654.3 131.8 33.1Add(deduct)ExpensesAdjustment: RecurringRepairandMaintenance 27.3 6.6 1.5 0.3OperatingPropertyTaxes 50.2 0.2 2.7 0.0PropertyManagementFees 56.7 14.7 3.0 0.7Electricity 27.0 8.4 1.4 0.4OperatingPropertyInsurance 20.9 13.4 1.1 0.7Security 12.3 3.0 0.7 0.2OtherOperationalExpenses 15.8 4.3 0.8 0.2
Add(deduct)RevenuesAdjustment: OtherNon-CashIncome 30.1 5.1 1.6 0.3AccruedIncome 34.7 7.4 1.9 0.4ReimbursableTenantImprovements 23.5 7.4 1.3 0.4ShareofProfitfromEquityAccountedInvestments -55.4 -4.4 -3.0 -0.2
NetRevenue 2,703.1 720.3 145.1 36.5
27
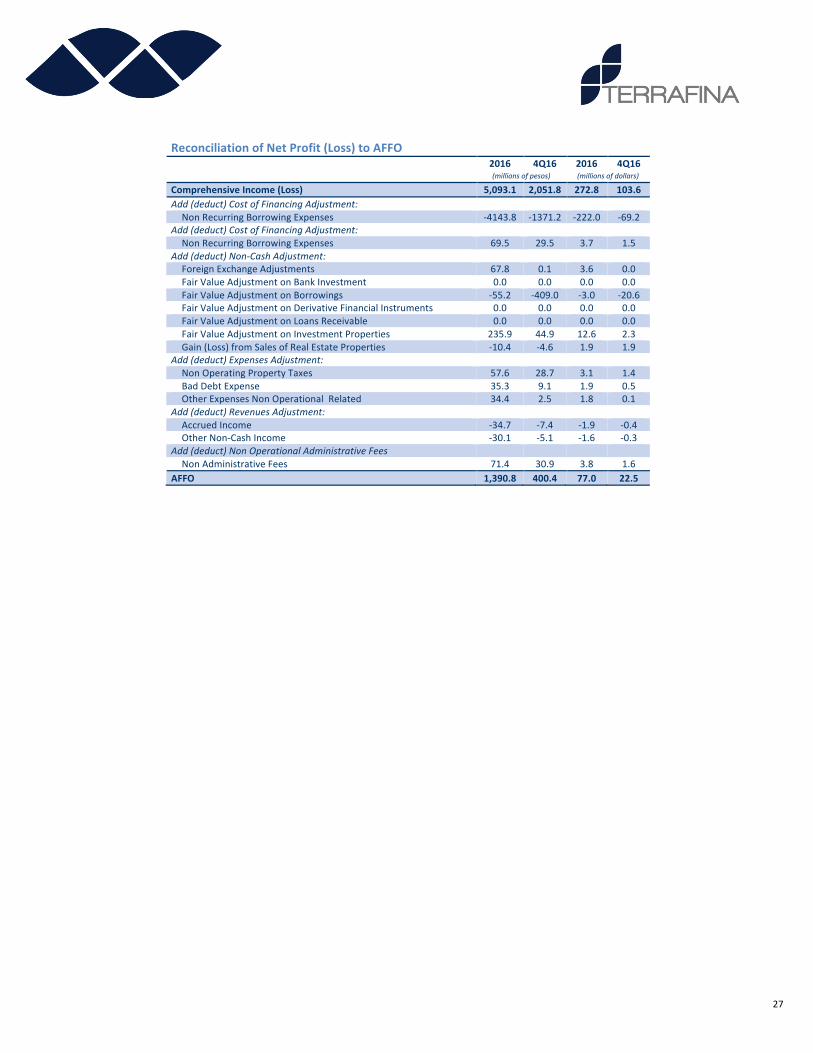
ReconciliationofNetProfit(Loss)toAFFO
2016 4Q16 2016 4Q16
(millionsofpesos) (millionsofdollars)
ComprehensiveIncome(Loss) 5,093.1 2,051.8 272.8 103.6Add(deduct)CostofFinancingAdjustment: NonRecurringBorrowingExpenses -4143.8 -1371.2 -222.0 -69.2
Add(deduct)CostofFinancingAdjustment: NonRecurringBorrowingExpenses 69.5 29.5 3.7 1.5
Add(deduct)Non-CashAdjustment: ForeignExchangeAdjustments 67.8 0.1 3.6 0.0FairValueAdjustmentonBankInvestment 0.0 0.0 0.0 0.0FairValueAdjustmentonBorrowings -55.2 -409.0 -3.0 -20.6FairValueAdjustmentonDerivativeFinancialInstruments 0.0 0.0 0.0 0.0FairValueAdjustmentonLoansReceivable 0.0 0.0 0.0 0.0FairValueAdjustmentonInvestmentProperties 235.9 44.9 12.6 2.3Gain(Loss)fromSalesofRealEstateProperties -10.4 -4.6 1.9 1.9
Add(deduct)ExpensesAdjustment: NonOperatingPropertyTaxes 57.6 28.7 3.1 1.4BadDebtExpense 35.3 9.1 1.9 0.5OtherExpensesNonOperationalRelated 34.4 2.5 1.8 0.1
Add(deduct)RevenuesAdjustment: AccruedIncome -34.7 -7.4 -1.9 -0.4OtherNon-CashIncome -30.1 -5.1 -1.6 -0.3
Add(deduct)NonOperationalAdministrativeFees NonAdministrativeFees 71.4 30.9 3.8 1.6
AFFO 1,390.8 400.4 77.0 22.5
28
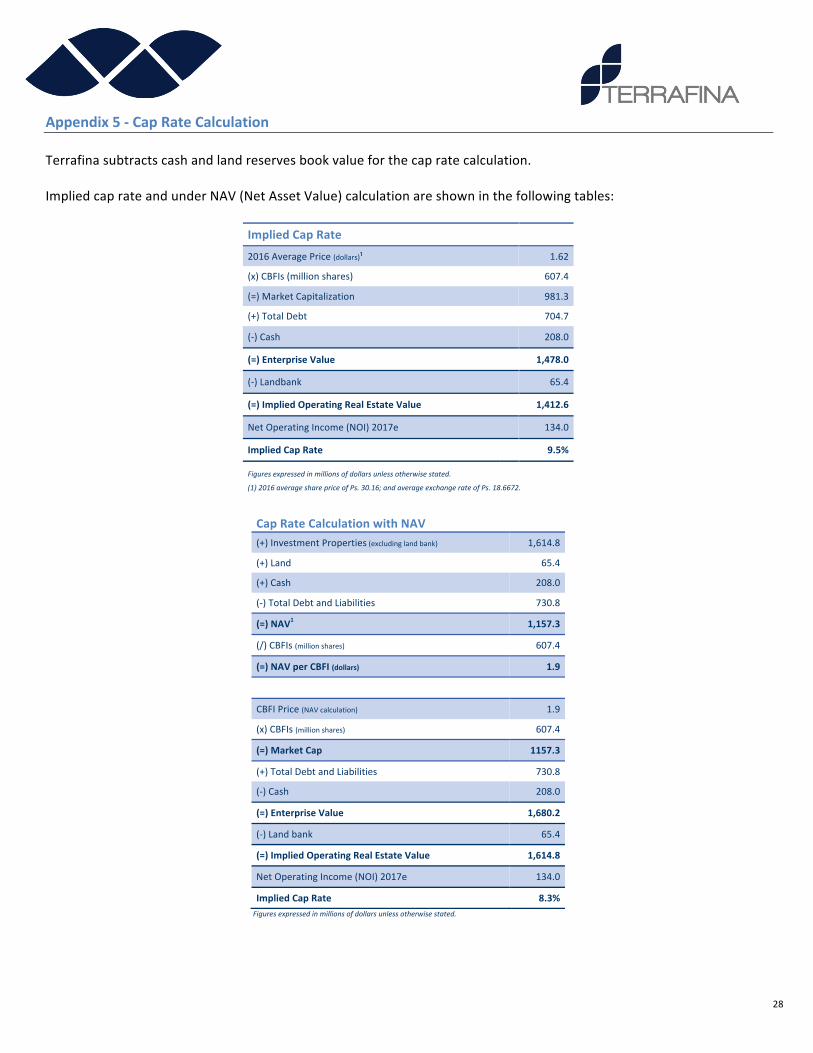
Appendix5-CapRateCalculationTerrafinasubtractscashandlandreservesbookvalueforthecapratecalculation.ImpliedcaprateandunderNAV(NetAssetValue)calculationareshowninthefollowingtables:
ImpliedCapRate
2016AveragePrice(dollars)¹ 1.62
(x)CBFIs(millionshares) 607.4
(=)MarketCapitalization 981.3
(+)TotalDebt 704.7
(-)Cash 208.0
(=)EnterpriseValue 1,478.0
(-)Landbank 65.4
(=)ImpliedOperatingRealEstateValue 1,412.6
NetOperatingIncome(NOI)2017e 134.0
ImpliedCapRate 9.5%
Figuresexpressedinmillionsofdollarsunlessotherwisestated.
(1)2016averagesharepriceofPs.30.16;andaverageexchangerateofPs.18.6672.
CapRateCalculationwithNAV
(+)InvestmentProperties(excludinglandbank) 1,614.8
(+)Land 65.4
(+)Cash 208.0
(-)TotalDebtandLiabilities 730.8
(=)NAV1 1,157.3
(/)CBFIs(millionshares) 607.4
(=)NAVperCBFI(dollars) 1.9
CBFIPrice(NAVcalculation) 1.9
(x)CBFIs(millionshares) 607.4
(=)MarketCap 1157.3
(+)TotalDebtandLiabilities 730.8
(-)Cash 208.0
(=)EnterpriseValue 1,680.2
(-)Landbank 65.4
(=)ImpliedOperatingRealEstateValue 1,614.8
NetOperatingIncome(NOI)2017e 134.0
ImpliedCapRate 8.3%Figuresexpressedinmillionsofdollarsunlessotherwisestated.

29
FinancialStatements
IncomeStatement
4Q16 2016
(thousandpesos)
Rentalrevenues
$668,187 $2,494,950
Otheroperatingincome
52,115 208,059
Realestateoperatingexpenses
(152,188) (555,595)
Feesandotherexpenses
(106,130) (329,282)
Realizedgainfromdisposalofinvestmentproperties
47,130 56,491
Netgain(loss)fromfairvalueadjustmentoninvestmentproperties
(44,857) (235,901)
Netgain(loss)fromfairvalueadjustmentonborrowings
409,025 55,234
Netgain(loss)fromfairvalueadjustmentonloansreceivable
- (44)
Net(loss)gainunrealizedfromfairvalueonderivativefinancialinstruments
- (18)
NetIncome(loss)fromfairvalueadjustmentonbankinvestments
- -
Foreignexchange(loss)gain
(140) (67,787)
Operatingprofit 873,142 1,626,007
Financeincome
2,171 5,626
Financecost
(198,852) (730,064)
Financecost-net (196,681) (724,438)
Shareofprofitfromequityaccountedinvestments
4,179 47,643
NetProfitfortheperiod 680,640 949,212
Items that may be subsequently reclassified to profit or loss-currencytranslationdifferences 1,371,156 4,143,839
TotalComprehensiveincomefortheperiod 2,051,796 5,093,051

30
FinancialStatements
BalanceSheet Dec-31-16 Sep-30-16(thousandsofpesos)
Assets Non-currentassets
Investmentproperties $34,719,694 $32,316,560(Cost:31/12/2016-Ps.33,817,311;30/09/2016-Ps.31,427,063)
Investmentsaccountedusingequitymethod 233,548
198,113Derivativefinancialinstruments -
-
Loanreceivable 41,472 38,108(Cost:31/12/2016-Ps.41,472;30/09/2016-Ps.38,108)
Currentassets Otherassets 111,257 81,468Loanreceivable 1,232
2,473
(Cost:31/12/2016-Ps.1,232;30/09/2016-Ps.2,473)
Recoverabletaxes 149,782 100,541Prepaidexpenses 12,385 4,557Acquisitionprepayment 9,809 16,700Deferredchargesandaccruedincome 173,361 156,441Accountsreceivable 43,417 63,221(Netofallowancefordoubtfulaccounts:31/12/2016-Ps.167,619;30/09/2016-Ps.149,154)
Restrictedcash 89,137 97,896
Cashandcashequivalents 4,297,096 4,838,822
Totalassets 39,882,190 37,914,900
NetassetsattributabletoInvestors Contributions,net 14,782,859
14,782,859
Retainedearnings 334,283
-Currencytranslationadjustment 9,663,287
8,292,131
Totalnetassets(NetEquity) 24,780,429 23,074,990
Liabilities
Non-currentliabilities
Borrowings 13,879,906 13,503,704(Cost:31/12/2016-$14,126,686;30/09/2016-$13,347,897)
Tenantdeposits 198,002
178,732
Accountspayable 5,421
4,981Currentliabilities Tradeandotherpayables 295,138 461,586Borrowings 681,609 642,743
(Cost:31/12/2016-Ps.681,609;30/09/2016-Ps.642,743)
Tenantdeposits 41,685
48,164
Totalliabilities(excludingnetassetsattributabletotheInvestors) 15,101,761 14,839,910
Totalnetassetsandliabilities 39,882,190 37,914,900

31
FinancialStatements
CashFlowStatement Dec-16
(thousandsofpesos)
Cashflowsfromoperatingactivities(Loss)profitfortheperiod $949,212
Adjustments:Netloss(gain)unrealizedfromfairvalueadjustmentoninvestmentproperties 235,901
Netloss(gain)unrealizedfromfairvalueadjustmentonborrowings (55,234)Netloss(gain)unrealizedfromfairvalueadjustmentonloansreceivable 44Netloss(gain)unrealizedfromfairvalueadjustmentonderivativefinancialinstruments 18Realizedgainfromdisposalofinvestmentproperties (56,491)
Baddebtexpense 35,284
Interestexpense 658,678
Interestincomeonbankaccounts (4,208)
Shareofprofitfromequityaccountedinvestments (47,643)
Decrease(increase)deferredrentsreceivable (61,467)
Decrease(increase)inrestrictedcash (31,094)
Decrease(increase)inaccountsreceivable (12,229)
Decrease(increase)inrecoverabletaxes 179,922
Decrease(increase)inprepaidexpenses (2,473)
Decrease(increase)inotherassets (18,497)
Decrease(increase)intenantdeposits 40,395
(Decrease)inaccountspayable (54,578)
Netcash(usedin)generatedfromoperatingactivities 1,755,540
CashflowsfrominvestingactivitiesAcquisitionssofinvestmentproperties (524,148)
Improvementsofinvestmentproperties (286,028)
Proceedsfromdispositionsofinvestmentproperties 129,188
Acquisitionprepayment (5,632)
Interestincomeonbankaccounts 4,208
Investmentsinjointventure (55,203)
Loansreceivabledeposit (37,705)
Loansreceivablepayment 637
Netcash(usedin)generatedfrominvestingactivities (774,683)
CashflowsfromfinancingactivitiesProceedsfromborrowings 2,894,910
Principalpaymentsonborrowings (2,918,819)
Interestexpense (658,678)
Distributionstoinvestors (1,266,206)
ProceedsfromCBFI,netofissuingcost 5,013
Netcash(usedin)generatedfromfinancingactivities (1,943,780)
Net(decrease)incashandcashequivalents (962,923)
Cashandcashequivalentsatthebeginningoftheperiod 4,467,863
Exchangeeffectsoncashandcashequivalents 792,156
Cashandcashequivalentsattheendoftheperiod 4,297,096
32
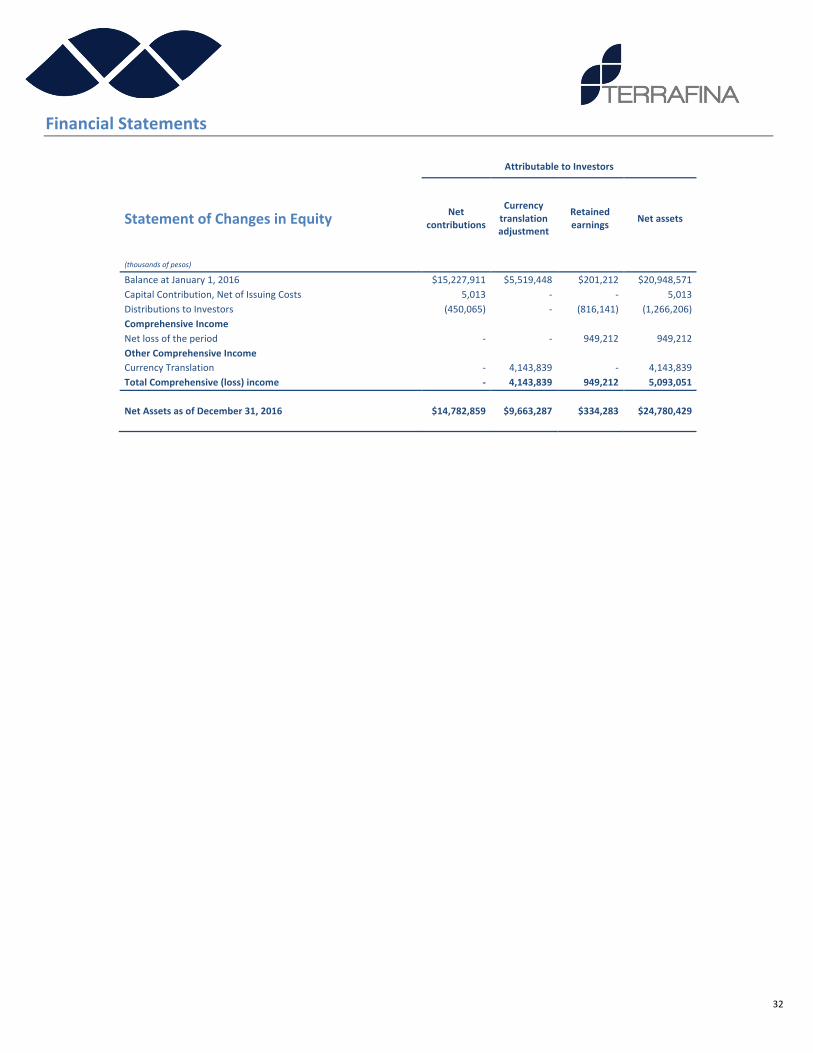
FinancialStatements AttributabletoInvestors
StatementofChangesinEquity Netcontributions
Currencytranslationadjustment
Retainedearnings Netassets
(thousandsofpesos) BalanceatJanuary1,2016 $15,227,911 $5,519,448 $201,212 $20,948,571CapitalContribution,NetofIssuingCosts 5,013 - - 5,013DistributionstoInvestors (450,065) - (816,141) (1,266,206)ComprehensiveIncome Netlossoftheperiod - - 949,212 949,212OtherComprehensiveIncome CurrencyTranslation - 4,143,839 - 4,143,839TotalComprehensive(loss)income - 4,143,839 949,212 5,093,051
NetAssetsasofDecember31,2016 $14,782,859 $9,663,287 $334,283 $24,780,429


![[XLS]upmsp.edu.in · Web view98.2 98 98 97.8 97.4 97.2 96.8 96.6 96.4 96 96 96 95.8 95.8 95.6 95.6 95.4 95.2 95.2 95.2 95 94.8 94.8 94.8 94.8 94.6 94.6 94.6 94.6 94.4 94.4 94.4 94.4](https://img.pdfslide.us/doc/110x75/5ad1ed257f8b9a86158c82d4/xlsupmspeduin-view982-98-98-978-974-972-968-966-964-96-96-96-958-958.jpg)