Embed Size (px)
Citation preview

2015/2016
Annual Results
Presentation
8 June 2016
14/15 15/16 14/15 15/16
14/15 15/16 14/15 15/16
P.2
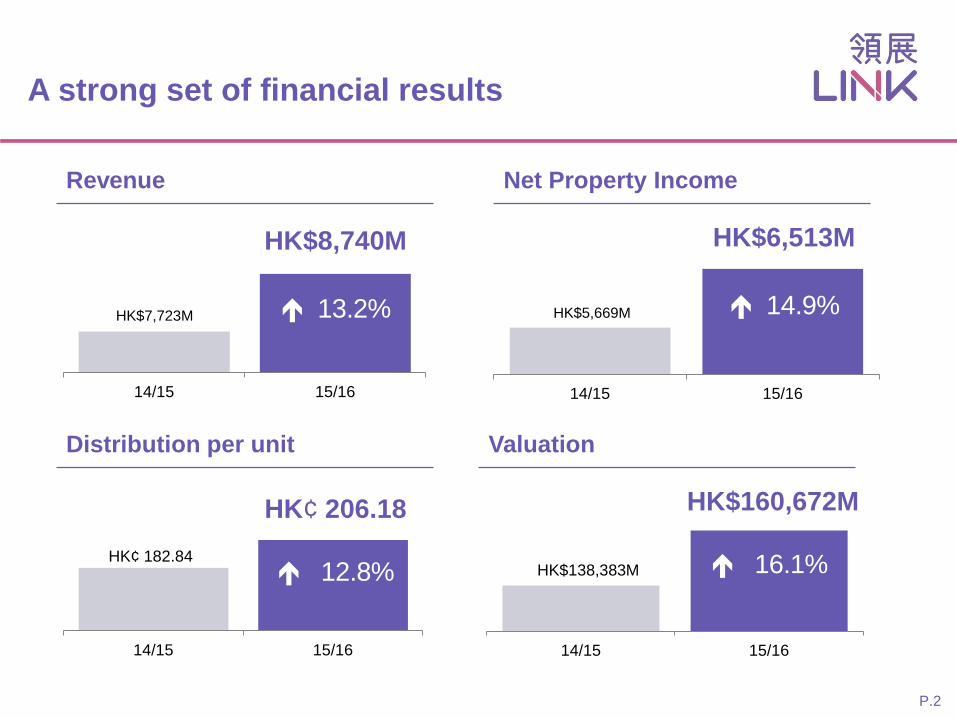
HK$6,513M
HK$5,669M
HK¢ 206.18
HK¢ 182.84
HK$160,672M
HK$138,383M
HK$8,740M
HK$7,723M
A strong set of financial results
13.2% 14.9%
12.8% 16.1%
Revenue Net Property Income
Distribution per unit Valuation

Social contributions
Improving portfolio quality
P.3
High productivity
5.2%
44
26.3% HK$27.9M
Tenant gross sales
YoY growth
Completed AE
projects to date
Reduction in energy consumption
since 2010
Amount donated through Link Together Initiatives
since 2013
Impressive non-financial performance
Occupancy
96%
Retention rate
78% 11.7%
Rent to sales ratio
16,000+ Tenant Academy
participants to date
14
Fresh markets
upgraded to date(1)
Notes: (1) Includes nine fresh markets refurbished by third party market operators. (2) Figures represent Hong Kong portfolio only.

Building a diverse and quality portfolio across
Hong Kong, Beijing and Shanghai
P.4
EC Mall, Beijing
Recent acquisitions
Total area of approximately 2.1 million sq.ft.
Corporate Avenue 1&2, Shanghai 700 Nathan Road, Mongkok
Artist rendering

Our strategic priorities rooted in the
sustainability framework
P.5
Notes: (1) Acquisition of 700 Nathan Road was completed on 15 April 2016. (2) Latest disposal of 9 non-core assets was completed on 31 May 2016.
Maintaining a prudent
and flexible capital
structure
Building a more
productive and higher
quality portfolio
Developing a strong
management team
Helping our tenants and
communities grow while
delighting shoppers
Asset/Brand
Maintained A and A2
credit ratings by S&P
and Moody’s
Hosted brand launch
events to align brand
message
Fixed rate debt/total
debt ratio at 63%
Reduced effective
interest rate to 2.57%
Organised 15 Tenant
Academy sessions
Launched Park &
Dine mobile app
2 3 4 1
Achieved close to zero
attrition rate for high
performing staff
Scored 84/100 in our
Mystery Shopper
Programme
Completed 5 asset
enhancement projects
Acquired 3 new
assets(1)
Disposed 14
assets(2)
Rolled out Asset
Management Model
and portfolio
segmentation
Unit buyback of
50.2M units
Established Link
Volunteer Committee
Staff Tenant Corporate Governance
Economy Community Environment
Our corporate sustainability framework
Our strategic priorities

Financial Review
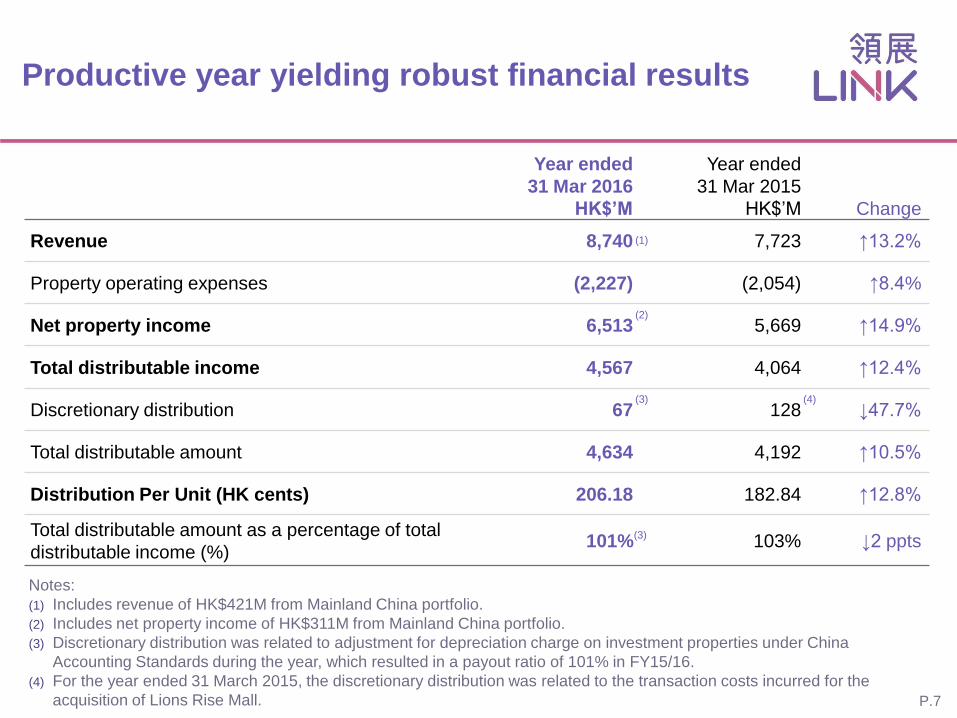
Productive year yielding robust financial results
Year ended
31 Mar 2016
HK$’M
Year ended
31 Mar 2015
HK$’M
Change
Revenue 8,740 7,723 ↑13.2%
Property operating expenses (2,227) (2,054) ↑8.4%
Net property income 6,513 5,669 ↑14.9%
Total distributable income 4,567 4,064 ↑12.4%
Discretionary distribution 67 128 ↓47.7%
Total distributable amount 4,634 4,192 ↑10.5%
Distribution Per Unit (HK cents) 206.18 182.84 ↑12.8%
Total distributable amount as a percentage of total
distributable income (%) 101% 103% ↓2 ppts
Notes:
(1) Includes revenue of HK$421M from Mainland China portfolio.
(2) Includes net property income of HK$311M from Mainland China portfolio.
(3) Discretionary distribution was related to adjustment for depreciation charge on investment properties under China
Accounting Standards during the year, which resulted in a payout ratio of 101% in FY15/16.
(4) For the year ended 31 March 2015, the discretionary distribution was related to the transaction costs incurred for the
acquisition of Lions Rise Mall. P.7
(1)
(2)
(3)
(3)
(4)

71.3%
18.0%
3.9% 2.5% 4.3%
Value creation through portfolio upgrade
and acquisitions
P.8
Notes:
(1) As at 31 Mar 2016.
(2) Hong Kong office is under development and is valued using residual method.
1
2 3
4 5
Asset type
Mar-16
HK$’M
Mar-15
HK$’M Change
1. Hong Kong retail 114,492 107,326 ↑6.7%
2. Hong Kong car park 28,888 25,177 ↑14.7%
3. Hong Kong office (2) 6,300 5,880 ↑7.1%
4. Mainland China retail 4,116 - -
5. Mainland China office 6,876 - -
Total 160,672 138,383 ↑16.1% Mainland China
6.8%
Hong Kong
93.2%
Valuation (1)
HK$56.79 NAV per unit
Hong Kong
Retail 4.54%
Car park 4.78%
Overall 4.59%
Mainland China
Retail 4.50-5.00%
Office 4.00%
Portfolio mix (1)
Capitalisation rate (1)

19.9%
18.5%
11.3%
28.3%
22.0%
Increased financial leverage supported by
disciplined capital management
P.9
Mar-16
HK$’B
1. Bank loans – revolving 6.9
2. Bank loans – term 6.4
3. MTN – listed 3.9
4. MTN – unlisted 9.8
5. Undrawn facilities 7.6
Total
committed
facilities
HK$ 34.6B
1
2
3
Credit ratings (1)
Moody’s
A2/Stable S&P
A/Negative
Gearing ratio (1)
16.5%
Note: (1) As at 31 March 2016.
Total debt
HK$27.0B
(all unsecured)
4
5
Diverse funding sources
Effective interest
rate (1)
5.0 years
31 Mar 2015 5.2 years
2.57%
31 Mar 2015 2.66%
Committed debt
maturity (1)
31 Mar 2015 A2/Stable
A/Stable
31 Mar 2015 11.9%
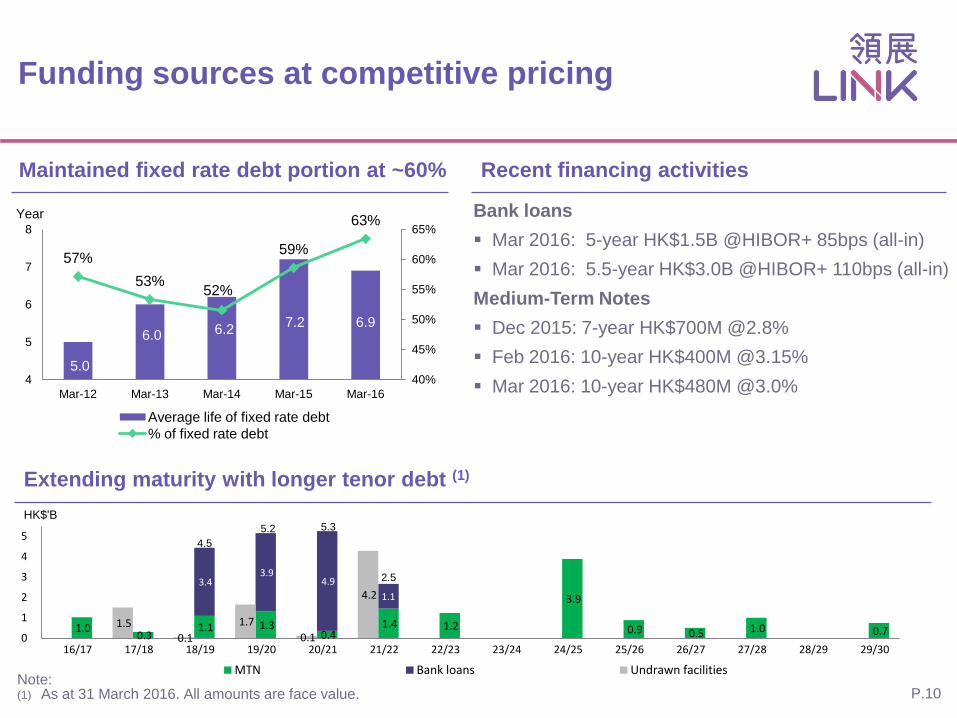
Funding sources at competitive pricing
Note: (1) As at 31 March 2016. All amounts are face value. P.10
HK$'B
Bank loans
Mar 2016: 5-year HK$1.5B @HIBOR+ 85bps (all-in)
Mar 2016: 5.5-year HK$3.0B @HIBOR+ 110bps (all-in)
Medium-Term Notes
Dec 2015: 7-year HK$700M @2.8%
Feb 2016: 10-year HK$400M @3.15%
Mar 2016: 10-year HK$480M @3.0%
5.0
6.0 6.2 7.2 6.9
57%
53% 52%
59%
63%
40%
45%
50%
55%
60%
65%
4
5
6
7
8
Mar-12 Mar-13 Mar-14 Mar-15 Mar-16
Average life of fixed rate debt
% of fixed rate debt
Year
Maintained fixed rate debt portion at ~60% Recent financing activities
Extending maturity with longer tenor debt (1)
1.0 0.3
1.1 1.3 0.4
1.4 1.2
3.9
0.9 0.5 1.0 0.7
3.4 3.9
4.9
1.1
1.5 0.1
1.7
0.1
4.2
0
1
2
3
4
5
16/17 17/18 18/19 19/20 20/21 21/22 22/23 23/24 24/25 25/26 26/27 27/28 28/29 29/30
MTN Bank loans Undrawn facilities
4.5
5.2 5.3
2.5

Hong Kong Portfolio
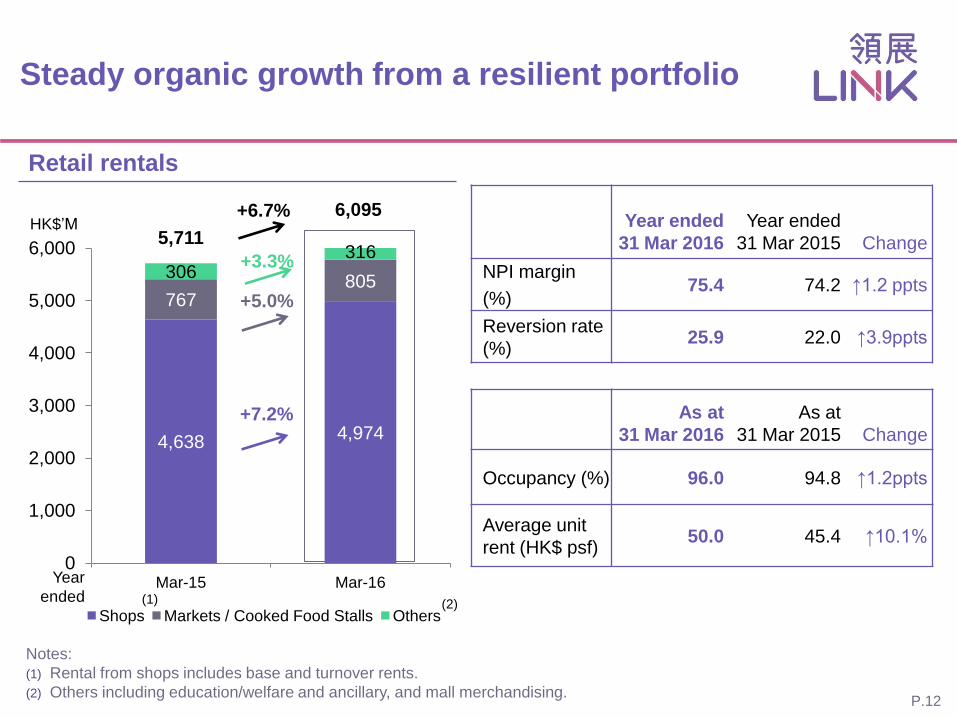
Steady organic growth from a resilient portfolio
P.12
5,711
6,095 Year ended
31 Mar 2016
Year ended
31 Mar 2015 Change
NPI margin
(%) 75.4 74.2 ↑1.2 ppts
Reversion rate
(%) 25.9 22.0 ↑3.9ppts
As at
31 Mar 2016
As at
31 Mar 2015 Change
Occupancy (%) 96.0 94.8 ↑1.2ppts
Average unit
rent (HK$ psf) 50.0 45.4 ↑10.1%
Notes:
(1) Rental from shops includes base and turnover rents.
(2) Others including education/welfare and ancillary, and mall merchandising.
4,638 4,974
767 805
306 316
0
1,000
2,000
3,000
4,000
5,000
6,000
Mar-15 Mar-16
Shops Markets / Cooked Food Stalls Others (1) (2)
+6.7%
+7.2%
+5.0%
+3.3%
HK$’M
Year
ended
Retail rentals

10.6%
0.8%
4.8% 5.2%
3.5%
1.5%
-8.2%
-4.7%
Food & Beverage Supermarkets & Foodstuff
General Retail Overall
Apr 15 - Mar 16 (Link) Apr 15 - Mar 16 (HK)
(3)
P.13
(YoY)
Notes:
(1) Percentage figures represent year-on-year change in tenants’ average monthly sales per square foot of the respective periods.
(2) A ratio of base rent plus management fee to tenants’ gross sales.
(3) Including services, personal care/ medicine, valuable goods and others.
11.6%
9.9%
14.1%
11.7%
Food & Beverage
Supermarkets & Foodstuff
General Retail Overall (3)
Link tenants continued to outperform the market
Link’s tenant sales growth vs HK (1) Rent to sales ratio (2)

Stable trade mix with good demand from
mass market retailers
P.14
Note: (1) Including clothing, department store, electrical and household products, optical, books and stationery, newspaper,
leisure and entertainment.
62.4% food
related
trades
Mar-16
1. Food and beverage 26.4%
2. Supermarket and foodstuff 21.9%
3. Markets/ Cooked food stalls 14.1%
4. Services 10.7%
5. Personal care/ Medicine 6.3%
6. Education/ Welfare and ancillary 1.2%
7. Valuable goods (Jewellery, watches and clocks) 0.7%
8. Others (1) 18.7%
1
2
3
4
5 6 7
8
Mar-14: 8 shops
Mar-16: 12 shops Mar-14: 5 shops
Mar-16: 8 shops
Mar-14: 0 shops
Mar-16: 8 shops
Mar-14: 0 shops
Mar-16: 3 shops
Selected new tenants
Selected expanding tenants
Trade mix by monthly rent

Under-supply of parking spaces underlies car park
income growth
P.15
Year ended
31 Mar
2016
Year ended
31 Mar
2015 Change
NPI margin
(%) 71.8 70.3 ↑1.5ppts
Car park income
per space per
month (HK$)
2,022 1,767 ↑14.4%(1)
Average valuation
per space
(HK$’000)
384 330 ↑16.4%
1 2
1,224 1,381
432
465
0
200
400
600
800
1,000
1,200
1,400
1,600
1,800
2,000
Mar-15 Mar-16
Monthly Hourly
HK$’M
Year
ended
+11.5%
+12.8%
+7.6%
1,656
1,846
Car park rentals
Note: (1) Increase was due to better utilisation and higher rates.

Cost control integrated into daily operations
P.16
1 2
161 155
113 118 108 117
236 271
300 298
201 213
381 365
554 580
0
200
400
600
800
1000
1200
1400
1600
1800
2000
2200
Mar-15 Mar-16
Property managers' fees, security and cleaning
Staff costs
Repair and maintenance
Utilities
Government rent and rates
Promotion and marketing expenses
Estate common area costs
Other property operating expenses
HK$’M
Year
ended
+3.1%
2,054
2,117 Property manager’s fees,
security & cleaning
Staff costs
Utilities
Repair & maintenance
Government rents & rates
Promotion & marketing
Other property operating
expenses
Estate common area costs
+4.7% due to minimum wage
increase
-4.2% due to lower long-term
incentive provisions
-0.7% energy savings
despite tariff increase
+14.8% in line with property
revenue growth
Property operating expenses
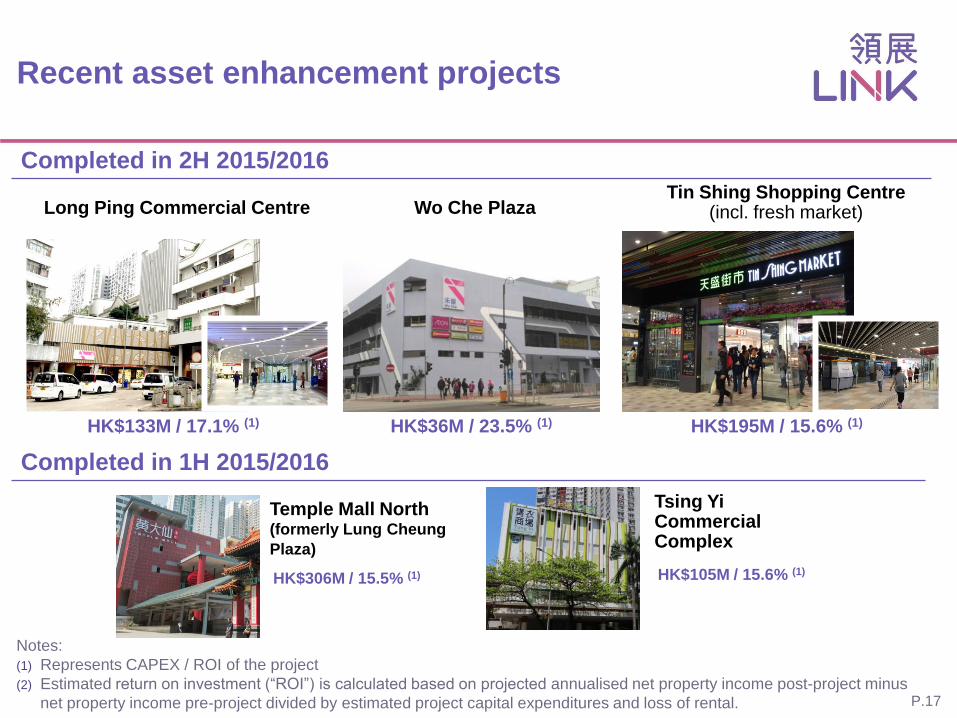
Recent asset enhancement projects
P.17
Notes:
(1) Represents CAPEX / ROI of the project
(2) Estimated return on investment (“ROI”) is calculated based on projected annualised net property income post-project minus
net property income pre-project divided by estimated project capital expenditures and loss of rental.
Long Ping Commercial Centre Wo Che Plaza Tin Shing Shopping Centre
(incl. fresh market)
Completed in 1H 2015/2016
Temple Mall North (formerly Lung Cheung
Plaza)
HK$306M / 15.5% (1)
Tsing Yi Commercial Complex
HK$105M / 15.6% (1)
HK$133M / 17.1% (1)
HK$36M / 23.5% (1)
Completed in 2H 2015/2016
HK$195M / 15.6% (1)
1
2
3
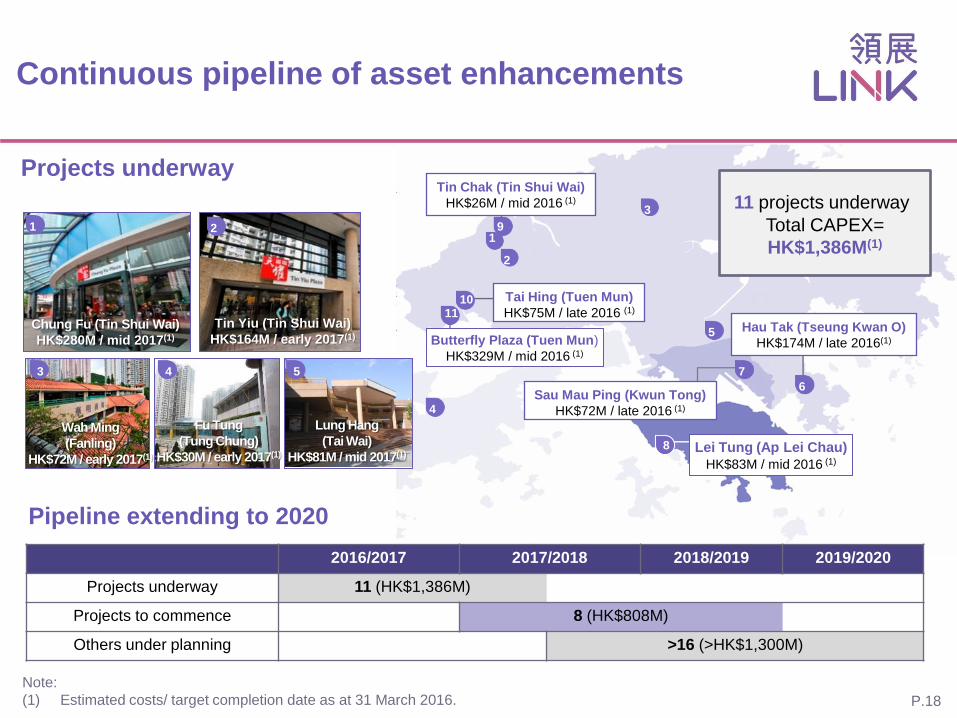
Continuous pipeline of asset enhancements
Note:
(1) Estimated costs/ target completion date as at 31 March 2016.
2016/2017 2017/2018 2018/2019 2019/2020
Projects underway 11 (HK$1,386M)
Projects to commence 8 (HK$808M)
Others under planning >16 (>HK$1,300M)
Pipeline extending to 2020
P.18
Wah Ming
(Fanling)
HK$72M / early 2017(1)
Lung Hang
(Tai Wai)
HK$81M / mid 2017(1)
Fu Tung
(Tung Chung)
HK$30M / early 2017(1)
Projects underway
Sau Mau Ping (Kwun Tong)
HK$72M / late 2016 (1)
Tin Yiu (Tin Shui Wai)
HK$164M / early 2017(1) Chung Fu (Tin Shui Wai)
HK$280M / mid 2017(1)
1 2
3 4
4
5
5 Hau Tak (Tseung Kwan O)
HK$174M / late 2016(1)
Tai Hing (Tuen Mun)
HK$75M / late 2016 (1)
Butterfly Plaza (Tuen Mun)
HK$329M / mid 2016 (1)
Tin Chak (Tin Shui Wai)
HK$26M / mid 2016 (1)
Lei Tung (Ap Lei Chau)
HK$83M / mid 2016 (1)
11 projects underway
Total CAPEX=
HK$1,386M(1)
6
7
8
9
10 11

Case study for post-AE second leasing cycle:
Choi Yuen Plaza
P.19
Chinese restaurant
Korean BBQ
Vietnamese cuisine
Shop
repartition &
tenant mix
enhancement
Chinese restaurant
麗都讌客 Nice Invitation
龍宴 Dragon Feast
自助燒 So Grill 大越 Da Viet
(Total IFA: ~6,600 sq.ft.)
(IFA: ~14,000 sq.ft.)
(IFA: ~21,000 sq.ft.)
In 2012
Completed asset enhancement
4/F whole floor was leased to a
Chinese restaurant
In 2015
Relayout restaurant space into three F&B outlets
Improved footfall and tenant sales
Overall F&B tenant sales increased by over 30%
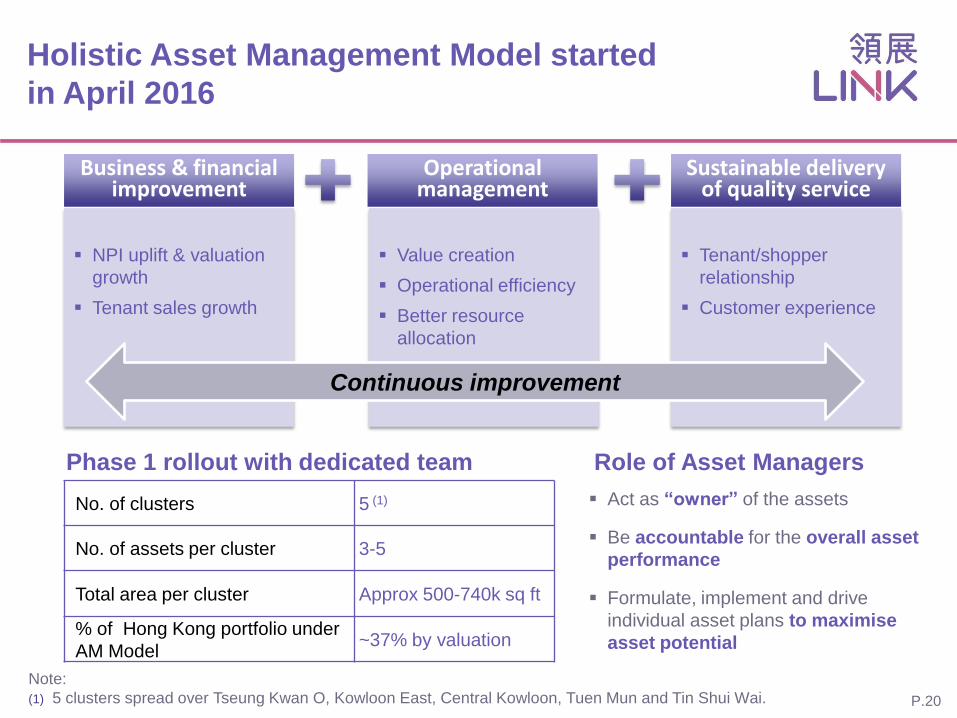
Holistic Asset Management Model started
in April 2016
No. of clusters 5 (1)
No. of assets per cluster 3-5
Total area per cluster Approx 500-740k sq ft
% of Hong Kong portfolio under
AM Model ~37% by valuation
NPI uplift & valuation
growth
Tenant sales growth
Business & financial improvement
Value creation
Operational efficiency
Better resource
allocation
Operational management
Tenant/shopper
relationship
Customer experience
Sustainable delivery of quality service
Continuous improvement
Act as “owner” of the assets
Be accountable for the overall asset
performance
Formulate, implement and drive
individual asset plans to maximise
asset potential
Role of Asset Managers
P.20
Note:
(1) 5 clusters spread over Tseung Kwan O, Kowloon East, Central Kowloon, Tuen Mun and Tin Shui Wai.
Phase 1 rollout with dedicated team

Increased customer engagement with portfolio
focus in F&B
Park & Dine app
Navigation and E-queuing
Partner with MTR for a Park &
Ride offer
F&B tenants joined e-queuing
network
Free wifi service to app
subscribers
P.21
New initiatives
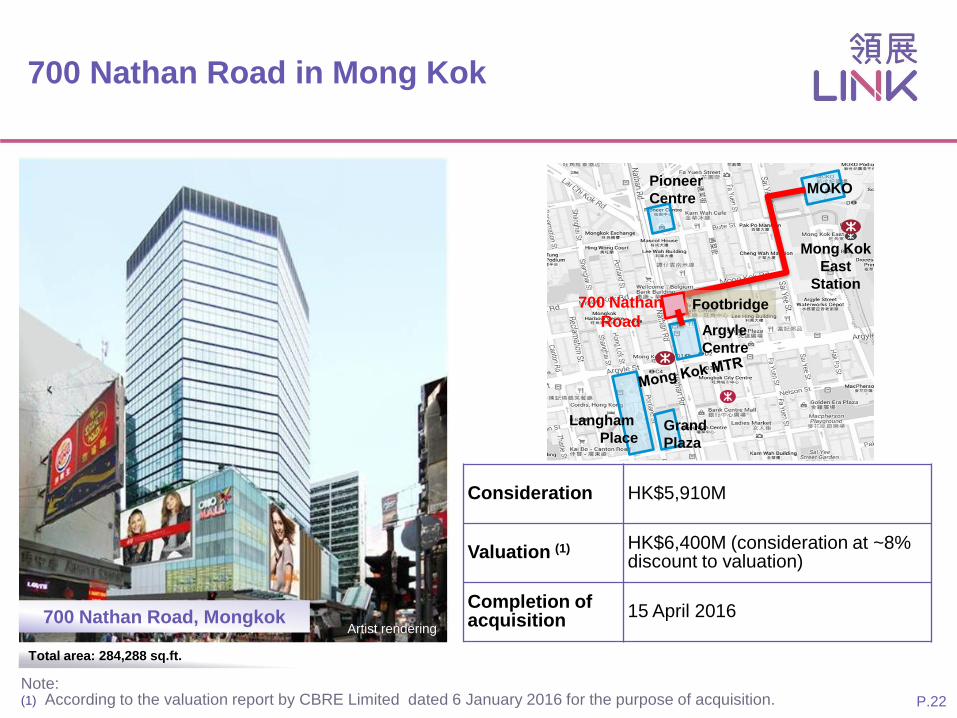
700 Nathan Road in Mong Kok
P.22
700 Nathan Road, Mongkok
MOKO
Mong Kok
East
Station
Pioneer
Centre
Argyle
Centre
Langham
Place Grand
Plaza
700 Nathan
Road Footbridge
Consideration HK$5,910M
Valuation (1) HK$6,400M (consideration at ~8% discount to valuation)
Completion of acquisition
15 April 2016
Total area: 284,288 sq.ft.
Note: (1) According to the valuation report by CBRE Limited dated 6 January 2016 for the purpose of acquisition.
Artist rendering

P.23
700 Nathan Road
A new mass-market retail destination
Proposed tenant mix
Tower (approx. 170,600 sq.ft.)
Semi-retail/services such as medical clinic,
education, sport & fitness, beauty salon, etc
Retail Podium (approx. 114,200 sq.ft.)
General retail targeting a broad range of
shoppers Footbridge
connecting to
Argyle Centre
Direct
access to
MTR
station in
basement
Typical
floorplate:
approx.
11,000 sq.ft.
Latest update
Completed acquisition on 15 April 2016
Engaged various consultants including
architect and traffic consultant
Finalising design and leasing strategy

Kowloon East commercial development in progress
P.24
Notes: (1) Approximate figures as at 31 March 2016. (2) Required to be completed by mid 2020 according to land lease.
Kowloon East Commercial
Development
Total area: 884,000 sq.ft. (Office: 806,673 sq.ft./ Retail: 77,223 sq.ft.)
Artist rendering
Estimated total development cost (1)
• Land cost • Construction costs and others
HK$10.5B HK$05.9B HK$04.6B
JV partnership 60% Link; 40% Nan Fung Development
Expected completion date (2) 2019
P.25
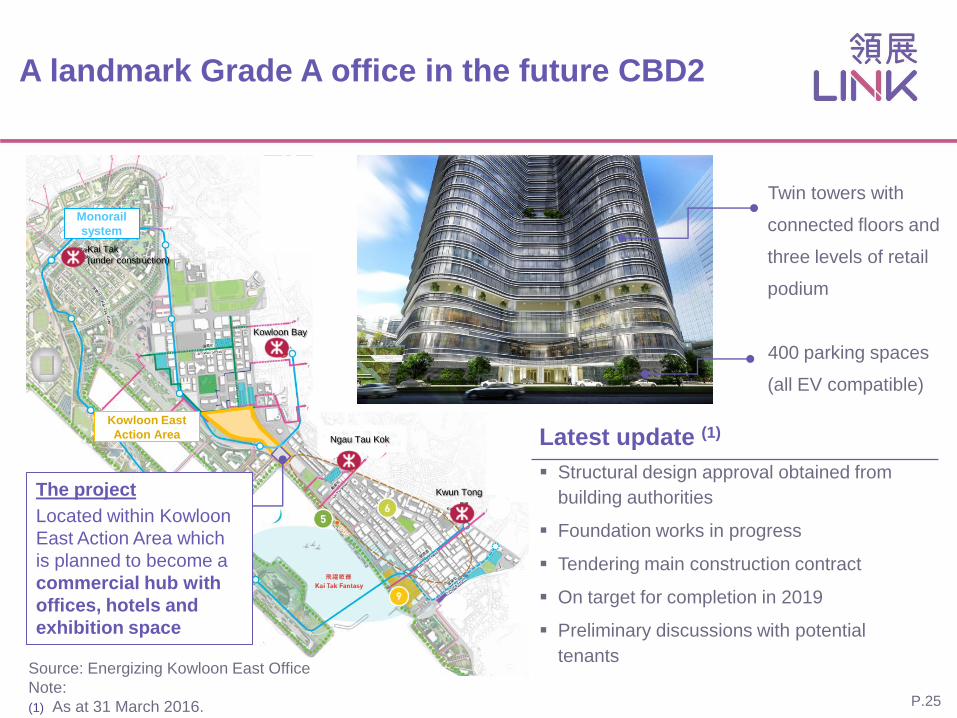
A landmark Grade A office in the future CBD2
Twin towers with
connected floors and
three levels of retail
podium
400 parking spaces
(all EV compatible)
Source: Energizing Kowloon East Office
Note:
(1) As at 31 March 2016.
Latest update (1)
Structural design approval obtained from
building authorities
Foundation works in progress
Tendering main construction contract
On target for completion in 2019
Preliminary discussions with potential
tenants
Monorail
system
Kowloon East
Action Area
Artist rendering
Kai Tak
(under construction)
Kwun Tong The project
Located within Kowloon
East Action Area which
is planned to become a
commercial hub with
offices, hotels and
exhibition space
Kowloon Bay
Ngau Tau Kok

Completion of disposal Dec 2015 May 2016
Number of assets disposed 5 2 7
Aggregate consideration HK$1,716M HK$1,690M HK$1,962M
Premium to valuation 30%(1) 15%(2) 23%(2)
P.26
Note: (1) Compared to valuation as at 30 September 2015. (2) Compared to valuation as at 31 March 2016.
Rationale
Part of the strategy for capital recycling and to enhance
portfolio quality
Use of proceeds
For debt repayment and general working capital
Unit buyback to neutralise loss in distribution
For new investments to expand and upgrade portfolio
Disposal to streamline portfolio and recycle capital
Disposals announced in 2015/2016
Relatively smaller assets
Lack of synergy
Limited AE potential
Disposal criteria

Mainland China Portfolio

EC Mall in Beijing
Delivering results over expectation
P.28
As at
31 March 2016
Occupancy 100%
Year ended
31 March 2016
Reversion 38.7%
Unique asset situated in
a sophisticated area
EC Mall, Beijing
Agreed property price RMB2,500M
Completion of acquisition April 2015
Located in Zhongguancun
Well connected by metro lines
Experienced local staff
Total area: 70,946 sqm
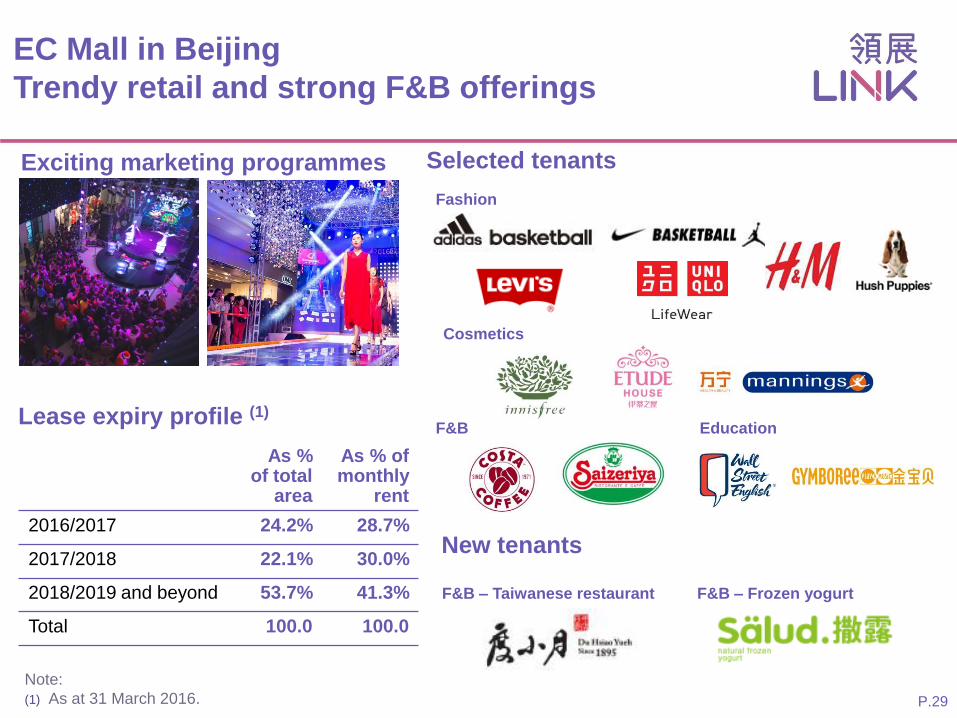
EC Mall in Beijing
Trendy retail and strong F&B offerings
Selected tenants
F&B
Fashion
Cosmetics
Education
P.29
Exciting marketing programmes
As % of total
area
As % of monthly
rent
2016/2017 24.2% 28.7%
2017/2018 22.1% 30.0%
2018/2019 and beyond 53.7% 41.3%
Total 100.0 100.0
Note:
(1) As at 31 March 2016.
New tenants
F&B – Taiwanese restaurant F&B – Frozen yogurt
Lease expiry profile (1)
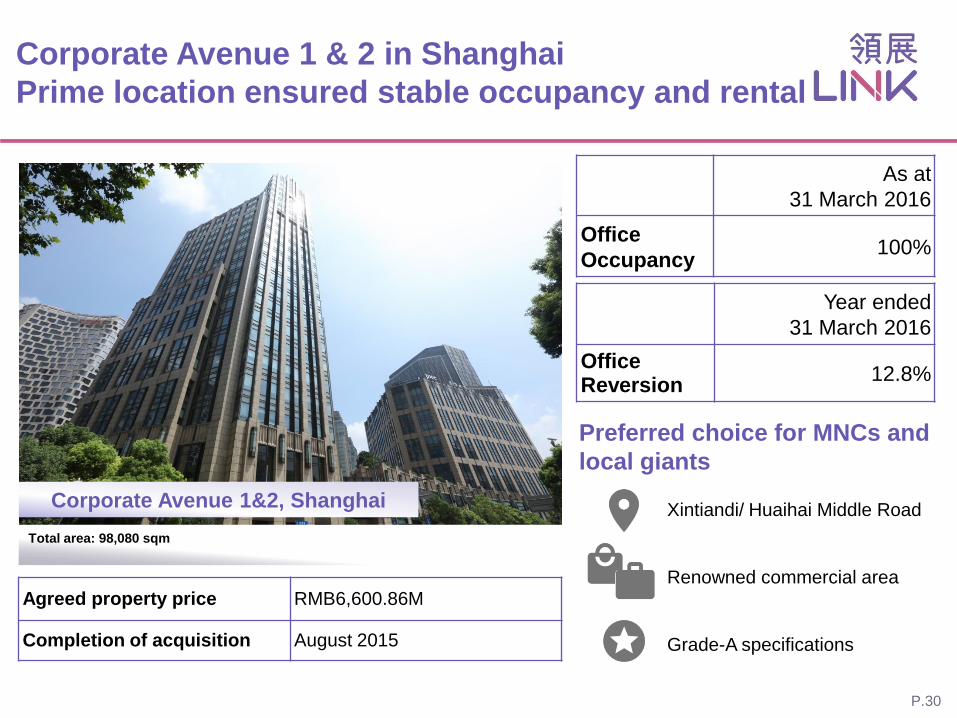
Corporate Avenue 1 & 2 in Shanghai
Prime location ensured stable occupancy and rental
P.30
As at
31 March 2016
Office
Occupancy 100%
Year ended
31 March 2016
Office Reversion
12.8%
Corporate Avenue 1&2, Shanghai
Agreed property price RMB6,600.86M
Completion of acquisition August 2015
Preferred choice for MNCs and
local giants
Xintiandi/ Huaihai Middle Road
Renowned commercial area
Grade-A specifications
Total area: 98,080 sqm
P.31
Note:
(1) As at 31 March 2016.
Stable expiry profile (by base rent) (1)
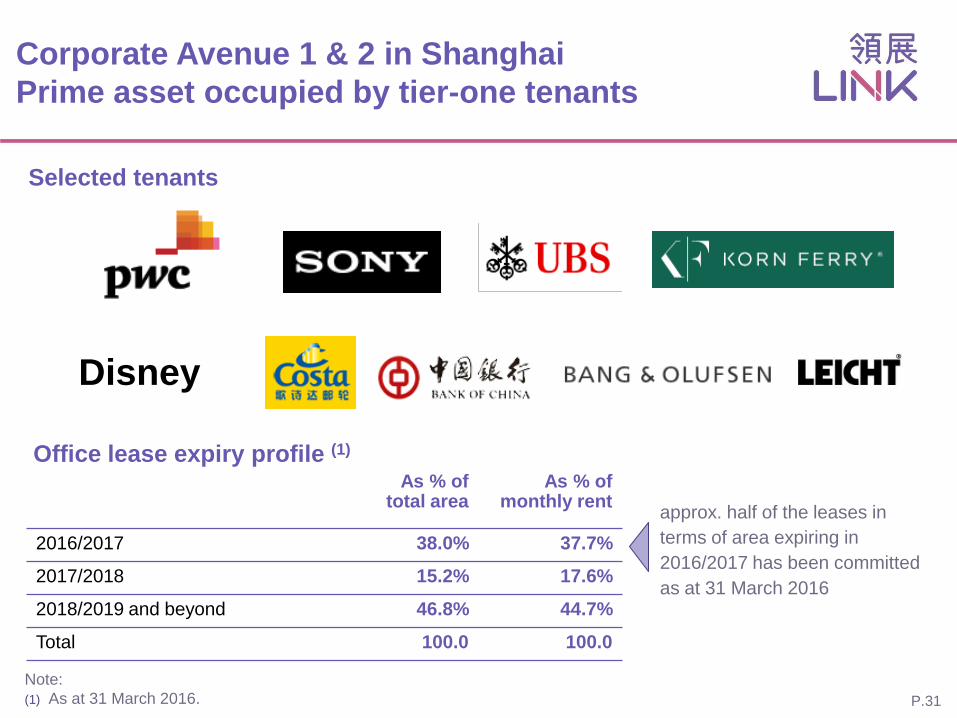
Corporate Avenue 1 & 2 in Shanghai
Prime asset occupied by tier-one tenants
Selected tenants
As % of total area
As % of monthly rent
2016/2017 38.0% 37.7%
2017/2018 15.2% 17.6%
2018/2019 and beyond 46.8% 44.7%
Total 100.0 100.0
Office lease expiry profile (1)
Disney
approx. half of the leases in
terms of area expiring in
2016/2017 has been committed
as at 31 March 2016

Strategy and Outlook

Asset disposal
Active capital recycling
P.33
Improve
portfolio
quality
Capital recycling strategy
Asset
management Asset
enhancement
Invest in long-term growth
Improve operational efficiency
Utilise our leasing and asset enhancement expertise
Acquire better quality and growth potential assets
Dispose non-core assets
Asset
acquisition/
property
development
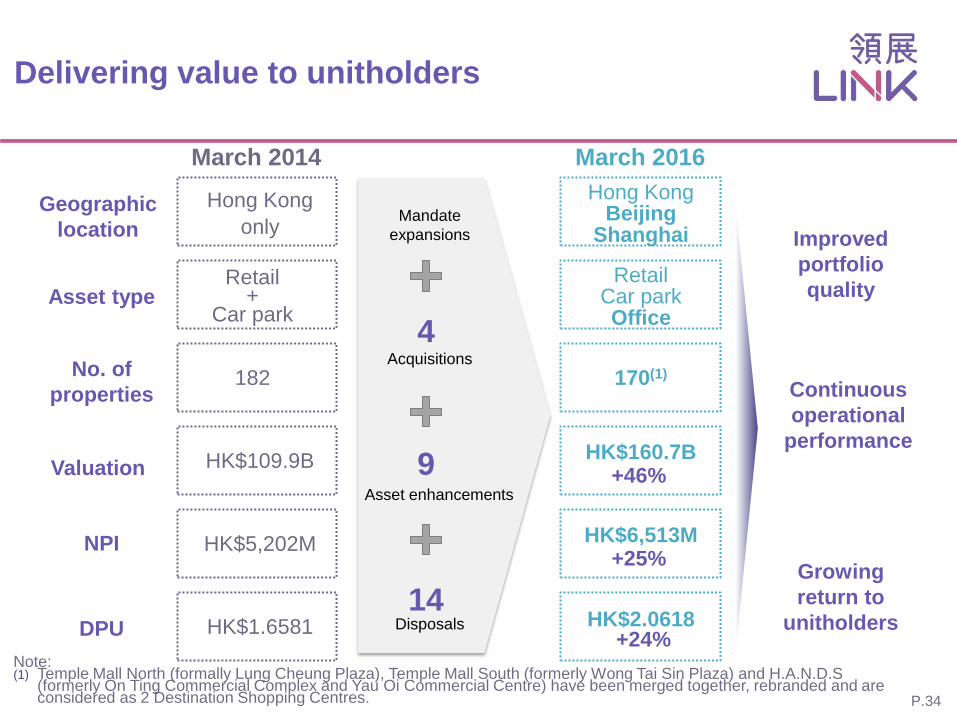
Delivering value to unitholders
P.34
Hong Kong
only
+46%
Valuation
No. of
properties
Geographic
location
NPI
Asset type
DPU
March 2014
March 2016
Mandate
expansions
Disposals
Acquisitions
Hong Kong Beijing
Shanghai
Retail +
Car park
Retail Car park Office
170(1) 182
HK$109.9B HK$160.7B
HK$5,202M HK$6,513M
HK$1.6581 HK$2.0618
4
Asset enhancements
+25%
+24%
Improved
portfolio
quality
Continuous
operational
performance
Growing
return to
unitholders
9
14
Note: (1) Temple Mall North (formally Lung Cheung Plaza), Temple Mall South (formerly Wong Tai Sin Plaza) and H.A.N.D.S
(formerly On Ting Commercial Complex and Yau Oi Commercial Centre) have been merged together, rebranded and are considered as 2 Destination Shopping Centres.

Environmental
Contribute towards building thriving communities
Environmental Social
Staff
P.35
26.3% energy
since 2010
Waste management at
fresh market
Green certification
for assets
7 Service Fund Projects
37 Neighbourhood Projects
100 Link Scholarships
Maintained headcount at ~900 Created Link Volunteer Committee
Organised 15
Tenant Academy
events
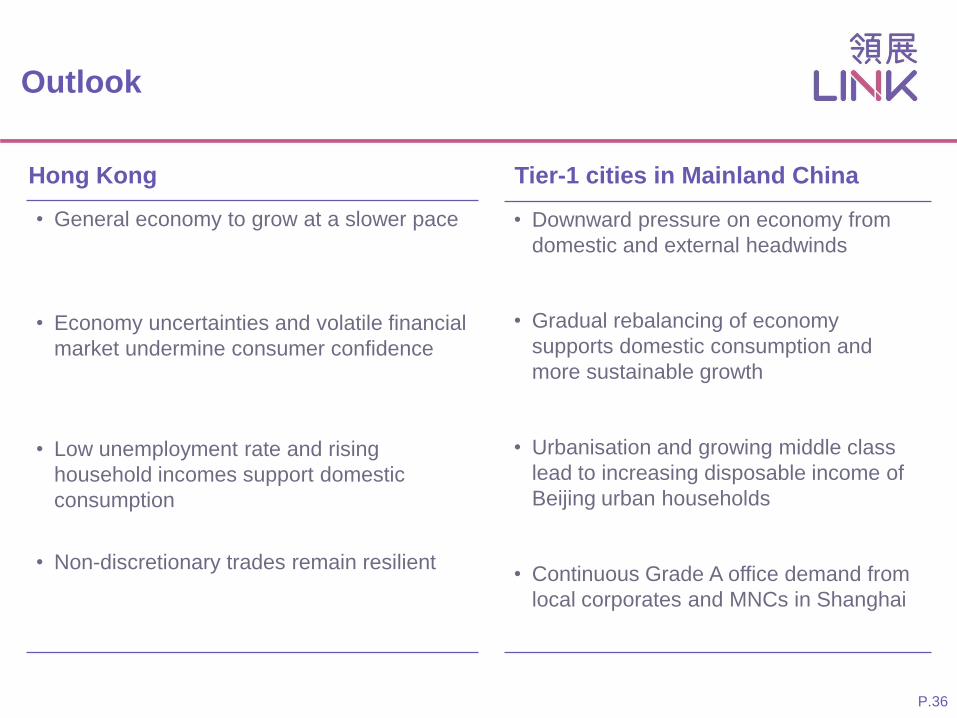
Outlook
• General economy to grow at a slower pace
• Economy uncertainties and volatile financial
market undermine consumer confidence
• Low unemployment rate and rising
household incomes support domestic
consumption
• Non-discretionary trades remain resilient
P.36
Hong Kong Tier-1 cities in Mainland China
• Downward pressure on economy from
domestic and external headwinds
• Gradual rebalancing of economy
supports domestic consumption and
more sustainable growth
• Urbanisation and growing middle class
lead to increasing disposable income of
Beijing urban households
• Continuous Grade A office demand from
local corporates and MNCs in Shanghai

P.37
Focus on core competencies and deliver on our
execution
Notes:
(1) By value of total portfolio.
(2) Investment cap for property development is 10% of gross asset value as stipulated in the HK REIT Code.
(3) Regulatory limit for gearing ratio is 45% under HK REIT Code.
On capital management
• Ensure attractive cost of funding
• Gearing ratio (3) : below 25%
Mass market retail remains as core
Seek growth opportunities by
fine-tuning tenant mix
Maintain strong financial position
Remain prudent and selective on
new investments
On portfolio mix • Core market : Hong Kong
• Mainland China : below 12.5%
• Office : below 12.5%
• Property development (2) : in HK only and below 10%
Management guidance

Building a sustainable business
Transformation of Link
from being a passive manager of a
portfolio of legacy assets to
becoming
an innovative and world-class
real estate investor and manager
P.38
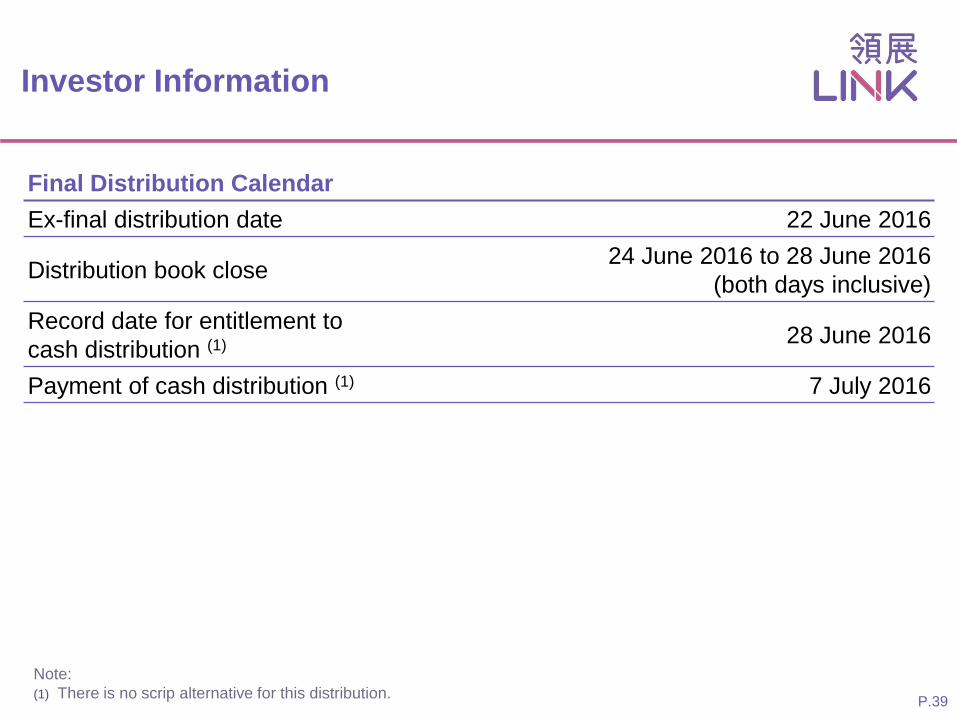
Investor Information
Final Distribution Calendar
Ex-final distribution date 22 June 2016
Distribution book close 24 June 2016 to 28 June 2016
(both days inclusive)
Record date for entitlement to
cash distribution (1) 28 June 2016
Payment of cash distribution (1) 7 July 2016
P.39
Note:
(1) There is no scrip alternative for this distribution.

Q&A’s

Appendix

Year ended
31 Mar 2016
HK$’M
Year ended
31 Mar 2015
HK$’M
YoY
%
Revenue (1) 8,740 7,723 13.2
Property operating expenses (2,227) (2,054) 8.4
Net property income 6,513 5,669 14.9
General and administrative expenses (368) (437) (15.8)
Interest income 6 32 (81.3)
Finance costs on interest bearing liabilities (508) (359) 41.5
Gain on disposal of investment properties 396 445 (11.0)
Profit before taxation, change in fair values of
investment properties and transactions with
Unitholders
6,039 5,350 12.9
Change in fair values of investment properties 11,263 22,699 (50.4)
Taxation (953) (819) 16.4
Non-controlling interest (54) - N/A
Profit for the year, before transactions with
Unitholders 16,295 27,230 (40.2)
Additional Data 1:
Income Statement Summary
P.42
Note: (1) Revenue recognised during the year comprise retail and commercial properties rentals of HK$6,506M, car parks rentals of
HK$1,846M and other revenues of HK$388M.

Additional Data 2:
Distribution Statement Summary
Year ended
31 Mar 2016
HK$’M
Year ended
31 Mar 2015
HK$’M
YoY
%
Profit for the year, before transactions with Unitholders 16,295 27,230 (40.2)
Change in fair values of investment properties
attributable to Unitholders (11,209) (22,699) (50.6)
Deferred taxation on change in fair values of
investment properties attributable to Unitholders 24 - N/A
Other non-cash income (101) (46) 119.6
Depreciation charge on investment properties under
China Accounting Standards (67) - N/A
Gain on disposal of investment properties, net of
transaction costs (375) (421) (10.9)
Total distributable income 4,567 4,064 12.4
Discretionary distribution 67 128 (47.7)
Total distributable amount 4,634 4,192 10.5
Distribution per unit (HK cents) 206.18 182.84 12.8
P.43
Note:
(1) Discretionary distribution was related to adjustment for depreciation charge on investment properties under China
Accounting Standards during the year.
(1)

Additional Data 3:
Financial Position & Investment Properties
HK$’M
As at 31 Mar 2016
As at 30 Sep 2015
As at 31 Mar 2015
Total Assets 163,452 157,405 143,144
Total Liabilities 36,011 35,209 25,038
Non-controlling interest 54 31 -
Net Assets Attributable to Unitholders 127,387 122,165 118,106
Units in Issue (M) 2,243.1 2,252.5 2,291.8
Net Asset Value Per Unit $56.79 $54.24 $51.53
HK$’M As at
31 Mar 2016
As at
30 Sep 2015
As at
31 Mar 2015
At beginning of period / year 138,383 138,383 109,899
Acquisition 10,974 10,974 1,320
Exchange adjustments (225) (49) -
Additions 1,594 658 6,969
Disposals (1,317) - (2,504)
Change in fair values of investment properties 11,263 5,785 22,699
160,672 155,751 138,383
Reclassify to “Investment properties held for sale” (3,060) (1,317) -
At end of period / year 157,612 154,434 138,383
Financial Position Summary
Fair Value of Investment Properties
(1)
P.44 Note: (1) Represents acquisitions of EC Mall in Beijing and Corporate Avenue 1 & 2 in Shanghai.

HK$’M
As at
31 Mar 2016
As at
31 Mar 2015
Retail properties 114,492 107,326
Car parks 28,888 25,177
Property under development 6,300 5,880
Properties in Mainland China 10,992 -
Total 160,672 138,383
Additional Data 4:
Valuation
P.45
Income Capitalisation Approach – Capitalisation Rate
Hong Kong
Retail properties 3.40 – 5.20% 3.40 – 5.20%
Retail properties: weighted average 4.54% 4.57%
Car parks 3.80 – 6.00% 3.80 – 6.00%
Car parks: weighted average 4.78% 4.78%
Overall weighted average 4.59% 4.61%
Mainland China(1)
Retail properties 4.50 – 5.00% N/A
Office properties 4.00% N/A
DCF Approach – Discount Rate
Hong Kong 7.50% 7.50%
Mainland China (1)
Retail properties 8.00 – 9.00% N/A
Office properties 7.50% N/A Independent valuer: CBRE Note: (1) Acquisitions of EC Mall in Beijing and Corporate Avenue 1 & 2 in Shanghai were completed on 1 April 2015 and 31 August 2015,
respectively.

Additional Data 5:
HK Portfolio - Revenue Analysis
Year
ended
31 Mar 2016
HK$’M
Year
ended
31 Mar 2015
HK$’M
YoY
%
Percentage
contribution
Year ended
31 Mar 2016
%
Retail rentals:
Shops (1) 4,974 4,638 7.2 59.8
Markets / Cooked Food Stalls 805 767 5.0 9.7
Education / Welfare and Ancillary 147 145 1.4 1.8
Mall Merchandising 169 161 5.0 2.0
Car park rentals:
Monthly 1,381 1,224 12.8 16.6
Hourly 465 432 7.6 5.6
Expenses recovery and other miscellaneous revenue:
Property related revenue (2) 378 356 6.2 4.5
Total 8,319 7,723 7.7 100.0
P.46
Note:
(1) Rental from shops includes turnover rent of HK$134 million (2015: HK$169 million).
(2) Including other revenue from retail properties of HK$374 million (2015:HK$353 million) and car park portfolio of
HK$4 million. (2015:HK$3 million).
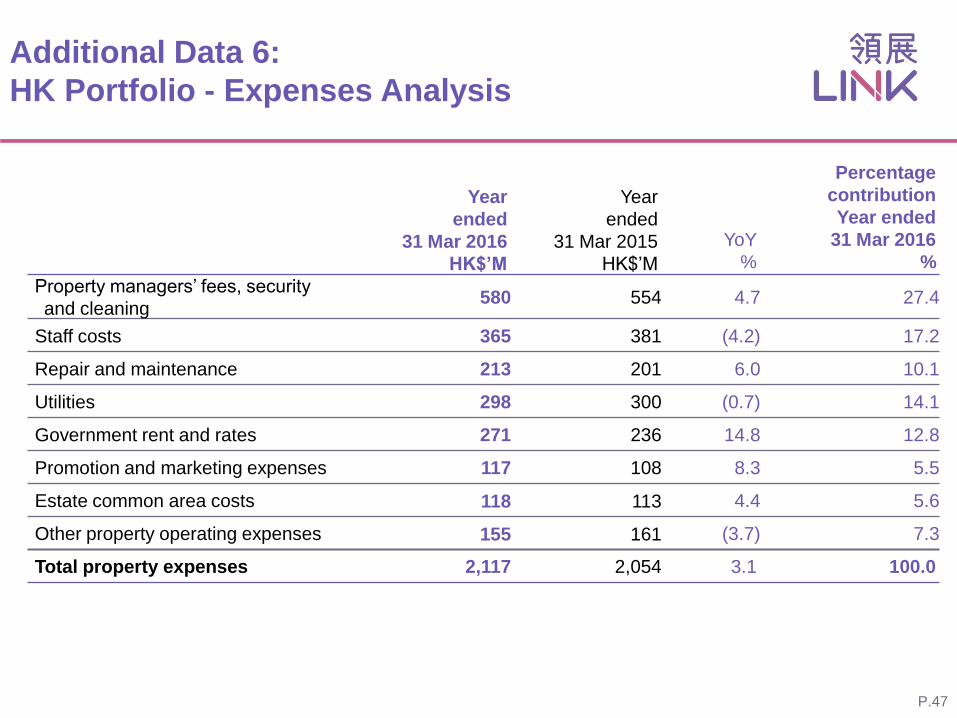
Additional Data 6:
HK Portfolio - Expenses Analysis
Year
ended
31 Mar 2016
HK$’M
Year
ended
31 Mar 2015
HK$’M
YoY
%
Percentage
contribution
Year ended
31 Mar 2016
%
Property managers’ fees, security
and cleaning 580 554 4.7 27.4
Staff costs 365 381 (4.2) 17.2
Repair and maintenance 213 201 6.0 10.1
Utilities 298 300 (0.7) 14.1
Government rent and rates 271 236 14.8 12.8
Promotion and marketing expenses 117 108 8.3 5.5
Estate common area costs 118 113 4.4 5.6
Other property operating expenses 155 161 (3.7) 7.3
Total property expenses 2,117 2,054 3.1 100.0
P.47

Additional Data 7:
HK Portfolio - Retail Properties by Valuation
No. of
properties
Valuation
HK$’M
Retail
rentals
HK$’M
Average monthly
unit rent
HK$ psf
Occupancy rate
%
As at
31 Mar 2016
Year ended
31 Mar
2016
As at
31 Mar
2016
As at
31 Mar
2015
As at
31 Mar
2016
As at
31 Mar
2015
Destination 6 21,463 1,044 70.8 62.3 97.3 96.7
Community 38 58,590 3,013 60.8 55.8 97.0 96.2
Neighbourhood 95 34,439 1,998 34.9 32.8 94.8 93.3
5 properties
disposed in Dec
2015
- - 40 - 25.1 - 91.9
Overall 139 114,492 6,095 50.0 45.4 96.0 94.8
P.48
Notes:
(1) Temple Mall North (formally Lung Cheung Plaza), Temple Mall South (formerly Wong Tai Sin Plaza) and H.A.N.D.S
(formerly On Ting Commercial Complex and Yau Oi Commercial Centre) have been merged together, rebranded and are
considered as 2 destination shopping centres.
(1)

As at
31 Mar 2016
%
As at
31 Mar 2015
%
Food and Beverage 26.4 25.2
Supermarket and Foodstuff 21.9 22.8
Markets / Cooked Food Stalls 14.1 14.1
Services 10.7 11.1
Personal Care/ Medicine 6.3 6.1
Education / Welfare and Ancillary 1.2 1.3
Valuable Goods (Jewellery, Watches and Clocks) 0.7 0.6
Others 18.7 18.8
Total 100.0 100.0
Additional Data 8:
HK Portfolio - Retail Trade Mix by Monthly Base Rent
P.49
Note: (1) Including clothing, department store, electrical and household products, optical, books and stationery, newspaper,
leisure and entertainment.
(1)

Additional Data 9:
HK Portfolio - Portfolio Metrics
As at
31 Mar 2016 As at
31 Mar 2015 Change
Average monthly unit rent (psf pm)
Shops HK$ 50.6 HK$ 45.7 10.7%
Overall (ex Self use office) HK$ 50.0 HK$45.4 10.1%
Occupancy rate
Shops
Markets/Cooked Food Stalls
Education/Welfare and Ancillary
97.1%
89.1%
92.4%
96.5%
86.4%
87.2%
0.6ppts
2.7ppts
5.2ppts Overall 96.0% 94.8% 1.2ppts
Year ended 31 Mar 2016
Year ended 31 Mar 2015
YoY Change
Composite reversion rate
Shops
Markets/Cooked Food Stalls
Education/Welfare and Ancillary
29.0%
10.4%
14.3%
23.3 %
12.0%
20.0%
5.7ppts
(1.6)ppts
(5.7)ppts
Overall 25.9% 22.0 % 3.9ppts
Net property income margin 74.6% 73.4 % 1.2ppts
Car park income per space per month HK$ 2,022 HK$ 1,767 14.4%
P.50
Note:
(1) Despite a slower increase in reversion due to partnership with experienced fresh market operators, improvements in
occupancy and cost savings have been observed.
(1)
(1)
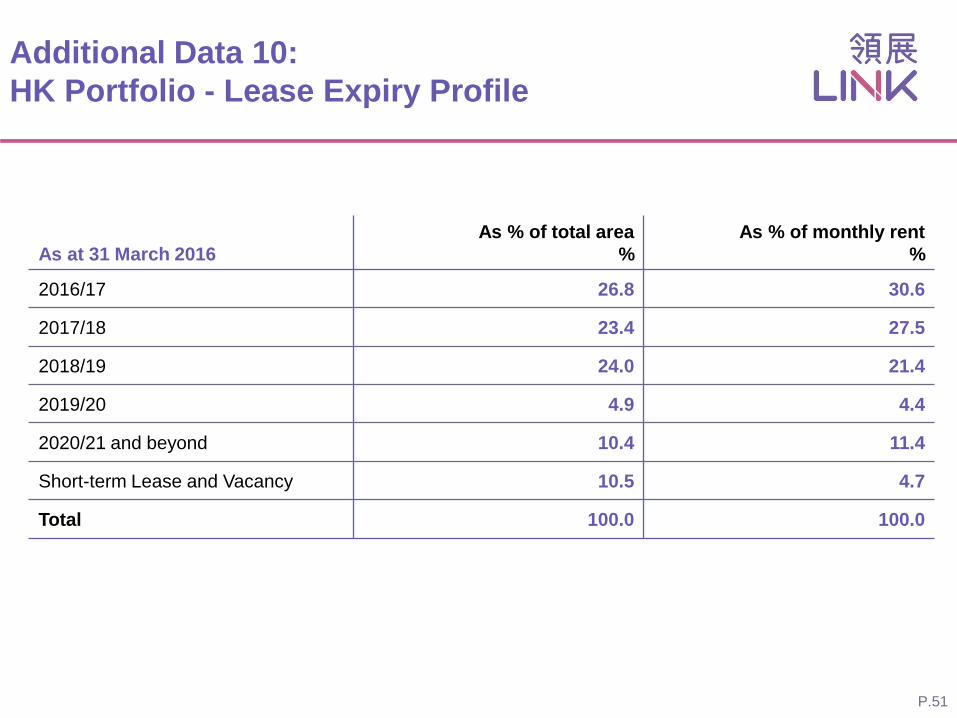
Additional Data 10:
HK Portfolio - Lease Expiry Profile
As at 31 March 2016
As % of total area
%
As % of monthly rent
%
2016/17 26.8 30.6
2017/18 23.4 27.5
2018/19 24.0 21.4
2019/20 4.9 4.4
2020/21 and beyond 10.4 11.4
Short-term Lease and Vacancy 10.5 4.7
Total 100.0 100.0
P.51

Additional Data 11:
Key Credit Metrics by Rating Agencies
As at
31 Mar 16 (3)
As at
31 Mar 15 (4)
S&P
(A / Negative)
Moody’s
(A2 / Stable)
Total debt / total assets 16.5% 11.9% N/A < 30%
Debt / debt and equity (1) 17.3% 10.9% < 35% N/A
FFO (2) / debt 18.2% 29.6% > 15% N/A
EBITDA interest coverage 10.0 x 13.6x N/A > 3.5x
Total debt / EBITDA 4.3 x 3.2x N/A < 5.0x
P.52
Note:
(1) Equity is equal to net assets attributable to Unitholders.
(2) Funds from operations is calculated by net cash generated from operating activities with adjustments for operating lease
expense, interest expenses and income.
(3) Preliminary figures to be confirmed by rating agencies.
(4) Figures based on reports of rating agencies.
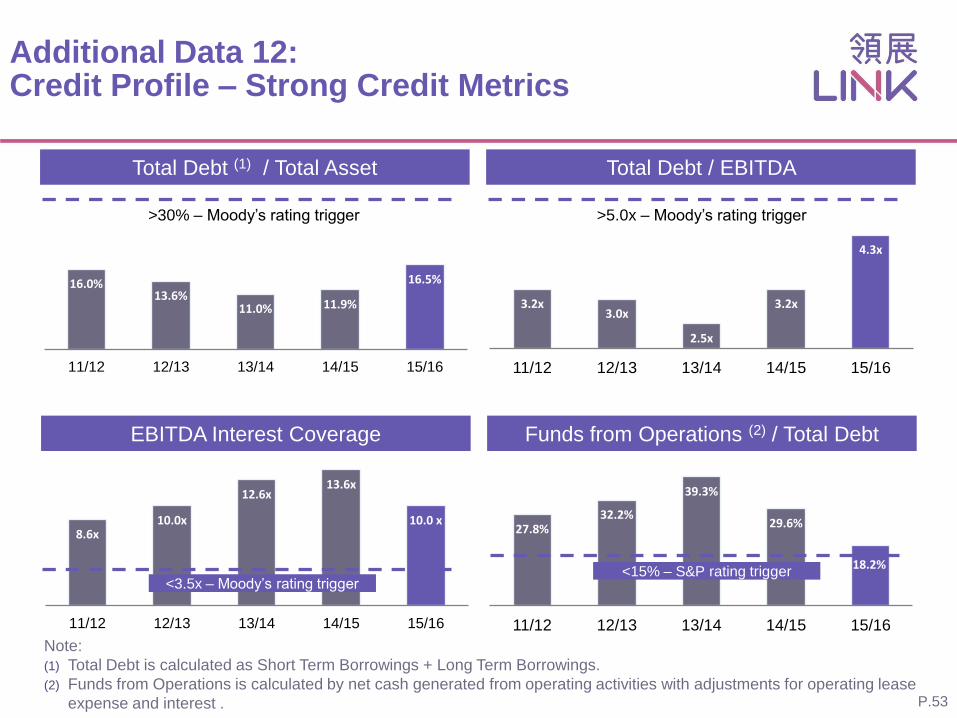
3.2x 3.0x
2.5x
3.2x
4.3x
11/12 12/13 13/14 14/15 15/16
Total Debt (1) / Total Asset Total Debt / EBITDA
EBITDA Interest Coverage Funds from Operations (2) / Total Debt
Additional Data 12: Credit Profile – Strong Credit Metrics
27.8% 32.2%
39.3%
29.6%
18.2%
11/12 12/13 13/14 14/15 15/16
16.0% 13.6%
11.0% 11.9%
16.5%
11/12 12/13 13/14 14/15 15/16
8.6x 10.0x
12.6x 13.6x
10.0 x
11/12 12/13 13/14 14/15 15/16
>30% – Moody’s rating trigger >5.0x – Moody’s rating trigger
<3.5x – Moody’s rating trigger <15% – S&P rating trigger
P.53
Note:
(1) Total Debt is calculated as Short Term Borrowings + Long Term Borrowings.
(2) Funds from Operations is calculated by net cash generated from operating activities with adjustments for operating lease
expense and interest .

Additional Data 13: Year-on-year Change of HK Retail Sales Value
P.54 Source: Census & Statistics Department
-40%
-30%
-20%
-10%
0%
10%
20%
30%
40%
50%
60%
92 93 94 95 96 97 98 99 00 01 02 03 04 05 06 07 08 09 10 11 12 13 14 15 1Q16
Year-on-Year Change of Retail Sales Value
Foods & alcoholic drinks
Supermarkets
Restaurant receipts
Jewellery
Department stores
Clothing
Asian financial crisis
Tech bubble burst
Global financial crisis
SARS outbreak
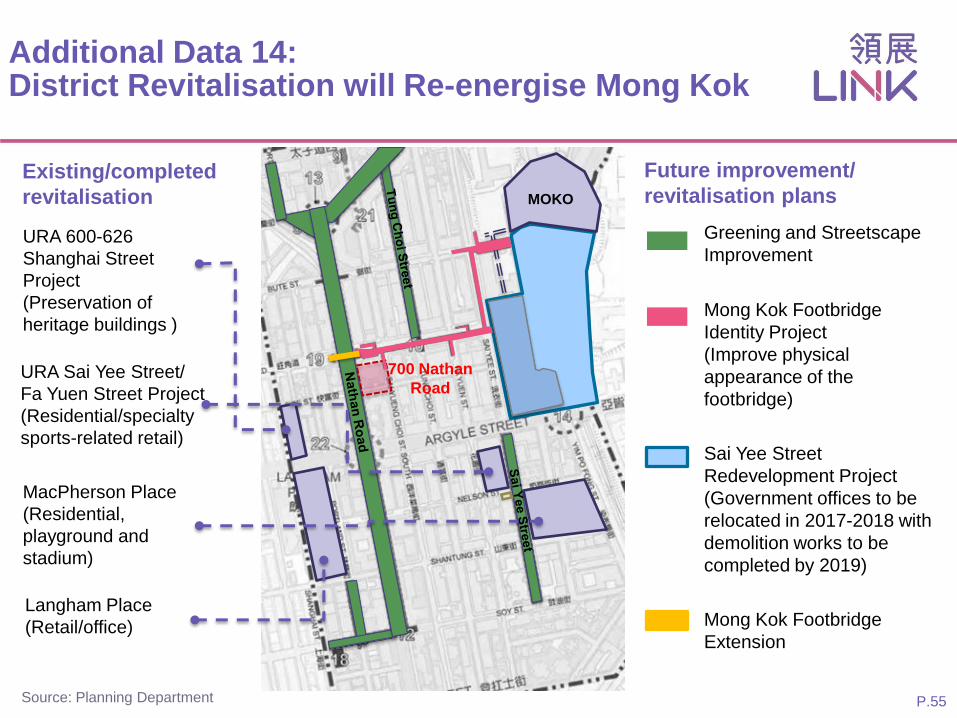
Langham Place
(Retail/office)
URA 600-626
Shanghai Street
Project
(Preservation of
heritage buildings )
Additional Data 14: District Revitalisation will Re-energise Mong Kok
MOKO
700 Nathan
Road
Future improvement/
revitalisation plans
Greening and Streetscape
Improvement
Mong Kok Footbridge
Identity Project
(Improve physical
appearance of the
footbridge)
Sai Yee Street
Redevelopment Project
(Government offices to be
relocated in 2017-2018 with
demolition works to be
completed by 2019)
Mong Kok Footbridge
Extension
MacPherson Place
(Residential,
playground and
stadium)
URA Sai Yee Street/
Fa Yuen Street Project
(Residential/specialty
sports-related retail)
Source: Planning Department P.55
Existing/completed
revitalisation

Additional Data 15:
Kowloon East Office Market Update
P.56 Source: JLL, 1Q2016
Kowloon East single-owned office
vacancy rate comparable to Central
Rental gap between Central and
Kowloon East expected to narrow
0
20
40
60
80
100
120
4Q
07
4Q
08
4Q
09
4Q
10
4Q
11
4Q
12
4Q
13
4Q
14
4Q
15
HK
D p
er
sq f
t p
er
mo
nth
, N
FA
Overall Central Hong Kong East Kowloon East
HK$ 71
3.3%
1.4%
0.8%
5.2%
0% 2% 4% 6% 8% 10%
Vacancy Rate
Kowloon East Hong Kong East Central Overall
Overall HK: 3.3%
Central: 1.4%
Kowloon East: 5.2%
(Single ownership:1.8%
Strata-titled: 10.7%)
1Q
20
16 V
aca
ncy r
ate

Additional Data 16:
Kowloon East - Environmentally Friendly
Linkage System to enhance connectivity
P.57 Source: Energizing Kowloon East Office
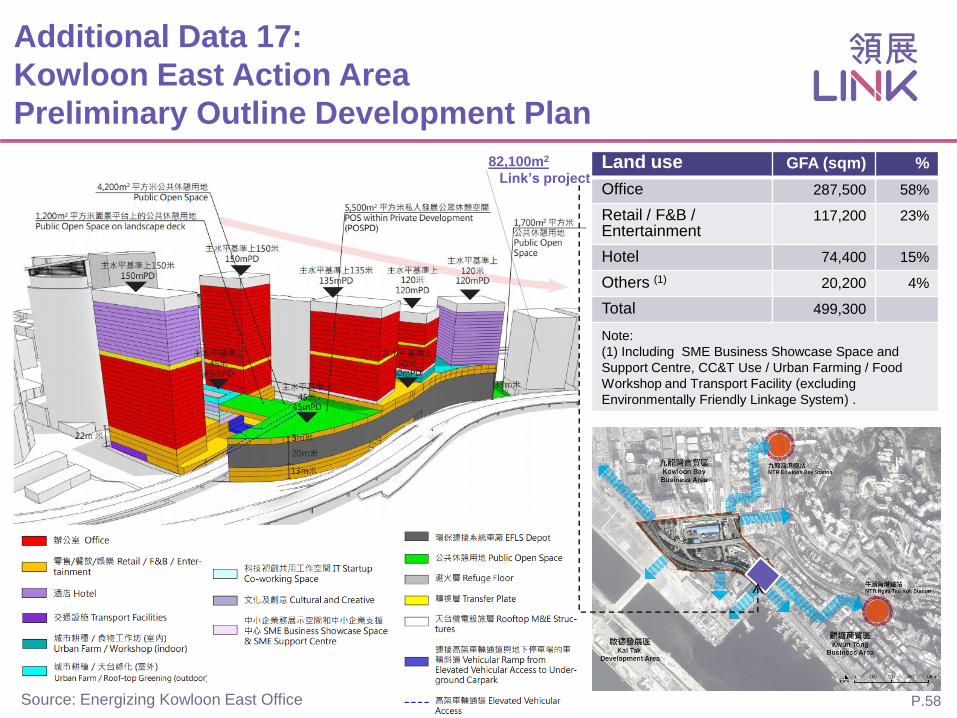
Source: Energizing Kowloon East Office P.58
Additional Data 17:
Kowloon East Action Area
Preliminary Outline Development Plan
82,100m2
Link’s project Land use GFA (sqm) %
Office 287,500 58%
Retail / F&B / Entertainment
117,200 23%
Hotel 74,400 15%
Others (1) 20,200 4%
Total 499,300
Note:
(1) Including SME Business Showcase Space and
Support Centre, CC&T Use / Urban Farming / Food
Workshop and Transport Facility (excluding
Environmentally Friendly Linkage System) .

Source: DTZ Cushman & Wakefield, May 2016
Additional Data 18: Office Supply in Shanghai Core CBDs
P.59
Direct comparables to
Corporate Avenue 1 & 2

Additional Data 19: Land Utilisation in Hong Kong 2014
66.5%
6.1%
4.8%
5.1%
2.3%
2.3% 2.3%
0.4%
6.9% 2.7%
0.6% Woodland/Shrubland/Grassland/Wetland
Agriculture
Other Urban or Built-up Land
Transportation
Open Space
Institutional
Industrial
Commercial
Residential
Water Bodies
Barren Land
Very limited land for commercial use in Hong Kong
Source: Planning Department, HKSAR P.60
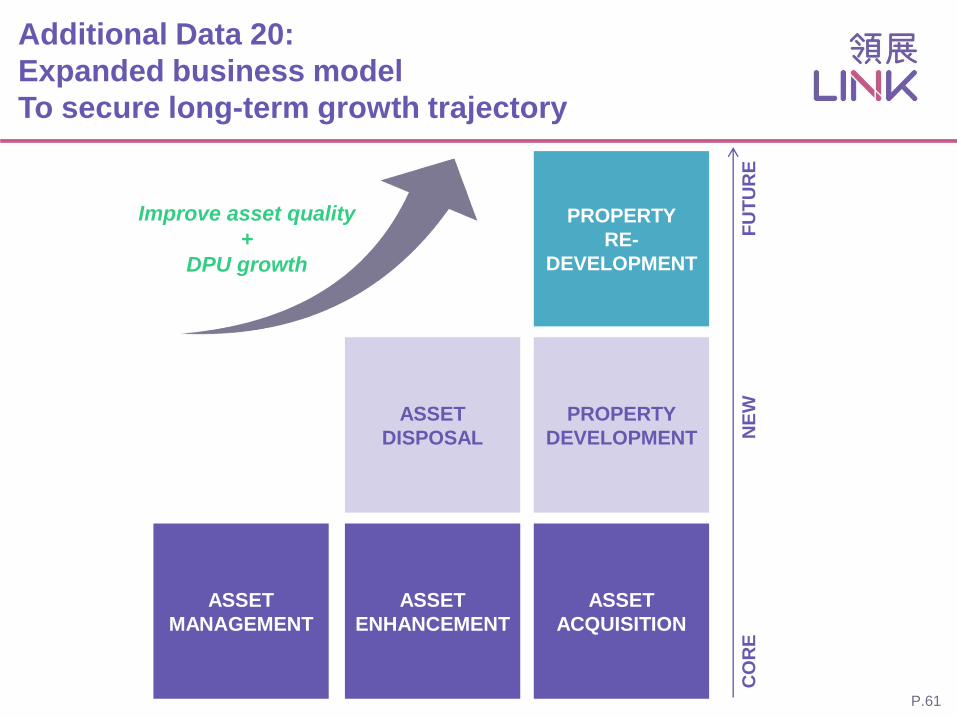
Additional Data 20:
Expanded business model
To secure long-term growth trajectory
PROPERTY
RE-
DEVELOPMENT
ASSET
MANAGEMENT
ASSET
ENHANCEMENT
ASSET
ACQUISITION
ASSET
DISPOSAL
PROPERTY
DEVELOPMENT
CO
RE
N
EW
F
UT
UR
E
Improve asset quality
+
DPU growth
P.61

FY06 FY07 FY08 FY09 FY10 FY11 FY12 FY13 FY14 FY15 FY16 and
beyond
Asset Management Asset Enhancement Asset Acquisition Property Development
DPU
Note:
(1) For illustration purpose only, not to scale
(1)
P.62
Sustain DPU growth
Additional Data 21:
Each growth driver adding to DPU growth

This document has been prepared by Link Asset Management Limited in its capacity as the Manager (the “Manager”) of Link Real Estate Investment Trust (“Link REIT”) solely for use at the presentations/meetings held and may not be reproduced or redistributed without permission. Neither this document nor any copy may be taken or transmitted into or distributed, directly or indirectly, in the United States or to any U.S. person (within the meaning of Regulation S under the United States Securities Act of 1933, as amended). Neither this document nor any copy may be taken or transmitted into or distributed or redistributed in Canada or to the resident thereof. The distribution of this document in other jurisdictions may be restricted by law and persons into whose possession this document comes should inform themselves about, and observe any such restrictions. By attending this presentation/meeting, you are deemed to agree to be bound by the foregoing restrictions and represent that you have understood and accepted the terms of this disclaimer. Any failure to comply with these restrictions may constitute a violation of applicable securities laws.
All information and data are provided for reference only. All opinions expressed herein are based on information available as of the date hereof and are subject to change without notice. The slides forming part of this document have been prepared solely as a support for oral discussion about Link REIT. No representation or warranty, express or implied, is made as to, and no reliance should be placed on, the fairness, accuracy, completeness or suitability of any information or opinion contained herein. None of Link REIT, the Manager, or any of its directors, officers, employees, agents or advisors shall be in any way responsible for the contents hereof, nor shall they be liable for any loss arising from use of the information contained in this presentation or otherwise arising in connection therewith.
This document may contain forward-looking statements. The past performance of Link REIT is not necessary indicative of the future performance of Link REIT and that the actual results may differ materially from those set forth in any forward-looking statements herein. Nothing contained in this document is, or shall be relied on, as a promise or forecast as to the future.
This document does not constitute an offer or invitation to purchase or subscribe for any securities of Link REIT and neither any part of it shall form basis of or be relied upon in connection with any contract, commitment or investment decision whatsoever. No action has been taken or will be taken by Link REIT, the Manager or any of its directors, officers, employees, agents or advisers, to register this document as an offering document or otherwise to permit public distribution of this document.
Disclaimer
P.63


![[XLS]upmsp.edu.in · Web view97.2 97 96.6 95.4 95.4 95.2 95.2 95 94.8 94.8 94.8 94.6 94.6 94.6 94.6 94.6 94.6 94.6 94.6 94.6 94.4 94.4 94.2 94 94 94 94 93.8 93.8 93.6 93.6 93.6 93.6](https://img.pdfslide.us/doc/110x75/5ae04b247f8b9a1c248d01e0/xlsupmspeduin-view972-97-966-954-954-952-952-95-948-948-948-946-946.jpg)


![[XLS]upmsp.edu.in · Web view98.2 98 98 97.8 97.4 97.2 96.8 96.6 96.4 96 96 96 95.8 95.8 95.6 95.6 95.4 95.2 95.2 95.2 95 94.8 94.8 94.8 94.8 94.6 94.6 94.6 94.6 94.4 94.4 94.4 94.4](https://img.pdfslide.us/doc/110x75/5ad1ed257f8b9a86158c82d4/xlsupmspeduin-view982-98-98-978-974-972-968-966-964-96-96-96-958-958.jpg)


