Embed Size (px)
Citation preview

Statewide Summary Report
CALIFORNIA’S FOURTH
CLIMATE CHANGE ASSESSMENT
Coordinating Agencies:
Fourth Climate Change Assessment Statewide Summary Report | 2
CALIFORNIA’S FOURTH
CLIMATE CHANGE ASSESSMENT
Introduction to California’s Fourth Climate Change Assessment
alifornia is a global leader in using, investing in, and advancing research to set proactive climate change policy, and its Climate Change Assessments provide the scientific foundation for understanding climate-related vulnerability at the local scale and informing resilience actions. The Climate Change Assessments directly inform State policies, plans, programs, and guidance to promote effective and integrated action to
safeguard California from climate change.
California’s Fourth Climate Change Assessment (Fourth Assessment) advances actionable science that serves the growing needs of state and local-level decision-makers from a variety of sectors. This cutting-edge research initiative is comprised of a wide-ranging body of technical reports, including rigorous, comprehensive climate change scenarios at a scale suitable for illuminating regional vulnerabilities and localized adaptation strategies in California; datasets and tools that improve integration of observed and projected knowledge about climate change into decision-making; and recommendations and information to directly inform vulnerability assessments and adaptation strategies for California’s energy sector, water resources and management, oceans and coasts, forests, wildfires, agriculture, biodiversity and habitat, and public health. In addition, these technical reports have been distilled into summary reports and a brochure, allowing the public and decision-makers to easily access relevant findings from the Fourth Assessment.
C
• A concise summary of the Fourth Assessment’s most important findings and conclusions.
• An in-depth report on how California’s people, built environment, and ecosystems will be impacted by climate change and how we can proactively adapt, based on the Fourth Assessment’s findings.
• Reports summarizing Fourth Assessment findings to provide a state of the science for nine regions, the ocean and coast, tribal communities, and climate justice in California.
• Academic research that provides robust and detailed results on resilience and vulnerability to climate change.
• A shared foundation of updated climate change projections, data and ecosystem models developed for use by Assessment authors to permit cross-comparability of results and ensure the findings consider a robust range of future climate conditions. These data are available to the public via Cal-Adapt.org.
All research contributing to the Fourth Assessment was peer-reviewed to ensure scientific rigor as well as, where applicable, appropriate representation of the practitioners and stakeholders to whom each report applies.
For the full suite of Fourth Assessment research products, please visit: www.ClimateAssessment.ca.gov
KEY FINDINGS
ASSESSMENT FOUNDATION: UPDATED CLIMATE PROJECTIONS AND DATA
SUMMARIES FOR REGIONS AND COMMUNITIES
STATEWIDE SUMMARY
ORIGINAL RESEARCH TO INFORM POLICY AND ACTION
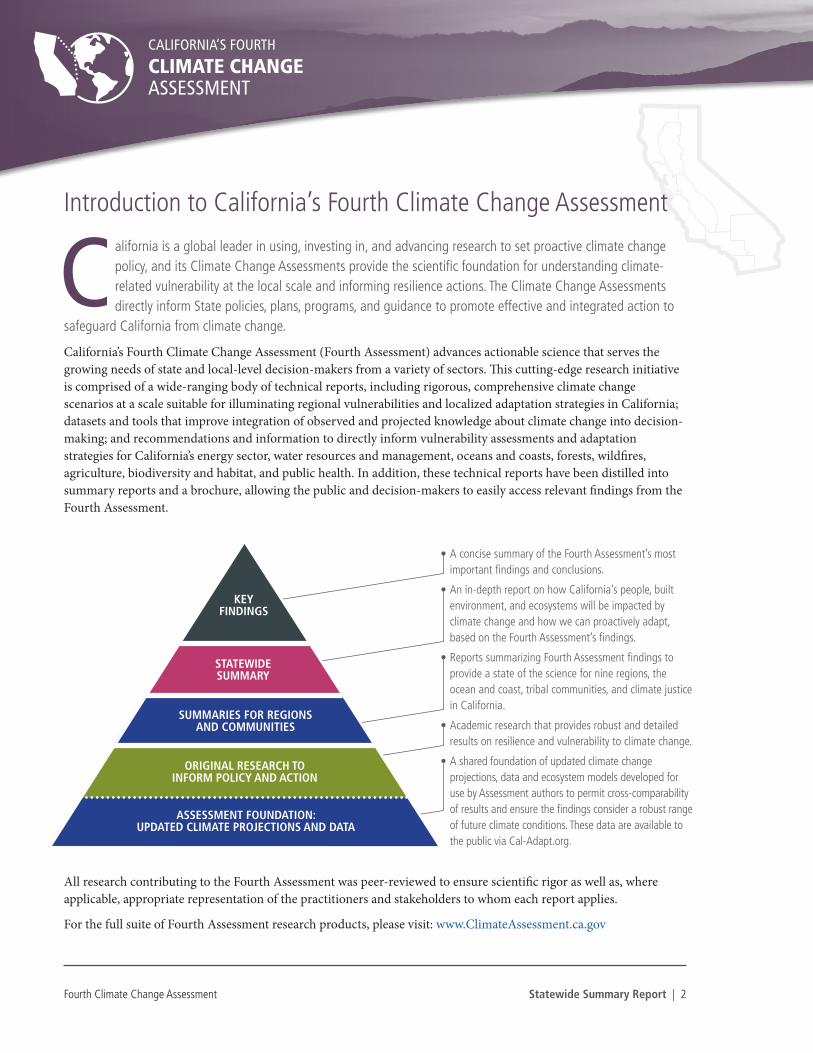
California Regions
The Statewide Summary Report presents an overview of the main findings from California’s Fourth Climate Change Assessment. Produced as part of a volunteer initiative by leading climate experts, this summary report aims to translate the state of climate science into useful information for decision-makers and practitioners to catalyze action that will benefit regions, the ocean and coast, frontline communities, and tribal and indigenous communities. The Statewide Summary Report presents findings in the context of existing climate science, including strategies to adapt to climate impacts and key research gaps needed to spur additional progress on safeguarding California from climate change.
SAN DIEGO
REGION
SAN FRANCISCO BAY AREA REGION
NORTH COAST REGION
CLIMATE JUSTICE
OCEAN AND COAST
COMMUNITIES
TRIBAL COMMUNITIES
SACRAMENTO VALLEY REGION
SAN JOAQUIN VALLEY REGION
SIERRA NEVADA REGION
LOS ANGELES REGION
INLAND DESERTS REGION
Fourth Climate Change Assessment Statewide Summary Report | 3
CALIFORNIA’S FOURTH
CLIMATE CHANGE ASSESSMENT
CENTRAL COAST REGION

Fourth Climate Change Assessment Statewide Summary Report | 4
CALIFORNIA’S FOURTH
CLIMATE CHANGE ASSESSMENT
Statewide Summary Report Authors
COORDINATING LEAD AUTHORS
Dan Cayan, Scripps Institution of Oceanography
Guido Franco, California Energy Commission
LEAD AUTHORS
Leah Fisher, California Governor’s Office of Planning and Research
Sonya Ziaja, California Public Utilities Commission
CONTRIBUTING AUTHORS
David Ackerly UC BerkeleyJohn Andrew California Department of Water ResourcesMaximilian Auffhammer UC BerkeleyRupa Basu California Office of Environmental Health Hazard AssessmentNeil Berg UC Los AngelesHilda Blanco University of Southern California Carolyn Cook California Department of Food and Agriculture Ivana Cvijanovic Lawrence Livermore National Laboratory Larry Dale Lawrence Berkeley National LaboratoryEric Fournier UC Los AngelesChristina Greene University of ArizonaAmrith Gunasekara California Department of Food and AgricultureEllen Hanak Public Policy Institute of CaliforniaMichael Hanemann Arizona State UniversityJelena Hartman California State Water Resources Control Board
Louise Bedsworth, California Governor’s Office of Planning and Research
Chris Jones UC BerkeleyJulie Kalansky Scripps Institution of OceanographyDan Kammen UC BerkeleySurabhi Karambelkar University of ArizonaNuin-Tara Key California Governor’s Office of Planning and ResearchMichael Kleeman UC DavisMillie Levin California Office of Emergency ServicesJay Lund UC DavisAmber Mahone E3 Michael L. Mann The George Washington UniversityJosué Medellín-Azuara UC MercedNicole Meyer-Morse California Office of Emergency ServicesMeredith Millet California Department of Public HealthMax Moritz UC Santa BarbaraJennifer Phillips California Ocean Protection Council David Pierce Scripps Institution of Oceanography
John Radke UC BerkeleyDavid Roland-Holst UC BerkeleyScott Samuelson UC IrvineAlan Sanstad Lawrence Berkeley National LaboratoryBenjamin Sleeter US Geological SurveyDavid Stoms California Energy CommissionJames Thorne UC DavisJason Vargo California Department of Public HealthMax Wei Lawrence Berkeley National Laboratory Leroy Westerling UC MercedSusan Wilhelm California Energy CommissionA. Park Williams Lamont-Doherty Earth Observatory of Columbia UniversityXiangmei Wu California Office of Environmental Health Hazard AssessmentErika Zavaleta UC Santa Cruz
8/2018
Fourth Climate Change Assessment Statewide Summary Report | 5
CALIFORNIA’S FOURTH
CLIMATE CHANGE ASSESSMENT
PEER REVIEW COMMITTEE MEMBERS
Chair: Robert Lempert, RAND Corporation
Phil Duffy, Woods Hole Research Center
Chris Field, Stanford University
Juliette Finzi Hart, U.S. Geological Survey
David Graves, Saintsbury Winery
Lara Kueppers, University of California, Berkeley
Robert A. Leiter, FAICP
Peter Moyle, University of California, Davis
Jonathan Parfrey, Climate Resolve
Stephanie Pincetl, University of California, Los Angeles
Margaret Torn, Lawrence Berkeley National Laboratory
Sarah White, California Workforce Development Board
ACKNOWLEDGMENTS
Creation of this report would not have been possible without the contributions of many people. First, we would like to thank all of the contributing authors who took time to develop content, review material, and support the development of this report. We would also like to thank the Fourth Assessment State Team, including Susan Wilhelm, Jim Thorne, Joey Wraithwall, Jamie Anderson, and Grayson Hough for their coordination and technical editing support, and Della Gilleran and her design team. A huge thank you to Beth Hotchkiss, who provided critical support on references and generating a bibliography for this report.
This report also benefited from the thoughtful comments and insights of the peer review committee, who reviewed and provided feedback on earlier drafts. Thank you to Rob Lempert who chaired this committee, and to all of the committee members listed here. California’s Fourth Climate Change Assessment was supported by funding from the California Energy Commission (CEC), the California Natural Resources Agency (CNRA), and contributions from researchers supported by external funds (see Appendix A for the complete research portfolio).
Any errors that remain in this report are the responsibility of the coordinating lead authors.
This report summarizes the results of work sponsored by the California Natural Resources Agency and California Energy Commission, in the context of broader scientific literature. The information presented here does not necessarily represent the views of the funding agencies or the State of California.
CITATION: Bedsworth, Louise, Dan Cayan, Guido Franco, Leah Fisher, Sonya Ziaja. (California Governor’s Office of Planning and Research, Scripps Institution of Oceanography, California Energy Commission, California Public Utilities Commission). 2018. Statewide Summary Report. California’s Fourth Climate Change Assessment. Publication number: SUM-CCCA4-2018-013.
8/2018

Fourth Climate Change Assessment Statewide Summary Report | 6
CALIFORNIA’S FOURTH
CLIMATE CHANGE ASSESSMENT
Table of Contents
Introduction to California’s Fourth Climate Change Assessment ...........................................................................................2
California Regions ...............................................................................................................................................................3
Statewide Summary Report Authors .................................................................................................................................4
Summary of Key Findings from the Fourth Assessment ..........................................................................................................8
Regional Analysis .................................................................................................................................................................8
Economic Impacts ...............................................................................................................................................................8
Climate Projections ...........................................................................................................................................................8
Land Use and Development ..............................................................................................................................................9
Projections: Wildfire ............................................................................................................................................................9
Projections: Sea-level Rise ..................................................................................................................................................9
People: Public Health ......................................................................................................................................................10
People: Tribal and Indigenous Communities ................................................................................................................10
People: Climate Justice ......................................................................................................................................................11
Built Systems: Energy .......................................................................................................................................................11
Built Systems: Water Supply .............................................................................................................................................11
Built Systems: Delta Levees and Infrastructure ............................................................................................................12
Natural and Working Lands and Waters: Agriculture ..................................................................................................12
Natural and Working Lands and Waters: Oceans ..........................................................................................................12
Introduction .................................................................................................................................................................................13
California’s Climate Change Assessment ........................................................................................................................13
The Fourth Assessment: Supporting Adaptation and Resilience ................................................................................15
Goals and Structure of the Report ..................................................................................................................................18
Chapter 1: Historical Data and Climate Projections for California .......................................................................................19
Climate Scenarios and Projections ..................................................................................................................................20
Chapter 2: Climate Change Impacts in California .................................................................................................................34
Land Use and Population Growth in a Changing Climate ...........................................................................................34
Equity and Social Vulnerability .......................................................................................................................................35
Impacts of Climate Change on People ..........................................................................................................................38

Fourth Climate Change Assessment Statewide Summary Report | 7
CALIFORNIA’S FOURTH
CLIMATE CHANGE ASSESSMENT
Climate Change and Infrastructure in California .........................................................................................................47
Natural Systems and Working Lands and Waters ..........................................................................................................58
Chapter 3: Adaptation and Resilience in the Face of Climate Change .................................................................................68
Reducing GHG Emissions: Implications of the Paris Agreement for California ......................................................70
Resilience-Building Strategies .........................................................................................................................................72
Chapter 4: Research Needs ..........................................................................................................................................................82
Conclusion: Assessment to Action ............................................................................................................................................88
Cal-Adapt and Visualization Tools ..................................................................................................................................88
ResilientCA.org ..................................................................................................................................................................88
Climate-Smart Infrastructure (AB 2800) .......................................................................................................................88
Continued Assessment and Progress Evaluation ..........................................................................................................89
Appendix A: Technical Reports and External Contributions to the Fourth Assessment ...................................................90
Appendix B: Estimates of the Direct Economic Costs of Climate Change in California ..................................................94
References ......................................................................................................................................................................................98

Fourth Climate Change Assessment Statewide Summary Report | 8
CALIFORNIA’S FOURTH
CLIMATE CHANGE ASSESSMENT
Fourth Climate Change Assessment Statewide Summary Report | 8
Summary of Key Findings from the Fourth Assessment
he Fourth California Climate Change Assessment is intended to support California’s climate policies and actions, with a focus on adaptation and resilience. Together the studies improve our understanding of the impacts of climate change in California and actions to help the state prepare for those impacts.
This section summarizes findings from the Fourth Assessment, including information on actions to help respond to climate impacts and risks.
Regional Analysis
Impact: For the first time in the California Climate Change Assessments, the Fourth Assessment includes a series of regionally focused reports. This was a priority for the Assessment because the vast majority of adaptation planning and implementation will happen at local to regional scales. Scientists and local practitioners collaborated, in what should only be the beginning of a longer and more permanent process, to identify ways to reduce or eliminate adverse climate impacts in California
Action: Several research products created for the Assessment, such as climate scenarios and wildfire projections, are available via Cal-Adapt.org and other websites, providing access to data sets and visualization tools to help local and regional decision-makers access relevant information.
Economic Impacts
Impact: Emerging findings for California show that costs associated with direct climate impacts by 2050 are dominated by human mortality, damages to coastal properties, and the potential for droughts and mega-floods. The costs are in the order of tens of billions of dollars. If global greenhouse gas emissions are reduced substantially from the current business-as-usual trajectory, the economic impacts could be greatly reduced.
Actions: California’s Fourth Climate Assessment contributes information and tools that are needed at local to statewide levels to design and implement adaptation measures to lower economic impacts. In addition, the Climate-Safe Infrastructure Working Group, created in response to Assembly Bill 2800 (Quirk), is releasing recommendations that build on the Fourth Assessment findings to inform a robust and comprehensive approach to building for the future.
Climate Projections
Impact: The Fourth Assessment includes new climate projections with higher spatial resolution to better simulate and project extreme events. These updated projections reinforce past findings about temperature and precipitation extremes. Additional results are now available describing humidity, solar radiation, and wind speed. The Fourth Assessment also includes new sea-level rise projections for nine regions in California and considers the potential effect of ice melt in Antarctica. Research also identified a strong correlation between projected climate impacts and cumulative global climate carbon dioxide emissions, allowing a preliminary interpretation of climate impacts in California of different greenhouse gas emissions scenarios, including one that assumes compliance with the Paris Agreement
Actions: California’s leadership in modeling and producing climate projections for both research and long-term planning should be continued and enhanced.
T
CALIFORNIA’S FOURTH
CLIMATE CHANGE ASSESSMENT
Fourth Climate Change Assessment Statewide Summary Report | 9
CALIFORNIA’S FOURTH
CLIMATE CHANGE ASSESSMENT
Fourth Climate Change Assessment Statewide Summary Report | 9
CALIFORNIA’S FOURTH
CLIMATE CHANGE ASSESSMENT
Land Use and Development
Impact: Because land use decisions are an important determinant of exposure to climate risk and the feasibility of different adaptation options, the Fourth Assessment uses a common set of land use projections to inform some of the technical reports, including the development of wildfire projections. These land use projections analyze different population growth rates, but do not consider changes in development patterns.
Action: Future assessments need to include land use scenarios to have a more complete understanding of climate risk and adaptation options. These projections should include different population growth rates as well as consideration of different development patterns, for instance the impacts of excluding development in high-fire risk areas.
Projections: Wildfire
Impact: Climate change will make forests more susceptible to extreme wildfires. By 2100, if greenhouse gas emissions continue to rise, one study found that the frequency of extreme wildfires burning over approximately 25,000 acres would increase by nearly 50 percent, and that average area burned statewide would increase by 77 percent by the end of the century. In the areas that have the highest fire risk, wildfire insurance is estimated to see costs rise by 18 percent by 2055 and the fraction of property insured would decrease.
Action: An extensive scientific review supported by the Fourth Assessment found that reducing tree density and restoring beneficial fire can improve long-term resilience to California’s forests. Simulations of large-scale fuels treatments in Sierra Nevada forests substantially reduce increases in burned area. Improving forest health by removing fuels can have important impacts to reduce rising wildfire insurance costs. Increasing understanding of megafires remains a critical research need for California.
Projections: Sea-level Rise
Impact: A new model estimates that, under mid to high sea-level rise scenarios, 31 to 67 percent of Southern California beaches may completely erode by 2100 without large-scale human interventions. Statewide damages could reach nearly $17.9 billion from inundation of residential and commercial buildings under 50 cm (~20 in) of sea-level rise, which is close to the 95th percentile of potential sea-level rise by the middle of this century. A 100-year coastal flood, on top of this level of sea-level rise, would almost double the costs.
Action: One study prepared for the Fourth Assessment develops technical guidance on design and implementation of natural infrastructure, such as the use of vegetated dunes, marsh sills, and native oyster reefs, for adaptation to sea-level rise. The HERA (Hazardous Exposure Reporting and Analytics) tool, a coastal evolution model that was enhanced with results from the Fourth Assessment, provides information about the number of residents affected, the value of residential and commercial properties flooded, and other useful information for different sea-level rise scenarios and coastal storms. Local planners will be able to use this new tool to analyze local vulnerabilities.
Fourth Climate Change Assessment Statewide Summary Report | 10
CALIFORNIA’S FOURTH
CLIMATE CHANGE ASSESSMENT
Fourth Climate Change Assessment Statewide Summary Report | 10
CALIFORNIA’S FOURTH
CLIMATE CHANGE ASSESSMENT
People: Public Health
Impact: Climate change poses direct and indirect risks to public health, as people will experience earlier death and worsening illnesses. However, deep greenhouse gas emission (GHG) reductions (80% below 1990 levels) in California could significantly improve health outcomes, and costs avoided would be comparable to the cost of achieving 80% GHG reductions by 2050. This would occur because technology with no or very low GHG emissions is associated with a reduction of conventional air pollutants that are damaging to human health.
Nineteen heat-related events occurred from 1999 to 2009 that had significant impacts on human health, resulting in about 11,000 excess hospitalizations. However, the National Weather Service issued Heat Advisories for only six of the events. Heat-Health Events (HHEs), which better predict risk to populations vulnerable to heat, will worsen drastically throughout the state: by midcentury, the Central Valley is projected to experience average Heat-Health Events that are two weeks longer, and HHEs could occur four to ten times more often in the Northern Sierra region.
Action: The Fourth Assessment led to the development of a prototype warning system known as the California Heat Assessment Tool (CHAT). It will support public health departments taking action to reduce heat-related morbidity and mortality outcomes. It is designed to provide information about heat events most likely to result in adverse health outcomes.
People: Tribal and Indigenous Communities
Impact: For the first time in the California Climate Assessments, the Fourth Assessment includes a Tribal and Indigenous Communities Summary Report. Tribes and Indigenous communities in California face unique challenges under a changing climate. Tribes maintain cultural lifeways and rely on traditional resources (e.g., salmon fisheries) for both social and economic purposes. However, tribes are no longer mobile across the landscape. For many tribes in California, seasonal movement and camps were a part of living with the environment. Today these nomadic options are not available or are limited. This is the result of Euro-American and U.S. policy and actions and underpins several climate vulnerabilities. Tribes with reservations/Rancherias/allotments are vulnerable to climate change in a specific way: tribal lands are essentially locked into fixed geographic locations and land status. Only relatively few tribal members are still able to engage in their cultural traditions as livelihoods.
Action: Traditional Ecological Knowledge (TEK)-based methods are gaining a revitalized position within a larger statewide toolset to combat the causes and effects of climate change by tribal and non-tribal stakeholders alike. The importance of maintaining TEK is not isolated to environmental and ecological improvements. These ancient, traditional practices are closely linked to climate resilience across tribal cultural health, identity, and continuity. Cultural practices and traditional land management are also linked to improving physical and mental health among tribal members. As an example of applied TEK science, many tribes use prescribed, controlled burns—commonly deployed within a centuries-old cultural context—to manage meadows, forests, and other areas within tribal lands. These TEK techniques are increasingly incorporated by non-tribal land and resource managers as a part of wildfire prevention and ecosystem management.
Fourth Climate Change Assessment Statewide Summary Report | 11
CALIFORNIA’S FOURTH
CLIMATE CHANGE ASSESSMENT
Fourth Climate Change Assessment Statewide Summary Report | 11
CALIFORNIA’S FOURTH
CLIMATE CHANGE ASSESSMENT
People: Climate Justice
Impact: The Fourth Assessment includes a report on Climate Justice in California, a new addition to the assessment process. This report highlights the importance of adaptation efforts to minimize climate impacts to disadvantaged communities, as well as case studies and innovative programs that are attempting to increase the resiliency of vulnerable populations in California.
Action: Areas for additional research are identified to better address climate adaptation for vulnerable populations and to promote climate justice in California. These research topics include better tools, indices, maps, and metrics for identifying and quantifying resilience in vulnerable communities, research into achieving a just transition to a low carbon economy, and methods to ensure community involvement in climate adaptation planning.
Built Systems: Energy
Impact: Higher temperatures will increase annual electricity demand for homes, driven mainly by the increased use of air conditioning units. High demand is projected in inland and Southern California, and more moderate increases are projected in cooler coastal areas. However, the increased annual residential energy demand for electricity is expected to be offset by reduced use of natural gas for space heating. Increases in peak hourly demand during the hot months of the year could be more pronounced than changes in annual demand. This is a critical finding for California’s electric system, because generating capacity must match peak electricity demand.
Action: Studies found that “flexible adaptation pathways” that allow for implementation of adaptation actions over time allow utilities to protect services to customers most effectively. The California Public Utilities Commission (CPUC) recently began a quasi-legislative process to consider strategies and guidance for climate adaptation for electric and natural gas utilities, which will be informed by the Fourth Assessment.
Built Systems: Water Supply
Impact: Current management practices for water supply and flood management in California may need to be revised for a changing climate. This is in part because such practices were designed for historical climatic conditions, which are changing and will continue to change during the rest of this century and beyond. As one example, the reduction in the Sierra Nevada snowpack, which provides natural water storage, will have implications throughout California’s water management system.
Action: Promising adaptation options such as the use of probabilistic hydrological forecasts, better measurements of the snowpack, and other modern ways to manage the water system could improve reservoir operations and flood safety. Increased groundwater storage is another promising option, which may include taking advantage of increased winter runoff to flood agricultural and natural areas to recharge aquifers. Institutional, regulatory, and legal approaches will need to be developed and adapted to quickly implement science-based solutions. In addition, more research is needed on changing human behavior and expectations around water use and availability.

Fourth Climate Change Assessment Statewide Summary Report | 12
CALIFORNIA’S FOURTH
CLIMATE CHANGE ASSESSMENT
Fourth Climate Change Assessment Statewide Summary Report | 12
CALIFORNIA’S FOURTH
CLIMATE CHANGE ASSESSMENT
Built Systems: Delta Levees and Infrastructure
Impact: New measurements found mean subsidence rates for some of the levees in the Sacramento-San Joaquin Delta of about 0.4 to 0.8 inches per year. This subsidence compounds the risk that sea-level rise and storms could cause overtopping or failure of the levees, exposing natural gas pipelines and other infrastructure to damage or structural failure. At this rate of subsidence, the levees may fail to meet the federal levee height standard (1.5 ft. freeboard above 100-year flood level) between 2050-2080, depending on the rate of sea-level rise.
Action: This research project was conducted collaboratively with the natural gas utility in this territory. Immediate action does not seem necessary because the impacts are not expected for a few decades; however, the research will be used to inform adaptation planning by the utility.
Natural and Working Lands and Waters: Agriculture
Impact: Many of California’s important crops, including fruit and nut trees, are particularly vulnerable to climate change impacts like changing temperature regimes and water-induced stress. A Fourth Assessment study indicates that adaptive decision-making and technological advancement may maintain the viability of California agriculture. However, additional studies show that viability of the sector overall may be at the expense of agricultural jobs and the dairy sector.
Action: Additional research is needed on potential yield changes of crops under changing climate conditions, to provide growers the crops varieties that can thrive under warmer and drier conditions, and the tools that they can use to identify and implement adaptation options. Sustainably managing groundwater resources remains a crucial priority.
Natural and Working Lands and Waters: Oceans
Impact: Increasing evidence shows that climate change is degrading California’s coastal and marine environment. In recent years, several unusual events have occurred along the California coast and ocean, including a historic marine heat wave, record harmful algal bloom, fishery closures, and a significant loss of northern kelp forests.
Action: A study prepared for the Fourth Assessment identified a species of mussel that could serve as a helpful bio-indicator to understand impacts of ocean acidification along the California.
Fourth Climate Change Assessment Statewide Summary Report | 13
CALIFORNIA’S FOURTH
CLIMATE CHANGE ASSESSMENT
Introduction
alifornia is one of the most “climate-challenged” regions of North America and must actively plan and implement strategies to prepare for and adapt to extreme events and shifts in previously “normal” averages (Overpeck et al., 2013; Pierce et al., 2018). Currently, temperatures are warming, heat waves are more frequent, and precipitation has become increasingly variable. California has experienced a succession of dry
spells, and with warmer conditions the impacts of these droughts have increased (OEHHA, 2018).
Observations from across the state are confirming these changes. Peak runoff in the Sacramento River occurs nearly a month earlier now than in the first half of the last century, glaciers in the Sierra Nevada have lost an average of 70 percent of their area since the start of the 20th century, and birds are wintering further north and closer to the coast (OEHHA, 2018). The recent 2012-2016 drought was exacerbated by unusual warmth (Williams, Seager, et al., 2015), and disproportionately low Sierra Nevada snowpack levels (Dettinger & Anderson, 2015). This drought has been described as a harbinger of projected dry spells in future decades, whose impacts will likely be worsened by increased heat (Mann & Gleick, 2015). A very wet winter in 2016-2017 followed this drought, a further indication of potential continued climate volatility in the future (Berg & Hall, 2015; Polade, et al., 2017; Swain et al., 2018).
These changes in the state’s physical climate will have effects on all parts of California’s society. The changes vary between regions in California, but every region is seeing and will continue to see effects from climate change (please see the Regional Reports for regionally specific information). Increasing temperatures and rising sea-levels will have direct impacts on public health and infrastructure. Drought, coastal and inland flooding, and wildfire will continue to affect people’s livelihoods and local economies. Changing weather patterns and more extreme conditions will impact tourism and rural economies in California, along with changes to agriculture and crops, which are a critical backbone of California’s economic success. There will also be negative impacts to California’s ecosystems, both on land and in the ocean, leading to local extinctions, migrations, and management challenges. Due to these projected impacts, California must continue to evaluate climate impacts as well as to plan for adaptation and resilience.
California’s Climate Change Assessment
Science and research investment has been an integral part of California’s approach and policies to mitigate and adapt to climate change for the past 12 years (Franco et al., 2008). Since 2006, the State has undertaken four comprehensive climate change assessments, designed to assess the impacts and risks from climate change and to identify potential solutions to inform policy actions (Table 1). Each of the four assessments has focused on a specific area of inquiry and has been linked to specific policy drivers, and in some instances, to specific policy outcomes.
California’s climate change assessments are a regionally-focused example of a regular series of broader assessments, including the U.S. National Climate Assessment (NCA) and global assessments from the Intergovernmental Panel on Climate Change (IPCC). These assessments estimate climate change impacts under different future emission scenarios using a set of global climate models (GCMs). While the IPCC assessments analyze impacts at a global scale, the NCA and California assessments share approaches to downscaling climate model outputs to produce projections relevant on a regional scale. The California Climate Change Assessment goes further by including a set of state-
C

Fourth Climate Change Assessment Statewide Summary Report | 14
CALIFORNIA’S FOURTH
CLIMATE CHANGE ASSESSMENT
funded research reports that examine how climate change will affect specific sectors, potential responses to climate change, and other policy-driven questions. Each of these reports presents original research findings for specific questions relevant to California’s climate change policy.
California’s Fourth Climate Change Assessment (the Fourth Assessment) includes over forty-four technical peer-reviewed reports that examine specific aspects of climate change in California, including projections of climate change impacts, analysis of vulnerabilities and adaptation for various sectors, and social and governance considerations for climate adaptation (see Appendix A for a full list of technical reports).
The Fourth Assessment includes this statewide report, as well as nine regional and three topical reports, designed to synthesize the findings from the Fourth Assessment—along with additional findings from recent peer-reviewed publications—and to present them in a more accessible format for the public, community organizations, stakeholders, and policy makers.1
FIRST CALIFORNIA
CLIMATE ASSESSMENT
SECOND CALIFORNIA
CLIMATE ASSESSMENT
THIRD CALIFORNIA
CLIMATE ASSESSMENT
FOURTH CALIFORNIA CLIMATE
ASSESSMENT
YEAR 2006 2009 2012 2018
DESCRIPTION Understanding climate impacts in California. Developed to provide support for undertaking greenhouse gas emission reductions.
Understanding how climate change will affect specific sectors. Made the case that adaptation could reduce costs.
Increased understanding of vulnerability in natural and human systems, and generated two pilot regional assessments.
Technical and regional reports designed to support adaptation actions at the state, regional, and local level.
DRIVER Executive Order S-3-05 Policymakers’ desire to know if adaptation was needed.
2009 Climate Adaptation Strategy
2015 Climate Change Research Plan
OUTCOME Assembly Bill (AB) 32 2009 Climate Adaptation Strategy
Supported passage of new climate adaptation laws.
Informing the implementation of AB 2800, which requires a report on how engineering standards should be changed to consider climate change. Other outcomes to be determined.
TABLE 1 | SUMMARY OF CALIFORNIA’S CLIMATE CHANGE ASSESSMENTS
1 All Fourth Assessments reports are accessible at climateassessment.ca.gov.

Fourth Climate Change Assessment Statewide Summary Report | 15
CALIFORNIA’S FOURTH
CLIMATE CHANGE ASSESSMENT
The Fourth Assessment: Supporting Adaptation and Resilience
As the effects of climate change become increasingly apparent, building resilience in the face of climate change and other hazards has become a focus of many efforts at the local, regional, and State level. California is taking steps to increase the State’s resilience to changing climate. Safeguarding California, the State’s climate adaptation strategy, outlines steps that State agencies have planned and are implementing to respond to climate change. Executive Order B-30-15, signed in April 2015, directs State agencies to integrate climate change considerations into all planning and investment. Legislation signed in 2015 requires local governments to consider climate change risk in the Safety Element of General Plans (Section 65302, CA Government Code). The Fourth Assessment was designed to support climate adaptation and resilience policies and actions in California.
Adaptation refers to a set of actions, programs, and activities designed to prepare for and respond to changing
44 TECHNICAL REPORTS 9 REGIONAL REPORTS 3 TOPICAL SYNTHESIS
REPORTS
1 STATEWIDE SUMMARY
REPORT
DESCRIPTION Research-based papers (similar style to papers published in scientific journals) that examine aspects of climate change in California.
Prepared by locally-based researchers, that include broad stakeholder engagement and are designed to support decision-making at local and regional levels.
Summarize findings for: Tribal and Indigenous Communities, Climate Justice, and Ocean and Coast.
Synthesizes the Fourth Assessment and presents high-level findings for the state.
AUDIENCE Research community and technical staff from local, regional, and state entities.
State, local, and regional decision makers and stakeholders.
State, local, and regional decision makers and stakeholders.
State, local, and regional decision makers and stakeholders.
TABLE 2 | SUMMARY OF REPORTS INCLUDED IN THE FOURTH ASSESSMENT
Adaptation is an adjustment in natural or human systems to a new or changing environment. Adaptation to climate change refers to adjustment in natural or human systems in response to actual or expected climatic stimuli or their effects, which moderates harm or exploits beneficial opportunities (US EPA, 2016).
Adaptive capacity is the “combination of the strengths, attributes, and resources available to an individual, community, society, or organization that can be used to prepare for and undertake actions to reduce adverse impacts, moderate harm, or exploit beneficial opportunities” (IPCC, 2012).
Exposure is the presence of people, infrastructure, natural systems, and economic, cultural, and social resources in areas that are subject to harm (IPCC, 2012).
Resilience is the “capacity of any entity – an individual, a community, an organization, or a natural system – to prepare for disruptions, to recover from shocks and stresses, and to
KEY TERMS

Fourth Climate Change Assessment Statewide Summary Report | 16
CALIFORNIA’S FOURTH
CLIMATE CHANGE ASSESSMENT
climate conditions. Taken together, the goal of these actions is to build resilience. The “Key Terms” text box provides some definitions that are used throughout this report and in accompanying studies from the Fourth Assessment.
Resilience is a concept that recognizes the interconnections and interdependencies across people, nature, and infrastructure. Social cohesion and a healthy economy are important determinants of resilience, alongside stable infrastructure and healthy natural systems. California uses a definition of resilience that defines outcomes across people and communities, natural systems, and infrastructure and built systems (Text Box: What is a Resilient California?). Resilience also depends on interconnections across these systems.
Executive Order B-30-15 and Safeguarding California recognize the importance of resilience, which is reflected in a set of principles underlying the State’s adaptation efforts. To the extent feasible, these principles are reflected in the Fourth Assessment and are touched on throughout this summary report. They include:
1. Protection of the State’s most vulnerable populations and communities:
Climate change will disproportionately affect the State’s most vulnerable citizens and communities in relative terms (e.g., percent of income or assets). Vulnerability arises from a combination of physical, social, economic, and demographic factors. Adaptation actions should account for disproportionate impacts and seek to build resilience in the State’s most vulnerable communities.
Several reports in the Fourth Assessment examine dimensions of vulnerability, including synthesis reports focused on tribal and indigenous communities and on climate justice.
adapt and grow from a disruptive experience” (Rodin, 2014). Adaptation actions contribute to increasing resilience, which is a desired outcome or state of being.
Sensitivity is the level to which a species, natural system, or community, government, etc., would be affected by changing climate conditions.
Vulnerability is the “susceptibility to harm from exposure to stresses associated with environmental and social change and from the absence of capacity to adapt” (Adger, 2006). Vulnerability can increase because of physical (built and environmental), social, political, and/or economic factor(s). These factors include, but are not limited to: race, class, sexual orientation and identification, national origin, and income inequality.2 Vulnerability is often defined as the combination of sensitivity and adaptive capacity as affected by the level of exposure to changing climate.
KEY TERMS – CONTINUED
2 See: opr.ca.gov/planning/icarp/vulnerable-communities.html
WHAT IS A RESILIENT CALIFORNIA?
All people and communities respond to changing average conditions, shocks, and stresses in a manner that minimizes risks to public health, safety, and the economy, and maximizes equity and protection of the most vulnerable.
Natural systems adjust and maintain desirable ecosystem characteristics in the face of change.
Infrastructure and built systems withstand and adapt to changing conditions and shocks, including changes in climate, while continuing to provide essential services.
Fourth Climate Change Assessment Statewide Summary Report | 17
CALIFORNIA’S FOURTH
CLIMATE CHANGE ASSESSMENT
2. Prioritization of natural infrastructure solutions:
Natural infrastructure is the preservation and/or restoration of ecological systems, or the use of engineered systems that employ ecological processes, to increase resiliency to climate change and/or manage other environmental problems. Natural infrastructure solutions can rely solely on natural systems (i.e., green infrastructure) or can integrate natural systems with more traditional “grey,” or human-constructed, infrastructure.
Several studies in the Fourth Assessment examine natural infrastructure approaches as adaptation solutions, including protection from sea-level rise and fuel reduction to mitigate wildfire risk and improve forest health.
3. Promotion and prioritization of integrated climate actions:
Since the State of California is committed to reducing greenhouse gas (GHG) emissions to 40 percent below 1990 levels by 2030 and 80 percent below 1990 levels by 2050, priority should be given to adaptation solutions that support building resilience, while at the same time also reducing GHG emissions.
The Fourth Assessment includes several studies that examine the resilience of the State’s energy system while also meeting the State’s GHG emission reduction goals.
4. Coordination with local and regional governments:
Given the need for local and regional governments to undertake adaptation actions, coordination is needed across state, local, regional, and federal governments. The regional reports prepared as part of the Fourth Assessment provide a means to translate the information and findings from this research effort to local and regional actors, and to communicate regional needs and activities to state decision makers.
5. Sustained monitoring and research to increase ability to understand and manage climate change impacts:
Climate change, its impacts, and appropriate management strategies are rapidly evolving. While the general direction of change is understood, additional work is needed to better understand the complexity and interactions among global, regional, and local climate change elements that operate across the physical, biological, and social landscape. This is further complicated by the fact that policies, management practices, and investments are also being updated in response to climate change. California must continue the work of this and previous assessments to build a strong tradition of connecting monitoring and research on climate change to engagement with decision makers, and to education at all levels.
Fourth Climate Change Assessment Statewide Summary Report | 18
CALIFORNIA’S FOURTH
CLIMATE CHANGE ASSESSMENT
Goals and Structure of the Report
This statewide summary report summarizes the main findings from the Fourth Assessment. The report synthesizes these Fourth Assessment findings in the context of recent literature to provide a more complete presentation of the information available on climate change impacts and adaptation options in California. However, while the report strives to be as representative as possible, it is not a comprehensive review of the tremendous amount of research on climate change in California that has been generated since California’s Third Climate Change Assessment was released in 2012. Every attempt is made to represent uncertainty and conditions under which future climate conditions are estimated; however, the report does not include a standard methodology for conveying uncertainty.
The report begins with an overview of historical and projected climate change in California under downscaled climate scenarios (Chapter 1). Chapter 2 discusses how climate change interacts with other changing factors such as land use and demographic change, and how these factors affect the State’s people, infrastructure, and natural systems. The following section reviews adaptation strategies and how they contribute to resilience (Chapter 3). The report concludes with a discussion of research needs in Chapter 4, followed by an overview of how the findings from the Fourth Assessment and future assessments can support climate action in Chapter 5.

Fourth Climate Change Assessment Statewide Summary Report | 19
CALIFORNIA’S FOURTH
CLIMATE CHANGE ASSESSMENT
Chapter 1: Historical Data and Climate Projections for California
alifornia is already experiencing climate change (e.g., Barnett et al., 2008; Williams et al., 2015) and its effects will increase over the coming decades. These changes will occur alongside and impact continued urbanization, changes to California’s energy system, economic and population growth, and the deployment of new technologies. This chapter reviews some of the historical data on climatic changes that have
affected and will continue to affect California, with a focus on future climate projections that are a part of the Fourth Assessment.
Each of the State’s Climate Assessments has included projections of how changes in global climate will affect California. The Fourth Assessment uses the recent Coupled Model Intercomparison Project Phase 5 (CMIP5) suite of global climate models and the Representative Concentration Pathway (RCP) long-term greenhouse gas concentration scenarios. While the general direction and trends in the projections have remained consistent with those from previous assessments, more recent analysis prepared for the Fourth Assessment further refined projections of climate impacts for California and provided important new information.
This chapter includes the following contributions from the Fourth Assessment:
- The development and use of a new downscaling technique, Localized Constructed Analogs (LOCA), which downscales the simulations of global climate models (GCMs) to the California region with higher spatial resolution and improved treatment of climate extremes than in prior assessments.
- The incorporation of a greater number of climate model simulations using LOCA, which enabled simulation of a broader range of projections and scenarios, and a wider investigation of climate model projections that was supported by the introduction of additional downscaled variables, including wind, humidity, and incoming solar radiation.
- Additional research into climate change influences upon weather and climate extremes, including heat waves, drought, heavy precipitation events, and high sea-levels.
- A broader set of sea-level rise scenarios that includes extreme (i.e., unlikely but possible) sea-level rise, which could occur under rapid ice melt and ice sheet collapse in Greenland and West Antarctica.
- More examination of the shifts in California’s precipitation regime, which currently indicates more dry days, more dry years, longer dry season, and increases in occasional heavy precipitation events and floods. Uncertainty remains in projections for future total precipitation.
- More extensive simulations of wildfire that help to explore possible increases in area burned as climate changes.
- Use of recent, well-observed examples of climate change and extreme weather impacts in California, including the occurrence of high sea-level in 2015, the warm drought in 2012-2016, and recent extreme wildfires (including the Rim fire, Sonoma/Santa Rosa fires, etc.) that help to understand and communicate projected future climate change impacts.
C

Fourth Climate Change Assessment Statewide Summary Report | 20
CALIFORNIA’S FOURTH
CLIMATE CHANGE ASSESSMENT
Climate Scenarios and Projections
Changes in global and California temperatures depend on the accumulation of carbon dioxide and other heat-trapping gases emitted from human activities in the atmosphere. The future emissions and resulting accumulation of greenhouse gases (GHGs) could take a range of pathways depending on the success of international and local efforts to reduce GHG emissions. The warming and other changes experienced under different future conditions are projected using Representative Concentration Pathways (RCPs). RCPs do not represent a specific policy, demographic, or economic future, but are defined in terms of their total radiative forcing (Watts per square meter) by 2100 (i.e., the net balance of radiation into and out of Earth’s surface due to human emissions of GHGs from all sources).
The Fourth Assessment uses two RCPs from the Fifth Intergovernmental Panel on Climate Change (IPCC) Assessment Report on Climate Change. The higher of the two RCPs represents accumulating GHG concentrations under a higher emissions pathway (RCP 8.5), commonly understood as a business-as-usual (BAU) scenario that would result in atmospheric CO2 concentrations exceeding 900 parts per million (ppm) by 2100, more than triple the level present in the atmosphere before human emissions began to accumulate. The more moderate GHG concentration pathway (RCP 4.5), a scenario where GHG emissions rise until mid-21st century and then decline, results in a CO2 concentration of about 550 ppm by 2100 (van Vuuren et al., 2011).
Global climate models (GCMs) use different RCPs to project future climate conditions. A group of experts selected by California’s Department of Water Resources identified 10 GCMs from a set of more than 30 available as being the most suitable for California water resource climate change studies (California Department of Water Resources, 2015). The Fourth Assessment uses these 10 GCMs and the two RCPs discussed above to simulate California’s historical and projected temperatures, precipitation, and other climate outcomes such as relative humidity and soil moisture. The outputs of these models provide a set of common climate scenarios used throughout the studies in the Fourth Assessment. This chapter describes climate outcomes under these common scenarios.

Fourth Climate Change Assessment Statewide Summary Report | 21
CALIFORNIA’S FOURTH
CLIMATE CHANGE ASSESSMENT
Annual precipitation in California and Nevada in cm (250 cm is approximately 100 in) in a global climate model with a resolution of approximately 160 km2 (100 square miles; left), and using a statistical model to account for the effects of topography at a 6 km2 (3.6 square miles) resolution (right). The global model only has a few grid cells over the entire state of California, so it is not able to resolve the coastal mountain ranges, interior valley, or Sierra Nevada Mountains on the border with Nevada. The precipitation field in the right panel, by contrast, captures the wet conditions on the west slopes of the mountains, and the dry, rain shadow region to the east of the mountains. The vertical scale has been exaggerated for clarity, and by the same amount in both panels. Source: Pierce et al., 2018.
FIGURE 1 | DEMONSTRATION OF DOWNSCALED MODELS
Most GCMs produce spatial outputs of global climate measures (including temperature, precipitation, winds, and other variables) that are rather coarse, typically for 100-200 km (62.5 – 125 mi) grid cells. However, regional climate studies typically employ data derived from the global models using a “downscaling” technique to better represent the more detailed variability over an area of interest, so that the results are compatible with regional planning and decision-making. For California’s Fourth Climate Change Assessment, variables of interest from the coarse-scale global model simulations have been downscaled over California’s complex terrain to finer grid cells of approximately 6 km (4mi) using a statistical technique called “Localized Constructed Analogs”, or LOCA (Pierce et al., 2014). Additionally, because models are mathematical approximations to the physical, chemical, and biological systems they simulate, the results from global and regional models are usually somewhat different from that observed in nature. Because of this, temperature, precipitation, and other variables of interest in California’s Fourth Climate Change Assessment’s regional projections have been “bias corrected” (Pierce et al., 2015), so that the model-simulated output is adjusted to match the averages and other statistical properties of observations over the historical period.
DOWNSCALING AND BIAS CORRECTION

Fourth Climate Change Assessment Statewide Summary Report | 22
CALIFORNIA’S FOURTH
CLIMATE CHANGE ASSESSMENT
TEMPERATURE
Warming of the climate system is unequivocal, and since the 1950s, many of the observed changes are unprecedented over decades to millennia (IPCC, 2014).
Climate change is already affecting temperatures across California (Barnett et al., 2008; Bonfils et al., 2008; Vose et al., 2017). The warming observed in California is consistent with overwhelming evidence that the Earth is warming (IPCC, 2014). In California, present-day (1986-2016) temperatures throughout the state have warmed above temperatures recorded during the first six decades of the 20th century (1901-1960). As shown in Figure 2, annual temperature increases over most of the state have exceeded 1°F, with some areas exceeding 2°F.
TABLE 3: A QUALITATIVE DESCRIPTION OF CURRENT UNDERSTANDING OF HISTORICAL AND EXPECTED CLIMATE IMPACTS IN CALIFORNIA
CLIMATE IMPACT HISTORICAL TRENDS FUTURE DIRECTION
OF CHANGE
CONFIDENCE FOR
FUTURE CHANGE
Temperature Warming (last 100+ years)
Warming Very High
Sea Levels Rising (last 100+ years)
Rising Very High
Snowpack Declining (last 60+ years)
Declining Very High
Annual Precipitation No significant trends (last 100+ years)
Unknown Low
Intensity of heavy precipitation events No significant trends (last 100 years)
Increasing Medium-High
Frequency of Drought No significant trends (last 100+ years)
Increasing Medium-High
Frequency and intensity of Santa Ana Winds No significant trends (last 60+ years)
Unknown Low
Marine Layer Clouds Some downward trends; mostly not significant (last 60+ years)
Unknown Low
Acres Burned by Wildfire Increasing (last 30+ years)
Increasing Medium-High

Fourth Climate Change Assessment Statewide Summary Report | 23
CALIFORNIA’S FOURTH
CLIMATE CHANGE ASSESSMENT
FIGURE 2 | HISTORICAL CHANGES IN ANNUAL TEMPERATURES
FIGURE 3 | PROJECTED TEMPERATURE INCREASES
Under both RCPs, all GCMs project continued warming over California over the 21st century. Figure 3a shows the annual maximum daily temperature averaged across the state, from 1950-2100. Figure 3b and Table 4 show how the warming progresses, on average, over successive three-decade periods.
Observed changes in annual temperatures (°F), demonstrating marked increases for most of the state. Changes are the difference between the average for present day (1986-2016) and the average for the first half of the last century (1901-1960). Data based on Vose et al., 2017.
Projected increases in annual average daily maximum temperature for California under two emissions scenarios. Graph (a) shows annual maximum temperature across California according to 1960-2005 observations (black line), range of simulated historical conditions (gray area), and 2006-2100 projections from the ten priority Global Climate Models (GCMs), downscaled over California. The envelope of the different model projected simulations is shown as blue and red shading. Graph (b) shows the average (dot) and range (line) within the envelope of models for historical (black), and early, mid, and late-21st century periods for RCP4.5 (blue) and RCP8.5 (red). Data source: Pierce et al., 2018
TABLE 4 | PROJECTED TEMPERATURE INCREASES
EARLY CENTURY: 2006 – 2039 MID-CENTURY: 2040 – 2069 LATE-CENTURY: 2070 – 2100
RCP 4.5 +2.5°F (72.6°F) +4.4°F (74.5°F) +5.6°F (75.5°F)
RCP 8.5 +2.7°F (72.8°F) +5.8°F (75.9°F) +8.8°F (78.9°F)
Projected Increase in Annual Average Maximum Daily Temperature under RCP 4.5 and 8.5. Projected Annual Average Temperature shown in parentheses. Data source: Pierce et al., 2018.
Fourth Climate Change Assessment Statewide Summary Report | 24
CALIFORNIA’S FOURTH
CLIMATE CHANGE ASSESSMENT
PRECIPITATION
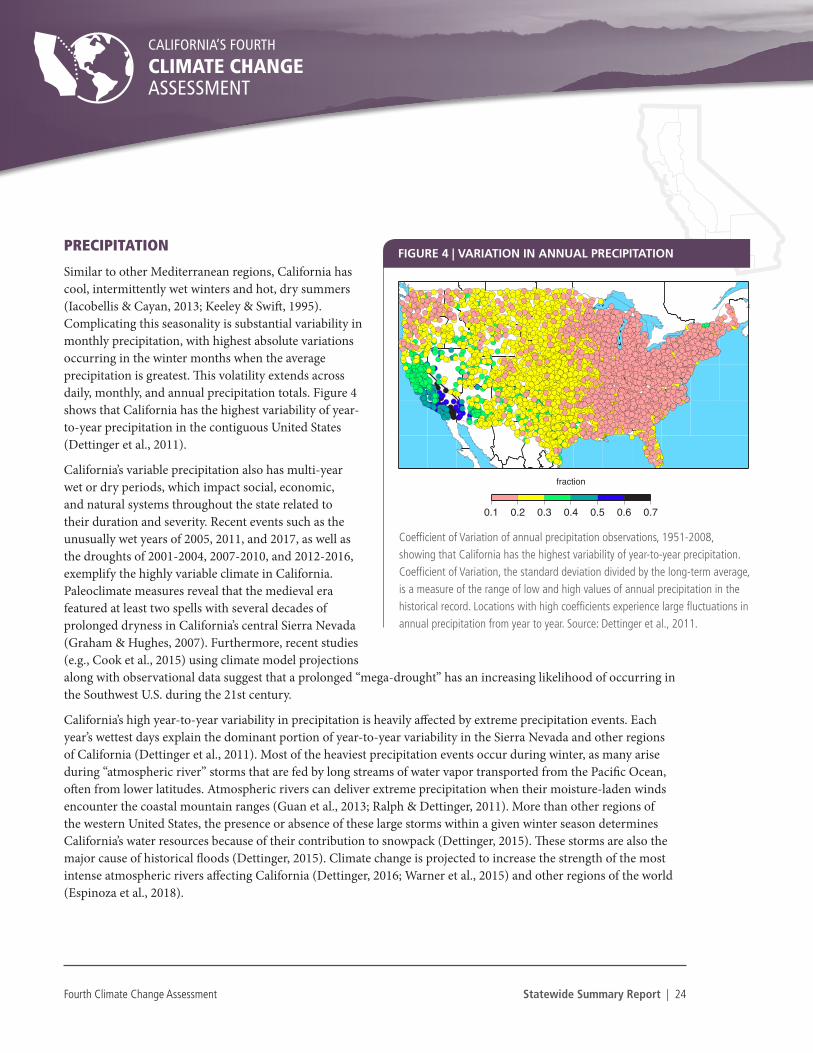
Similar to other Mediterranean regions, California has cool, intermittently wet winters and hot, dry summers (Iacobellis & Cayan, 2013; Keeley & Swift, 1995). Complicating this seasonality is substantial variability in monthly precipitation, with highest absolute variations occurring in the winter months when the average precipitation is greatest. This volatility extends across daily, monthly, and annual precipitation totals. Figure 4 shows that California has the highest variability of year-to-year precipitation in the contiguous United States (Dettinger et al., 2011).
California’s variable precipitation also has multi-year wet or dry periods, which impact social, economic, and natural systems throughout the state related to their duration and severity. Recent events such as the unusually wet years of 2005, 2011, and 2017, as well as the droughts of 2001-2004, 2007-2010, and 2012-2016, exemplify the highly variable climate in California. Paleoclimate measures reveal that the medieval era featured at least two spells with several decades of prolonged dryness in California’s central Sierra Nevada (Graham & Hughes, 2007). Furthermore, recent studies (e.g., Cook et al., 2015) using climate model projections along with observational data suggest that a prolonged “mega-drought” has an increasing likelihood of occurring in the Southwest U.S. during the 21st century.
California’s high year-to-year variability in precipitation is heavily affected by extreme precipitation events. Each year’s wettest days explain the dominant portion of year-to-year variability in the Sierra Nevada and other regions of California (Dettinger et al., 2011). Most of the heaviest precipitation events occur during winter, as many arise during “atmospheric river” storms that are fed by long streams of water vapor transported from the Pacific Ocean, often from lower latitudes. Atmospheric rivers can deliver extreme precipitation when their moisture-laden winds encounter the coastal mountain ranges (Guan et al., 2013; Ralph & Dettinger, 2011). More than other regions of the western United States, the presence or absence of these large storms within a given winter season determines California’s water resources because of their contribution to snowpack (Dettinger, 2015). These storms are also the major cause of historical floods (Dettinger, 2015). Climate change is projected to increase the strength of the most intense atmospheric rivers affecting California (Dettinger, 2016; Warner et al., 2015) and other regions of the world (Espinoza et al., 2018).
COEFFICENTS OF VARIATION OF TOTAL PRECIPITATION, WY 1951-2008
fraction
0.1 0.2 0.3 0.4 0.5 0.6 0.7
FIGURE 4 | VARIATION IN ANNUAL PRECIPITATION
Coefficient of Variation of annual precipitation observations, 1951-2008, showing that California has the highest variability of year-to-year precipitation. Coefficient of Variation, the standard deviation divided by the long-term average, is a measure of the range of low and high values of annual precipitation in the historical record. Locations with high coefficients experience large fluctuations in annual precipitation from year to year. Source: Dettinger et al., 2011.

Fourth Climate Change Assessment Statewide Summary Report | 25
CALIFORNIA’S FOURTH
CLIMATE CHANGE ASSESSMENT
Projected Changes in California Precipitation
On an annual basis, climate model projections do not present a strong consensus towards the whole of California “getting wetter” or “getting drier” (He et al., 2018; Pierce et al., 2018). The models do show a tendency for the northern part of the state to become wetter, and the very southern portion of California, extending and intensifying in Mexico, to become drier (Figure 5); however, this tendency is relatively small compared to the amount of year-to-year variation in precipitation in the region. Due to large annual variation, changes in annual mean or longer-term precipitation are likely not the best metrics to understand societal impacts of precipitation changes, which often result from drought and shorter period extremes.
In California’s highly variable climate setting, with models projecting less frequent but more extreme daily precipitation, year-to-year precipitation becomes more volatile and the number of dry years increases (Berg & Hall, 2015; Pierce et al., 2018; Swain et al., 2018). As the climate continues to warm, atmospheric rivers, responsible for many of the heaviest extremes, will carry more moisture (Lavers et al., 2015), and extreme precipitation may increase (Polade et al., 2017). The recent wet winter of 2017, in which total precipitation was dominated by some highly productive storm events, may provide a glimpse of the future. A recent study by Swain et al. (2018) used a new set of climate simulations to investigate extreme precipitation events, finding an increase in the probability of
Left panel: Average annual precipitation in California. Right two panels: Projected percent changes (2070-2100 relative to 1950-2005) of annual precipitation, averaged over 10 LOCA downscaled GCMs selected for the Fourth Assessment for RCP 4.5 (left) and RCP 8.5 (right) scenarios. Sources: Left: modified from PRISM, 2018; Right: Pierce et al., 2018.
FIGURE 5 | HISTORIC AND PROJECTED PRECIPITATION IN CALIFORNIA
Fourth Climate Change Assessment Statewide Summary Report | 26
CALIFORNIA’S FOURTH
CLIMATE CHANGE ASSESSMENT
a “mega-flood” similar to the one that devastated California in the winter of 1861-1862 (Brewer, 1930; Ingram & Malamud-Roam, 2013; Porter et al., 2011; Rodin, 2014). Swain et al. (2018) state that, under the RCP 8.5 scenario, “…such an event is more likely than not to occur at least once between 2018 and 2060, and that multiple occurrences are plausible by 2100”. Additional studies are needed to increase the confidence of this finding, but the results are in general agreement with the increased occurrence of heavy precipitation events.
Warm Droughts and Intensification of Seasonal Dryness
Warming air temperatures throughout the 21st century will increase moisture loss from soils, which will lead to drier seasonal conditions even if precipitation increases (Thorne et al., 2015). Warming air temperatures also amplify dryness caused by decreases in precipitation (Ault et al., 2016; Cayan et al., 2010; Diffenbaugh et al., 2015). These changes affect both seasonal dryness and drought events. Climate projections from the previous and present generation of GCMs (e.g. Pierce et al., 2014; Swain et al., 2018) show that seasonal summer dryness in California may become prolonged due to earlier spring soil drying that lasts longer into the fall and winter rainy season. The extreme warmth during the drought years of 2014 and 2015 intensified some aspects of the 2012-2016 drought (Griffin & Anchukaitis, 2014; Mao et al., 2015; Stephenson et al., 2018; Williams, Seager, et al., 2015) and may be analogous for future drought events (Diffenbaugh et al., 2015; Mann & Gleick, 2015; Williams, Seager, et al., 2015).
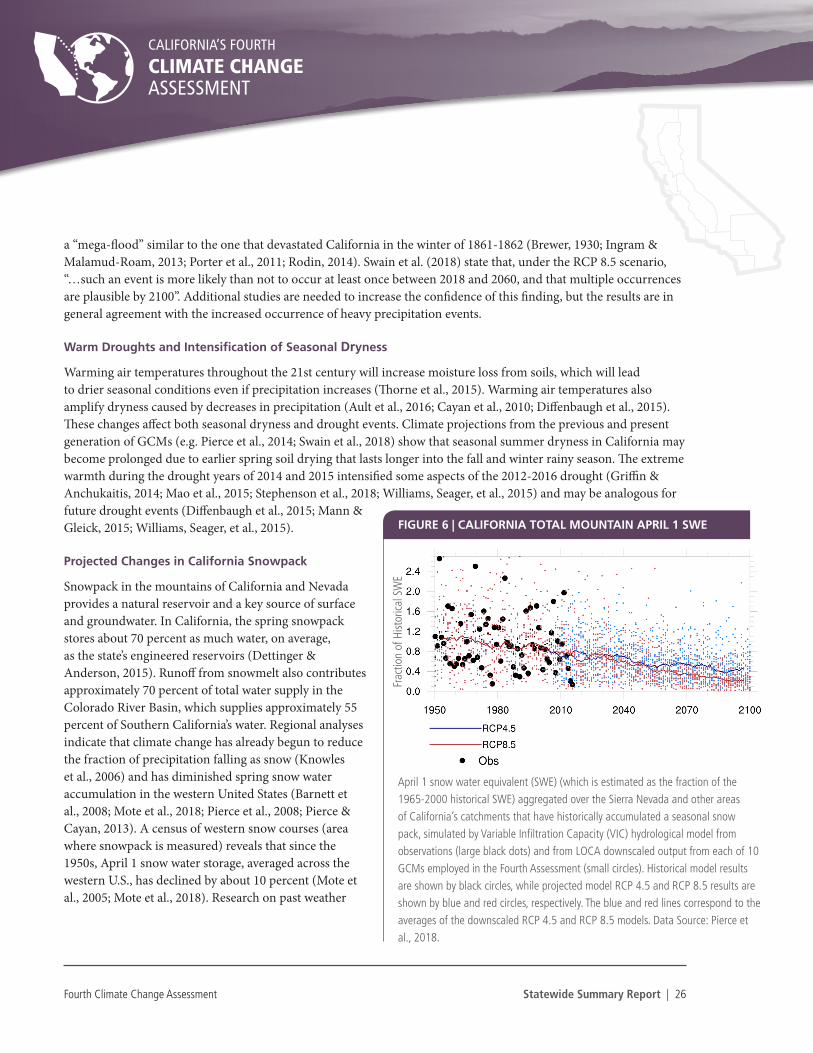
Projected Changes in California Snowpack
Snowpack in the mountains of California and Nevada provides a natural reservoir and a key source of surface and groundwater. In California, the spring snowpack stores about 70 percent as much water, on average, as the state’s engineered reservoirs (Dettinger & Anderson, 2015). Runoff from snowmelt also contributes approximately 70 percent of total water supply in the Colorado River Basin, which supplies approximately 55 percent of Southern California’s water. Regional analyses indicate that climate change has already begun to reduce the fraction of precipitation falling as snow (Knowles et al., 2006) and has diminished spring snow water accumulation in the western United States (Barnett et al., 2008; Mote et al., 2018; Pierce et al., 2008; Pierce & Cayan, 2013). A census of western snow courses (area where snowpack is measured) reveals that since the 1950s, April 1 snow water storage, averaged across the western U.S., has declined by about 10 percent (Mote et al., 2005; Mote et al., 2018). Research on past weather
April 1 snow water equivalent (SWE) (which is estimated as the fraction of the 1965-2000 historical SWE) aggregated over the Sierra Nevada and other areas of California’s catchments that have historically accumulated a seasonal snow pack, simulated by Variable Infiltration Capacity (VIC) hydrological model from observations (large black dots) and from LOCA downscaled output from each of 10 GCMs employed in the Fourth Assessment (small circles). Historical model results are shown by black circles, while projected model RCP 4.5 and RCP 8.5 results are shown by blue and red circles, respectively. The blue and red lines correspond to the averages of the downscaled RCP 4.5 and RCP 8.5 models. Data Source: Pierce et al., 2018.
FIGURE 6 | CALIFORNIA TOTAL MOUNTAIN APRIL 1 SWE
Frac
tion
of H
istor
ical S
WE

Fourth Climate Change Assessment Statewide Summary Report | 27
CALIFORNIA’S FOURTH
CLIMATE CHANGE ASSESSMENT
patterns and modeling of future scenarios indicate that the low California snowpack during 2014 could be an analog for future climate change-driven water supply scenarios (Mann & Gleick, 2015).
Spring snowpack, aggregated over the Sierra Nevada and other mountain catchments in central and northern California, declines substantially under modeled climate changes (Figure 6). The mean snow water equivalent (SWE) declines to less than two-thirds of its historical average by 2050, averaged over several model projections under both RCP 4.5 and 8.5 scenarios. By 2100, SWE declines to less than half the historical median under RCP 4.5, and less than one-third under RCP 8.5. Importantly, the decline in spring snowpack occurs even if the amount of precipitation remains relatively stable over the central and northern California region; the snow loss is the result of a progressively warmer climate. Furthermore, while the models indicate that strong year-to-year variation will continue to occur, the likelihood of attaining spring snowpack that reaches or exceeds historical average is projected to diminish markedly (Pierce et al., 2018) (Figure 6).
Arctic Sea Ice: A Possible Driver of California’s Precipitation Changes
California’s varying and changing climate is impacted by regional processes within the state as well as by changes around the globe. Notably, over the past several decades, the Arctic has been warming at rates higher than any other area in the world, resulting in immense loss of sea ice cover (Perovich et al., 2017; Vaughn et al., 2013).
The first modeling studies investigating the impacts of Arctic sea-ice loss on California’s climate revealed links similar to the ones suggested by the paleoclimate indictors – that a decrease in Arctic sea ice was linked to drier conditions in California (Sewall, 2005; Sewall & Sloan, 2004). However, these modeling results have been difficult to reconcile with the existing literature, which suggests that California’s rainfall is primarily driven from the tropical Pacific sector (e.g., Cook et al., 2007; Herweijer et al., 2006; Rasmusson & Mo, 1993; Ting & Sardeshmukh, 1993; Trenberth et al., 1998). A recent study by Cvijanovic et al. (2017) developed a novel modeling framework to re-investigate the impacts of Arctic sea-ice loss on California’s climate. These simulations supported the findings by Sewall and Sloan (2004), estimating that Arctic sea-ice loss at the magnitude expected in the next few decades could, on average, decrease the amount of winter precipitation in California by up to 15 percent; however, they also found in their simulations that some years became wetter. By demonstrating that sea ice changes do not impact California’s precipitation from high latitudes directly (as previously thought), but through the tropics, Cvijanovic et al. (2017) have shown that the ‘sea ice’ (Sewall & Sloan, 2004) and ‘tropical’ hypotheses are not mutually exclusive. However, more studies are needed to confirm the link between reduced sea ice in the Arctic and dry conditions in California.
MARINE LAYER CLOUDS
Coastal low stratus clouds, including fog and stratus with elevated cloud bases, are a defining aspect of summer climate in coastal California. These coastal stratus clouds are also known as Marine Layer Clouds (MLC), or more colloquially as “May gray” and “June gloom”. MLC are affected by atmospheric circulation on broad Pacific-North America and regional scales, local topography, regional land and ocean surface temperature, and urban heating (Williams et al., 2018; Williams, Schwartz, et al., 2015). Because most of these processes are likely to be altered by global climate change, MLC may also be affected. However, because MLC is affected by multiple factors that themselves may be affected in opposite ways as climate changes, little is currently known about overall MLC sensitivity to climate change. Iacobellis and Cayan (2013) demonstrated that summertime MLC cover is strongly associated with coastal California surface temperature
Fourth Climate Change Assessment Statewide Summary Report | 28
CALIFORNIA’S FOURTH
CLIMATE CHANGE ASSESSMENT
variations. Along the coastal margin of California, a decrease in daily average cloud cover of 10 percent was found to increase afternoon temperatures by about 1°F (0.55°C), and vice-versa for increased cloud cover. MLC that typically shield the coast from summertime heat were absent during several recent heat waves, resulting in significant public health impacts (Gershunov et al., 2009; Gershunov & Guirguis, 2012; Guirguis et al., 2014). A recent investigation by Williams et al. (2018) indicates that land use changes and other factors in urban areas have diminished coastal fog and low clouds, but additional corroborative studies are needed.
WILDFIRE
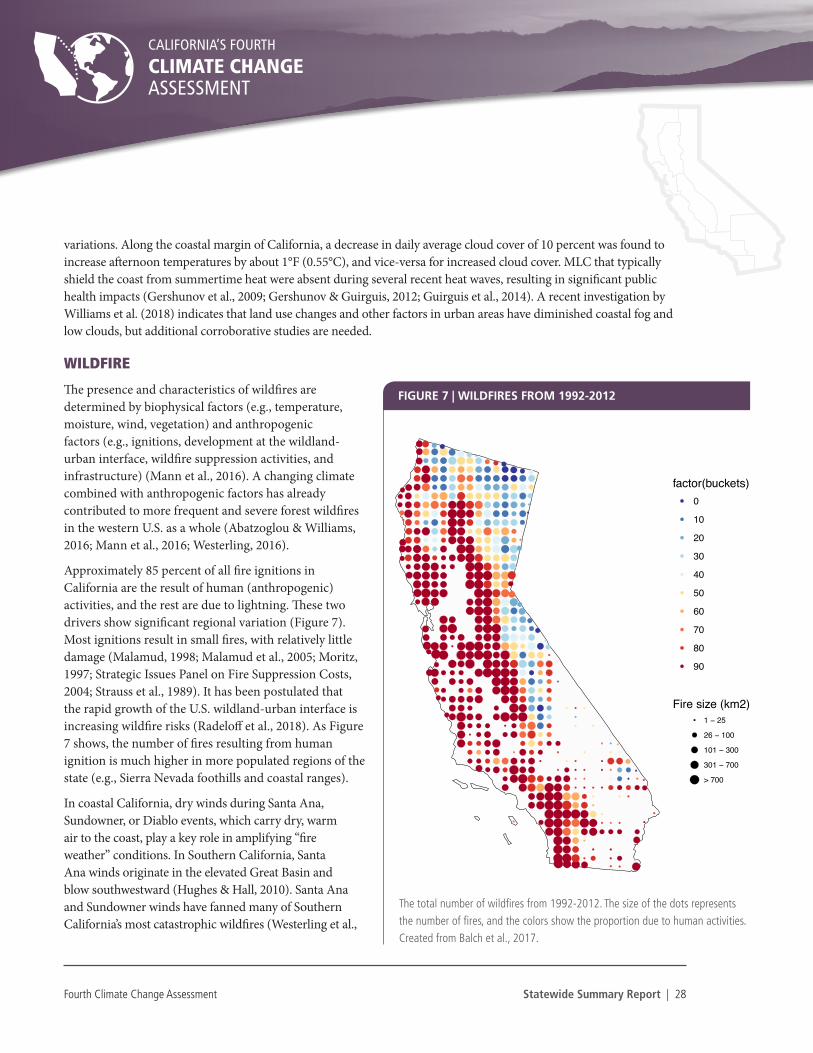
The presence and characteristics of wildfires are determined by biophysical factors (e.g., temperature, moisture, wind, vegetation) and anthropogenic factors (e.g., ignitions, development at the wildland-urban interface, wildfire suppression activities, and infrastructure) (Mann et al., 2016). A changing climate combined with anthropogenic factors has already contributed to more frequent and severe forest wildfires in the western U.S. as a whole (Abatzoglou & Williams, 2016; Mann et al., 2016; Westerling, 2016).
Approximately 85 percent of all fire ignitions in California are the result of human (anthropogenic) activities, and the rest are due to lightning. These two drivers show significant regional variation (Figure 7). Most ignitions result in small fires, with relatively little damage (Malamud, 1998; Malamud et al., 2005; Moritz, 1997; Strategic Issues Panel on Fire Suppression Costs, 2004; Strauss et al., 1989). It has been postulated that the rapid growth of the U.S. wildland-urban interface is increasing wildfire risks (Radeloff et al., 2018). As Figure 7 shows, the number of fires resulting from human ignition is much higher in more populated regions of the state (e.g., Sierra Nevada foothills and coastal ranges).
In coastal California, dry winds during Santa Ana, Sundowner, or Diablo events, which carry dry, warm air to the coast, play a key role in amplifying “fire weather” conditions. In Southern California, Santa Ana winds originate in the elevated Great Basin and blow southwestward (Hughes & Hall, 2010). Santa Ana and Sundowner winds have fanned many of Southern California’s most catastrophic wildfires (Westerling et al.,
●●●● ● ● ●●●● ● ● ● ● ●
●●● ● ●
●●● ● ●●●●●●●● ● ● ●
● ●●●●●●● ● ● ● ●
●●●●●● ● ●
●●●●●●● ●
●●●●●●● ● ● ●
● ●●●●●● ● ● ● ● ● ● ● ● ●
●●●●● ● ●● ● ● ● ● ● ●●
● ● ● ●●●● ● ● ● ● ● ● ● ● ●
● ● ● ●●● ● ● ● ● ● ● ●● ●
● ● ● ● ● ● ● ● ● ● ● ●
● ● ● ●● ● ● ● ● ● ● ● ●
● ● ● ● ● ●●●● ● ●
●● ● ● ● ● ●●● ● ● ●
●●●●● ●●●●●● ● ●
●● ● ● ●●●● ● ● ● ●
●● ●●●● ●●●● ● ●
●● ● ● ● ●●●●● ● ●
● ● ● ● ●●●●● ● ● ●
●●● ● ● ●●●●●● ● ● ●● ●●● ●●●●●●●●
●●● ●●●●●●●●●● ●
●●● ● ●●●●●●●●●●●
● ● ● ● ●●●●●●● ●
● ●● ●●●● ● ● ●●
●● ●●●●●●●
●●●●●●●●●● ●●●●●●●
●●●● ●●●●●●●●● ●●●●●●
●●●●● ●●●●●●● ●●●● ● ●●●●●●
●●●●● ● ●●●●●●●●●●●● ● ● ●●●●●●●●●●● ● ● ●●●●●●●●● ●
●●●●●●●● ●●●●● ●
●
● ● ● ● ●●●●●●●●● ●
●●●●●●●●●●●●● ● ●●
● ●●●●●●●●●●●●● ● ●
●● ● ●●●●●●●●●●●●●●●●●● ●●●●●●●●●● ●
●●●●●●●●●●●●●●●
●●●●●●●●●●●● ● ●
●● ●●●●●● ● ● ●
●●●●●● ● ●
●● ● ●
factor(buckets)●
●
●
●
●
●
●
●
●
●
0
10
20
30
40
50
60
70
80
90
Fire size (km2)●
●
●
●
●
1 − 25
26 − 100
101 − 300
301 − 700
> 700
FIGURE 7 | WILDFIRES FROM 1992-2012
The total number of wildfires from 1992-2012. The size of the dots represents the number of fires, and the colors show the proportion due to human activities. Created from Balch et al., 2017.
●●●● ● ● ●●●● ● ● ● ● ●
●●● ● ●
●●● ● ●●●●●●●● ● ● ●
● ●●●●●●● ● ● ● ●
●●●●●● ● ●
●●●●●●● ●
●●●●●●● ● ● ●
● ●●●●●● ● ● ● ● ● ● ● ● ●
●●●●● ● ●● ● ● ● ● ● ●●
● ● ● ●●●● ● ● ● ● ● ● ● ● ●
● ● ● ●●● ● ● ● ● ● ● ●● ●
● ● ● ● ● ● ● ● ● ● ● ●
● ● ● ●● ● ● ● ● ● ● ● ●
● ● ● ● ● ●●●● ● ●
●● ● ● ● ● ●●● ● ● ●
●●●●● ●●●●●● ● ●
●● ● ● ●●●● ● ● ● ●
●● ●●●● ●●●● ● ●
●● ● ● ● ●●●●● ● ●
● ● ● ● ●●●●● ● ● ●
●●● ● ● ●●●●●● ● ● ●● ●●● ●●●●●●●●
●●● ●●●●●●●●●● ●
●●● ● ●●●●●●●●●●●
● ● ● ● ●●●●●●● ●
● ●● ●●●● ● ● ●●
●● ●●●●●●●
●●●●●●●●●● ●●●●●●●
●●●● ●●●●●●●●● ●●●●●●
●●●●● ●●●●●●● ●●●● ● ●●●●●●
●●●●● ● ●●●●●●●●●●●● ● ● ●●●●●●●●●●● ● ● ●●●●●●●●● ●
●●●●●●●● ●●●●● ●
●
● ● ● ● ●●●●●●●●● ●
●●●●●●●●●●●●● ● ●●
● ●●●●●●●●●●●●● ● ●
●● ● ●●●●●●●●●●●●●●●●●● ●●●●●●●●●● ●
●●●●●●●●●●●●●●●
●●●●●●●●●●●● ● ●
●● ●●●●●● ● ● ●
●●●●●● ● ●
●● ● ●
factor(buckets)●
●
●
●
●
●
●
●
●
●
0
10
20
30
40
50
60
70
80
90
Fire size (km2)●
●
●
●
●
1 − 25
26 − 100
101 − 300
301 − 700
> 700
Fourth Climate Change Assessment Statewide Summary Report | 29
CALIFORNIA’S FOURTH
CLIMATE CHANGE ASSESSMENT
2004). In October 2017, a Diablo wind event contributed to fire behavior that led to enormous damage in Sonoma and Napa Counties. Modelers are still working to determine how Santa Ana, Sundowner, and Diablo winds may respond to climate change. Some results suggest decreased activity based on a combination of observations and climate model projections (Hughes et al., 2011). However, there is no indication of decreased activity in the longest record of Santa Ana winds available (Guzman-Morales et al., 2016). GCM simulations suggest that late season Santa Ana winds will continue to be most frequent in December and January, and that they will likely become hotter with climate change (Hughes et al., 2011). Some studies suggest substantial increases in area burned due to Santa Ana winds by the middle of this century (e.g., Jin et al., 2015). Overall, however, there is lack of consensus on how Santa Ana wildfires will change during the rest of this century. In 2017, a late onset in winter precipitation maintained the availability of dry vegetation during December. When Diablo winds developed that month, the dry vegetation was primed for explosive wildfires. Usually, early winter precipitation will moisten dry summer and fall vegetation, limiting wildfires in December and January even with the presence of dry winds.
Wildfire Scenarios and Projections
In recent years, the area burned by wildfires has increased in parallel with increasing air temperatures (OEHHA, 2018). Wildfires have also been occurring at higher elevations in the Sierra Nevada mountains (Schwartz et al., 2015), a trend which is expected to continue under future climate change. Climate change will likely modify the vegetation in California, affecting the characteristics of fires on the land (Liang et al., 2017a, 2017b; Westerling et al., 2011; Westerling, 2018). Land use and development patterns also play an important role in future fire activity (Mann et al., 2014). Because of these complexities, projecting future wildfires is complicated, and results depend on the time period for the projection and what interacting factors are included in the analysis. Because wildfires are affected by multiple and sometimes complex drivers, projections of wildfire in future decades in California range from modest changes from historical conditions (Mann et al., 2016) to relatively large increases in wildfire regimes (Jin et al., 2015; Westerling et al., 2011).
Westerling (2018) developed new wildfire projections for the Fourth Assessment driven by the climate scenarios described above and human population projections described in Chapter 2. Westerling (2018) used a set of statistical models trained with historical records of fire, climate, and land surface characteristics (including population, development footprint, and statistical proxies for static human influences on ignitions in non-urban areas). These models simulate individual large fire events (greater than 400 hectares or 988 acres) as a function of changing climate, population, development footprint, and forest fuels management strategies. Importantly, Westerling’s models do not consider potential changes in wind regimes, which may be an important, albeit difficult to project, factor in areas of California that have been or may be affected by dry winds. Figure 8 shows the results of an average of four GCMs used, highlighting the large increase in area burned per year in the forests of the Sierra Nevada and North Coast. Please refer to Westerling (2018) for a full discussion on uncertainties in these wildfire projections.

Fourth Climate Change Assessment Statewide Summary Report | 30
CALIFORNIA’S FOURTH
CLIMATE CHANGE ASSESSMENT
Westerling’s (2018) modeling results under the high emission scenarios (RCP 8.5) show a 77 percent increase in mean area burned (compared to 1961-1990) by the end of the century. Under this modeling framework, the maximum area burned statewide would increase 178 percent by the end of the century under a high emission scenario, and extreme wildfires (i.e., fires larger than 10,000 hectares or 24,710 acres) would occur 50 percent more frequently. Simulations of the effect of large-scale fuels treatment (e.g., fuel reduction) substantially reduce the increases in burned area (Westerling, 2018), which could also increase carbon storage in treated areas (Liang et al., 2018). As indicated in the discussion above about MLC, land use changes and other factors in urban areas may contribute to diminished coastal fog and low clouds (Williams et al., 2018). Diminished coastal fog makes coastal regions more prone to wildfire because of increased seasonal drying of coastal vegetation.
The massive death of 129 million trees from a combination of the recent drought, an associated bark beetle outbreak, and an unhealthy forest due to decades of fire suppression and resulting overgrowth compounds the uncertainties about changes in wildfire risk under climate change (Stephens et al., 2018). Such conditions could lead to greater fire risk, particularly of “mass fires” burning large areas simultaneously (Stephens et al., 2018). However, the science of predicting wildfire intensity, spread, and duration is still limited, and current fire behavior models are not designed to take into account the loading of dead fuel. A preliminary analysis of possible effects of mortality on near-term fire severity in the Sierra Nevada, excluding longer-term conjectures about mass fire, found increases in high severity burned areas on the order of 1 to 7 percent for Sierra Nevada forests (Westerling, 2018), but the actual impacts could be substantially more severe.
Average annual area in hectares burned using four GCMs and 30-year periods for RCP 8.5, mid-range population growth. (a) 1961-1990; (b) 2035–2064; (c) 2070–2099. Source: Westerling, 2018
FIGURE 8 | PROJECTED AVERAGE ANNUAL AREA BURNED BY WILDFIRE

Fourth Climate Change Assessment Statewide Summary Report | 31
CALIFORNIA’S FOURTH
CLIMATE CHANGE ASSESSMENT
SEA-LEVEL RISE, COASTAL FLOODING, AND EROSION
Sea-level along the central and southern California coast has risen more than 15 cm (5.9 inches) over the 20th century. Recently, even moderate tides and storms have produced extremely high sea-levels—La Jolla’s all time highest sea-level occurred on November 2015 under a high astronomical tide and a moderate storm. Over the 21st century, it is virtually certain that sea-levels will rise substantially; however, uncertainty persists in the rate of rise. Sea-level rise (SLR) estimates are similar under both a moderate and high emission scenario through 2050, as demonstrated by projections of La Jolla’s maximum daily sea-level (Figure 9, upper) and number of hours of exceedance over historical maximum (Figure 9, lower). The difference between the 50th and 95th percentile estimates increases with time, primarily because of the large uncertainty in ice sheet melting. The SLR increase for different projections is not linear in time. By 2100, the 50th percentile SLR projection under RCP 8.5 is more than five times the SLR projected for 2100 under RCP 4.5 (Pierce et al., 2018).
The National Research Council developed SLR projections for California in 2012, but these did not correspond to future emission scenarios (National Research Council, 2012). The SLR projections developed for the Fourth Assessment use a probabilistic approach and, like the projections for temperature, are linked to RCP 8.5 and RCP 4.5. A more recent scientific review prepared for the Ocean Protection Council reports similar values as the ones used for the Fourth Assessment (Griggs et al., 2017; see “Text Box: Sea-Level Rise Projections: Fourth Assessment and SLR Guidance).
Flooding from sea-level rise and coastal wave events leads to bluff, cliff, and beach erosion, which could affect large geographic areas (hundreds of kilometers). In research conducted for the Fourth Assessment, Erikson et al. (2018) found that if a 100-year storm occurs under a future with 2m (6.6 feet) of SLR, resultant flooding in Southern California could affect 250,000 people and lead to damages of $50 billion worth of property and $39 billion worth of buildings.
Recognizing the need to have projections of SLR in combination with coastal storms, the Fourth Assessment supported the development of the U.S. Geological Survey Coastal Storm Modeling System (CoSMos) for the South Coast (Pt. Conception to the U.S./Mexico border) (Erikson et al., 2018). This additional investment extended the model’s coverage, and the dynamic modeling tool is now
The SLR projections developed for the Fourth Assessment present a broader range of SLR estimates than the recent report Rising Seas in California: An Update on Sea-Level Rise Science, which was used by the Ocean Protection Council (OPC) in the preparation of State of California Sea-Level Rise Guidance (2018). The Fourth Assessment SLR projections include, under the RCP 8.5 scenario, a slim possibility that sea-level rise will exceed 9 feet by 2100. This is about the same magnitude as the very high H++ scenario included in the recently released OPC Sea Level Guidance, but the OPC extreme scenario is not assigned a probability and is not attached to an individual emission scenario. Both programs’ projections are based on estimates of contributions to SLR from primary sources using different methods, including model projections and expert input. However, the Fourth Assessment uses new modeling results that quantify the potential rapid demise of the Antarctic land-based ice mass. Because there is still considerable uncertainty in these results, the Fourth Assessment projections are meant for research purposes, while the OPC projections are meant for regulatory and planning purposes.
SEA-LEVEL RISE PROJECTIONS: FOURTH ASSESSMENT AND SLR GUIDANCE

Fourth Climate Change Assessment Statewide Summary Report | 32
CALIFORNIA’S FOURTH
CLIMATE CHANGE ASSESSMENT
Projected daily maximum sea level at La Jolla constructed from the eight hourly simulations that conform to RCP 4.5 and RCP 8.5 simulations. Envelopes of 50th-95th percentile daily maximum of RCP 4.5 and RCP 8.5 projections are shown in light blue and light red. The maximum annual value from 99.9 percentile RCP 4.5 and RCP 8.5 projections are shown as solid blue and solid red lines. Maximum observed historical sea level at La Jolla is shown as blue inverted triangle
Projected hours of sea level exceeding the historical maximum for La Jolla, California under 50th percentile and 95th percentile SLR scenarios under RCP 4.5 (light and dark blue) and RCP 8.5 (light and dark red). The envelope shows high to low set of results from each of eight California GCMs for which hourly sea level projections were developed. The inverted triangle in the upper right corner of the graph marks the number of hours in a year, 8,760 hours. Source: Pierce et al., 2018.
FIGURE 9 | SEA-LEVEL RISE PROJECTIONS FOR LA JOLLA, CALIFORNIA
Sea-level rise projections under RCP 4.5 and RCP 8.5 for La Jolla, which provide a representative example of SLR projections for the entire California coast.
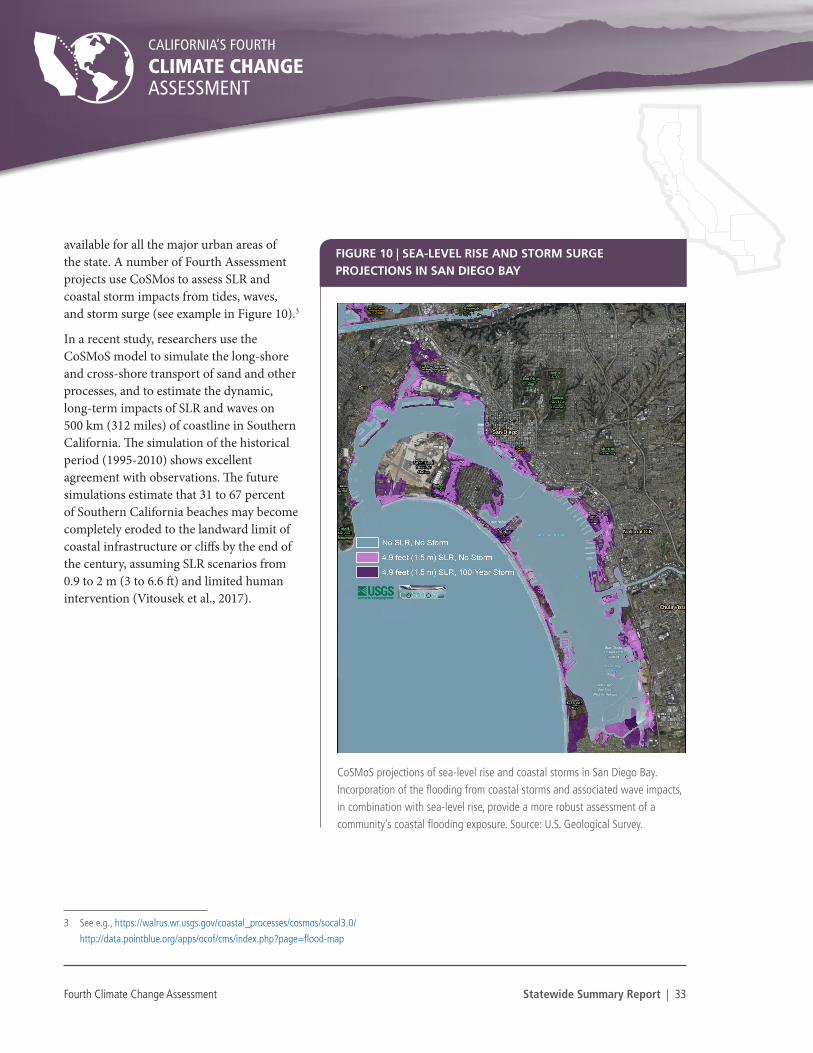
Fourth Climate Change Assessment Statewide Summary Report | 33
CALIFORNIA’S FOURTH
CLIMATE CHANGE ASSESSMENT
CoSMoS projections of sea-level rise and coastal storms in San Diego Bay. Incorporation of the flooding from coastal storms and associated wave impacts, in combination with sea-level rise, provide a more robust assessment of a community’s coastal flooding exposure. Source: U.S. Geological Survey.
FIGURE 10 | SEA-LEVEL RISE AND STORM SURGE PROJECTIONS IN SAN DIEGO BAY
available for all the major urban areas of the state. A number of Fourth Assessment projects use CoSMos to assess SLR and coastal storm impacts from tides, waves, and storm surge (see example in Figure 10).3
In a recent study, researchers use the CoSMoS model to simulate the long-shore and cross-shore transport of sand and other processes, and to estimate the dynamic, long-term impacts of SLR and waves on 500 km (312 miles) of coastline in Southern California. The simulation of the historical period (1995-2010) shows excellent agreement with observations. The future simulations estimate that 31 to 67 percent of Southern California beaches may become completely eroded to the landward limit of coastal infrastructure or cliffs by the end of the century, assuming SLR scenarios from 0.9 to 2 m (3 to 6.6 ft) and limited human intervention (Vitousek et al., 2017).
3 See e.g., https://walrus.wr.usgs.gov/coastal_processes/cosmos/socal3.0/
http://data.pointblue.org/apps/ocof/cms/index.php?page=flood-map
Fourth Climate Change Assessment Statewide Summary Report | 34
CALIFORNIA’S FOURTH
CLIMATE CHANGE ASSESSMENT
Chapter 2: Climate Change Impacts in California
limate risk is a function of climate and weather events, exposure, and vulnerability (IPCC, 2012). California is already experiencing the effects of a changing climate, and these impacts are projected to worsen, even with only moderate increases in global greenhouse gas emissions. Chapter 1 outlines how climate changes are expected to evolve in California over the coming century. However, how these changes are experienced
will be affected by exposure and vulnerability. Exposure is the presence of people, infrastructure, natural systems, and economic, cultural, and social resources in areas that are subject to harm (adapted from IPCC, 2012). Vulnerability is the susceptibility to harm and can be attributed to social, economic, demographic, and physical factors. Both vulnerability and exposure are directly affected by California’s population growth, development patterns, and success in addressing underlying vulnerabilities, including equity and social vulnerability.4
This chapter starts with a discussion of population growth and land use, as well as equity and social vulnerability – factors that will have an important influence on how climate change is experienced by Californians. The chapter then provides an overview of how climate change will affect people, infrastructure, and natural systems. The interdependencies and linkages among these systems are complex, but crucial to consider in taking steps to respond to and build resilience in the face of a changing climate (Adger et al., 2011; Adger et al., 2003; Dietz, 2003; Meerow et al., 2016).
Land Use and Population Growth in a Changing Climate
Population growth and associated development have always had significant impacts on the environment, and these become even more important under a changing climate. The ways in which people organize, build, and plan will not only affect how the climate continues to change, but also how people will experience the impacts of climate change (Garmestani & Allen, 2014). California has a variety of urban and rural communities, with distinct and geographically specific attributes. Although 95 percent of the state’s population resides in urban areas or clusters (U.S. Census Bureau, 2012), rural populations and communities will also feel significant effects from a changing climate.
Land use and development patterns are a determinant of climate change exposure for people, infrastructure, and natural systems. Land use conversion can result in the loss of habitat or natural features (e.g., floodplains) that provide natural protection for communities and infrastructure. Development in high-hazard areas (e.g., coastal areas at risk of SLR and flooding) place people, infrastructure, and other assets at risk. Design standards and features can mitigate this exposure, but underlying land use and development patterns should be factored into consideration of climate impacts.
The Fourth Assessment includes projections of population and land use change through the end of the 21st century to enable this consideration. These projections build on previous research on land use and population change (Thorne et al., 2012), but use a new approach developed by Sleeter et al. (2017) that considers land use change across all land types and uses, not just urban development. The scenarios consider different population growth rates, but assume that development follows historical patterns (i.e., these scenarios do not include consideration of more
C
2 For a definition of vulnerability, see “Key Terms” text box, page15.

Fourth Climate Change Assessment Statewide Summary Report | 35
CALIFORNIA’S FOURTH
CLIMATE CHANGE ASSESSMENT
compact growth patterns versus sprawl). The projections include rates of population change based on California-specific historical data for a business-as-usual scenario and three additional county-level growth scenarios developed by the Department of Finance for the Fourth Assessment (Table 5).
Under historical development patterns, urbanization will continue to have profound effects on the composition of ecosystems in California and in particular on natural and working lands. For example, under the Medium Growth Scenario, development is projected to increase by 60 percent by the end of the century, resulting in a net decline in grasslands of 8 percent. Under the three population scenarios, developed lands are projected to increase 40 to 90 percent by 2100. The land use change modeling found that urban expansion will most likely occur adjacent to existing cities, with some towns continuing to merge into larger metropolitan areas.
Several Fourth Assessment studies used these projections, including analysis of wildfire scenarios (Westerling, 2018), impacts on the electrical transmission and distribution grid (Dale et al., 2018), homeowner’s insurance (Dixon et al., 2018), and for adaptations in crop and livestock systems (Medellín-Azuara et al., 2018). However, it is important to indicate that undertaking more compact development patterns (e.g., accommodating more people in existing urban areas) results in the least conflict with ecological objectives such as preservation of biodiversity corridors and less conversion of agricultural areas to development (Thorne, Choe, Boynton, et al., 2017; Thorne, Santos, et al., 2017). This and other climate-friendly land use developments should be explored in future assessments.
Equity and Social Vulnerability
Vulnerability can be measured in both absolute and relative terms.5 However, as a matter of policy design and implementation, California is focused on vulnerability in relative terms, for people and communities with the least capacity and resources to undertake climate action and to prepare for, respond to, and recover from climate impacts.
Several factors contribute to people’s vulnerability to climate change. These can include personal attributes (i.e., age, economic status, race, citizenship, etc.), the physical environment (i.e., pollution or lack of shade trees), and historic underinvestment and marginalization (e.g., Cooley et al., 2012; Gamble & Balbus, 2016; Kersten et al., 2012; Roos, 2018). For example, vulnerability is exacerbated by institutionalized racism and a legacy of de jure and de facto segregation (e.g., Rothstein, 2017). Proximity to pre-existing sources of pollution is another source of long-
5 For example, a billionaire who lost $700,000 has lost more in absolute terms than a middle class person who loses $500,000. But in relative terms, the
middle class person has lost more as a percentage of overall assets than the billionaire has.
TABLE 5: POPULATION PROJECTIONS DEVELOPED FOR THE FOURTH ASSESSMENT
SCENARIO DESCRIPTION
Low Growth Modest population growth to a high of 45 million at mid-century, followed by a decline to 42 million by the end of the century.
Medium Growth Population grows to 52 million by mid-century and levels off.
High Growth Population grows at a rate similar to historical rates, to nearly 61 million by the end of the century; growth rate diminishes over time.
TABLE 5 | POPULATION PROJECTIONS DEVELOPED FOR THE FOURTH ASSESSMENT
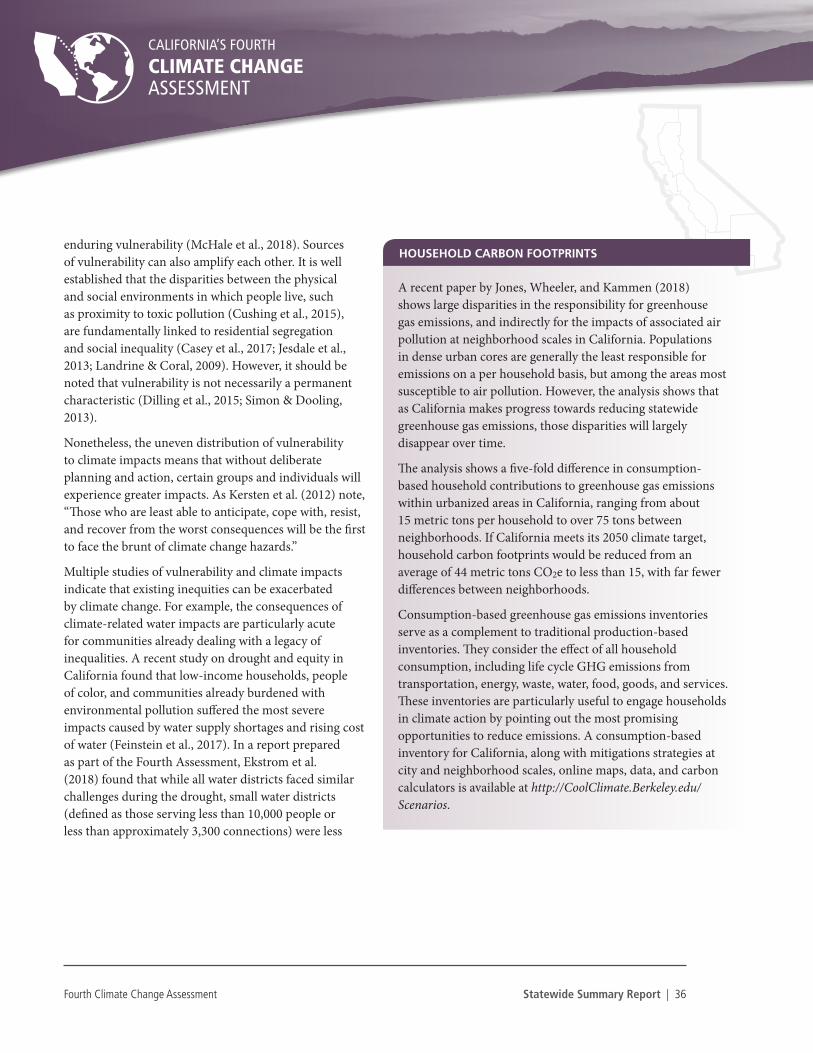
Fourth Climate Change Assessment Statewide Summary Report | 36
CALIFORNIA’S FOURTH
CLIMATE CHANGE ASSESSMENT
enduring vulnerability (McHale et al., 2018). Sources of vulnerability can also amplify each other. It is well established that the disparities between the physical and social environments in which people live, such as proximity to toxic pollution (Cushing et al., 2015), are fundamentally linked to residential segregation and social inequality (Casey et al., 2017; Jesdale et al., 2013; Landrine & Coral, 2009). However, it should be noted that vulnerability is not necessarily a permanent characteristic (Dilling et al., 2015; Simon & Dooling, 2013).
Nonetheless, the uneven distribution of vulnerability to climate impacts means that without deliberate planning and action, certain groups and individuals will experience greater impacts. As Kersten et al. (2012) note, “Those who are least able to anticipate, cope with, resist, and recover from the worst consequences will be the first to face the brunt of climate change hazards.”
Multiple studies of vulnerability and climate impacts indicate that existing inequities can be exacerbated by climate change. For example, the consequences of climate-related water impacts are particularly acute for communities already dealing with a legacy of inequalities. A recent study on drought and equity in California found that low-income households, people of color, and communities already burdened with environmental pollution suffered the most severe impacts caused by water supply shortages and rising cost of water (Feinstein et al., 2017). In a report prepared as part of the Fourth Assessment, Ekstrom et al. (2018) found that while all water districts faced similar challenges during the drought, small water districts (defined as those serving less than 10,000 people or less than approximately 3,300 connections) were less
A recent paper by Jones, Wheeler, and Kammen (2018) shows large disparities in the responsibility for greenhouse gas emissions, and indirectly for the impacts of associated air pollution at neighborhood scales in California. Populations in dense urban cores are generally the least responsible for emissions on a per household basis, but among the areas most susceptible to air pollution. However, the analysis shows that as California makes progress towards reducing statewide greenhouse gas emissions, those disparities will largely disappear over time.
The analysis shows a five-fold difference in consumption-based household contributions to greenhouse gas emissions within urbanized areas in California, ranging from about 15 metric tons per household to over 75 tons between neighborhoods. If California meets its 2050 climate target, household carbon footprints would be reduced from an average of 44 metric tons CO2e to less than 15, with far fewer differences between neighborhoods.
Consumption-based greenhouse gas emissions inventories serve as a complement to traditional production-based inventories. They consider the effect of all household consumption, including life cycle GHG emissions from transportation, energy, waste, water, food, goods, and services. These inventories are particularly useful to engage households in climate action by pointing out the most promising opportunities to reduce emissions. A consumption-based inventory for California, along with mitigations strategies at city and neighborhood scales, online maps, data, and carbon calculators is available at http://CoolClimate.Berkeley.edu/Scenarios.
HOUSEHOLD CARBON FOOTPRINTS
Fourth Climate Change Assessment Statewide Summary Report | 37
CALIFORNIA’S FOURTH
CLIMATE CHANGE ASSESSMENT
likely to have the resources and capacity to overcome those challenges. These districts are most likely to serve small, rural communities in California. Furthermore, for marginalized populations in rural areas of the state, agricultural actions in response to the drought, including increases in groundwater pumping and crop choices, are increasing and reshaping their vulnerability to drought and water shortage (Greene, 2018).
Inequities not only exist in varying exposures to climate risk, but also in the availability and implementation of potential adaptation or resilience solutions. Recent research analyzed differences in tree canopy, an important tool for adapting to the effects of extreme heat, at the census block group scale in coastal Los Angeles and found disparities between canopy in high-income and low-income neighborhoods (Locke et al., 2017). This disparity can have implications for communities because of the benefits tree canopy provides in reducing the negative effects of extreme heat events. A study prepared for the Fourth Assessment provides one of the first estimates of these benefits in one location (Taha et al., 2018).
The imperative to address the types of inequities discussed above is encompassed in the principle of climate justice. The concept of climate justice is that “that no group of people should disproportionately bear the burden of climate impacts or the costs of mitigation and adaptation” (Cooley et al., 2012).6 Unlike environmental justice, climate justice,7 does not necessarily have a pollution component. Like environmental justice, climate justice also captures the concept of inter-generational equity, which states that future generations should not bear a disproportionate burden from climate-related impacts. Implementation of climate justice requires examining and designing processes for planning and adaptation that reflect principles of equity and inclusion from the outset, as well as considering the distribution of climate burdens and benefits (Bulkeley et al., 2014; Schlosberg, 2007). California’s adaptation policy, research, and programs emphasize ensuring that low-income and vulnerable communities are meaningfully included in plans and programs for climate adaptation plans and projects (CNRA, 2018). For additional information on climate justice in California, please refer to the Fourth Assessment’s Climate Justice Summary Report (2018).
6 This theory has become central to the state of California. Executive Order B-30-15, which requires all agencies to integrate climate change into planning and
investment, identifies protection of the State’s most vulnerable communities as a principle of that work.
7 Environmental justice is aimed at preventing and repairing unfair distributions of environmental harms or goods across populations (Roos, 2018; Schlosberg,
2007).

Fourth Climate Change Assessment Statewide Summary Report | 38
CALIFORNIA’S FOURTH
CLIMATE CHANGE ASSESSMENT
Impacts of Climate Change on People
Climate change will affect Californians through several different mechanisms, including increased exposure of people to climate-related risks, and threats to infrastructure and the natural environment. This section focuses on direct threats to people and communities, starting with a discussion of public health and economic impacts. It then reviews emergency management and concludes with a discussion of tribal and indigenous communities, who face unique challenges under a changing climate.
PUBLIC HEALTH AND WELLBEING
Available science indicates that because of climate change, many people will endure more illness and be at greater risk of early death in California. High ambient temperatures have been shown to adversely affect public health via early death (mortality) and illness (morbidity) (Basu, 2009; Ostro et al., 2011; Sherbakov et al., 2018). Drought and wildfire, associated with climate change, present significant health and wellbeing risks for California populations. It is estimated that the drought ending in 2016 affected nearly the entire state (DWR & NRA, 2016), and that more than 2.7 million Californians (>7 percent) currently live in high-risk wildfires areas, in part due to historic land decisions (“CalBRACE,” 2018). Exposure to wildfire smoke is linked to increased incidences of respiratory illnesses (Reid et al. 2016). Climate change will also have indirect impacts on public health, including increased vector-borne diseases, and stress and mental trauma due to extreme events and disasters, economic disruptions, and residential displacement (Gould & Dervin, 2012; McMichael & Lindgren, 2011; USGCRP, 2016). These indirect climate impacts are discussed further in the Public Health chapter of Safeguarding California.
Describing the potential health impacts of climate change in California requires understanding the various factors that already determine people’s health and wellbeing. Over half of a person’s long-term health outcomes result from social factors (CDPH, 2015). These determinants include the social and economic
Climate change poses direct and indirect risks to public health, and the public health benefits of deep greenhouse gas emission (GHG) reductions could be comparable to the cost of achieving the GHG reductions.
New methods are being applied to estimate the economic costs of climate change. Emerging findings for California show that costs are dominated by human mortality, damages to coastal properties, and the potential for droughts and mega-floods.
Critical emergency infrastructure is at risk from flood and wildfire over this century, and a new tool is available to evaluate this risk via CERI-Climate (California Emergency Response Infrastructure Climate Vulnerability Tool).
Tribes and Indigenous communities in California face unique challenges under a changing climate. Tribes maintain cultural lifeways and rely on traditional resources (e.g., salmon fisheries) for both social and economic purposes. However, tribes are no longer mobile across the landscape. For many tribes in California, seasonal movement and camps were a part of living with the environment. Today these nomadic options are not available or are limited. This is the result of Euro-American and U.S. policy and actions and underpins several climate vulnerabilities. Tribes with reservations/Rancherias/allotments are vulnerable to climate change in a specific way: tribal lands are essentially locked into fixed geographic locations and land status. Only relatively few tribal members are still able to engage in their cultural traditions as livelihoods.
KEY FINDINGS FROM THE FOURTH ASSESSMENT
Fourth Climate Change Assessment Statewide Summary Report | 39
CALIFORNIA’S FOURTH
CLIMATE CHANGE ASSESSMENT
circumstances in which people grow up and live as adults, the educational opportunities they have, and the environmental quality and built environment in which they live and work. These and other social factors combine in disadvantaged communities to create levels of toxic chronic stress and also influence behaviors, including smoking, diet, and sedentary lifestyles, which can be harmful to long term health. (McGovern et al., 2014; Mokdad et al., 2004; WHO, 2009). Many of these social determinants of health contribute to lowering one’s adaptive capacity, and when combined with climate impacts, increase vulnerability in the face of a changing climate.
These social determinants, therefore, are crucial when assessing options to mitigate public health impacts of climate change. For example, studies of mitigation strategies for high heat strongly suggest considering relative income and access to greenery. Air conditioning has been shown to decrease mortality and morbidity from high heat (Barreca et al., 2013). In California, Ostro et al. (2011) estimated impacts on mortality resulting from average temperature increases under a high emission scenario to be 6,700 to 11,300 additional annual deaths in 2050.8 However, the same authors report that an increase in penetration of air conditioning units of 20 percent would decrease the mortality effect by 33 percent by 2050 (Ostro et al., 2011). Air conditioning usage varies within and across California counties. For example, in San Diego County’s three distinct climatic regions (CEC, 2015), hotter, interior regions have higher air conditioning usage than coastal regions. Guirguis et al. (2018) used this as a natural experiment to show that heat-related mortality was lower in regions with higher penetration of air conditioning units. Guirguis et al. (2018) also found that disparities in AC ownership were associated with income, race/ethnicity, and home ownership. The existence of air conditioning and its use are not always equivalent. Even when some have air conditioning, low-income groups may not use it during high temperature events due to financial constraints (Bassil & Cole, 2010). Given that heat waves are expected to increase with climate change, understanding health impacts of heat and the role of air conditioning/acclimation is critical for reducing human health impacts in the future (Guirguis et al. 2018).
Disadvantaged communities may also lack easy access to cooling centers in metropolitan areas. In Los Angeles County for example, 80 percent of households are within walking distance of a public cooling resource such as a library or commercial establishment. While this fraction is high, 20 percent of households do not have easy access to publicly-available places with free access to space cooling (Fraser et al., 2016). Outdoor workers are also more vulnerable to high temperatures. An analysis of communities in Los Angeles showed that for each percentage increase in residents working in construction, there was a 7.9 percent increase in heat-related hospitalizations, and an 8.1 percent increase in heat-related hospitalizations compared to other communities (Riley et al., 2018). Alternative adaptation options should be developed for outdoor workers where access to areas with space cooling is not practical.
A study using more than 6 million hospitalization records in California (warm seasons from 1999 to 2009) reported adverse public health impacts for heat waves as well as temperature events below the threshold to technically be considered heat waves. Adverse health impacts were also reported when temperatures were above the relevant mean daily mean temperatures in 16 climatic zones defined by the California Energy Commission for building energy standard purposes (CEC, 2015; Sherbakov et al., 2018). The authors define heat waves as the mean temperature above the month-specific 95th percentile for a minimum of two days. This suggests that precautionary measures should also be taken for conditions that are not considered as severe as a heat wave.
8 SRES A2 scenario
Fourth Climate Change Assessment Statewide Summary Report | 40
CALIFORNIA’S FOURTH
CLIMATE CHANGE ASSESSMENT
Temperature increases will impact populations in urban areas more severely due to the Urban Heat Island effect (Stone et al., 2012). Urban heat island mitigation strategies include increasing the tree canopy in cities, since trees reduce surface air temperature in streets and buildings, as well as using cool roofs and pavements that reflect more radiant energy due to being painted a white color, or that are covered with a roof-top garden (James et al., 2015; Jesdale et al., 2013). A Fourth Assessment study demonstrates that neighborhood-scale tree canopy and increases in albedo (e.g., roofs that reflect solar radiation) reduce ambient air temperatures (Taha et al., 2018). This is one of the first studies to use real-world data to quantify benefits of cool roofs and canopy cover in urban areas in California and needs to be duplicated in other cities and settings in the state.
While increasing temperatures present a direct threat to public health, climate change will also result in a number of indirect negative impacts to health and well-being. Higher temperatures associated with climate change could lead to increases in ground-level ozone and reduce the effectiveness of emission reductions taken to achieve air quality standards, a phenomenon known as the “climate penalty” (Jacob & Winner, 2009; Mickley, 2007; Rasmussen et al., 2013). While many analyses still show improvements in air quality over the coming century (e.g., Shen et al., 2017; Trail et al., 2014), even with changing climate, Trail et al. (2014) show that these improvements are less than expected because of climate change. Please see the text box in Chapter 3, “Public Health Benefits of Deep GHG Emission Reductions in California”, for further discussion of the potential benefits of deep GHG reductions and associated reductions in NOx, particulate matter, and volatile organic compounds (VOCs) (Zapata et al., 2018). Climate change is also expected to affect water quality through increased runoff and the associated potential for algal blooms (Michalak, 2016). These effects must be closely monitored, and mitigation measures put into effect to minimize the potential threat to human health.
ECONOMIC IMPACTS OF A CHANGING CLIMATE
Impacts of climate change are already being detected and attributed at varying spatial scales (IPCC, 2015). A sizable literature has attempted to quantify the future direct impacts on the global economy (Carleton & Hsiang, 2016). Economists are now taking advantage of “big data” and natural experiments to estimate damages of climate change to specific groups or sectors. The new economic studies follow groups (e.g., counties, labor in different industries, nations) and information on behavior over time under different weather conditions to infer the response of these sectors to changes in weather and climate (see Heal and Park (2016) for an overview of the economic literature). A major finding of these studies is that the response of outcomes to temperature is not linear as assumed in some of the older economic studies. At a national level, changes to temperature above certain thresholds negatively affect macro-level measures of economic activity such as gross domestic product (Burke et al., 2018; Burke et al., 2015).
The most recent comprehensive study provides the first county-level estimate of direct economic damages from climate change in the U.S., by examining impacts to agriculture, crime, coastal storms, energy, human mortality, and labor (Hsiang et al., 2017). The study finds relatively high direct economic damages to California and the southern part of the United States in general (see Figure 11). However, several of the study’s assumptions limit how well it represents damages in California. For example, there are no estimated coastal damages for California because the study only accounts for hurricanes, and agriculture impacts do not include consideration of high value crops grown in California. Despite these limitations, the study by Hsiang and others (2017) is an important methodological contribution on how to estimate direct economic impacts that could be emulated for California.

Fourth Climate Change Assessment Statewide Summary Report | 41
CALIFORNIA’S FOURTH
CLIMATE CHANGE ASSESSMENT
Spatial distribution of projected damages due to climate change at county level median values for 2080 to 2099. Source: Hsiang et al., 2017.
FIGURE 11 | DISTRIBUTION OF PROJECTED DAMAGES FROM CLIMATE CHANGE
Several studies, mostly associated with the current and past California Climate Change Assessments, have attempted to estimate economic impacts on the California economy for market (e.g., agricultural revenues) and non-market (e.g., human mortality) goods. Table 6 summarizes the available estimated costs of different climate impacts, and identifies some gaps where information is not available. However, it is important to note that the values in the table are not fully comparable because they derive from studies that use different assumptions, including socio-economic conditions, climate and sea-level projections, and other factors. The uncertainty in the estimates is very high, and the individual impacts should not be added up to estimate total direct impacts to California. Nonetheless, this table provides some order of magnitude estimates of economic impacts and suggests that without adaptation, the economic impacts of climate change will be very costly.
Based on the estimates in Table 6, direct damages by the middle of this century appear to be dominated by four factors: human mortality, damages to coastal properties, the potential impacts of inland mega floods (similar to the devastating flood experienced in 1861-1862 (Swain et al., 2018)), and droughts. However, many other important impacts have not been quantified, including public health and property damage from wildfires, impacts on human morbidity from high temperatures, impacts of drought on water quality, and impacts to habitat and other ecosystem services. All of these damages are likely to be costly. For instance, a recent UC Davis analysis estimates that the 2016 drought in California resulted in over $600 million in direct economic damages (annual losses) and resulted in the loss of 4,700 jobs (Medellín-Azuara et al., 2016). Even though $600 million is a small fraction (0.02 percent) of the $2.7 trillion California economy, these damages had severe economic impacts to agriculture and agricultural workers in particular.
Analysis at the national scale shows that economic impacts in the second part of this century tend to increase exponentially, but they are substantially dampened if efforts to reduce global GHG emissions are successful (e.g., Hsiang et al., 2017), and if effective adaptation measures are implemented.

Fourth Climate Change Assessment Statewide Summary Report | 42
CALIFORNIA’S FOURTH
CLIMATE CHANGE ASSESSMENT
See Appendix B for a more detailed table and documentation of assumptions.
* Implementation of adaptation measures (e.g., increased penetration and access of space cooling) could substantially reduce these impacts.
** Swain et al., 2018 is the only study suggesting an increased probability of a mega flood with a changing climate. Given the high costs associated with this event, it is listed in this table to highlight the importance of additional studies on this topic using different methods. The $42 billion cost is estimated taking into account the probability of this event in a 5 year period centered in 2050.
TABLE 6 | ORDER OF MAGNITUDE ESTIMATION OF DIRECT ECONOMIC IMPACTS FROM CLIMATE CHANGE BY 2050.
EFFECT OF ACTIVITY MAIN CLIMATE DRIVER COST
($ billion/year)COMMENTS
Human mortality* High ambient temperatures 50 Premature annual mortality (Ostro et al., 2011) translated into monetary terms using a value of a statistical life of $7.5 million.
All sectors of the economy
Mega-flood** similar to the one that devastated California in 1861-1862
42 One recent study by Swain et al., (2018) suggests a substantial likelihood of these floods in the rest of this century
Replacement value of buildings (residential and commercial sector)
Permanent inundation 18 Assuming 50 cm (~20 in) of sea-level rise, which is in the upper range (~95th percentile) of potential sea-level rise outcomes by 2050 (Pierce et al., 2018). Costs obtained from https://www.usgs.gov/apps/hera/ accessed on July 7, 2018.
Water supply and agriculture
Potential effect of a long drought
> 3 Assuming reductions in precipitation from 5 to 30 percent from historical conditions. Actual impacts would be much higher than $3 billion because the economic models assume very efficient adaptation. (Herman et al, 2018; Medellín-Azuara et al., 2018).
Energy demand: residential sector
Increase temperatures < 0.2 Increases in electricity demand ($0.65 billion) would be compensated by reductions of demand for space heating ($0.5 billion). (Auffhammer et al., 2018). Expected increases in energy efficiency will also lower costs even further.
Other impacts (e.g., human morbidity, loss of human lives and properties during wildfires)
Changes in temperature, aridity, wildfires, inland flooding, etc.
Unquantified or poorly quantified (see Appendix B).
Ecological impacts Changes in temperature, aridity, wildfires, inland flooding, etc.
Unquantified. Some argue that it is impossible to estimate the value of ecosystems in monetary terms for both practical and ethical reasons. Others are working to quantify the value of ecosystem services.

Fourth Climate Change Assessment Statewide Summary Report | 43
CALIFORNIA’S FOURTH
CLIMATE CHANGE ASSESSMENT
EMERGENCY MANAGEMENT AND DISASTER PREVENTION
Climate change will continue to increase the frequency and severity of some extreme weather events around the world and in California. These extreme events will likely be one of the most acute ways that Californians experience climate change. Emerging research examines the causal relationships between climate change and extreme weather. The 2016 Bulletin of the American Meteorological Society (AMS) on extreme events summarizes research results demonstrating, for the first time, that three 2016 events (a global heat record, heat across Asia, and a marine heat wave off the coast of Alaska) would not have been possible without climate change (AMS, 2018).
Emergency management encompasses disaster preparedness, response, recovery, and longer-term resilience planning. Emergency management and preparedness across this planning spectrum are critical to protect people, infrastructure, and natural systems across the state. Building resilience of people and infrastructure is necessary to minimize the impacts of a disaster and to expedite recovery.
Infrastructure provides the physical necessities of modern life, including electricity, gas, transportation, and water. A Fourth Assessment study by Lauland et al. (2018) categorizes California’s critical emergency response infrastructure by evaluating exposure and infrastructure impacts from projected floods and wildfire hazards, using RCP 8.5 and the median for flooding or average for wildfire among GCMs. The results indicate that critical facilities at risk from both flood (0.5 feet exposure threshold) and wildfire (50 percent burned threshold) increase by the end of the century, with expected losses of over $1.7 billion (using a business-as-usual population scenario).
Chapter 3 discusses how climate change will affect infrastructure in California. In the context of emergency prevention and management in California, evaluating the vulnerability and risks to infrastructure across the state is critical to improve overall community resilience. When infrastructure is impacted by an extreme event, communities can lose “lifeline” systems (Paton & Johnston, 2017), leaving people vulnerable and in need of services. Furthermore, these vulnerabilities are often exacerbated and have greater negative impacts on disadvantaged and vulnerable populations, as discussed above (Moser & Finzi-Hart, 2018). The impacts of connected lifeline systems on vulnerable communities are a significant barrier toward building and retaining their resilience to climate change and extreme events (McNichol, 2017).

Fourth Climate Change Assessment Statewide Summary Report | 44
CALIFORNIA’S FOURTH
CLIMATE CHANGE ASSESSMENT
TRIBAL AND INDIGENOUS COMMUNITIES
Tribal and indigenous communities face unique challenges under changing climate conditions. Over 115 federally recognized tribes (~20 percent of all tribes in the U.S.) exist in California, and they self-identify into three regions: Northern, Central, and Southern California.9 A Tribal Chairmen’s Association exists for each region. Although many tribes have developed economic enterprises (e.g., roughly half the tribes across the state have casinos), tribal communities are among the most socio-economically disadvantaged in the State.10 While the impacts of climate change will affect all tribes across the state, as with all California communities, each tribe is distinct with unique histories, cultures, practices, resources, and relationships to their environment. The following discussion is not a comprehensive assessment of the impacts climate change will have on tribes across the state, but rather, it highlights some of the key findings and messages from the inaugural Summary Report from Tribal and Indigenous Communities within California.
This is the first time a Tribal and Indigenous Communities Report has been included as part of the California Climate Assessment. The goal was to put together an author team for the report that spans across a range of sectors, regions, expertise, and commitment to working on climate-related issues.
Expert elicitation is a methodology used to combine the subjective judgments of technical experts when data is insufficient or unavailable to inform decision-making and there is a need to quantify the extent and causes of uncertainty (Morgan, 2014). Although expert elicitation generally depends on statistical methodologies and presents subjective judgments in a quantified manner, the underlying theory behind the methodology is that experts have more informed frames for viewing specific problems (Colson & Cooke, 2018). Furthermore, by combining their perspectives it is possible to have more informed policy under conditions of uncertainty (O’Hagan et al., 2006). This underlying theory can be used in less-quantifiable but still structured ways to elicit and combine expert opinion, as done for the Summary Report from Tribal and Indigenous Communities within California.
Information on climate impacts, strategies, and actions taken by tribes and Indigenous communities to mitigate and adapt to these impacts is often not documented in peer-reviewed scientific literature. How climate change is explained and understood differs between government agencies and Western scientists, and Indigenous Peoples and knowledge holders. Indigenous science, which includes long-term observations, monitoring, testing, and validation over generations, is often documented through oral traditions and passed down through traditional knowledge systems. Given this, a key guiding principle in the author selection process for the Summary Report from Tribal and Indigenous Communities within California was that the value of traditional knowledge would be honored, recognized, respected, and protected.
9 It is important to note the common inaccuracy of data concerning the number of tribes in California. Federal and state sources for the number of tribes
within California differ. In this report the authors were inclusive, which presents a slightly larger number than these illustrative sources: http://www.ncsl.org/
research/state-tribal-institute/list-of-federal-and-state-recognized-tribes.aspx#ca ; http://www.courts.ca.gov/3066.htm ; https://www.federalregister.gov/
documents/2016/01/29/2016-01769/indian-entities-recognized-and-eligible-to-receive-services-from-the-united-states-bureau-of-indian
10 Only Federally Recognized Tribes are legally allowed to have Casinos. Likewise, the majority of Tribal casinos in California provide only sufficient revenue to
support tribal governmental functions.
Fourth Climate Change Assessment Statewide Summary Report | 45
CALIFORNIA’S FOURTH
CLIMATE CHANGE ASSESSMENT
Before outlining key findings from the report, it is important to set a brief context for how historic events continue to perpetuate contemporary conditions, which are exacerbated by climate impacts. Prior to European contact, tribes were the land managers of North America. Tribes used a wide array of techniques to maintain an environment capable of supporting large, thriving human populations. These practices varied from tribe to tribe, but generally focused on ecosystem interconnectivity, respecting the carrying capacity of land, and viewing humans as an integral part of the environment. Much of that interconnectedness has been lost, and few tribal members are able to engage in their cultural traditions as a livelihood today. Nonetheless, these practices and their basis in Traditional Ecological Knowledge (TEK) are re-emerging as foundations of, compliments to, and accelerators of modern techniques to combat climate change. Traditional Ecological Knowledge is unique to each tribe and underpins many tribes’ environmental management and community and economic development approaches.11
Both tribal and non-tribal communities across the state are currently facing, and will continue to face, impacts from a changing climate. However, compounding social, economic, and political conditions exacerbate the severity of the impacts experienced by tribal communities. For example, the public health risks due to extreme heat are exacerbated for tribal communities because of a lack of infrastructure and public facilities (e.g., cooling centers), limited economic means to cover increased energy prices, and, for rural communities, limited access to medical facilities in the event of heat-related illness. Many tribal communities rely on local water sources (ground and surface), so an increase in drought frequency and severity will impact both water availability and quality (Summary Report from Tribal and Indigenous Communities within California, 2018). Increased drought will also affect local ecology, with the potential to make traditional plant and animal resources scarce. Increased wildfire is a particular risk to rural and isolated tribal communities and can damage or destroy cultural sites, as well as traditional gathering areas. Tribes may also lack the ability to relocate because of legal or cultural constraints and considerations. Tribal lands are fixed at a certain location, so tribes are essentially locked into Rancherias, allotments, or other types of fixed geographic locations and land status. Where these tribal lands are subject to climate impacts that could make land uninhabitable, tribes could be forced to relocate as a last resort after efforts are made to adapt. In all cases relocation to new tribal lands – often federal trust land – is administratively difficult, prohibitively expensive, takes years or decades to accomplish, and is fraught with cultural, social, and economic upheaval.
Climate change also affects cultural resources, which can include environments, conditions, practices, places, plants, and animals that are of significance in a particular tribe’s culture. Climate change impacts affect cultural resources across all tribal lands. For example, South Coast tribes are threatened by a loss of gathering areas, traditional plants used for food, medicine, and basketry, and a loss of a sense of continuity with connection to the land. Tribal gatherers in central California have had to travel north to the Hoopa Reservation, Lake Tahoe, or south to Tehachapi to gather enough Black Oak acorns for their cultural events.
11 The Summary Report from Tribal and Indigenous Communities within California provides additional insight into the importance of maintaining Traditional
Ecological Knowledge, not just for environmental and ecological adaptation, but also how these practices are closely linked to climate resilience across tribal
cultural health, identify, and continuity.

Fourth Climate Change Assessment Statewide Summary Report | 46
CALIFORNIA’S FOURTH
CLIMATE CHANGE ASSESSMENT
Where resources remain, the ability to achieve stewardship necessary to maintain the resources is limited. For instance, decades of wildfire suppression have exacerbated the risk of wildfire across the landscape, and many tribes have felt this quite specifically. Prescribed fire has long been a tribal practice for managing the land. Current constraints that limit setting prescribed fires (e.g., air quality regulations and conflicts with metropolitan areas) disrupt this traditional practice and increase the risk of wildfire in tribal areas. While climate change’s historic scale and rate of change are not foreign to tribes, the ability to actively engage in stewardship to buffer against the impacts of climate change is largely beyond tribal control, as the ability to steward at a landscape scale does not exist under the purview of tribal planning and action.
Further compounding climate impacts are historic gaps in energy, water, and transportation infrastructure within tribal communities; there are large tribal areas in California that have never had an electrical grid, natural gas, internet, or other basic utility services. For example, many rural tribal communities only have one-way road access, limiting emergency response and preparedness efforts in response to extreme events.
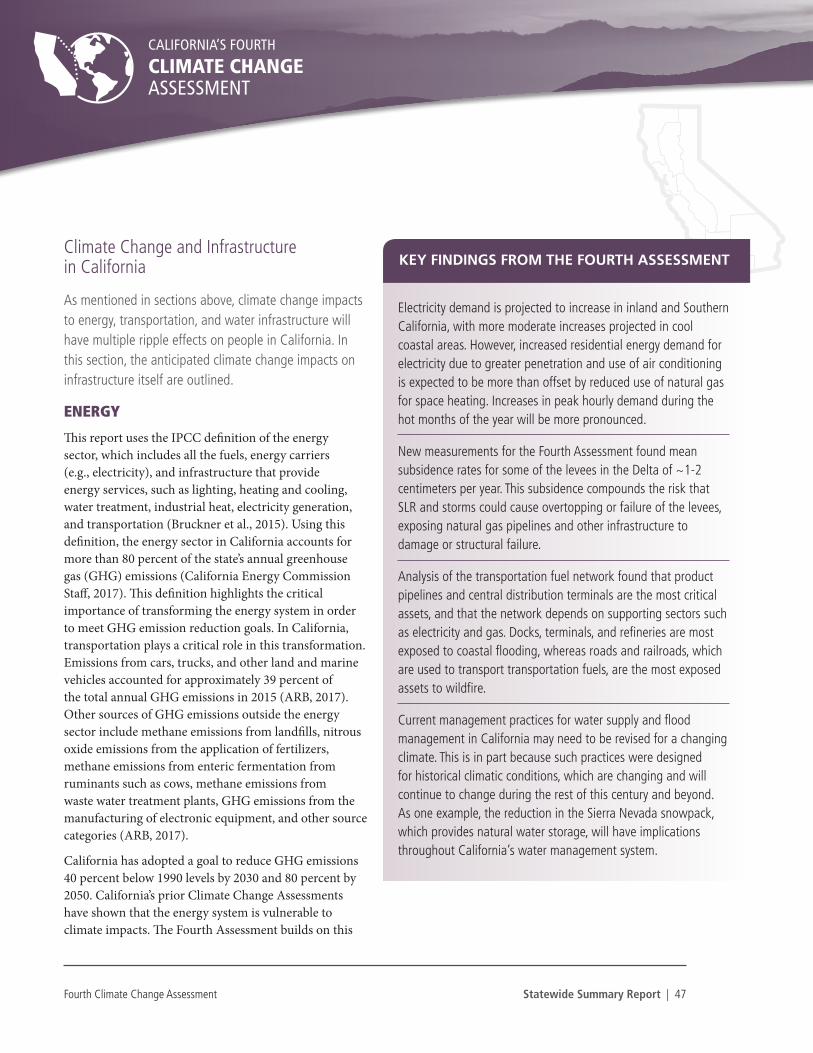
Fourth Climate Change Assessment Statewide Summary Report | 47
CALIFORNIA’S FOURTH
CLIMATE CHANGE ASSESSMENT
Electricity demand is projected to increase in inland and Southern California, with more moderate increases projected in cool coastal areas. However, increased residential energy demand for electricity due to greater penetration and use of air conditioning is expected to be more than offset by reduced use of natural gas for space heating. Increases in peak hourly demand during the hot months of the year will be more pronounced.
New measurements for the Fourth Assessment found mean subsidence rates for some of the levees in the Delta of ~1-2 centimeters per year. This subsidence compounds the risk that SLR and storms could cause overtopping or failure of the levees, exposing natural gas pipelines and other infrastructure to damage or structural failure.
Analysis of the transportation fuel network found that product pipelines and central distribution terminals are the most critical assets, and that the network depends on supporting sectors such as electricity and gas. Docks, terminals, and refineries are most exposed to coastal flooding, whereas roads and railroads, which are used to transport transportation fuels, are the most exposed assets to wildfire.
Current management practices for water supply and flood management in California may need to be revised for a changing climate. This is in part because such practices were designed for historical climatic conditions, which are changing and will continue to change during the rest of this century and beyond. As one example, the reduction in the Sierra Nevada snowpack, which provides natural water storage, will have implications throughout California’s water management system.
KEY FINDINGS FROM THE FOURTH ASSESSMENTClimate Change and Infrastructure in California
As mentioned in sections above, climate change impacts to energy, transportation, and water infrastructure will have multiple ripple effects on people in California. In this section, the anticipated climate change impacts on infrastructure itself are outlined.
ENERGY
This report uses the IPCC definition of the energy sector, which includes all the fuels, energy carriers (e.g., electricity), and infrastructure that provide energy services, such as lighting, heating and cooling, water treatment, industrial heat, electricity generation, and transportation (Bruckner et al., 2015). Using this definition, the energy sector in California accounts for more than 80 percent of the state’s annual greenhouse gas (GHG) emissions (California Energy Commission Staff, 2017). This definition highlights the critical importance of transforming the energy system in order to meet GHG emission reduction goals. In California, transportation plays a critical role in this transformation. Emissions from cars, trucks, and other land and marine vehicles accounted for approximately 39 percent of the total annual GHG emissions in 2015 (ARB, 2017). Other sources of GHG emissions outside the energy sector include methane emissions from landfills, nitrous oxide emissions from the application of fertilizers, methane emissions from enteric fermentation from ruminants such as cows, methane emissions from waste water treatment plants, GHG emissions from the manufacturing of electronic equipment, and other source categories (ARB, 2017).
California has adopted a goal to reduce GHG emissions 40 percent below 1990 levels by 2030 and 80 percent by 2050. California’s prior Climate Change Assessments have shown that the energy system is vulnerable to climate impacts. The Fourth Assessment builds on this
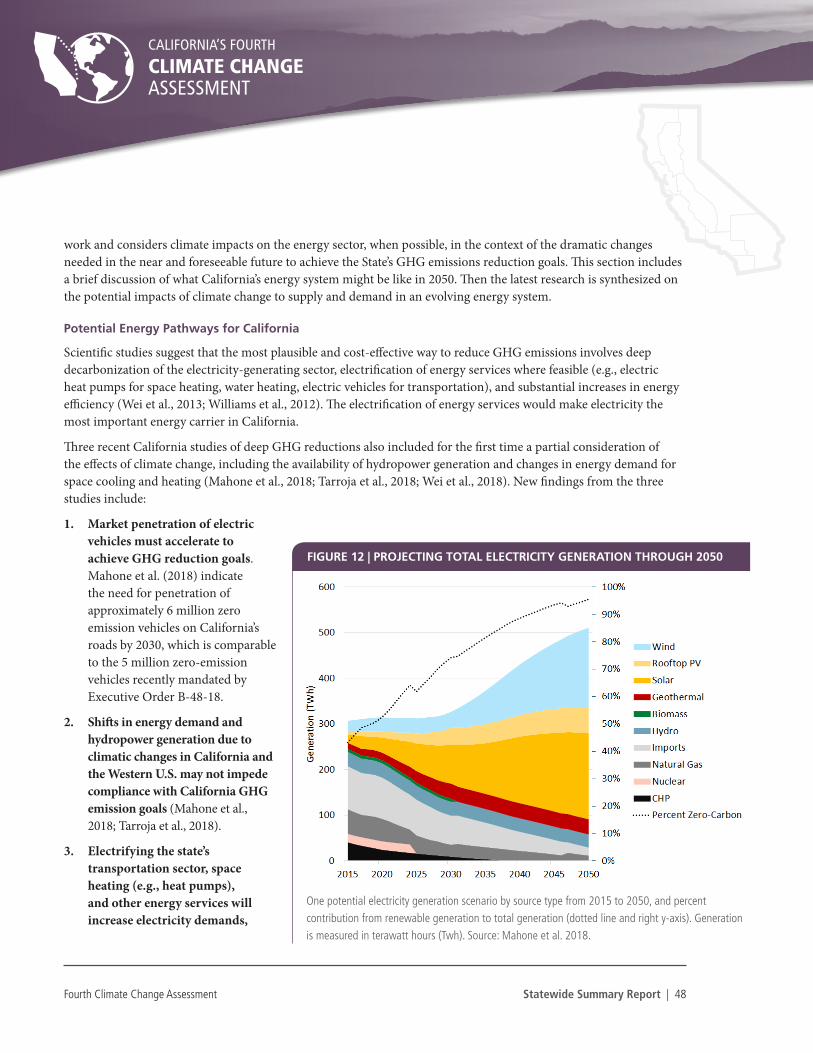
Fourth Climate Change Assessment Statewide Summary Report | 48
CALIFORNIA’S FOURTH
CLIMATE CHANGE ASSESSMENT
work and considers climate impacts on the energy sector, when possible, in the context of the dramatic changes needed in the near and foreseeable future to achieve the State’s GHG emissions reduction goals. This section includes a brief discussion of what California’s energy system might be like in 2050. Then the latest research is synthesized on the potential impacts of climate change to supply and demand in an evolving energy system.
Potential Energy Pathways for California
Scientific studies suggest that the most plausible and cost-effective way to reduce GHG emissions involves deep decarbonization of the electricity-generating sector, electrification of energy services where feasible (e.g., electric heat pumps for space heating, water heating, electric vehicles for transportation), and substantial increases in energy efficiency (Wei et al., 2013; Williams et al., 2012). The electrification of energy services would make electricity the most important energy carrier in California.
Three recent California studies of deep GHG reductions also included for the first time a partial consideration of the effects of climate change, including the availability of hydropower generation and changes in energy demand for space cooling and heating (Mahone et al., 2018; Tarroja et al., 2018; Wei et al., 2018). New findings from the three studies include:
1. Market penetration of electric vehicles must accelerate to achieve GHG reduction goals. Mahone et al. (2018) indicate the need for penetration of approximately 6 million zero emission vehicles on California’s roads by 2030, which is comparable to the 5 million zero-emission vehicles recently mandated by Executive Order B-48-18.
2. Shifts in energy demand and hydropower generation due to climatic changes in California and the Western U.S. may not impede compliance with California GHG emission goals (Mahone et al., 2018; Tarroja et al., 2018).
3. Electrifying the state’s transportation sector, space heating (e.g., heat pumps), and other energy services will increase electricity demands,
One potential electricity generation scenario by source type from 2015 to 2050, and percent contribution from renewable generation to total generation (dotted line and right y-axis). Generation is measured in terawatt hours (Twh). Source: Mahone et al. 2018.
FIGURE 12 | PROJECTING TOTAL ELECTRICITY GENERATION THROUGH 2050

Fourth Climate Change Assessment Statewide Summary Report | 49
CALIFORNIA’S FOURTH
CLIMATE CHANGE ASSESSMENT
even with unprecedented increases in energy efficiency (Mahone et al., 2018; Tarroja et al., 2018). A second peak in electricity demand may appear in the winter season driven by the demand for electric space heating (Wei et al., 2013).
A caveat is that these three studies did not consider extreme weather events (including extended droughts) and other climate-related impacts to the energy system, such as reduced efficiency of thermal power plants with hotter temperatures.
Climate Change Impacts to the Energy System in California
Changing climate conditions will affect the energy system in several ways: by changing energy demand, changing performance of the energy delivery system, and by direct risks to infrastructure.
IMPACTS TO ENERGY DEMAND
Climate change is already affecting energy demand for space heating. This demand is roughly proportional to heating degree days (HDD), which is a measure of the duration and extent that outdoor temperatures are below 65°F. The long-term record, from 1970 to the present, suggests a decline of HDD of about 20 percent in California (NOAA NCDC). Demand for natural gas in the residential sector and HDD declined substantially from 2000 to 2015, even as the economy grew by about 40 percent in real terms (CA Department of Finance) (Figure 13).
The geographic distribution of potential changes in energy demand is also important for energy planning and for detailed studies about the vulnerability of the energy system to climate change. Auffhammer (2018) estimated spatial changes in annual residential electricity and natural gas demand at the five-digit ZIP code level. This Fourth Assessment study found more pronounced increases in electricity demand in inland and Southern California, and more moderate increases in cool coastal areas (Figure 14). This study also found that increased residential energy demand for electricity due to greater penetration and use of air conditioning is expected to be more than offset by reduced use of natural gas for space heating. This measure of net energy in homes is site energy, which does not take into account the energy required to generate electricity and to transport the electricity to homes. In addition, with the electrification of space heating with heat pumps and other technologies, total electricity demand in homes would increase.
Regardless of whether annual average household energy demand increases under changing climate conditions, the projected increases in peak electricity demand in the hot months of the year have important implications for the
FIGURE 13 | TRENDING STATEWIDE NATURAL GAS DEMAND AND HEATING DEGREE DAYS
Recent trends of statewide natural gas demand for the residential sector (blue line) and Heating Degree Days (HDDs, red line). The lines show an overall decline in HDDs and natural gas consumption for the residential sector. Data Source: ARB Fuel Combustion Data; NOAA HDD Data.
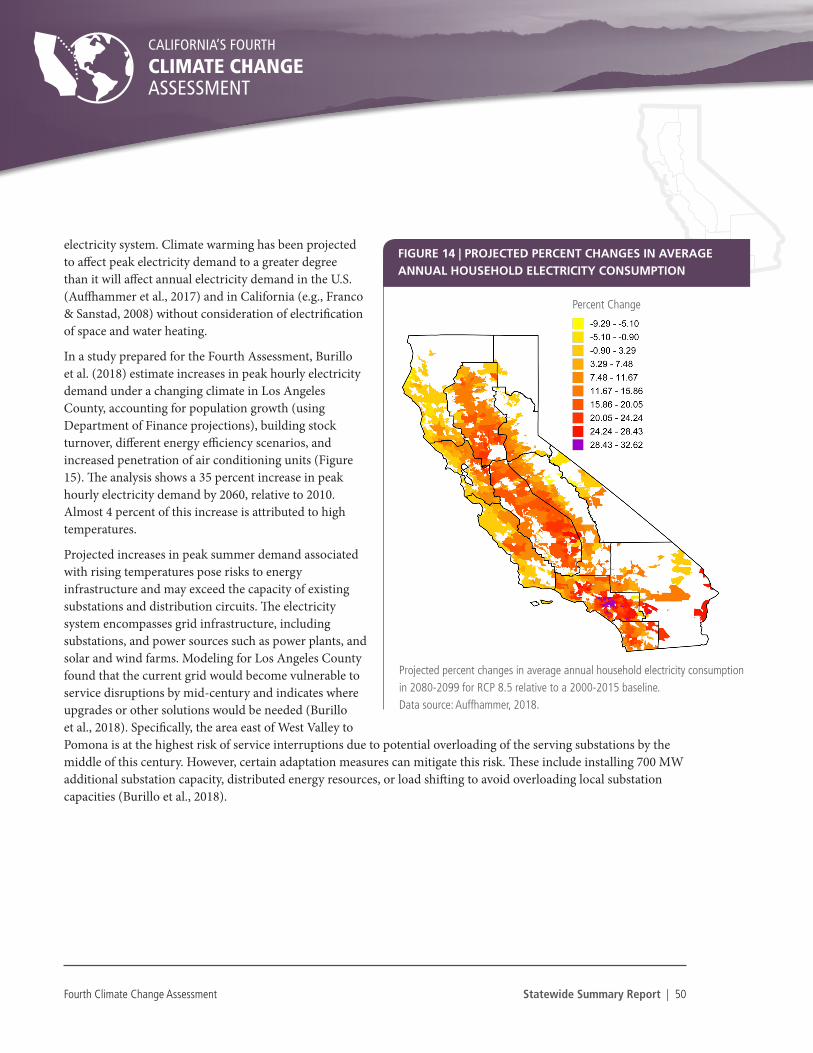
Fourth Climate Change Assessment Statewide Summary Report | 50
CALIFORNIA’S FOURTH
CLIMATE CHANGE ASSESSMENT
electricity system. Climate warming has been projected to affect peak electricity demand to a greater degree than it will affect annual electricity demand in the U.S. (Auffhammer et al., 2017) and in California (e.g., Franco & Sanstad, 2008) without consideration of electrification of space and water heating.
In a study prepared for the Fourth Assessment, Burillo et al. (2018) estimate increases in peak hourly electricity demand under a changing climate in Los Angeles County, accounting for population growth (using Department of Finance projections), building stock turnover, different energy efficiency scenarios, and increased penetration of air conditioning units (Figure 15). The analysis shows a 35 percent increase in peak hourly electricity demand by 2060, relative to 2010. Almost 4 percent of this increase is attributed to high temperatures.
Projected increases in peak summer demand associated with rising temperatures pose risks to energy infrastructure and may exceed the capacity of existing substations and distribution circuits. The electricity system encompasses grid infrastructure, including substations, and power sources such as power plants, and solar and wind farms. Modeling for Los Angeles County found that the current grid would become vulnerable to service disruptions by mid-century and indicates where upgrades or other solutions would be needed (Burillo et al., 2018). Specifically, the area east of West Valley to Pomona is at the highest risk of service interruptions due to potential overloading of the serving substations by the middle of this century. However, certain adaptation measures can mitigate this risk. These include installing 700 MW additional substation capacity, distributed energy resources, or load shifting to avoid overloading local substation capacities (Burillo et al., 2018).
FIGURE 14 | PROJECTED PERCENT CHANGES IN AVERAGE ANNUAL HOUSEHOLD ELECTRICITY CONSUMPTION
Projected percent changes in average annual household electricity consumption in 2080-2099 for RCP 8.5 relative to a 2000-2015 baseline. Data source: Auffhammer, 2018.
Percent Change
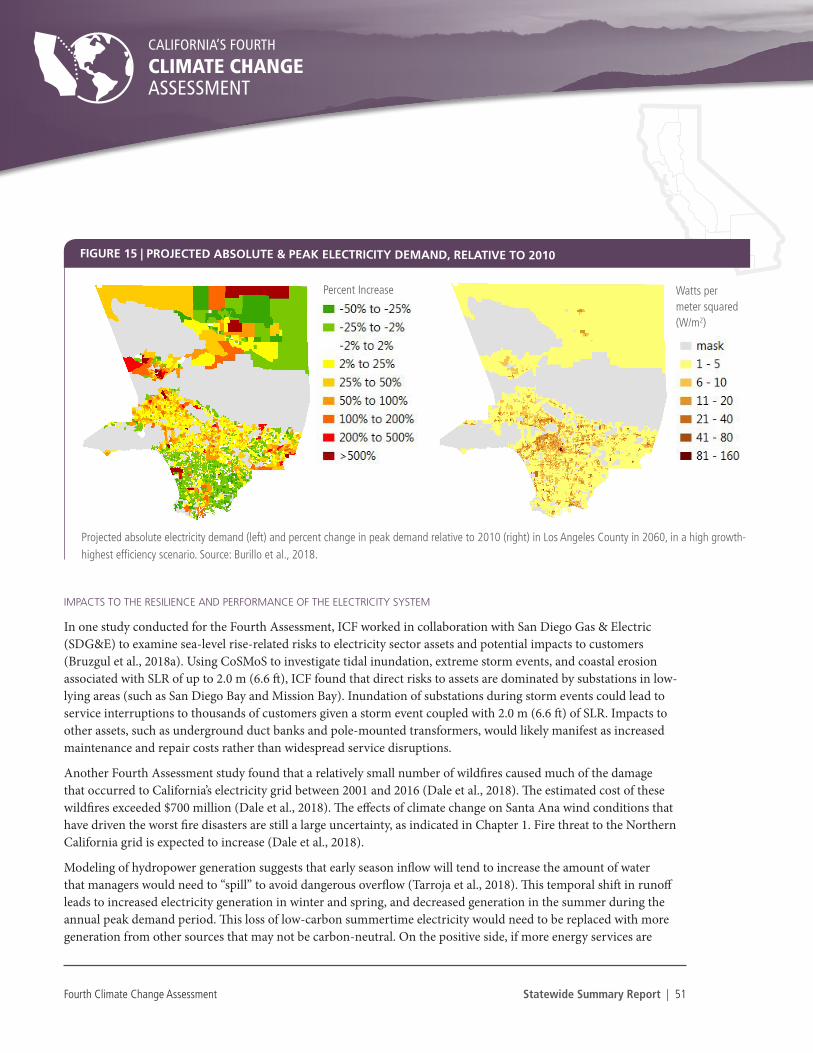
Fourth Climate Change Assessment Statewide Summary Report | 51
CALIFORNIA’S FOURTH
CLIMATE CHANGE ASSESSMENT
IMPACTS TO THE RESILIENCE AND PERFORMANCE OF THE ELECTRICITY SYSTEM
In one study conducted for the Fourth Assessment, ICF worked in collaboration with San Diego Gas & Electric (SDG&E) to examine sea-level rise-related risks to electricity sector assets and potential impacts to customers (Bruzgul et al., 2018a). Using CoSMoS to investigate tidal inundation, extreme storm events, and coastal erosion associated with SLR of up to 2.0 m (6.6 ft), ICF found that direct risks to assets are dominated by substations in low-lying areas (such as San Diego Bay and Mission Bay). Inundation of substations during storm events could lead to service interruptions to thousands of customers given a storm event coupled with 2.0 m (6.6 ft) of SLR. Impacts to other assets, such as underground duct banks and pole-mounted transformers, would likely manifest as increased maintenance and repair costs rather than widespread service disruptions.
Another Fourth Assessment study found that a relatively small number of wildfires caused much of the damage that occurred to California’s electricity grid between 2001 and 2016 (Dale et al., 2018). The estimated cost of these wildfires exceeded $700 million (Dale et al., 2018). The effects of climate change on Santa Ana wind conditions that have driven the worst fire disasters are still a large uncertainty, as indicated in Chapter 1. Fire threat to the Northern California grid is expected to increase (Dale et al., 2018).
Modeling of hydropower generation suggests that early season inflow will tend to increase the amount of water that managers would need to “spill” to avoid dangerous overflow (Tarroja et al., 2018). This temporal shift in runoff leads to increased electricity generation in winter and spring, and decreased generation in the summer during the annual peak demand period. This loss of low-carbon summertime electricity would need to be replaced with more generation from other sources that may not be carbon-neutral. On the positive side, if more energy services are
FIGURE 15 | PROJECTED ABSOLUTE & PEAK ELECTRICITY DEMAND, RELATIVE TO 2010
Projected absolute electricity demand (left) and percent change in peak demand relative to 2010 (right) in Los Angeles County in 2060, in a high growth-highest efficiency scenario. Source: Burillo et al., 2018.
Watts per meter squared (W/m2)
Percent Increase

Fourth Climate Change Assessment Statewide Summary Report | 52
CALIFORNIA’S FOURTH
CLIMATE CHANGE ASSESSMENT
electrified, such as space heating in winter as described above, the generation of additional hydropower could help meet that increase in the winter seasonal load. Solar generation would also be at its annual minimum in the winter; the added hydropower could complement the annual cycle of solar energy availability. Impacts on hydropower systems could also affect the amount of spinning reserve power available to be dispatched to the grid on short notice. This potential loss would also need to be made up through other energy resources (Tarroja et al., 2018), which could include flexible non-generating resources such as energy storage or smart-charging electric vehicles.
The impacts of climate change on other renewable electricity sources are less clear. Downscaled data from the average of nine GCMs project a relatively small change in solar radiation due to decreases in summer being offset by increases in fall, winter, and spring (Pierce et al., 2018). Solar capacity could also be constrained by the availability of cooling water under climate change in the best resource areas (Tarroja et al., 2018). Wind energy is highly variable, which makes it difficult to forecast, and the effects of climate change on wind magnitude and operating conditions are uncertain. One new study, using a single GCM, projects increased summertime wind power production followed by a decrease in fall and winter power production from near-term climate change at major wind energy facilities across California (Wang et al., 2018), but the results must be validated.
IMPACTS TO PERFORMANCE AND RESILIENCE OF THE NATURAL GAS SYSTEM
Many natural gas facilities such as underground natural gas storage units and pipelines are concentrated under islands in the Sacramento‐San Joaquin Delta. Previous research with airborne laser scanning measured the subsidence of the levees, and new measurements for the Fourth Assessment found mean subsidence rates of ~1-2 centimeters per year (~0.4 to 0.8 inches per year) (Brooks et al., 2018). This subsidence compounds the risk that SLR and storms could cause overtopping or failure of the levees, exposing natural gas pipelines and other infrastructure to damage or structural failure (Radke et al., 2016). Buried infrastructure can also be exposed to humid conditions due to flooding or an increase of the elevation of the water table due to sea-level rise (Hummel et al., 2018). The combination of subsidence, SLR, and a 100-year flood event could lead to levees failing to meet the federal levee height standard by 2060 or 2080, depending on the rate of sea-level rise (Brooks et al., 2018).
ICF and SDG&E conducted a multi-hazard risk assessment of the natural gas system in SDG&E territory to coastal and inland flooding, wildfire, and extreme heat (Bruzgul et al., 2018b). The study shows that the natural gas system in SDG&E territory is generally not very vulnerable to these risks. Findings from the study include:
• Despite low exposure and sensitivity to wildfire, impacts from costs and staff time associated with restoration of service connections after fire events could be substantial.
• Extreme heat could result in accelerated wear and tear on, and increased cooling costs for, compressor equipment.
• The transmission line running from Los Angeles to San Diego is a major pipeline asset that is potentially exposed to projected coastal hazards and could experience disruption. This pipeline is important because it serves coastal beach communities along about half of the San Diego coastline. However, this line was seen to have low sensitiv-ity overall because it is backfed (i.e., supplied from both northern and southern ends), which would limit service disruptions.
• Cathodic protection is the prevailing approach to minimizing pipelines’ corrosion risks in coastal areas at risk to

Fourth Climate Change Assessment Statewide Summary Report | 53
CALIFORNIA’S FOURTH
CLIMATE CHANGE ASSESSMENT
inundation and saltwater intrusion. However, these protections require regular inspection and maintenance (So-CalGas, 2016), and the potential for the effectiveness of this protection to diminish due to weather-related factors has been raised in public filings (CPUC, 2016).
California’s Transportation Fuel Sector
The Fourth Assessment undertook the first attempt to consider weather-related risks posed to California’s transportation fuel system (TFS) as a physically connected, multi-sector network (Radke et al., 2018). Because the vast majority of fuels currently used in the transportation sector originate from crude oil, this section only addresses the petroleum sector (e.g., refineries, terminals, pipelines for crude oil and refined products, gas stations). Specifically, Radke et al. (2018) explore wildfire- and flooding-related risks and uncertainties, and how these may intensify under a changing climate. This study found that product pipelines and central distribution terminals are the most critical assets within the TFS network, and that the network depends on supporting sectors such as electricity and gas. Docks, terminals, and refineries are the TFS assets most exposed to coastal flooding, whereas roads and railroads, which are used to transport transportation fuels, are the most exposed assets to wildfire.
TRANSPORTATION INFRASTRUCTURE
Many of California’s roads, railroads, pipelines, waterways, ports, and airports are integral to the U.S. economy and will be significantly affected by climate change. Disruption in one part of the system can create downstream ‘ripple effects’, including both direct and indirect economic impacts of inter-connected, inter-dependent, infrastructure systems. For example in 2005, damage to oil and gas production and delivery by Hurricanes Katrina and Rita impacted natural gas, oil, and electricity systems in the rest of the United States (Building a Resilient Energy Gulf Coast, 2010; Wilbanks et al., 2014), impacting markets as far as New York and New England (Rosenzweig & Solecki, 2013). California is a key supplier of goods and services to the rest of the United States; a disruption in California’s transport system has the potential to cause disastrous consequences for the rest of the country.
Increased Average and Extreme Temperatures
The increased average and extreme temperatures projected for California (see Chapter 1) will affect paved roads and rail tracks. Higher temperatures increase the probability of track buckling, requiring implementation of procedures that reduce speeds, adding delays with associated costs. Projected temperature increases are estimated to add approximately 3-9 percent to the cost of road construction and maintenance over a 30-year period (Underwood et al., 2017). Without successful adaptation of roadway materials (i.e., asphalt and pavement), researchers estimate that the median total cost to California for 2040-2070 will be between ~$1 billion for RCP 4.5 to ~$1.25 billion for RCP 8.5. Nationally, the cumulative projected cost of climate change impacts on the rail system (2016–2099) is estimated to range from an increase over historical costs of $25 to $45 billion under the RCP 4.5 scenario to $35 to $60 billion for RCP 8.5 scenario. These costs only take into account delay-minute costs associated with the physical deformation of the rails with higher temperature, which requires reduced traffic or temporary lack of service. However, the deployment and use of temperature sensors could be used to optimize traffic and reduce time delays, substantially reducing economic impacts (Chinowsky et al., 2017).

Fourth Climate Change Assessment Statewide Summary Report | 54
CALIFORNIA’S FOURTH
CLIMATE CHANGE ASSESSMENT
Flooding
Sea-level rise, intense coastal storm events, increased precipitation events, coastal land subsidence, and extreme heat threaten coastal transportation infrastructure (Radke et al., 2016; Schweikert et al., 2014). California’s transportation system is highly vulnerable to flooding of roads, railways, and airport runways in coastal areas through the combined effect of sea‐level rise and storm surges (National Research Council Transportation Research Board, 2008). Modeling of SLR coupled with a hundred-year storm event in 2100 in the San Francisco Bay area shows minimal temporary roadway inundation, but significant effects on critical nodes (connectors) in the regional road network, increasing the potential for major disruptions in regional commute patterns (Biging et al., 2012).
Recent modeling of flood events indicates that ~225 km (~140 miles) of highways are susceptible to flooding in a 100 year storm event by 2020, and ~595 km (~370 miles) by the year 2100 (Radke et al., 2018). The amount of temporary road inundation is estimated to be approximately 2,460 km (1,540 miles) in the 2020-2040 simulation window, and 6,085 km in 2080-2100, but Radke et al. (2018) show that the impacts of this flooding remain localized and will not increase the probability of failures for regional accessibility.
California’s rail system is a critical element of the state’s economy. Railway operations are disrupted if only 10 cm (~4 inches) of flooding occurs. However, these disruptions are typically short lived, as rails can be quickly repaired or replaced (Radke et al., 2018). An estimated ~184 km (~115 miles) of rail is projected to be exposed to coastal flooding in the period 2020-2040; this number more than doubles to ~483 km (~300 miles) in the 2080-2100 period (Radke et al., 2018).
Seaports are often in the most vulnerable areas to climate change-driven flooding impacts (Becker et al., 2012). Major seaports in California have already experienced minor impacts of SLR and storm surge. This trend will continue to increase to the end of the century (Table 7) with risk increasing greatly by 2080. Although the dock infrastructure may not be completely submerged, the bumpers and docking infrastructure required to successfully dock a boat will be compromised. Importantly, Andeavor Long Beach Terminal 1/Berth 121, a marine terminal that offloads crude from marine tankers and supplies 80 percent (~500,000 barrels / day) of Southern California’s crude oil, is impacted by 2080 (Figure 16; Radke et al., 2018).
The terminals of the Port of Los Angeles are well above current mean sea-levels. A recent study concluded that no major upgrades are necessary at this point, but that the situation must be reassessed every time a major upgrade of this port takes place. Implementing adaptation measures in coordination with major facility upgrades would lower costs substantially and, in addition, new scientific information could inform the design of specific adaptation measures (Sriver et al., 2018).
There are approximately 200 commercial airport facilities in the state (Caltrans, 2016); the major effects of anthropogenic climate change on California’s biggest airports will be mainly due to flooding. Modeling of
PORT 2000-2020 2080-2100
San Francisco 0.84 km2 (0.33 mi2) 2.28 km2 (0.89)
Oakland 0.09 km2 (0.04) 3.66 km2 (1.43)
Los Angeles 0.4 km2 (0.16) 2.64 km2 (1.03)
Long Beach 2.39 km2 (0.93) 4.94 km2 (1.95)
Area of major coastal seaports potentially flooded due to SLR and coastal storms. Numbers in parenthesis are square miles. Results of modeling indicate that there is a substantial increase in areas flooded. Source: Radke et al., 2018.
TABLE 7 | PORTS POTENTIALLY FLOODED FROM SEA-LEVEL RISE & COASTAL STORMS

Fourth Climate Change Assessment Statewide Summary Report | 55
CALIFORNIA’S FOURTH
CLIMATE CHANGE ASSESSMENT
SLR at the thirteen busiest airports suggests that Oakland (OAK) and San Francisco (SFO) have already, or will shortly begin to, experience flooding from SLR and storm surge projected for the 2000-2020 time period (Radke et al., 2018). The Santa Barbara (SBA) airport begins to flood in the 2020-2040 period, and San Diego (SAN) begins to flood by 2060-2080 (Radke et al., 2018).
Wildfire
Wildfire may be the biggest immediate threat to California’s transportation system, as vegetation fuel accumulation continues to increase (Calkin et al., 2015). Wildfires can also have cascading impacts to transportation infrastructure through sequential extreme events; for instance, mudslides following the 2018 Thomas wildfire in southern California resulted in the closure of Highway 101, a major north-south corridor for the state. Unlike flooding, where high-risk conditions are found in low-lying regions or near the coast, wildfire threat is ubiquitous throughout the state. Many transportation system assets exist in high-risk areas, and although there is an excellent record of response and repair, long term chronic disturbances due to climate change are only now being discussed (Radke et al., 2018).
By intersecting all transportation infrastructure with wildfire perimeters from 1990-2017 and reporting lengths/counts, the study by Radke et al. (2018) finds that a considerable amount of infrastructure is exposed to wildfire risk, with the highest risk being to roads and highways (Table 8). Transportation infrastructure can be both directly and indirectly affected when exposed to wildfire. Rails may warp due to thermal expansion from direct wildfire exposure. Smoke and fire-fighting operations can lead to temporary service disruptions that can affect movement of goods and services (Finlay et al., 2012; Radke et al., 2018).
Mapping and measuring regional wildfire risk for transportation due to climate change is critical in long term strategic planning. Using averaged annualized mean estimated values for area burned by wildfire (Westerling, 2018), Radke et al. (2018) developed a Modeled Wildfire Threat Rating system to analyze spatio-temporal trends in areas burned by wildfire. Roadways have the greatest exposure, with trends that continue to increase to the end of the
Flooding projections for Andeavor Long Beach Terminal 1/Berth 121, which offloads crude from marine tankers and supplies 80% (~500,000 barrels / day) of Southern California’s crude. This figure demonstrates the maximum, median, and minimum estimates of the highest predicted SLR and storm event of different scenarios (between years 2020-2040 and 2080-2100). Source: Radke et al., 2018.
FIGURE 16 | ANDEAVOR LONG BEACH TERMINAL FLOODING PROJECTIONS

Fourth Climate Change Assessment Statewide Summary Report | 56
CALIFORNIA’S FOURTH
CLIMATE CHANGE ASSESSMENT
century. Railways have approximately half the exposure of roads but also have an increasing exposure trend.
WATER INFRASTRUCTURE
Water is central to California’s people, economy, and natural systems, all of which rely on, and are part of, a complex network to store and distribute water throughout the state. Available science indicates that there is a significant potential for frequent and severe water availability and water quality problems resulting from a combination of increased volatility in precipitation, continued reductions in snowpack, unsustainable use of groundwater, a tendency toward decreased soil moisture, and higher overall in-stream temperatures (see Chapter 1). California’s unique hydrology and statewide water infrastructure amplify the complexity of managing water resources in the face of changing climatic conditions. This section focuses on findings from Fourth Assessment technical reports along with other relevant literature to provide insight on the challenges, advances, and future research needs related to water management in California.12
Fluctuations in precipitation are a fundamental feature of California’s climate (see Chapter 1), and reliance on snowpack and groundwater are critical parts of California water resources. During a typical year, approximately 40 percent of the state’s total water supply comes from groundwater. During dry years, this increases to more than half of the state’s total supply, with groundwater thus serving as a critical buffer against the impacts of drought. One of the challenges for California’s water supply is a spatial and temporal mismatch of supply and demand. Whereas most of the precipitation falls in the northern part of the State (Figure 5) in the winter, water demand is concentrated in major urban centers and the agricultural areas in central and southern California, particularly during the summer and early fall. In order to support growth and a vibrant economy, California has developed an extensive network of water conveyance facilities—both natural and built—to store and deliver water to agricultural and urban areas. The Sacramento-San Joaquin Delta (Delta) serves as the hub of California’s water operations, providing water to millions of people and thousands of acres of farmland, as well as providing habitat for abundant wildlife including migratory and resident fish species.
Much of California’s water conveyance infrastructure was developed with a heavy reliance on snowpack for seasonal water storage. The recent 2012-2016 drought provides a strong example of how recent episodes of unusually warm
Transportation asset exposure to wildfires from 1990-2017. Note: Wildfire Exposure is the summed intersects of transportation infrastructure maps with maps of historical fire perimeters (1990-2017 from FRAP and GEOMAC). The numbers in parentheses show values in miles. Source: Radke et al., 2018.
TRANSPORTATION
ASSET
WILDFIRE
EXPOSURE
STATE TOTAL % EXPOSED
RAILWAYS ~ 336 KM
(210 MILES)
~12,005 KM
(7,503 MILES)
~3%
HIGHWAYS ~1,753 KM
(1,996 MILES)
~37,249 KM
(23,280 MILES)
~5%
STREETS ~42,278 KM
(26,423 MILES)
~550,702KM
(334,189 MILES)
~8%
AIRPORTS (COUNT) 1 213 ~0.5%
BRIDGES (COUNT) 730 24,677 ~3%
PORTS (COUNT) 0 213 ~0%
TABLE 8 | TRANSPORTATION ASSET EXPOSURE TO WILDFIRES (1990-2017)
12 Local and regional approaches are discussed in the nine companion Regional Reports (climateassessment.ca.gov).

Fourth Climate Change Assessment Statewide Summary Report | 57
CALIFORNIA’S FOURTH
CLIMATE CHANGE ASSESSMENT
temperatures and low snowpack can diminish water availability to California’s water system, which supports the large and growing population of the state—whose water needs have increased nearly 80 percent since the severe drought of 1976-77—and also supports agricultural production, energy generation, ecosystem health, and the economy (OEHHA, 2018; Mann & Gleick, 2015). As mentioned earlier, climate projections suggest snowpack will decrease with air temperature warming, regardless of whether precipitation increases or decreases (Thorne et al., 2015).
The ability of California’s water infrastructure to withstand and rebound from climate change is compromised by its advanced age, deferred maintenance, funding constraints, and ongoing technological changes (Vahedifard et al., 2017). In the Delta, over 1,000 miles of levees are vulnerable to collapse from earthquakes, rising sea-levels, and potentially increasingly severe storms. Two Fourth Assessment reports examine what can be expected for water infrastructure. These studies find that across the state, a decline in performance of storage and conveyance systems is expected, including a decline in reservoir carryover storage (amount of water available in the reservoirs before the start of the wet season in October), reduced Delta water exports, and diminished drought resilience and operational control to meet future downstream river flow temperature requirements (Schwarz et al., 2018; Wang et al., 2018). Figure 17 illustrates the substantial reduction of carryover storage (i.e., the volume of water remaining in a reservoir in the fall) projected for Shasta and Oroville, the largest reservoirs in Northern California. This parameter gives a useful depiction of the resilience of the large-scale systems to drought shortages. Figure 17 shows that, on average in ten climate models under RCP 4.5 and RCP 8.5 scenarios, carryover storage in the largest reservoirs (i.e., Shasta and Oroville) is projected to decline markedly, by roughly one-third over the course of this century. This stored water will not be available to use during dry years.
Two Fourth Assessment reports highlight challenges within the regulatory and administrative system in the state, especially in terms of its flexibility and response time in addressing drought-stressors within the water conveyance system (Green Nylen et al., 2018a, 2018b). Because future California droughts are likely to be more frequent, longer, and more intense, they will pose increasing challenges for water management, raising the stakes for effective drought response (Green Nylen et al., 2018a). Analysis of water rights administration and oversight during the last four major statewide droughts (from 1976 to 2016) suggests there was little proactive preparation in advance of droughts, resulting in heavy reliance on in-drought improvisation. These studies, and the suite of studies prepared for the Fourth Assessment, indicate that current water management practices will need to continue to improve to be resilient to what is expected from a changing climate.
1980 2000 2020 2040 2060 2080 2100October
0
1
2
3
Milli
ons
of A
cre
Feet
Millerton (U San Joaquin)
Oroville (Feather)
Don Pedro (Tuolumne)
Shasta (Sacramento)
New Melones (Stanislaus)
)McClure (Merced
Folsom (American)
CASCaDE2-Modified CALSIM2 October Reservoir Storages
ReservoirLocations
Potential changes of October reservoir storage for major water reservoirs in California. Source: Sierra Nevada Regional Report, 2018.
FIGURE 17 | POTENTIAL CHANGES IN OCTOBER RESERVOIR STORAGE
Fourth Climate Change Assessment Statewide Summary Report | 58
CALIFORNIA’S FOURTH
CLIMATE CHANGE ASSESSMENT
Natural Systems and Working Lands and Waters
California’s natural and working lands are important components of communities, the economy, and the culture of California. California’s natural landscapes include forests, chaparral, deserts, and riparian and wetland habitats; working landscapes include rangelands and agricultural lands. These confer multiple benefits for the state. The state’s forested upper watersheds are a critical component of the state’s water system, interconnected landscapes provide habitat for the state’s rich biodiversity, and working landscapes produce food and support healthy soils to store water and carbon, habitat for migratory species, and pollinator habitats. Healthy, well-managed natural and working lands can also remove and store carbon from the atmosphere and are an important contribution to the state’s efforts to reduce GHG emissions (CNRA, 2017).
Natural and working landscapes also provide important opportunities for natural infrastructure solutions. Publicly-held lands can be managed and protected to provide ongoing ecosystem services such as water delivery, and they can potentially serve as needed solutions to climate change challenges, including potential carbon storage, migration corridors for wildlife, groundwater recharge, and for flood management (Opperman et al., 2017). One Fourth Assessment report estimates the carbon stored in land acquired by the State Coastal Conservancy and shows higher than average carbon storage compared to statewide average. The report also estimates benefits associated with the avoided conversion of this land to agricultural or urban uses (Ackerly et al., 2018).
This section discusses how climate change is affecting California’s natural and working lands and summarizes new research findings from the Fourth Assessment, where applicable, as well as other recent research. Topics covered include agriculture, biodiversity and ecosystems, forest health, and California’s ocean and coast. Water concerns and impacts are woven into each of these sections, as climate change impacts to precipitation and California’s water system significantly affect each of these areas.
An economic optimization modeling study suggests that agriculture can remain economically viable while confronting climate change impacts through adaptive decision-making and technological advancement. However, that viability may be at the expense of agricultural jobs and the dairy sector.
An extensive literature review on fuel treatment in forests concluded that practices that reduce stand density and restore beneficial fire can improve climate resilience, reduce the likelihood of severe wildfires, and minimize the long-term carbon losses from forested areas.
In the last few years, California has experienced unusual events in the ocean and along the coast, including an unprecedented marine heat wave, a record harmful algal bloom, closures of fisheries, and significant loss of northern kelp forests. There is increasing evidence that climate change is transforming and degrading California’s coastal and marine ecosystems due to impacts including sea-level rise, ocean acidification, and ocean warming. Continued climate-driven changes to the ocean and coast will have significant consequences for California’s coastal ecosystems, economy, communities, culture, and heritage.
KEY FINDINGS FROM THE FOURTH ASSESSMENT
Fourth Climate Change Assessment Statewide Summary Report | 59
CALIFORNIA’S FOURTH
CLIMATE CHANGE ASSESSMENT
AGRICULTURE
California produces over half of the nation’s specialty crops, including fruits, vegetables, nuts, flowers, and nursery crops. California agriculture has faced increasing pressure in recent decades, including the conversion of agricultural land for urban development, new regulatory challenges, and the impacts of extreme climate events, including droughts, floods, and warmer temperatures. Under changing climate conditions, agriculture is projected to experience lower crop yields due to extreme heat waves, heat stress and increased water needs of crops and livestock (particularly during dry and warm years), and new and changing pest and disease threats (Hatfield et al., 2015; Pathak et al., 2018). Many of these impacts can be lessened through on-farm management practices and integration of climate change in decision-making, as presented in some Fourth Assessment reports discussed in Chapter 3.
Although it is difficult to narrow down impacts from climate change for all agricultural commodities and regions, it is evident from recent droughts that agricultural production will be challenged by water shortages, higher temperatures, changing atmospheric conditions, and conversion of agricultural land to developed uses (Medellín-Azuara et al., 2018; Wilson et al., 2017). Agriculture is the economic foundation for many of California’s communities, particularly rural communities where other employment opportunities are limited. Roughly 6.7 percent of jobs statewide are generated by farms and farm processing, and in the Central Valley the figure is much higher (22 percent) (UC Agricultural Issues Center, 2012). This means that climate change impacts to agriculture, and even nuanced impacts such as shifting cropping patterns, may create hardships in the rural communities where agriculture is foundational. Different crops have different labor demands (Medellín-Azuara et al., 2016), and shifting crop patterns may result in changes in employment throughout the agricultural sector (Greene, 2018; Villarejo, 1996). A Fourth Assessment study found that in the 2012-2016 drought, to access higher market prices and compensate for the higher cost of water, many farms switched to higher value crops, for which cultivation and harvesting could be largely automated—leaving agricultural workers with employment shortages beyond the drought (Greene, 2018). A report by the University of California found that in 2016, the drought resulted in a $603 million loss to the economy and the loss of 4,700 jobs due to the impacts on agriculture (Medellín-Azuara et al., 2016).
The impacts of climate change on California’s water availability and delivery infrastructure were discussed in the last section; here effects of a changing water system for agriculture are summarized. California has historically experienced multi-year droughts and has been able to support agricultural water demands through groundwater reserves, winter snowpack, reservoir storage, and conveyance of water throughout the state in canals. However, as outlined in Chapter 1, higher temperatures will likely decrease snow storage, which, coupled with increased evapo-transpiration rates and the potential for more frequent and severe droughts, will call for additional preparedness for more frequent surface water shortages and reliance on sustainable groundwater management.
Griffin and Anchukaitis (2014) and Medellín-Azuara et al. (2015) highlight the vulnerability of agriculture to water shortage and over-reliance on groundwater to withstand droughts. Groundwater withdrawals increase the climate vulnerabilities of other social groups and systems, including many in the food and agriculture systems (Christian-Smith et al., 2015). For example, groundwater withdrawals during the 2012-2016 drought impacted the availability and affordability of domestic water for many rural disadvantaged communities who are largely employed in agriculture (Feinstein et al., 2017). Additionally, a Fourth Assessment report found that long-term overdraft makes reliance on groundwater less available as a drought response adaptation measure in the future, meaning actions must be taken to balance water resources and use (Langridge, 2018).

Fourth Climate Change Assessment Statewide Summary Report | 60
CALIFORNIA’S FOURTH
CLIMATE CHANGE ASSESSMENT
Perennial crops, such as fruit and nut trees, are particularly vulnerable to climate change because their decades-long lifespans will cause them to experience the increasing impacts of a changing climate. Fruit and nut trees pose particular difficulties: they are vulnerable to thermal risk due to projected decreases in chilling hours, and they will experience increased water demand and water-induced stress (Pathak et al., 2018). Limited information is available on potential yield changes of perennial crops under changing climate conditions. One recent study examining the thermal niche of almonds under climate change found that by the middle of this century, almond growth and development patterns in the Central Valley would experience about a two-week delay in chill accumulation, and from about a one to two and a half week advance in the timing of bloom and harvest (Parker & Abatzoglou, 2018). However, most of the Central Valley would continue to be viable for almond cultivation at least until the middle of this century. Almonds are an important case study, as California provides nearly 100 percent of the almonds cultivated in the U.S. and about 80 percent of their global production. Uncertainty exists in how other specialty crops will respond to climate change due to their diversity and the complexity of direct and indirect impacts (Kerr et al., 2017).
An economic modeling study completed as part of the Fourth Assessment indicates that through adaptive decision-making and technological advancement, agriculture can remain economically viable in the face of climate change (Medellín-Azuara et al., 2018). However, that viability may be at the expense of agricultural jobs and the dairy sector. In optimization modeling of crop changes in response to water shortage, some idling of land occurs in water strained scenarios (Medellín-Azuara et al., 2018). In the modeled scenarios, farms are also able to respond to higher costs/scarcity of water and land by shifting to crops that tolerate the new climate and yet provide high value. The use of crop switching to handle higher costs of water seen in the model has a real life analog: Greene’s (2018) study, mentioned above, found that in the 2012-2016 drought many farms did switch to higher value crops. Based on the modeling in Medellín-Azuara et al. (2018), another implication of movement towards high-value crops is that production of livestock feed crops is expected to decrease in the 2050 timeframe, impacting livestock operations such as dairies (Medellín-Azuara et al., 2018) and related businesses. The Agricultural Issues Center determined that 190,000 jobs were supported by dairies and the dairy-processing sector in 2014. These jobs were located on dairy farms and in related dairy processing facilities (Sumner et al., 2015).
BIODIVERSITY AND ECOSYSTEMS
California is one of 25 global biodiversity hotspots (Myers et al., 2000), in large part because of its diverse mountain ranges, geology, and climatic conditions. Because California’s various climates strongly influence its biodiversity, climate change is expected to have direct and indirect impacts to the plants and animals of the state, both terrestrial and aquatic. No Fourth Assessment reports specifically examine impacts on biodiversity and ecosystems, so this section relies on current literature. However, Chapter 3 includes results from a Fourth Assessment study on climate-wise corridors for terrestrial species (Keeley et al., 2018).
Direct effects of climate change to California’s ecosystems include the physiological stress that species will experience as temperature and precipitation change. This stress will cause population declines in many species and may force vegetation communities and individual species to shift their geographic distributions or ranges to track the shifts in suitable climates. Changes in the timing of the seasons could also disrupt the timing of critical life cycle events (i.e., phenology). Climate change will also facilitate the spread of invasive species, pests, pathogens, and diseases that affect ecosystems and species. Given the speed at which climate is changing, geographic shifts in plant and animal

Fourth Climate Change Assessment Statewide Summary Report | 61
CALIFORNIA’S FOURTH
CLIMATE CHANGE ASSESSMENT
communities may require human assistance. A likely consequence is the creation of novel ecosystems, made up of native species from a diversity of sources and non-native species from all over the world.
Early studies on the impacts of climate change to terrestrial species tended to focus on the movement of climate conditions suitable for those species. The greater a change in conditions, the further away the similar conditions may move, a concept called climate velocity (Ackerly et al., 2010; Loarie et al., 2009). In mountainous terrain, climate velocity could be slower, due to the wide range of climate conditions found close to each other. Researchers have modeled many species in California (e.g. Fernándezet al., 2015; Franklin, 1998; Seo et al., 2009), and in many cases, these models show a decline in the size of species’ ranges as suitable climate locations become smaller (Loarie et al., 2008). However, a number of well-documented concerns about species distribution models suggest that such results can be used to gauge direction but likely lack sufficient accuracy to be used by themselves as the basis for adaptation planning (Faurby & Araújo, 2018).
A study developed in collaboration with forest managers in California’s southern Sierra Nevada Mountains used a place-based approach to examine how far climatic conditions could shift from optimal for the vegetation type currently located in a given area (Thorne, Choe, Boynton, et al., 2017). This climate exposure approach (Thorne et al., 2016; Thorne, Choe, Boynton, et al., 2017) can identify locations where a vegetation type will potentially be less climatically stressed from areas with higher stress. Sites that retain suitable climates can be considered climate refugia, whereas those that shift to marginal or unsuitable conditions would become more vulnerable. Under the RCP 8.5 scenario (similar to the current global emissions rate), between 45-56 percent of the natural vegetation of California becomes climatically marginal by 2100, whereas only 21-28 percent of the vegetation becomes climatically marginal under a lower emissions scenario (RCP 4.5 scenario). Some of the most impacted regions are predicted to be the Sierra Nevada foothills, the south coast including Los Angeles and San Diego, the deserts, and under some scenarios, the coast ranges north of the San Francisco Bay Area.
Changes in the timing of climatic events can also affect the timing of species’ lifecycle phases. Many species have co-evolved with others so that their respective development needs are synchronized. A well-known example is with the emergence of butterflies and the simultaneous flowering of their host plants. Earlier flowering times are linked to early warming temperatures (Cayton et al., 2015), and observations show advancing spring flight of butterflies in California (Forister & Shapiro, 2003). If butterflies and host plants are not able to adapt at the same rate, butterflies may suffer from lack of food, and the hosts from lack of pollinators, or they may shift to non-native plants. Other examples may involve predator-prey relationships and migratory species. Shifts in the suitable climatic conditions for seedling establishment of two common California oaks indicate significant decreases in the “establishment windows” and suggest future population declines (Davis et al., 2016).
Climate change is expected to promote the success of invasive species, pests, and pathogens (Anderegg et al., 2015). One of the most graphic examples California is already experiencing is the large outbreak of bark beetles in California’s conifer forests. These beetles have always been present in periodic outbreaks, and normally cold winter weather keeps their population somewhat in check, preventing large tree die-offs. However, as winter temperatures rise, and in conjunction with the recent drought, their populations have burgeoned to create unprecedented tree die-offs. This is especially true in the southern Sierra Nevada, where in places tree mortality is nearly 100 percent. The lack of surviving seed trees is likely to cause failure of pine regeneration and result in forest conversions to shrubland (Stephens et al., 2018).

Fourth Climate Change Assessment Statewide Summary Report | 62
CALIFORNIA’S FOURTH
CLIMATE CHANGE ASSESSMENT
Aquatic species also face challenges under changing climate conditions. Under current emissions trajectories, 82 percent of native fishes have an increased probability of becoming instinct by 2100 (Moyle et al., 2013). Many of these species, including iconic salmon and steelhead trout, are already at risk and listed as species of special concern or endangered, even without climate change impacts (Quiñones & Moyle, 2015). In contrast, non-native species are thriving in the warm water of reservoirs and the increasingly warm waters of California’s rivers, taking the place of many native fishes. In the next 50-100 years, many aquatic ecosystems in California will have morphed into new ecosystems, highly modified and supporting fishes, aquatic plants, and invertebrates from all over the world, with just a few native species remaining (Moyle, 2014). This situation already exists in the Delta and many Central Valley streams.
Shifting water regimes and related changes in management strategies are impacting aquatic species as well as terrestrial ecosystems. The shifts already observed in the water cycle have altered water quality (e.g., sedimentation or algal blooms), habitat suitability, and management strategies for native species. For example, streamflow and suspended sediment transport simulations to the Bay-Delta indicate a shift in future sediment events that will impact freshwater and estuarine species (Stern et al., 2016). Significant consequences arise from shifts in sediment supplies. Increased sediment supply to the Bay-Delta will help bolster the resilience of marshes against sea-level rise by aiding in marsh accretion. However, water quality may decline due to increases in contaminants such as pesticides, herbicides, nutrients, and mercury.
Water quality for aquatic habitats as well as human use is also affected by wildfires. Wildfires drastically change the terrain and make the ground less able to absorb water, creating conditions conducive to flash flooding and mudflows. The burned hillsides from the 2017 wildfires have left communities vulnerable to catastrophic mud and debris flows, which also negatively impact natural systems.
FOREST HEALTH
Forests cover roughly 33 million acres of California’s 100 million acres, and approximately 19 million of the forested acres are public lands. Forests provide important habitat, capture, store, and filter precipitation that goes into the state’s water system, and support economic activities through recreation and timber. The Fourth Assessment contributes to California’s ongoing forest programs, management, and research with studies on wildfire projections (Westerling, 2018), and an extensive literature review on fuel treatment (Moghaddas et al., 2018). Given the importance of California’s forest health, this report also summarizes recent literature on what can be expected for forests, and what questions remain.
Climate change can affect forests directly through temperature and precipitation changes, but also through the interaction of multiple stressors. As discussed in Chapter 1, uncertainty exists in how climate change will affect total precipitation (He et al., 2018). Models also suggest that there is a tendency for wetter conditions in the northern part of the state and drier conditions in the south (Neelin et al., 2013; Pierce et al., 2018; Seager et al., 2014). In addition to changes in annual precipitation, forests are sensitive to the variability and sequencing of precipitation events (e.g., Jump et al., 2017). The 2012-2016 drought contributed to widespread tree mortality throughout the state, due to associated warmer temperatures that stressed the trees and made them more susceptible to pests and pathogens (Asner et al., 2016; Stephenson et al., 2018; Young et al., 2017).

Fourth Climate Change Assessment Statewide Summary Report | 63
CALIFORNIA’S FOURTH
CLIMATE CHANGE ASSESSMENT
Regardless of the direction of changes in precipitation, warming will influence forest ecosystems through changes in the timing of seasonal and natural patterns, respiration, snow storage, and atmospheric moisture demand (Anderegg, et al., 2015; Mankin & Diffenbaugh, 2015; Williams et al., 2013; Thorne et al., 2015; Wolkovich et al., 2012). Droughts co-occurring with and worsened by increasingly high temperatures are of particular importance in California’s forests (Diffenbaugh et al., 2015; Williams, Schwartz, et al., 2015). The recent drought highlighted this effect: precipitation shortfalls were not record-breaking in a centennial context, but when coupled with record-breaking heat, they resulted in record-breaking drought conditions as quantified by the Palmer Drought Severity Index (Griffin & Anchukaitis, 2014; Williams, Seager, et al., 2015).
Higher carbon dioxide concentrations in the atmosphere enable plants to improve water-use efficiency through increased stomatal regulation (Farquhar, 1997; Field et al., 1995), which has been said to counteract at least some of the drying effects of heat during drought (Kirschbaum & McMillan, 2018; Milly & Dunne, 2016; Swann et al., 2016). While satellite observations indicate that global vegetation water-use efficiency has increased in part due to higher CO2 concentrations in recent decades (Huang et al., 2015), observations suggest that this increase has not been as large as predicted by models (Smith et al., 2016). Additional research is needed to better understand these dynamics.
Although wildfires have long played an important role in California’s forests, human impacts on natural fire regimes have been varied and substantial (e.g., timber harvests, changing ignition patterns, fire suppression, land development). At relatively broad scales, climate affects fire regimes in two fundamental ways: altering vegetation growth rates (which affects fuel accumulation rates), or through changes in fire season length and severity (which affects fuel flammability and fire weather) (Krawchuk & Moritz, 2011; Littell et al., 2009; Meyn et al., 2007; Westerling, 2018). Continued shifts in local anthropogenic influences will cause additional disruptions to natural forest patterns and processes, and climatic shifts will continue to threaten the health and persistence of California forests.
However, key uncertainties exist about how future fire weather and increased atmospheric CO2 concentrations may influence fire activity in California forests. Extreme fire weather, particularly in the form of hot and dry winds, can have a strong influence on shrubland fire regimes (e.g., Jin et al., 2014; Moritz et al., 2010), and contributes to conversion of shrublands to grasslands, as described in a Fourth Assessment report (Jennings et al., 2018). Strong winds have also been associated with severe forest fires in California (e.g., Safford et al., 2009; Thompson & Spies, 2010), meaning that climate change impacts on wind patterns may also strongly affect forests, potentially serving as the trigger mechanism for conversion of forest to other types of vegetation (Goforth & Minnich, 2008).
An extensive literature review about fuel treatment in forests prepared for the Fourth Assessment concludes that practices that reduce stand density and restore beneficial fire can improve climate resilience, reduce the likelihood of severe wildfires, and minimize the long-term carbon losses from forested areas (Moghaddas et al., 2018). An analysis prepared for the Mokelumne River watershed in the Sierra Nevada region shows that fuel treatment reduces the size and intensity of wildfires, and that the economic benefits of these treatments may be up to three times greater than their costs. The benefits derive from avoided structure loss, lower fire suppression and post-event restoration costs, and the avoided loss of merchantable timber and biomass that could be used for energy (Buckley et al., 2014). Recent fires in the study area could allow for additional analysis to explore the robustness of these results.
In addition to the threats summarized above, questions remain about how much of the currently forested landscape will be able to sustain viable forests in the future. Forest loss is already a global concern (Allen et al., 2015). Climates

Fourth Climate Change Assessment Statewide Summary Report | 64
CALIFORNIA’S FOURTH
CLIMATE CHANGE ASSESSMENT
in some regions are changing relatively quickly, and it is likely that many forest species will not be able to persist where they are now. A number of recent studies also show evidence that forest regeneration patterns are shifting as temperatures warm (e.g., Fellows & Goulden, 2012; Kueppers et al., 2017; Liang et al., 2017b; Monleon & Lintz, 2015; Serra-Diaz et al., 2016), and introduced species appear to show disproportionate upward shifts in elevation (e.g., Wolf et al., 2016).
Long-lived plants, such as forest tree species, will need to disperse to and regenerate in new suitable environments relatively quickly, and whether these new forests occupy land that is protected from development may be critical to their long-term persistence (Batllori et al., 2017). It is likely that some conifer forest types will replace others at higher elevations, while at lower elevations such forests will likely be displaced by drought-resistant hardwood dominated ecosystems (e.g., Liang et al., 2017b; McIntyre et al., 2015). Some forest trees, such as those in the highest mountains of California, will not be able to shift upward in elevation and may be lost altogether (Ackerly et al., 2010) or may invade current meadows (Lubetkin et al., 2017), potentially altering mountain hydrology.
A recent study found that most forest types in California will be at very high levels of exposure to negative climate impacts later in this century, although this effect is not quite as severe under wetter climate futures (Thorne, Choe, Boynton, et al., 2017). Regardless, it is certain that chronic temperature stress, episodic extreme droughts, pest and pathogen outbreaks, and wildfires will interact as compound disturbances that amplify effects and facilitate major ecosystem transitions in California (Batllori et al., 2017; Buma, 2015; Dale et al., 2001; Paine et al., 1998).
Moisture stress in conifer forests enhances tree vulnerability to insect infestation, particularly by bark beetles (Anderegg et al., 2015; Bentz et al., 2010; Berryman, 1976; Gaylord et al., 2013; Hart et al., 2014; Kolb et al., 2016; Raffa et al., 2008). Between 2010 and 2017, an estimated 129 million trees have died (Young et al., 2017).
Bark beetle outbreaks may be promoted by warming for multiple reasons (Bentz et al., 2010). Warming may promote successful beetle overwintering (Weed et al., 2015) and may also promote earlier timing of adult emergence and flight in spring/early summer, which may enable beetles to increase the frequency at which they can mate, lay eggs, and emerge as adults (Bentz et al., 2016).
Importantly, much remains to be understood about how climate changes and accompanying tree demographic changes will combine to affect future trends in bark beetle activity in California and elsewhere (Six, et al., 2014). Beetle responses to climate change will be species-specific and strongly influenced by, and coupled to, species-specific shifts in tree distributions (Thorne, Choe, Boynton, et al., 2017; Williams & Liebhold, 2002).
It is worth noting that the vast expanses of beetle-killed trees throughout western U.S. forests have motivated concerns about increases in fire danger following infestations (Hicke et al., 2012). While the connection between vast expanses of dead trees and fire danger appears intuitive, empirical analyses focusing on recent decades indicate that areas attacked by beetles have tended not to burn with a higher frequency or severity than similar non-attacked forest during the observed period (Andrus et al., 2016; Hart et al., 2015; Harvey et al., 2014; Kane et al., 2017; Meigs et al., 2016; Mietkiewicz & Kulakowski, 2016). However, some have suggested the potential for rare but severe types of fire over large areas in coming decades (Stephens et al., 2018).
WILDCARD: BEETLE INFESTATIONS
Fourth Climate Change Assessment Statewide Summary Report | 65
CALIFORNIA’S FOURTH
CLIMATE CHANGE ASSESSMENT
OCEAN AND COAST
The Fourth Assessment includes the first synthesis report detailing climate change impacts, research needs, and adaptation solutions for California’s ocean and coast (California’s Ocean and Coast Summary Report, 2018). The findings from that report, including relevant Fourth Assessment technical reports, are summarized here and in the following chapters.
From the Oregon border to Mexico, California’s ocean and coast support a large economy and many coastal communities. Although California’s 19 coastal counties only account for 22 percent of the state’s area, they are home to 68 percent of its people, 80 percent of its wages, and 80 percent of its GDP (ERG, 2016). California’s ocean supports a vast diversity of marine life, as well as fishing communities that depend on fish and shellfish for their livelihoods, which provide a diverse supply of seafood to the state and for export. In 2012, approximately 1,900 commercial fishing vessels operated in California and 7,700 jobs were supported by recreational marine fishing (NOAA NMFS, 2012).
The ocean is the main regulator of the planet’s climate and is now severely impacted by human-induced climate change. The ocean has absorbed about 93 percent of the excess heat trapped by the Earth as a result of greenhouse gases (USGCRP, 2017). Ocean waters are warming, becoming depleted of oxygen, and acidifying, while sea-levels are rising. These changes are subjecting coastal areas to more frequent and intense flooding and storms, and they are also already affecting marine fisheries and aquaculture, which account for about 17 percent of the global population’s intake of animal protein (FAO, 2016). In the coming decades, 10 percent of the world’s population may face micronutrient and fatty acid deficiencies simply because the oceans are running out of wild fish (Golden et al., 2016). California is much less susceptible than other regions, but the state’s role in providing wild-caught fish to a global market will be impacted, and presently emerging global patterns will eventually impact the health of Californians.
In the last few years, California has experienced unusual events in the ocean and along the coast, including an unprecedented marine heat wave, a record harmful algal bloom, closures of fisheries, and a significant loss of northern kelp forests. There is increasing evidence that climate change is transforming and degrading California’s coastal and marine ecosystems due to impacts including sea-level rise, ocean acidification, and ocean warming.
Climate-driven changes to the ocean and coast – both already occurring and projected – will have significant consequences for California’s coastal ecosystems, economy, communities, culture, and heritage. These consequences will also have ripple effects in California well beyond the local area affected, effects that could extend into the U.S. economy (for instance in the case of key port facilities such as Los Angeles-Long Beach) (Grifman et al., 2013; Hummel et al., 2018; Moser et al., 2018). Projected impacts to California’s ocean and coast are summarized below, as well as the consequences for California.
Rising Sea-levels
The phenomenon of SLR and its impacts to infrastructure are discussed in earlier parts of this report. Here risks to human population and communities are summarized. Importantly, SLR combined with extreme storms will have drastic impacts along the coastline as well as for inland flooding. The impacts to the economy are expected to be severe, and coastal ecosystems will face challenging conditions to which they must adapt. A new report by the California State Coastal Conservancy and the Nature Conservancy produced the first statewide assessment of the sea-
Fourth Climate Change Assessment Statewide Summary Report | 66
CALIFORNIA’S FOURTH
CLIMATE CHANGE ASSESSMENT
level rise vulnerability of California’s coastal habitats, species, and conservation lands (Heady et al., 2018). This report found that 55 percent of current habitat by area is highly vulnerable to five feet of seal level rise, including 60 percent of beaches, 58 percent of rocky intertidal habitat, 58 percent of marshes, and 55 percent of tidal flats. Furthermore, 41,000 acres of public conservation lands are projected to be inundated by subtidal waters (Heady et al., 2018).
Seventy-five percent of California’s population lives in coastal counties, and millions live along a coastline increasingly subject to sea-level rise. Adaptation to sea-level rise over the next 30-40 years will likely utilize protection strategies such as beach nourishment, tidal marshes, and potentially coastal armoring. However, with increasing sea-level rise and coastal storms by mid-century, localities may begin to consider retreat strategies, which may require the expansion of inland cities.
Sea-level rise will raise the water table in areas close to the ocean. In some areas, elevated water tables may result in groundwater flooding and/or exposure of buried infrastructure. An analysis for the San Francisco Bay Area suggests that impacts of sea-level rise on wastewater treatment plants will be significantly higher if groundwater flooding is also taken into account (Hummel et al., 2018).
Ocean Temperature-Driven Changes
From 1900 to 2016, California’s coastal oceans warmed by ~0.7°C (1.260°F) (USGCRP, 2017). Long-term temperature records indicate that the California Current System is warming, which in recent years has been accompanied by unusual variability. This variability was evidenced by the large patch of warm water along the West Coast known as “the Blob” that persisted from 2013-2016.
Observations show that unusually warm ocean temperatures contributed to an increase in harmful algal blooms (HABs) along the Pacific Coast (Gobler et al., 2017; McKibben et al., 2017). HABs pose threats to public health, especially those blooms that produce domoic acid, which can which can be fatal for people who eat tainted shellfish (McKibben et al., 2017; Moore et al., 2008). Perhaps the most well-recognized of these organisms is the toxic diatom Pseudo-nitzschia, responsible for mass marine organism mortalities and shellfish contamination that led to an unprecedented five-month delay in opening the commercially-important Dungeness crab fishery in 2015 (Callahan, 2016; Chavez et al., 2017; McCabe et al., 2016). This caused substantial economic hardship, though precise measures of the losses have not been made. More frequent and widespread HABs may result in increasing economic damages and threats to the health of people, marine mammals, and seabirds (Gobler et al., 2017; McKibben et al., 2017).
Ocean Chemistry
Increases in atmospheric carbon dioxide concentrations are fundamentally changing the chemistry of the ocean (e.g., Caldeira & Wickett, 2003; Feely et al., 2004). The ocean absorbs approximately 30 percent of the CO2 released into the atmosphere every year, increasing the acidity of the ocean (termed ‘ocean acidification’). Ocean acidification (OA) is predicted to occur especially rapidly along the West Coast (e.g., Gruber et al., 2012). Ocean acidification presents a clear threat to coastal communities through its significant impacts on commercial fisheries and farmed shellfish (Ekstrom et al., 2015) as well as to ocean ecosystems on a broader scale. Ocean acidification affects many shell-forming species, including oysters, mussels, abalone, crabs, and the microscopic plankton that form the base of the oceanic food chain (Kroeker et al., 2013; Kroeker et al., 2010). Significant changes in behavior and physiology of fish
Fourth Climate Change Assessment Statewide Summary Report | 67
CALIFORNIA’S FOURTH
CLIMATE CHANGE ASSESSMENT
and invertebrates due to rising CO2 and increased acidity have already been documented (e.g., Hamilton et al., 2017; Jellison et al., 2017; Kroeker et al., 2013; Munday et al., 2009). Species vulnerable to ocean acidification account for approximately half of total fisheries revenue on the West Coast (Marshall et al., 2017).
Alongside these observations of changing carbon dioxide content, measurements indicate a decline in dissolved oxygen (DO) within California’s Current System, including expansion of hypoxic zones (i.e., waters with low or depleted oxygen concentrations). Climate change may reduce oxygen content in coastal eastern Pacific waters to levels lower than any naturally occurring conditions by 2040 (Henson et al., 2017; Long et al., 2016).
California’s marine waters, and the coastal climate itself, respond strongly to changes in wind and weather patterns. For California’s north and central coast, each spring and summer feature persistent northwest winds that cause cool waters to rise to the surface from deeper in the ocean (i.e., upwelling). When these cool waters rise up and come into contact the overlying atmosphere, they produce a damp and chilly marine layer with persistent coastal fog (described as “marine layer clouds” in Chapter 1). In coastal California, the growing season of economically important crops overlaps with the occurrence of coastal fog, which provides shading and direct water inputs. Iconic species such as coastal redwoods also depend on coastal fog. In addition to the marine layer, upwelling brings nutrient rich, oxygen poor, and low pH water to the coastal zone, significantly influencing marine life (Checkley & Barth, 2009). In fall and winter, weaker and less persistent north-to-south coastal winds mean that upwelling is less frequent and intense, and mostly confined to the southern part of the California Current. With climate change, upwelling is expected to intensify in spring but weaken in summer, and these changes are expected to expand beyond natural variability in the second half of this century (Brady et al., 2017).
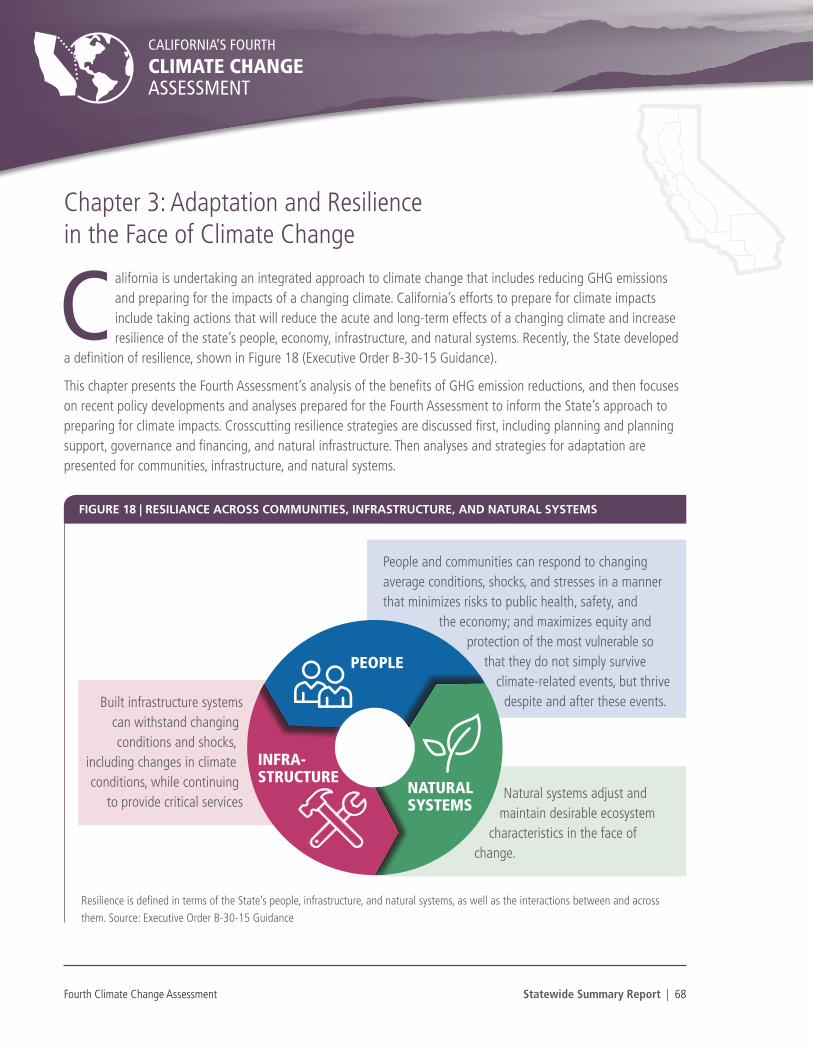
Fourth Climate Change Assessment Statewide Summary Report | 68
CALIFORNIA’S FOURTH
CLIMATE CHANGE ASSESSMENT
Chapter 3: Adaptation and Resilience in the Face of Climate Change
alifornia is undertaking an integrated approach to climate change that includes reducing GHG emissions and preparing for the impacts of a changing climate. California’s efforts to prepare for climate impacts include taking actions that will reduce the acute and long-term effects of a changing climate and increase resilience of the state’s people, economy, infrastructure, and natural systems. Recently, the State developed
a definition of resilience, shown in Figure 18 (Executive Order B-30-15 Guidance).
This chapter presents the Fourth Assessment’s analysis of the benefits of GHG emission reductions, and then focuses on recent policy developments and analyses prepared for the Fourth Assessment to inform the State’s approach to preparing for climate impacts. Crosscutting resilience strategies are discussed first, including planning and planning support, governance and financing, and natural infrastructure. Then analyses and strategies for adaptation are presented for communities, infrastructure, and natural systems.
C
Resilience is defined in terms of the State’s people, infrastructure, and natural systems, as well as the interactions between and across them. Source: Executive Order B-30-15 Guidance
FIGURE 18 | RESILIANCE ACROSS COMMUNITIES, INFRASTRUCTURE, AND NATURAL SYSTEMS
PEOPLE
INFRA- STRUCTURE
NATURAL SYSTEMS
Built infrastructure systems can withstand changing conditions and shocks,
including changes in climate conditions, while continuing
to provide critical services
People and communities can respond to changing average conditions, shocks, and stresses in a manner that minimizes risks to public health, safety, and
the economy; and maximizes equity and protection of the most vulnerable so
that they do not simply survive climate-related events, but thrive
despite and after these events.
Natural systems adjust and maintain desirable ecosystem
characteristics in the face of change.
Fourth Climate Change Assessment Statewide Summary Report | 69
CALIFORNIA’S FOURTH
CLIMATE CHANGE ASSESSMENT
Both emission reductions and resilience-building strategies are needed to protect California from the impacts of a changing climate. An analysis prepared for the Fourth Assessment quantifies the benefit to California in a future where emission reduction commitments under the Paris Agreement are met.
Several Fourth Assessment studies examined tools and resources to support better climate resilience:
• A new tool developed for the Fourth Assessment provides public health officials with information likely to be most relevant for California conditions.
• A study of a simulated cascading emergency events demonstrates that maps of interconnected lifeline systems are critical, particularly in metropolitan areas, to help practitioners be more aware of the importance of cascading events and geographically-connected impacts (teleconnections), and effective efforts to prevent or otherwise mitigate them.
New tools and approaches will be needed across communities, infrastructure, and natural systems to support adaptation actions and to build resilience:
• An extensive literature review examining fuel treatment in forests concludes that practices that reduce stand density and restore beneficial fire can improve climate resilience, reduce the likelihood of severe wildfires, and minimize the long-term carbon losses from forested areas.
• Natural infrastructure can deliver substantial environmental and recreational values while also providing protection from sea-level rise. One study developed technical guidance on design and implementation of natural infrastructure for adaptation to sea-level rise.
• Soil organic carbon can be used to both reduce GHG emissions and contribute to resilience of agriculture. A field trial and modeling study demonstrates that a single application of compost to rangelands in California can increase soil organic carbon sequestration for up to 30 years and enhance net primary productivity, while also increasing water infiltration and support groundwater recharge.
A critical review of climate-wise corridors for terrestrial species makes recommendations to capture connectivity needs of the majority of species, including incorporated projected climate data to identify future similar habitat patches. The study also identifies a framework to guide successful implementation of corridors, which considers governance challenges and the need for coordination across landowners and jurisdictions.
Traditional Ecological Knowledge-based methods are gaining a revitalized position within a larger statewide toolset to combat the causes and effects of climate change by tribal and non-tribal stakeholders alike. The importance of maintaining TEK is not isolated to environmental and ecological improvements. These ancient, traditional practices are closely linked to climate resilience across tribal cultural health, identity, and continuity. Cultural practices and traditional land management are also linked to improving physical and mental health among tribal members. As an example of applied TEK science, many tribes use prescribed, controlled burns – commonly deployed within a centuries-old cultural context – to manage meadows, forests, and other areas within tribal lands. These TEK techniques are increasingly incorporated by non-tribal land and resource managers as a part of wildfire prevention and ecosystem management.
KEY FINDINGS FROM THE FOURTH ASSESSMENT
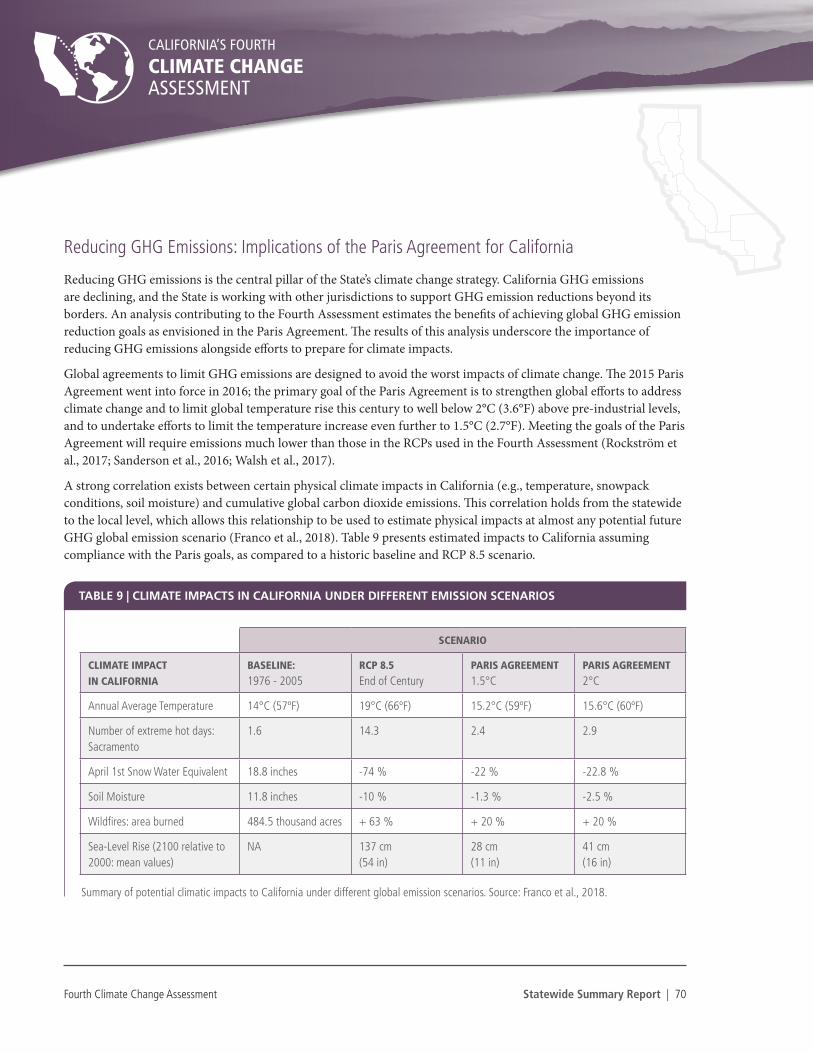
Fourth Climate Change Assessment Statewide Summary Report | 70
CALIFORNIA’S FOURTH
CLIMATE CHANGE ASSESSMENT
Reducing GHG Emissions: Implications of the Paris Agreement for California
Reducing GHG emissions is the central pillar of the State’s climate change strategy. California GHG emissions are declining, and the State is working with other jurisdictions to support GHG emission reductions beyond its borders. An analysis contributing to the Fourth Assessment estimates the benefits of achieving global GHG emission reduction goals as envisioned in the Paris Agreement. The results of this analysis underscore the importance of reducing GHG emissions alongside efforts to prepare for climate impacts.
Global agreements to limit GHG emissions are designed to avoid the worst impacts of climate change. The 2015 Paris Agreement went into force in 2016; the primary goal of the Paris Agreement is to strengthen global efforts to address climate change and to limit global temperature rise this century to well below 2°C (3.6°F) above pre-industrial levels, and to undertake efforts to limit the temperature increase even further to 1.5°C (2.7°F). Meeting the goals of the Paris Agreement will require emissions much lower than those in the RCPs used in the Fourth Assessment (Rockström et al., 2017; Sanderson et al., 2016; Walsh et al., 2017).
A strong correlation exists between certain physical climate impacts in California (e.g., temperature, snowpack conditions, soil moisture) and cumulative global carbon dioxide emissions. This correlation holds from the statewide to the local level, which allows this relationship to be used to estimate physical impacts at almost any potential future GHG global emission scenario (Franco et al., 2018). Table 9 presents estimated impacts to California assuming compliance with the Paris goals, as compared to a historic baseline and RCP 8.5 scenario.
SCENARIO
CLIMATE IMPACT
IN CALIFORNIA
BASELINE:
1976 - 2005RCP 8.5
End of CenturyPARIS AGREEMENT
1.5°CPARIS AGREEMENT
2°C
Annual Average Temperature 14°C (57ºF) 19°C (66ºF) 15.2°C (59ºF) 15.6°C (60ºF)
Number of extreme hot days: Sacramento
1.6 14.3 2.4 2.9
April 1st Snow Water Equivalent 18.8 inches -74 % -22 % -22.8 %
Soil Moisture 11.8 inches -10 % -1.3 % -2.5 %
Wildfires: area burned 484.5 thousand acres + 63 % + 20 % + 20 %
Sea-Level Rise (2100 relative to 2000: mean values)
NA 137 cm (54 in)
28 cm (11 in)
41 cm (16 in)
Summary of potential climatic impacts to California under different global emission scenarios. Source: Franco et al., 2018.
TABLE 9 | CLIMATE IMPACTS IN CALIFORNIA UNDER DIFFERENT EMISSION SCENARIOS
Fourth Climate Change Assessment Statewide Summary Report | 71
CALIFORNIA’S FOURTH
CLIMATE CHANGE ASSESSMENT
In addition to the potential benefits outlined in Table 9, another recent study shows that efforts to reduce GHG emissions can result in significant indirect health benefits due to reduction in pollutants from fossil fuel combustion (see text box on Public Health Benefits of Deep GHG Emission Reductions).
Many sources that emit greenhouse gases (GHGs) also release criteria air pollutants, including particulate matter (PM), nitrous oxides (NOx), and volatile organic compounds (VOCs). Actions to reduce GHG emissions will indirectly improve air quality by decreasing emissions of these pollutants. A recent detailed analysis suggests that adoption of low-carbon energy in California to reduce GHG emissions 80 percent below 1990 levels would lead to a 55 percent reduction in air pollution mortality rates relative to 2010 levels (Zapata et al., 2018). These public health improvements have a value of $11-20 billion/year in California (Zapata et al., 2018). The majority of these public health savings are associated with reductions in PM concentrations, which is the primary air quality challenge in California. These public health savings are driven by local emissions reductions, assuming no actions outside of California. Therefore, the transition to low-carbon energy sources in the state has immediate benefits for air quality.
Ozone is the second main air quality challenge in California. The national ambient air quality standard (NAAQS) for ozone of 70 parts per billion (ppb) is approximately equivalent to the 98th percentile of measured 8-hour ozone concentrations (Parrish et al., 2017). Ambient ozone concentrations include ozone produced locally plus any baseline ozone transported into California. Baseline ozone is caused by NOx and VOC emissions in the Northern Hemisphere, often from sources that also emit GHGs. Baseline ozone concentrations in California have a 50th percentile concentration of ~35 ppb and a 98th percentile concentration of 60 ppb (Parrish et al., 2017). At the higher baseline level, local ozone production in excess of 10 ppb will violate the NAAQS.
Deep GHG reductions at the global scale reduce NOx and VOC emissions in the Northern Hemisphere, which in turn reduces baseline ozone transported into California. Global adoption of low-carbon energy would avoid 8,000 deaths across the U.S. in one year due to reduced baseline and locally-generated ozone (Zhang et al., 2017). Foreign GHG emission reductions contribute about 60 percent of the avoided mortality in the U.S. due to ozone. Roland-Holst et al. (2018) interpreted these results from Zhang et al. (2017) for California in a scenario that results in 80 percent reductions of GHG emissions from 1990 levels by 2050. This study also predicts public health benefits due to reduction of morbidity effects (e.g., asthma attacks, hospital admissions), increasing the overall estimation of public health benefits in California. Lower baseline ozone levels associated with global GHG reductions will also facilitate compliance with the 70 ppb ozone NAAQS in California (Parrish et al., 2017).
The public health savings of deep GHG emission reductions in California in isolation or in combination with global action are comparable to the potential cost of GHG reductions (Roland-Holst et al., 2018; Zapata et al., 2018). This holds even without consideration of other benefits of deep GHG reductions, such as lower overall climate risks from higher temperatures and sea-level rise.
PUBLIC HEALTH BENEFITS OF DEEP GHG EMISSION REDUCTIONS IN CALIFORNIA
Fourth Climate Change Assessment Statewide Summary Report | 72
CALIFORNIA’S FOURTH
CLIMATE CHANGE ASSESSMENT
Resilience-Building Strategies
The adaptation approaches addressed in the Fourth Assessment consider adaptation from different perspectives and include consideration of sector-specific activities and crosscutting needs. In many cases, the analyses build on ongoing research. In this section, current adaptation approaches and needs are discussed, highlighting new findings that emerged in Fourth Assessment studies. First, crosscutting approaches are covered, including local planning and planning support, governance and financing, and natural infrastructure. Then, adaptation approaches are presented for Communities and People, Infrastructure, and Natural Systems.
ADAPTATION PLANNING AND PLANNING SUPPORT
Many of the strategies to build resilience in people and communities will be implemented by local government decision makers. Local governments have the primary authority over land use and development decisions, which have critical implications for exposure and vulnerability under a changing climate. This includes land use decisions, but also the development of strategies to respond to climate risks.
Legislation signed in 2015 (SB 379) requires that cities and counties consider climate risk in their General Plan (California Gov. Code § 65302). California state law requires each city and county to adopt a general plan “for the physical development of the county or city, and any land outside its boundaries which in the planning agency’s judgment bears relation to its planning” (California Gov. Code § 65300). The 2017 General Plan Guidelines released by the Governor’s Office of Planning and Research highlight the relationship between land use planning decisions and transportation patterns, electricity demand, and housing (Governor’s Office of Planning and Research, 2017).
Two Fourth Assessment studies focused on support for local climate planning:
Local Capacity Building
Local governments control land use decisions within their boundaries and will be at the forefront of adapting to climate change. However, many do not have the resources to address the challenge. Researchers funded through the Fourth Assessment engaged local government stakeholders to develop a toolkit for local governments to identify opportunities to improve existing capabilities in order to pursue climate change adaptation initiatives more effectively and holistically (Kay et al., 2018). The toolkit is available online for use by local governments.13
Supporting Response to Heat Emergencies
The Fourth Assessment also includes the development of a prototype warning system known as California Heat Assessment Tool (CHAT). CHAT is a prototype to support public health departments in taking action to reduce heat-related morbidity and mortality outcomes. It is designed to provide information about heat events most likely to result in adverse health outcomes in California (Steinberg et al., 2018). The current National Weather Service (NWS) heat warning system does not fully capture heat events likely to result in adverse health outcomes in California. Between 1999 and 2009, 19 heat related events in California had significant impacts on human health. These resulted in approximately 11,000 excess hospitalizations, but NWS heat advisories were only issued for six of the events
13 http://arccacalifornia.org/adapt-ca/
Fourth Climate Change Assessment Statewide Summary Report | 73
CALIFORNIA’S FOURTH
CLIMATE CHANGE ASSESSMENT
(Guirguis et al., 2014). CHAT uses observed heat thresholds in California, taking into account the factors discussed in the public health section in Chapter 2, to identify Heat-Health Events, which are likely to capture heat events more relevant and effective for California conditions from local to regional scales.
Cal-Adapt
All of the information on projected climate change projections prepared for the Fourth Assessment is included in the State’s online climate tool, Cal-Adapt. Researchers and programmers at UC Berkeley have developed Cal-Adapt to present information in an accessible format that is relevant to utilities, local planners, and other practitioners. The Fourth Assessment invested to maintain and further develop Cal-Adapt; this includes adding new climate projections such as wildfire scenarios used for the Fourth Assessment (Thomas et al., 2018).
GOVERNANCE AND FINANCING
Several Fourth Assessment studies examine governance and financing aspects of adaptation action:
Proactive Planning and Improved Governance
Governance across multi-sectoral and complex climate impacts with varying geographic impact areas is a challenge across the state, for infrastructure, ecosystems, and communities. Change in governance will be a crucial component of effective climate adaptation along with natural, economic, and social changes already underway. Two governance challenges that are highlighted in the Fourth Assessment are focused on concerns for water management and sea-level rise adaptation planning.
WATER GOVERNANCE
Although a wide variety of technical solutions have the potential to adapt California’s water system to climate change, the feasibility of these solutions depends on available funding, the legal and political landscape, socioeconomic barriers, and behavior (e.g., Kay et al., 2018). California’s water management and governance system is comprised of a patchwork of local, state, and federal agencies, alongside public and private water utilities. Collaboration is critical to ensure that the efforts of each of these individual stakeholders are successful to respond to hydrological stressors. Two Fourth Assessment analyses examine these challenges and recommend establishing multilevel collaborative governance structures to meet new groundwater management requirements under the Sustainable Groundwater Management Act (Conrad et al., 2018; Langridge et al., 2018).
SEA-LEVEL RISE GOVERNANCE
A study contributing to the Fourth Assessment focused on the need for collaborative, regional approaches to preparing for sea-level rise. Lubell (2017) examines the “governance gap” between SLR risks and the implementation of solutions. This gap arises due to the need to engage in multi-level cooperation among various stakeholders, even though the problem and the solutions may be already understood. As Lubell (2017) states, “sea-level rise adaptation entails interdependencies, where the vulnerabilities and adaptation decisions of local actors impose regional costs and benefits. While regional cooperation is beginning to emerge, most stakeholders see a critical need for shared learning, coordination, and planning.”
Fourth Climate Change Assessment Statewide Summary Report | 74
CALIFORNIA’S FOURTH
CLIMATE CHANGE ASSESSMENT
Financing Adaptation
The findings of recent studies, including from the Fourth Assessment, stress the financing needs of local governments to adapt to specific climate change impacts (Moser et al., 2018; Mann et al., 2017). Moser et al.’s (2018) study focuses on the financial needs to meet the multiple challenges of adaptation, provides an analysis of existing and proposed solutions, and cautions against potential solutions that would reinforce long-standing injustices and disparities. Their analysis also points out that financing challenges are about more than money; the challenges encompass institutional and governance considerations. Additional work is needed to identify how existing funding tools can support adaptation and resilience efforts, and to develop a more robust understanding of adaptation costs and benefits.
Climate Change and Insurance
Insurance is one mechanism to protect assets from damage from climate-related impacts. In their recent investigation into climate, wildfire risk, and insurance in California, Dixon et al. (2018) describe how insurance markets in wildfire prone areas of the state are facing major changes. Premiums in wildfire prone areas are high, but insurance professionals noted in interviews that they do not think those high prices accurately reflect the difference in risk. With climate change, Dixon et al. (2018) estimate that premiums per $1,000 of coverage in wildfire prone areas would rise 18 percent, while the insurance take-up rate is projected to drop by 7 percent. As with other studies of cost, they estimate that early reduction of emissions will substantially reduce economic impacts.
NATURAL INFRASTRUCTURE
New research from the Fourth Assessment affirms that natural infrastructure (e.g., healthy watersheds and soils, etc.) is a key tool for building resilience.
Terrestrially, land conservation and soil management are increasingly being recognized as a means to improve soil water-holding capacity, increase base flows and aquifer recharge, reduce flooding and erosion, and reduce climate-related water deficits (Flint et al., 2018). The California Department of Food and Agriculture has developed a Healthy Soils Initiative that is investing in demonstration projects throughout the state. Experiments are taking place with flooding fields and orchards in high rain years to encourage groundwater infiltration and enhancement rather than sending the water out to sea. Managing floodplains in general as ‘green infrastructure’ can have major benefits to native fishes, birds, and other biota (Opperman et al., 2017). Intensive thinning in highly productive forests generates substantial reductions in evapotranspiration, suggesting that forest thinning could result in increased base flows of up to 10 percent for dry years and 5 percent for all years (Roche et al., 2018). Headwater lands are also seen as a critical natural infrastructure in need of greater attention to secure the water quality benefits and habitat they provide (Solins et al., 2018).14
Natural infrastructure can deliver substantial environmental and recreational values while also providing protection from sea-level rise. One study prepared for the Fourth Assessment developed technical guidance on design and implementation of natural infrastructure such as the use of vegetated dunes, marsh sills, and native oyster reefs, for adaptation to sea-level rise. The report also provides definitions and case studies to illustrate demonstrated benefits
14 AB 2480, signed into law in 2016, defines watersheds as infrastructure (California Water Code Section 108.5).
Fourth Climate Change Assessment Statewide Summary Report | 75
CALIFORNIA’S FOURTH
CLIMATE CHANGE ASSESSMENT
and lessons learned (Newkirk et al., 2018; Judge et al., 2017). Using five case studies, they demonstrate natural shoreline infrastructure projects that range from fully natural approaches that preserve or restore natural systems, hybrid solutions that integrate engineered aspects into restored or created natural features, and fully engineered structures like seawalls and revetments. These case studies are designed to be useful examples for coastal planners, local governments, and others working on solutions and making decisions regarding climate-related coastal hazards, and to also take into consideration the diversity of the California coast and need for tailoring projects to particular conditions.
BUILDING RESILIENCE IN COMMUNITIES AND PEOPLE
Chapters 1 and 2 demonstrate that climate change impacts to weather and extreme events can have disproportionate impacts on certain communities. Here, tribal approaches to adaptation are covered, as well as the importance of emergency preparedness for overall resilience.
Tribes and Indigenous Communities
Tribal climate change perspectives trace back thousands of years. For many tribes, climate solutions come from a selection of actors, ancient history, generational, and place-based knowledge from eras when the relationships between climate, environment, and human action were more symbiotic.
Conducting meadow restoration, carbon sequestration, building sustainable energy, and protecting and improving salmon runs are among an extensive array of tribal climate actions undertaken to adapt to and mitigate climate change, and to exert bold management to restore their lands and shared environment (Summary Report from Tribal and Indigenous Communities within California, 2018). Tribes are also leading innovative partnerships with state and federal agencies. For example, many tribes are developing and enhancing emergency preparedness efforts, including negotiations with the U.S. Forest Service to create multiple access routes to tribal lands. The Karuk Tribe and the Klamath and Six Rivers National Forests have entered into a Memorandum of Understanding (MOU) based upon the Government-to-Government relationship established between the Tribe and the Forest Service. This MOU establishes a framework upon which the Tribe and the Forest Service may jointly identify, plan, and accomplish mutually beneficial projects and activities that provide for watershed restoration, job opportunities, and community economic development.15
Emergency Preparedness and Disaster Mitigation
Building on the findings from Fourth Assessment reports and others on the utility of fine resolution exposure projections, professionals and staff overseeing key infrastructure for California need the appropriate information and capacity to prepare for changing climate conditions (Moser & Finzi-Hart, 2018; Radke et al., 2018). Managers of the water system and electricity grid have used weather and climate data to better manage infrastructure (Allen et al., 2011; Lach & Rayner, 2017; Rice et al., 2009).
15 The Summary Report from Tribal and Indigenous Communities within California provides many more examples of California tribes’ innovative strategies and
action to address climate change.
Fourth Climate Change Assessment Statewide Summary Report | 76
CALIFORNIA’S FOURTH
CLIMATE CHANGE ASSESSMENT
A study prepared for the Fourth Assessment demonstrates that managers also need maps of interconnected lifeline systems, particularly in metropolitan areas (Moser & Finzi-Hart, 2018). These integrated maps can help practitioners be more aware of the importance of cascading events and geographically-connected impacts (teleconnections), as well as effective efforts to prevent or otherwise mitigate them. This study highlights that some interconnections may be beyond the traditional jurisdiction scope of local emergency managers and may occur far outside their territory. Emergency managers and other planners need the tools and knowledge to assess, internalize, and capitalize on the understanding of how electricity infrastructure, economic sectors, and other systems are interconnected. This information must be used not only by emergency managers, but also by control room operators for those who oversee the state’s critical infrastructure systems (Roe & Schulman 2015). This is vital because the full spectrum of emergency management must start with the emergency prevention activities taken for key critical infrastructures. Further research to develop and test methods for more inclusive risk and vulnerability assessments is needed.
BUILDING RESILIENCE IN INFRASTRUCTURE
The resilience of California’s energy, transportation, and water infrastructure to climate change impacts is critically important to overall community resilience and well-being, as well as to prevent cascading impacts of disasters.
Energy
State agencies and California electricity and natural gas utilities recognize the threat of climate change and are working together to build climate resilience. For example, the California Energy Commission (CEC) and the California Public Utilities Commission (CPUC) have created a high-level adaptation working group for information sharing across numerous state agencies. As part of the 2017 Integrated Energy Policy Report, electric and natural gas utilities are also engaged with CEC in discussions about potential climate impacts and adaptation options. Recent legislation further requires local governments, which own multiple publicly-owned utilities, to prepare adaptation plans as part of their regular hazard mitigation plans (Chapter 10, IEPR, 2017).
The CPUC currently requires electric and natural gas investor-owned utilities to discuss climate adaptation as part of their Risk Assessment Mitigation Phase (RAMP) filings. Additionally, the CPUC recently issued an Order Instituting Rulemaking16 to consider strategies and guidance for climate adaptation for all investor-owned utilities, beginning with electric and natural gas utilities. The Rulemaking will consider: how to define climate adaptation for these utilities; data, tools, and resources necessary for utility planning and operations related to adaptation; impacts on disadvantaged communities; and frameworks for addressing climate adaptation issues both in CPUC proceedings and in utility planning and operations.
The studies for the Fourth Assessment, as before, will inform the deliberations at the CPUC, CEC, and other agencies. Appendix A lists the energy-related studies that are part of the Fourth Assessment.
16 http://docs.cpuc.ca.gov/PublishedDocs/Published/G000/M213/K511/213511543.PDF

Fourth Climate Change Assessment Statewide Summary Report | 77
CALIFORNIA’S FOURTH
CLIMATE CHANGE ASSESSMENT
Transportation Infrastructure
A number of specific activities are already underway to address climate risk for certain elements of the transportation system. These are outlined below.
Highways: Caltrans, in coordination with state and federal agencies and research institutions, is conducting Vulnerability Assessments for each Caltrans District using locally relevant data sets.17 These assessments focus on the State Highway System and will help Caltrans districts identify vulnerabilities to SLR, storm surge, precipitation, wildfire, and temperature increases, as well as to identify adaptation options. This effort will identify segments of highway that are most susceptible to these climate-related events.
Railways: California railway companies use Risk Management Status Reports to adopt preventive behaviors while executing due diligence. Current railroad operating procedures incorporate speed restrictions to avoid track-buckling events due to high temperatures. These costly restrictions manifest currently as blanket reductions in speed. Adapting sensor technology could reduce delays by focusing speed restrictions to specific spatial locations, rather than having broad speed reduction procedures (Chinowsky et al., 2017).
Marine facilities: Permits to construct a new marine facility, or to undertake upgrades to existing facilities, require designs to address SLR.18 The Chevron Richmond Long Wharf facility upgraded a number of berths in 2016 to accommodate both vessel fleet requirements and SLR. The Naval Supply Systems Command Fleet Logistics Center of San Diego (NAVSUP - FLC) upgraded their 100-year-old Defense Fuel Support Point terminal at Point Loma at a cost of $195 million. This state-of-the-art facility was rebuilt using climate change and SLR adaptation accommodations, and it was the first marine terminal facility of this kind to receive LEED Certification (Seaman, 2015).
Airports: The San Francisco International Airport Five-Year Capital Plan (SFO, 2015) identifies actions that can be implemented sequentially in an adaptive manner in response to flooding and rising sea-level predictions. In the near term these include filling the remaining gaps in the existing seawall, reinforcing embankments, and raising low-lying areas at the end of runways. In the longer term they include the replacement, armoring, and heightening of seawalls to protect against wave energy.
Water Infrastructure
Despite the challenges faced in managing California’s water systems for both people and ecosystems, efforts in science, water management, and governance can improve the state’s capacity to anticipate and respond to climate change impacts on the state’s water system.
The loss of snowpack projected during the rest of this century (see Chapter 1) necessitates revisiting California’s expectations for water supply and demand, as well as relevant water management practices. For example, groundwater recharge is one technique that may help to offset the lack of snowpack. As reported in Kearns & Parker (2018), a multidisciplinary group of experts met in 2017 and suggested making groundwater recharge a part of climate adaptation plans.19 Researchers at UC Davis have mapped potential suitable areas that could be used to
17 There are 12 Caltrans districts.
18 http://www.slc.ca.gov/Info/AB691.html
19 https://cafwd.app.box.com/s/jtuhmgvczied9eds3pr9x64kkcxy2umr

Fourth Climate Change Assessment Statewide Summary Report | 78
CALIFORNIA’S FOURTH
CLIMATE CHANGE ASSESSMENT
recharge groundwater, including areas that are in use for agricultural purposes (O’Geen et al., 2015). They have also tested the recharging performance and the impact of intentional flooding of cropping areas during the winter season using “excess” water available in wet years. The results are encouraging, showing that crops such as alfalfa (Dahlke et al., 2018) and almonds (Ulrich et al., 2017) could be temporarily flooded in the cold season without deleterious effects on the quantity and quality of the crops. This practice could also be included as part of the plan being developed to comply with the Sustainable Groundwater Management Act (Bachand et al., 2016).
Institutional constraints discussed in Chapter 2 affect both the adaptive capacity and resilience of the water system (Green Nylen et al., 2018a, 2018b). Nylen et al. (2018a, 2018b) highlight that there are actions the State Water Resources Control Board (the Board) and other water agencies can take to improve their preparedness and response to drought events. In the past, the Board has had to make basic decisions during a drought crisis about what drought response strategies to use, how to reconcile competing priorities, and how to communicate with stakeholders. The Board and other water agencies can make future drought responses more timely, effective, and transparent by proactively adopting a contingency-based framework to support drought decision making, and by taking a suite of related actions including working to make key policy decisions in advance of droughts, maximizing learning from past droughts, and prioritizing water rights enforcement between droughts.
While urban and agricultural water interests were largely able to mitigate the negative impacts of drought, the aquatic environment suffered greatly during the 2012-2016 drought. Lack of an effective governance system meant that environmental water was sacrificed or minimized during the drought (Mount et al., 2017). Widespread aquatic extinctions will only be prevented with smart management of the water released from dams, which should include restoring spawning and rearing habitats for fishes (Opperman et al., 2017).
The Fourth Assessment also presents technical options, discussed below, to improve the resilience of the state’s water system:
Technical Advances: Improving current flood and water supply forecasting (as well as predictive models) are crucial efforts to move to a proactive approach to managing and responding to extreme precipitation events with a well-planned strategy for water management. Several Fourth Assessment technical reports provide improved projections and analysis of precipitation impacts to facilitate adaptive decision-making for water management (AghaKouchak et al., 2018; Avanzi et al., 2018; He et al., 2018).
Strategically employing precipitation and runoff forecasts has some potential to improve the operation of reservoirs, flood control, infiltration strategies, and hydropower, and this could accommodate potential water supply shortages from a drier and warmer climate, especially in southern California. As highlighted in a Fourth Assessment technical report, such operational changes will often be more cost-effective than some reservoir capacity expansion proposals (Herman et al., 2018). Other studies explore the utility of hydrological forecasts (with and without climate forecast components) and find them to be beneficial management aids for storing water and providing for multiple competing uses (e.g., Georgakakos et al., 2014). Demonstrations of one such decision-support tool show that its implementation could significantly reduce water shortages, increase electricity generation, and improve timing the release of water to reduce salinity in key areas in the Delta, while also providing adequate flood protection (Georgakakos et al., 2014). The California Department of Water Resources was able to secure funding and authorization to start implementing and using a similar system. Likewise, another tool is being developed for Sonoma County in what is known as Forecast Informed Reservoir Operations (FIRO).

Fourth Climate Change Assessment Statewide Summary Report | 79
CALIFORNIA’S FOURTH
CLIMATE CHANGE ASSESSMENT
BUILDING RESILIENCE IN NATURAL SYSTEMS AND WORKING LANDS
Similar to infrastructure, California’s ability to be resilient to climate change is dependent on the resilience of its natural systems and working lands. Adaptation of agricultural practices, adaptive conservation techniques for biodiversity and ecosystems, forest management, and various adaptive and conservation practices for California’s coast and ocean will build resilience. Furthermore, it is important to consider the principles above of engagement and partnership when building resilience in natural systems; traditional ecological knowledge (TEK) available through partnerships with California’s tribal communities can be a valuable resource in developing projects and adaptation priorities (Summary Report from Tribal and Indigenous Communities within California, 2018).
Agriculture
Based on prior actions taken in droughts, the traditional adaptation strategies for agriculture have been shifts in crops and cropping patterns, water management, and on-farm management practices. To face potential water shortages, adopting a water portfolio approach can increase the sustainability and resiliency of the agricultural sector. In the water portfolio approach, farms and irrigation districts identify alternative sources of water and manage these various water sources sustainably. Not only does securing multiple water sources sustain production, it also contributes to economic security by increasing agricultural land values (Mukherjee & Schwabe, 2015). This is significant because land that is highly valued for agricultural production and profitable as farmland is less likely to be lost to development.
Another method for farms to increase resiliency to water shortage is through enhancing soil organic matter. Adequate soil organic matter has been linked to improved water retention of soil as well as increased water recharge, soil stabilization, and protection from erosion (Andrews et al., 2002; Flint et al., 2018; Mitchell et al., 2017, 2012). Practices that contribute to increasing soil carbon stocks include addition of soil amendments, cover cropping, and reduced tillage or no tillage (Chambers et al., 2016; Flint et al., 2018; Griscom et al., 2017). A Fourth Assessment field trial and modeling study demonstrates that a single application of compost to rangelands in California can increase soil organic carbon sequestration for up to 30 years and enhance net primary productivity (Silver et al., 2018). The resulting increase in soil organic matter and increased vegetation also supports infiltration of water during precipitation events, contributing to recharge of aquifers (Flint et al., 2018). These studies suggest that the composting of organic waste streams for the purpose of land application results in fewer GHG emissions than alternative waste pathways, including current practices such as landfilling and anaerobic manure storage (Flint et al., 2018; Silver et al., 2018). In another Fourth Assessment study, Flint et al. (2018) find that the carbon sequestration potential of this practice will be most beneficial under lower global carbon emission scenarios. A recent expert elicitation exercise examining the potential net GHG benefits of soil carbon sequestration reports increasing carbon in rangelands as the most promising option (Stanton et al., 2018). However, the net GHG sequestration is more modest than the potential reported in Flint et al. (2018). The assumptions between the two studies vary, potentially resulting in these differing results.
Surveys show that farmers perceive greater risk from potential climate change policies than they do from climate change itself (Haden et al., 2013; Niles et al., 2013). Thus, research into adaptation options for agriculture should be designed to provide information and demonstrate the alternatives to climate-friendly practices, for both mitigation and adaptation, while leaving the decision on how and if to adapt to the farmers. This could be done, for example, by developing plants that are more adapted to expected future climatic conditions, while also testing and demonstrating more efficient water irrigation practices (Wolf et al., 2017).

Fourth Climate Change Assessment Statewide Summary Report | 80
CALIFORNIA’S FOURTH
CLIMATE CHANGE ASSESSMENT
Biodiversity and Ecosystems
Scientists expect that many species will not be able to disperse rapidly enough to track suitable climate conditions, or that barriers (cities, freeways, farms) will impede such dispersal. In such cases, “assisted migration” has been proposed as an adaptation strategy (McLachlan et al., 2007). This would involve the “translocation of representatives of a species or population harmed by climate change to an area outside the indigenous range of that unit where it would be predicted to move as climate changes, were it not for anthropogenic dispersal barriers or lack of time” (Hällfors et al., 2014). However, controversy exists around this strategy.
To address the loss of habitat for wildlife, protected areas have been and are currently being established around the world. California’s protected state and federal lands provide an opportunity for climate adaptation of terrestrial species, although in their current form, they do little for aquatic species (Grantham et al., 2017). However, wildlife populations in isolated reserves may have a lower chance of long-term survival. Because of this, a common conservation tool, conservation corridors, may offer climate adaptation possibilities. These corridors are broadly defined as areas of the landscape that facilitate movement, and they serve to counteract fragmentation and thereby prevent extinction of area-sensitive species, conserve genetic variability, and allow species to shift their geographic range with climate change (Heller & Zavaleta, 2009; Hilty et al., 2006). For aquatic systems, the corridors historically were stream channels, which are now mostly blocked by dams and diversions; thus, the large-scale blockage or destruction of stream channels means that conservation either has to be in situ, in isolated stream reaches, or through deliberate movement of fish to new habitats by people.
A critical review by Keeley et al. (2018) for the Fourth Assessment evaluates numerous strategies for designing and implementing climate-wise corridors for terrestrial species. This study recommends starting with structural connectivity designs (based on land use and land cover) to capture the connectivity needs of the majority of species. Corridors should be prioritized that connect habitat patches to sites where, based on projected climate data, the future climate will be similar to the current climate in the habitat patch (i.e., climate analogs) and climate refugia should also be incorporated in the design. The study also identifies a framework to guide successful implementation of corridors, which considers governance challenges and the need for coordination across landowners and jurisdictions.
Forests
An extensive literature review on fuel treatment in forests prepared for the Fourth Assessment concludes that practices that reduce stand density and restore beneficial fire can improve climate resilience, reduce the likelihood of severe wildfires, and minimize the long-term carbon losses from forested areas (Moghaddas et al., 2018). This approach aligns with the State’s recently completed Forest Carbon Plan, which recognizes that fuel reduction, thinning, and the use of prescribed fire is currently insufficient to restore forest health. The Plan identifies the need for partnership with private and federal landowners and tribes to achieve forest health objectives, and to use regional and landscape-scale approaches to improve forest health (CNRA, 2017).

Fourth Climate Change Assessment Statewide Summary Report | 81
CALIFORNIA’S FOURTH
CLIMATE CHANGE ASSESSMENT
Ocean and Coast
Studies prepared for the Fourth Assessment examine several dimensions of adaptation and resilience for California’s coasts and ocean.
Sea-Level Rise: Coastal and ocean monitoring and observation systems have allowed the documentation and quantification of ongoing climate-related changes, such as increases in ocean temperature and acidity, or more frequent and extensive harmful algal blooms. These monitoring systems are critical to illuminate the effects of compounding climate impacts. Continuing to monitor these and other environmental indicators will also expand the ability to track the extent of climate change impacts, enabling the state to respond with appropriate and timely mitigation and adaptation measures.
The U.S. Geological Survey (USGS) developed the Hazard Exposure and Analytics (HERA) tool, which allows visualization of the sea-level impacts estimated with CoSMoS, and also uses socio-economic data to estimate the number of people that would be affected by SLR, the infrastructure at risk, the replacement costs of residential and commercial buildings, and the roads that would be affected. Furthermore, the option to download scenario data at local, regional, or statewide levels makes HERA a useful planning tool for the exploration of practical adaptation measures (Erikson et al., 2018). This tool is used in a Fourth Assessment study to estimate impacts based on the projections of shoreline changes from the updated CoSMoS model and implemented for Southern California (Erikson et al., 2018). There are plans to use the updated CoSMoS model developed for the Fourth Assessment to estimate shoreline changes for the rest of this century for other coastal areas in California.
Another Fourth Assessment study conducted a new survey as part of a longitudinal study of coastal managers. The survey results show that SLR has become the dominant concern for coastal managers, followed by water quality concerns (Moser et al., 2018), and that funding and financing is a major barrier to action. While there remain additional challenges and barriers to preparing for and adapting to climate impacts, there are adaptation efforts underway in California.
Ocean Acidification and Hypoxia: Researchers at the state and federal level have identified indicator species that might be most sensitive to ocean acidification and declining dissolved oxygen in order to assist in planning for these phenomena. These preliminary indicator species can be employed for biological and chemical monitoring. For example, the Ocean Climate Indicators report summarizes potential indicator species for North-Central California (Duncan et al., 2014). Potential indicator species (mussels, oysters, and small plankton that form the base of the food web (pteropods)) have also been reviewed in the Indicators of Climate Change in California report by California’s Office of Environmental Health and Hazard Assessment (OEHHA, 2018).
A recent study completed as part of the Fourth Assessment suggests a promising role for California mussels (Mytilus californianus) to serve as bio-indicators of ocean acidification in California’s coastal waters (Gaylord et al., 2018). Controlling or reducing nutrient runoff from sewage disposal and agricultural fertilizers can also help mitigate ocean acidification, as can the restoration of marine plants and seaweeds in coastal environments. These systems also provide other important benefits, such as carbon storage. Because of the important functions of coastal habitat, protection, preservation, and restoration remain important goals (Nielsen et al. 2018).
Fourth Climate Change Assessment Statewide Summary Report | 82
CALIFORNIA’S FOURTH
CLIMATE CHANGE ASSESSMENT
Chapter 4: Research Needs
he Fourth Assessment extends and builds on previous assessments and recent literature, demonstrating that California is already experiencing the effects of climate change and that these impacts will increase in magnitude over the coming century. While the magnitude of these impacts will be determined by the future accumulation of global GHG emissions, some amount of change is inevitable and is already being
experienced. Franco et al.’s (2018) analysis of the impact of stabilization pathways for California reiterates that accelerated efforts to reduce GHG emissions must be made a priority both in California and across the globe. Furthermore, understanding the extent to which adaptation measures can decrease the potential economic costs of climate change (see Table 6) – even given their own implementation costs – is a critical emerging area of research at local, state, national, and international scales.
While the Fourth Assessment improves understanding of climate impacts and potential adaptation approaches, it also reveals areas where additional research and investigation is needed. These research needs span natural and social sciences. Therefore, alongside efforts to address climate change, it is important that the State continue to invest in research. This chapter highlights some key areas for research and action that will facilitate translating the Fourth Assessment into action.
LAND USE, EXPOSURE, AND VULNERABILITY
The studies in the Fourth Assessment use a set of land use projections that consider high, medium, and low population sizes. However, they do not consider alternative development patterns and the effect of different development patterns on climate hazards, exposure, and vulnerability. Development patterns will affect GHG emissions and also exposure to climate risk. Additional research is needed to examine how different development patterns and densities affect future climate exposure and vulnerability.
IMPROVED SUPPORT AND INTEGRATION OF USER NEEDS
An important finding from several of the Fourth Assessment reports and in recent literature examining adaptation activity is that more information is needed to support action on the ground (Baker et al., 2018; Ekstrom et al., 2017; Moser & Ekstrom, 2012). However, earlier studies on barriers to adaptation have identified that there are many obstacles to adaptation, not only a lack of information. These include governance, political attitudes, financing, and leadership (Moser & Ekstrom, 2012). As part of the Fourth Assessment, Moser et al. (2018) show that funding and financing challenges are among the top barriers to adaptation, but that these are affected by a number of other non-financial factors. Furthermore, several studies show that less populated and rural institutions generally lag behind actors in larger urbanized areas (Ekstrom et al., 2018; Moser & Finzi-Hart, 2018).
Looking ahead, increased attention must be paid to bridging the gap between researchers and practitioners. This should include increased efforts to test and implement models of co-production (Vogel et al., 2016), as well as the use of tools like robust decision making (Sriver et al., 2018) and risk management under high uncertainty (Kunreuther et al., 2013) that engage decision-makers to better understand uncertainty and how climate change will affect outcomes over a range of future climate scenarios. Experiments and pilots that explore learning by doing should also be supported. An example of this type of work is the California Department of Fish and Wildlife’s climate risk assessment for California’s
T

Fourth Climate Change Assessment Statewide Summary Report | 83
CALIFORNIA’S FOURTH
CLIMATE CHANGE ASSESSMENT
vegetation. The study was co-developed by University and natural resource management agencies and is being used for planning purposes within the agency (Thorne et al., 2016; Thorne, Choe, Boynton, et al., 2017).
Continued investment and engagement around Cal-Adapt is one pathway for reaching practitioners, as is continued investment and engagement around the regional and synthesis reports prepared as part of the Fourth Assessment. Increased investment in tools and approaches that support interaction and coordination across decision-makers and researchers will help as well.
Research is also needed to better understand adaptation approaches (including public-private cooperation) in mitigating the effects of climate change, as well as socio-technological strategies for adaptation. These strategies should include an evaluation of equity outcomes, and coordination between public agencies and private landowners in developing planning and designing policies.
CLIMATE JUSTICE, TRIBAL COMMUNITIES, AND ENGAGEMENT
Climate justice is a priority for the State’s climate change programs. However, additional research, engagement, and partnerships are needed to understand the distribution of climate impacts and experience of climate change on disadvantaged and vulnerable communities, as well as how to integrate needs of these communities and populations into planning. For instance, in the agricultural sector, a Fourth Assessment report demonstrates that seasonal and migrant farmworkers are neglected in climate vulnerability and adaptation plans (Greene, 2018). A few studies have looked at barriers to disaster preparedness and recovery for Latino and undocumented farmworkers (Burke et al., 2012; Orozco, 2010), but these studies are limited.
Additional research and partnerships are especially critical to engage with tribal communities in California. Up to this point, the State’s climate change assessments have not worked with tribes or addressed research questions focused on tribes. Additional work is also needed to better understand and account for Traditional Ecological Knowledge in the design of climate solutions. There is a particular need for a comprehensive assessment, led by tribes, to understand climate impacts on tribal lands, tribal engagement and partnerships in crafting and implementing adaptation projects, and to build tribal capacity to play an appropriate role in ecosystem management. Such an assessment would also provide opportunity for stronger partnership between tribal and non-tribal actors to learn from traditional tribal ecosystem management. Additional research is also needed on tribal-specific adaptation strategies in the context of the legal, cultural, and political considerations specific to tribal communities. Investments are needed to develop documentation and case studies of integration of Traditional Ecological Knowledge and collaborative approaches to support climate resilience. Finally, data that can be utilized by tribes are needed to support adaptation.
CLIMATE, WATER, AND PEOPLE
Research on the vulnerability, adaptive capacity, and potential impacts of climate-related hydrological stressors for disadvantaged communities needs significant advancement. For example, approaches to studying variable levels of preparedness, adaptive capacity, and impacts will need to be specific to the communities under consideration. Advances in social science research highlight the need for context- and community-specific studies to discern variable levels of exposure to and preparedness against climate change impacts, as well as adaptive capacity. While
Fourth Climate Change Assessment Statewide Summary Report | 84
CALIFORNIA’S FOURTH
CLIMATE CHANGE ASSESSMENT
small water system providers need assistance with climate adaptation, they may require different approaches than what are provided to larger systems (Ekstrom et al., 2018). In addition, there should be a focus on the common disadvantages that hinder drought resilience, such as limited staff capacity, financial burdens, and outreach challenges.
Furthermore, responses to water vulnerability can vary even in the same location and may have uneven impacts on different groups and between urban and rural areas. For example, in a Fourth Assessment report focused on drought in the San Joaquin Valley, Greene (2018) observes that the short-term response of farmers (increased groundwater pumping and switching to low-labor crops) helped them survive the drought, but it exacerbated the insecurity of farmworkers and rural communities. Greene’s (2018) study suggests that technical solutions to drought need to first consider the differing social and environmental causes of vulnerability across communities.
IMPROVED ACCOUNTING OF CO-BENEFITS
California has placed a priority on implementing adaptation solutions that also support reducing GHG emissions. Several studies show that climate actions can result in a range of additional benefits (e.g., Zapata et al., 2018 for public health). Developing more robust tools and techniques to quantify and account for the multiple benefits of climate actions can be helpful to address a range of future concerns, including climate justice issues. A “multiple-benefit” approach can provide opportunities for funding of climate-related projects and actions from multiple sources. This can also apply to marine and coastal ecosystems, as additional research is needed to understand where carbon storage and ocean acidification amelioration potential may be greatest within the variety of physical environments along California’s coast. A guide to some methods for accounting for co-benefits has been assembled by the California Air Resources Board.20
INTERCONNECTION AND CASCADING EFFECTS
Fourth Assessment funded research — in addition to other recent literature — advances our understanding of potential pathways for the future energy system and the vulnerabilities of the current and future system to the effects of climate change. However, these studies also identify new or emerging knowledge gaps for future research to address. Studying the energy sector or subsectors of the energy system provides a partial view of real-world vulnerabilities. More integrated studies are required to determine potential modes of failure when considering the interconnection between energy and telecommunications, transportation, and other sectors (Moser & Finzi-Hart, 2018; Radke et al., 2018). This includes exploring the likelihood of cascading infrastructure effects and their prevention in other sectors (e.g., roads, bridges, and drainage), and then integrating the results in macroeconomic models to capture the indirect economic effects of diverting GDP-enhancing capital investments toward climate defensive infrastructure (Neumann et al., 2015; Roe & Schulman, 2015).
Similarly, infrastructure system changes do not occur in a vacuum; the actions of people are closely tied to the technical characteristics of their energy systems (see, e.g., Rutherford & Coutard, 2014). Future transitions in the energy systems are highly social as well as technical; energy users are critical to the evolution of demand, supply,
20 https://ww2.arb.ca.gov/resources/documents/cci-co-benefit-assessment-methodologies
Fourth Climate Change Assessment Statewide Summary Report | 85
CALIFORNIA’S FOURTH
CLIMATE CHANGE ASSESSMENT
efficiency, infrastructure, and the built environment. Energy users are also central players in adaptation, resilience, and coping with the effects of environmental and technical change. Research that synchronizes attention to the social in combination with the technical, environmental, and economic will be required for successful transition planning and implementation. Attention to distributional interactions, emergent creativity, and the physical, emotional, and economic well-being of individuals and groups will also be necessary. This will require nuanced analyses moving beyond the consumer-centered studies that have dominated this research field to date (Moezzi et al., 2018).
HIGH-RESOLUTION CLIMATE DATA AND PROJECTION NEEDS
In many sectors, data are needed at a scale that is relevant for planning and decision-making, which may extend beyond the resources provided by Cal-Adapt. For example, spatially downscaled results can be used to measure the cumulative exposure to transportation infrastructure, such as roads, rail, and bridges, within physiographic sub-regions—such as a watershed—and administrative or political regions in order to assess potential impacts and cost-effective adaptation (Neumann et al., 2015).
More research is needed on downscaled sea-level rise projections, particularly for the inland impacts of SLR. The Delta’s vulnerability to climate change and SLR, and required adaptation, are of critical importance. For smaller flood events, SLR has a large effect on water surface elevation in locations further downstream in the Delta. In the Fourth Assessment, Maendly (2018) shows that for larger flood events, the effect of sea-level rise diminishes because flood-flows drive the water surface elevations. Additional research and action are needed to increase understanding of the Delta’s vulnerabilities to changes in climatic condition.
In the case of wildfire, climate change is affecting the drivers of fire behavior in novel ways, and this report highlights uncertainties around wildfire projections under climate change. Research is needed to better understand how the unprecedented tree mortality during the 2012-2016 drought has changed fuel conditions and fire response. In addition, researchers have reached different conclusions about the effect of climate change on wind regimes, particularly on extreme wind events such as the Santa Ana and Diablo winds that create many of the most devastating wildfires in the state. These changing factors have not been adequately incorporated into wildfire risk analysis.
Wildfire projections in the Fourth Assessment explicitly focused on the likelihood and size of fires in forest, shrubland, and grassland, and do not address fire spreading into developed areas or the Wildland-Urban Interface. As seen in 2017, the most costly wildfire damage occurred in developed areas like Santa Rosa and Montecito. More work is needed to incorporate new knowledge into wildfire risk modeling to simulate both near-term risk when red flag conditions are approaching, and long-term risk for assessing vulnerability to the grid and other critical assets that need to be powered during emergencies (e.g., hospitals, fire stations), so that adaptation measures can be implemented.
INTEGRATION OF CLIMATE CHANGE INTO CONSERVATION PLANNING
As the climate changes, California needs to improve its understanding of how climate change will affect strategies and investments in conservation. In the discussion of forest health, biodiversity and ecosystems, and California’s ocean and coast, important questions were identified about how well suited current conservation areas are to future climate conditions. More work is needed to identify what types of landscape connectivity projects will be most effective

Fourth Climate Change Assessment Statewide Summary Report | 86
CALIFORNIA’S FOURTH
CLIMATE CHANGE ASSESSMENT
for enabling species movements, and more systematic work is needed to consider the range of land management techniques available and where they might be applied to promote ecosystem resilience. Furthermore, better quantification of the value of ecosystem services provided by natural systems, and the potential benefits of improving ecosystem processes such as carbon sequestration on working lands, could help incentivize conservation projects.
Marine and Aquatic Species and Conservation
Additional research is needed to enable sustainable fisheries in California waters. A clearer understanding of the oceanic conditions that are affecting individual commercial or recreational fish or shellfish species can provide better guidance for management agencies on establishing harvest quotas. One of the goals of California’s Marine Protected Areas (MPAs) is to protect the diversity and function of marine life and ecosystems. In fact, the adaptive value of California’s network of MPAs to conserve marine natural heritage and biodiversity in the face of climate change may be more important than previously appreciated. Recent research has revealed a relatively persistent spatial mosaic of exposure risk to increasing ocean acidity (Chan et al., 2017), raising questions about whether California’s MPA network is optimally configured to provide genetic adaptation benefits.
Additional research is needed on the biology and status of native fishes and invertebrates, and the ‘health’ of aquatic ecosystems throughout California. A statewide strategy for protecting and managing the state’s highly endemic and highly endangered aquatic biota is needed, with immediate implementation. The work of Howard et al. (2018) provides a step toward this goal.
Adaptive Forest Management
Research is also needed to understand the potential tradeoffs between forest management approaches and outcomes, including for species living in forests. One key research need is evaluating performance metrics for forest restoration under climate change. For example, forests are valued for their role in sequestering carbon in California (e.g., Battles et al., 2018; Moghaddas et al., 2018), but it is not clear what priority maximizing carbon should be for management under changing climate conditions (e.g., Campbell et al., 2012; Hurteau & Brooks, 2011). Another area for research is identification and evaluation of tradeoffs in the use of prescribed fire, which is increasingly promoted as a tool for forest management (e.g., Moritz et al., 2014; North et al., 2015; Stephens et al., 2018). However, better characterization and analysis of the health effects and general discomfort of nearby populations in response to this strategy is needed (White et al., 2017). Research is also needed to better determine seed collection and planting location in forest restoration under a changing climate, including the potential for assisted migration.
INNOVATIVE APPROACHES TO BUILDING RESILIENCE
Increasingly, adaptation and resilience solutions are taking a more integrated approach that considers how climate change will affect systems, or the networks that connect people, infrastructure, and nature. Designing and supporting adaptation strategies requires understanding not just the magnitude of the effect, but also the social and material dimensions of that change. For example, Moser and Finzi-Hart (2015) identify societal teleconnections as an important factor in how climate risks are experienced. Societal teleconnections are institutional relationships that propagate risk in space and time. These connections include institutional agreements, social contracts, and interpersonal relationships. In the Fourth Assessment, Moser and Finzi-Hart (2018) explore how such

Fourth Climate Change Assessment Statewide Summary Report | 87
CALIFORNIA’S FOURTH
CLIMATE CHANGE ASSESSMENT
teleconnections affect lifeline services in Los Angeles, illustrating how a shock event can ripple through a region, and the importance of recognizing these relationships.
Following Hurricane Sandy, the U.S. Department of Housing and Urban Development (HUD) worked with the Rockefeller Foundation to support Rebuild by Design, a competition to support resilient recovery in the affected region. The design-based approach is built on the interconnections across infrastructure, nature, and people. This approach has been employed in other contexts including the San Francisco Bay Area (Resilient by Design), and in a HUD-winning project being implemented in Tuolumne County to support resilient recovery after the 2013 Rim Fire. Additional investment and support for design-based approaches to building resilience are needed to better understand and identify opportunities to achieve multiple benefits and leverage funding sources.

Fourth Climate Change Assessment Statewide Summary Report | 88
CALIFORNIA’S FOURTH
CLIMATE CHANGE ASSESSMENT
Conclusion: Assessment to Action alifornia’s Climate Change Assessments are developed to support the design, implementation, and evaluation of climate change policies and programs. The Fourth Assessment was designed to support adaptation and resilience activities, and the results will support several initiatives.
Cal-Adapt and Visualization Tools
The Fourth Assessment includes several projects designed to improve access and presentation of climate impact information in a manner that supports planning and decision-making. This includes Cal-Adapt, the State’s online portal for accessing climate projection data at a scale relevant for decision makers. Fourth Assessment funds supported the further development of Cal-Adapt to include all of the new projection data developed for the Fourth Assessment (Thomas et al., 2018). The Fourth Assessment also includes further development of the CoSMoS model to better understand the impacts of sea-level rise and storms along the California Coast (Erikson et al., 2018). With investment from the Fourth Assessment, CoSMoS now provides information for all major urban areas along the California coast.
Several State guidance documents already direct users to Cal-Adapt and/or CoSMoS to gather climate change data, including the General Plan Guidelines,21 Planning and Investing for a Resilient California,22 and the Adaptation Planning Guide.23 The importance of these tools for practitioners will increase as more planning and investment processes integrate climate change considerations.
ResilientCA.org
Through the Integrated Climate Adaptation and Resiliency Program, the Governor’s Office of Planning and Research has developed an Adaptation Clearinghouse, resilientca.org, to support a community of practice across the state on resilience and adaptation decision-making. The Clearinghouse provides access to climate data and tools, including Cal-Adapt and CoSMoS, guidance documents, and case studies. It allows users to access information by sector, climate impact, and geographic location. The portal will continue to develop as new resources are available and additional information is gathered on user needs.
Climate-Smart Infrastructure (AB 2800)
The Climate-Smart Infrastructure Workgroup has produced a report outlining actions and information needed to design infrastructure that will be resilient in the face of future climate conditions. The results of the Fourth Assessment will support the implementation of Assembly Bill 2800 by providing downscaled climate variables and tools such as Cal-Adapt and CoSMoS. Taken together, the Fourth Assessment and the Climate-Smart Infrastructure report will support the development of climate-ready building and engineering standards.
C
21 http://opr.ca.gov/planning/general-plan/
22 http://opr.ca.gov/docs/20180313-Building_a_Resilient_CA.pdf
23 http://resources.ca.gov/climate/safeguarding/local-action/

Fourth Climate Change Assessment Statewide Summary Report | 89
CALIFORNIA’S FOURTH
CLIMATE CHANGE ASSESSMENT
Continued Assessment and Progress Evaluation
As noted at the outset of this report, research investment has been an integral element of California’s climate change program since its inception. The climate change assessment process has been developed to support policy design and implementation. Maintaining the Assessment process, both through continued investment and through engagement with planners and decision makers, is critical to ensure that the Assessment will be translated into climate action.
As this Fourth Assessment is concluding, work is already underway to identify opportunities and needs for California’s Fifth Climate Change Assessment. Throughout this process, engagement must go hand in hand with continued evaluation of progress, challenges, and information gaps and needs. Regular monitoring of State activities through the implementation of Safeguarding California and of State, local, and regional actions through the Integrated Climate Adaptation and Resiliency Program should also be used to inform future research and assessment investments. This integration will help to ensure that information will most effectively be translated into action.
Fourth Climate Change Assessment Statewide Summary Report | 90
CALIFORNIA’S FOURTH
CLIMATE CHANGE ASSESSMENT
Appendix A: Technical Reports and External Contributions to the Fourth Assessment
Ackerly, David, John Battles, Van Butsic, Patrick Gonzalez, Maggi Kelly, Whendee Silver, David Saah, Stefania Di Tommaso, Allegra Mayer, Diana Moanga, Isabel Schroeter, Bruce Riordan. (University of California, Berkeley). 2018. Land Acquisition and Ecosystem Carbon in Coastal California. California’s Fourth Climate Change Assessment. Publication number: CCCA4-EXT-2018-003.
AghaKouchak, Amir, Elisa Ragno, Charlotte Love, Hamed Moftakhari. (University of California, Irvine). 2018. Projected Changes in California’s Precipitation Intensity-Duration-Frequency Curves. California’s Fourth Climate Change Assessment, California Energy Commission. Publication number: CCCA4-CEC-2018-005.
Auffhammer, Maximilian. (University of California, Berkeley and NBER). 2018. Climate Adaptive Response Estimation: Short and Long Run Impacts of Climate Change on Residential Electricity and Natural Gas Consumption Using Big Data. California’s Fourth Climate Change Assessment. Publication number: CCCA4-EXT-2018-005.
Avanzi, Francesco, Tessa Maurer, Sami Malek, Steven D. Glaser, Roger C. Bales, Martha H. Conklin. (University of California, Berkeley and University of California, Merced). 2018. Feather River Hydrologic Observatory: Improving Hydrological Snowpack Forecasting for Hydropower Generation Using Intelligent Information Systems. California’s Fourth Climate Change Assessment, California Energy Commission. Publication number: CCCA4-CEC-2018-001.
Barnard, Patrick L., Li H. Erikson, Andrea O’Neill, Patrick Limber, Sean Vitousek, Juliette Finzi Hart, Maya Hayden, Jeanne Jones, Nathan Wood, Michael Fitzgibbon, Amy Foxgrover, Jessica Lovering. (U.S. Geological Survey and Point Blue Conservation Science). 2018. Assessing and Communicating the Impacts of Climate Change on the Southern California Coast. California’s Fourth Climate Change Assessment, California Natural Resources Agency. Publication number: CCCA4-CNRA-2018-013.
Battles, John, David Bell, Robert Kennedy, David Saah, Brandon Collins, Robert York, John Sanders. (University of California, Berkeley). 2018. Innovations in Measuring and Managing Forest Carbon Stocks in California. California’s Fourth Climate Change Assessment, California Natural Resources Agency. Publication number: CCCA4-CNRA-2018-014.
Brooks, Benjamin, Jennifer Telling, Todd Ericksen, Craig L. Glennie, Noah Knowles, Dan Cayan, Darren Hauser, Adam LeWinter. (U.S. Geological Survey). 2018. High Resolution Measurement of Levee Subsidence Related to Energy Infrastructure in the Sacramento-San Joaquin Delta. California’s Fourth Climate Change Assessment, California Energy Commission. Publication number: CCCA4-CEC-2018-003.
Bruzgul, Judsen, Robert Kay, Andy Petrow, Beth Rodehorst, Dave Revell, Maya Bruguera, Dan Moreno, Ken Collison. (ICF and Revell Coastal). 2018. Rising Seas and Electricity Infrastructure: Potential Impacts and Adaptation Actions for San Diego Gas & Electric. California’s Fourth Climate Change Assessment, California Energy Commission. Publication number: CCCA4-CEC-2018-004.
Bruzgul, Judsen, Robert Kay, Andy Petrow, Beth Rodehorst, David Revell, Maya Bruguera, Tommy Hendrickson, Kevin Petak, Dan Moreno, Julio Manik. (ICF and Revell Coastal). 2018. Potential Climate Change Impacts and Adaptation Actions for Gas Assets in the San Diego Gas and Electric Company Service Area. California’s Fourth Climate Change Assessment, California Energy Commission. Publication number: CCCA4-CEC-2018-009.
Burillo, Daniel, Mikhail Chester, Stephanie Pincetl, Eric Fournier, Katharine Reich, Alex Hall. (University of California Los Angeles). 2018. Climate Change in Los Angeles County: Grid Vulnerability to Extreme Heat. California’s Fourth Climate Change Assessment, California Energy Commission. Publication number: CCCA4-CEC-2018-013.
Fourth Climate Change Assessment Statewide Summary Report | 91
CALIFORNIA’S FOURTH
CLIMATE CHANGE ASSESSMENT
Dale, Larry, Michael Carnall, Gary Fitts, Sarah Lewis McDonald, Max Wei. (Lawrence Berkeley National Laboratory). 2018. Assessing the Impact of Wildfires on the California Electricity Grid. California’s Fourth Climate Change Assessment, California Energy Commission. Publication number: CCCA4-CEC-2018-002.
Dias, Daniela F., Daniel R. Cayan, Alexander Gershunov. (Scripps Institution of Oceanography, University of California, San Diego). 2018. Statistical Prediction of Minimum and Maximum Air Temperature in California and Western North America. California’s Fourth Climate Change Assessment, California Energy Commission. Publication number: CCCA4-CEC-2018-011
Dixon, Lloyd, Flavia Tsang, Gary Fitts. (GreenwareTech and RAND Corporation). 2018. The Impact of Changing Wildfire Risk on California’s Residential Insurance Market. California’s Fourth Climate Change Assessment, California Natural Resources Agency. Publication number: CCCA4-CNRA-2018-008.
Ekstrom, Julia A., Meghan R. Klasic, Amanda Fencl, Mark Lubell, Ezekiel Baker, Frances Einterz. (University of California, Davis). 2018. Drought Management and Climate Adaptation among Small, Self-Sufficient Water Systems in California. California’s Fourth Climate Change Assessment, California Natural Resources Agency. Publication number: CCCA4-CNRA-2018-004.
Flint, L., Flint, A., Stern, M., Mayer, A., Vergara, S., Silver, W., Casey, F., Franco, F., Byrd, K., Sleeter, B., Alvarez, P., Creque, J., Estrada, T., Cameron, D. (U.S. Geological Survey). 2018. Increasing Soil Organic Carbon to Mitigate Greenhouse Gases and Increase Climate Resiliency for California. California’s Fourth Climate Change Assessment, California Natural Resources Agency. Publication number: CCCA4-CNRA-2018-006.
Franco, Guido, Daniel R. Cayan, David W. Pierce, Anthony L. Westerling, James H. Thorne. (California Energy Commission). 2018. Cumulative Global CO2 Emissions and their Climate Impacts from Local through Regional Scales. California’s Fourth Climate Change Assessment. Publication number: CCCA4-EXT-2018-007.
Gaylord, Brian, Emily Rivest, Tessa Hill, Eric Sanford, Priya Shukla, Aaron Ninokawa. (Bodega Marine Laboratory, University of California, Davis). 2018. California Mussels as Bio-Indicators of the Ecological Consequences of Global Change: Temperature, Ocean Acidification, and Hypoxia. California’s Fourth Climate Change Assessment, California Natural Resources Agency. Publication number: CCCA4-CNRA-2018-003.
Green Nylen, Nell, Michael Kiparsky, Dave Owen, Holly Doremus, Michael Hanemann. (University of California, Berkeley). 2018. Addressing Institutional Vulnerabilities in California’s Drought Water Allocation, Part 2: Improving Water Rights Administration and Oversight for Future Droughts. California’s Fourth Climate Change Assessment, California Natural Resources Agency. Publication number: CCCA4-CNRA-2018-010.
Green Nylen, Nell, Michael Kiparsky, Dave Owen, Holly Doremus, Michael Hanemann. (University of California, Berkeley). 2018. Addressing Institutional Vulnerabilities in California’s Drought Water Allocation, Part 1: Water Rights Administration and Oversight During Major Statewide Droughts, 1976–2016. California’s Fourth Climate Change Assessment, California Natural Resources Agency. Publication number: CCCA4-CNRA-2018-009.
He, Minxue, Andrew Schwarz, Elissa Lynn, Michael Anderson (California Department of Water Resources). 2018. Projected Changes in Precipitation, Temperature, and Drought across California’s Hydrologic Regions. California’s Fourth Climate Change Assessment. Publication number: CCCA4-EXT-2018-002.
Herman, J., M. Fefer, M. Dogan, M. Jenkins, J. Medellín-Azuara, J. Lund. (University of California, Davis). 2018. Advancing Hydro-Economic Optimization to Identify Vulnerabilities and Adaptation Opportunities in California’s Water System. California’s Fourth Climate Change Assessment, California Natural Resources Agency. Publication number: CCCA4-CNRA-2018-016.

Fourth Climate Change Assessment Statewide Summary Report | 92
CALIFORNIA’S FOURTH
CLIMATE CHANGE ASSESSMENT
Jennings, M.K., D. Cayan, J. Kalansky, A.D. Pairis, D.M. Lawson, A.D. Syphard, U. Abeysekera, R.E.S. Clemesha, A. Gershunov, K. Guirguis, J.M. Randall, E.D. Stein, S. Vanderplank. (San Diego State University). 2018. San Diego County Ecosystems: Ecological Impacts Of Climate Change On A Biodiversity Hotspot. California’s Fourth Climate Change Assessment. Publication number: CCCA4-EXT-2018-010.
Kay, Robert, Kif Scheuer, Brenda Dix, Maya Bruguera, Angela Wong, Julia Kim (ICF and Local Government Commission). 2018. Overcoming Organizational Barriers to Implementing Local Government Adaptation Strategies. California’s Fourth Climate Change Assessment, California Natural Resources Agency. Publication number: CCCA4-CNRA-2018-005.
Keeley A.T.H., D. Ackerly, G. Basson, D.R. Cameron, L. Hannah, N.E. Heller, P.R. Huber, P.R. Roehrdanz, C.A. Schloss, J.H. Thorne, S. Veloz, A.M. Merenlender. (University of California, Berkeley). 2018. Migration Corridors as Adaptation to Climate Change: Why, How, and What Next. California’s Fourth Climate Change Assessment, California Natural Resources Agency. Publication number: CCCA4-CNRA-2018-001.
Langridge, Ruth, Stephen Sepaniak, Amanda Fencl, Linda-Estelí Méndez (University of California, Santa Cruz). 2018. Adapting to Climate Change and Drought in Selected California Groundwater Basins: Local Achievements and Challenges, California’s Fourth Climate Change Assessment. Publication number: CCCA4-EXT-2018-006.
LaTourrette, Tom, Andrew Lauland, Jordan Fischbach, Neil Berg, Chuck Stelzner. (RAND Corporation). 2018. Assessing Vulnerability and Improving Resilience of Critical Emergency Management Infrastructure in California in a Changing Climate. California’s Fourth Climate Change Assessment, California Natural Resources Agency. Publication number: CCCA4-CNRA-2018-015.
Maendly, Romain. (California Department of Water Resources). 2018. Development of Stage-Frequency Curves in the Sacramento – San Joaquin Delta for Climate Change and Sea Level Rise. California’s Fourth Climate Change Assessment. Publication number: CCCA4-EXT-2018-011.
Medellin-Azuara, Josue, Daniel A. Sumner, Qianyao Yolanda Pan, Hyunok Lee, Victoria Espinoza, Andrew Bell, Selina Davila Olivera, Jonathan Herman, Jay R. Lund. (University of California, Davis and University of California, Merced). 2018. Economic and Environmental Implications of California Crop and Livestock, Adaptation to Climate Change. California Natural Resources Agency. Publication number: CCCA4-CNRA-2018-018.
Moezzi, Mithra, Loren Lutzenhiser, Aaron Ingle, and Harold Wilhite. (QQForward). 2018. Sixteen Ways Energy Efficiency Researchers See People + Why it Matters for Climate Change. California’s Fourth Climate Change Assessment. Publication number: EXT-CCC4A-2018-008.
Moghaddas, Jason, Gary Roller, Jonathan Long, David Saah, Max Moritz, Dan Stark, David Schmidt, Thomas Buchholz, Travis Freed, Erin Alvey, John Gunn. (Spatial Informatics Group). 2018. Fuel Treatment for Forest Resilience and Climate Mitigations: A Critical Review for Coniferous Forests of the Sierra Nevada, Southern Cascade, Coast, Klamath, and Transverse Ranges. California Natural Resources Agency. Publication number: CCCA4-CNRA-2018-017.
Moser, Suzanne and Juliette Finzi Hart. (Susanne Moser Research & Consulting and U.S. Geological Survey). 2018. The Adaptation Blind Spot-Electrical Grid Teleconnected and Cascading Climate Change Impacts on Community Lifelines in Los Angeles. California’s Fourth Climate Change Assessment, California Energy Commission. Publication number: CCCA4-CEC-2018-008.
Moser, S.C., J.A. Ekstrom, J. Kim, S. Heitsch. (Susanne Moser Research & Consulting). 2018. Adaptation Finance Challenges: Characteristic Patterns Facing California Local Governments and Ways to Overcome Them. California’s Fourth Climate Change Assessment, California Natural Resources Agency. Publication number: CCCA4-CNRA-2018-007.
Moser, Susanne, Juliette Finzi Hart, Alyssa Newton Mann, Nick Sadrpour, Phyllis Grifman. (Susanne Moser Research & Consulting and U.S. Geological Survey). 2018. Growing Effort, Growing Challenge: Findings from the 2016 CA Coastal Adaptation Needs Assessment Survey. California’s Fourth Climate Change Assessment. Publication number: CCCA4-EXT-2018-009.

Fourth Climate Change Assessment Statewide Summary Report | 93
CALIFORNIA’S FOURTH
CLIMATE CHANGE ASSESSMENT
Newkirk, Sarah, Sam Veloz, Maya Hayden, Walter Heady, Kelly Leo, Jenna Judge, Robert Battalio, Tiffany Cheng, Tara Ursell, Mary Small. (The Nature Conservancy and Point Blue Conservation Science). 2018. Toward Natural Infrastructure to Manage Shoreline Change in California. California’s Fourth Climate Change Assessment, California Natural Resources Agency. Publication number: CCCA4-CNRA-2018-011.
Pierce, David W., Daniel R. Cayan, Julie F. Kalansky. (Scripps Institution of Oceanography). 2018. Climate, Drought, and Sea Level Rise Scenarios for the Fourth California Climate Assessment. California’s Fourth Climate Change Assessment, California Energy Commission. Publication number: CCCA4-CEC-2018-006.
Radke, J.D, G.S. Biging, K. Roverts, M. Schmidt-Poolman, H. Foster, E. Roe, Y. Ju, S. Lindbergh, T. Beach, L. Maier, Y. He, M. Ashenfarb, P. Norton, M. Wray, A. Alruheil, S. Yi, R. Rau, J. Collins, D. Radke, M. Coufal, S. Marx, D. Moanga, V. Ulyashin, A. Dalal. (University of California, Berkeley). 2018. Assessing Extreme Weather-Related Vulnerability and Identifying Resilience Options for California’s Interdependent Transportation Fuel Sector. California’s Fourth Climate Change Assessment, California Energy Commission. Publication Number: CCCA4-CEC-2018-012.
Schwarz, Andrew, Patrick Ray, Sungwook Wi, Casey Brown, Minxue He, Matthew Correa. (California Department of Water Resources). 2018. Climate Change Risks Faced by the California Central Valley Water Resource System. California’s Fourth Climate Change Assessment. Publication number: CCCA4-EXT-2018-001.
Silver, Whendee, Sintana Vergara, Allegra Mayer. (University of California, Berkeley). 2018. Carbon Sequestration and Greenhouse Gas Mitigation Potential of Composting and Soil Amendments on California’s Rangelands. California’s Fourth Climate Change Assessment, California Natural Resources Agency. Publication number: CCCA4-CNRA-2018-002.
Steinberg, Nik, Emilie Mazzacurati, Josh Turner, Colin Gannon, Robert Dickinson, Mark Snyder, Bridget Thrasher. (Four Twenty Seven and Argos Analytics). 2018. Preparing Public Health Officials for Climate Change: A Decision Support Tool. California’s Fourth Climate Change Assessment, California Natural Resources Agency. Publication number: CCCA4-CNRA-2018-012.
Taha, Haider, George Ban-Weiss, Sharon Chen, Haley Gilbert, Howdy Goudey, Joseph Ko, Arash Mohegh, Angie Rodriguez, Jonathan Slack, Tianbo Tang, Ronnen Levinson. (Lawrence Berkeley National Laboratory). 2018. Modeling and Observations to Detect Neighborhood-Scale Heat Islands and Inform Effective Countermeasures in Los Angeles. California’s Fourth Climate Change Assessment, California Energy Commission. Publication number: CCCA4-CEC-2018-007.
Thomas, Nancy, Shruti Mukhtyar, Brian Galey, Maggi Kelly. (University of California, Berkeley). 2018. Visualizing Climate-Related Risks to the Natural Gas System using Cal-Adapt. California’s Fourth Climate Change Assessment, California Energy Commission. Publication number: CCCA4-CEC-2018-015.
Wang, Jianzhong, Hongbing Yin, Erik Reyes, Tara Smith, Francis Chung (California Department of Water Resources). 2018. Mean and Extreme Climate Change Impacts on the State Water Project. California’s Fourth Climate Change Assessment. Publication number: CCCA4-EXT-2018-004.
Westerling, Anthony Leroy. (University of California, Merced). 2018. Wildfire Simulations for the Fourth California Climate Assessment: Projecting Changes in Extreme Wildfire Events with a Warming Climate. California’s Fourth Climate Change Assessment, California Energy Commission. Publication number: CCCA4-CEC-2018-014.
Zhenhai Zhang, Daniel R. Cayan, David W. Pierce. (Scripps Institution of Oceanography). 2018. Seasonal Temperature Forecast Skill over the California Region in NMME. California’s Fourth Climate Change Assessment, California Energy Commission. Publication number: CCCA4-CEC-2018-010.

Fourth Climate Change Assessment Statewide Summary Report | 94
CALIFORNIA’S FOURTH
CLIMATE CHANGE ASSESSMENT
Appendix B: Estimates of the Direct Economic Costs of Climate Change in California Order of magnitude estimation of economic damages to different economic activities in California by the middle of this century due to climate change
EFFECT OR
ACTIVITY
CLIMATE
DRIVERS
COSTS COMMENTS REFERENCES VALUE USED
IN TABLE 6 ($
BILLION)
Public Health: mortality
High temperatures
$50.3 to $84.8 billion in ~2050
Premature mortality due to increased ambient air temperatures. Assumes a value of statistical life of $7.5 million. An increased penetration of air conditioning units of about 20% from the baseline reduces mortality by 16% and 33% by 2025 and 2050, respectively, suggesting a high potential for adaptation. Mortality is a non-market impact, which is not part of the Gross Domestic Products (GDP). From Ostro et al. (2011): “These analyses indicate that for the high emissions scenario, the central estimate of annual premature mortality ranges from 2100 to 4300 for the year 2025 and from 6700 to 11,300 for 2050.”
Ostro et al., 2011
$50.00
Transportation (paving/asphalt)
Changes in temperature
~ $1 billion total in the 2040-2070 period
California’s median cost impact from failing to successfully adapt in terms of suitable asphalt/cement paving materials is estimated for the 2040-2070 period to range between ~$1 billion for RCP 4.5 to ~$1.25 billion for RCP 8.5. Annual impacts would be $1.30 billion.
Underwood et al., 2017
Energy (residential sector)
Changes in temperature
~ $0.51 billion/year (natural gas) About $0.65 billion/year (electricity)
Natural gas (NG) consumption would go down by 10.4% and electricity would go up by 4.2% by the middle of this century. In 2016, annual expenditures for NG and electricity for the residential sector were $4.88 and $15.36 billion, respectively. This calculation uses the 2015 expenditures and the estimated percent changes.
Auffhammer, 2018 (Table 4); EIA 2017
$0.14
Electricity System
Wildfires > $ 47 million per year
From 2001-2016, wildfires cost utilities over $700 million in damages to transmission and distribution infrastructure. The $47 million number per year assumes similar values in the future and no adaptation. We do not report this value in Table 6.
Dale et al., 2018
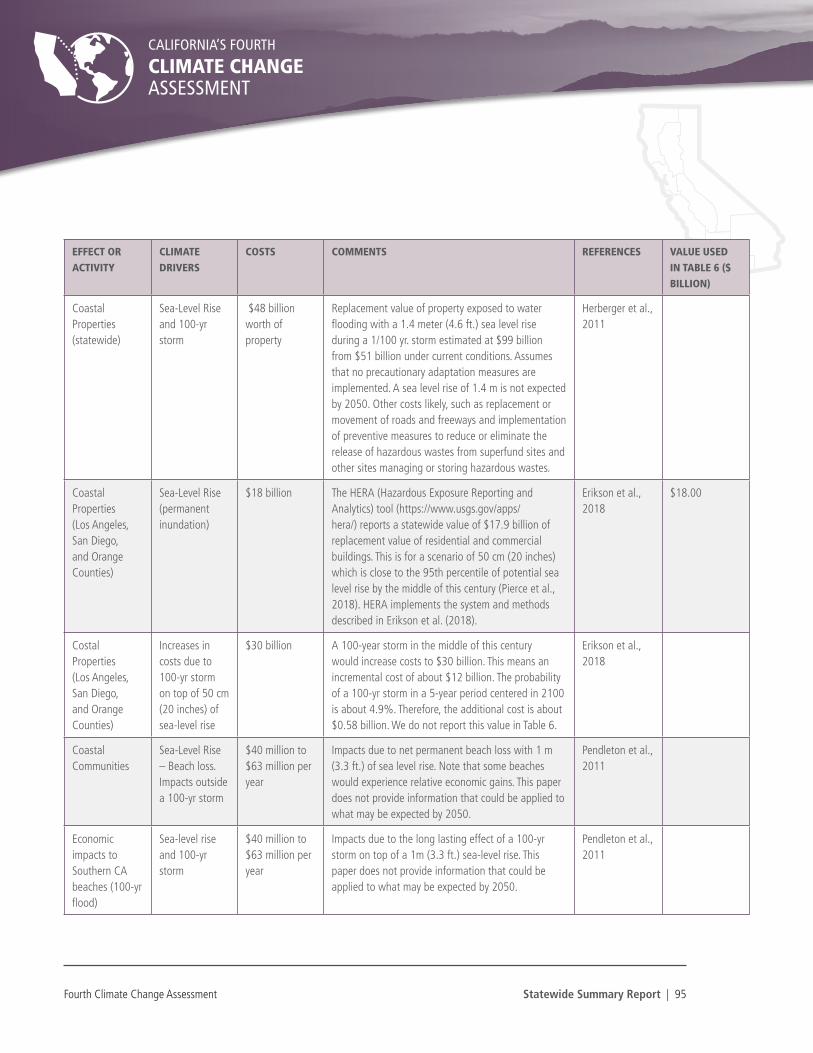
Fourth Climate Change Assessment Statewide Summary Report | 95
CALIFORNIA’S FOURTH
CLIMATE CHANGE ASSESSMENT
EFFECT OR
ACTIVITY
CLIMATE
DRIVERS
COSTS COMMENTS REFERENCES VALUE USED
IN TABLE 6 ($
BILLION)
Coastal Properties (statewide)
Sea-Level Rise and 100-yr storm
$48 billion worth of property
Replacement value of property exposed to water flooding with a 1.4 meter (4.6 ft.) sea level rise during a 1/100 yr. storm estimated at $99 billion from $51 billion under current conditions. Assumes that no precautionary adaptation measures are implemented. A sea level rise of 1.4 m is not expected by 2050. Other costs likely, such as replacement or movement of roads and freeways and implementation of preventive measures to reduce or eliminate the release of hazardous wastes from superfund sites and other sites managing or storing hazardous wastes.
Herberger et al., 2011
Coastal Properties (Los Angeles, San Diego, and Orange Counties)
Sea-Level Rise (permanent inundation)
$18 billion The HERA (Hazardous Exposure Reporting and Analytics) tool (https://www.usgs.gov/apps/hera/) reports a statewide value of $17.9 billion of replacement value of residential and commercial buildings. This is for a scenario of 50 cm (20 inches) which is close to the 95th percentile of potential sea level rise by the middle of this century (Pierce et al., 2018). HERA implements the system and methods described in Erikson et al. (2018).
Erikson et al., 2018
$18.00
Costal Properties (Los Angeles, San Diego, and Orange Counties)
Increases in costs due to 100-yr storm on top of 50 cm (20 inches) of sea-level rise
$30 billion A 100-year storm in the middle of this century would increase costs to $30 billion. This means an incremental cost of about $12 billion. The probability of a 100-yr storm in a 5-year period centered in 2100 is about 4.9%. Therefore, the additional cost is about $0.58 billion. We do not report this value in Table 6.
Erikson et al., 2018
Coastal Communities
Sea-Level Rise – Beach loss. Impacts outside a 100-yr storm
$40 million to $63 million per year
Impacts due to net permanent beach loss with 1 m (3.3 ft.) of sea level rise. Note that some beaches would experience relative economic gains. This paper does not provide information that could be applied to what may be expected by 2050.
Pendleton et al., 2011
Economic impacts to Southern CA beaches (100-yr flood)
Sea-level rise and 100-yr storm
$40 million to $63 million per year
Impacts due to the long lasting effect of a 100-yr storm on top of a 1m (3.3 ft.) sea-level rise. This paper does not provide information that could be applied to what may be expected by 2050.
Pendleton et al., 2011

Fourth Climate Change Assessment Statewide Summary Report | 96
CALIFORNIA’S FOURTH
CLIMATE CHANGE ASSESSMENT
EFFECT OR
ACTIVITY
CLIMATE
DRIVERS
COSTS COMMENTS REFERENCES VALUE USED
IN TABLE 6 ($
BILLION)
Water Supply Precipitation and temperature
From $0.1 to $1 billion per year
Water shortage costs strongly depend on average annual water availability, which this study varied from 0% to -30% relative to a historical baseline. Actual costs may be much higher. The model used for the study assumes close to perfect adaptation (e.g., perfect foresight). A version of the model with limited foresight estimate costs for the historical period that are 3 times the costs associated with the version of the model that assumes perfect foresight.
Herman et al., 2018
$1.00
Timberlands Temperature and precipitation
Decline of harvested timber value of 5% to 8% by 2100
The values depend strongly on the assumed market value of wood and how precipitation would change. The economic cost is about $3 billion by 2050 and $8 billion by 2080 assuming no adaptation.
Hannah et al., 2011
All economic sectors
Mega inland flooding
~ $42 billion Climate change would increase the probability of large storms potentially resulting in mega flooding conditions. The cost of a flooding event similar to the 1861-1862 flooding has been estimated at about $750 billion. According to Swain et al., there is a 50% chance to experience a similar event before 2060. The estimated cost depends on the probability of mega flood in a 5 year period centered in 2050, which is calculated assuming the following based on Figure 1c: linear probabilities per year of having an event (slope for the blue line in Figure 1c = 0.02807 events/yr.; baseline = 0.00526 events per year). The blue line represents a 50 percent change of an event. Therefore, the probability of having an event in a 5 year period is (0.02807 - 0.00526) *5*0.5 = 0.057 events that translates into a cost of $42 billion
Porter et al., 2011; Swain et al., 2018.
$42.00

Fourth Climate Change Assessment Statewide Summary Report | 97
CALIFORNIA’S FOURTH
CLIMATE CHANGE ASSESSMENT
EFFECT OR
ACTIVITY
CLIMATE
DRIVERS
COSTS COMMENTS REFERENCES VALUE USED
IN TABLE 6 ($
BILLION)
Ecosystem impacts and loss of biodiversity
All physical changes including sea level rise.
Unknown Some argue that it is impossible to estimate the value of ecosystems in monetary terms for both practical and ethical reasons. At the same time, some ecosystem impacts have been estimated elsewhere, although there are none yet in California.
Pope Francis, 2015; Neuteleers, & Engelen, 2014; Vucetich et al., 2014.
Other impacts* Reduced snowpack, increases in relative humidity, more wildfires, etc.
Unknown The scientific literature is thin on economic impacts with and without the consideration of adaptation. Other impacts not considered above include human morbidity, direct and indirect impacts of wildfires to the economy of the state, changes in outdoor recreational opportunities, water quality, etc.
Potential economic impacts of Water supply and agriculture reported together in Table 6. We report the estimated maximum impacts without considering the probability of experiencing very dry conditions by the middle of this century.
* Summer and winter recreation, human morbidity, relocation of roads, changes to ports and airports, reduced demand for space heating for the commercial and industrial sectors, increased energy demand for space cooling for commercial and industrial buildings, premature failure of equipment (e.g., electrical transformers), human mortality and morbidity due to exposure to pollutants from wildfires, etc.

Fourth Climate Change Assessment Statewide Summary Report | 98
CALIFORNIA’S FOURTH
CLIMATE CHANGE ASSESSMENT
References
Abatzoglou, J. T., & Williams, A. P. (2016). Impact of anthropogenic climate change on wildfire across western US forests. Proceedings of the National Academy of Sciences, 113(42), 11770–11775. https://doi.org/10.1073/pnas.1607171113
Ackerly, D., Battles, J., Butsic, V., Gonzalez, P., Kelly, M., Silver, W., … Riordan, B. (2018). Land Acquisition and Ecosystem Carbon in Coastal California. California’s Fourth Climate Change Assessment. Publication number: CCCA4-EXT-2018-003.
Ackerly, D., Loarie, D., Cornwell, S. R., Weiss, W. K., Hamilton, S. B., Branciforte, R., & Kraft, N. J. B. (2010). The geography of climate change: implications for conservation biogeography: Geography of climate change. Diversity and Distributions, 16(3), 476–487. https://doi.org/10.1111/j.1472-4642.2010.00654.x
Adger, W. N. (Ed.). (2006). Fairness in adaptation to climate change: edited by W. Neil Adger ... [et al.]. Cambridge, Mass: MIT Press.
Adger, W. N., Brown, K., Nelson, D. R., Berkes, F., Eakin, H., Folke, C., … Tompkins, E. L. (2011). Resilience implications of policy responses to climate change: Resilience implications of policy responses to climate change. Wiley Interdisciplinary Reviews: Climate Change, 2(5), 757–766. https://doi.org/10.1002/wcc.133
Adger, W. N., Huq, S., Brown, K., Conway, D., & Hulme, M. (2003). Adaptation to climate change in the developing world. Progress in Development Studies, 3(3), 179–195. https://doi.org/10.1191/1464993403ps060oa
AghaKouchak, A., Rango, E., Love, C., & Moftakhari, H. (2018). Projected Changes in California’s Precipitation Intensity-Duration-Frequency Curves. California’s Fourth Climate Change Assessment, California Energy Commission. Publication number: CCCA4-CEC-2018-005.
Allen, C. D., Breshears, D. D., & McDowell, N. G. (2015). On underestimation of global vulnerability to tree mortality and forest die-off from hotter drought in the Anthropocene. Ecosphere, 6(8), art129. https://doi.org/10.1890/ES15-00203.1
Allen, D., Webber, M., & Williams, R. (2011, November). EFRI RESIN-The Interface of Infrastructures, Markets, and Natural Cycles: Innovative Modeling and Control Mechanisms for Managing Electricity, Water and Air Quality in Texas. Powerpoint, Champaign, Illinois. Retrieved from http://conferences.ict.illinois.edu/RESINworkshop2011/project-ppts/WEBBER--.pdf
AMS. (2018). Explaining Extreme Events of 2016 from a Climate Perspective. Bulletin of the American Meteorological Society. Retrieved from http://www.ametsoc.net/eee/2016/2016_bams_eee_low_res.pdf
Anderegg, W. R. L., Ballantyne, A. P., Smith, W. K., Majkut, J., Rabin, S., Beaulieu, C., … Pacala, S. W. (2015). Tropical nighttime warming as a dominant driver of variability in the terrestrial carbon sink. Proceedings of the National Academy of Sciences, 201521479. https://doi.org/10.1073/pnas.1521479112
Anderegg, W. R. L., Hicke, J. A., Fisher, R. A., Allen, C. D., Aukema, J., Bentz, B., … Zeppel, M. (2015). Tree mortality from drought, insects, and their interactions in a changing climate. New Phytologist, 208(3), 674–683. https://doi.org/10.1111/nph.13477
Fourth Climate Change Assessment Statewide Summary Report | 99
CALIFORNIA’S FOURTH
CLIMATE CHANGE ASSESSMENT
Andrews, S. S., Mitchell, J. P., Mancinelli, R., Karlen, D. L., Hartz, T. K., Horwath, W. R., … Munk, D. S. (2002). On-farm assessment of soil quality in California’s central valley. Agronomy Journal, 94(1), 12–23. https://doi.org/10.2134/agronj2002.1200
Andrus, R. A., Veblen, T. T., Harvey, B. J., & Hart, S. J. (2016). Fire severity unaffected by spruce beetle outbreak in spruce-fir forests in southwestern Colorado. Ecological Applications, 26(3), 700–711. https://doi.org/10.1890/15-1121
ARB. (2017). California’s Greenhouse Gas Emission Inventory - 2017 Edition. Retrieved June 27, 2018, from https://www.arb.ca.gov/cc/inventory/data/data.htm
Asner, G. P., Brodrick, P. G., Anderson, C. B., Vaughn, N., Knapp, D. E., & Martin, R. E. (2016). Progressive forest canopy water loss during the 2012–2015 California drought. Proceedings of the National Academy of Sciences, 113(2), E249–E255. https://doi.org/10.1073/pnas.1523397113
Auffhammer, M. (2018). Climate Adaptive Response Estimation: Short and Long Run Impacts of Climate Change on Residential Electricity and Natural Gas Consumption Using Big Data. California’s Fourth Climate Change Assessment. Publication number: CCCA4-EXT-2018-005.
Auffhammer, M., Baylis, P., & Hausman, C. H. (2017). Climate change is projected to have severe impacts on the frequency and intensity of peak electricity demand across the United States. Proceedings of the National Academy of Sciences, 114(8), 1886–1891. https://doi.org/10.1073/pnas.1613193114
Ault, T. R., Mankin, J. S., Cook, B. I., & Smerdon, J. E. (2016). Relative impacts of mitigation, temperature, and precipitation on 21st-century megadrought risk in the American Southwest. Science Advances, 2(10), e1600873. https://doi.org/10.1126/sciadv.1600873
Avanzi, F., Maurer, T., Malek, S., Glaser, S. D., Bales, R. C., & Conklin, M. H. (2018). Feather River Hydrologic Observatory: Improving Hydrological Snowpack Forecasting for Hydropower Generation Using Intelligent Information Systems. California’s Fourth Climate Change Assessment, California Energy Commission. Publication number: CCCA4-CEC-2018-001.
Bachand, P., Roy, S., Stern, N., Choperena, J., Cameron, D., & Horwath, W. (2016). On-farm flood capture could reduce groundwater overdraft in Kings River Basin. California Agriculture, 70(4), 200–207.
Baker, Z., Ekstrom, J., & Bedsworth, L. (2018). Climate information? Embedding climate futures within temporalities of California water management. Environmental Sociology, 1–15. https://doi.org/10.1080/23251042.2018.1455123
Balch, J. K., Bradley, B. A., Abatzoglou, J. T., Nagy, R. C., Fusco, E. J., & Mahood, A. L. (2017). Human-started wildfires expand the fire niche across the United States. Proceedings of the National Academy of Sciences, 114(11), 2946–2951. https://doi.org/10.1073/pnas.1617394114
Barnett, T. P., Pierce, D. W., Hidalgo, H. G., Bonfils, C., Santer, B. D., Das, T., … Dettinger, M. D. (2008). Human-induced changes in the hydrology of the western United States. Science, 319(5866), 1080–1083. https://doi.org/10.1126/science.1152538

Fourth Climate Change Assessment Statewide Summary Report | 100
CALIFORNIA’S FOURTH
CLIMATE CHANGE ASSESSMENT
Barreca, A., Clay, K., Deschenes, O., Greenstone, M., & Shapiro, J. (2013). Adapting to Climate Change: The Remarkable Decline in the U.S. Temperature-Mortality Relationship over the 20th Century (No. w18692). Cambridge, MA: National Bureau of Economic Research. https://doi.org/10.3386/w18692
Bassil, K., & Cole, D. (2010). Effectiveness of public health interventions in reducing morbidity and mortality during heat episodes: a Structured Review. International Journal of Environmental Research and Public Health, 7(3), 991–1001. https://doi.org/10.3390/ijerph7030991
Basu, R. (2009). High ambient temperature and mortality: a review of epidemiologic studies from 2001 to 2008. Environmental Health, 8, 40. https://doi.org/10.1186/1476-069X-8-40
Batllori, E., De Cáceres, M., Brotons, L., Ackerly, D. D., Moritz, M. A., & Lloret, F. (2017). Cumulative effects of fire and drought in Mediterranean ecosystems. Ecosphere, 8(8), e01906. https://doi.org/10.1002/ecs2.1906
Batllori, E., Parisien, M.-A., Parks, S. A., Moritz, M. A., & Miller, C. (2017). Potential relocation of climatic environments suggests high rates of climate displacement within the North American protection network. Global Change Biology, 23(8), 3219–3230. https://doi.org/10.1111/gcb.13663
Battles, J., Bell, D., Kennedy, R., Saah, D., Collins, B., York, R., Sanders, J. (2018). Innovations in Measuring and Managing Forest Carbon Stocks in California. California’s Fourth Climate Change Assessment, California Natural Resources Agency. Publication number: CCCA4-CNRA-2018-014.
Becker, A., Inoue, S., Fischer, M., & Schwegler, B. (2012). Climate change impacts on international seaports: knowledge, perceptions, and planning efforts among port administrators. Climatic Change, 110(1–2), 5–29. https://doi.org/10.1007/s10584-011-0043-7
Bentz, B. J., Duncan, J. P., & Powell, J. A. (2016). Elevational shifts in thermal suitability for mountain pine beetle population growth in a changing climate. Forestry, 89(3), 271–283. https://doi.org/10.1093/forestry/cpv054
Bentz, B. J., Régnière, J., Fettig, C. J., Hansen, E. M., Hayes, J. L., Hicke, J. A., … Seybold, S. J. (2010). Climate change and bark beetles of the Western United States and Canada: Direct and indirect effects. BioScience, 60(8), 602–613. https://doi.org/10.1525/bio.2010.60.8.6
Berg, N., & Hall, A. (2015). Increased interannual precipitation extremes over California under climate change. Journal of Climate, 28(16), 6324–6334. https://doi.org/10.1175/JCLI-D-14-00624.1
Berryman, A. A. (1976). Theoretical explanation of mountain pine beetle dynamics in lodgepole pine forests 1. Environmental Entomology, 5(6), 1225–1233. https://doi.org/10.1093/ee/5.6.1225
Biging, G. S., Radke, J. D., & Lee, J. H. (2012). Impacts of Predicted Sea-Level Rise and Extreme Storm Events on the Transportation Infrastructure in the San Francisco Bay Region (No. CEC-500-2012-040). California Energy Commission.
Fourth Climate Change Assessment Statewide Summary Report | 101
CALIFORNIA’S FOURTH
CLIMATE CHANGE ASSESSMENT
Bonfils, C., Santer, B. D., Pierce, D. W., Hidalgo, H. G., Bala, G., Das, T., … Nozawa, T. (2008). Detection and attribution of temperature changes in the mountainous western United States. Journal of Climate, 21(23), 6404–6424. https://doi.org/10.1175/2008JCLI2397.1
Brady, R. X., Alexander, M. A., Lovenduski, N. S., & Rykaczewski, R. R. (2017). Emergent anthropogenic trends in California Current upwelling. Geophysical Research Letters, 44(10), 5044–5052. https://doi.org/10.1002/2017GL072945
Brewer, W. H. (1930). Up and Down California in 1860-1864; The Journal of William H. Brewer. (F. P. Farquhar, Ed.). Yale University Press. Retrieved from http://cdn.loc.gov//service/gdc/calbk/142.pdf
Brooks, B., Telling, J., Erickson, T., Glennie, C. L., Knowles, N., Cayan, D., … LeWinter, A. (2018). High Resolution Measurement of Levee Subsidence Related to Energy Infrastructure in the Sacramento-San Joaquin Delta. California’s Fourth Climate Change Assessment, California Energy Commission. Publication number: CCCA4-CEC-2018-003.
Bruckner, T., Bashmakov, I. A., Mulugetta, Y., Chum, J. C., De la Vega Navarro, A., Edmonds, J., … Zhang, X. (2015). Energy Systems. In Climate Change 2014: Mitigation of Climate Change�; Summary for Policymakers Technical Summary�; Part of the Working Group III Contribution to the Fifth Assessment Report of the Intergovernmental Panel on Climate Change [Edenhofer, O., R. Pichs-Madruga, Y. Sokona, E. Farahani, S. Kadner, K. Seyboth, A. Adler, I. Baum, S. Brunner, P. Eickemeier, B. Kriemann, J. Savolainen, S. Schlömer, C. von Stechow, T. Zwickel and J.C. Minx (eds.)] (pp. 511–598). Geneva, Switzerland: Intergovernmental Panel on Climate Change.
Bruzgul, J., Kay, R., Petrow, A., Rodehorst, B., Revell, D., Bruguera, M., … Collison, K. (2018a). Rising Seas and Electricity Infrastructure: Potential Impacts and Adaptation Actions for San Diego Gas & Electric. California’s Fourth Climate Change Assessment, California Energy Commission. Publication number: CCCA4-CEC-2018-004.
Bruzgul, J., Kay, R., Petrow, A., Rodehorst, B., Revell, D., Bruguera, M., … Manik, J. (2018b). Potential Climate Change Impacts and Adaptation Actions for Gas Assets in the San Diego Gas and Electric Company Service Area. California’s Fourth Climate Change Assessment, California Energy Commission. Publication number: CCCA4-CEC-2018-009.
Buckley, M., Beck, N., Bowden, P., Miller, M. E., Hill, B., Luce, C., … Gaither, J. (2014). Mokelumne watershed avoided cost analysis: Why Sierra fuel treatments make economic sense. Auburn, California: Sierra Nevada Conservancy. Retrieved from http://www.sierranevadaconservancy.ca.gov/mokelumne
Building a Resilient Energy Gulf Coast: Executive Report. (2010). Entergy Corporation.
Bulkeley, H., Edwards, G. A. S., & Fuller, S. (2014). Contesting climate justice in the city: Examining politics and practice in urban climate change experiments. Global Environmental Change, 25, 31–40. https://doi.org/10.1016/j.gloenvcha.2014.01.009
Buma, B. (2015). Disturbance interactions: characterization, prediction, and the potential for cascading effects. Ecosphere, 6(4), art70. https://doi.org/10.1890/ES15-00058.1
Fourth Climate Change Assessment Statewide Summary Report | 102
CALIFORNIA’S FOURTH
CLIMATE CHANGE ASSESSMENT
Burillo, D., Chester, M., Pincetl, S., Fournier, E., Reich, K., & Hall, A. (2018). Climate Change in Los Angeles County: Grid Vulnerability to Extreme Heat. California’s Fourth Climate Change Assessment, California Energy Commission. Publication number: CCCA4-CEC-2018-013.
Burke, M., Davis, W. M., & Diffenbaugh, N. S. (2018). Large potential reduction in economic damages under UN mitigation targets. Nature, 557(7706), 549–553. https://doi.org/10.1038/s41586-018-0071-9
Burke, M., Hsiang, S. M., & Miguel, E. (2015). Global non-linear effect of temperature on economic production. Nature, 527(7577), 235–239. https://doi.org/10.1038/nature15725
Burke, S., Bethel, J. W., & Britt, A. F. (2012). Assessing disaster preparedness among Latino migrant and seasonal farmworkers in eastern North Carolina. International Journal of Environmental Research and Public Health, 9(9), 3115–3133. https://doi.org/10.3390/ijerph9093115
CalBRACE. (2018). Retrieved July 5, 2018, from https://www.cdph.ca.gov/Programs/OHE/Pages/CalBRACE.aspx
Caldeira, K., & Wickett, M. E. (2003). Anthropogenic carbon and ocean pH: Oceanography. Nature, 425(6956), 365–365. https://doi.org/10.1038/425365a
California Energy Commission Staff. (2017). 2017 Integrated Energy Policy Report (No. CEC-100-2017-001-CMF). California Energy Commission.
California Ocean Protection Council. (2018). State of California Sea Level Rise Guidance. California Natural Resources Agency. Retrieved from http://www.opc.ca.gov/webmaster/ftp/pdf/agenda_items/20180314/Item3_Exhibit-A_OPC_SLR_Guidance-rd3.pdf
California Gov. Code § 65300. (n.d.). Retrieved June 20, 2018, from http://leginfo.legislature.ca.gov/faces/codes_displaySection.xhtml?lawCode=GOV§ionNum=65300
California Public Utilities Commission. (2016). Risk Assessment and Mitigation Phase Report of San Diego Gas & Electric Company and Southern California Gas Company.
Calkin, D. E., Thompson, M. P., & Finney, M. A. (2015). Negative consequences of positive feedbacks in US wildfire management. Forest Ecosystems, 2(1). https://doi.org/10.1186/s40663-015-0033-8
Callahan, M. (2016, August 3). Delayed Dungeness crab season sinks catch, sales for California fishermen. Retrieved May 25, 2018, from http://www.pressdemocrat.com/news/5921141-181/delayed-dungeness-crab-season-sinks
Caltrans. (2016). California Public Use Airports. Retrieved May 30, 2018, from http://www.dot.ca.gov/hq/tsip/gis/datalibrary/Metadata/Airports.html
Fourth Climate Change Assessment Statewide Summary Report | 103
CALIFORNIA’S FOURTH
CLIMATE CHANGE ASSESSMENT
Campbell, J. L., Harmon, M. E., & Mitchell, S. R. (2012). Can fuel-reduction treatments really increase forest carbon storage in the western US by reducing future fire emissions? Frontiers in Ecology and the Environment, 10(2), 83–90. https://doi.org/10.1890/110057
Carleton, T. A., & Hsiang, S. M. (2016). Social and economic impacts of climate. Science, 353(6304). https://doi.org/10.1126/science.aad9837
Casey, J., James, P., Cushing, L., Jesdale, B., & Morello-Frosch, R. (2017). Race, ethnicity, income concentration and 10-year change in urban greenness in the United States. International Journal of Environmental Research and Public Health, 14(12), 1546. https://doi.org/10.3390/ijerph14121546
Cayan, D. R., Das, T., Pierce, D. W., Barnett, T. P., Tyree, M., & Gershunov, A. (2010). Future dryness in the southwest US and the hydrology of the early 21st century drought. Proceedings of the National Academy of Sciences, 107(50), 21271–21276. https://doi.org/10.1073/pnas.0912391107
Cayton, H. L., Haddad, N. M., Gross, K., Diamond, S. E., & Ries, L. (2015). Do growing degree days predict phenology across butterfly species? Ecology, 96(6), 1473–1479. https://doi.org/10.1890/15-0131.1
CDPH. (2015). The Portrait of Promise: The California Statewide Plan to Promote Health and Mental Health Equity (p. 97). Sacramento, CA: Office of Health Equity and the California Department of Public Health (CDPH). Retrieved from https://www.cdph.ca.gov/Programs/OHE/CDPH%20Document%20Library/Accessible-CDPH_OHE_Disparity_Report_Final%20(2).pdf
CEC. (2015). California Energy Maps. Retrieved June 27, 2018, from http://www.energy.ca.gov/maps/renewable/building_climate_zones.html
Chambers, A., Lal, R., & Paustian, K. (2016). Soil carbon sequestration potential of US croplands and grasslands: Implementing the 4 per Thousand Initiative. Journal of Soil and Water Conservation, 71(3), 68A-74A. https://doi.org/10.2489/jswc.71.3.68A
Chan, F., Barth, J. A., Blanchette, C. A., Byrne, R. H., Chavez, F., Cheriton, O., … Washburn, L. (2017). Persistent spatial structuring of coastal ocean acidification in the California Current System. Scientific Reports, 7(1). https://doi.org/10.1038/s41598-017-02777-y
Chavez, F. P., Costello, C., Aseltine-Neilson, D., Doremus, H., Field, J., Gaines, S., … Wheeler, S. (2017). Readying California Fisheries for Climate Change. The Climate Change and Fisheries Working Group and Ocean Science Trust. Retrieved from http://www.oceansciencetrust.org/wp-content/uploads/2016/06/Climate-and-Fisheries_GuidanceDoc.pdf
Checkley, D. M., & Barth, J. A. (2009). Patterns and processes in the California Current System. Progress in Oceanography, 83(1–4), 49–64. https://doi.org/10.1016/j.pocean.2009.07.028

Fourth Climate Change Assessment Statewide Summary Report | 104
CALIFORNIA’S FOURTH
CLIMATE CHANGE ASSESSMENT
Chinowsky, P., Helman, J., Gulati, S., Neumann, J., & Martinich, J. (2017). Impacts of climate change on operation of the US rail network. Transport Policy. https://doi.org/10.1016/j.tranpol.2017.05.007
Christian-Smith, J., Levy, M. C., & Gleick, P. H. (2015). Maladaptation to drought: a case report from California, USA. Sustainability Science, 10(3), 491–501. https://doi.org/10.1007/s11625-014-0269-1
CNRA. (2017, January 20). California Forest Carbon Plan: Managing our Forest Landscapes in a Changing Climate. California Department of Forestry and Fire Protection, Natural Resources Agency, Environmental Protection Agency. Retrieved from http://fire.ca.gov/fcat/downloads/California%20Forest%20Carbon%20Plan%20Draft%20for%20Public%20Review_Jan17.pdf
CNRA. (2018). Safeguarding California Plan: 2018 Update – California’s Climate Adaptation Strategy. California Natural Resources Agency. Retrieved from http://resources.ca.gov/docs/climate/safeguarding/update2018/safeguarding-california-plan-2018-update.pdf
Colson, A. R., & Cooke, R. M. (2018). Expert elicitation: Using the classical model to validate experts’ judgments. Review of Environmental Economics and Policy, 12(1), 113–132. https://doi.org/10.1093/reep/rex022
Conrad, E., Moran, T., DuPraw, M. E., Ceppos, D., Martinez, J., & Blomquist, W. (2018). Diverse stakeholders create collaborative, multilevel basin governance for groundwater sustainability. California Agriculture, 72(1), 44–53. https://doi.org/10.3733/ca.2018a0002
Cook, B. I., Ault, T. R., & Smerdon, J. E. (2015). Unprecedented 21st century drought risk in the American Southwest and Central Plains. Science Advances, 1(1), e1400082–e1400082. https://doi.org/10.1126/sciadv.1400082
Cook, E. R., Seager, R., Cane, M. A., & Stahle, D. W. (2007). North American drought: Reconstructions, causes, and consequences. Earth-Science Reviews, 81(1–2), 93–134. https://doi.org/10.1016/j.earscirev.2006.12.002
Cooley, H., Moore, E., Heberger, M., & Allen, L. (2012, July). Social Vulnerability to Climate Change in California. Pacific Institute. Retrieved from http://www.energy.ca.gov/2012publications/CEC-500-2012-013/CEC-500-2012-013.pdf
Cornwell, J. C., Glibert, P. M., & Owens, M. S. (2014). Nutrient fluxes from sediments in the San Francisco Bay Delta. Estuaries and Coasts, 37(5), 1120–1133. https://doi.org/10.1007/s12237-013-9755-4
Cushing, L., Morello-Frosch, R., Wander, M., & Pastor, M. (2015). The haves, the have-nots, and the health of everyone: The relationship between social inequality and environmental quality. Annual Review of Public Health, 36(1), 193–209. https://doi.org/10.1146/annurev-publhealth-031914-122646
Cvijanovic, I., Santer, B. D., Bonfils, C., Lucas, D. D., Chiang, J. C. H., & Zimmerman, S. (2017). Future loss of Arctic sea-ice cover could drive a substantial decrease in California’s rainfall. Nature Communications, 8(1). https://doi.org/10.1038/s41467-017-01907-4
Fourth Climate Change Assessment Statewide Summary Report | 105
CALIFORNIA’S FOURTH
CLIMATE CHANGE ASSESSMENT
Dahlke, H., Brown, A., Orloff, S., Putnam, D., & O’Geen, T. (2018). Managed winter flooding of alfalfa recharges groundwater with minimal crop damage. California Agriculture, 72(1), 65–75.
Dale, L., Carnall, M., Fitts, G., McDonald, S. L., & Wei, M. (2018). Assessing the Impact of Wildfires on the California Electricity Grid. California’s Fourth Climate Change Assessment, California Energy Commission. Publication number: CCCA4-CEC-2018-002.
Dale, V. H., Joyce, L. A., McNulty, S., Neilson, R. P., Ayres, M. P., Flannigan, M. D., … Michael Wotton, B. (2001). Climate change and forest disturbances: Climate change can affect forests by altering the frequency, intensity, duration, and timing of fire, drought, introduced species, insect and pathogen outbreaks, hurricanes, windstorms, ice storms, or landslides. BioScience, 51(9), 723. https://doi.org/10.1641/0006-3568(2001)051[0723:CCAFD]2.0.CO;2
Davis, F. W., Sweet, L. C., Serra-Diaz, J. M., Franklin, J., McCullough, I., Flint, A., … Moritz, M. A. (2016). Shrinking windows of opportunity for oak seedling establishment in southern California mountains. Ecosphere, 7(11), e01573. https://doi.org/10.1002/ecs2.1573
Dettinger, M. (2015). Strum Und Drand – California’s Remarkable Storm-Drought Connection. Hydrolink, (1), 21–22.
Dettinger, M. (2016). Historical and future relations between large storms and droughts in California. San Francisco Estuary and Watershed Science, 14(2). https://doi.org/10.15447/sfews.2016v14iss2art1
Dettinger, M. (2018). Sierra Nevada Regional Report. California’s Fourth Climate Change Assessment. Publication number: SUM-CCC4A-2018-004.
Dettinger, M. D., & Anderson, M. L. (2015). Storage in California’s reservoirs and snowpack in this time of drought. San Francisco Estuary and Watershed Science, 13(2). Retrieved from https://escholarship.org/uc/item/8m26d692
Dettinger, M. D., Ralph, F. M., Das, T., Neiman, P. J., & Cayan, D. R. (2011). Atmospheric rivers, floods and the water resources of California. Water, 3(2), 445–478. https://doi.org/10.3390/w3020445
Dietz, T. (2003). The struggle to govern the commons. Science, 302(5652), 1907–1912. https://doi.org/10.1126/science.1091015
Diffenbaugh, N. S., Swain, D. L., & Touma, D. (2015). Anthropogenic warming has increased drought risk in California. Proceedings of the National Academy of Sciences, 112(13), 3931–3936. https://doi.org/10.1073/pnas.1422385112
Dilling, L., Daly, M. E., Travis, W. R., Wilhelmi, O. V., & Klein, R. A. (2015). The dynamics of vulnerability: why adapting to climate variability will not always prepare us for climate change: Dynamics of vulnerability. Wiley Interdisciplinary Reviews: Climate Change, 6(4), 413–425. https://doi.org/10.1002/wcc.341

Fourth Climate Change Assessment Statewide Summary Report | 106
CALIFORNIA’S FOURTH
CLIMATE CHANGE ASSESSMENT
Dixon, L., Tsang, F., & Fitts, G. (2018). The Impact of Changing Wildfire Risk on California’s Residential Insurance Market. California’s Fourth Climate Change Assessment, California Natural Resources Agency. Publication number: CCCA4-CNRA-2018-008.
Duncan, B. E., Higgason, K. D., Suchanek, T. H., Largier, J., Stachowicz, J., Allen, S., … Wilkerson, F. (2014). Ocean Climate Indicators: A Monitoring Inventory and Plan for Tracking Climate Change in the North-central California Coast and Ocean Region (p. 85). U.S. Department of Commerce, National Oceanic and Atmospheric Administration, Office of National Marine Sanctuaries. Retrieved from https://sanctuaries.noaa.gov/science/conservation/ocean-climate-indicators.html
DWR, & NRA. (2016). Drought and Water Year 2016: Hot and Dry Conditions Continue. California Department of Water Resources, Natural Resources Agency, State of California. Retrieved from https://water.ca.gov/LegacyFiles/waterconditions/docs/a3065_Drought_8page_v9_FINALsm.pdf
Eastern Research Group, Inc. (ERG). (2016). The National Significance of California’s Ocean Economy. NOAA Office for Coastal Management. Retrieved from https://coast.noaa.gov/data/digitalcoast/pdf/california-ocean-economy.pdf
Edenhofer, O., Pichs-Madruga, R., Sokona, Y., Minx, J. C., Farahani, E., Kadner, S., … Intergovernmental Panel on Climate Change (Eds.). (2015). Climate Change 2014: Mitigation of Climate Change�; Summary for Policymakers Technical Summary�; Part of the Working Group III Contribution to the Fifth Assessment Report of the Intergovernmental Panel on Climate Change. Geneva, Switzerland: Intergovernmental Panel on Climate Change.
Ekstrom, J. A., Bedsworth, L., & Fencl, A. (2017). Gauging climate preparedness to inform adaptation needs: local level adaptation in drinking water quality in CA, USA. Climatic Change, 140(3–4), 467–481. https://doi.org/10.1007/s10584-016-1870-3
Ekstrom, J. A., Klasic, M. R., Fencl, A., Lubell, M., Baker, E., & Einterz, F. (2018). Drought Management and Climate Adaptation among Small, Self-Sufficient Water Systems in California: Appendix A- Supplementary Background Information. California’s Fourth Climate Change Assessment, California Natural Resources Agency. Publication number: CCCA4-CNRA-2018-004.
Ekstrom, J. A., Suatoni, L., Cooley, S. R., Pendleton, L. H., Waldbusser, G. G., Cinner, J. E., … Portela, R. (2015). Vulnerability and adaptation of US shellfisheries to ocean acidification. Nature Climate Change, 5(3), 207–214. https://doi.org/10.1038/nclimate2508
Erikson, L. H., P., Barnard, L., O’Neill, A., Limber, P., Vitousek, S., Hart, J. F., … Lovering, J. (2018). Assessing and Communicating the Impacts of Climate Change on the Southern California Coast. California’s Fourth Climate Change Assessment, California Natural Resources Agency. Publication number: CCCA4-CNRA-2018-013.
Espinoza, V., Waliser, D. E., Guan, B., Lavers, D. A., & Ralph, F. M. (2018). Global analysis of climate change projection effects on atmospheric rivers. Geophysical Research Letters, 45(9), 4299–4308. https://doi.org/10.1029/2017GL076968
FAO (Ed.). (2016). Contributing to Food Security and Nutrition for All. Rome: Food and Agriculture Organization of the United Nations. Retrieved from http://www.fao.org/3/a-i5692e.pdf
Fourth Climate Change Assessment Statewide Summary Report | 107
CALIFORNIA’S FOURTH
CLIMATE CHANGE ASSESSMENT
Farquhar, G. D. (1997). Climate change: Carbon dioxide and vegetation. Science, 278(5342), 1411–1411. https://doi.org/10.1126/science.278.5342.1411
Faurby, S., & Araújo, M. B. (2018). Anthropogenic range contractions bias species climate change forecasts. Nature Climate Change, 8(3), 252–256. https://doi.org/10.1038/s41558-018-0089-x
Feely, R. A., Sabine, C. L., Lee, K., Berelson, W., Kleypas, J., Fabry, V. J., & Millero, F. J. (2004). Impact of Anthropogenic CO2 on the CaCO3 System in the Oceans. Science, 305(5682), 362–366. https://doi.org/10.1126/science.1097329
Feinstein, L., Phurisamban, R., Ford, A., Tyler, C., & Crawford, A. (2017, January). Drought and Equity in California. Pacific Institute and The Environmental Justice Coalition for Water. Retrieved from http://pacinst.org/wp-content/uploads/2017/01/PI_DroughtAndEquityInCA_Jan_2017.pdf
Fellows, A. W., & Goulden, M. L. (2012). Rapid vegetation redistribution in Southern California during the early 2000s drought. Journal of Geophysical Research: Biogeosciences, 117(G3), n/a-n/a. https://doi.org/10.1029/2012JG002044
Fernández, M., Hamilton, H. H., & Kueppers, L. M. (2015). Back to the future: using historical climate variation to project near-term shifts in habitat suitable for coast redwood. Global Change Biology, 21(11), 4141–4152. https://doi.org/10.1111/gcb.13027
Field, C. B., Barros, V., Stocker, T. F., Dokken, D. J., Ebi, K. L., Mastrandrea, M. D., … Dube, O.P. (2012). IPCC 2012: Summary for Policymakers. In: Managing the Risks of Extreme Events and Disasters to Advance Climate Change Adaptation (pp. 1–19). Cambridge, UK and New York, NY, USA: Intergovernmental Panel on Climate Change. Retrieved from https://www.ipcc.ch/pdf/special-reports/srex/SREX_FD_SPM_final.pdf
Field, C. B., Jackson, R. B., & Mooney, H. A. (1995). Stomatal responses to increased CO2: implications from the plant to the global scale. Plant, Cell and Environment, 18(10), 1214–1225. https://doi.org/10.1111/j.1365-3040.1995.tb00630.x
Finlay, S. E., Moffat, A., Gazzard, R., Baker, D., & Murray, V. (2012). Health Impacts of Wildfires. PLoS Currents. https://doi.org/10.1371/4f959951cce2c
Flint, L., Flint, A., Stern, M., Mayer, A., Vergara, S., Silver, W., … Cameron, D. (2018). Increasing Soil Organic Carbon to Mitigate Greenhouse Gases and Increase Climate Resiliency for California. California’s Fourth Climate Change Assessment, California Natural Resources Agency. Publication number: CCCA4-CNRA-2018-006.
Forister, M. L., & Shapiro, A. M. (2003). Climatic trends and advancing spring flight of butterflies in lowland California. Global Change Biology, 9(7), 1130–1135. https://doi.org/10.1046/j.1365-2486.2003.00643.x
Franco, G., Cayan, D. H., Pierce, D. W., Westerling, A. L., & Thorne, J. H. (2018). Cumulative Global CO2 Emissions and their Climate Impacts from Local through Regional Scales. California’s Fourth Climate Change Assessment. Publication number: CCCA4-EXT-2018-007.

Fourth Climate Change Assessment Statewide Summary Report | 108
CALIFORNIA’S FOURTH
CLIMATE CHANGE ASSESSMENT
Goforth, B. R., & Minnich, R. A. (2008). Densification, stand-replacement wildfire, and extirpation of mixed conifer forest in Cuyamaca Rancho State Park, southern California. Forest Ecology and Management, 256(1–2), 36–45. https://doi.org/10.1016/j.foreco.2008.03.032
Golden, C. D., Allison, E. H., Cheung, W. W. L., Dey, M. M., Halpern, B. S., McCauley, D. J., … Myers, S. S. (2016). Nutrition: Fall in fish catch threatens human health. Nature News, 534(7607), 317. https://doi.org/10.1038/534317a
Goode, R. (2018). Tribal and Indigenous Communities Summary Report. California’s Fourth Climate Change Assessment. Publication number: SUM-CCCA4-2018-010.
Gould, S., & Dervin, K. (2012, February). Climate Action for Health: Integrating Public Health into Climate Action Planning. California Department of Public Health. Retrieved from https://www.cdph.ca.gov/Programs/OHE/CDPH%20Document%20Library/CCHEP-General/CDPH-2012-Climate-Action-for-Health_accessible.pdf
Governor’s Office of Planning and Research. (2017). General Plan Guidelines. Retrieved July 6, 2018, from http://opr.ca.gov/planning/general-plan/guidelines.html
Graham, N. E., & Hughes, M. K. (2007). Reconstructing the Mediaeval low stands of Mono Lake, Sierra Nevada, California, USA. The Holocene, 17(8), 1197–1210. https://doi.org/10.1177/0959683607085126
Grantham, T. E., Fesenmyer, K. A., Peek, R., Holmes, E., Quiñones, R. M., Bell, A., … Moyle, P. B. (2017). Missing the boat on freshwater fish conservation in California: California fish conservation planning. Conservation Letters, 10(1), 77–85. https://doi.org/10.1111/conl.12249
Green Nylen, N., Kiparsky, M., Owen, D., Doremus, H., & Hanemann, M. (2018a). Addressing Institutional Vulnerabilities in California’s Drought Water Allocation, Part 1: Water Rights Administration and Oversight During Major Statewide Droughts, 1976–2016. California’s Fourth Climate Change Assessment, California Natural Resources Agency. Publication number: CCCA4-CNRA-2018-009.
Green Nylen, N., Kiparsky, M., Owen, D., Doremus, H., & Hanemann, M. (2018b). Addressing Institutional Vulnerabilities in California’s Drought Water Allocation, Part 2: Improving Water Rights Administration and Oversight for Future Droughts. California’s Fourth Climate Change Assessment, California Natural Resources Agency. Publication number: CCCA4-CNRA-2018-010.
Greene, Christina. (2018). Broadening understandings of drought: the climate vulnerability of farmworkers and rural communities in California (USA). Environmental Science & Policy.
Griffin, D., & Anchukaitis, K. J. (2014). How unusual is the 2012-2014 California drought? Geophysical Research Letters, 41(24), 9017–9023. https://doi.org/10.1002/2014GL062433
Fourth Climate Change Assessment Statewide Summary Report | 109
CALIFORNIA’S FOURTH
CLIMATE CHANGE ASSESSMENT
Grifman, P., Hart, J., Ladwig, J., Newton Mann, A., & Schulhof, M. (2013). Sea Level Rise Vulnerability Study for the City of Los Angeles. University of Southern California Sea Grant Program. Retrieved from https://dornsife.usc.edu/assets/sites/291/docs/pdfs/City_of_LA_SLR_Vulnerability_Study_FINAL_Summary_Report_Online_Hyperlinks.pdf
Griggs, G., A ́rvai, J., Cayan, D., DeConto, R., Fox, J., Fricker, H.A., Kopp, R.E., Tebaldi, C., Whiteman, E.A. (2017). Rising Seas in California: An Update on Sea-Level Rise Science. California Ocean Protection Council Science Advisory Team Working Group, California Ocean Science Trust. Retrieved from http://www.opc.ca.gov/webmaster/ftp/pdf/docs/rising-seas-in-california-an-update-on-sea-level-rise-science.pdf
Griscom, B. W., Adams, J., Ellis, P. W., Houghton, R. A., Lomax, G., Miteva, D. A., … Fargione, J. (2017). Natural climate solutions. Proceedings of the National Academy of Sciences, 114(44), 11645–11650. https://doi.org/10.1073/pnas.1710465114
Gruber, N., Hauri, C., Lachkar, Z., Loher, D., Frolicher, T. L., & Plattner, G.-K. (2012). Rapid progression of ocean acidification in the California current system. Science, 337(6091), 220–223. https://doi.org/10.1126/science.1216773
Guan, B., Molotch, N. P., Waliser, D. E., Fetzer, E. J., & Neiman, P. J. (2013). The 2010/2011 snow season in California’s Sierra Nevada: Role of atmospheric rivers and modes of large-scale variability: Atmospheric Rivers and Modes of Large-Scale Variability. Water Resources Research, 49(10), 6731–6743. https://doi.org/10.1002/wrcr.20537
Guirguis, K., Gershunov, A., Tardy, A., & Basu, R. (2014). The impact of recent heat waves on human health in California. Journal of Applied Meteorology and Climatology, 53(1), 3–19. https://doi.org/10.1175/JAMC-D-13-0130.1
Guirguis, Kristen, Basu, Rupa, Al-Delaimy, Wael, Benmarhnia, Tarik, Clemesha, Rachel, Corcos, Isabel, … Gershunov, Alexander. (2018). Heat, Disparities, and Health Outcomes in San Diego County’s Diverse Climate Zones. GeoHealth. https://doi.org/10.1029/2017GH000127
Guzman-Morales, J., Gershunov, A., Theiss, J., Li, H., & Cayan, D. (2016). Santa Ana winds of Southern California: Their climatology, extremes, and behavior spanning six and a half decades. Geophysical Research Letters, 43(6), 2827–2834. https://doi.org/10.1002/2016GL067887
Haden, V. R., Dempsey, M., Wheeler, S., Salas, W., & Jackson, L. E. (2013). Use of local greenhouse gas inventories to prioritize opportunities for climate action planning and voluntary mitigation by agricultural stakeholders in California. Journal of Environmental Planning and Management, 56(4), 553–571. https://doi.org/10.1080/09640568.2012.689616
Hällfors, M. H., Liao, J., Dzurisin, J., Grundel, R., Hyvärinen, M., Towle, K., … Hellmann, J. J. (2014). Addressing potential local adaptation in species distribution models: implications for conservation under climate change. Ecological Applications, 26(4), 1154–1169. https://doi.org/10.1890/15-0926
Hamilton, P. B., Rolshausen, G., Webster, T. M. U., & Tyler, C. R. (2017). Adaptive capabilities and fitness consequences associated with pollution exposure in fish. Phil. Trans. R. Soc. B, 372(1712), 20160042. https://doi.org/10.1098/rstb.2016.0042

Fourth Climate Change Assessment Statewide Summary Report | 110
CALIFORNIA’S FOURTH
CLIMATE CHANGE ASSESSMENT
Hannah, L., Costello, C., Guo, C., Ries, L., Kolstad, C., Panitz, D., Snider, N. (2011). The impact of climate change on California timberlands. Climatic Change 109(Suppl 1). https://doi.org/10.1007/s10584-011-0307-2
Hart, S. J., Schoennagel, T., Veblen, T. T., & Chapman, T. B. (2015). Area burned in the western United States is unaffected by recent mountain pine beetle outbreaks. Proceedings of the National Academy of Sciences, 112(14), 4375–4380. https://doi.org/10.1073/pnas.1424037112
Hart, S. J., Veblen, T. T., Eisenhart, K. S., Jarvis, D., & Kulakowski, D. (2014). Drought induces spruce beetle (Dendroctonus rufipennis) outbreaks across northwestern Colorado. Ecology, 95(4), 930–939. https://doi.org/10.1890/13-0230.1
Harvey, B. J., Donato, D. C., & Turner, M. G. (2014). Recent mountain pine beetle outbreaks, wildfire severity, and postfire tree regeneration in the US Northern Rockies. Proceedings of the National Academy of Sciences, 111(42), 15120–15125. https://doi.org/10.1073/pnas.1411346111
Hatfield, J., Takle, G., Grotjahn, R., Holden, P., Izaurralde, R. C., Mader, T., & Marshall, E. (2015). Ch. 6: Agriculture. In Climate Change Impacts in the United States: The Third National Climate Assessment (pp. 150–174). U.S. Global Change Research Program. Retrieved from http://s3.amazonaws.com/nca2014/high/NCA3_Climate_Change_Impacts_in_the_United%20States_HighRes.pdf
He, M., Schwarz, E., Lynn, E., & Anderson, M. (2018). Projected Changes in Precipitation, Temperature, and Drought across California’s Hydrologic Regions. California’s Fourth Climate Change Assessment. Publication number: CCCA4-EXT-2018-002.
Heady, W. N., Cohen, B. S., Gleason, M. G., Morris, J. N., Newkirk, S. G., Klausmeyer, K. R., … Small, M. (2018). Conserving California’s Coastal Habitats: A Legacy and a Future with Sea Level Rise (p. 143). San Francisco and Oakland, CA: The Nature Conservancy, Coastal Conservancy. Retrieved from https://www.conservationgateway.org/ConservationPractices/Marine/crr/library/Documents/TNC_SCC_CoastalAssessment_lo%20sngl.pdf
Heal, G., & Park, J. (2016). Reflections—temperature stress and the direct impact of climate change: A review of an emerging literature. Review of Environmental Economics and Policy, 10(2), 347–362. https://doi.org/10.1093/reep/rew007
Heberger, M., Cooley, H., Herrera, P., Gleick, P.H., Moore, E. (2011). Potential impacts of increased coastal flooding in California due to sea-level rise. Climatic Change, 109(Suppl 1). DOI 10.1007/s10584-011-0308-1
Heller, N. E., & Zavaleta, E. S. (2009). Biodiversity management in the face of climate change: A review of 22 years of recommendations. Biological Conservation, 142(1), 14–32. https://doi.org/10.1016/j.biocon.2008.10.006
Henson, S. A., Beaulieu, C., Ilyina, T., John, J. G., Long, M., Séférian, R., … Sarmiento, J. L. (2017). Rapid emergence of climate change in environmental drivers of marine ecosystems. Nature Communications, 8, 14682. https://doi.org/10.1038/ncomms14682
Fourth Climate Change Assessment Statewide Summary Report | 111
CALIFORNIA’S FOURTH
CLIMATE CHANGE ASSESSMENT
Herman, J., Fefer, M., Dogan, M., Jenkins, M., Medellín-Azuara, J., & Lund, J. (2018). Advancing Hydro-Economic Optimization to Identify Vulnerabilities and Adaptation Opportunities in California’s Water System. California’s Fourth Climate Change Assessment, California Natural Resources Agency. Publication number: CCCA4-CNRA-2018-016.
Herweijer, C., Seager, R., & Cook, E. R. (2006). North American droughts of the mid to late nineteenth century: a history, simulation and implication for Mediaeval drought. The Holocene, 16(2), 159–171. https://doi.org/10.1191/0959683606hl917rp
Hicke, J. A., Johnson, M. C., Hayes, J. L., & Preisler, H. K. (2012). Effects of bark beetle-caused tree mortality on wildfire. Forest Ecology and Management, 271, 81–90. https://doi.org/10.1016/j.foreco.2012.02.005
Hilty, J. A., Lidicker, W. Z., & Merenlender, A. M. (2006). Corridor ecology: the science and practice of linking landscapes for biodiversity conservation. Washington, DC: Island Press.
Howard, J. K., Fesenmyer, K. A., Grantham, T. E., Viers, J. H., Ode, P. R., Moyle, P. B., … Wright, A. N. (2018). A freshwater conservation blueprint for California: prioritizing watersheds for freshwater biodiversity. Freshwater Science, 37(2), 417–431. https://doi.org/10.1086/697996
Hsiang, S., Kopp, R., Jina, A., Rising, J., Delgado, M., Mohan, S., … Houser, T. (2017). Estimating economic damage from climate change in the United States. Science, 356(6345), 1362–1369. https://doi.org/10.1126/science.aal4369
Huang, M., Piao, S., Sun, Y., Ciais, P., Cheng, L., Mao, J., … Wang, Y. (2015). Change in terrestrial ecosystem water-use efficiency over the last three decades. Global Change Biology, 21(6), 2366–2378. https://doi.org/10.1111/gcb.12873
Hughes, M., & Hall, A. (2010). Local and synoptic mechanisms causing Southern California’s Santa Ana winds. Climate Dynamics, 34(6), 847–857. https://doi.org/10.1007/s00382-009-0650-4
Hughes, M., Hall, A., & Kim, J. (2011). Human-induced changes in wind, temperature and relative humidity during Santa Ana events. Climatic Change, 109(S1), 119–132. https://doi.org/10.1007/s10584-011-0300-9
Hummel, M. A., Berry, M. S., & Stacey, M. T. (2018). Sea level rise impacts on wastewater treatment systems along the U.S. coasts. Earth’s Future, 6(4), 622–633. https://doi.org/10.1002/2017EF000805
Hurteau, M. D., & Brooks, M. L. (2011). Short- and long-term effects of fire on carbon in US dry temperate forest systems. BioScience, 61(2), 139–146. https://doi.org/10.1525/bio.2011.61.2.9
Iacobellis, S. F., & Cayan, D. R. (2013). The variability of California summertime marine stratus: Impacts on surface air temperatures. Journal of Geophysical Research: Atmospheres, 118(16), 9105–9122. https://doi.org/10.1002/jgrd.50652
Ingram, B. L., & Malamud-Roam, F. (2013). The West without Water: What Past Floods, Droughts, and other Climatic Clues Tell Us about Tomorrow. Berkeley: University of California Press.
Fourth Climate Change Assessment Statewide Summary Report | 112
CALIFORNIA’S FOURTH
CLIMATE CHANGE ASSESSMENT
IPCC. (2012). Glossary of Terms. In Managing the Risks of Extreme Events and Disasters to Advance Climate Change Adaptation (pp. 555–564). New York, NY: Cambridge University Press.
IPCC. (2014). IPCC Fifth Assessment Report. Retrieved February 19, 2018, from https://www.ipcc.ch/report/ar5/
Jacob, D. J., & Winner, D. A. (2009). Effect of Climate Change on Air Quality. Retrieved from https://dash.harvard.edu/handle/1/3553961
James, P., Banay, R. F., Hart, J. E., & Laden, F. (2015). A Review of the Health Benefits of Greenness. Current Epidemiology Reports, 2(2), 131–142. https://doi.org/10.1007/s40471-015-0043-7
Jellison, B. M., Ninokawa, A., Hill, T. M., Sanford, E., & Gaylord, B. (2017). Seawater carbonate chemistry and predator avoidance behavior of Tegula funebralis in the presence and absence of cue from Pisaster ochraceus [Data set]. https://doi.org/10.1594/PANGAEA.875937
Jennings, M. K., Cayan, D., Kalansky, J., Pairis, A. D., Lawson, D. M., Syphard, A. D., … Vanderplank, S. (2018). San Diego County Ecosystems: Ecological Impacts of Climate Change on a Biodiversity Hotspot. California’s Fourth Climate Change Assessment. Publication number: CCCA4-EXT-2018-010.
Jesdale, B. M., Morello-Frosch, R., & Cushing, L. (2013). The racial/ethnic distribution of heat risk–related land cover in relation to residential segregation. Environmental Health Perspectives, 121(7), 811–817. https://doi.org/10.1289/ehp.1205919
Jin, Y., Goulden, M. L., Faivre, N., Veraverbeke, S., Sun, F., Hall, A., … Randerson, J. T. (2015). Identification of two distinct fire regimes in Southern California: implications for economic impact and future change. Environmental Research Letters, 10(9), 094005. https://doi.org/10.1088/1748-9326/10/9/094005
Jin, Y., Randerson, J. T., Faivre, N., Capps, S., Hall, A., & Goulden, M. L. (2014). Contrasting controls on wildland fires in Southern California during periods with and without Santa Ana winds: Controls on Southern California fires. Journal of Geophysical Research: Biogeosciences, 119(3), 432–450. https://doi.org/10.1002/2013JG002541
Jones, C. M., Wheeler, S. M., & Kammen, D. M. (2018). Carbon Footprint Planning: Quantifying Local and State Mitigation Opportunities for 700 California Cities. Urban Planning, 3(2), 35. https://doi.org/10.17645/up.v3i2.1218
Judge, J., Newkirk, S., Leo, K., Heady, W., Hayden, M., Veloz, S., … Small, M. (2017). Case Studies of Natural Shoreline Infrastructure in Coastal California: A Component of Identification of Natural Infrastructure Options for Adapting to Sea Level Rise (California’s Fourth Climate Change Assessment). Arlington, VA: The Nature Conservancy. Retrieved from http://scc.ca.gov/files/2017/11/tnc_Natural-Shoreline-Case-Study_hi.pdf
Jump, A. S., Ruiz-Benito, P., Greenwood, S., Allen, C. D., Kitzberger, T., Fensham, R., … Lloret, F. (2017). Structural overshoot of tree growth with climate variability and the global spectrum of drought-induced forest dieback. Global Change Biology, 23(9), 3742–3757. https://doi.org/10.1111/gcb.13636
Fourth Climate Change Assessment Statewide Summary Report | 113
CALIFORNIA’S FOURTH
CLIMATE CHANGE ASSESSMENT
Kane, J. M., Varner, J. M., Metz, M. R., & van Mantgem, P. J. (2017). Characterizing interactions between fire and other disturbances and their impacts on tree mortality in western U.S. Forests. Forest Ecology and Management, 405, 188–199. https://doi.org/10.1016/j.foreco.2017.09.037
Kay, R., Scheuer, K., Dix, B., Bruguera, M., Wong, A., & Kim, J. (2018). Overcoming Organizational Barriers to Implementing Local Government Adaptation Strategies. California’s Fourth Climate Change Assessment, California Natural Resources Agency. Publication number: CCCA4-CNRA-2018-005.
Kearns, F., & Parker, D. (2018). Supporting sustainable groundwater management. California Agriculture, 72(1), 6–7.
Keeley, A., Basson, D., Cameron, D., Hannah, L., Heller, N., Huber, P., … Veloz, S. (2018). Migration Corridors as Adaptation to Climate Change: Why, How, and What Next. California’s Fourth Climate Change Assessment, California Natural Resources Agency. Publication number: CCCA4-CNRA-2018-001.
Keeley, J. E., & Swift, C. C. (1995). Biodiversity and Ecosystem Functioning in Mediterranean-Climate California. In Mediterranean-Type Ecosystems (pp. 121–183). Springer, Berlin, Heidelberg. https://doi.org/10.1007/978-3-642-78881-9_3
Kerr, A., Dialesandro, J., Steenwerth, K., Lopez-Brody, N., & Elias, E. (2017). Vulnerability of California specialty crops to projected mid-century temperature changes. Climatic Change, 18–2017. https://doi.org/10.1007/s10584-017-2011-3
Kersten, E., Morello-Frosch, R., Pastor, M., & Ramos, M. (2012). Facing the Climate Gap: How Environmental Justice Communities are Leading the Way to a More Sustainable and Equitable California. (p. 82).
Kirschbaum, M. U. F., & McMillan, A. M. S. (2018). Warming and elevated CO2 have opposing influences on transpiration. Which is more important? Current Forestry Reports, 4(2), 51–71. https://doi.org/10.1007/s40725-018-0073-8
Knowles, N., Dettinger, M. D., & Cayan, D. R. (2006). Trends in snowfall versus rainfall in the western United States. Journal of Climate, 19(18), 4545–4559. https://doi.org/10.1175/JCLI3850.1
Kolb, T. E., Fettig, C. J., Ayres, M. P., Bentz, B. J., Hicke, J. A., Mathiasen, R., … Weed, A. S. (2016). Observed and anticipated impacts of drought on forest insects and diseases in the United States. Forest Ecology and Management, 380, 321–334. https://doi.org/10.1016/j.foreco.2016.04.051
Kolby Smith, W., Reed, S. C., Cleveland, C. C., Ballantyne, A. P., Anderegg, W. R. L., Wieder, W. R., … Running, S. W. (2016). Large divergence of satellite and Earth system model estimates of global terrestrial CO2 fertilization. Nature Climate Change, 6(3), 306–310. https://doi.org/10.1038/nclimate2879
Krawchuk, M. A., & Moritz, M. A. (2011). Constraints on global fire activity vary across a resource gradient. Ecology, 92(1), 121–132. https://doi.org/10.1890/09-1843.1

Fourth Climate Change Assessment Statewide Summary Report | 114
CALIFORNIA’S FOURTH
CLIMATE CHANGE ASSESSMENT
Kroeker, K. J., Kordas, R. L., Crim, R., Hendriks, I. E., Ramajo, L., Singh, G. S., … Gattuso, J.-P. (2013). Impacts of ocean acidification on marine organisms: quantifying sensitivities and interaction with warming. Global Change Biology, 19(6), 1884–1896. https://doi.org/10.1111/gcb.12179
Kroeker, K. J., Kordas, R. L., Crim, R. N., & Singh, G. G. (2010). Meta-analysis reveals negative yet variable effects of ocean acidification on marine organisms: Biological responses to ocean acidification. Ecology Letters, 13(11), 1419–1434. https://doi.org/10.1111/j.1461-0248.2010.01518.x
Kueppers, L. M., Conlisk, E., Castanha, C., Moyes, A. B., Germino, M. J., de Valpine, P., … Mitton, J. B. (2017). Warming and provenance limit tree recruitment across and beyond the elevation range of subalpine forest. Global Change Biology, 23(6), 2383–2395. https://doi.org/10.1111/gcb.13561
Kunreuther, H., Heal, G., Allen, M., Edenhofer, O., Field, C. B., & Yohe, G. (2013). Risk management and climate change. Nature Climate Change, 3(5), 447–450. https://doi.org/10.1038/nclimate1740
Lach, D., & Rayner, S. (2017). Are forecasts still for wimps? Journal of the Southwest, 59(1–2), 245–263. https://doi.org/10.1353/jsw.2017.0013
Landrine, H., & Coral, I. (2009). Separate and unequal: residential segregation and black health disparities. Ethnicity & Disease, 19, 179–184.
Langridge, R. (2018). Central Coast Summary Report. California’s Fourth Climate Change Assessment. Publication number: SUM-CCC4A-2018-006.
Langridge, R., Sepaniak, S., Fencl, A., & Méndez, L.-E. (2018). Adapting to Climate Change and Drought in Selected California Groundwater Basins: Local Achievements and Challenges. California’s Fourth Climate Change Assessment. Publication number: CCCA4-EXT-2018-006.
Lauland, A., LaTourette, T., Lauland, A., Fischbach, J., Berg, N., & Stelzner, C. (2018). Assessing Vulnerability and Improving Resilience of Critical Emergency Management Infrastructure in California in a Changing Climate. California’s Fourth Climate Change Assessment, California Natural Resources Agency. Publication number: CCCA4-CNRA-2018-015.
Lavers, D. A., Ralph, F. M., Waliser, D. E., Gershunov, A., & Dettinger, M. D. (2015). Climate change intensification of horizontal water vapor transport in CMIP5: WATER VAPOR TRANSPORT IN CMIP5. Geophysical Research Letters, 42(13), 5617–5625. https://doi.org/10.1002/2015GL064672
Liang, S., Hurteau, M. D., & Westerling, A. L. (2017a). Potential decline in carbon carrying capacity under projected climate-wildfire interactions in the Sierra Nevada. Scientific Reports, 7(1). https://doi.org/10.1038/s41598-017-02686-0
Liang, S., Hurteau, M. D., & Westerling, A. L. (2017b). Response of Sierra Nevada forests to projected climate-wildfire interactions. Global Change Biology, 23(5), 2016–2030. https://doi.org/10.1111/gcb.13544

Fourth Climate Change Assessment Statewide Summary Report | 115
CALIFORNIA’S FOURTH
CLIMATE CHANGE ASSESSMENT
Liang, S., Hurteau, M. D., & Westerling, A. L. (2018). Large-scale restoration increases carbon stability under projected climate and wildfire regimes. Frontiers in Ecology and the Environment, 16(4), 207–212. https://doi.org/10.1002/fee.1791
Littell, J. S., McKenzie, D., Peterson, D. L., & Westerling, A. L. (2009). Climate and wildfire area burned in western U.S. ecoprovinces, 1916–2003. Ecological Applications, 19(4), 1003–1021. https://doi.org/10.1890/07-1183.1
Loarie, S. R., Carter, B. E., Hayhoe, K., McMahon, S., Moe, R., Knight, C. A., & Ackerly, D. D. (2008). Climate change and the future of California’s endemic flora. PLoS ONE, 3(6), e2502. https://doi.org/10.1371/journal.pone.0002502
Loarie, S. R., Duffy, P. B., Hamilton, H., Asner, G. P., Field, C. B., & Ackerly, D. D. (2009). The velocity of climate change. Nature, 462(7276), 1052–1055. https://doi.org/10.1038/nature08649
Locke, D. H., Han, S., Kondo, M. C., Murphy-Dunning, C., & Cox, M. (2017). Did community greening reduce crime? Evidence from New Haven, CT, 1996–2007. Landscape and Urban Planning, 161, 72–79. https://doi.org/10.1016/j.landurbplan.2017.01.006
Long, M. C., Deutsch, C., & Ito, T. (2016). Finding forced trends in oceanic oxygen. Global Biogeochemical Cycles, 30(2), 381–397. https://doi.org/10.1002/2015GB005310
Lubell, M. (2017). The Governance Gap: Climate Adaptation and Sea-Level Rise in the San Francisco Bay Area. University of California, Davis.
Lubetkin, K. C., Westerling, A. L., & Kueppers, L. M. (2017). Climate and landscape drive the pace and pattern of conifer encroachment into subalpine meadows. Ecological Applications, 27(6), 1876–1887. https://doi.org/10.1002/eap.1574
Lynn, E., Chair, C., O’Daly, W., Keeley, F., DSIWM, D., Woled, J., & DSIWM, D. (2015). Perspectives and Guidance for Climate Change Analysis. California Department of Water Resources (DWR) Climate Change Technical Advisory Group (CCTAG), 142.
Maendly, R. (2018). Development of Stage-Frequency Curves in the Sacramento – San Joaquin Delta for Climate Change and Sea Level Rise. California’s Fourth Climate Change Assessment. Publication number: CCCA4-EXT-2018-011.
Mahone, A., Subin, Z., Kahn-Lang, J., Allen, D., Li, V., De Moor, G., … Price, S. (2018). Deep Decarbonization in a Biofuels-Constrained World. California Energy Commission.
Malamud, B. D. (1998). Forest fires: An example of self-organized critical behavior. Science, 281(5384), 1840–1842. https://doi.org/10.1126/science.281.5384.1840
Malamud, B. D., Millington, J. D. A., & Perry, G. L. W. (2005). Characterizing wildfire regimes in the United States. Proceedings of the National Academy of Sciences, 102(13), 4694–4699. https://doi.org/10.1073/pnas.0500880102
Mankin, J. S., & Diffenbaugh, N. S. (2015). Influence of temperature and precipitation variability on near-term snow trends. Climate Dynamics, 45(3–4), 1099–1116. https://doi.org/10.1007/s00382-014-2357-4
Fourth Climate Change Assessment Statewide Summary Report | 116
CALIFORNIA’S FOURTH
CLIMATE CHANGE ASSESSMENT
Mann, M. E., & Gleick, P. H. (2015). Climate change and California drought in the 21st century. Proceedings of the National Academy of Sciences, 112(13), 3858–3859. https://doi.org/10.1073/pnas.1503667112
Mann, M. L., Batllori, E., Moritz, M. A., Waller, E. K., Berck, P., Flint, A. L., … Dolfi, E. (2016). Incorporating anthropogenic influences into fire probability models: Effects of human activity and climate change on fire activity in California. PLOS ONE, 11(4), e0153589. https://doi.org/10.1371/journal.pone.0153589
Mann, M. L., Berck, P., Moritz, M. A., Batllori, E., Baldwin, J. G., Gately, C. K., & Cameron, D. R. (2014). Modeling residential development in California from 2000 to 2050: Integrating wildfire risk, wildland and agricultural encroachment. Land Use Policy, 41, 438–452. https://doi.org/10.1016/j.landusepol.2014.06.020
Mao, Y., Nijssen, B., & Lettenmaier, D. P. (2015). Is climate change implicated in the 2013-2014 California drought? A hydrologic perspective. Geophysical Research Letters, 42(8), 2805–2813. https://doi.org/10.1002/2015GL063456
Marshall, K. N., Kaplan, I. C., Hodgson, E. E., Hermann, A., Busch, D. S., McElhany, P., … Fulton, E. A. (2017). Risks of ocean acidification in the California Current food web and fisheries: ecosystem model projections. Global Change Biology, 23(4), 1525–1539. https://doi.org/10.1111/gcb.13594
McCabe, R. M., Hickey, B. M., Kudela, R. M., Lefebvre, K. A., Adams, N. G., Bill, B. D., … Trainer, V. L. (2016). An unprecedented coastwide toxic algal bloom linked to anomalous ocean conditions. Geophysical Research Letters, 43(19), 10,366-10,376. https://doi.org/10.1002/2016GL070023
McGovern, L., Miller, G., & Huges-Cromwick, P. (2014, August 21). Health Policy Brief: The Relative Contribution of Multiple Determinants to Health Outcomes. Health Affairs. Retrieved from https://www.rwjf.org/content/dam/farm/reports/issue_briefs/2014/rwjf415185
McHale, C. M., Osborne, G., Morello-Frosch, R., Salmon, A. G., Sandy, M. S., Solomon, G., … Zeise, L. (2018). Assessing health risks from multiple environmental stressors: Moving from G × E to I × E. Mutation Research/Reviews in Mutation Research, 775, 11–20. https://doi.org/10.1016/j.mrrev.2017.11.003
McIntyre, P. J., Thorne, J. H., Dolanc, C. R., Flint, A. L., Flint, L. E., Kelly, M., & Ackerly, D. D. (2015). Twentieth-century shifts in forest structure in California: Denser forests, smaller trees, and increased dominance of oaks. Proceedings of the National Academy of Sciences, 112(5), 1458–1463. https://doi.org/10.1073/pnas.1410186112
McKibben, S. M., Peterson, W., Wood, A. M., Trainer, V. L., Hunter, M., & White, A. E. (2017). Climatic regulation of the neurotoxin domoic acid. Proceedings of the National Academy of Sciences, 114(2), 239–244. https://doi.org/10.1073/pnas.1606798114
McLachlan, J. S., Hellmann, J. J., & Schwartz, M. W. (2007). A framework for debate of assisted migration in an era of climate change. Conservation Biology, 21(2), 297–302. https://doi.org/10.1111/j.1523-1739.2007.00676.x
Fourth Climate Change Assessment Statewide Summary Report | 117
CALIFORNIA’S FOURTH
CLIMATE CHANGE ASSESSMENT
McMichael, A. J., & Lindgren, E. (2011). Climate change: present and future risks to health, and necessary responses: Review: Climate change and health. Journal of Internal Medicine, 270(5), 401–413. https://doi.org/10.1111/j.1365-2796.2011.02415.x
McNichol, E. (2017, August 10). It’s Time for States to Invest in Infrastructure. Retrieved June 18, 2018, from https://www.cbpp.org/research/state-budget-and-tax/its-time-for-states-to-invest-in-infrastructure
Medellín-Azuara, J., MacEwan, D., Howitt, R. E., Sumner, D. A., & Lund, J. R. (2016). Economic Analysis of the 2016 California Drought on Agriculture (p. 20). Davis, California: Center for Watershed Sciences University of California Davis. Retrieved from https://watershed.ucdavis.edu/files/DroughtReport_20160812.pdf
Medellín-Azuara, J., Sumner, D. A., Yolanda Pan, Q., Lee, H., Espinoza, V., Bell, A., … Lund, J. R. (2018). Economic and Environmental Implications of California Crop and Livestock, Adaptation to Climate Change. California’s Fourth Climate Change Assessment, California Natural Resources Agency. Publication number: CCCA4-CNRA-2018-018.
Medellín-Azuara, J., MacEwan, D., Howitt, R., Koruakos, G., Dogrul, E., Brush, C., … Lund, J. (2015). Hydro-economic analysis of groundwater pumping for irrigated agriculture in California’s Central Valley, USA. Hydrogeology Journal. Retrieved from https://link.springer.com/article/10.1007/s10040-015-1283-9
Meerow, S., Newell, J. P., & Stults, M. (2016). Defining urban resilience: A review. Landscape and Urban Planning, 147, 38–49. https://doi.org/10.1016/j.landurbplan.2015.11.011
Meigs, G. W., Zald, H. S. J., Campbell, J. L., Keeton, W. S., & Kennedy, R. E. (2016). Do insect outbreaks reduce the severity of subsequent forest fires? Environmental Research Letters, 11(4), 045008. https://doi.org/10.1088/1748-9326/11/4/045008
Meyn, A., White, P. S., Buhk, C., & Jentsch, A. (2007). Environmental drivers of large, infrequent wildfires: the emerging conceptual model. Progress in Physical Geography, 31(3), 287–312. https://doi.org/10.1177/0309133307079365
Michalak, A. M. (2016). Study role of climate change in extreme threats to water quality. Nature News, 535(7612), 349. https://doi.org/10.1038/535349a
Mickley, L. (2007). A future short of breath? Possible effects of climate change on smog. Environment, 49, 32–43. https://doi.org/10.3200/ENVT.49.6.34-43
Mietkiewicz, N., & Kulakowski, D. (2016). Relative importance of climate and mountain pine beetle outbreaks on the occurrence of large wildfires in the western USA. Ecological Applications, 26(8), 2525–2537. https://doi.org/10.1002/eap.1400
Milly, P. C. D., & Dunne, K. A. (2016). Potential evapotranspiration and continental drying. Nature Climate Change, 6(10), 946–949. https://doi.org/10.1038/nclimate3046
Fourth Climate Change Assessment Statewide Summary Report | 118
CALIFORNIA’S FOURTH
CLIMATE CHANGE ASSESSMENT
Mitchell, J. P., Shrestha, A., Mathesius, K., Scow, K. M., Southard, R. J., Haney, R. L., … Horwath, W. R. (2017). Cover cropping and no-tillage improve soil health in an arid irrigated cropping system in California’s San Joaquin Valley, USA. Soil and Tillage Research, 165, 325–335. https://doi.org/10.1016/j.still.2016.09.001
Mitchell, J. P., Singh, P. N., Wallender, W. W., Munk, D. S., Wroble, J. F., Horwath, W. R., … Hanson, B. R. (2012). No-tillage and high-residue practices reduce soil water evaporation. California Agriculture, 66(2), 55–61. https://doi.org/10.3733/ca.v066n02p55
Moezzi, M., Lutzenhiser, L., Ingle, A., & Wilhite, H. (2018). Sixteen Ways Energy Efficiency Researchers See People + Why it Matters for Climate Change. California’s Fourth Climate Change Assessment. Publication number: EXT-CCC4A-2018-008.
Moghaddas, J., Roller, G., Long, J., Saah, D., Moritz, M., Stark, D., … Gunn, J. (2018). Fuel Treatment for Forest Resilience and Climate Mitigations: A Critical Review for Coniferous Forests of the Sierra Nevada, Southern Cascade, Coast, Klamath, and Transverse Ranges. California’s Fourth Climate Change Assessment, California Natural Resources Agency. Publication number: CCCA4-CNRA-2018-017.
Mokdad, A. H., Marks, J. S., Stroup, D. F., & Gerberding, J. L. (2004). Actual causes of death in the United States, 2000. JAMA, 291(10), 1238–1245. https://doi.org/10.1001/jama.291.10.1238
Monleon, V. J., & Lintz, H. E. (2015). Evidence of tree species’ range shifts in a complex landscape. PLOS ONE, 10(1), e0118069. https://doi.org/10.1371/journal.pone.0118069
Moore, S. K., Trainer, V. L., Mantua, N. J., Parker, M. S., Laws, E. A., Backer, L. C., & Fleming, L. E. (2008). Impacts of climate variability and future climate change on harmful algal blooms and human health. Environmental Health, 7(Suppl 2), S4. https://doi.org/10.1186/1476-069X-7-S2-S4
Morgan, M. G. (2014). Use (and abuse) of expert elicitation in support of decision making for public policy. Proceedings of the National Academy of Sciences of the United States of America, 111(20), 7176–7184. https://doi.org/10.1073/pnas.1319946111
Moritz, M. A. (1997). Analyzing extreme disturbance events: Fire in Los Padres national forest. Ecological Applications, 7(4), 1252–1262. https://doi.org/10.1890/1051-0761(1997)007[1252:AEDEFI]2.0.CO;2
Moritz, M. A., Batllori, E., Bradstock, R. A., Gill, A. M., Handmer, J., Hessburg, P. F., … Syphard, A. D. (2014). Learning to coexist with wildfire. Nature, 515(7525), 58–66. https://doi.org/10.1038/nature13946
Moritz, M. A., Moody, T. J., Krawchuk, M. A., Hughes, M., & Hall, A. (2010). Spatial variation in extreme winds predicts large wildfire locations in chaparral ecosystems. Geophysical Research Letters, 37(4). https://doi.org/10.1029/2009GL041735
Moser, S. C., Ekstrom, J. A., Kim, J., & Heitsch, S. (2018). Adaptation Finance Challenges: Characteristic Patterns Facing California Local Governments and Ways to Overcome Them. California’s Fourth Climate Change Assessment, California Natural Resources Agency. Publication number: CCCA4-CNRA-2018-007.
Fourth Climate Change Assessment Statewide Summary Report | 119
CALIFORNIA’S FOURTH
CLIMATE CHANGE ASSESSMENT
Moser, Susanne C., & Ekstrom, J. A. (2012). Identifying and Overcoming Barriers to Climate Change Adaptation in San Francisco Bay: Results from Case Studies (No. CEC-500-2012-034). California Energy Commission. Retrieved from http://www.energy.ca.gov/2012publications/CEC-500-2012-034/CEC-500-2012-034.pdf
Moser, S. & Finzi-Hart, J. (2018). Adaptation Blind Spot-Electrical Grid Teleconnected and Cascading Climate Change Impacts on Community Lifelines in Los Angeles. California’s Fourth Climate Change Assessment, California Energy Commission. Publication number: CCCA4-CEC-2018-008.
Moser, Susanne C., Finzi Hart, J. A., Newton Mann, A. G., Sadrpour, N., & Grifman, P. M. (2018). Growing Effort, Growing Challenge: Findings from the 2016 CA Coastal Adaptation Needs Assessment Survey. California’s Fourth Climate Change Assessment. Publication number: CCCA4-EXT-2018-009.
Moser, Susanne C., & Finzi-Hart, J. A. (2015). The long arm of climate change: societal teleconnections and the future of climate change impacts studies. Climatic Change, 129(1–2), 13–26. https://doi.org/10.1007/s10584-015-1328-z
Mote, P. W., Hamlet, A. F., Clark, M. P., & Lettenmaier, D. P. (2005). Declining mountain snowpack in western North America. Bulletin of the American Meteorological Society, 86(1), 39–50. https://doi.org/10.1175/BAMS-86-1-39
Mote, P. W., Li, S., Lettenmaier, D. P., Xiao, M., & Engel, R. (2018). Dramatic declines in snowpack in the western US. Npj Climate and Atmospheric Science, 1(1). https://doi.org/10.1038/s41612-018-0012-1
Mount, J., Gray, B., Chappelle, C., Gartrell, G., Grantham, T., Moyle, P., … Thompson, B. “Buzz.” (2017). Managing California’s Freshwater Ecosystems: Lessons from the 2012-16 Drought (p. 54). Retrieved from http://www.ppic.org/wp-content/uploads/r_1117jmr.pdf
Moyle, P. B. (2014). Novel aquatic ecosystems: The new reality for streams in California and other Mediterranean climate regions. River Research and Applications, 30(10), 1335–1344. https://doi.org/10.1002/rra.2709
Moyle, Peter B., Kiernan, J. D., Crain, P. K., & Quiñones, R. M. (2013). Climate change vulnerability of native and alien freshwater fishes of California: A systematic assessment approach. PLOS ONE, 8(5), e63883. https://doi.org/10.1371/journal.pone.0063883
Mukherjee, M., & Schwabe, K. (2015). Irrigated agricultural adaptation to water and climate variability: The economic value of a water portfolio. American Journal of Agricultural Economics, 97(3), 809–832. https://doi.org/10.1093/ajae/aau101
Munday, P. L., Dixson, D. L., Donelson, J. M., Jones, G. P., Pratchett, M. S., Devitsina, G. V., & Døving, K. B. (2009). Ocean acidification impairs olfactory discrimination and homing ability of a marine fish. Proceedings of the National Academy of Sciences, 106(6), 1848–1852. https://doi.org/10.1073/pnas.0809996106
Myers, N., Mittermeier, R. A., Mittermeier, C. G., da Fonseca, G. A. B., & Kent, J. (2000). Biodiversity hotspots for conservation priorities. Nature, 403(6772), 853–858. https://doi.org/10.1038/35002501

Fourth Climate Change Assessment Statewide Summary Report | 120
CALIFORNIA’S FOURTH
CLIMATE CHANGE ASSESSMENT
National Research Council. (2012). Sea-Level Rise for the Coasts of California, Oregon, and Washington: Past, Present, and Future. National Research Council. https://doi.org/10.17226/13389
National Research Council, Transportation Research Board, & Committee on Climate Change and US Transportation. (2008). Potential Impacts of Climate Change on US Transportation: Special Report 290. Washington DC, USA: Transportation Research Board.
Neelin, J. D., Langenbrunner, B., Meyerson, J. E., Hall, A., & Berg, N. (2013). California winter precipitation change under global warming in the Coupled Model Intercomparison Project Phase 5 ensemble. Journal of Climate, 26(17), 6238–6256. https://doi.org/10.1175/JCLI-D-12-00514.1
Neumann, J. E., Price, J., Chinowsky, P., Wright, L., Ludwig, L., Streeter, R., … Martinich, J. (2015). Climate change risks to US infrastructure: impacts on roads, bridges, coastal development, and urban drainage. Climatic Change, 131(1), 97–109. https://doi.org/10.1007/s10584-013-1037-4
Neuteleers, S., & Engelen, B. (2015). Talking money: How market-based valuation can undermine environmental protection. Ecological Economics 117. https://doi.org/10.1016/j.ecolecon.2014.06.022
Newkirk, S., Veloz, S., Hayden, M., Heady, W., Leo, K., Judge, J., … Small, M. (2018). Toward Natural Infrastructure to Manage Shoreline Change in California. California’s Fourth Climate Change Assessment, California Natural Resources Agency. Publication number: CCCA4-CNRA-2018-011.
Newton Mann, A., Grifman, P., & Hart, J. F. (2017). The stakes are rising: Lessons on engaging coastal communities on climate adaptation in Southern California. Cities and the Environment (CATE), 10(2). Retrieved from http://digitalcommons.lmu.edu/cate/vol10/iss2/6
Nielsen, K., Stachowicz, J., Carter, H., … Wheeler, S. (2018). Emerging understanding of the potential role of seagrass and kelp as an ocean acidification management tool in California. California Ocean Science Trust. http://www.oceansciencetrust.org/wp-content/uploads/2018/01/OA-SAV-emerging-findings-report-1.30.18.pdf
Niles, M. T., Lubell, M., & Haden, V. R. (2013). Perceptions and responses to climate policy risks among California farmers. Global Environmental Change, 23(6), 1752–1760. https://doi.org/10.1016/j.gloenvcha.2013.08.005
North, M. P., Stephens, S. L., Collins, B. M., Agee, J. K., Aplet, G., Franklin, J. F., & Fule, P. Z. (2015). Reform forest fire management. Science, 349(6254), 1280–1281. https://doi.org/10.1126/science.aab2356
Office of Environmental Health Hazard Assessment, California Environmental Protection Agency. (2018). Indicators of Climate Change in California. Retrieved from https://oehha.ca.gov/media/downloads/climate-change/report/2018caindicatorsreportmay2018.pdf
Fourth Climate Change Assessment Statewide Summary Report | 121
CALIFORNIA’S FOURTH
CLIMATE CHANGE ASSESSMENT
O’Geen, A., Saal, M., Dahlke, H., Doll, D., Elkins, R., Fulton, A., … Walkinshaw, M. (2015). Soil suitability index identifies potential areas for groundwater banking on agricultural lands. California Agriculture, 69(2), 75–84.
O’Hagan, A., Buck, C., Daneshkhah,, A., Eiser, J. R., Garthwaite, P., Jenkinson, D., … Rakow, T. (2006). Uncertain Judgements: Eliciting Experts’ Probabilities. Wiley & Sons. Retrieved from https://www.wiley.com/en-us/Uncertain+Judgements%3A+Eliciting+Experts%27+Probabilities-p-9780470029992
Opperman, J. J., Moyle, P. B., Larsen, E. W., Florsheim, J. L., & Manfree, A. D. (2017). Floodplains: Processes and Management for Ecosystem Services. Oakland, California: University of California Press.
Orozco, G. L. (2010). The 2007 California citrus freeze: vulnerability, poverty, and unemployment issues of farmworkers. Journal of Employment Counseling, 47(3), 100–110. https://doi.org/10.1002/j.2161-1920.2010.tb00095.x
Ostro, B., Rauch, S., & Green, S. (2011). Quantifying the health impacts of future changes in temperature in California. Environmental Research, 111(8), 1258–1264. https://doi.org/10.1016/j.envres.2011.08.013
Overpeck, J., Garfin, G., Jardine, A., Busch, D. E., Cayan, D., Dettinger, M., … Udall, B. (2013). Summary for Decision Makers. In G. Garfin, A. Jardine, R. Merideth, M. Black, & S. LeRoy (Eds.), Assessment of Climate Change in the Southwest United States (pp. 1–20). Washington, DC: Island Press/Center for Resource Economics. https://doi.org/10.5822/978-1-61091-484-0_1
Paine, R. T., Tegner, M. J., & Johnson, E. A. (1998). Compounded perturbations yield ecological surprises. Ecosystems, 1(6), 535–545. https://doi.org/10.1007/s100219900049
Park Williams, A., Allen, C. D., Macalady, A. K., Griffin, D., Woodhouse, C. A., Meko, D. M., … McDowell, N. G. (2013). Temperature as a potent driver of regional forest drought stress and tree mortality. Nature Climate Change, 3(3), 292–297. https://doi.org/10.1038/nclimate1693
Parker, L. E., & Abatzoglou, J. T. (2018). Shifts in the thermal niche of almond under climate change. Climatic Change, 147(1–2), 211–224. https://doi.org/10.1007/s10584-017-2118-6
Parrish, D. D., Petropavlovskikh, I., & Oltmans, S. J. (2017). Reversal of long-term trend in baseline ozone concentrations at the North American west coast: U.S. baseline ozone trend r eversal. Geophysical Research Letters, 44(20), 10,675-10,681. https://doi.org/10.1002/2017GL074960
Parrish, David D., Young, L. M., Newman, M. H., Aikin, K. C., & Ryerson, T. B. (2017). Ozone design values in Southern California’s air basins: Temporal evolution and U.S. background contribution: Southern California ozone design values. Journal of Geophysical Research: Atmospheres, 122(20), 11,166-11,182. https://doi.org/10.1002/2016JD026329
Pathak, T., Maskey, M., Dahlberg, J., Kearns, F., Bali, K., & Zaccaria, D. (2018). Climate change trends and impacts on California agriculture: A detailed review. Agronomy, 8(3), 25. https://doi.org/10.3390/agronomy8030025

Fourth Climate Change Assessment Statewide Summary Report | 122
CALIFORNIA’S FOURTH
CLIMATE CHANGE ASSESSMENT
Paton, D., & Johnston, D. (2017). Disaster Resilience: An Integrated Approach (2nd Ed.). Charles C Thomas Publisher.
Pendleton, L., King, P., Mohn, C., Webster, D.G., Vaughn, R. Adams, P.N. (2011). Estimating the potential economic impacts of climate change on Southern California beaches. Climatic Change 109(Suppl 1). DOI 10.1007/s10584-011-0309-0
Perovich, D., Meier, W., Tschudi, M., Farrell, S., Hendricks, S., Gerland, S., … Webster, M. (2017). Sea Ice. Arctic Program. Retrieved from https://www.arctic.noaa.gov/Report-Card/Report-Card-2017/ArtMID/7798/ArticleID/699/Sea-Ice
Phillips, J., & Sievanen, L. (2018). California’s Ocean and Coast Summary Report. California’s Fourth Climate Change Assessment. Publication number: SUM-CCC4A-2018-011.
Pierce, D. W., Cayan, D. R., & Kalansky, J. F. (2018). Climate, Drought, and Sea Level Rise Scenarios for the Fourth California Climate Assessment. California’s Fourth Climate Change Assessment, California Energy Commission. Publication number: CCCA4-CEC-2018-006.
Pierce, David W., Barnett, T. P., Hidalgo, H. G., Das, T., Bonfils, C., Santer, B. D., … Nozawa, T. (2008). Attribution of declining western U.S. snowpack to human effects. Journal of Climate, 21(23), 6425–6444. https://doi.org/10.1175/2008JCLI2405.1
Pierce, David W., & Cayan, D. R. (2013). The uneven response of different snow measures to human-induced climate warming. Journal of Climate, 26(12), 4148–4167. https://doi.org/10.1175/JCLI-D-12-00534.1
Pierce, David W., Cayan, D. R., Maurer, E. P., Abatzoglou, J. T., & Hegewisch, K. C. (2015). Improved bias correction techniques for hydrological simulations of climate change*. Journal of Hydrometeorology, 16(6), 2421–2442. https://doi.org/10.1175/JHM-D-14-0236.1
Pierce, David W., Cayan, D. R., & Thrasher, B. L. (2014). Statistical downscaling using localized constructed analogs (LOCA)*. Journal of Hydrometeorology, 15(6), 2558–2585. https://doi.org/10.1175/JHM-D-14-0082.1
Polade, S. D., Gershunov, A., Cayan, D. R., Dettinger, M. D., & Pierce, D. W. (2017). Precipitation in a warming world: Assessing projected hydro-climate changes in California and other Mediterranean climate regions. Scientific Reports, 7(1). https://doi.org/10.1038/s41598-017-11285-y
Pope Francis. (2015). “Laudato si.” The Holy See. http://w2.vatican.va/content/francesco/en/encyclicals/documents/papa-francesco_20150524_enciclica-laudato-si.html
Porter, K., Wein, A., Alpers, C., Baez, A., Barnard, P., Carter, J., … Wills, C. (2011). Overview of the ARkStorm Scenario (p. 183). U.S. Department of the Interior, U.S. Geological Survey. Retrieved from https://pubs.usgs.gov/of/2010/1312/of2010-1312_text.pdf
PRISM, 2018. Accessed July, 2018. Thirty-year average maps for the U.S., available at http://www.prism.oregonstate.edu/normals/.

Fourth Climate Change Assessment Statewide Summary Report | 123
CALIFORNIA’S FOURTH
CLIMATE CHANGE ASSESSMENT
Quiñones, R. M., & Moyle, Peter B. (2015). California’s freshwater fishes: status and management. Fishes in Mediterranean Environments, 2015. https://doi.org/10.29094/FiSHMED.2015.001
Radeloff, V. C., Helmers, D. P., Kramer, H. A., Mockrin, M. H., Alexandre, P. M., Bar-Massada, A., … Stewart, S. I. (2018). Rapid growth of the US wildland-urban interface raises wildfire risk. Proceedings of the National Academy of Sciences, 115(13), 3314–3319. https://doi.org/10.1073/pnas.1718850115
Radke, J. D., Biging, G. S., Roberts, K., Schmidt-Poolman, M., Foster, H., Roe, E., … Dalal, A. (2018). Assessing Extreme Weather-Related Vulnerability and Identifying Resilience Options for California’s Independent Transportation Fuel Sector. California’s Fourth Climate Change Assessment, California Energy Commission. Publication Number: CCCA4-CEC-2018-012.
Radke, J. D., Biging, G. S., Schmidt-Poolman, M., Foster, H., Roe, E., Ju, Y., … Reeves, I. (2016). Assessment of Bay Area Natural Gas Pipeline Vulnerability to Climate Change (No. CEC-500-2017-008). California Energy Commission.
Raffa, K. F., Aukema, B. H., Bentz, B. J., Carroll, A. L., Hicke, J. A., Turner, M. G., & Romme, W. H. (2008). Cross-scale Drivers of Natural Disturbances Prone to Anthropogenic Amplification: The Dynamics of Bark Beetle Eruptions. BioScience, 58(6), 501–517. https://doi.org/10.1641/B580607
Ralph, F. M., & Dettinger, M. D. (2011). Storms, floods, and the science of atmospheric rivers. Eos, Transactions American Geophysical Union, 92(32), 265. https://doi.org/10.1029/2011EO320001
Rasmussen, D. J., Hu, J., Mahmud, A., & Kleeman, M. J. (2013). The ozone-climate penalty: past, present, and future. Environmental Science & Technology, 47(24), 14258–14266. https://doi.org/10.1021/es403446m
Rasmusson, E. M., & Mo, K. (1993). Linkages between 200-mb tropical and extratropical circulation anomalies during the 1986–1989 ENSO Cycle. Journal of Climate, 6(4), 595–616. https://doi.org/10.1175/1520-0442(1993)006<0595:LBMTAE>2.0.CO;2
Rice, J. L., Woodhouse, C. A., & Lukas, J. J. (2009). Science and decision making: Water management and tree-ring data in the western United States. JAWRA Journal of the American Water Resources Association, 45(5), 1248–1259. https://doi.org/10.1111/j.1752-1688.2009.00358.x
Riley, K., Wilhalme, H., Delp, L., & Eisenman, D. P. (2018). Mortality and morbidity during extreme heat events and prevalence of outdoor work: An analysis of community-level data from Los Angeles county, California. International Journal of Environmental Research and Public Health, 15(4). https://doi.org/10.3390/ijerph15040580
Roche, J. W., Goulden, M. L., & Bales, R. C. (2018). Estimating evapotranspiration change due to forest treatment and fire at the basin scale in the Sierra Nevada, California: Forest Disturbance and Evapotranspiration Change. Ecohydrology, e1978. https://doi.org/10.1002/eco.1978
Rockström, J., Gaffney, O., Rogelj, J., Meinshausen, M., Nakicenovic, N., & Schellnhuber, H. J. (2017). A roadmap for rapid decarbonization. Science, 355(6331), 1269–1271. https://doi.org/10.1126/science.aah3443
Fourth Climate Change Assessment Statewide Summary Report | 124
CALIFORNIA’S FOURTH
CLIMATE CHANGE ASSESSMENT
Rodin, J. (2014). The Resilience Dividend: Being Strong in a World Where Things Go Wrong. PublicAffairs.
Roe, E., & Schulman, P. R. (2015). Comparing emergency response infrastructure to other critical infrastructures in the California Bay-Delta of the United States: A research note on inter-infrastructural differences in reliability management: Inter-infrastructural differences in reliability management. Journal of Contingencies and Crisis Management, 23(4), 193–200. https://doi.org/10.1111/1468-5973.12083
Roland-Holst, D., Evans, S., Heft-Neal, S., Behnke, D., & Lucy Shim, M. (2018). Exploring Economic Impacts in Long-Term California Energy Scenarios: Technical Documentation. Berkeley, CA: Berkeley Economic Advising and Research.
Roos, M. (2018). Climate Justice Summary Report. California’s Fourth Climate Change Assessment. Publication number: SUM-CCC4A-2018-012.
Rosenzweig, C., & Solecki, W. (Eds.). (2013). Climate Risk Information 2013: Observations, Climate Change Projections, and Maps. New York City Panel on Climate Change. Retrieved from https://pubs.giss.nasa.gov/abs/ro04310p.html
Rothstein, R. (2017). The Color of Law: A Forgotten History of How Our Government Segregated America (1 edition). New York London: Liveright.
Rutherford, J., & Coutard, O. (2014). Urban energy transitions: Places, processes and politics of socio-technical change. Urban Studies, 51(7), 1353–1377. https://doi.org/10.1177/0042098013500090
Safford, H. D., Schmidt, D. A., & Carlson, C. H. (2009). Effects of fuel treatments on fire severity in an area of wildland–urban interface, Angora Fire, Lake Tahoe Basin, California. Forest Ecology and Management, 258(5), 773–787. https://doi.org/10.1016/j.foreco.2009.05.024
San Francisco International Airport Five-Year Capital Plan: Fiscal Year 2015/16 - Fiscal Year 2019/20. (2015, July 1). San Francisco International Airport. Retrieved from https://media.flysfo.com/media/sfo/about-sfo/capital-plan-fy1516_1.pdf
Sanderson, B. M., O’Neill, B. C., & Tebaldi, C. (2016). What would it take to achieve the Paris temperature targets? Geophysical Research Letters, 43(13), 7133–7142. https://doi.org/10.1002/2016GL069563
Schlosberg, D. (2007). Defining Environmental Justice: Theories, Movements, and Nature. Oxford University Press.
Schwartz, M. W., Butt, N., Dolanc, C. R., Holguin, A., Moritz, M. A., North, M. P., … van Mantgem, P. J. (2015). Increasing elevation of fire in the Sierra Nevada and implications for forest change. Ecosphere, 6(7), art121. https://doi.org/10.1890/ES15-00003.1
Schwarz, A., Ray, P., Wi, S., Brown, C., He, M., & Correa, M. (2018). Climate Change Risks Faced by the California Central Valley Water Resource System. California’s Fourth Climate Change Assessment. Publication number: CCCA4-EXT-2018-001.
Fourth Climate Change Assessment Statewide Summary Report | 125
CALIFORNIA’S FOURTH
CLIMATE CHANGE ASSESSMENT
Schweikert, A., Chinowsky, P., Espinet, X., & Tarbert, M. (2014). Climate Change and Infrastructure impacts: Comparing the impact on roads in ten countries through 2100. Procedia Engineering, 78, 306–316. https://doi.org/10.1016/j.proeng.2014.07.072
Seager, R., Neelin, D., Simpson, I., Liu, H., Henderson, N., Shaw, T., … Cook, B. (2014). Dynamical and thermodynamical causes of large-scale changes in the hydrological cycle over North America in response to global warming*. Journal of Climate, 27(20), 7921–7948. https://doi.org/10.1175/JCLI-D-14-00153.1
Seaman, K. (2015, June 24). DFSP Point Loma Fuel Storage Facility Becomes First to Receive LEED Certification, With White XR-5® Geomembrane for Secondary Containment. Retrieved May 25, 2018, from http://www.seamancorp.com/news/dfsp-point-loma-fuel-storage-facility-becomes-first-to-receive-leed-certification-with-white-xr-5%C2%AE-geomembrane-for-secondary-containment
Seo, C., Thorne, J. H., Hannah, L., & Thuiller, W. (2009). Scale effects in species distribution models: implications for conservation planning under climate change. Biology Letters, 5(1), 39–43. https://doi.org/10.1098/rsbl.2008.0476
Serra-Diaz, J. M., Franklin, J., Dillon, W. W., Syphard, A. D., Davis, F. W., & Meentemeyer, R. K. (2016). California forests show early indications of both range shifts and local persistence under climate change: Early indications of tree range shifts. Global Ecology and Biogeography, 25(2), 164–175. https://doi.org/10.1111/geb.12396
Sewall, J. O. (2005). Precipitation shifts over western North America as a result of declining Arctic sea ice cover: The coupled system response. Earth Interactions, 9(26), 1–23. https://doi.org/10.1175/EI171.1
Sewall, J. O., & Sloan, L. C. (2004). Disappearing Arctic sea ice reduces available water in the American west: Reduced Arctic Ice and American Water. Geophysical Research Letters, 31(6), n/a-n/a. https://doi.org/10.1029/2003GL019133
Shen, L., Mickley, L. J., & Murray, L. T. (2017). Influence of 2000–2050 climate change on particulate matter in the United States: results from a new statistical model. Atmospheric Chemistry and Physics, 17(6), 4355–4367. https://doi.org/10.5194/acp-17-4355-2017
Sherbakov, T., Malig, B., Guirguis, K., Gershunov, A., & Basu, R. (2018). Ambient temperature and added heat wave effects on hospitalizations in California from 1999 to 2009. Environmental Research, 160, 83–90. https://doi.org/10.1016/j.envres.2017.08.052
Silver, W. L., Vergara, S. E., & Mayer, A. (2018). Carbon Sequestration and Greenhouse Gas Mitigation Potential of Composting and Soil Amendments on California’s Rangelands. California’s Fourth Climate Change Assessment, California Natural Resources Agency. Publication number: CCCA4-CNRA-2018-002.
Simon, G. L., & Dooling, S. (2013). Flame and fortune in California: The material and political dimensions of vulnerability. Global Environmental Change, 23(6), 1410–1423. https://doi.org/10.1016/j.gloenvcha.2013.08.008
Fourth Climate Change Assessment Statewide Summary Report | 126
CALIFORNIA’S FOURTH
CLIMATE CHANGE ASSESSMENT
Six, D., Biber, E., & Long, E. (2014). Management for mountain pine beetle outbreak suppression: Does relevant science support current policy? Forests, 5(1), 103–133. https://doi.org/10.3390/f5010103
Sleeter, B. M., Wilson, T. S., Sharygin, E., & Sherba, J. T. (2017). Future scenarios of land change based on empirical data and demographic trends. Earth’s Future, 5(11), 1068–1083. https://doi.org/10.1002/2017EF000560
SoCalGas. (2016). Chapter SCG-4 Catastrophic Damage Involving a High-Pressure Gas Pipeline Failure. In Risk Assessment and Mitigation Phase Risk Mitigation Plan. Retrieved from https://socalgas.com/regulatory/documents/i-16-10-016/SCG-4_RAMP_Catastrophic_Damage_Involving_a_High-Pressure_Pipeline_Failure_FINAL.pdf
Solins, J. P., Thorne, J. H., & Cadenasso, M. L. (2018). Riparian canopy expansion in an urban landscape: Multiple drivers of vegetation change along headwater streams near Sacramento, California. Landscape and Urban Planning, 172, 37–46. https://doi.org/10.1016/j.landurbplan.2017.12.005
Sriver, R. L., Lempert, R. J., Wikman-Svahn, P., & Keller, K. (2018). Characterizing uncertain sea-level rise projections to support investment decisions. PLOS ONE, 13(2), e0190641. https://doi.org/10.1371/journal.pone.0190641
Stanton, C. Y., Mach, K. J., Turner, P. A., Lalonde, S. J., Sanchez, D. L., & Field, C. B. (2018). Managing cropland and rangeland for climate mitigation: an expert elicitation on soil carbon in California. Climatic Change. https://doi.org/10.1007/s10584-018-2142-1
Steinberg, N. C., Mazzacurati, E., Turner, J., Gannon, C., Dickinson, R., Snyder, M., & Thrasher, B. (2018). Preparing Public Health Officials for Climate Change: A Decision Support Tool. California’s Fourth Climate Change Assessment, California Natural Resources Agency. Publication number: CCCA4-CNRA-2018-012.
Stephens, S. L., Collins, B. M., Fettig, C. J., Finney, M. A., Hoffman, C. M., Knapp, E. E., … Wayman, R. B. (2018). Drought, tree mortality, and wildfire in forests adapted to frequent fire. BioScience, 68(2), 77–88. https://doi.org/10.1093/biosci/bix146
Stephenson, N. L., Das, A. J., Ampersee, N. J., Cahill, K. G., Caprio, A. C., Sanders, J. E., & Williams, A. P. (2018). Patterns and correlates of giant sequoia foliage dieback during California’s 2012–2016 hotter drought. Forest Ecology and Management, 419–420, 268–278. https://doi.org/10.1016/j.foreco.2017.10.053
Stern, M., Flint, L., Minear, J., Flint, A., & Wright, S. (2016). Characterizing changes in streamflow and sediment supply in the Sacramento River basin, California, using hydrological simulation program—FORTRAN (HSPF). Water, 8(10), 432. https://doi.org/10.3390/w8100432
Stone, B., Vargo, J., & Habeeb, D. (2012). Managing climate change in cities: Will climate action plans work? Landscape and Urban Planning, 107(3), 263–271. https://doi.org/10.1016/j.landurbplan.2012.05.014
Strategic Issues Panel on Fire Suppression Costs. (2004). Large Fire Suppression Costs: Strategies for Cost Management. Retrieved from https://www.forestsandrangelands.gov/resources/reports/documents/2004/costmanagement.pdf
Fourth Climate Change Assessment Statewide Summary Report | 127
CALIFORNIA’S FOURTH
CLIMATE CHANGE ASSESSMENT
Strauss, D., Bednar, L., & Mees, R. (1989). Do one percent of the forest fires cause ninety-nine percent of the damage? Forest Science, 35(2), 319–328. https://doi.org/10.1093/forestscience/35.2.319
Sumner, D. A., Medellín-Azuara, J., & Coughlin, E. (2015). Contributions of the California Dairy Industry to the California Economy. University of California Agricultural Issues Center. Retrieved from http://aic.ucdavis.edu/publications/CMABReport2015.pdf
Swain, D. L., Langenbrunner, B., Neelin, J. D., & Hall, A. (2018). Increasing precipitation volatility in twenty-first-century California. Nature Climate Change, 8(5), 427–433. https://doi.org/10.1038/s41558-018-0140-y
Swann, A. L. S., Hoffman, F. M., Koven, C. D., & Randerson, J. T. (2016). Plant responses to increasing CO reduce estimates of climate impacts on drought severity. Proceedings of the National Academy of Sciences, 113(36), 10019–10024. https://doi.org/10.1073/pnas.1604581113
Taha, H., Ban-Weiss, G., Chen, S., Gilbert, H., Goudey, H., Ko, J., … Levinson, R. (2018). Modeling and Observations to Detect Neighborhood-Scale Heat Islands to Inform Effective Countermeasures in Los Angeles. California’s Fourth Climate Change Assessment, California Energy Commission. Publication number: CCCA4-CEC-2018-007.
Tarroja, B., Chiang, F., AghaKouchak, A., Samuelsen, S., Raghavan, S. V., Wei, M., … Hong, T. (2018). Translating climate change and heating system electrification impacts on building energy use to future greenhouse gas emissions and electric grid capacity requirements in California. Applied Energy, 225, 522–534. https://doi.org/10.1016/j.apenergy.2018.05.003
Thomas, N., Mukhtyar, S., Galey, B., & Kelly, M. (2018). Visualizing Climate-Related Risks to the Natural Gas System using Cal-Adapt. California’s Fourth Climate Change Assessment, California Energy Commission. Publication number: CCCA4-CEC-2018-015.
Thompson, J. R., & Spies, T. A. (2010). Factors associated with crown damage following recurring mixed-severity wildfires and post-fire management in southwestern Oregon. Landscape Ecology, 25(5), 775–789. https://doi.org/10.1007/s10980-010-9456-3
Thorne, J. H., Boynton, R. M., Holguin, A. J., Stewart, J. A. E., & Bjorkman, J. (2016). A climate change vulnerability assessment of California’s terrestrial vegetation (p. 331). Sacramento, CA: California Department of Fish and Wildlife (CDFW). Retrieved from https://www.researchgate.net/profile/Joseph_Stewart4/publication/296639897_A_climate_change_vulnerability_assessment_of_California’s_terrestrial_vegetation/links/56d72def08aee1aa5f75c693/A-climate-change-vulnerability-assessment-of-Californias-terrestrial-vegetation.pdf
Thorne, James H., Bjorkman, J., & Roth, N. (2012). Urban Growth in California: Projecting Growth in California (2000–2050) Under Six Alternative Policy Scenarios and Assessing Impacts to Future Dispersal Corridors, Fire Threats and Climate-Sensitive Agriculture. California Energy Commission. Retrieved from http://www.energy.ca.gov/2012publications/CEC-500-2012-009/CEC-500-2012-009.pdf

Fourth Climate Change Assessment Statewide Summary Report | 128
CALIFORNIA’S FOURTH
CLIMATE CHANGE ASSESSMENT
Thorne, James H., Boynton, R. M., Flint, L. E., & Flint, A. L. (2015). The magnitude and spatial patterns of historical and future hydrologic change in California’s watersheds. Ecosphere, 6(2), art24. https://doi.org/10.1890/ES14-00300.1
Thorne, James H., Choe, H., Boynton, R. M., Bjorkman, J., Albright, W., Nydick, K., … Schwartz, M. W. (2017). The impact of climate change uncertainty on California’s vegetation and adaptation management. Ecosphere, 8(12), e02021. https://doi.org/10.1002/ecs2.2021
Thorne, James H., Santos, M. J., Bjorkman, J., Soong, O., Ikegami, M., Seo, C., & Hannah, L. (2017). Does infill outperform climate-adaptive growth policies in meeting sustainable urbanization goals? A scenario-based study in California, USA. Landscape and Urban Planning, 157, 483–492. https://doi.org/10.1016/j.landurbplan.2016.08.013
Ting, M., & Sardeshmukh, P. D. (1993). Factors determining the extratropical response to equatorial diabatic heating anomalies. Journal of the Atmospheric Sciences, 50(6), 907–918. https://doi.org/10.1175/1520-0469(1993)050<0907:FDTERT>2.0.CO;2
Trail, M., Tsimpidi, A. P., Liu, P., Tsigaridis, K., Rudokas, J., Miller, P., … Russell, A. (2014). Sensitivity of air quality to potential future climate change and emissions in the United States and major cities. Atmospheric Environment, 94, 552–563. https://doi.org/10.1016/j.atmosenv.2014.05.079
Trenberth, K. E., Branstator, G. W., Karoly, D., Kumar, A., Lau, N.-C., & Ropelewski, C. (1998). Progress during TOGA in understanding and modeling global teleconnections associated with tropical sea surface temperatures. Journal of Geophysical Research: Oceans, 103(C7), 14291–14324. https://doi.org/10.1029/97JC01444
UC Agricultural Issues Center. (2012). MOCA: The Measure of California Agriculture. Retrieved May 25, 2018, from http://aic.ucdavis.edu/publications/moca/mocamenu.htm
Ulrich, C., Nico, P. S., Wu, Y., Newman, G. A., Conrad, M. E., & Dahlke, H. E. (2017). On-Farm, Almond Orchard Flooding as a Viable Aquifer Recharge Alternative. AGU Fall Meeting Abstracts, 23. Retrieved from http://adsabs.harvard.edu/abs/2017AGUFMPA23A0367U
Underwood, B. S., Guido, Z., Gudipudi, P., & Feinberg, Y. (2017). Increased costs to US pavement infrastructure from future temperature rise. Nature Climate Change, 7(10), 704–707. https://doi.org/10.1038/nclimate3390
U.S. Census Bureau. (2012, March 26). Growth in Urban Population Outpaces Rest of Nation, Census Bureau Reports. Retrieved May 24, 2018, from https://www.census.gov/newsroom/releases/archives/2010_census/cb12-50.html
U.S. Energy Information Administration. State Profiles and Energy Estimates (2016). Table E10. Residential Sector Energy Expenditure Estimates (Million Dollars) [Data]. Retrieved July 10, 2018, from https://www.eia.gov/state/seds/data.php?incfile=/state/seds/sep_sum/html/sum_ex_res.html&sid=US
U.S. Environmental Protection Agency, C. C. D. (2016). Glossary of Climate Change Terms [Data & Tools,]. Retrieved May 24, 2018, from https://www3.epa.gov/climatechange/glossary.html

Fourth Climate Change Assessment Statewide Summary Report | 129
CALIFORNIA’S FOURTH
CLIMATE CHANGE ASSESSMENT
U.S. National Oceanic and Atmospheric Administration, National Environmental Satellite, Data, and Information Service. (n.d.). NOAA and NCDC Divisional Data Select. Retrieved May 30, 2018, from https://www7.ncdc.noaa.gov/CDO/CDODivisionalSelect.jsp#
U.S. National Oceanic and Atmospheric Administration, National Marine Fisheries Service. (2012). Fisheries economics of the United States. Retrieved from https://ST/economics/publications/feus/fisheries_economics_2012
USGCRP. (2016). The Impacts of Climate Change on Human Health in the United States: A Scientific Assessment (pp. 1–312). U.S. Global Change Research Program, Washington, DC. Retrieved from /executive-summary
USGCRP. (2017). Climate Science Special Report: Fourth National Climate Assessment, Volume 1 (p. 470). Washington DC, USA: U.S. Global Change Research Program.
Vahedifard, F., AghaKouchak, A., Ragno, E., Shahrokhabadi, S., & Mallakpour, I. (2017). Lessons from the Oroville dam. Science, 355(6330), 1139–1140. https://doi.org/10.1126/science.aan0171
van Vuuren, D. P., Edmonds, J., Kainuma, M., Riahi, K., Thomson, A., Hibbard, K., … Rose, S. K. (2011). The representative concentration pathways: an overview. Climatic Change, 109(1–2), 5–31. https://doi.org/10.1007/s10584-011-0148-z
Vaughn, D. G., Comiso, J. C., Allison, I., Carrasco, J., Georg, K., Kwok, R., … Zhang, T. (2013). Observations: Cryosphere. In Climate Change 2013: The Physical Science Basis. Contribution of Working Group I to the Fifth Assessment Report of the Intergovernmental Panel on Climate Change [Stocker, T.F., D. Qin, G.-K. Plattner, M. Tignor, S.K. Allen, J. Boschung, A. Nauels, Y. Xia, V. Bex and P.M. Midgley (eds.)]. Cambridge: Cambridge University Press. Retrieved from http://public.eblib.com/choice/publicfullrecord.aspx?p=3563440
Villarejo, Don. (1996). On Shaky Ground: Farm Operator Turnover in California Agriculture. California Institute for Rural Studies.
Vitousek, S., Barnard, P. L., Limber, P., Erikson, L., & Cole, B. (2017). A model integrating longshore and cross-shore processes for predicting long-term shoreline response to climate change. Journal of Geophysical Research: Earth Surface, 122(4), 782–806. https://doi.org/10.1002/2016JF004065
Vogel, J., McNie, E., & Behar, D. (2016). Co-producing actionable science for water utilities. Climate Services, 2–3, 30–40. https://doi.org/10.1016/j.cliser.2016.06.003
Vose, R. S., Easterling, D. R., Kunkel, K. E., LeGrande, A. N., & Wehner, M. F. (2017). Temperature changes in the United States. Climate Science Special Report: Fourth National Climate Assessment, Volume I [Wuebbles, D.J., D.W. Fahey, K.A. Hibbard, D.J. Dokken, B.C. Stewart, and T.K. Maycock (Eds.)]., 185–206. https://doi.org/10.7930/J0N29V45.
Vucetich, J.A., Bruskotter, J.T., & Nelson, M.P. (2015). Evaluating whether nature’s intrinsic value is an axiom of or anathema to conservation. Conservation Biology 29(2). https://doi.org/10.1111/cobi.12464

Fourth Climate Change Assessment Statewide Summary Report | 130
CALIFORNIA’S FOURTH
CLIMATE CHANGE ASSESSMENT
Walsh, B., Ciais, P., Janssens, I. A., Peñuelas, J., Riahi, K., Rydzak, F., … Obersteiner, M. (2017). Pathways for balancing CO2 emissions and sinks. Nature Communications, 8, 14856. https://doi.org/10.1038/ncomms14856
Wang, J., Yin, H., Reyes, E., Smith, T., & Chung, F. (2018). Mean and Extreme Climate Change Impacts on the State Water Project. California’s Fourth Climate Change Assessment. Publication number: CCCA4-EXT-2018-004.
Wang, M., Ullrich, P., & Millstein, D. (2018). The future of wind energy in California: Future projections with the Variable-Resolution CESM. Renewable Energy, 127, 242–257. https://doi.org/10.1016/j.renene.2018.04.031
Warner, M. D., Mass, C. F., & Salathé, E. P. (2015). Changes in winter atmospheric rivers along the North American west coast in CMIP5 climate models. Journal of Hydrometeorology, 16(1), 118–128. https://doi.org/10.1175/JHM-D-14-0080.1
Weed, A. S., Bentz, B. J., Ayres, M. P., & Holmes, T. P. (2015). Geographically variable response of Dendroctonus ponderosae to winter warming in the western United States. Landscape Ecology, 30(6), 1075–1093. https://doi.org/10.1007/s10980-015-0170-z
Wei, M., Nelson, J. H., Greenblatt, J. B., Mileva, A., Johnston, J., Ting, M., … Kammen, D. M. (2013). Deep carbon reductions in California require electrification and integration across economic sectors. Environmental Research Letters, 8(1), 014038. https://doi.org/10.1088/1748-9326/8/1/014038
Wei, M., Raghavan, S., Hidalgo-Gonzalez, P., Henriquez Auba, R., Millstein, D., Hoffacker, M., … Florin-Langer, J. (2018). Building a Healthier and More Robust Future: 2050 Low Carbon Energy Scenarios for California. California Energy Commission.
Westerling, A. L., Bryant, B. P., Preisler, H. K., Holmes, T. P., Hidalgo, H. G., Das, T., & Shrestha, S. R. (2011). Climate change and growth scenarios for California wildfire. Climatic Change, 109(S1), 445–463. https://doi.org/10.1007/s10584-011-0329-9
Westerling, Anthony L., Cayan, D. R., Brown, T. J., Hall, B. L., & Riddle, L. G. (2004). Climate, Santa Ana Winds and autumn wildfires in southern California. Eos, Transactions American Geophysical Union, 85(31), 289. https://doi.org/10.1029/2004EO310001
Westerling, Anthony LeRoy. (2016). Increasing western US forest wildfire activity: sensitivity to changes in the timing of spring. Philosophical Transactions of the Royal Society B: Biological Sciences, 371(1696), 20150178. https://doi.org/10.1098/rstb.2015.0178
Westerling, Anthony LeRoy. (2018). Wildfire Simulations for the Fourth California Climate Assessment: Projecting Changes in Extreme Wildfire Events with a Warming Climate. California’s Fourth Climate Change Assessment, California Energy Commission. Publication number: CCCA4-CEC-2018-014.
White, R., Hessburg, P., Larkin, S., & Varner, M. (2017). Smoke in a new era of fire. Science Update, (24), 19.
WHO (Ed.). (2009). Global health risks: mortality and burden of disease attributable to selected major risks. Geneva, Switzerland: World Health Organization.
Fourth Climate Change Assessment Statewide Summary Report | 131
CALIFORNIA’S FOURTH
CLIMATE CHANGE ASSESSMENT
Wilbanks, T., Fernandez, S., Backus, G., Garcia, P., Zimmerman, R., & Al, E. (2014). "Climate Change and Infrastructure, Urban Systems, and Vulnerabilities.” Report to the U.S. Department of Energy in Support of the National Climate Assessment, Oak Ridge National Laboratory, 2012. Washington DC, USA: Island Press. Retrieved from https://nyuscholars.nyu.edu/en/publications/climate-change-and-infrastructure-urban-systems-and-vulnerabiliti
Williams, A. P., Gentine, P., Moritz, M. A., Roberts, D. A., & Abatzoglou, J. T. (2018). Effect of reduced summer cloud shading on evaporative demand and wildfire in coastal Southern California. Geophysical Research Letters. https://doi.org/10.1029/2018GL077319
Williams, A. P., Schwartz, R. E., Iacobellis, S., Seager, R., Cook, B. I., Still, C. J., … Michaelsen, J. (2015). Urbanization causes increased cloud base height and decreased fog in coastal Southern California. Geophysical Research Letters, 42(5), 1527–1536. https://doi.org/10.1002/2015GL063266
Williams, A. P., Seager, R., Abatzoglou, J. T., Cook, B. I., Smerdon, J. E., & Cook, E. R. (2015). Contribution of anthropogenic warming to California drought during 2012-2014: Global Warming and California Drought. Geophysical Research Letters, 42(16), 6819–6828. https://doi.org/10.1002/2015GL064924
Williams, D. W., & Liebhold, A. M. (2002). Climate change and the outbreak ranges of two North American bark beetles. Agricultural and Forest Entomology, 4(2), 87–99. https://doi.org/10.1046/j.1461-9563.2002.00124.x
Williams, J. H., DeBenedictis, A., Ghanadan, R., Mahone, A., Moore, J., Morrow, W. R., … Torn, M. S. (2012). The technology path to deep greenhouse gas emissions cuts by 2050: The pivotal role of electricity. Science, 335(6064), 53–59. https://doi.org/10.1126/science.1208365
Wilson, T. S., Sleeter, B. M., & Cameron, D. R. (2017). Mediterranean California’s water use future under multiple scenarios of developed and agricultural land use change. PLOS ONE, 12(10), e0187181. https://doi.org/10.1371/journal.pone.0187181
Wolf, A., Zimmerman, N. B., Anderegg, W. R. L., Busby, P. E., & Christensen, J. (2016). Altitudinal shifts of the native and introduced flora of California in the context of 20th-century warming: Altitudinal shifts in California’s flora. Global Ecology and Biogeography, 25(4), 418–429. https://doi.org/10.1111/geb.12423
Wolf, K., Herrera, I., Tomich, T., & Scow, K. (2017). Long-term agricultural experiments inform the development of climate-smart agricultural practices. California Agriculture, 71(3), 120–124.
Wolkovich, E. M., Cook, B. I., Allen, J. M., Crimmins, T. M., Betancourt, J. L., Travers, S. E., … Cleland, E. E. (2012). Warming experiments underpredict plant phenological responses to climate change. Nature, 485(7399), 494–497. https://doi.org/10.1038/nature11014
Young, D. J. N., Stevens, J. T., Earles, J. M., Moore, J., Ellis, A., Jirka, A. L., & Latimer, A. M. (2017). Long-term climate and competition explain forest mortality patterns under extreme drought. Ecology Letters, 20(1), 78–86. https://doi.org/10.1111/ele.12711

Fourth Climate Change Assessment Statewide Summary Report | 132
CALIFORNIA’S FOURTH
CLIMATE CHANGE ASSESSMENT
Zapata, C. B., Yang, C., Yeh, S., Ogden, J., & Kleeman, M. J. (2018). Low-carbon energy generates public health savings in California. Atmospheric Chemistry and Physics, 18(7), 4817–4830. https://doi.org/10.5194/acp-18-4817-2018
Zhang, Y., Smith, S. J., Bowden, J. H., Adelman, Z., & West, J. J. (2017). Co-benefits of global, domestic, and sectoral greenhouse gas mitigation for US air quality and human health in 2050. Environmental Research Letters, 12(11), 114033. https://doi.org/10.1088/1748-9326/aa8f76