Embed Size (px)
Citation preview

Foundations of Assessment II Methods, Data Gathering and Sharing Results
Goals of Today’s Presentation
1. Understand the various
methods available for
assessment
2. Learn how and why to share
results
3. Gain confidence to plan and
conduct assessments in your
department
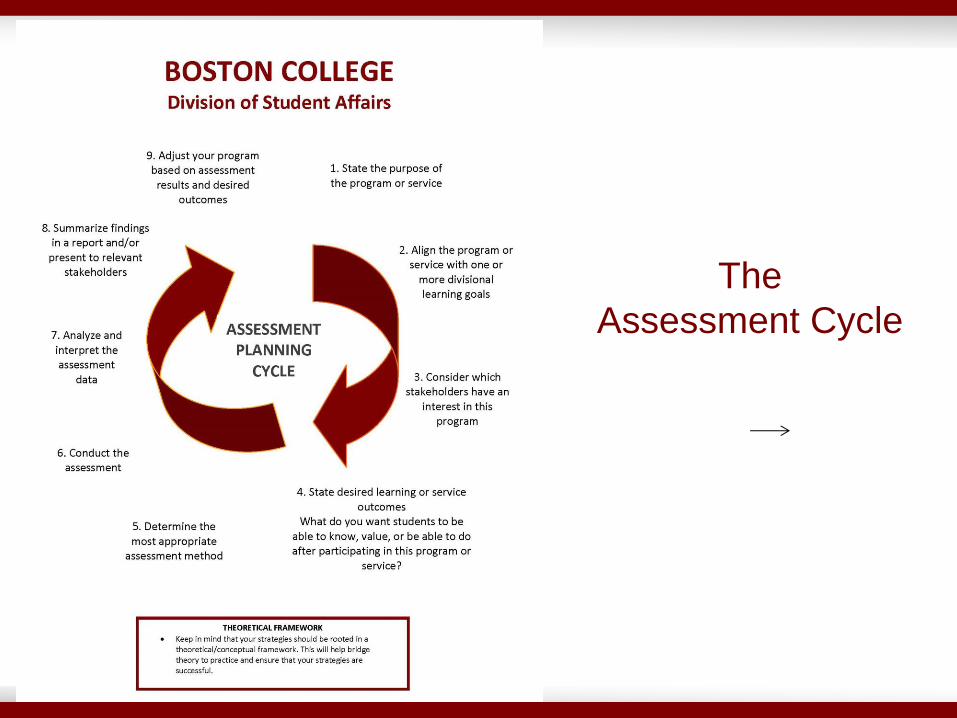
The
Assessment Cycle
A few questions
• What methods has your
department used for data
collection?
• How did you determine
that those methods were
the best way to gather
evidence?

Surveys
Rubrics
Interviews
Pre/Post evaluation
Reflection
Quick assessments
Document Analysis
Reviewing existing data
Focus Groups
Demonstrations
Observations
Written papers, projects
Posters and presentations
Portfolios
Mobile data collection
Tests, exams, quizzes
Common Methods for Gathering Evidence

Things to consider when selecting a method
How will you use the data?
Available resources (i.e., time, materials, budget, expertise)
Potential for collaboration
Cultural sensitivity
Direct vs. indirect
Quantitative vs. qualitative
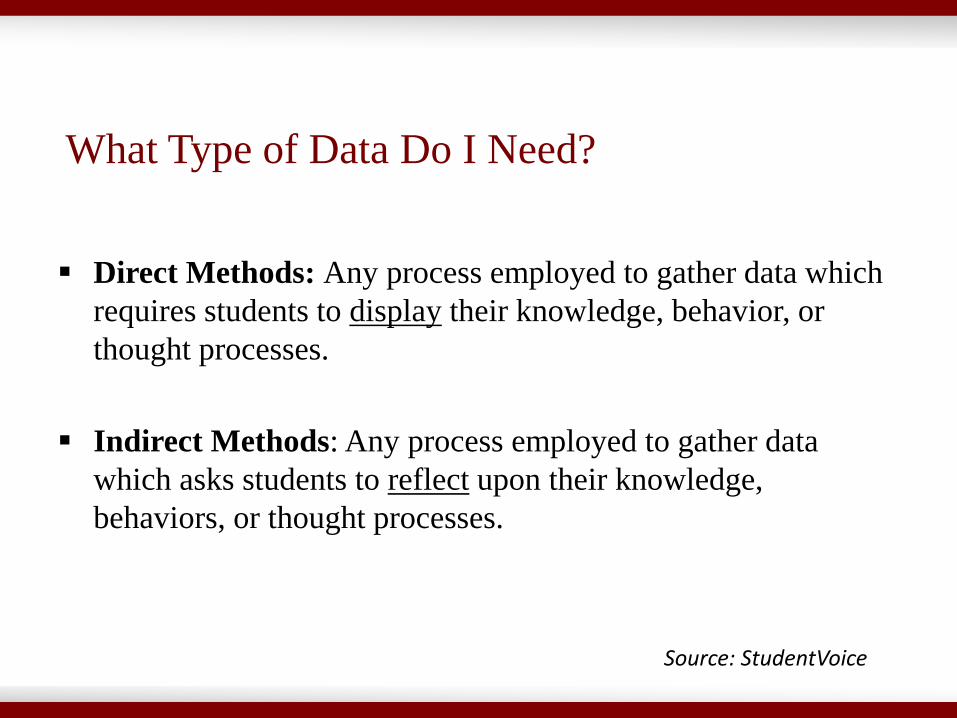
What Type of Data Do I Need?
Direct Methods: Any process employed to gather data which
requires students to display their knowledge, behavior, or
thought processes.
Indirect Methods: Any process employed to gather data
which asks students to reflect upon their knowledge,
behaviors, or thought processes.
Source: StudentVoice

What Type of Data Do I Need?
Quantitative
Focus on numbers/numeric values
Easier to report and analyze
Can generalize to greater
population with larger samples
Less influenced by social
desirability
Sometimes less time, money
Qualitative
Focus on text/narrative from
respondents
More depth/robustness
Ability to capture “elusive”
evidence of student learning and
development
Specific sample
Adapted from StudentVoice

Questions for Choosing a Method
Is your method going to provide you with the evidence you need
to make a statement about the learning that occurred?
If you are assessing satisfaction or service effectiveness, is the
method going to give you the most detailed and accurate
information?
Do you have the time and resources to use the specific method?
Adapted from StudentVoice

Surveys
Advantages
Useful when you have a large
population.
Easily administered
Easy to compare longitudinally
You can ask a variety of questions
Quick data turnaround
Good for statistical reporting
Disadvantages
Indirect measure
Interpretation – lack of skill in
understanding results
Low response rates
May need secondary direct
measure to learn more
information

What is a focus group?
Qualitative research
Small group, open discussion
Gauges opinions, perceptions and attitudes

Focus Groups
Advantages
Able to collect a lot of rich data in
short time
Understand perceptions, beliefs
and options
Direct and indirect
Members build off each other’s
ideas
Disadvantages
Less useful for statistical reports
Facilitation requires skill
Not generalizable
Time needed for preparation and
analysis
Lack of control over discussion
Difficult to attract participants

Quick Assessment Techniques
Quick, easy, and systematic
Assessment does not HAVE to be time-consuming
Minimal resources
“Pulse” on how things are going

Rubrics
Scoring tool for subjective
assessment
Assess student performance
on learning objectives
Clearly define acceptable and
unacceptable performance
Training programs, interviews,
projects

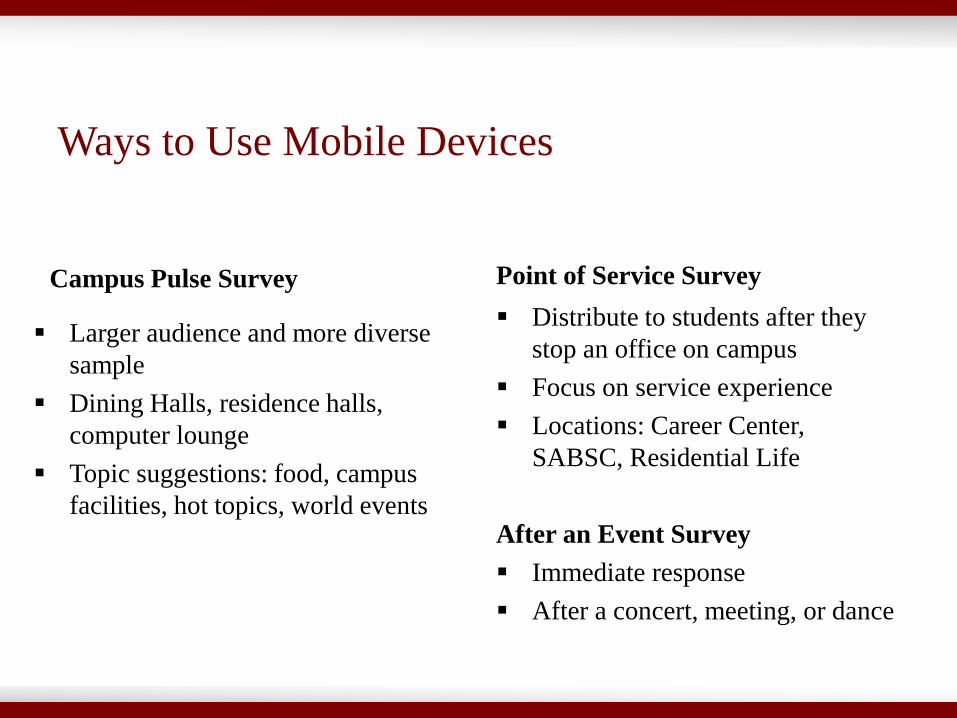
Ways to Use Mobile Devices
Campus Pulse Survey
Larger audience and more diverse
sample
Dining Halls, residence halls,
computer lounge
Topic suggestions: food, campus
facilities, hot topics, world events
Point of Service Survey
Distribute to students after they
stop an office on campus
Focus on service experience
Locations: Career Center,
SABSC, Residential Life
After an Event Survey
Immediate response
After a concert, meeting, or dance

Mobile Devices

Analyzing and interpreting your data requires as
much diligence and strategy as the design
process.

Analysis Read the data with an eye for themes, categories, patterns, and relationships
Have multiple people read the data and discuss the key themes
Identify contradictions surprises
Interpretation Make assumptions, add meaning, and come up with conclusions – keeping
your own assumptions and beliefs visible.
Do not disregard outliers: Data that is surprising, contradictory, or puzzling
can be insightful
Source: InSites 2007
Qualitative Data

Quantitative Data
Student Voice - sort your data, use crosstabs, and view it in graphs or pie
charts.
StudentVoice does not help you analyze or interpret your data!
Your responsibility is to describe the data as clearly, completely, and
concisely as possible.
Interpretation For each learning outcome, compare the results with the level of intended
outcome. What does the data show?
Analysis

Why Focus on Reporting Results?
Role Modeling
Buy-in
Historical Documentation
Evidence
Source: StudentVoice
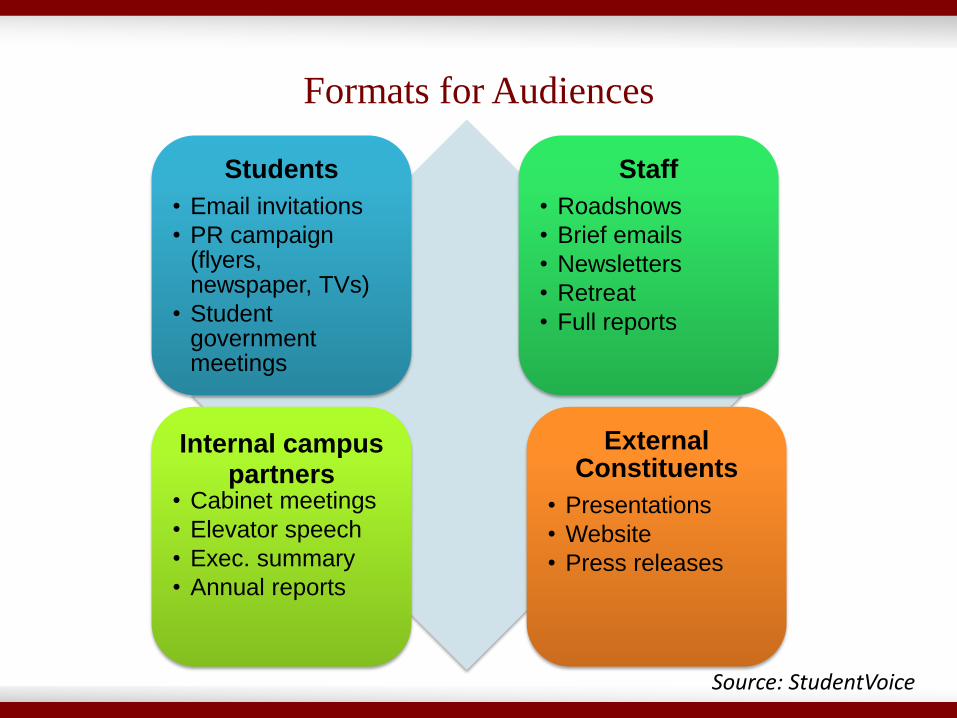
Formats for Audiences
Students
• Email invitations
• PR campaign (flyers, newspaper, TVs)
• Student government meetings
Staff
• Roadshows
• Brief emails
• Newsletters
• Retreat
• Full reports
Internal campus partners
• Cabinet meetings
• Elevator speech
• Exec. summary
• Annual reports
External Constituents
• Presentations
• Website
• Press releases
Source: StudentVoice
Policymakers are more likely to read information if:
• Information is in short bulleted paragraphs, not large blocks
of type
• Charts or graphs are used to illustrate key points
• If provided in print rather than electronically
• Recommendations and implications are presented
Source: StudentVoice

When do you need to report your results?
Who is the audience of the report?
Why is this information important to this audience?
What are your options for reporting the results?
What is the best method for reporting your results?
What exactly should be or needs to be included?
Questions to Consider when Planning a Report

Basic Structure of
Assessment Report
1. Executive summary
2. Purpose of assessment
3. Methods
4. Description of
participants
5. Findings
6. Discussion/implications
and conclusion

Questions/Discussion