Embed Size (px)
Citation preview
This document is downloaded from DR‑NTU (https://dr.ntu.edu.sg)Nanyang Technological University, Singapore.
Membrane fouling in seawater reverse osmosis(SWRO) desalination process
Yin, Wenqiang
2019
Yin, W. (2019). Membrane fouling in seawater reverse osmosis (SWRO) desalination process.Doctoral thesis, Nanyang Technological University, Singapore.
https://hdl.handle.net/10356/136781
https://doi.org/10.32657/10356/136781
This work is licensed under a Creative Commons Attribution‑NonCommercial 4.0International License (CC BY‑NC 4.0).
Downloaded on 25 Feb 2022 03:25:13 SGT
MEMBRANE FOULING IN SEAWATER REVERSE
OSMOSIS (SWRO) DESALINATION PROCESS
YIN WENQIANG
SCHOOL OF CIVIL AND ENVIRONMENTAL ENGINEERING
2019

MEMBRANE FOULING IN SEAWATER REVERSE
OSMOSIS (SWRO) DESALINATION PROCESS
YIN WENQIANG
School of Civil and Environmental Engineering
A thesis submitted to the Nanyang Technological University
in partial fulfilment of the requirements for the degree of
Doctor of Philosophy
2019
Authorship Attribution Statement
This thesis contains material from 2 paper(s) published in the following peer-
reviewed journal(s) in which I am listed as an author.
Chapter 4 is published as Yin, W., Li, X., Suwarno, S. R., Cornelissen, E. R., & Chong,
T. H. Fouling behavior of isolated dissolved organic fractions from seawater in
reverse osmosis (RO) desalination process. Water Research 159: 385-396 (2019).
DOI: 10.1016/j.watres.2019.05.038.
The contributions of the co-authors are as follows:
• Prof. Chong and Dr. Suwarno provided the initial project direction.
• I prepared the manuscript drafts. The manuscript was revised by Dr. Li and
Prof. Cornelissen.
• Prof. Chong edited the final manuscript drafts.
• Dr. Suwarno provided guidance of fractionation process.
• I completed the fractionation process and organic fouling study with the
analysis of membrane autopsy.
• FYP student Ang Wee Heng John and FYP student Tan Man Ping Joanne
provided help in the experiment.
• All experiments and data analysis were conducted by me in the Singapore
Membrane Technology Centre (SMTC).
Chapter 5 is published as Yin, W., Ho, J.S., Cornelissen, E. R., & Chong, T. H. Impact
of isolated dissolved organic fractions from seawater on biofouling in reverse osmosis
(RO) desalination process. Water Research 168: 115198 (2020).
DOI: 10.1016/j.watres.2019.115198
The contributions of the co-authors are as follows:
• Prof. Chong provided the initial project direction.
• Prof. Chong edited the final manuscript drafts.

Acknowledgements
i
ACKNOWLEDGMENTS
I would like to express my greatest appreciation to my supervisor and mentor
Professor Chong Tzyy Haur. Professor Chong provided me many helps and supports
in my research study all the time. I would like to express my sincere gratitude to his
patience and motivation. He kept guiding me to the correct direction, and leading me
to learn more knowledge in the current research field. I benefited a lot from his open-
minded view, abundant research knowledge, rigorous academic style, and
outstanding academic spirit.
Besides my supervisor, I would like to thank my co-mentor Professor Emile R.
Cornelissen. He kept guiding me during my PhD life. He always gave me useful
advice of my research work, and made my research more rigorous. At the same time,
I am also very grateful to Dr. Stanislaus Raditya Suwarno, who provided me many
supports when I started my PhD. Thanks to him, I am able to master the experimental
setup and analytical instrument. Furthermore, I can transport the skill to others. Also,
many thanks go to my colleagues Miss. Tan Hwee Sin who has helped me a lot in the
experiment designs and sample preparation in my study.
Special thanks to Dr. Li Xin for his patient and kind help. He gave me the greatest
help at the most confused stage of my PhD. He was sharing his full experience of
research and writing skill to me which helped me to avoid many mistakes and saved
lots of time and energy. At the same time, I also want to specially thank to Dr. Ho Jia
Shin and Dr. Sim Lee Nuang for their sincere supports and guidance in my PhD study.
My appreciation also goes to all the staffs and students from Singapore Membrane
Technology Centre (SMTC). I also appreciate that the support from school of Civil
& Environmental Engineering (CEE), NTU. Thanks for funding me and support me
on my research.
Last but not the least, I would like to acknowledge my parents and my girlfriend Miss.
Wu who keep encouraging me and motivating me all the time in my whole PhD life.
ii
TABLE OF CONTENTS
ACKNOWLEDGMENTS ..................................................................... i
LIST OF PUBLICATIONS ................................................................. vi
LIST OF FIGURES ............................................................................ vii
LIST OF TABLES ............................................................................... xi
LIST OF SYMBOLS .......................................................................... xiii
LIST OF ABBREVIATIONS ............................................................. xv
SUMMARY ........................................................................................ xvii
CHAPTER 1 Introduction .................................................................... 1
1.1 Background ................................................................................................................... 1
1.2 Problem statement ........................................................................................................ 2
1.3 Objectives and scope .................................................................................................... 5
CHAPTER 2 Literature Review .......................................................... 8
2.1 Pressure-Driven Membrane Processes ......................................................................... 8
2.1.1 Fundamentals ......................................................................................................... 8
2.1.2 RO Membrane, Modules and Operation Mode ..................................................... 9
2.1.3 Concentration Polarization (CP) .......................................................................... 11
2.1.4 Seawater Reverse Osmosis (SWRO) Desalination Process ................................ 13
2.1.5 Membrane Fouling ............................................................................................... 14
2.2 Organic Fouling .......................................................................................................... 15
2.2.1 Characteristics of Seawater Organic Matters ...................................................... 16
2.2.2 Fouling Evaluation with Model Organic Foulants .............................................. 18
2.2.3 Fouling Evaluation with Natural Organic Matters (NOM) ................................. 21
2.2.4 Interfacial Force Investigation in Organic Fouling ............................................. 22
2.3 Biofouling ................................................................................................................... 28
2.3.1 Mechanism of Biofouling .................................................................................... 28
2.3.2 Compositions of Biofilm ..................................................................................... 28
2.3.3 Biofouling Potential ............................................................................................. 29
2.4 Fouling Control ........................................................................................................... 31
2.5 Summary of Literature Review .................................................................................. 36
iii
CHAPTER 3 Materials and Methods ................................................ 39
3.1 Experimental Setups ................................................................................................... 39
3.1.1 Crossflow Setup ................................................................................................... 39
3.1.2 Dead-end Setup .................................................................................................... 40
3.2 Membranes ................................................................................................................. 41
3.2.1 Microfiltration (MF) membrane .......................................................................... 41
3.2.2 Ultrafiltration (UF) Membrane ............................................................................ 41
3.2.3 Nanofiltration (NF) Membrane ............................................................................ 42
3.2.4 Reverse Osmosis (RO) Membrane ...................................................................... 42
3.3 Sample Preparation ..................................................................................................... 43
3.3.1 Raw Seawater ...................................................................................................... 43
3.3.2 Synthetic Seawater ............................................................................................... 43
3.3.3 Model Organic Solutions ..................................................................................... 43
3.3.4 Bacterial Stock Solution ...................................................................................... 44
3.4 Analytical Methods ..................................................................................................... 44
3.4.1 Liquid Chromatography-Organic Carbon Detector (LC-OCD) .......................... 44
3.4.2 Fluorescence-excitation emission matrix (F-EEM) ............................................. 45
3.4.3 Exopolymeric Substances (EPS) Measurement ................................................... 46
3.4.4 Assimilable Organic Carbon (AOC) Measurement ............................................. 46
3.4.5 Confocal Laser Scanning Microscopy (CLSM) .................................................. 49
3.4.6 Modified Fouling Index (MFI) Measurement ..................................................... 49
3.4.7 Inorganic analysis ................................................................................................ 50
3.4.8 Attenuated Total Reflectance - Fourier Transform Infrared Spectrometry (ATR-FTIR) ............................................................................................................................ 50
3.4.9 Atomic Force Microscopy (AFM) Measurement ................................................ 51
3.4.10 Extend Derjaguin-Landau-Verwey-Overbeek (XDLVO) Theory ..................... 51
3.4.11 Field Emission Scanning Electron Microscope (FE-SEM) ............................... 52
CHAPTER 4 Fouling Behavior of Isolated Dissolved Organic Fractions from Seawater in Reverse Osmosis (RO) Desalination Process .................................................................................................. 53
4.1 Introduction ................................................................................................................. 53
4.2 Materials and Methods ............................................................................................... 54
4.2.1 Fractionation and Concentration of DOM in Seawater ....................................... 54
4.2.2 Comparison of Model Foulants and Isolated Organic Fractions ......................... 57

iv
4.2.3 Bench-Scale RO Fouling Study of Isolated Organic Fractions ........................... 58
4.2.4 Adhesion and Cohesion Force Measurements ..................................................... 59
4.2.5 XDLVO Theory Analysis .................................................................................... 59
4.3 Results and Discussion ............................................................................................... 59
4.3.1 Performance of Fractionation and Concentration Process ................................... 59
4.3.2 Chemical Analysis and Fouling Potential of Model Organic Foulants and Isolated Organic Fractions ............................................................................................ 67
4.3.3 Foulant-Membrane and Foulant-Foulant Interactions ......................................... 71
4.3.4 RO Fouling of Isolated Organic Fractions ........................................................... 79
4.4 Conclusions ................................................................................................................. 81
CHAPTER 5 Impact of Isolated Dissolved Organic Fractions from Seawater on Biofouling in Reverse Osmosis (RO) Desalination Process .................................................................................................. 83
5.1 Introduction ................................................................................................................. 83
5.2. Materials and Methods .............................................................................................. 84
5.2.1 Fractionation and Concentration of Dissolved Organic Fractions from Seawater ...................................................................................................................................... 84
5.2.2 Assimilable Organic Carbon (AOC) Measurement ............................................. 84
5.2.3 Organic Transformation During Bacteria Growth in Isolated Dissolved Organic Fractions ....................................................................................................................... 85
5.2.4 Atomic Force Microscopy (AFM) Measurement ................................................ 85
5.2.5 Impact of Isolated Dissolved Organic Fractions on SWRO biofouling .............. 85
5.3 Results and Discussion ............................................................................................... 86
5.3.1 Isolated Dissolved Organic Fractions from Seawater ......................................... 86
5.3.2 Assimilable Organic Carbon (AOC) Analysis .................................................... 87
5.3.3 Organic Transformation During Bacteria Growth in Isolated Dissolved Organic Fractions ....................................................................................................................... 90
5.3.4 Bacteria-clean/fouled Membrane Interactions ..................................................... 93
5.3.5 Impact of Isolated Dissolved Organic Fractions on SWRO Biofouling .............. 94
5.4. Conclusions .............................................................................................................. 100
CHAPTER 6 Mitigating Reverse Osmosis (RO) Fouling in Seawater Desalination Process by Removing Low Molecular Weight (LMW) Organic Compounds with Nanofiltration (NF) Pretreatment ...................................................................................... 102
6.1 Introduction ............................................................................................................... 102
v
6.2 Materials and Methods ............................................................................................. 102
6.2.1 NF pretreatment and RO fouling experiment .................................................... 102
6.2.2 Analytical Methods ............................................................................................ 104
6.3. Results and Discussion ............................................................................................ 105
6.3.1 Performance of NF Membranes ......................................................................... 105
6.3.2 Performance of RO ............................................................................................ 111
6.4 Conclusion ................................................................................................................ 114
CHAPTER 7 Conclusions and Future Works ................................ 115
7.1 Overall Conclusions .................................................................................................. 115
7.2 Recommendations for Future Works ........................................................................ 118
Appendix A ........................................................................................ 120
A.1 Electrodialysis (ED) Setup ....................................................................................... 120
A.2 Performance of Electrodialysis (ED) in Desalting Seawater ................................... 121
Appendix B ......................................................................................... 125
B.1 Permeate Flux of NF Membranes: ........................................................................... 125
REFERENCES .................................................................................. 126
List of publications
vi
LIST OF PUBLICATIONS
Ø Journals
Yin, W., Li, X., Suwarno, S. R., Cornelissen, E. R., & Chong, T. H. (2019). Fouling
behavior of isolated dissolved organic fractions from seawater in reverse osmosis
(RO) desalination process. Water Research 159: 385-396.
Yin, W., Ho, J.S., Cornelissen, E. R., & Chong, T. H. (2020). Impact of isolated
dissolved organic fractions from seawater on biofouling in reverse osmosis (RO)
desalination process. Water Research 168: 115198.
Ø Conferences
Yin, W., Li, X., Suwarno, S. R., Cornelissen, E. R., & Chong, T. H. " Fouling behavior
of isolated dissolved organic fractions from seawater in reverse osmosis (RO)
desalination process ", The 12th Conference of Aseanian Membrane Society
(AMS10), Jeju, Korea, 02-05 Jul 2019 (Poster presentation).
List of figures
vii
LIST OF FIGURES
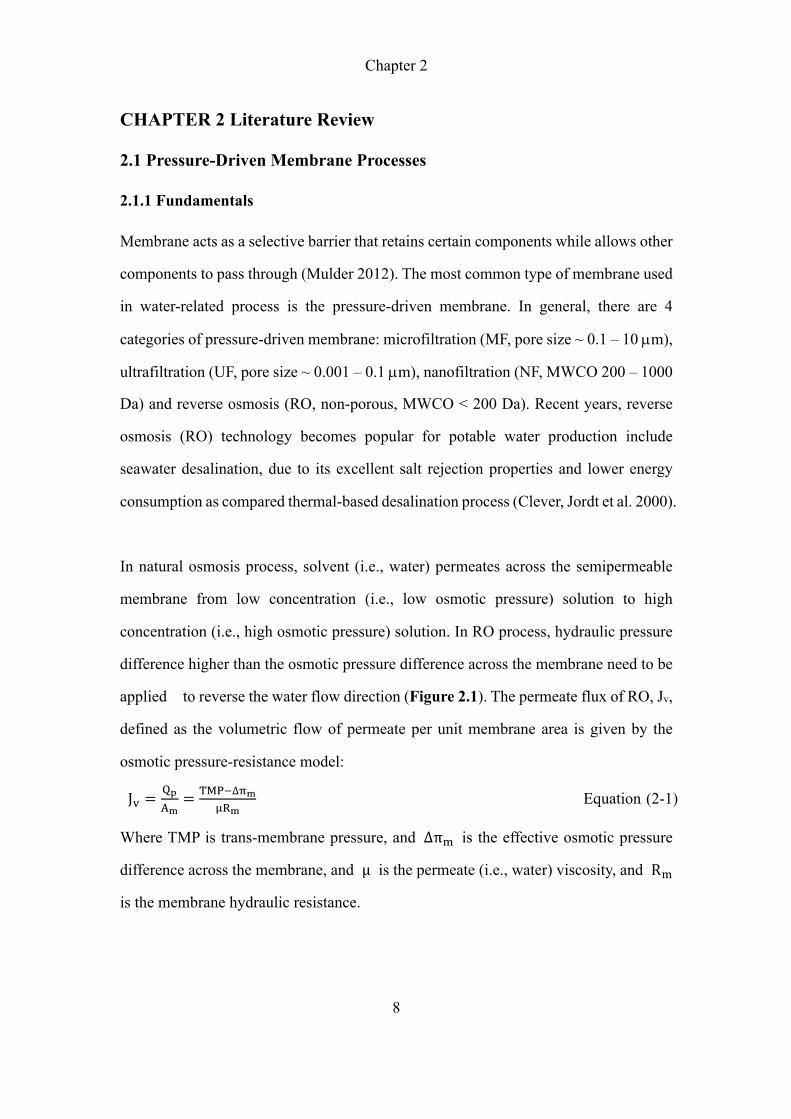
Figure 2.1 Illustration of reverse osmosis process ..................................................... 9
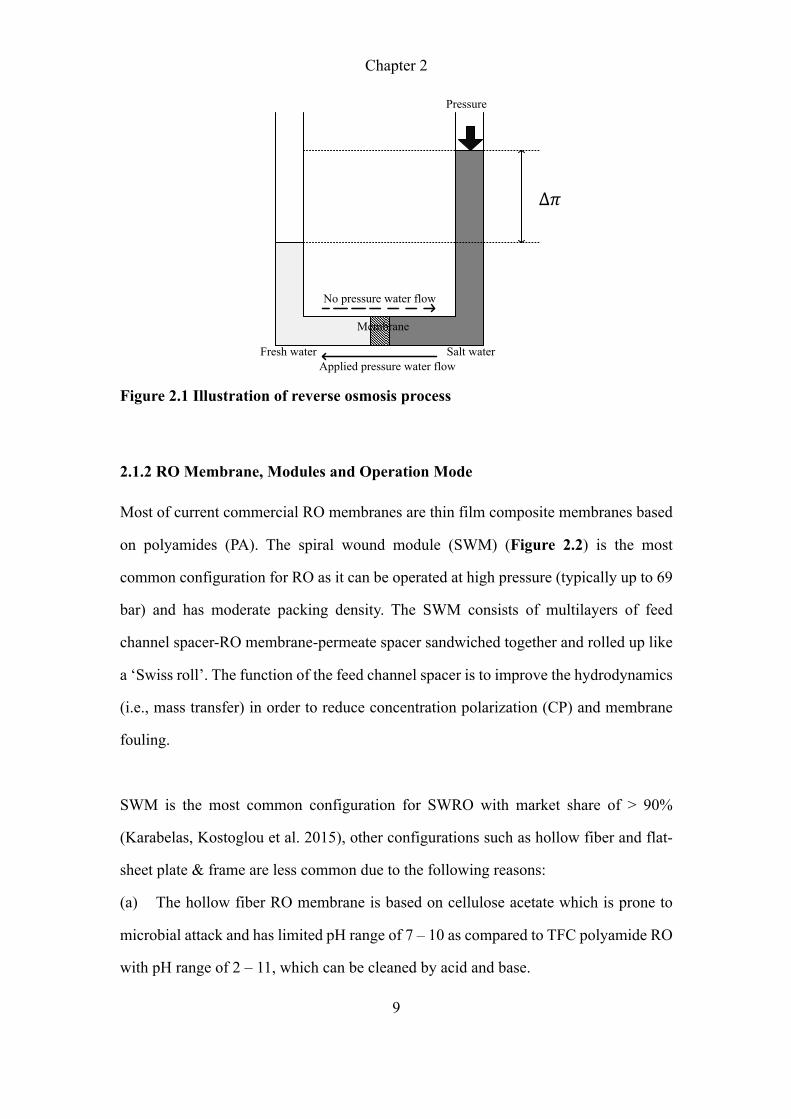
Figure 2.2 Spiral wound membrane module for desalination (Karabelas, Kostoglou
et al. 2015). ............................................................................................................... 10
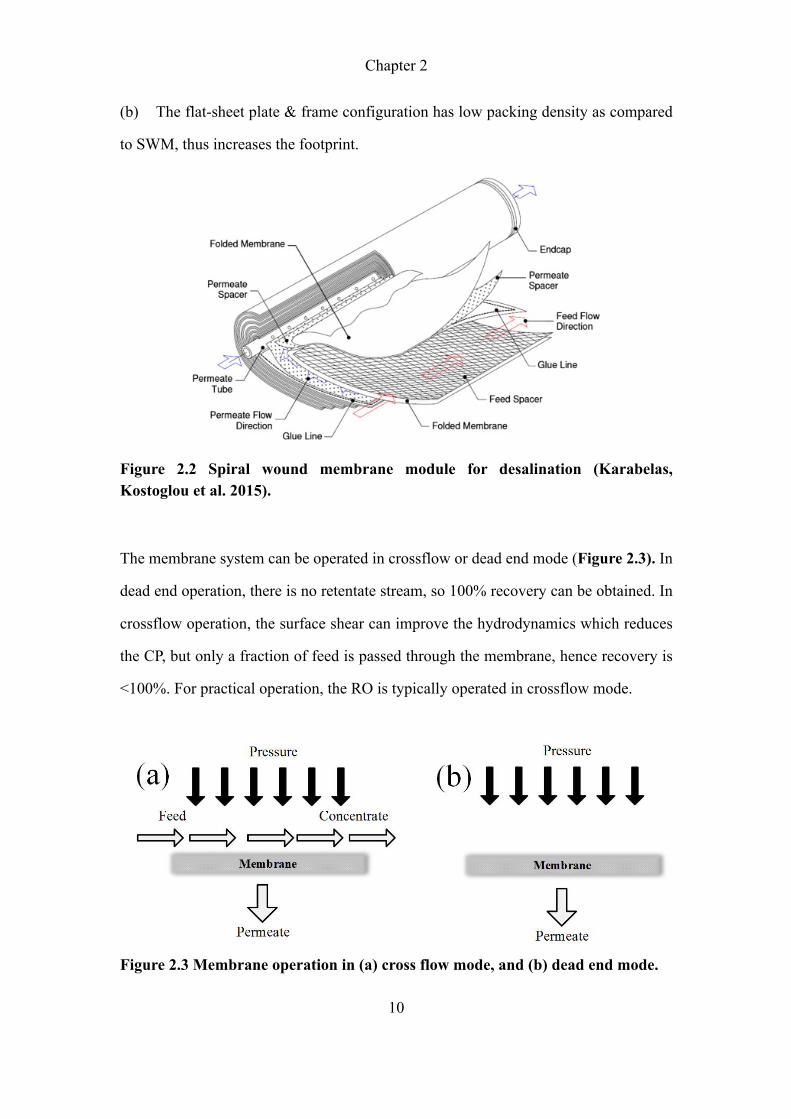
Figure 2.3 Membrane operation in (a) cross flow mode, and (b) dead end mode. ... 10
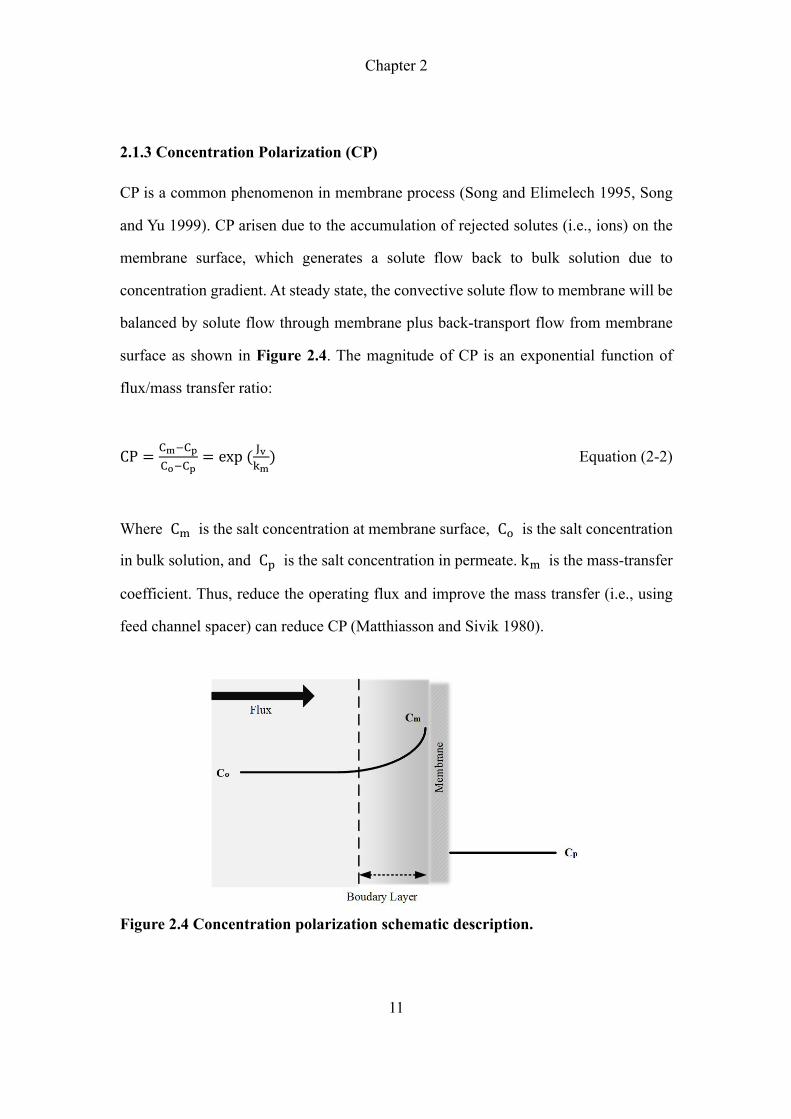
Figure 2.4 Concentration polarization schematic description. ................................. 11
Figure 2.5 Concentration polarization(a) before fouling and (b)after fouling (Tang,
Chong et al. 2011). .................................................................................................... 12
Figure 2.6 Schematic diagram of seawater reverse osmosis (SWRO) desalination
process. ..................................................................................................................... 13
Figure 2.7 Operation conditions of (a) constant pressure, and (b) constant flux. .... 14
Figure 2.8 Chemical structure of sodium alginate (SA) (Katsoufidou, Yiantsios et al.
2007). ........................................................................................................................ 19
Figure 2.9 Schematic illustration of alginate reaction with Ca2+ (Li, Xu et al. 2007).
.................................................................................................................................. 19
Figure 2.10 Chemical structure of marine (a) humic acid, and (b) fulvic acid (Harvey,
Boran et al. 1983). .................................................................................................... 21
Figure 2.11 Standard force-distance measurement curve (Powell, Hilal et al. 2017).
.................................................................................................................................. 27
Figure 2.12 (a) AFM adhesion force measurement for foulant-cleaned membrane, and
(b) foulant-fouled membrane by using foulant-coated tip. ....................................... 27
Figure 2.13 Diagram of summary of literature review. ............................................ 36
Figure 3.1 Schematic diagram of crossflow filtration setup. .................................... 39
Figure 3.2 Schematic diagram of dead-end filtration setup. ..................................... 41
Figure 3.3 Typical EEM peak values (Chen, Westerhoff et al. 2003). ..................... 45
Figure 3.4 Calibration curve by plotting the live cell count against the sodium acetate
concentration using natural inoculum. ...................................................................... 49
Figure 4.1 Illustration of fractionation and concentration of organics in seawater by
membrane technique. (i) MF membrane: pressure = 0.06 bar, dead end filtration mode;
(ii) Operating conditions of NF membrane: pressure = 2.0 bar, initial flux = 8 L/m2h,
crossflow velocity = 0.39 m/s; (iii) UF membrane: pressure = 0.16 bar, initial flux =

List of figures
viii
10 L/m2h, crossflow velocity = 0.39 m/s. Spiral wound membrane elements, 2.5-inch
module with membrane area of 2.4 m2, were employed in UF/NF processes. 57
Figure 4.2 (a) Organic rejections, and (b) Salt rejections by different UF and NF
membranes (seawater as feed, measurements with three repetitions (error bar for n =
3) were obtained from dead-end filtration at 2 bar except NF90 at 30 bar). ............ 64
Figure 4.3 LC-OCD analysis of organic rejection of GH and XT membranes. ....... 64
Figure 4.4 (a) LC-OCD chromatograms of natural seawater and fractionated organics
(i.e. BP, HS&BB and LMW fractions), and (b) proportion of organics in each isolated
organic fraction, calculated from LC-OCD analysis results. .................................... 65
Figure 4.5 LC-OCD chromatograms of (a) F.BP and model foulants of SA and BSA,
(b) F.HS&BB and model foulant of HA, and (c) F.LMW and model foulant of
AOM.LMW. ............................................................................................................. 68
Figure 4.6 FEEM spectroscopy of (a) seawater, (b) F.BP, (c) F.HS&BB, (d) F.LMW,
(e) SA, (f) BSA, (g) HA, and (h) AOM.LMW. ......................................................... 70
Figure 4.7 Plot of t/V vs. V (t = filtration time, V = cumulated volume) for (a) model
organic foulants, and (b) isolated organic fractions. The MFI value, which represents
fouling potential, is the slope of the fitted line in the cake filtration stage. ............. 71
Figure 4.8 Retraction force-distance values of foulant-membrane and foulant-foulant
under salt conditions of (a) Na+, and (b) Na+, Ca2+, and Mg2+. ................................ 73
Figure 4.9 Retraction force-distance curves of foulant-membrane and foulant-foulant
under salt conditions of (a) Na+, and (b) Na+, Ca2+, and Mg2+, with frequency
distribution histogram. .............................................................................................. 74
Figure 4.10 ATR-FTIR spectra of RO membrane and isolated organic fractions. ... 77
Figure 4.11 Flux decline curves under different salt conditions for (a) F.BP, (b)
F.HS&BB, and (c) AOM.LMW (force-distant curve was shown in the graph). ...... 79
Figure 4.12 LCOCD analysis of foulants extracted from organic-fouled RO
membrane by (a) F.BP, (b) F.HS&BB as feed solutions, and (c) AOM.LMW. ........ 80
Figure 5.1 The illustrations of (i) inoculum preparation, (ii) sample preparation and
(iii) cell count measurement in AOC analysis. 84
Figure 5.2 LC-OCD analysis of organic compounds in original seawater and isolated
dissolved organic fractions. The percentage value is the % ratio of DOC of BP,
List of figures
ix
HS&BB, or LMW to total DOC (the chromatograph of each fraction can refer to
Figure 4.4). ............................................................................................................... 87
Figure 5.3 Growth curve of indigenous inoculum in different isolated dissolved
organic fractions from seawater. Initial concentration of organic in each fraction = 0.5
mg-C/L (Error bars for n = 3). .................................................................................. 88
Figure 5.4 Bio-transformation of organics by Vibrio sp. B2 (Kim and Chong 2017) as
inoculum in different isolated dissolved organic fractions from seawater (a) LC-OCD,
and (b) FEEM analysis (Error bars for n = 3). .......................................................... 91
Figure 5.5 Organic concentration during growth test of Vibrio sp. B2 (Kim and Chong
2017) as inoculum in carbon-free solution (Error bars for n = 30). ......................... 93
Figure 5.6 AFM analysis of interaction of bacteria-clean RO membrane, bacteria-BP-
fouled membrane, bacteria-HS&BB-fouled membrane, bacteria-LMW fouled
membrane, and bacteria-bacteria (Error bar for n = 30). .......................................... 94
Figure 5.7 Monitoring of organic profile in feed tank during SWRO biofouling test
with different isolated dissolved organic fractions from seawater as RO feed (a) F.BP,
(b) F.HS&BB, and (c) F.LMW. ................................................................................. 95
Figure 5.8 Flux decline profile of RO biofouling by Vibrio sp. B2 (Kim and Chong
2017) in different isolated dissolved organic fractions from seawater. The control
experiments were tests without the presence of bacteria, taken from our previous
work (Chapter 4). Concentration of organic in each fraction = 0.5 mg-C/L. ........... 95
Figure 5.9 CLSM image of biofouled membrane coupon in RO biofouling test with
different isolated dissolved organic fractions from seawater as RO feed (a) F.BP, (b)
F.HS&BB, and (c) F.LMW. ...................................................................................... 96
Figure 5.10 (a) Biovolume (μm3/μm2) of live and dead cells, (b) LC-OCD, (c) EPS
(protein and polysaccharide), (d) FEEM of biofouled RO membranes by Vibrio sp.
B2 (Kim and Chong 2017) in different isolated dissolved organic fractions from
seawater. The control experiments in (b) were tests without the presence of bacteria,
taken from our previous work (Chapter 4). .............................................................. 99
Figure 6.1 Diagram of the seawater pretreatment process and fouling experiment.
104
Figure 6.2 Flux decline profile of RO system fed with permeate from UF and UF-NF
pretreatment. ........................................................................................................... 111
List of figures
x
Figure 6.3 Morphology of RO membrane surface fed with (a) UF permeate, (b)
NF270 permeate, (c) NF1 permeate and (d) NF2 permeate under a magnitude of
×10,000. .................................................................................................................. 113
Figure A.1 Conductivity profile of MF filtered seawater in diluate during the ED
process at applied voltage of 10, 30, and 60 V. 121
Figure A.2 MF filtred seawater organic transfer in diluate and concentrate during ED
process at voltage of 60V. ....................................................................................... 122
Figure A.3 Comparison of (a) humic acids, and (b) F.HS&BB on organic transfer in
diluate and concentrate during ED process at voltage of 60V. ............................... 123
Figure A.4 Comparison of (a) sucrose, and (b) AOM.LMW on organic transfer in
diluate and concentrate during ED process at voltage of 60V. ............................... 124
Figure B.1 Flux decline of (a) NF1, NF2, and NF270 against recovery and (b)
extended operating time (right) fed with raw seawater. 125
Figure B.2 Foulant analysis on NF membranes (a) fed with raw seawater and (b) UF
filtered seawater. ..................................................................................................... 125
List of tables
xi
LIST OF TABLES
Table 2.1 Common analytical techniques for characterization of DOM in seawater.
.................................................................................................................................. 18
Table 2.2 List of major pretreatment methods in seawater desalination process. .... 34
Table 3.1 Surface tension properties of probe liquids (Hwang, Lee et al. 2011) 52
Table 4.1 Compositions of seawater in this study (n = 15) 61
Table 4.2 Contact angle, zeta potential (pH = pHsw), molecular weight cut off
(MWCO) and material of UF and NF membranes ................................................... 62
Table 4.3 The recovery of organic compounds in the fractionation and concentration
process by membrane technique in one batch of experiment with initial volume of
285 litres of seawater. ............................................................................................... 66
Table 4.4 Ions concentrations in each organic fraction before and after salt adjustment.
.................................................................................................................................. 67
Table 4.5 Contact angle and zeta potential of clean RO membrane and fouled RO
membranes with isolated organic fractions. ............................................................. 76
Table 4.6 Surface tension and interfacial free energy of foulant-membrane and
foulant-foulant (mJ/m2) ............................................................................................ 78
Table 5.1 Concentration of dissolved ions in isolated dissolved organic fractions
before and after ionic adjustment. 87
Table 5.2 AOC/DOC of isolated dissolved organic fractions. .................................. 89
Table 5.3 Contribution of AOC and DOC by different organic compounds in seawater.
.................................................................................................................................. 90
Table 6.1 Properties of NF270, NF1 and NF2. 105
Table 6.2 Water quality of raw seawater and permeate from UF and UF-NF
pretreatment. ........................................................................................................... 108
Table 6.3 Organic rejection by UF and NF membranes against recovery
(measurements were obtained from cross-flow filtration at 1 bar for UF and 4 bars
for NF membranes). ................................................................................................ 108
Table 6.4 Cation rejections of NF membranes against recovery (measurements were
obtained from cross-flow filtration at 4 bars). ........................................................ 110
List of tables
xii
Table 6.5 Anion rejections of NF membranes against recovery (measurements were
obtained from cross-flow filtration at 4 bars). ........................................................ 110
Table 6.6 Foulant analysis on RO membranes using permeate from UF and NF
pretreatments. ......................................................................................................... 112
List of symbols
xiii
LIST OF SYMBOLS
A Membrane area
CP Concentration polarization
!" Salt concentration in bulk
!# Salt concentration in permeate
!$ Salt concentration near membrane surface
e Electron charge
I Membrane fouling potential
Jv Permeate flux
k Boltzmann’s constant
%$ Mass-transfer coefficient
Ninitial Initial cell count
Nfinal Final cell count
Nnegative Cell count in negative control
ni The number of ions
Rm Membrane resistance
&' Foulant hydraulic resistance
t Filtration time
T Absolute temperature
V Permeate volume
zi The valence of ions
( Viscosity
θ Contact angle
γLW Liftshitz-van der Waals component
γ+ Electron acceptor
γ- Electron donor
Ɛ0 Dielectric permittivity of the fluid
Ɛr Dielectric permittivity of the water
ζm Surface potential of membrane
ζc Surface potential of colloids
List of symbols
xiv
κ Inverse Debye screening length
∆*$ Osmosis pressure difference between feed and permeate
ΔP Pressure drop
ΔGTOT Total interaction energy
ΔGLW Lifshitz-van der Waals interaction
ΔGEL Electrostatic double layer interaction
ΔGAB Lewis acid-base interaction
List of abbreviations
xv
LIST OF ABBREVIATIONS
AB Acid-base
AFM Atomic Force Microscopy
AOC Assimilable Organic Carbon
AOM
BP
Algal Organic Matter
Biopolymers
BSA Bovine Serum Albumin
BOM Biodegradable Organic Matters
BDOC Biodegradable Dissolved Organic Carbon
BECP Biofilm-enhance Concentration Polarization
CP Concentration Polarization
CEOP Cake Enhance Osmotic Pressure
DI Deionized
DBP Disinfection By-product
DLVO Derjaguin-Landau-Verwey-Overbeek
DOC
DOM
Dissolved Organic Carbon
Dissolved Organic Matter
ED Electrodialysis
EDL Electrical Double Layer
EPS Extracellular Polymeric Substances
FA Fulvic Acids
F.BP Fraction of Biopolymers
F.HS&BB Fraction of Humic Substances and Building Blocks
F.LMW Fraction of Low Molecular Weight
FEEM Fluorescence Excitation Emission Matrix
HA Humic acids
HS&BB Humic Substances and Building Blocks
ICP-OES Inductively Coupled Plasma Optical Emission Spectrometry
LC-OCD Liquid Chromatography with Organic Carbon Detection
LMW Low Molecular Weight
LW Lifshitz-van der Waals
List of abbreviations
xvi
MD Membrane Distillation
MF Microfiltration
MFI Modified Fouling Index
MW
MWCO
Molecular Weight
Molecular Weight Cut Off
NF Nanofiltration
NOM Natural Organic Matters
PA Polyamides
POM Particulate Organic Matter
RO Reverse Osmosis
SA Sodium Alginate
SMP soluble microbial products
SPE Solid-Phase Extraction
SWRO Seawater Reverse Osmosis
TDS Total Dissolved Solid
TEP Transparent Exopolymers
TOC Total Organic Carbon
TMP Trans-membrane Pressure
UF Ultrafiltration
VDW Van Der Waals
XDLVO Extended Derjaguin-Landau-Verwey-Overbeek
Summary
xvii
SUMMARY
Seawater reverse osmosis (SWRO) desalination technology is an important
technology for providing potable water for industries and human daily life due to its
lower-energy consumption compared to thermal based desalination technology.
However, membrane fouling is still a persistent problem in SWRO desalination plants.
Organic fouling and biofouling, in particular the interplay between them, are the
challenges that require attention.
In the first part of my study, the focus was on organic fouling in SWRO desalination
process. Classifying organics in seawater will provide an in-depth understanding of
the important fraction on SWRO organic fouling. The dissolved organic matter
(DOM) in seawater was fractionated and concentrated by a membrane-based
technique into three major fractions according to their molecular weight (MW) as
defined in the liquid chromatography with organic carbon detection (LC-OCD)
method, namely the fraction of biopolymer (F.BP, MW > 1000 Da), fraction of humic
substance with building block (F.HS&BB, MW 350 – 1000 Da), and fraction of low
molecular weight compounds (F.LMW, MW < 350 Da). An overall recovery of >80%
of the organics in seawater was attained. Compared with model foulants such as
sodium alginate (SA), bovine serum albumin (BSA), and humic acid (HA), all
isolated organic fractions showed lower fluorescence intensities, and had lower
fouling potentials than common model foulants used in SWRO fouling studies, thus
the model foulants were not good representatives of the natural organics in seawater.
In addition, results from atomic force microscopy (AFM) and extended Derjaguin-
Landau-Verwey-Overbeek (XDLVO) theory showed that initial fouling (i.e., foulant-
membrane interaction) was the main driver in SWRO organic fouling with F.BP as
the major contributor followed by F.LMW. In addition, divalent ions were found to
enhance the RO fouling by increasing the adhesion and cohesion forces between
foulant-membrane and foulant-foulant.
In second part of my study, the focus was on biofouling and the interplay between
organic fouling and biofouling in SWRO desalination process by using the isolated
Summary
xviii
dissolved organic fractions. From the assimilable organic carbon (AOC) results, the
AOC/DOC ratio was in the order of F.LMW (~35%) > F.BP (~19%) > F.HS&BB
(~8%); AOC/DOC of seawater was ~20%; organic compositions of seawater were
BP ~6%, HS&BB ~52% and LMW ~42%; thus LMW accounted for >70% of AOC
in seawater. Their impact on SWRO biofouling in term of flux decline rate was in the
order of F.LMW (~30%) > F.BP (~20%) > F.HS&BB (<10%). Despite being the
major organic compound in seawater, HS&BB showed marginal effect on biofouling.
The role of indigenous BP was less critical owing to its relatively low concentration.
LMW, which was the major AOC contributor, played a significant role in biofouling
by promoting microbial growth that contributed to the build-up of soluble microbial
products and exopolymeric substances (i.e., in particular BP). Therefore, seawater
pretreatment shall focus on the removal of AOC (i.e., LMW) rather than the removal
of biopolymer.
In third part of my study, the focus was on the LMW removal by using low-pressure
NF pretreatment process and the subsequent impact on SWRO fouling. Three
different membranes were evaluated: NF270 was a commercial membrane based on
polyamide thin film composite with negatively charged surface, NF1 and NF2 were
glutaraldehyde cross-linked layer-by-layer polyelectrolyte membranes with
positively charged surface (i.e., NF2 contained more polyelectrolyte layers than NF1).
The organic/inorganic rejection of NF membranes followed the order of NF2 > NF1 >
NF270 while pure water permeability (PWP) was in the order of NF1 > NF270 >
NF2. Meanwhile the degree of RO fouling in term of flux decline and foulant amount
was in the order of NF270 > NF1 > NF2. In addition, the results suggested that NF
membrane can be optimized to achieve excellent removal of LMW, but a balance
between permeability, rejection and fouling shall be considered when selecting the
membrane for seawater pretreatment. For instance, NF2 membrane with the lowest
permeability (~1.9 LMH/bar) was less competitive even though it showed the lowest
SWRO fouling (i.e., flux decline ~3%) as compared to NF 1 (permeability of 4.0
LMH/bar, flux decline ~10%).
Chapter 1
1
CHAPTER 1 Introduction
1.1 Background
Water scarcity is one of the main challenges facing many countries around the world.
The demand of fresh water is increasing at an accelerating rate with the increase in
population and expansion of industrial and agricultural activities. To date, fresh water
sources such as surface water and groundwater are over-exploited. To overcome the
water scarcity, seawater desalination by reverse osmosis (RO) technology is regarded
as the most widely used technique to convert seawater to high quality potable water.
For example, more than 60% desalination capacity in the world is based on membrane
technology (Abdelkareem, Assad et al. 2018).
RO membrane-based desalination technology is popular as compared to thermal-based
desalination technology due to its lower energy consumption of about ~3 - 4 kWh/m3
(Amy, Ghaffour et al. 2017), which is 8 times lower than thermal-based method (i.e.,
~35 kWh/m3) (Fritzmann, Löwenberg et al. 2007, Amy, Ghaffour et al. 2017). About
85% of total energy consumed by SWRO desalination process is associated with the
RO process while other units such as intake, pre-treatment, and post-treatment etc.
consume about 15% of total energy. However, membrane fouling is still the bottleneck
of RO technology that results in a decrease in productivity and quality, an increase in
energy demand and chemical usage for membrane cleaning, thus an increase in the
operation & maintenance cost. Therefore, an understanding of the mechanisms of RO
fouling is critical to mitigate fouling process in order to prolong the membrane lifetime
and reduce the energy demand and chemical usage.
Chapter 1
2
1.2 Problem statement
Organic fouling caused by dissolved organic matter (DOM) in seawater can
significantly increase the operational costs and energy consumption during SWRO, but
organic fouling in SWRO process has not been fully understood (Ang, Tiraferri et al.
2011). Based on operational definition, for example retention by a filter (i.e. 0.45 µm),
the retained organic matters are referred to as particulate organic matter (POM) while
the fraction that passed through the filter are referred to as DOM. Typically, the
pretreatment process in SWRO demonstrated high efficiency in the removal of POM
but not DOM (Jamaly, Darwish et al. 2014), thus the focus of this study is on the impacts
of DOM on RO fouling.
The DOM in seawater is a complex mixture of polysaccharides, proteins, amino acids,
carbohydrates, and humics with wide ranges of molecular weights (MWs), functional
groups, structural features, and in complex matrix. Most oceanic DOM is of marine
origin, where the DOM accumulation at surface ocean (<1000 m) is closely associated
with biological production from biotic and abiotic removal processes while the DOM
at the deep ocean (>1000 m) is refractory (Ogawa and Tanoue 2003, Carlson and
Hansell 2015). In comparison to surface water and wastewater, the DOM concentration
in seawater is relatively low (typically < 5 mg-C/L), but severe RO fouling can still be
easily triggered by these organics. In general, the studies on RO organic fouling by
natural seawater have focused more on the assessment of the pretreatment process and
the overall RO membrane performance, the fundamentals of fouling are less discussed
(Jeong, Naidu et al. 2016). In other studies, various model foulants such as alginic acid
or sodium alginate (SA), bovine serum albumin (BSA), and humic acid (HA) have been
employed as the surrogates of DOM to understand their effects on RO membrane
fouling (Ham, Kim et al. 2013, Park, Jeong et al. 2019). The relevant investigations
clearly demonstrate different fouling tendencies with different groups of organic
Chapter 1
3
components in membrane process (Miyoshi, Hayashi et al. 2016, Ding, Yamamura et
al. 2018), e.g., fouling rate has strong correlation (R = 0.74) with TEP concentration but
neglectable correlation (R = -0.09) with TOC concentration in Miyoshi’s study. The
fouling layers formed on the membrane surface appear to lead to different resistances
from the complex organic solutions (Ao, Liu et al. 2016), e.g., the irreversible fouling
resistance of organic solution with high turbidity is 5 times higher than that with low
turbidity. In addition, the co-existence of various types of model foulants also resulted
in a synergistic fouling effect on membranes (Li and Elimelech 2006, Ang and
Elimelech 2007), e.g., flux decline caused by the combined fouling (i.e., alginate + BSA)
was increased ~20% compared with single organic fouling (i.e., BSA) without divalent
ions in Ang’s study. However, the straightforward analysis with model foulants in RO
fouling seems insufficient to represent the actual fouling phenomena in SWRO, which
may lead to missing or inaccurate results. The extraction of natural organics from real
seawater sources becomes the main challenge for the investigation of RO fouling using
real seawater.
In addition to organic fouling, the biofilm formation on RO membrane is closely
associated with the organics in RO feed water. For instance, bacteria consume feed
organics to proliferate; extracellular polymeric substances (EPS) are secreted by
bacteria cells; soluble microbial products (SMP) are released from metabolism of feed
organics (i.e., utilization associated products, UAP) as well as during cell lysis and
hydrolysis of EPS (i.e., biomass associated products, BAP); a portion of the SMP could
be easily utilized by bacteria (Kunacheva and Stuckey 2014). In general, DOM can be
further categorized into biopolymer (BP, molecular weight, MW >1000 Da), humic
substances and building blocks (HS&BB, MW 350 – 1000 Da), and low molecular
weight compounds (LMW, MW < 350 Da) by liquid chromatography-organic carbon
detection (LC-OCD) analysis (Huber, Balz et al. 2011). Biodegradable organic matter
Chapter 1
4
or biodegradable organic carbon (BOM or BDOC) is defined as the DOM that can be
mineralized by heterotrophic microorganisms; while assimilable organic carbon (AOC)
is that portion of BDOC that can be readily utilized to support microbial growth (Wang,
Tao et al. 2014). Over the years, AOC measurement has been widely applied as a
surrogate to predict the biofouling potential of various types of water in various water
treatment processes (Water and Solutions 2005, Weinrich, LeChevallier et al. 2016,
Terry and Summers 2018) including seawater applications (Water and Solutions 2005,
Jeong et al. 2013b, Jeong et al. 2016, Weinrich et al. 2016). The AOC measurement
method based on colony forming units was first proposed by van der Kooij (van der
Kooij et al. 1982), and later improved by other researchers to enhance its accuracy and
efficiency (van der Kooij, Visser et al. 1982, Kaplan, Bott et al. 1993, LeChevallier,
Shaw et al. 1993). In addition, flow cytometry instrument has been used to measure the
AOC rapidly by counting the true volumetric cells in the solution (Hammes and Egli
2005, Elhadidy, Van Dyke et al. 2016). Assessing the AOC concentration in SWRO
process is critical as it has been reported that after pretreatment processes of raw
seawater, the RO feed water still have high biofouling potential as surviving cells can
proliferate by consuming the residual biodegradable substances (Matin, Khan et al.
2011). For example, organic molecules (MW < 1000 Da) leaking from coagulation or
ultrafiltration (UF) membrane showed a strong relationship with AOC content (Hem
and Efraimsen 2001). In addition, it was reported that an increase in AOC level was
associated with excessive chemical dosing (i.e., chlorination and then de-chlorination
with sodium bisulfite), fluctuation of water quality (i.e., algal blooms) and organic
oxidation (Weinrich, LeChevallier et al. 2016). Furthermore, study also showed that NF
permeate with very low DOM amount could still be preferentially consumed by the
bacteria (Meylan, Hammes et al. 2007).

Chapter 1
5
Despite large amount of research work on organic fouling and biofouling in RO process,
the role of organic compositions in seawater on SWRO biofouling remains unclear,
more importantly the interplay between them. Most of previous studies used nutrient
broth or acetate as the nutrient source to simulate biofouling (Chong, Wong et al. 2008,
Siddiqui, Rzechowicz et al. 2015, Harlev, Bogler et al. 2019), which was not good
representative of organics in seawater and might not capture the actual mechanism in
SWRO biofouling. Since biopolymers and humic substances were identified as the
major organic foulant on RO membrane, it was recommended to reduce the high
molecular weight organic content in RO feed to reduce the flux decline (Deng, Ngo et
al. 2019). On the other hand, it was established that the removal of AOC, i.e., reduction
in biofouling potential, was accompanied by the removal of LMW in seawater
pretreated with biofilter and MBR (Naidu, Jeong et al. 2013, Jeong, Rice et al. 2014),
nevertheless the studies did not perform SWRO biofouling test to confirm its actual
impact. Therefore, this warrants further investigation on the effect of different dissolved
organic compounds on biofouling in SWRO process in order to formulate an effective
pretreatment that target at the culprit for fouling mitigation.
1.3 Objectives and scope
The objectives and scope of this study are shown and summarized as follow:

Chapter 1
6
1) Literature review on fouling in seawater reverse osmosis (SWRO) desalination
process (Chapter 2).
2) Materials and methods (Chapter 3).
3) Investigate the SWRO organic fouling mechanism by using isolated organic
fractions from seawater. First, DOM in seawater was fractionated into different
fractions based on their MWs, i.e., biopolymer (BP, molecular weight,
MW >1000 Da), humic substances and building blocks (HS&BB, MW 350 –
1000 Da), and low molecular weight compounds (LMW, MW < 350 Da), using
a membrane-based technique, i.e., a combination of ultrafiltration (UF) and
nanofiltration (NF) membranes. Then, the isolated organic fractions and their
corresponding model foulants were characterized by size exclusion liquid
chromatography and fluorescence spectroscopy, and were compared in term of
their fouling potentials. In addition, SWRO fouling of the isolated organic
Chapter 1
7
fractions were performed. The interaction force and interfacial energy were
examined by AFM force-distance measurement and XDLVO theory (Chapter
4).
4) Investigate the biofouling potential of the isolated organic fractions from
seawater and to evaluate their impacts on membrane biofouling in SWRO
desalination process. First, three major dissolved organic fractions were isolated
from seawater by the fractionation method developed in Chapter 4. Second, the
biofouling potential of the isolated dissolved organic fractions was
characterized by the assimilable organic carbon (AOC) measurement. Third, the
organic transformation that occurred during the bacteria growth was examined.
Fourth, the bacteria-clean/fouled membrane interactions were characterized by
atomic force microscopy (AFM) analysis. Last, the impact of isolated dissolved
organic fractions on SWRO biofouling was investigated using a laboratory
cross-flow RO setup (Chapter 5).
5) Investigate the fouling mitigation in SWRO process by removing LMW
compounds in seawater using low-pressure nanofiltration (NF) membrane. First,
three NF membranes were characterized in terms of permeability and molecular
weight cut off (MWCO): NF270, which was a commercial membrane based on
polyamide thin film composite membrane; NF1 and NF2, which were
glutaraldehyde cross-linked layer-by-layer polyelectrolyte membranes (i.e.,
NF2 contained more polyelectrolyte layers than NF1). The organic/inorganic
rejection properties of membranes were determined from LC-OCD, ICP-OES
and IC measurements. The key water quality parameters of NF permeate were
monitored by LC-OCD (i.e., LMW) and AOC measurements. The impact of
LMW and AOC concentrations on SWRO fouling was critically assessed
(Chapter 6).
Chapter 2
8
CHAPTER 2 Literature Review
2.1 Pressure-Driven Membrane Processes
2.1.1 Fundamentals
Membrane acts as a selective barrier that retains certain components while allows other
components to pass through (Mulder 2012). The most common type of membrane used
in water-related process is the pressure-driven membrane. In general, there are 4
categories of pressure-driven membrane: microfiltration (MF, pore size ~ 0.1 – 10 µm),
ultrafiltration (UF, pore size ~ 0.001 – 0.1 µm), nanofiltration (NF, MWCO 200 – 1000
Da) and reverse osmosis (RO, non-porous, MWCO < 200 Da). Recent years, reverse
osmosis (RO) technology becomes popular for potable water production include
seawater desalination, due to its excellent salt rejection properties and lower energy
consumption as compared thermal-based desalination process (Clever, Jordt et al. 2000).
In natural osmosis process, solvent (i.e., water) permeates across the semipermeable
membrane from low concentration (i.e., low osmotic pressure) solution to high
concentration (i.e., high osmotic pressure) solution. In RO process, hydraulic pressure
difference higher than the osmotic pressure difference across the membrane need to be
applied to reverse the water flow direction (Figure 2.1). The permeate flux of RO, Jv,
defined as the volumetric flow of permeate per unit membrane area is given by the
osmotic pressure-resistance model:
J, =./01
= 2345∆61781
Equation (2-1)
Where TMP is trans-membrane pressure, and ∆π: is the effective osmotic pressure
difference across the membrane, and µ is the permeate (i.e., water) viscosity, and R:
is the membrane hydraulic resistance.
Chapter 2
9
Figure 2.1 Illustration of reverse osmosis process
2.1.2 RO Membrane, Modules and Operation Mode
Most of current commercial RO membranes are thin film composite membranes based
on polyamides (PA). The spiral wound module (SWM) (Figure 2.2) is the most
common configuration for RO as it can be operated at high pressure (typically up to 69
bar) and has moderate packing density. The SWM consists of multilayers of feed
channel spacer-RO membrane-permeate spacer sandwiched together and rolled up like
a ‘Swiss roll’. The function of the feed channel spacer is to improve the hydrodynamics
(i.e., mass transfer) in order to reduce concentration polarization (CP) and membrane
fouling.
SWM is the most common configuration for SWRO with market share of > 90%
(Karabelas, Kostoglou et al. 2015), other configurations such as hollow fiber and flat-
sheet plate & frame are less common due to the following reasons:
(a) The hollow fiber RO membrane is based on cellulose acetate which is prone to
microbial attack and has limited pH range of 7 – 10 as compared to TFC polyamide RO
with pH range of 2 – 11, which can be cleaned by acid and base.
Pressure
Membrane
No pressure water flow
Fresh water Salt waterApplied pressure water flow
∆*
Chapter 2
10
(b) The flat-sheet plate & frame configuration has low packing density as compared
to SWM, thus increases the footprint.
Figure 2.2 Spiral wound membrane module for desalination (Karabelas, Kostoglou et al. 2015).
The membrane system can be operated in crossflow or dead end mode (Figure 2.3). In
dead end operation, there is no retentate stream, so 100% recovery can be obtained. In
crossflow operation, the surface shear can improve the hydrodynamics which reduces
the CP, but only a fraction of feed is passed through the membrane, hence recovery is
<100%. For practical operation, the RO is typically operated in crossflow mode.
Figure 2.3 Membrane operation in (a) cross flow mode, and (b) dead end mode.
Chapter 2
11
2.1.3 Concentration Polarization (CP)
CP is a common phenomenon in membrane process (Song and Elimelech 1995, Song
and Yu 1999). CP arisen due to the accumulation of rejected solutes (i.e., ions) on the
membrane surface, which generates a solute flow back to bulk solution due to
concentration gradient. At steady state, the convective solute flow to membrane will be
balanced by solute flow through membrane plus back-transport flow from membrane
surface as shown in Figure 2.4. The magnitude of CP is an exponential function of
flux/mass transfer ratio:
CP =?15?/?@5?/
= exp( FGH1) Equation (2-2)
Where C: is the salt concentration at membrane surface, CJ is the salt concentration
in bulk solution, and CK is the salt concentration in permeate.k: is the mass-transfer
coefficient. Thus, reduce the operating flux and improve the mass transfer (i.e., using
feed channel spacer) can reduce CP (Matthiasson and Sivik 1980).
Figure 2.4 Concentration polarization schematic description.
Chapter 2
12
CP is not desired as it increases the concentration thus osmotic pressure at the
membrane surface. CP is also linked to membrane fouling since the fouling species
accumulate on the membrane surface under the effect of CP.
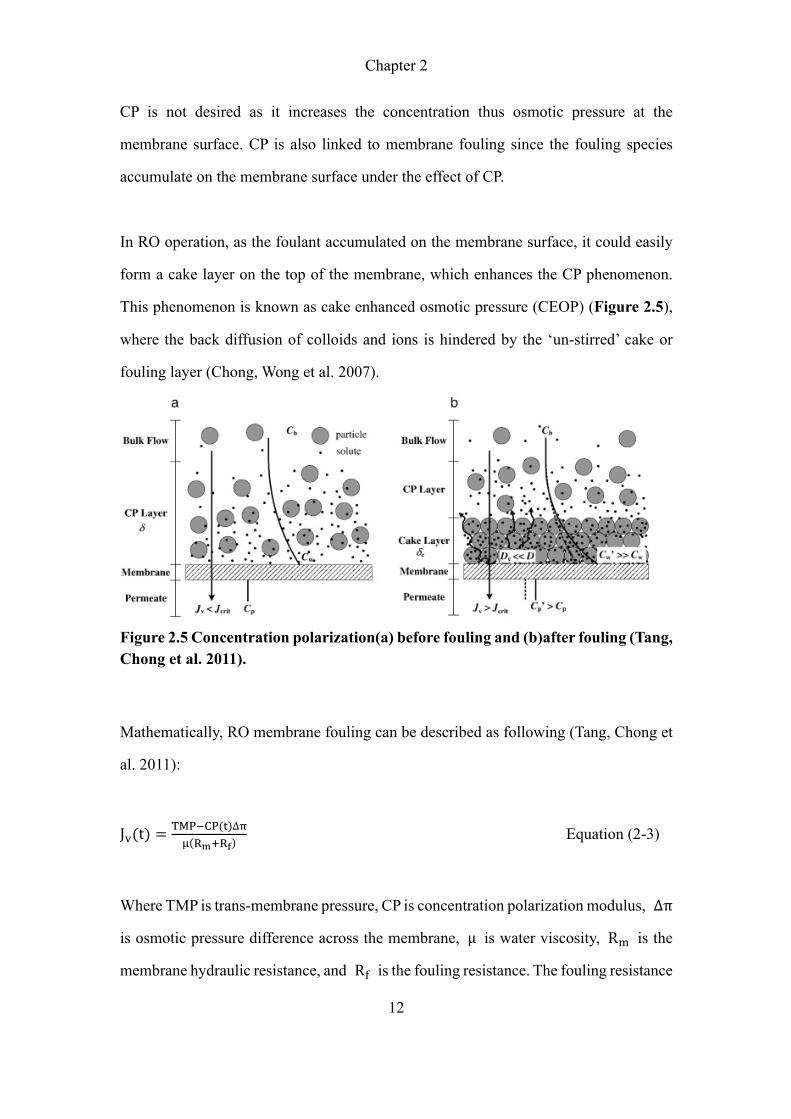
In RO operation, as the foulant accumulated on the membrane surface, it could easily
form a cake layer on the top of the membrane, which enhances the CP phenomenon.
This phenomenon is known as cake enhanced osmotic pressure (CEOP) (Figure 2.5),
where the back diffusion of colloids and ions is hindered by the ‘un-stirred’ cake or
fouling layer (Chong, Wong et al. 2007).
Figure 2.5 Concentration polarization(a) before fouling and (b)after fouling (Tang, Chong et al. 2011).
Mathematically, RO membrane fouling can be described as following (Tang, Chong et
al. 2011):
J,(t) =2345?4(N)∆67(81O8P)
Equation (2-3)
Where TMP is trans-membrane pressure, CP is concentration polarization modulus, ∆π
is osmotic pressure difference across the membrane, µ is water viscosity, R: is the
membrane hydraulic resistance, and RQ is the fouling resistance. The fouling resistance
Chapter 2
13
is the sum of reversible, irreversible and irremovable fouling resistances; while the
CEOP effect is reflected by changes in CP as a function of time.
2.1.4 Seawater Reverse Osmosis (SWRO) Desalination Process
In general, seawater contains ~96% water and ~4% of total dissolved solid (TDS),
which composes of large amount of salts, in particular sodium and chloride ions (Kaya,
Sert et al. 2015). The TDS in seawater varies with location based on evaporation rate
and temperature (Wright 1995, Dalvi, Al-Rasheed et al. 2000). The high TDS gives rise
to high osmotic pressure, thus SWRO desalination process typically requires pressure
of > 50 bar, which means high energy demand of > 2.5 kWh/m3 water produced.
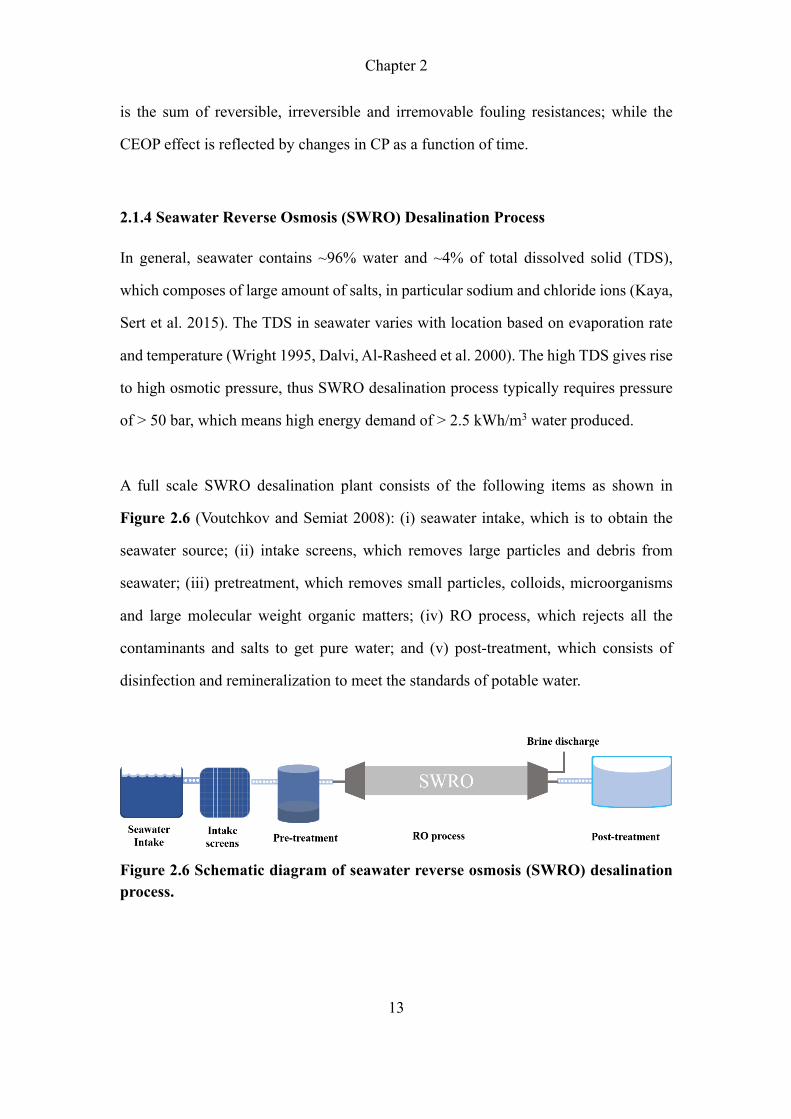
A full scale SWRO desalination plant consists of the following items as shown in
Figure 2.6 (Voutchkov and Semiat 2008): (i) seawater intake, which is to obtain the
seawater source; (ii) intake screens, which removes large particles and debris from
seawater; (iii) pretreatment, which removes small particles, colloids, microorganisms
and large molecular weight organic matters; (iv) RO process, which rejects all the
contaminants and salts to get pure water; and (v) post-treatment, which consists of
disinfection and remineralization to meet the standards of potable water.
Figure 2.6 Schematic diagram of seawater reverse osmosis (SWRO) desalination process.
Chapter 2
14
SWRO desalination process has been successfully applied in many countries such as
Israel and Singapore. By 2020, the total capacity in Israel is expected to rise to 650
million m3/year, which occupies 30% of the total potable water supply (Dreizin, Tenne
et al. 2008). In Singapore, due to limited natural water resources and catchment areas,
desalinated water by RO technology becomes an important source of water, i.e., 4th
National Tap (Chua, Hawlader et al. 2003); the current total capacity is 1.6 million m3/d,
which by 2060 it is expected to meet up to 30% of Singapore’s water needs.
2.1.5 Membrane Fouling
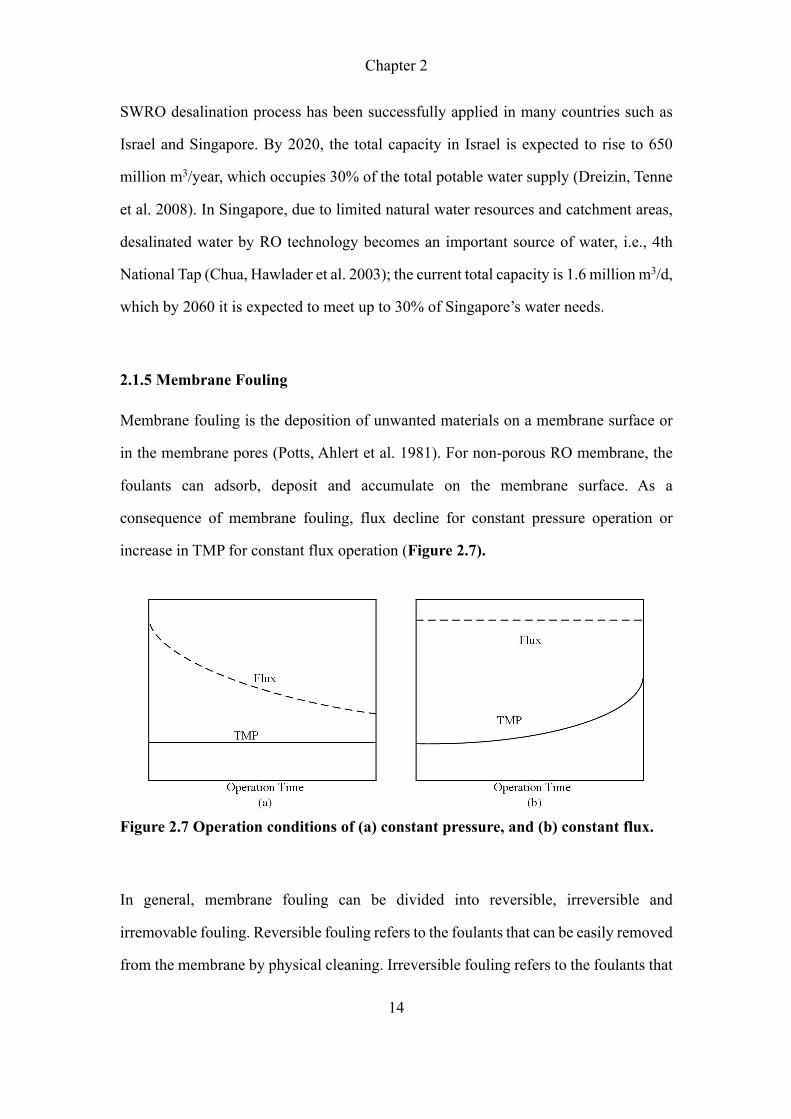
Membrane fouling is the deposition of unwanted materials on a membrane surface or
in the membrane pores (Potts, Ahlert et al. 1981). For non-porous RO membrane, the
foulants can adsorb, deposit and accumulate on the membrane surface. As a
consequence of membrane fouling, flux decline for constant pressure operation or
increase in TMP for constant flux operation (Figure 2.7).
Figure 2.7 Operation conditions of (a) constant pressure, and (b) constant flux.
In general, membrane fouling can be divided into reversible, irreversible and
irremovable fouling. Reversible fouling refers to the foulants that can be easily removed
from the membrane by physical cleaning. Irreversible fouling refers to the foulants that
Chapter 2
15
can only be removed by chemical cleaning while irremovable fouling refers to foulants
that stay permanently on the membrane surface, i.e., permanent loss of membrane
permeability (Fan, Harris et al. 2001).
Fouling in RO process can be generally classified into scaling, colloidal fouling, organic
fouling and biofouling (Chian, Chen et al. 2007). Scaling refers to the
crystallization/precipitation of inorganic salt when the concentration of sparingly
soluble salt, i.e., calcium carbonate, calcium sulfate, etc., exceeds the saturation level
at the RO membrane surface. Scaling in RO can be easily prevented by avoiding high
recovery operation to maintain the system below the solubility limit of salts or adding
scale inhibitors (Jiang, Li et al. 2017). Colloidal fouling refers to the deposition of
colloids, i.e., rigid inorganic colloids such as silica, aluminium silicate, iron hydroxide
etc. and organic macromolecules, typically in the size range of 1-1000 nm, and
formation of a cake layer on the RO membrane surface (Tang, Chong et al. 2011).
Colloidal fouling by organic compounds is also known as organic fouling. Colloidal
fouling can be mitigated by seawater pretreatment such as coagulation-flocculation or
microfiltration-ultrafiltration and combination of processes, in which the effectiveness
depends strongly on the size and nature of colloids. Biofouling is related to biofilm
formation on membrane surface, which is recognized as the most challenging problem
for many SWRO desalination plants (Nejati, Mirbagheri et al. 2019). This is because
even with 99.9% removal of microorganisms in RO feed water, severe biofouling can
still occur (Matin, Khan et al. 2011). The focus of this work is on organic fouling and
biofouling which are elaborated in the following sections.
2.2 Organic Fouling
Despite the organic concentration in seawater is lower compared to the inorganic parts,
organic fouling is still the Achilles heel of SWRO desalination process since organic
Chapter 2
16
fouling layer can support bacteria growth that causes subsequent biofilm formation
(Shon, Kim et al. 2009).
2.2.1 Characteristics of Seawater Organic Matters
Natural organic matters (NOM) in seawater are generally divided into two parts, i.e.,
particulate organic matters (POM) and dissolved organic matters (DOM). POM is
commonly defined as the organic matters with particle size larger than 0.45 μm, while
DOM is defined as the organic matters with particles size less than 0.45 μm. In seawater,
POM occupies very small portion of the total organic matters (Thurman 1985).
Typically, the pretreatment process in SWRO demonstrated high efficiency in the
removal of POM but not DOM (Jamaly, Darwish et al. 2014).
DOM in seawater consists of various organic matters with a wide range of molecular
weight (MW) distribution (Matilainen, Gjessing et al. 2011). The main components of
DOM in seawater consist of polysaccharides, proteins, humic acids, carbohydrates,
amino sugars and low molecular weight compounds (Thurman 1985, Ogawa and
Tanoue 2003). The relevant analytical techniques for organic matters are summarized
in
Table 2.1. Traditionally, the concentration of organics in seawater is quantified in
term of total organic carbon (TOC). However, detailed characteristics of the organics
cannot be well presented (Rodriguez 2011, Miyoshi, Hayashi et al. 2016). UV
absorbance was popular to characterize specific organics which absorb UV light at
wavelength of 254 nm. The drawback is that part of the residual organics cannot be
captured by UV detection. Fluorescence-excitation emission matrix (F-EEM), and the
attenuated total reflectance-fourier transform infrared spectrometry (ATR-FTIR) are
also powerful tools to characterize the organics, and the disadvantages are listed in
Table 2.1.
Chapter 2
17
Recent years, liquid chromatography-organic carbon detection (LC-OCD) has been
widely used to characterize the organics in seawater based on their MW, where DOM
can be separated into biopolymers (BP, MW > 1 kDa), humic substances with building
blocks (HS&BB, MW 350 – 1000 Da), and low molecular weight compounds (LMW,
MW < 350 Da) (Huber, Balz et al. 2011). From LC-OCD analysis, seawater mainly
consists of HS&BB and LMW compounds, occupying ~40-70% of the total DOC
(Penru, Simon et al. 2013, Simon, Penru et al. 2013). Humic substances are the major
portion in natural water (Fan, Harris et al. 2001), which consist of complex mixtures
such as aromatic and aliphatic components with mainly carboxylic and phenolic
functional groups (Thurman 1985). Reported MW of humic substances is about 1000
Da by using the LC-OCD analysis (Alizadeh Tabatabai, Schippers et al. 2014). In
addition, it was reported that BP, although occupies the least percentage of seawater
organics, seems to trigger severe RO fouling (Miyoshi, Hayashi et al. 2016).

Chapter 2
18
Table 2.1 Common analytical techniques for characterization of DOM in seawater.
Applications Advantages Disadvantages Typical range
TOC Measure the total
concentration of
organic carbon
-Timesaving
-Detect low concentration
(ppb level)
No detail of
organic MW
Organic
concentration:
0-100 ppm
UV254 -Identify aromatic
constituents
Timesaving Missing non-
UV absorbed
organics
Wavelength:
254 nm
LC-OCD Measure organic
carbon based on
MW
-MW distribution
-Concentration of different
fractions based on MW
-Detect low concentration
(ppb level)
Time-
consuming
MW range:
<0.45 um
F-EEM Detect protein-like,
tryptophan-like,
tyrosine-like, humic-
like, and fulvic-like
materials
-Timesaving
-Detect low concentration
(ppb level)
Missing non-
fluorescent
organics
Wavelength:
200-800 nm
ATR-FTIR Provide the
functional groups of
organics
-Timesaving
-Suitable for solid and
liquid samples
Less detail of
organic species
Wavelength:
400-5000 cm-1
2.2.2 Fouling Evaluation with Model Organic Foulants
In order to study the organic fouling in RO process, various model foulants with
uniform structure and well-known feature such as alginic acid or sodium alginate (SA),
Chapter 2
19
bovine serum albumin (BSA), humic acid (HA) and fulvic acid (FA) have been
employed as the surrogates of DOM (Zularisam, Ismail et al. 2006, Ham, Kim et al.
2013).
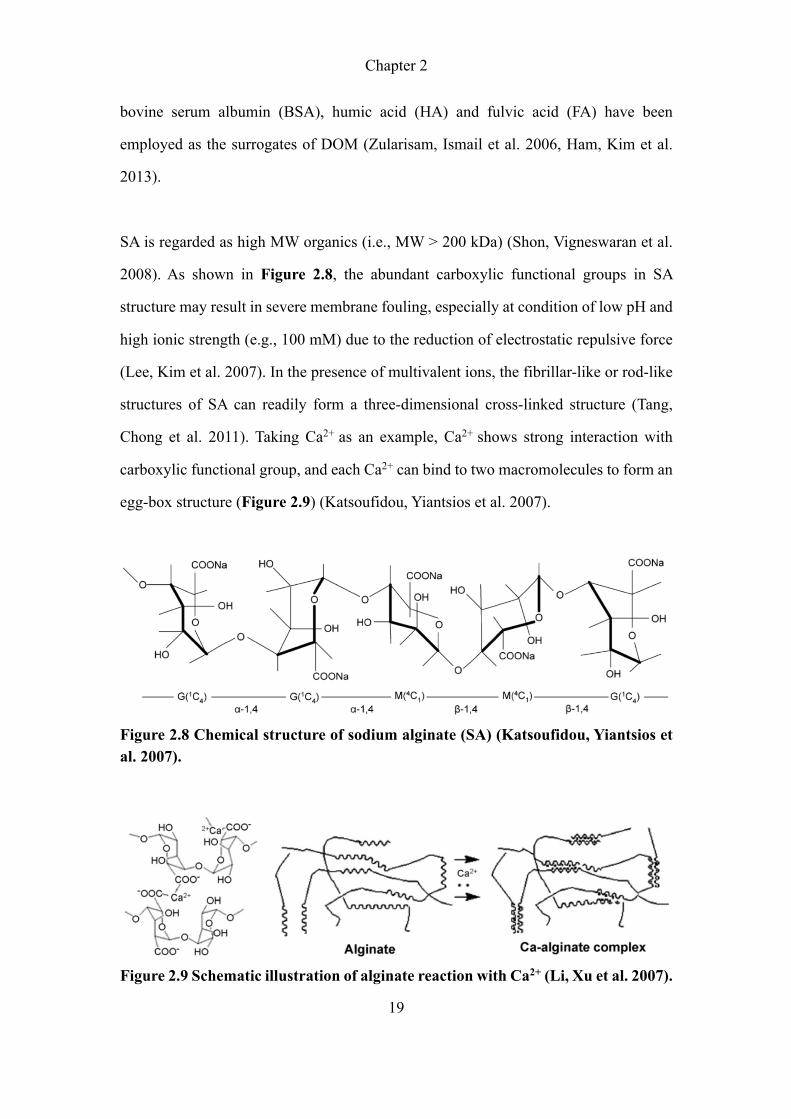
SA is regarded as high MW organics (i.e., MW > 200 kDa) (Shon, Vigneswaran et al.
2008). As shown in Figure 2.8, the abundant carboxylic functional groups in SA
structure may result in severe membrane fouling, especially at condition of low pH and
high ionic strength (e.g., 100 mM) due to the reduction of electrostatic repulsive force
(Lee, Kim et al. 2007). In the presence of multivalent ions, the fibrillar-like or rod-like
structures of SA can readily form a three-dimensional cross-linked structure (Tang,
Chong et al. 2011). Taking Ca2+ as an example, Ca2+ shows strong interaction with
carboxylic functional group, and each Ca2+ can bind to two macromolecules to form an
egg-box structure (Figure 2.9) (Katsoufidou, Yiantsios et al. 2007).
Figure 2.8 Chemical structure of sodium alginate (SA) (Katsoufidou, Yiantsios et al. 2007).
Figure 2.9 Schematic illustration of alginate reaction with Ca2+ (Li, Xu et al. 2007).
Chapter 2
20
BSA, as a common representative of protein, has a spherical structure and the MW is
well defined (MW ~67 kDa). BSA has been frequently selected as the model foulant to
study protein fouling in membrane processes (Li, Xu et al. 2007, Mo, Tay et al. 2008).
Similar to the SA, significant fouling can be observed under the condition of high ionic
strength and Ca2+ (Mo, Tay et al. 2008). In addition, BSA is sensitive to the pH of
solution because of the presence of carboxylic and amine functional groups (Tang,
Chong et al. 2011), where negative charge can be observed when pH value is higher
than its isoelectric point (pH = 4.7). It has been reported that most severe membrane
fouling occurred when pH reached the isoelectric point, where the repulsion force
between membrane and protein is the weakest (Mo, Tay et al. 2008).
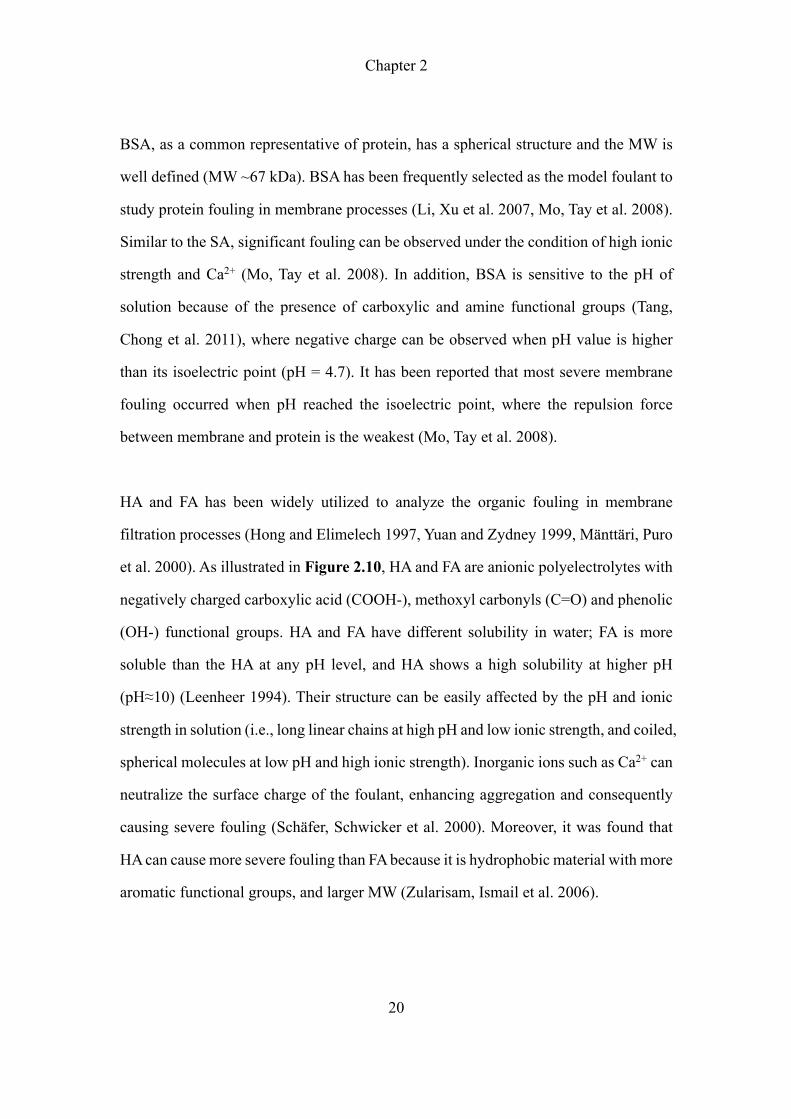
HA and FA has been widely utilized to analyze the organic fouling in membrane
filtration processes (Hong and Elimelech 1997, Yuan and Zydney 1999, Mänttäri, Puro
et al. 2000). As illustrated in Figure 2.10, HA and FA are anionic polyelectrolytes with
negatively charged carboxylic acid (COOH-), methoxyl carbonyls (C=O) and phenolic
(OH-) functional groups. HA and FA have different solubility in water; FA is more
soluble than the HA at any pH level, and HA shows a high solubility at higher pH
(pH≈10) (Leenheer 1994). Their structure can be easily affected by the pH and ionic
strength in solution (i.e., long linear chains at high pH and low ionic strength, and coiled,
spherical molecules at low pH and high ionic strength). Inorganic ions such as Ca2+ can
neutralize the surface charge of the foulant, enhancing aggregation and consequently
causing severe fouling (Schäfer, Schwicker et al. 2000). Moreover, it was found that
HA can cause more severe fouling than FA because it is hydrophobic material with more
aromatic functional groups, and larger MW (Zularisam, Ismail et al. 2006).
Chapter 2
21
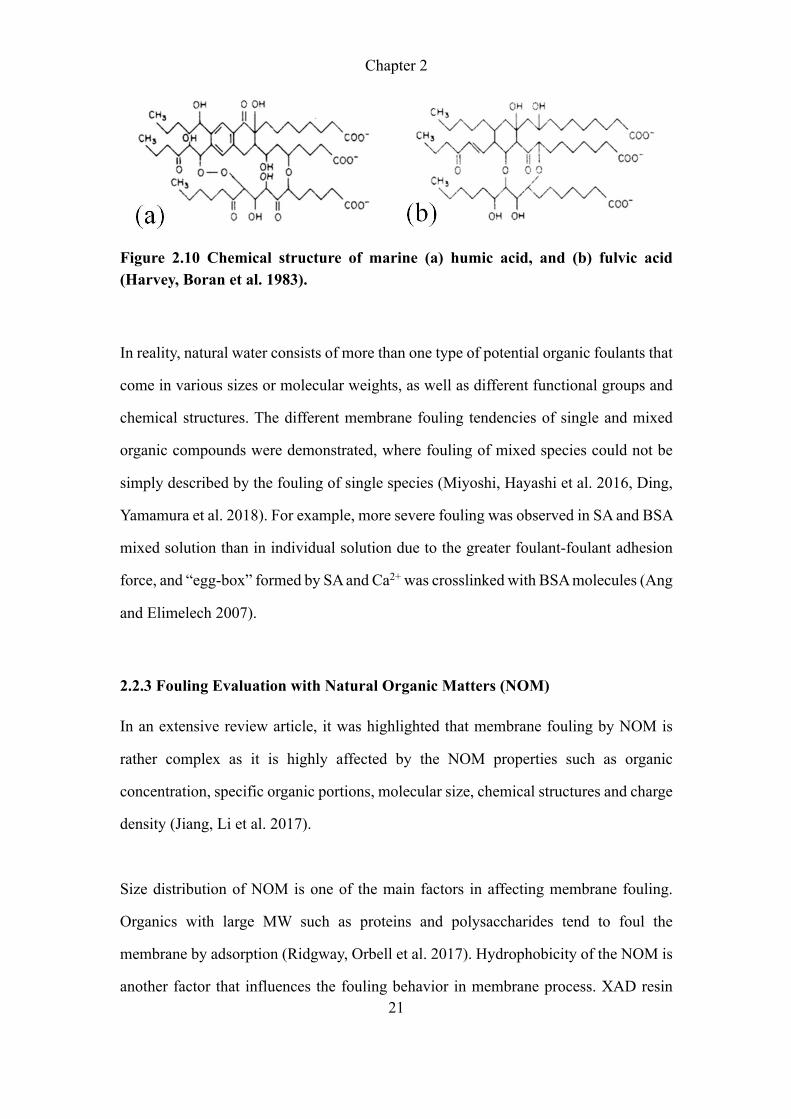
Figure 2.10 Chemical structure of marine (a) humic acid, and (b) fulvic acid (Harvey, Boran et al. 1983).
In reality, natural water consists of more than one type of potential organic foulants that
come in various sizes or molecular weights, as well as different functional groups and
chemical structures. The different membrane fouling tendencies of single and mixed
organic compounds were demonstrated, where fouling of mixed species could not be
simply described by the fouling of single species (Miyoshi, Hayashi et al. 2016, Ding,
Yamamura et al. 2018). For example, more severe fouling was observed in SA and BSA
mixed solution than in individual solution due to the greater foulant-foulant adhesion
force, and “egg-box” formed by SA and Ca2+ was crosslinked with BSA molecules (Ang
and Elimelech 2007).
2.2.3 Fouling Evaluation with Natural Organic Matters (NOM)
In an extensive review article, it was highlighted that membrane fouling by NOM is
rather complex as it is highly affected by the NOM properties such as organic
concentration, specific organic portions, molecular size, chemical structures and charge
density (Jiang, Li et al. 2017).
Size distribution of NOM is one of the main factors in affecting membrane fouling.
Organics with large MW such as proteins and polysaccharides tend to foul the
membrane by adsorption (Ridgway, Orbell et al. 2017). Hydrophobicity of the NOM is
another factor that influences the fouling behavior in membrane process. XAD resin
Chapter 2
22
was used to fractionate the NOM in surface water according to the degree of
hydrophobicity, where major three fraction can be obtained, i.e., hydrophilic fraction,
hydrophobic fraction, and transphilic fraction (Fan, Harris et al. 2001, Penru, Simon et
al. 2013). In terms of their fouling phenomenon, study demonstrated that hydrophobic
NOM fractions caused more severe fouling than hydrophilic fractions in the following
order: hydrophilic neutral > hydrophobic acids > transphilic acids > hydrophilic
charged (Nilson and DiGiano 1996). This also implicates that the charge of the organics
also a factor that lead to various level of fouling because foulant and membrane could
have electrostatic attraction or electrostatic repulsion according to the surface charge of
two materials (Mo, Tay et al. 2008).
In seawater reverse osmosis (SWRO) desalination plant, due to the low concentration
of NOM as compared with other water sources, organic fouling still occurs. From
SWRO membrane autopsies, it has been identified that the major organic foulants
consist of high molecular weight compounds include biopolymers such as
polysaccharides and proteins (Jeong, Kim et al. 2013, Miyoshi, Hayashi et al. 2016).
Transparent exopolymer particles (TEP) and extracellular polymeric substances (EPS)
are also detected on the RO membrane surface, the detailed characteristic and fouling
behavior will be discussed in the Section 2.3. In addition, recent study also suggested
that low molecular weight compounds were observed on fouled RO membrane (Jeong,
Naidu et al. 2016).
2.2.4 Interfacial Force Investigation in Organic Fouling
Generally, the fouling mechanism can be divided into two steps; organics first interact
with clean membrane, followed by the subsequent interaction with the organic-fouled
membrane. The interaction between foulant and membrane includes chemical and
physical interaction. Chemical interaction normally causes irreversible fouling due to

Chapter 2
23
high strength of adsorption, while physical interaction with weak adsorption results in
reversible fouling.
2.2.4.1 Extend Derjaguin-Landau-Verwey-Overbeek (XDLVO) Theory
Organic foulants are attracted to the membrane surface under physical factor such as
permeation drag and/or the chemical interaction, where the constituents could bind with
the functional groups of membrane (Brant and Childress 2002). In order to analyze the
interactions between foulant-membrane and foulant-foulant, classical Derjaguin-
Landau-Verwey-Overbeek (DLVO) theory has been used, where the total interaction
energy is the sum of the van der Waals (VDW) interaction and the electrical double
layer (EDL) interaction (Brant and Childress 2002). The VDW interaction is not
affected by the solution chemistry, while the EDL interaction can be strongly affected
by the solution chemistry. This explained why the diameter of the organic compounds
becomes larger in the presence of Ca2+ and Mg2+ (Jin, Huang et al. 2009). Organic
aggregation easily happens when the absolute value of VDW force is higher than that
of EDL force. However, DLVO theory did not provide satisfactory description of the
fouling behavior. For example, the chemical and morphological heterogeneity of the
membrane surface may lead to different energy distributions on surface. In addition,
surface tension was excluded in classical DLVO theory (Bhattacharjee, Sharma et al.
1996, Meagher, Klauber et al. 1996, Brant and Childress 2002). Therefore, an extended
DLVO (XDLVO) theory was developed by van Oss (van Oss 1993), which included an
additional interaction energy named Lewis short-ranged acid-base (AB) interaction
between two surfaces immersed in a polar solvent (water). AB interaction can be simply
affected by the hydrophobicity of immersed colloids. For example, hydrophobic
colloids in water can aggregate faster because of evacuation of water from each colloid.
Many studies have demonstrated that XDLVO theory was more reasonable to describe
the interactions between foulant and membrane (Brant and Childress 2002, Lin, Lu et
Chapter 2
24
al. 2014). For example, AB interaction was identified as the key factor that governed
the organic fouling in seawater condition; it was concluded that initial fouling rate, i.e.,
flux decline, was controlled by the alginate-membrane adhesive free energy while
lateral fouling rate was governed by the alginate-alginate adhesive free energy after the
RO membrane surface was covered by alginate foulant (Jin, Huang et al. 2009). In
another study, it was highlighted that BSA fouling was more severe due to BSA-BSA
interaction rather than BSA-membrane interaction (Mo, Tay et al. 2008).
In XDLVO theory, the total interaction energy ΔGTOT between solid materials can be
determined by including the Lifshitz-van der Waals (LW) interaction ΔGLW,
electrostatic double layer (EDL) interaction ΔGEL, and Lewis acid-base (AB)
interaction ΔGAB, which can be expressed as follow (van Oss 1993, Van Oss 2006):
ΔGTOT = ΔGLW + ΔGEL + ΔGAB Equation (2-4)
To obtain the surface tension parameters of the solid materials, contact angle
measurements were carried out. The extended Young’s equation was used to calculate
the γSTU, γSO and γS5 for the solid materials, which can be written as follow:
(1 + cosθ)γ\2]2 = 2 _`γSTUγ\
TU +aγSOγ\5 +aγS5γ\
Ob Equation (2-5)
Where θ is the contact angle, γLW, γ+, and γ- are the Liftshitz-van der Waals component,
electron acceptor and electron donor, respectively. The subscript of s and l represents
solid materials and probe liquids.
Cohesion energy is the energy between two same solid surfaces, such as foulant-foulant
interaction, while adhesion energy is the energy between two different solid surfaces,
Chapter 2
25
i.e., such as foulant-membrane interaction. When the gap between two solid surfaces is
close to the minimum equilibrium cut-off distance ( i.e., the value reaches to 0.158 nm),
the cohesion and adhesion energy can be expressed as (Meinders, Van der Mei et al.
1995, Van Oss, Docoslis et al. 1999):
ΔGefTU = 2g`γ\TU − aγ:TUi gaγjTU − `γ\
TUi Equation (2-6)
ΔGef0k = 2aγ\Ol√γ:5 + aγj5 − aγ\
5n + 2aγ\5laγ:O + aγjO − aγ\
On − 2laγ:O γj5 + aγ:5 γjOn Equation (2-7)
Where the subscript of m and c correspond to membrane and organic foulant,
respectively.
The EL interaction energy can be calculated by the following equation:
∆GefoT =pqprst(ζ:t + ζjt) × g1 − coth(κy) +
tz1z{z1| Oz{|
csch(κy)i Equation (2-8)
Where Ɛ0Ɛr is the dielectric permittivity of the fluid (i.e. Ɛ0 = 8.85419x10⁻¹², Ɛr = 78,
respectively), ζm and ζc are the surface potentials of the membrane and organic foulant
which were determined by zeta potential measurements, respectively. κ is the inverse
Debye screening length which was determined using following equation:
κ = `}| ∑�ÄÅÄ
|
pqprH2 Equation (2-9)
Where e is the electron charge, ni is the number of ions, zi is the valence of ions, k is
the Boltzmann’s constant and T is the absolute temperature.
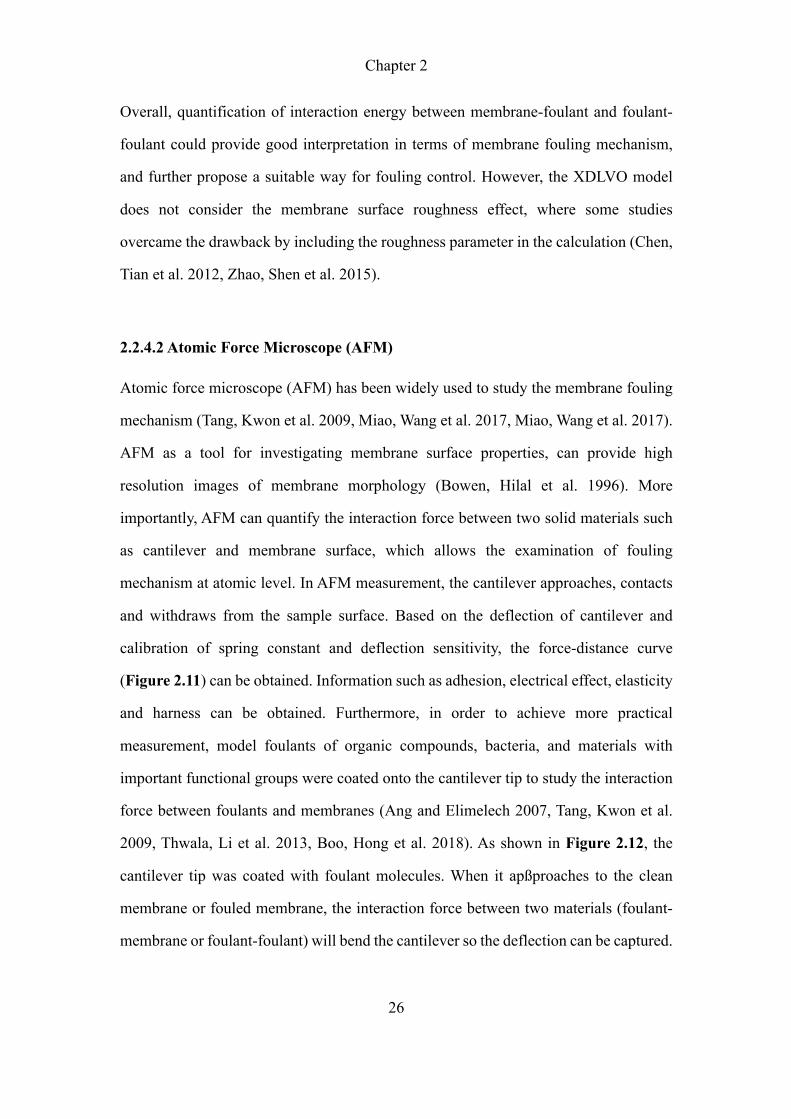
Chapter 2
26
Overall, quantification of interaction energy between membrane-foulant and foulant-
foulant could provide good interpretation in terms of membrane fouling mechanism,
and further propose a suitable way for fouling control. However, the XDLVO model
does not consider the membrane surface roughness effect, where some studies
overcame the drawback by including the roughness parameter in the calculation (Chen,
Tian et al. 2012, Zhao, Shen et al. 2015).
2.2.4.2 Atomic Force Microscope (AFM)
Atomic force microscope (AFM) has been widely used to study the membrane fouling
mechanism (Tang, Kwon et al. 2009, Miao, Wang et al. 2017, Miao, Wang et al. 2017).
AFM as a tool for investigating membrane surface properties, can provide high
resolution images of membrane morphology (Bowen, Hilal et al. 1996). More
importantly, AFM can quantify the interaction force between two solid materials such
as cantilever and membrane surface, which allows the examination of fouling
mechanism at atomic level. In AFM measurement, the cantilever approaches, contacts
and withdraws from the sample surface. Based on the deflection of cantilever and
calibration of spring constant and deflection sensitivity, the force-distance curve
(Figure 2.11) can be obtained. Information such as adhesion, electrical effect, elasticity
and harness can be obtained. Furthermore, in order to achieve more practical
measurement, model foulants of organic compounds, bacteria, and materials with
important functional groups were coated onto the cantilever tip to study the interaction
force between foulants and membranes (Ang and Elimelech 2007, Tang, Kwon et al.
2009, Thwala, Li et al. 2013, Boo, Hong et al. 2018). As shown in Figure 2.12, the
cantilever tip was coated with foulant molecules. When it apßproaches to the clean
membrane or fouled membrane, the interaction force between two materials (foulant-
membrane or foulant-foulant) will bend the cantilever so the deflection can be captured.

Chapter 2
27
Figure 2.11 Standard force-distance measurement curve (Powell, Hilal et al. 2017).
Figure 2.12 (a) AFM adhesion force measurement for foulant-cleaned membrane, and (b) foulant-fouled membrane by using foulant-coated tip.
Examples of AFM application in membrane fouling studies include Tang and co-
workers (Tang, Kwon et al. 2009) discovered that flux decline was correlated to the
adhesion forces between HA and membrane; the interaction force was strongly affected
by solution chemistry, i.e., in the presence of divalent ions (Lee and Elimelech 2006)
and increase of ionic strength due to shielding effect (Lee and Elimelech 2006, Miao,
Wang et al. 2017).
Chapter 2
28
2.3 Biofouling
2.3.1 Mechanism of Biofouling
Biofouling is persistent in SWRO desalination process and is often treated as the most
serious type of fouling. Membrane biofouling is related to biological activities and
formation of biofilms on the membrane surface. Although pretreatment processes are
installed prior RO process, RO biofouling is still inevitable. This is because even with
99.9% removal of bacteria from the bulk solution, the survived bacteria can still attach,
proliferate and form biofilm on RO membranes (Flemming 1997).
The formation of biofilm on membrane surface is closely related to the availability of
organic constituents in the feed solution. In general, the mechanisms of biofilm
formation can be categorized into four successive stages: (i) the attachment of organics
onto the membrane surface, leading to the formation of a conditioning film that
facilitates the subsequent bacteria attachment; (ii) the deposition of microorganisms
onto the membrane surface; (iii) proliferation and production of exopolymeric
substances (EPS) and soluble microbial products (SMP) to form a mature biofilm; and
(iv) dispersal of biofilm, where cells and organics are released from the biofilm into the
environment (Barker and Stuckey 1999, Flemming 2011).
2.3.2 Compositions of Biofilm
Extracellular polymeric substances (EPS) have been identified as the key components
of biofilm. They are mainly made up of polysaccharides, proteins, lipids, extracellular
DNA and humic substances (Herzberg, Kang et al. 2009). EPS also increase the cell
hydrophobicity and enhance the cell adhesion onto membrane, which could result in
severe flux decline (Matin, Khan et al. 2011).

Chapter 2
29
In addition, RO biofouling could also give rise to the biofilm-enhanced osmotic
pressure effect (BEOP), similar to the CEOP effect in colloidal fouling (Herzberg and
Elimelech 2007). It was found that bacteria cells embedded in matrix of EPS (i.e.,
biofilm) has increased the hydraulic resistance and hindered the back-diffusion of salt,
thus resulting in severe flux decline or increase in TMP.
2.3.3 Biofouling Potential
Biofouling potential is usually determined by the organic amount in the feed water
which can be seen as nutrient for bacterial growth. Therefore, the bacteria growth is
quantified by various method to assess the biofouling potential. The most common and
direct methods are biodegradable dissolved organic carbon (BDOC) measurement and
assimilable organic carbon (AOC) measurement (Wang, Tao et al. 2014, Terry and
Summers 2018).
2.3.3.1 Biodegradable dissolved organic carbon (BDOC) measurement
The organic compounds in the water are mainly classified into biodegradable organic
matters (BOM), and non-biodegradable organics. The BOM in water offers energy and
carbon source for the microorganisms. Different BOM concentration could be various
based on the water types such as wastewater and seawater (Servais, Billen et al. 1987).
In addition, the BOM content can increase in some treatment processes such as
oxidation and disinfection (Hozalski, Bouwer et al. 1999, LeChevallier 2013).
Biodegradable dissolved organic carbon (BDOC) occupies the main portion in the
BOM, which accounts for 21-34% (Huck 1990). Some studies have indicated that the
use of ozone or chlorine for sterilizing the water could increase the amount of BDOC
because of the degradation of organics (van der Kooij, Hijnen et al. 1989, Hureiki,
Croué et al. 1994). It makes the organics more susceptible for the bacterial consumption.
In addition, biofouling may become more serious in such case because it is hard to
Chapter 2
30
ensure the whole process and setup are under sterilization. Once the bacteria appeared,
they consume these degradable BOM and cause severe biofouling.
BDOC measurement is based on the amount of organics consumed by bacteria over a
period of time (Terry and Summers 2018). BDOC value is obtained by subtracting the
finial concentration of the BDOC from the initial BDOC concentration. Generally, at
least 10 days are necessary to achieve the complete consumption of the BDOC, which
is quite time-consuming (Servais, Billen et al. 1987). Nowadays, for faster
measurement, assimilable organic carbon (AOC) measurement becomes more popular.
2.3.3.2 Assimilable organic carbon (AOC) measurement
Assimilable organic carbon (AOC) are those organic matters can be consumed by the
microorganisms. AOC generally occupies 0.1-9% of all DOC in water (Sim, Chong et
al. 2017), which is part of the BDOC. Its main feature is that AOC can be rapidly
consumed and evaluated by the growth of bacteria, while BDOC is calculated from the
change in organic carbon (Wang, Tao et al. 2014). Both AOC and BDOC provide
effective information for water stability. AOC is more popular because of its shorter
measurement time (Jeong, Naidu et al. 2013).
AOC measurement is quantified by adding inoculum until it reaches the stationary
phase (van der Kooij, Visser et al. 1982). The maximum bacterial growth is recorded.
There are various methods to assess the growth of bacteria, such as bioluminescence,
colony-forming units, turbidity, adenosine triphosphate (ATP), and flow cytometry
(Sim, Chong et al. 2017). Among them, flow cytometry instrument has been regarded
as the most popular tool to rapidly measure the AOC by quantifying the cell count
(Hammes and Egli 2005, Elhadidy, Van Dyke et al. 2016). The growth yield which can
be obtained by the standard calibration using acetate is needed to convert the cell count
Chapter 2
31
to AOC value as μg/L of acetate (Hammes and Egli 2005). Inoculum usually uses
identified organisms or indigenous bacteria. Study shows that indigenous bacteria are
more representative for the nature water (Elhadidy, Van Dyke et al. 2016). For example,
seawater bacteria which can stand high salinity are suitable as the inoculum in AOC
measurement for assessing seawater AOC than other inoculum which may hard to
survive in the seawater condition. AOC becomes one of the most effective method to
quantify the amount of organic carbon that can be assimilated by microorganisms in
water, and it has been considered as a useful indicator to evaluate the impact of
biofouling in many water treatment processes (van der Kooij 1992, Weinrich,
LeChevallier et al. 2016).
In recent years, AOC measurement has become necessary in many studies to evaluate
the performance of the pretreatment process such as organic removal (including AOC
removal) (Charnock and Kjønnø 2000, Jeong, Naidu et al. 2013, Jeong, Naidu et al.
2016, Weinrich, LeChevallier et al. 2016). The results suggested that biofouling can be
mitigated by the reduction of AOC value in seawater desalination pretreatment process
(Jeong, Rice et al. 2014). Therefore, AOC measurement has become an important
indicator to access the efficiency of the pretreatment process. Meanwhile, more studies
have focused on the source of AOC in seawater. Some references have found that large
amount of AOC could be produced where low molecular weight organics increased in
the presence of ozone due to breakdown of large molecules to smaller one (van der
Kooij, Hijnen et al. 1989, Hammes, Salhi et al. 2006). These studies offered more
details of the AOC content and extended a better way to prevent biofouling.
2.4 Fouling Control
As the most economic method, RO in seawater desalination process still faces the
challenge of fouling. Colloid particles easily form a cake layer on the membrane surface.
Chapter 2
32
The organic compounds can form a conditioning layer on membrane and further result
in biofouling. Scaling also occurs when the salt ions are oversaturated along the
membrane module, although less problematic.
In order to prevent fouling, pretreatment is necessarily employed prior to RO process,
which is an indispensable process to reduce the organic particles and colloids. Table
2.2 lists the information of major pretreatments in seawater desalination process.
Currently, in most pilot-scale desalination plants, sand filtration is the main used
pretreatment method to remove particles when incorporated with additional coagulants
(Potts, Ahlert et al. 1981). The results show that this strategy lowers the silt density
index (SDI) and increases the removal of turbidity and suspended solids in effluent.
However, complete removal to these particles and colloids is hardly achieved. The
stable water quality is difficult to be guaranteed (Brehant, Bonnelye et al. 2002).
Common method for biofouling control in SWRO such as chlorination of raw seawater
(i.e., disinfection) and subsequent de-chlorination by adding sodium bisulfite (SBS) to
RO feed water after the pre-treatment step (Note that RO membrane has poor tolerance
to free chlorine, i.e., the chlorine tolerance of RO is 2000 to 3000 ppm-hour exposure
with a doubling of salt passage (Bartels, Wilf et al. 2005)) is not effective as the survived
bacteria can proliferate and form mature biofilm on the RO membrane surface if
nutrient is available (Khan, Hong et al. 2015). In addition, the disadvantage of
chlorination includes the formation of harmful disinfection by-products such as
trihalomethanes, haloacetic acids, halonitromethanes, haloacetonitriles, bromates,
chlorites, iodo-acids etc. by reacting with natural organic matters, iodide and bromide
ions in seawater (Richardson 2003, Huang, Fang et al. 2005, Yang, Shang et al. 2007).

Chapter 2
33
In addition to chemical dosing, more recently, microfiltration (MF) and ultrafiltration
(UF) become attractive as the pretreatment techniques because they can
consistently/effectively remove the particles and colloids at low pressure (Jamaly,
Darwish et al. 2014). Therefore, herein, membrane-based pretreatment is highlighted.
MF and UF membranes both efficiently retain large particles and macromolecules from
water, which can produce high quality effluent and sustain high tolerance of chemical
addition. Teng et al (Teng, Hawlader et al. 2003) found that UF with pore size of 0.01
μm could produce 78 L/m2h of water, and the TMP was increased slowly, indicating
that less fouling potential for UF pretreatment process. Brehant et al (Brehant, Bonnelye
et al. 2002) summarized that better water quality can be consistently obtained using UF
pretreatment, comparing to conventional pretreatment strategies. In addition, UF
membrane can greatly reduce the turbidity in seawater due to smaller pore size and
reject over 98% of the algae and microorganisms (Ma, Zhao et al. 2007, Shon,
Vigneswaran et al. 2008). Meanwhile, Leparc et al (Leparc, Rapenne et al. 2007)
concluded that UF membrane was capable for lasting a long-term operation without
chemical cleaning.
Recently, integrated coagulant and UF membrane is more appealing to further promote
the performances of the pretreatment (Jeong, Kim et al. 2013). The addition of
coagulant improves the performance of the UF membrane owing to the controlled UF
fouling. However, overdosing of the coagulants may cause more severe RO fouling
because of the addition of mineral salt. In addition, scaling also occurred easily in the
bulk or on the membrane surface when the undesired salts and hardness ions
oversaturated along the membrane module with the increase of the recovery and CP
(Song, Gao et al. 2013). Moreover, the addition of anti-scalant (e.g. phosphate) is also
prone to induce biofouling (Weinrich, Haas et al. 2013). Additionally, biopolymers and
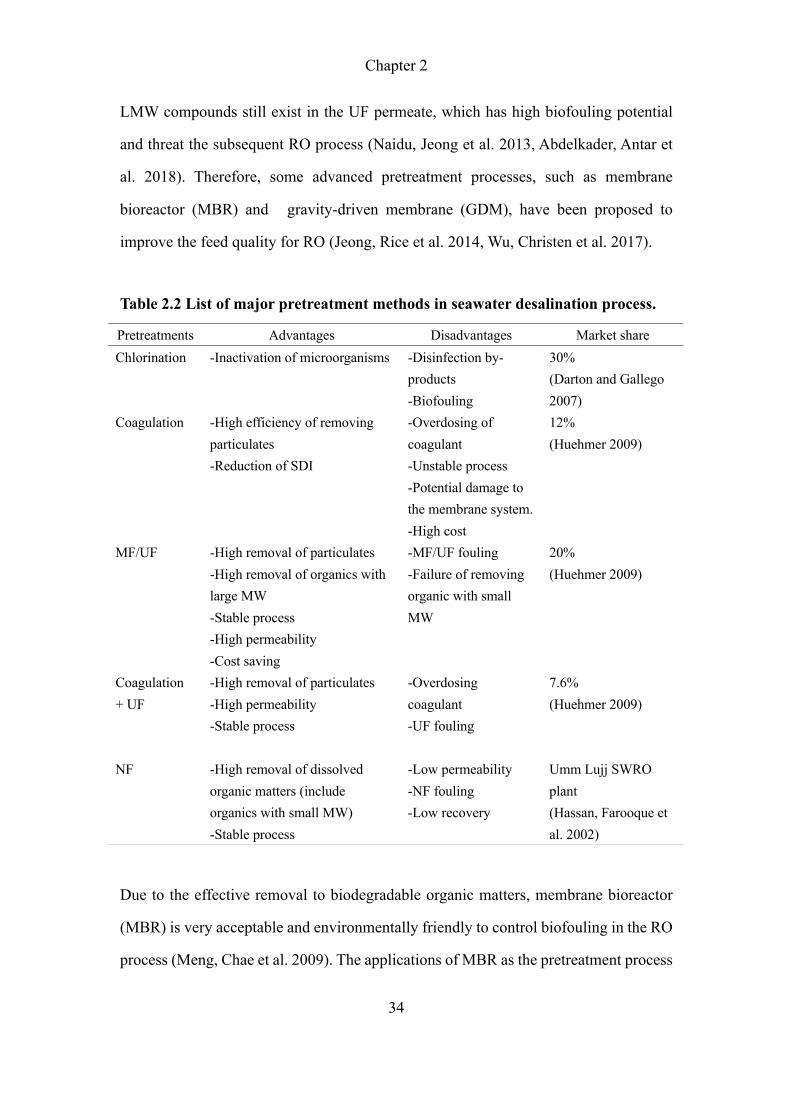
Chapter 2
34
LMW compounds still exist in the UF permeate, which has high biofouling potential
and threat the subsequent RO process (Naidu, Jeong et al. 2013, Abdelkader, Antar et
al. 2018). Therefore, some advanced pretreatment processes, such as membrane
bioreactor (MBR) and gravity-driven membrane (GDM), have been proposed to
improve the feed quality for RO (Jeong, Rice et al. 2014, Wu, Christen et al. 2017).
Table 2.2 List of major pretreatment methods in seawater desalination process.
Due to the effective removal to biodegradable organic matters, membrane bioreactor
(MBR) is very acceptable and environmentally friendly to control biofouling in the RO
process (Meng, Chae et al. 2009). The applications of MBR as the pretreatment process
Pretreatments Advantages Disadvantages Market share Chlorination -Inactivation of microorganisms -Disinfection by-
products -Biofouling
30% (Darton and Gallego 2007)
Coagulation -High efficiency of removing particulates -Reduction of SDI
-Overdosing of coagulant -Unstable process -Potential damage to the membrane system. -High cost
12% (Huehmer 2009)
MF/UF -High removal of particulates -High removal of organics with large MW -Stable process -High permeability -Cost saving
-MF/UF fouling -Failure of removing organic with small MW
20% (Huehmer 2009)
Coagulation + UF
-High removal of particulates -High permeability -Stable process
-Overdosing coagulant -UF fouling
7.6% (Huehmer 2009)
NF -High removal of dissolved organic matters (include organics with small MW) -Stable process
-Low permeability -NF fouling -Low recovery
Umm Lujj SWRO plant (Hassan, Farooque et al. 2002)

Chapter 2
35
before RO have been widely reported(Achilli, Cath et al. 2009, Kitade, Wu et al. 2013).
For example, Jeong’s group (Jeong, Naidu et al. 2013) has used MBR to pretreat
seawater, where powder activated carbon (PAC) was applied to absorb organics and
bacteria. Results shows that this pretreatment successfully improved the RO recovery
and extended the RO lifetime. Meanwhile, less foulant was observed on RO membrane
surface, indicating is the well sustainable. Similar findings were also confirmed in other
studies (Jeong, Rice et al. 2014). In addition to MBR, gravity-driven membrane (GDM)
has also been successfully applied in the seawater pretreatment (Wu, Christen et al.
2017, Lee, Suwarno et al. 2019). Compared to MF/UF pretreatment, GDM is gravity-
drive process, where there is zero energy consumption from the pump. In addition, high
water quality can be obtained from the permeate of GDM because it is regarded as a
bioreactor on the membrane surface, where the organic matter can be continuously
consumed by the biofilm (Akhondi, Wu et al. 2015).
Nanofiltration (NF) membrane which has high rejection of the organic matter and the
divalent ions has also been employed as an alternative pretreatment technique in SWRO
process (Zhou, Zhu et al. 2015). Hassan et al. (Hassan, Al-Sofi et al. 1998) and
Uhilinger (Uhlinger 2001) have proposed the low-cost NF+RO process, which showed
the rejection of total dissolved salt (TDS) was over 90% at the pressure of 22 bar. In
addition, the cost saved up to 27% compared with the single-stage SWRO. Fouling
reduction in RO process was observed due to the high-quality feed from NF. A pilot
study in Umm LUjj desalination plant showed that TDS of permeate achieved to 200
mg/L using NF as pretreatment, and water recovery increased to 56% in RO process
where energy consumption was reduced 38% in comparison of conventional SWRO
process (Hassan, Farooque et al. 2002). The advantage of NF pretreatment using in
seawater desalination in terms of high water recovery and energy saving was also
presented in other studies, demonstrating that NF can be considered as an advancement
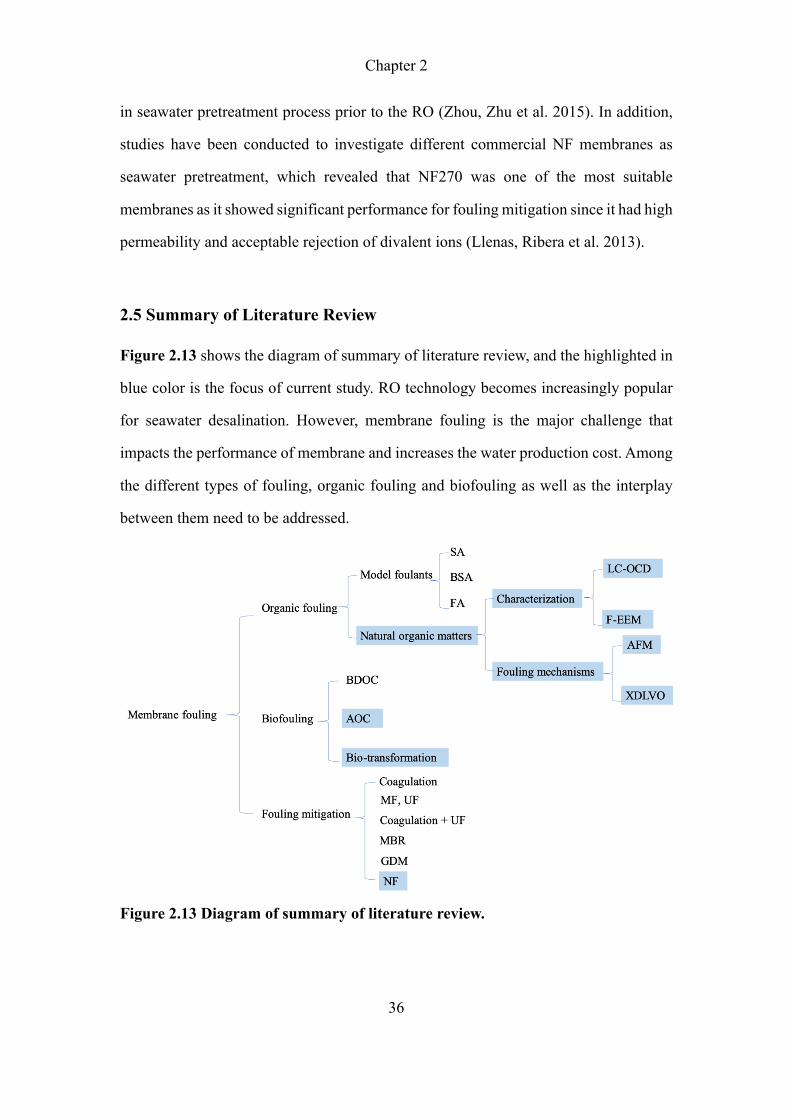
Chapter 2
36
in seawater pretreatment process prior to the RO (Zhou, Zhu et al. 2015). In addition,
studies have been conducted to investigate different commercial NF membranes as
seawater pretreatment, which revealed that NF270 was one of the most suitable
membranes as it showed significant performance for fouling mitigation since it had high
permeability and acceptable rejection of divalent ions (Llenas, Ribera et al. 2013).
2.5 Summary of Literature Review
Figure 2.13 shows the diagram of summary of literature review, and the highlighted in
blue color is the focus of current study. RO technology becomes increasingly popular
for seawater desalination. However, membrane fouling is the major challenge that
impacts the performance of membrane and increases the water production cost. Among
the different types of fouling, organic fouling and biofouling as well as the interplay
between them need to be addressed.
Figure 2.13 Diagram of summary of literature review.
Chapter 2
37
With regard to organic matters, model foulants such as alginate, bovine serum albumin,
humic acid, etc. have been widely used to represent the natural organic compounds in
order to simplify the actual organic fouling process. In recent years, advanced analytical
tools such as LC-OCD, UV254, and F-EEM were applied to characterize the organic
constituents in various water samples as well as foulants on membrane in order to
identify the critical components that could be responsible for the RO fouling. In addition,
the foulant-clean membrane and foulant-fouled membrane interactions were analysed
by the XDLVO theory and AFM measurement to provide an understanding of the
fouling mechanism.
Biofouling is generally recognized as the most persistence problem for RO operation.
RO biofouling is associated with the formation of biofilm on the membrane surface.
The organic compounds in water can form a conditioning layer (i.e., organic fouling)
that facilitate the attachment of bacteria, and serve as the nutrient source for bacteria to
proliferate that subsequently form a mature biofilm on the membrane surface. The
exopolymer substances have been identified as the key component of a biofilm from
the membrane autopsies. As a consequence of biofilm formation, an increase in
hydraulic resistance and biofilm-enhanced osmotic pressure effect result in a drastic
decline in flux or rapid rise in trans-membrane pressure. Furthermore, the assimilable
organic carbon (AOC) was developed as an indicator of the biofouling potential of
water samples.
In addition, the common pretreatment methods for seawater desalination process
include coagulation/flocculation, ultrafiltration and combination of both. However,
most of the dissolved organic matters in seawater are not successfully captured, thus
the RO feed water still have high biofouling potential. Emerging technologies such as
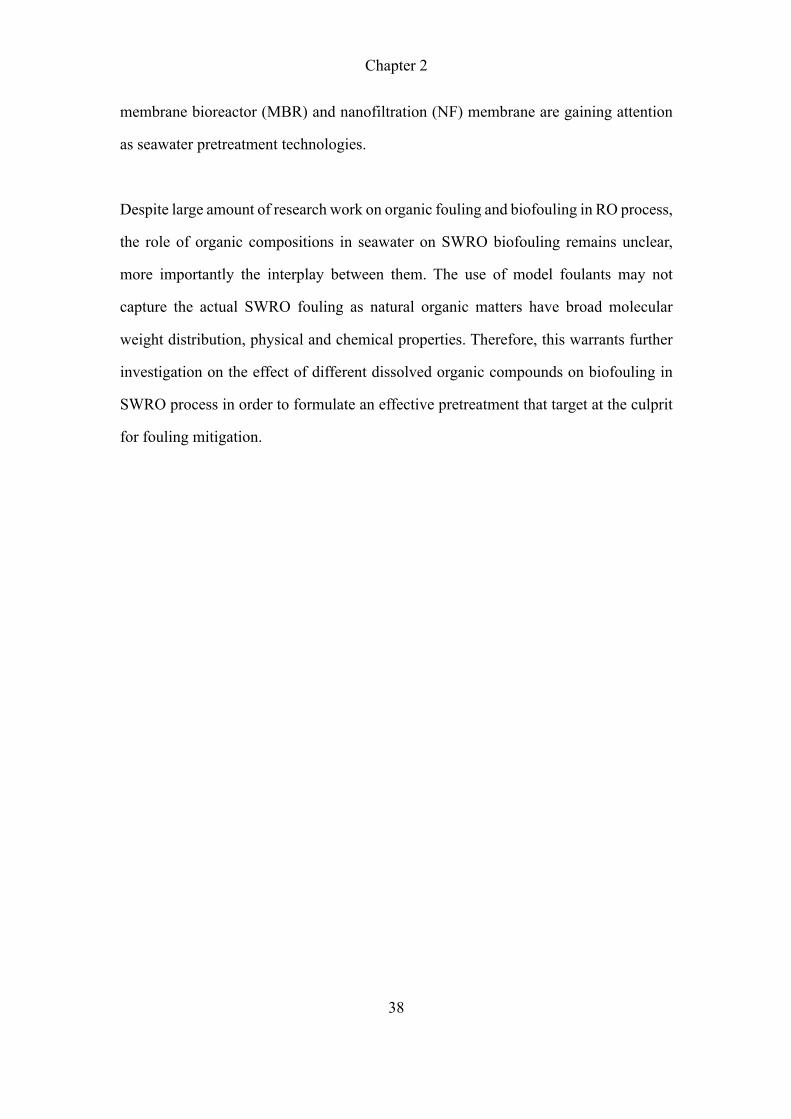
Chapter 2
38
membrane bioreactor (MBR) and nanofiltration (NF) membrane are gaining attention
as seawater pretreatment technologies.
Despite large amount of research work on organic fouling and biofouling in RO process,
the role of organic compositions in seawater on SWRO biofouling remains unclear,
more importantly the interplay between them. The use of model foulants may not
capture the actual SWRO fouling as natural organic matters have broad molecular
weight distribution, physical and chemical properties. Therefore, this warrants further
investigation on the effect of different dissolved organic compounds on biofouling in
SWRO process in order to formulate an effective pretreatment that target at the culprit
for fouling mitigation.
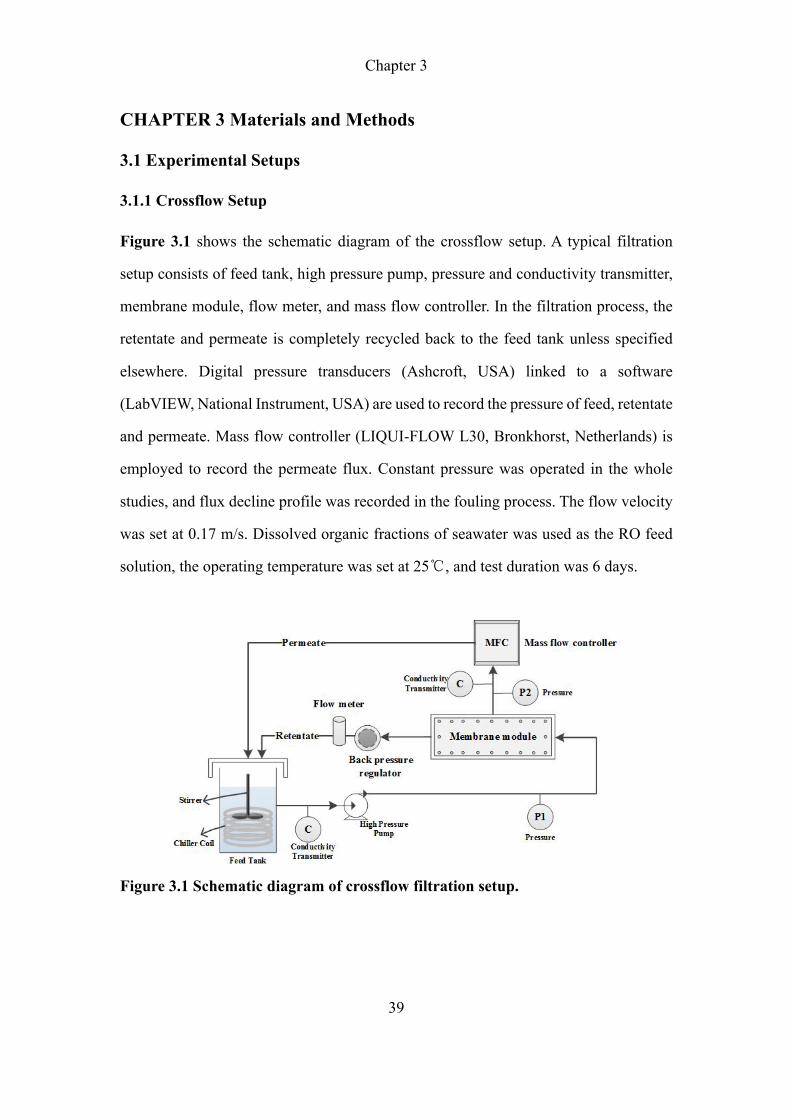
Chapter 3
39
CHAPTER 3 Materials and Methods
3.1 Experimental Setups
3.1.1 Crossflow Setup
Figure 3.1 shows the schematic diagram of the crossflow setup. A typical filtration
setup consists of feed tank, high pressure pump, pressure and conductivity transmitter,
membrane module, flow meter, and mass flow controller. In the filtration process, the
retentate and permeate is completely recycled back to the feed tank unless specified
elsewhere. Digital pressure transducers (Ashcroft, USA) linked to a software
(LabVIEW, National Instrument, USA) are used to record the pressure of feed, retentate
and permeate. Mass flow controller (LIQUI-FLOW L30, Bronkhorst, Netherlands) is
employed to record the permeate flux. Constant pressure was operated in the whole
studies, and flux decline profile was recorded in the fouling process. The flow velocity
was set at 0.17 m/s. Dissolved organic fractions of seawater was used as the RO feed
solution, the operating temperature was set at 25�, and test duration was 6 days.
Figure 3.1 Schematic diagram of crossflow filtration setup.

Chapter 3
40
Two types of membrane modules were used, i.e., module for flat sheet membrane and
module for spiral wound membrane. In flat sheet membrane, two different size of flat
sheet cells were selected, i.e., one was with area of 0.0186 m2, and another was with
area of 0.0045 m2. Module with larger membrane area was to obtain higher volume of
permeate, while module with smaller membrane area was to achieve stronger fouling
phenomenon that can be observed in a short time.
In order to increase the efficiency of obtaining high permeate volume, spiral wound
membrane element was applied with larger membrane area (2.4 m2). The structure of
the spiral wound membrane has been discussed in the Section 2.1.2.
3.1.2 Dead-end Setup
Figure 3.2 shows the schematic diagram of the dead-end filtration setup which consists
of 1 L feed vessel and 200 ml membrane cell. The dead-end RO cell with an active
membrane area of 0.002826 m2 can operate under constant pressure provided by the
compressed nitrogen gas. The permeate is collected in a beaker on a weighing balance
which is connected to a computer for data acquisition using LabView software. The
changing weight is recorded every 30s and can be converted to volume (liter) and flux
(L/m2h). Dissolved organic fractions of seawater and model foulants such as SA, BSA,
and HA were used as the feed solution, the operating temperature was set at 25�, and
the test duration was 6 hours.
Chapter 3
41
Figure 3.2 Schematic diagram of dead-end filtration setup.
3.2 Membranes
3.2.1 Microfiltration (MF) membrane
Microfiltration (MF) membrane (KAREI Filtration, Japan) with pore size of 0.2 μm
was to remove the suspended particles and bacteria during the filtration process.
3.2.2 Ultrafiltration (UF) Membrane
Commercial UF membranes were employed in this thesis. Two different flat sheet
membranes were used which were GH (GE Osmonics Inc. USA) with molecular weight
cut-off (MWCO) of 2kDa and XT (Synder Filtration, USA) with MWCO of 1kDa. In
addition, one spiral wound UF membrane of XT (Synder Filtration, USA) with MWCO
of 1kDa was also applied.
One hollow fiber UF membrane was employed to pretreat the seawater. The outside-to-
inside hollow fiber UF membrane (outer diameter: 1.2 mm, effective length: 26 cm)
was purchased from Toray company with MWCO of 150kDa. The UF module
contained 18 hollow fibers with an effective area of 0.0186 m2.
Chapter 3
42
3.2.3 Nanofiltration (NF) Membrane
Commercial flat sheet NF membranes used in this thesis were NFG (Synder Filtration,
USA), XN45 (GE Osmonics Inc.USA), NFW (Synder Filtration, USA), NF 270 (DOW,
USA) and NF 90 (DOW, USA), respectively. In addition, one spiral wound NF
membrane of NFW (Synder Filtration, USA) with MWCO of 0.3-0.5kDa was also
applied.
Two in-house fabricated low-pressure hollow fiber NF membranes (i.e., NF1 and NF2)
were used for seawater pretreatment process. The detailed fabrication procedure was
summarized in the previous study (Liu, Shi et al. 2015). Briefly, hollow fiber NF
membranes were fabricated by layer-by-layer (LBL) deposition with the introduction
of the polyelectrolyte solution of poly (allylamine hydrochloride) (PAH, Sigma Aldrich)
and poly (styrenesulfonic acid) sodium salt (PSS, Alfa Aesar) with sodium chloride
(NaCl, Merck) and glutaraldehyde (GA, Sigma Aldrich) solution as the crosslinker
throughout the lumen side. In this study, two types of LBL membranes (i.e.,
PSS+PAH+PSS+GA, and PSS+PAH+PSS+PAH+GA) were termed as NF1 and NF2
membrane. Each hollow fiber NF module consisted of 15 hollow fibers (inner diameter
0.75 mm, effective length: 26 cm) with an effective area of approximately 0.0093 m2.
In the pretreatment experiment, two NF modules were employed in parallel to achieve
an effective area of 0.0186 m2.
3.2.4 Reverse Osmosis (RO) Membrane
The RO membrane used in this thesis was commercial SW-30HR which was purchased
from Dow Filmtec. Membranes were flushed with deionized (DI) water (Millipore,
USA) for 1 min and soaked in DI water for 24 hours prior to use.
Chapter 3
43
3.3 Sample Preparation
3.3.1 Raw Seawater
The seawater sample was collected from a R&D site next to a seawater reverse osmosis
(SWRO) desalination plant in Singapore. As seawater was chlorinated before it was
delivered to the collection tank, de-chlorination of the seawater by using adequate
sodium bisulfite concentration (Acros Organics, USA) was performed. De-chlorinated
seawater was stored at 4℃ in the cold room and used within one week. The organic
compositions of seawater were analysed by LC-OCD and F-EEM, and the detailed
procedure are presented in Section 3.4.1 and Section 3.4.2, respectively.
3.3.2 Synthetic Seawater
Synthetic seawater composed of 8g Na2SO4 (Merck, USA), 2.22g CaCl2 (Merck, USA),
22g MgCl2·6H2O (Merck, USA), and 47.86g NaCl (Merck, USA) in 2L of DI water.
The synthetic seawater was autoclaved prior to use.
3.3.3 Model Organic Solutions
Sodium alginate (SA), bovine serum albumin (BSA) and humic acid (HA) (all
purchased from Sigma Aldrich), which represented polysaccharides, proteins and
humic substances, respectively, were applied in this thesis. The concentrations of test
solutions were adjusted to certain concentration by mixing certain amount of organic
with DI water, with ionic concentrations equivalent to seawater (i.e., Na+, Ca2+, Mg2+),
which was confirmed by TOC (TOC-VCSH, Shimadzu, Japan), liquid
chromatography-organic carbon detector (LC-OCD Model 8, DOC-LABOR, Germany)
and inductively coupled plasma optical emission spectrometry (ICP-OES, Optima 8000,
Perkin Elmer, USA) measurements, respectively.
Chapter 3
44
3.3.4 Bacterial Stock Solution
Vibrio sp. B2, which was isolated from a fouled SWRO membrane in previous work
(Kim and Chong 2017), was selected as the model bacterium to study the organic
transformation during bacteria growth in isolated dissolved organic fractions. The
inoculum was prepared as following: the bacteria was first cultured in two Erlenmeyer
flasks with 200 mL marine broth solution (37.4 g/L, BD) and incubated with shaking at
180 rpm and 37℃ for 24 h. The bacteria free from marine broth was harvested by (i)
centrifugation at 4000 rpm for 20 mins at room temperature, (ii) the supernatant was
discarded, (iii) the pellets were washed with 0.85% NaCl solution; the above procedure
was repeated 3 times, followed by centrifugation at 4000 rpm for 10 mins at room
temperature. Subsequently, the bacteria was re-suspended into NaCl solution (35 g/L,
Merck) to achieve an optical density OD600nm of 0.1 (Shimadzu, model UV1800).
3.4 Analytical Methods
3.4.1 Liquid Chromatography-Organic Carbon Detector (LC-OCD)
Liquid chromatography-organic carbon detector (LC-OCD Model 8, DOC-LABOR,
Germany) was employed to quantify the organic distribution based on the molecular
weight (MW) in the seawater and the permeates. The organic compound was isolated
into major fractions though size exclusion column (SEC). The organic fractions are
categorized into biopolymers (BP, MW: >20kDa), humic substances (HS, MW:
~1000Da), building blocks (BB, MW: 300-500Da), low molecular weight acids (LMW-
A, MW: <350Da), and neutrals (LMW-N, MW: <350Da) (Huber, Balz et al. 2011).
Each water sample was pre-filtered through a 0.45 μm syringe filter prior to analysis.
Quantification of the LC-OCD results were done using a customized software program
(ChromCALC, DOC-LABOR, Karlsruhe, Germany).
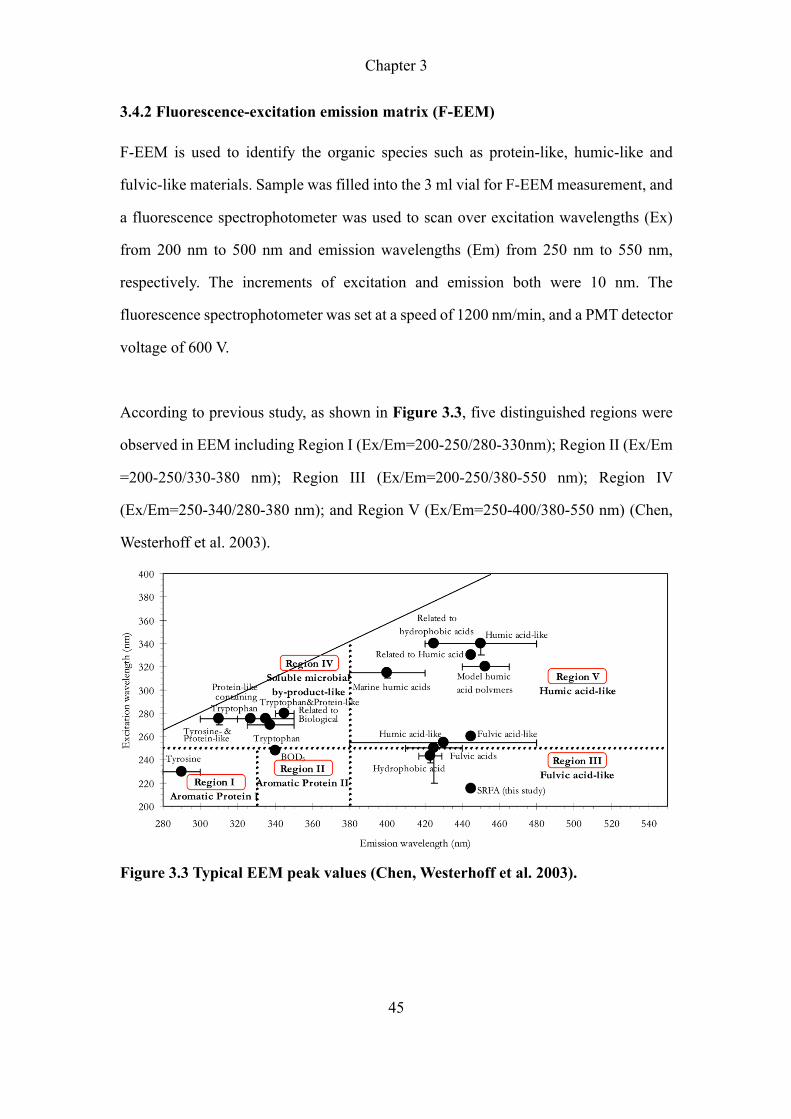
Chapter 3
45
3.4.2 Fluorescence-excitation emission matrix (F-EEM)
F-EEM is used to identify the organic species such as protein-like, humic-like and
fulvic-like materials. Sample was filled into the 3 ml vial for F-EEM measurement, and
a fluorescence spectrophotometer was used to scan over excitation wavelengths (Ex)
from 200 nm to 500 nm and emission wavelengths (Em) from 250 nm to 550 nm,
respectively. The increments of excitation and emission both were 10 nm. The
fluorescence spectrophotometer was set at a speed of 1200 nm/min, and a PMT detector
voltage of 600 V.
According to previous study, as shown in Figure 3.3, five distinguished regions were
observed in EEM including Region I (Ex/Em=200-250/280-330nm); Region II (Ex/Em
=200-250/330-380 nm); Region III (Ex/Em=200-250/380-550 nm); Region IV
(Ex/Em=250-340/280-380 nm); and Region V (Ex/Em=250-400/380-550 nm) (Chen,
Westerhoff et al. 2003).
Figure 3.3 Typical EEM peak values (Chen, Westerhoff et al. 2003).
Chapter 3
46
3.4.3 Exopolymeric Substances (EPS) Measurement
The exopolymeric substances (EPS) in foulant solution which consists of
polysaccharide and protein was quantified using the method described in previous study
(Suwarno, Chen et al. 2012). In brief, for the measurement of polysaccharide content,
sample solution (2 mL) was added into a mixture of 1 mL 5% (w/v) phenol solution
and 5 mL of H2SO4, and the solution was left to cool to room temperature. The UV-vis
absorbance of the solution was measured using a UV spectrometer at 490 nm (UV-1800,
SHIMADZU, Japan). Glucose (Merck, USA) was used as the calibration standard for
this measurement. The protein concentration was measured using the Bicinchoninic
Acid (BCA) Assay Kit (Pierce, product #23225). Sample solution (1 mL) was mixed
with the working reagent (2 mL) and incubated in darkness for 2 h at room temperature.
The solution was further measured at an absorbance of 562 nm by using UV
spectrometer. Bovine serum albumin (BSA) solution was used as the standard to
calibrate the protein concentration.
3.4.4 Assimilable Organic Carbon (AOC) Measurement
Assimilable Organic Carbon (AOC) analysis was used to quantify the biofouling
potential in the sample based on the method developed by Hammes et al (Hammes,
Berney et al. 2008). All glassware and plastic caps were cleaned following a protocol
developed by Elhadidy et al. (Elhadidy, Van Dyke et al. 2016) to ensure that they were
AOC-free. Briefly, the glassware and caps were acid- and alkaline-washed by an
automated washer (Miele Professional) followed by rinsing with DI water.
Subsequently, the glassware was soaked overnight in 0.2 M HCl solution (Sigma, USA),
followed by flushing with DI water for at least 5 times to ensure that they are acid-free.
Then, the glassware was covered with aluminum foil and dried in oven at 100℃
Subsequently, dried glassware was baked in muffle furnace at 450℃ for 6 h. The plastic
caps were soaked in foil-covered beaker with 10% sodium persulfate solution (Sigma,
Chapter 3
47
USA) and then placed in 60℃ water bath for at least 1 h. Lastly, caps were washed with
DI water after soaking in sodium persulfate solution and followed by drying in oven at
100℃.
Indigenous inoculum was prepared by using raw sweater. Briefly, raw seawater (5L)
which contains large particles, was filtered through 11 μm filter paper (Whatman, Grade
1, England) using vacuum pump. Subsequently, filtered seawater was passed through a
0.2 μm nucleopore track-etch membrane (Whatman, Grade 1, England) to achieve 500
ml suspended solution in the retentate with fairly concentrated viable bacteria count.
This solution was then incubated at 30℃ with 40 rpm for 21 days to ensure that the
background AOC has been consumed completely. The cell count was measured using
flow cytometer (BD Accuri C6, USA), and this solution was used as the inoculum for
the AOC study. The sample (10 mL) was firstly filtered through a 0.22 μm PES syringe
filter (Millipore, USA) into a 40 mL AOC-free vial. Subsequently, the sample was
heated in 70℃ water bath for 30 min to ensure that the residual bacteria in the solution
was inactivated, and finally sample was allowed to cool down to room temperature.
Each syringe filter was pre-washed by filtering with 100 ml of DI water prior to use.
Prepared inoculum was injected into each vial to achieve an approximate cell count of
1×10⁴ cells/mL, which was identified as the initial cell count (Ninitial). Then, the
inoculated samples were incubated in a temperature-controlled shaker-incubator
(Model: ZQZY-70AF, Shanghai Zhichu Instrument Co., Ltd) at 30℃ with 40 rpm. Cell
count was measured using flow cytometer (BD Accuri C6, USA) every 24 h intervals,
and the highest cell count (Nfinal) was recorded in order to calculate the AOC
concentration of each sample. The sample without inoculum was prepared as negative
control (Nnegative). Prior to measurement all samples were stained with SYTO9
(Molecular Probes, USA) in the dark for 20 mins. Each AOC measurement was done
in triplicates. The equation for AOC concentration is:
Chapter 3
48
ÉÑ!((Ö − ! Ü⁄ ) = làâäãåç5àäãäéäåç5àãèêåéäëèn(
íèççìî )
ïñóòôöô$õúùöû(íèççìüêí) Equation (3-1)
The inoculum yield was evaluated by different standard concentration of sodium acetate
solution with inorganic nutrient at seawater condition (35 g/L, NaCl). The acetate
concentration of standard solution was prepared to 0 µg-C/L, 30.15 µg-C/L, 60.3 µg-
C/L, 120.6 µg-C/L, and 241.2 µg-C/L, respectively. The mineral nutrient was prepared
by mixing 306.8 mg of NH4Cl, 576 mg of KNO3, and 68.4 mg of K2HPO4 into 200mL
DI water as described in previous method (APHA 2012, Elhadidy, Van Dyke et al. 2016).
Then, the standard solution and mineral stock were filtered through 0.2 μm PES syringe
filter. Final concentration of sodium acetate solution was prepared by adding 5 µL of
filtered mineral stock to 10 mL standard solutions. Indigenous inoculum was added into
each standard solution to achieve an approximately cell count of 1×10⁴ cells/mL. There
were three replicates for each standard. Cell count was measured by flow cytometer
daily until it achieved to maximum cell count. Corrected cell growth was obtained by
counteracting the initial cell count and the value from the negative control. Lastly,
inoculum yield was calculated by plotting corrected cell growth against acetate
concentration in calibration process (as shown in Figure 3.4). In this study, the
inoculum yield was 1.1623×10⁵ cells/µg-C.
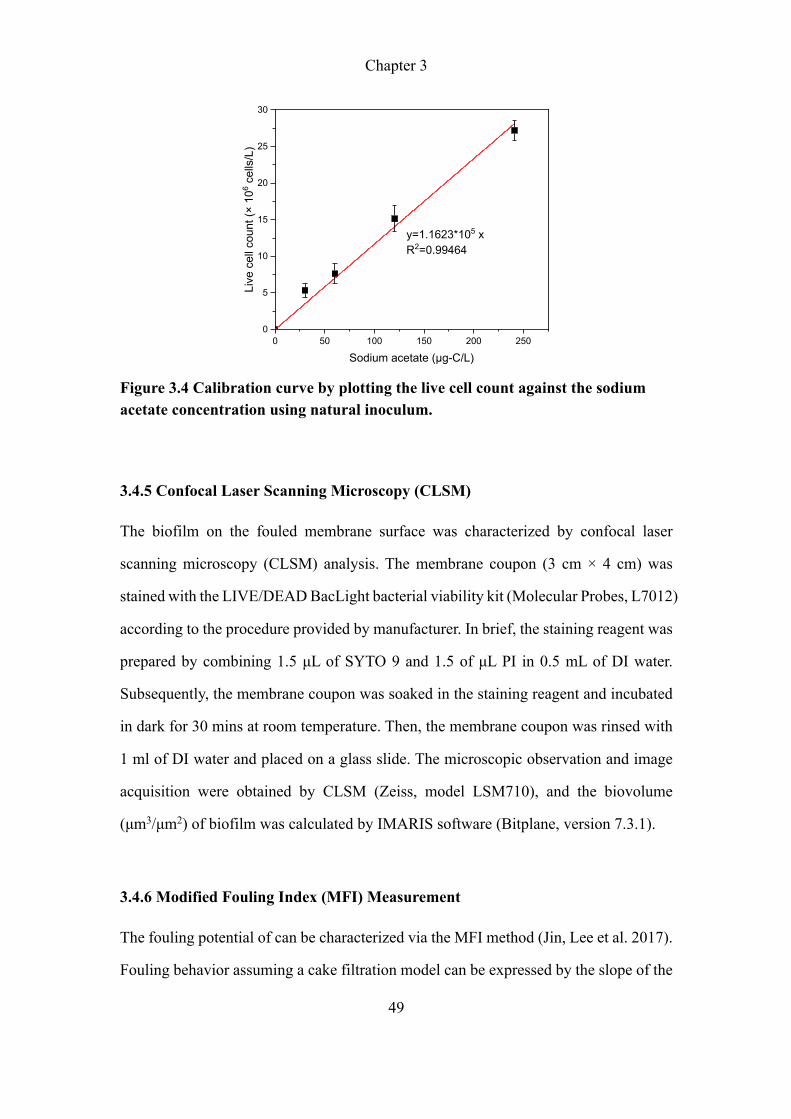
Chapter 3
49
Figure 3.4 Calibration curve by plotting the live cell count against the sodium acetate concentration using natural inoculum.
3.4.5 Confocal Laser Scanning Microscopy (CLSM)
The biofilm on the fouled membrane surface was characterized by confocal laser
scanning microscopy (CLSM) analysis. The membrane coupon (3 cm × 4 cm) was
stained with the LIVE/DEAD BacLight bacterial viability kit (Molecular Probes, L7012)
according to the procedure provided by manufacturer. In brief, the staining reagent was
prepared by combining 1.5 μL of SYTO 9 and 1.5 of μL PI in 0.5 mL of DI water.
Subsequently, the membrane coupon was soaked in the staining reagent and incubated
in dark for 30 mins at room temperature. Then, the membrane coupon was rinsed with
1 ml of DI water and placed on a glass slide. The microscopic observation and image
acquisition were obtained by CLSM (Zeiss, model LSM710), and the biovolume
(μm3/μm2) of biofilm was calculated by IMARIS software (Bitplane, version 7.3.1).
3.4.6 Modified Fouling Index (MFI) Measurement
The fouling potential of can be characterized via the MFI method (Jin, Lee et al. 2017).
Fouling behavior assuming a cake filtration model can be expressed by the slope of the
0 50 100 150 200 2500
5
10
15
20
25
30
Live
cel
l cou
nt (×
106 c
ells
/L)
Sodium acetate (μg-C/L)
y=1.1623*105 xR2=0.99464
Chapter 3
50
plot of time divided by cumulative permeate volume (t/V) versus cumulative permeate
volume (V) with a linear fitting, using following equation:
†°= ¢£§
∆•∙ß+ ï¢
t∆•∙ß|® Equation (3-1)
Where Rm is membrane resistance, Ʃ is pressure drop across filter, A is membrane
surface area, ( is sample viscosity, and ™ is a measure of the membrane fouling
potential of the sample. The term ï¢t∆•∙ß|
according to this equation can serve as an
index of the fouling tendency (i.e., MFI) when Ʃ, (, and A2 are constant value (Jin,
Lee et al. 2017).
3.4.7 Inorganic analysis
Salt concentration of the cations (i.e., Na+, Ca2+, Mg2+) and anions (i.e., Cl-, SO42-) were
analyzed by an inductively coupled plasma optical emission spectrometry (ICP-OES,
Optima 8000, Perkin Elmer, USA), and an ion chromatography system (IC, DIONEX
ICS-1000), respectively.
3.4.8 Attenuated Total Reflectance - Fourier Transform Infrared Spectrometry
(ATR-FTIR)
The functional groups of clean membrane and fouled membranes were identified by the
FTIR (Prestige-21, Shimadzu)). In addition, for the powder sample, prior to
measurement, one milligram of sample was mixed with 100 mg of potassium bromide
(KBr). Transparent and hard slice with thickness of ~0.5 mm was formed by using a
pressing tool. All the sample was measured 30 scans under a scanning range of 400-
4000 cm-1 at 1 cm-1 resolution.
Chapter 3
51
3.4.9 Atomic Force Microscopy (AFM) Measurement
The intermolecular forces between foulant-clean RO membrane and foulant-fouled
membrane were measured with an atomic force microscopy (AFM, model XE-100,
Park systems, Korea) to understand the organic fouling and biofouling behavior. A
commercial AFM cantilever (Nanoscan, USA), which was coated with SiO2 particles
(5.0 μm in diameter), with a spring constant of 0.06 N/m was applied. Herein, the
organic-coated cantilevers were prepared by soaking the tip into the solutions with
expected foulant (>5 mg-C/L) at 4℃ for 48 hours prior to use (Villacorte, Ekowati et
al. 2015). The bacteria-coated cantilever tip was prepared by soaking the tip into the
Vibrio sp. B2 stock solution with concentration of 6×10⁶ cells/mL at 4℃ for 48 hours
prior to use. The tips were first examined for the adhesion force between tip and clean
membrane surface (i.e., baseline), and then the foulant-coated probe was used to
determine foulant-membrane and foulant-foulant interaction forces. The foulant-fouled
membranes were prepared by using dead-end filtration method as shown in Section
3.1.2. An AFM fluid cell was utilized, and calibration was carried out to determine the
spring constant of the organic-coated tips. All the force-curve measurements were taken
from at least 5 different locations and tested 6 times for each point to obtain the average
results.
3.4.10 Extend Derjaguin-Landau-Verwey-Overbeek (XDLVO) Theory
According to the XDLVO theory, the interfacial free energies between solid materials
i.e., foulant-foulant and foulant-membrane, can be calculated from the surface tension-
contact angles measurements (Goniometer) and surface charge-zeta potential
measurements (SurPASS electrokinetic analyzer). In this study, the surface tension was
determined by two polar probe liquids and one non-polar probe liquid. The properties
of probe liquids used for contact angle measurements are listed in Table 3.1. The
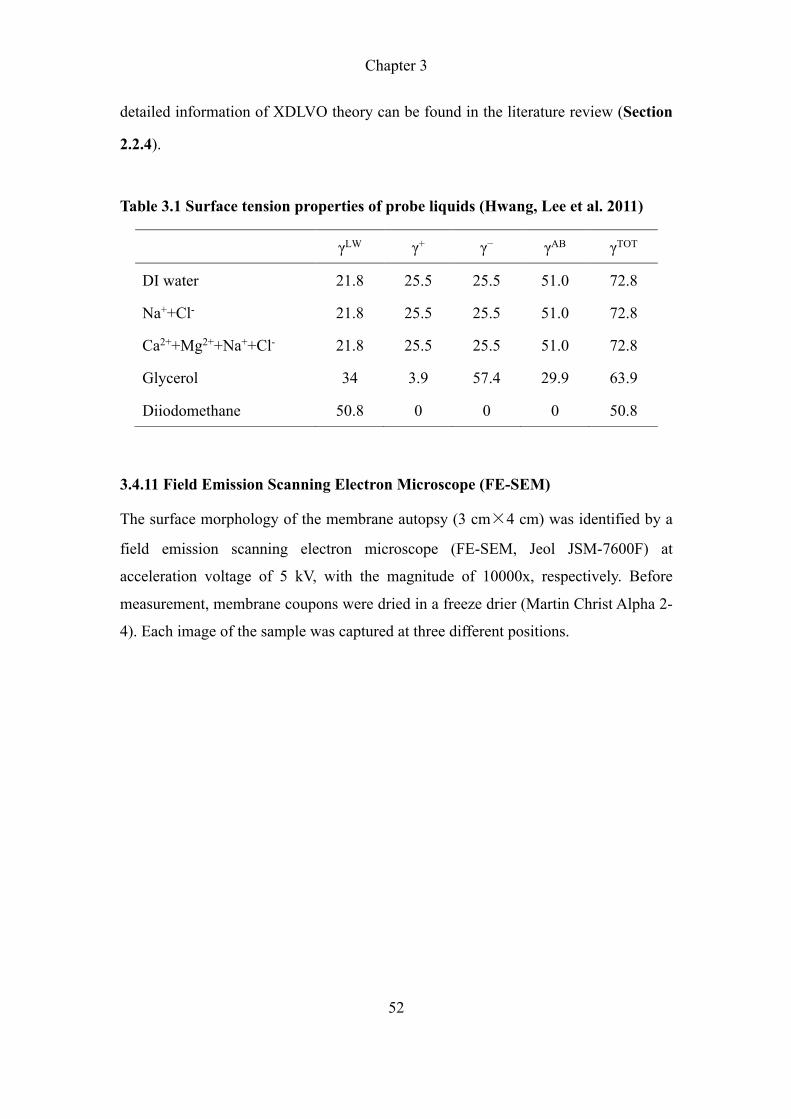
Chapter 3
52
detailed information of XDLVO theory can be found in the literature review (Section
2.2.4).
Table 3.1 Surface tension properties of probe liquids (Hwang, Lee et al. 2011)
γLW γ+ γ− γAB γTOT
DI water 21.8 25.5 25.5 51.0 72.8
Na++Cl- 21.8 25.5 25.5 51.0 72.8
Ca2++Mg2++Na++Cl- 21.8 25.5 25.5 51.0 72.8
Glycerol 34 3.9 57.4 29.9 63.9
Diiodomethane 50.8 0 0 0 50.8
3.4.11 Field Emission Scanning Electron Microscope (FE-SEM)
The surface morphology of the membrane autopsy (3 cm�4 cm) was identified by a
field emission scanning electron microscope (FE-SEM, Jeol JSM-7600F) at
acceleration voltage of 5 kV, with the magnitude of 10000x, respectively. Before
measurement, membrane coupons were dried in a freeze drier (Martin Christ Alpha 2-
4). Each image of the sample was captured at three different positions.

Chapter 4
53
CHAPTER 4 Fouling Behavior of Isolated Dissolved Organic
Fractions from Seawater in Reverse Osmosis (RO) Desalination
Process
This chapter describes the fractionation process of isolating the organic matter in
seawater based on the molecular weight. In addition, the organic fouling mechanism of
each fraction was studied. The fractionation process was well described and it could be
practically applied in other type of water such as surface water and wastewater. The
methods using AFM and XDLVO theory could also be considered as a way for fouling
prediction.
4.1 Introduction
As described in Chapter 1 & 2, smaller MW compounds (i.e., <1 kDa) which have a
high presence in seawater (Penru, Simon et al. 2013) and may cause severe RO fouling
have not been well understood since these small MW organics were not the focus in
previous studies. An understanding of the fouling behavior of these small MW
compounds in seawater is necessary. Therefore, considering the properties associated
with their MWs, in this study, the focus was on the impact on RO fouling by different
organic fractions, i.e., (i) MW: >1 kDa, (ii) MW: 350 – 1000 Da, and (iii) MW: <350
Da, in seawater isolated by membrane technique.
The atomic force microscopy (AFM) and the extended Derjaguin-Landau-Verwey-
Overbeek (XDLVO) theory have been widely used to analyze the interaction forces and
energies between foulant-membrane and foulant-foulant, which are powerful methods
for fouling mechanism exploration (Li and Elimelech 2004, Jin, Huang et al. 2009,
Tiraferri, Kang et al. 2012, Li, Li et al. 2015, Ding, Yang et al. 2016). However, little
studies were found to apply AFM method and XDLVO model to understand the RO

Chapter 4
54
fouling behavior of natural DOM in seawater (Villacorte, Ekowati et al. 2015). In
addition, seawater consists of large amount of divalent ions such as Ca2+ and Mg2+, but
the influence of divalent ions under high salinity condition on RO organic fouling still
remain elusive.
This study aimed to investigate the fouling mechanism by using isolated organic
fractions from seawater. First, DOM in seawater was fractionated into different
fractions based on their MWs using membrane technique. Then, the isolated organic
fractions and their corresponding model foulants were characterized by size exclusion
liquid chromatography and fluorescence spectroscopy, and were compared in term of
their fouling potentials. In addition, SWRO fouling of the isolated organic fractions
were performed. The interaction force and interfacial energy were examined by AFM
force-distance measurement and XDLVO theory.
4.2 Materials and Methods
4.2.1 Fractionation and Concentration of DOM in Seawater
4.2.1.1 Seawater Sample
The collection of seawater sample was described in Section 3.3.1. Total of 15 seawater
samples were collected over a 9-month period and total volume of seawater used in this
chapter was ~1200 L. The concentrations of organic compounds were quantified by
LC-OCD, duplicate measurements were made for each sample.
4.2.1.2 Membrane Characterization and Selection
Commercial UF and NF membranes were employed to isolate and concentrate the
organic constituents from seawater. The investigated membranes included UF
membranes: GH and XT; NF membranes: NFG, XN45, NFW, NF 270 and NF 90. The
Chapter 4
55
contact angles of the membranes were determined using a goniometer (model DSA25,
KRUSS GmbH, Germany). The contact angle of each sample was measured at five
random positions. The surface charge of membrane was obtained by SurPASS
electrokinetic analyzer (Anton Paar GmbH, Austria) at standard condition of 10 mM
KCl solution. A series of neutral organic solutes such as ribose (MW: 150.13 g/mol),
glucose (MW: 180.16 g/mol), sucrose (MW: 342.29 g/mol), raffinose (MW: 594.52
g/mol), and α-Cyclodextrin (MW: 972.84 g/mol) at concentration of 200 mg/L were
used to characterize the molecular weight cut offs (MWCOs) of NF membranes. A
bench-scale dead-end filtration setup was used, and the MWCO was determined from
approximate MW that was 90% rejected by the membrane (Liu, Shi et al. 2015).
The selection of UF and NF membranes for subsequent isolation process were based
on the rejection of targeted organic component. The LC-OCD was applied to detect the
distribution and concentration of targeted organic fractions in the feed and permeate. In
addition, the concentration of ionic species in seawater was measured by an ICP-OES.
Prior to measurement of the rejection properties using a dead-end filtration cell, the
membranes were compacted with DI water at 3 bar for 3 hours.
4.2.1.3 Fractionation and Concentration Protocol
The fractionation and concentration procedure of organics from seawater by the
selected membranes is illustrated in Figure 4.1. Three stages were involved: (i)
seawater was pretreated by a 0.2 μm MF membrane to remove the suspended particles,
followed by (ii) filtration through an NF membrane for separating the LMW fraction (F.
LMW, permeate) from the BP and HS&BB fractions (retentate). Discontinuous-
diafiltration was performed where DI water (i.e., ~300 L) was added to the system and
retentate was recycled until all the LMW compounds were separated, (iii) the NF
retentate which contained BP and HS&BB compounds was then filtered through an UF
Chapter 4
56
membrane for separating the BP fraction (F.BP, retentate) from the HS&BB fraction
(F.HS&BB, permeate). Similarly, discontinuous-diafiltration (i.e., ~300 L of DI water)
was performed in this step. High crossflow rate (0.39 m/s) and low flux (≤ 10 L/m2h)
were applied in the UF/NF fractionation process to minimize membrane fouling by the
organic compounds. The concentration of isolated organic fractions was conducted in
stage (ii) and (iii) simultaneously through volume reduction by discharging the
unwanted permeate. It is worth noting that due to the separation characteristics of
membranes and the dilution effect of added DI water, the concentration of ions appeared
to be different in each of the fractionated solutions. Thus, inorganic salts such as NaCl,
MgCl2·6H2O, and CaCl2 (Merck, USA) were added to adjust the concentration of ions
in F.BP and F.HS&BB to be same as the original seawater. Note that the F.LMW after
fractionation process contained high concentration of salts, no suitable NF/RO
membrane was found to be able to remove the salts, thus ED was tested to separate
LMW from salt ions.
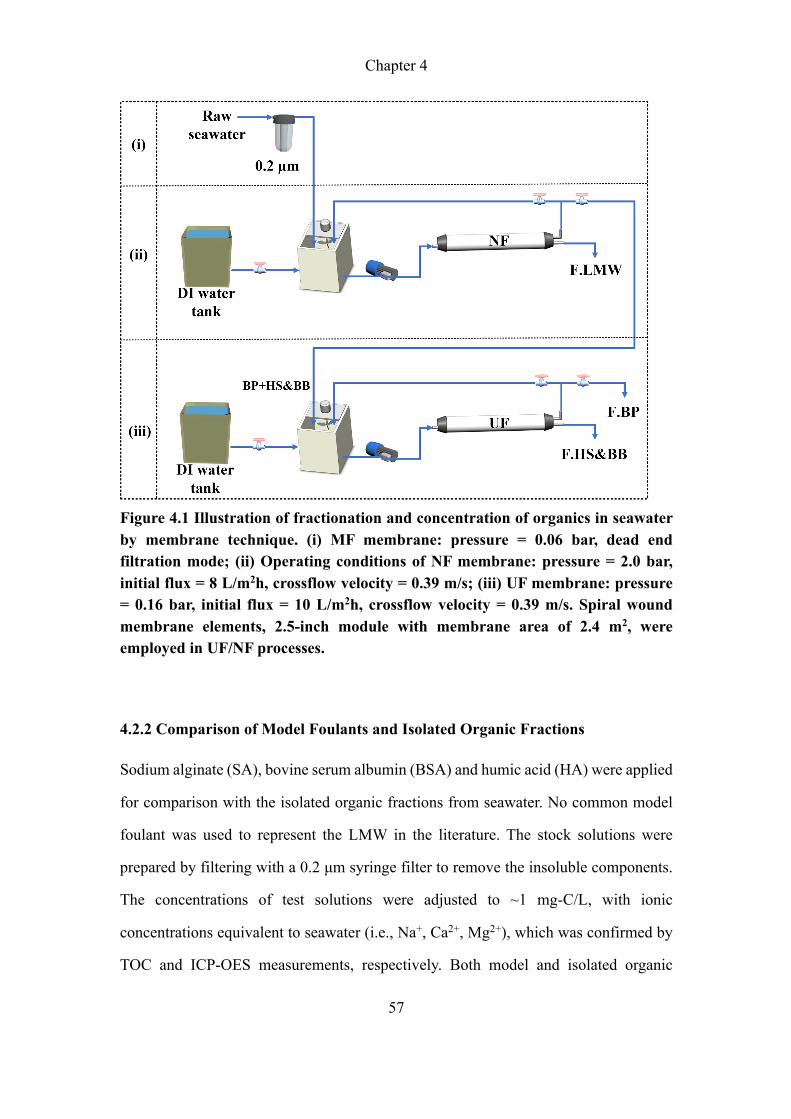
Chapter 4
57
Figure 4.1 Illustration of fractionation and concentration of organics in seawater by membrane technique. (i) MF membrane: pressure = 0.06 bar, dead end filtration mode; (ii) Operating conditions of NF membrane: pressure = 2.0 bar, initial flux = 8 L/m2h, crossflow velocity = 0.39 m/s; (iii) UF membrane: pressure = 0.16 bar, initial flux = 10 L/m2h, crossflow velocity = 0.39 m/s. Spiral wound membrane elements, 2.5-inch module with membrane area of 2.4 m2, were employed in UF/NF processes.
4.2.2 Comparison of Model Foulants and Isolated Organic Fractions
Sodium alginate (SA), bovine serum albumin (BSA) and humic acid (HA) were applied
for comparison with the isolated organic fractions from seawater. No common model
foulant was used to represent the LMW in the literature. The stock solutions were
prepared by filtering with a 0.2 μm syringe filter to remove the insoluble components.
The concentrations of test solutions were adjusted to ~1 mg-C/L, with ionic
concentrations equivalent to seawater (i.e., Na+, Ca2+, Mg2+), which was confirmed by
TOC and ICP-OES measurements, respectively. Both model and isolated organic
Chapter 4
58
solutions were analyzed by LC-OCD and F-EEM. In addition, the fouling potentials of
isolated organic fractions and their corresponding model foulants were characterized
via the Modified Fouling Index (MFI) method (Jin, Lee et al. 2017).
Here, SW-30HR RO membrane and dead-end filtration cell were used to retain all
organic compounds. The feed organic concentrations were set at 1 mg-C/L and salt
concentrations were similar to seawater. The stabilization of membrane was conducted
for 12 h at 55 bar with DI water, followed by filtration of test solution. The flux was
converted from the weight of collected permeate recorded by an electric balance
(OHAUS, USA) as described in Section 3.1.2.
4.2.3 Bench-Scale RO Fouling Study of Isolated Organic Fractions
A laboratory-scale crossflow RO filtration setup was employed for fouling experiments
as described in Section 3.1.1. A 0.2 μm cartridge filter was installed in the circulation
loop to prevent bacteria growth in the system. The initial flux was set at 0.17 m/s and
20 L/m2h, respectively. The flux decline profile was used as the fouling indicator. The
fouling process lasted for 6 days. In addition, the effects of monovalent and divalent
ions on RO organic fouling were studied. Two types of salt solution at seawater
concentrations were tested, (i) solution contained Na+ only, and (ii) solution contained
Na+, Ca2+ and Mg2+ (by adding NaCl, MgCl2·6H2O, and CaCl2).
At the end of experiment, membrane autopsy studies were performed. The foulants
were extracted from fouled membrane surface by immersing membrane coupon into 25
ml of DI water and ultrasonication for 30 min, followed by 1 min vortex. The foulant
solution was analyzed by LC-OCD. Note that only small volume of concentrated
F.LMW (15 mL, >5mg/L) was obtained via SPE method, thus no SWRO fouling test
that required large volume (~20L) was conducted for F.LMW; AOM.LMW as a
Chapter 4
59
surrogate of F.LMW was tested instead (Appendix A). An electrodialysis unit (PCCell,
GmbH, Germany) was used to remove the salt.
4.2.4 Adhesion and Cohesion Force Measurements
The intermolecular forces between isolated organic fractions and clean RO membrane
(i.e., foulant-membrane) as well as organic-fouled membrane (i.e., foulant-foulant)
were measured with an atomic force microscopy to understand the fouling behavior. A
detailed protocol was shown in Section 3.4.9. Due to the concentration of F.LMW by
membrane method would further increase the salt concentrations, herein, small volume
with high concentration of F.LMW (i.e., 15 mL, >5 mg-C/L) that was free of salt was
achieved by filtering ~5L of F.LMW through SPE cartridges (C18 Sep-Pak Vac, 6cc,
1.0g) according to the procedure in previous study (Jeong, Kim et al. 2013).
4.2.5 XDLVO Theory Analysis
A detailed procedure was summarized in Section 3.4.10. The functional groups of RO
membrane and isolated organic fractions were identified by the ATR-FTIR. Prior to
measurement, one milligram of isolated organic fraction was extracted as powder by
the SPE method and freeze dried, followed by mixing with 100 mg of potassium
bromide (KBr).
4.3 Results and Discussion
4.3.1 Performance of Fractionation and Concentration Process
4.3.1.1 Seawater Compositions
The organic and ionic concentrations of seawater are summarized in Table 4.1. The
samples (n = 15) were collected and characterized over a nine-month period. It was
found that the concentration of organics remained relatively constant; the average DOC
Chapter 4
60
was 1175.4±69.3 μg/L. In details, the concentration of HS was 495.3±72.1 μg/L, which
occupied the largest portion (42%), while the concentration of BB was 182.6±33.8 μg/L
(16%). It shall be noted that BB is the breakdown product of HS which has a lower MW
(Huber, Balz et al. 2011), and in current study, the terms HS and BB were combined as
HS&BB, which occupied 58% of total DOC. The concentration of LMW compounds
showed more obvious fluctuations (i.e., the highest reading was 504 μg/L and the lowest
reading was 223 μg/L). This could be caused by the variations of microorganisms
bioactivity in seawater which was related to organics photolysis resulting in a series of
radical and fragmentation reactions (Jeong, Naidu et al. 2016). Moreover, the oxidation
processes could also break down the organics from large MW to smaller MW (Filloux,
Gernjak et al. 2016). In contrast to wastewater or river water, BP was present at a low
concentration in seawater, thus large volume of seawater (~1200 L) was required for
the isolation process to collect sufficient amount of BP. Furthermore, high concentration
of salt (Table 4.4) may impose high osmotic pressure effect in the isolation process
with NF membrane.

Chapter 4
61
Table 4.1 Compositions of seawater in this study (n = 15)
Parameter Value
DOC (μg/L) 1175.4±69.3
HOC (μg/L) 63.2±29.1
Biopolymers (μg/L) 79.0±22.8
Humic substances (μg/L) 495.3±72.1
Building blocks (μg/L) 182.6±33.8
LMW (μg/L) 355.3±116.9
Ca2+ (mg/L) 362.1±0.9
Mg2+ (mg/L) 1252.3±8.7
Na+ (mg/L) 10600±125
Conductivity (mS/cm) 47.5±0.2
DOC: dissolved organic carbon; HOC: hydrophobic organic carbon; LMW: low
molecular weight compounds
4.3.1.2 Membrane Selection, Fractionation Performance and Mass Balance
In this study, isolated organic fractions from seawater were obtained by membrane
filtration technique. Some important technical parameters such as contact angle, surface
charge, and MWCO of the applied commercial UF and NF membranes were
summarized in Table 4.2. All the measured MWCOs of the membranes were slightly
larger than the specifications provided by the manufacturers. The information on the
standards used and methods of characterization by different suppliers were not available.
In this study, spherical and uncharged organics and uniform approach were applied for
measuring the MWCOs of different membranes, which could provide a more
comprehensive and precise information to allow comparison of different membranes.
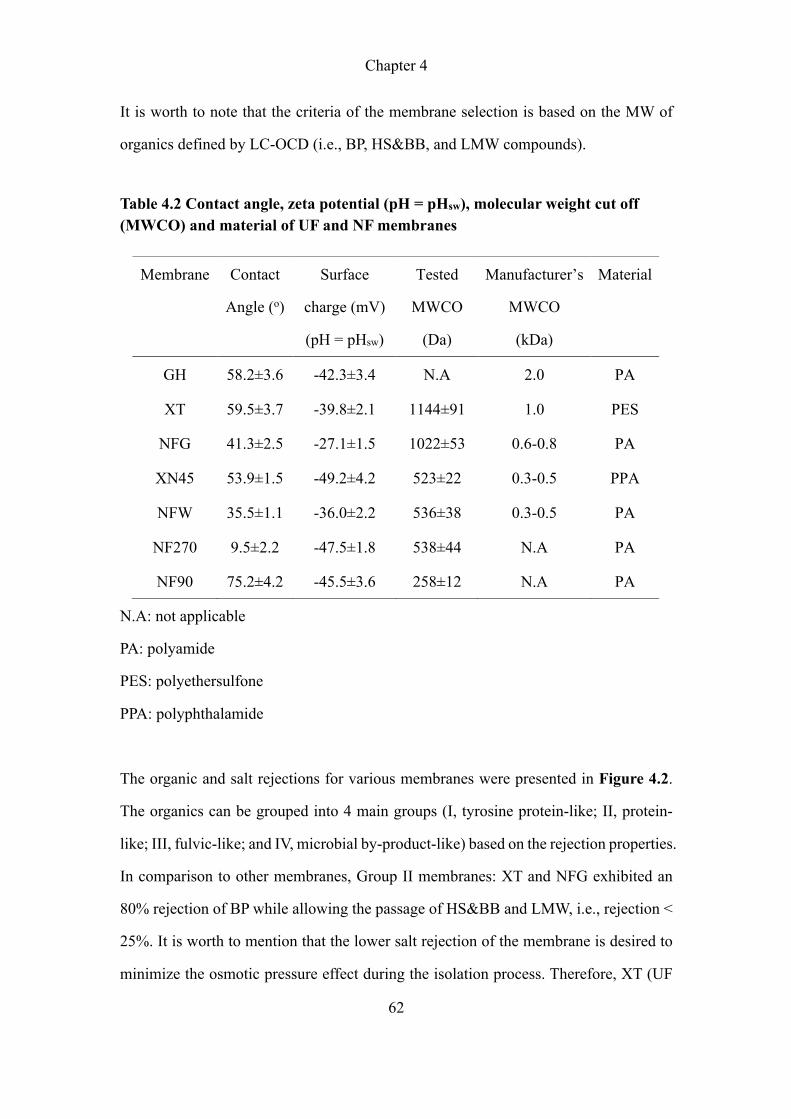
Chapter 4
62
It is worth to note that the criteria of the membrane selection is based on the MW of
organics defined by LC-OCD (i.e., BP, HS&BB, and LMW compounds).
Table 4.2 Contact angle, zeta potential (pH = pHsw), molecular weight cut off (MWCO) and material of UF and NF membranes
N.A: not applicable
PA: polyamide
PES: polyethersulfone
PPA: polyphthalamide
The organic and salt rejections for various membranes were presented in Figure 4.2.
The organics can be grouped into 4 main groups (I, tyrosine protein-like; II, protein-
like; III, fulvic-like; and IV, microbial by-product-like) based on the rejection properties.
In comparison to other membranes, Group II membranes: XT and NFG exhibited an
80% rejection of BP while allowing the passage of HS&BB and LMW, i.e., rejection <
25%. It is worth to mention that the lower salt rejection of the membrane is desired to
minimize the osmotic pressure effect during the isolation process. Therefore, XT (UF
Membrane Contact
Angle (o)
Surface
charge (mV)
(pH = pHsw)
Tested
MWCO
(Da)
Manufacturer’s
MWCO
(kDa)
Material
GH 58.2±3.6 -42.3±3.4 N.A 2.0 PA
XT 59.5±3.7 -39.8±2.1 1144±91 1.0 PES
NFG 41.3±2.5 -27.1±1.5 1022±53 0.6-0.8 PA
XN45 53.9±1.5 -49.2±4.2 523±22 0.3-0.5 PPA
NFW 35.5±1.1 -36.0±2.2 536±38 0.3-0.5 PA
NF270 9.5±2.2 -47.5±1.8 538±44 N.A PA
NF90 75.2±4.2 -45.5±3.6 258±12 N.A PA
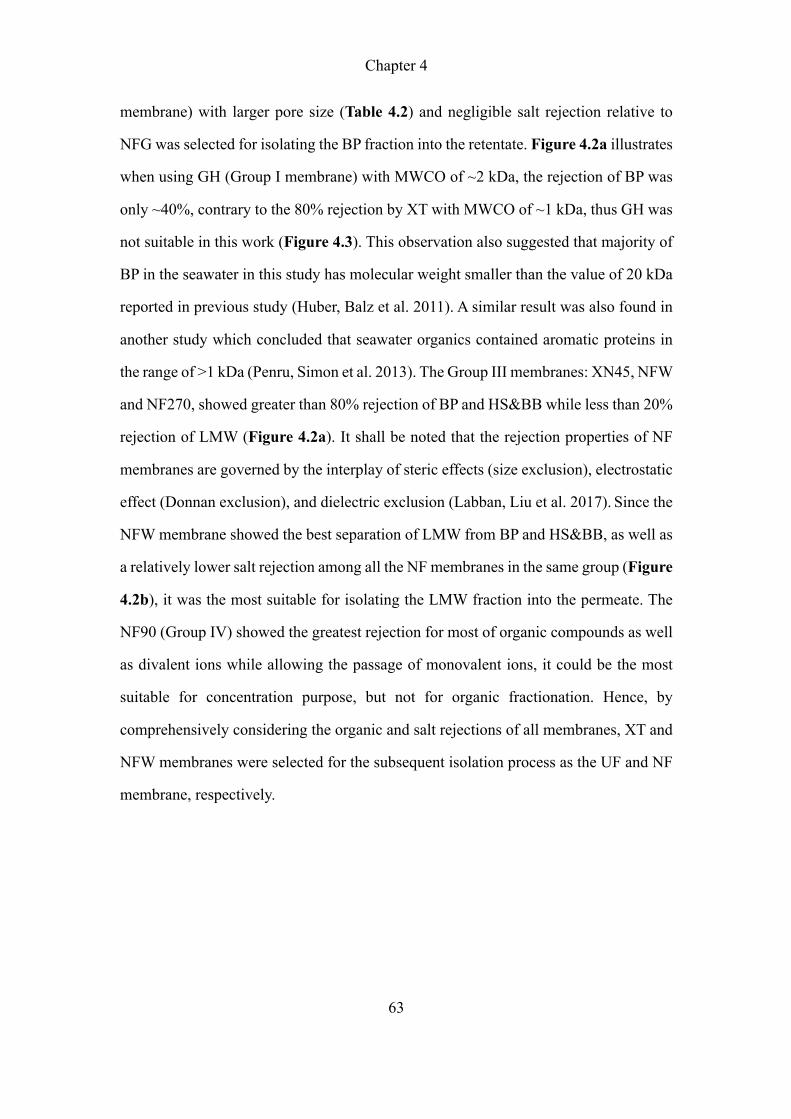
Chapter 4
63
membrane) with larger pore size (Table 4.2) and negligible salt rejection relative to
NFG was selected for isolating the BP fraction into the retentate. Figure 4.2a illustrates
when using GH (Group I membrane) with MWCO of ~2 kDa, the rejection of BP was
only ~40%, contrary to the 80% rejection by XT with MWCO of ~1 kDa, thus GH was
not suitable in this work (Figure 4.3). This observation also suggested that majority of
BP in the seawater in this study has molecular weight smaller than the value of 20 kDa
reported in previous study (Huber, Balz et al. 2011). A similar result was also found in
another study which concluded that seawater organics contained aromatic proteins in
the range of >1 kDa (Penru, Simon et al. 2013). The Group III membranes: XN45, NFW
and NF270, showed greater than 80% rejection of BP and HS&BB while less than 20%
rejection of LMW (Figure 4.2a). It shall be noted that the rejection properties of NF
membranes are governed by the interplay of steric effects (size exclusion), electrostatic
effect (Donnan exclusion), and dielectric exclusion (Labban, Liu et al. 2017). Since the
NFW membrane showed the best separation of LMW from BP and HS&BB, as well as
a relatively lower salt rejection among all the NF membranes in the same group (Figure
4.2b), it was the most suitable for isolating the LMW fraction into the permeate. The
NF90 (Group IV) showed the greatest rejection for most of organic compounds as well
as divalent ions while allowing the passage of monovalent ions, it could be the most
suitable for concentration purpose, but not for organic fractionation. Hence, by
comprehensively considering the organic and salt rejections of all membranes, XT and
NFW membranes were selected for the subsequent isolation process as the UF and NF
membrane, respectively.
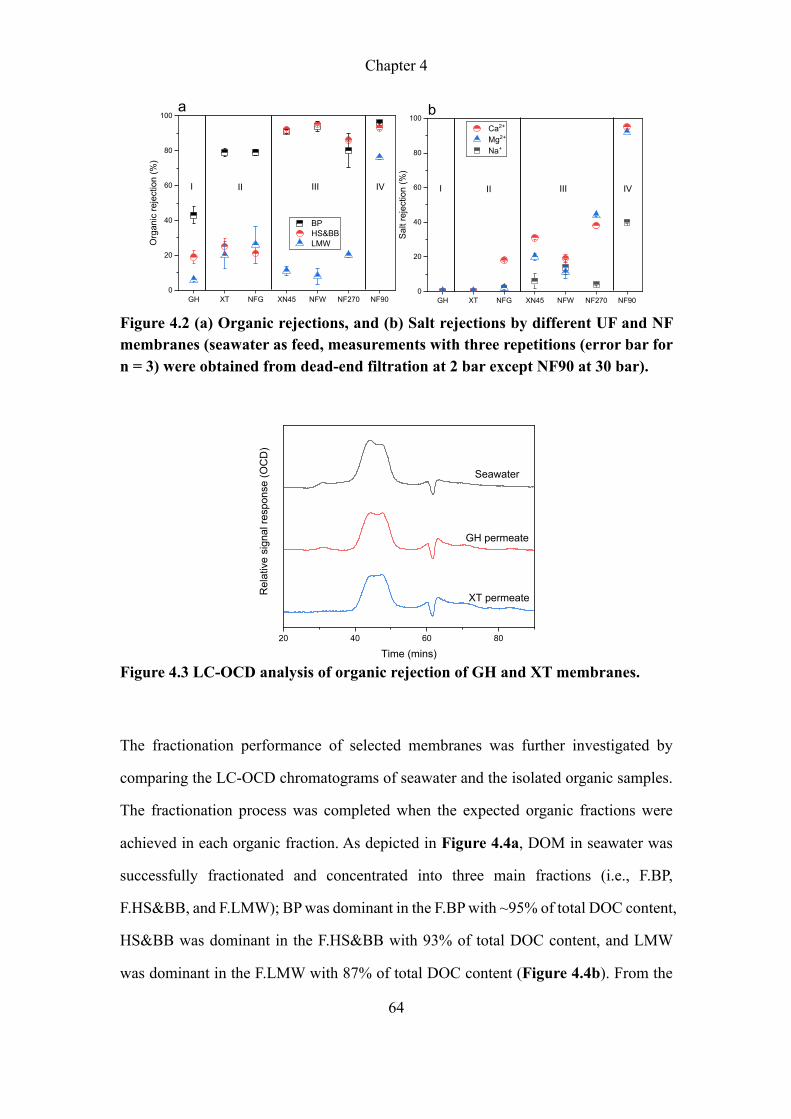
Chapter 4
64
Figure 4.2 (a) Organic rejections, and (b) Salt rejections by different UF and NF membranes (seawater as feed, measurements with three repetitions (error bar for n = 3) were obtained from dead-end filtration at 2 bar except NF90 at 30 bar).
Figure 4.3 LC-OCD analysis of organic rejection of GH and XT membranes.
The fractionation performance of selected membranes was further investigated by
comparing the LC-OCD chromatograms of seawater and the isolated organic samples.
The fractionation process was completed when the expected organic fractions were
achieved in each organic fraction. As depicted in Figure 4.4a, DOM in seawater was
successfully fractionated and concentrated into three main fractions (i.e., F.BP,
F.HS&BB, and F.LMW); BP was dominant in the F.BP with ~95% of total DOC content,
HS&BB was dominant in the F.HS&BB with 93% of total DOC content, and LMW
was dominant in the F.LMW with 87% of total DOC content (Figure 4.4b). From the
GH XT NFG XN45 NFW NF270 NF900
20
40
60
80
100
BP HS&BB LMWO
rgan
ic re
ject
ion
(%)
a
I II III IV
GH XT NFG XN45 NFW NF270 NF900
20
40
60
80
100 Ca2+
Mg2+
Na+
Salt
reje
ctio
n (%
)
b
I II III IV
20 40 60 80
Rel
ativ
e si
gnal
resp
onse
(OC
D)
Time (mins)
Seawater
GH permeate
XT permeate
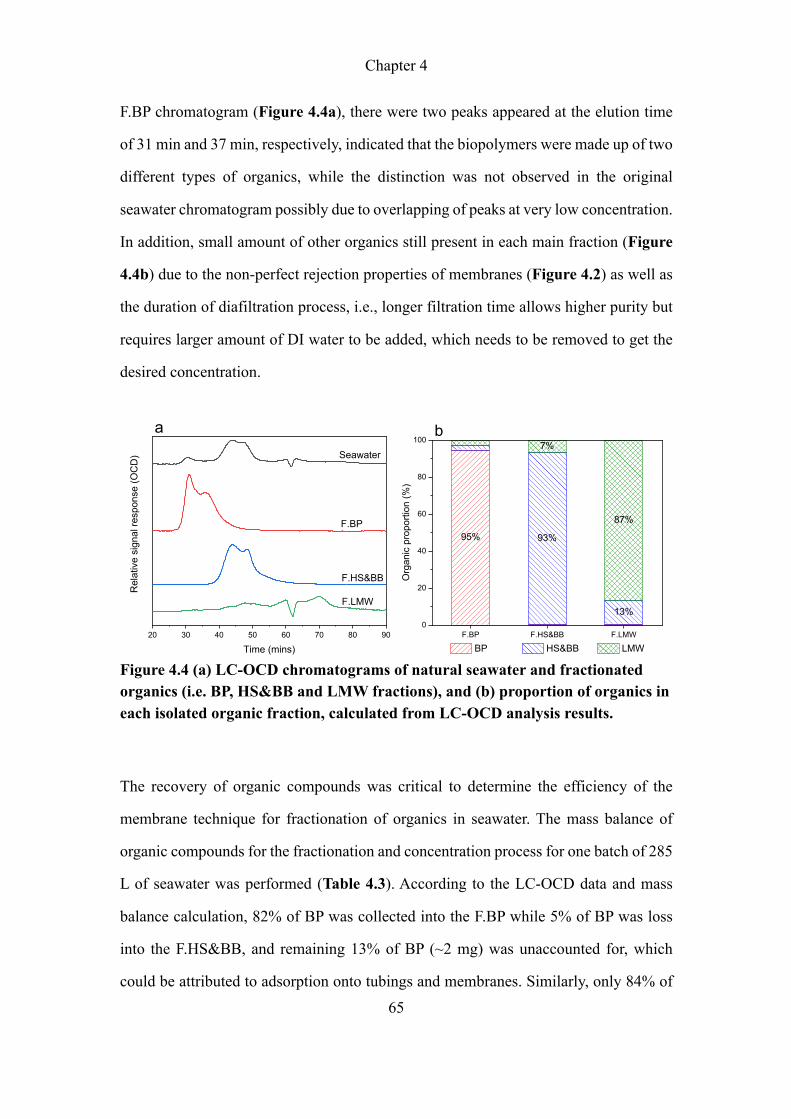
Chapter 4
65
F.BP chromatogram (Figure 4.4a), there were two peaks appeared at the elution time
of 31 min and 37 min, respectively, indicated that the biopolymers were made up of two
different types of organics, while the distinction was not observed in the original
seawater chromatogram possibly due to overlapping of peaks at very low concentration.
In addition, small amount of other organics still present in each main fraction (Figure
4.4b) due to the non-perfect rejection properties of membranes (Figure 4.2) as well as
the duration of diafiltration process, i.e., longer filtration time allows higher purity but
requires larger amount of DI water to be added, which needs to be removed to get the
desired concentration.
Figure 4.4 (a) LC-OCD chromatograms of natural seawater and fractionated organics (i.e. BP, HS&BB and LMW fractions), and (b) proportion of organics in each isolated organic fraction, calculated from LC-OCD analysis results.
The recovery of organic compounds was critical to determine the efficiency of the
membrane technique for fractionation of organics in seawater. The mass balance of
organic compounds for the fractionation and concentration process for one batch of 285
L of seawater was performed (Table 4.3). According to the LC-OCD data and mass
balance calculation, 82% of BP was collected into the F.BP while 5% of BP was loss
into the F.HS&BB, and remaining 13% of BP (~2 mg) was unaccounted for, which
could be attributed to adsorption onto tubings and membranes. Similarly, only 84% of
20 30 40 50 60 70 80 90
F.LMW
F.HS&BB
F.BP
Rel
ativ
e si
gnal
res
pons
e (O
CD
)
Time (mins)
Seawater
a
95% 93%
13%
7%
87%
F.BP F.HS&BB F.LMW0
20
40
60
80
100b
Org
anic
pro
porti
on (%
)
BP HS&BB LMW
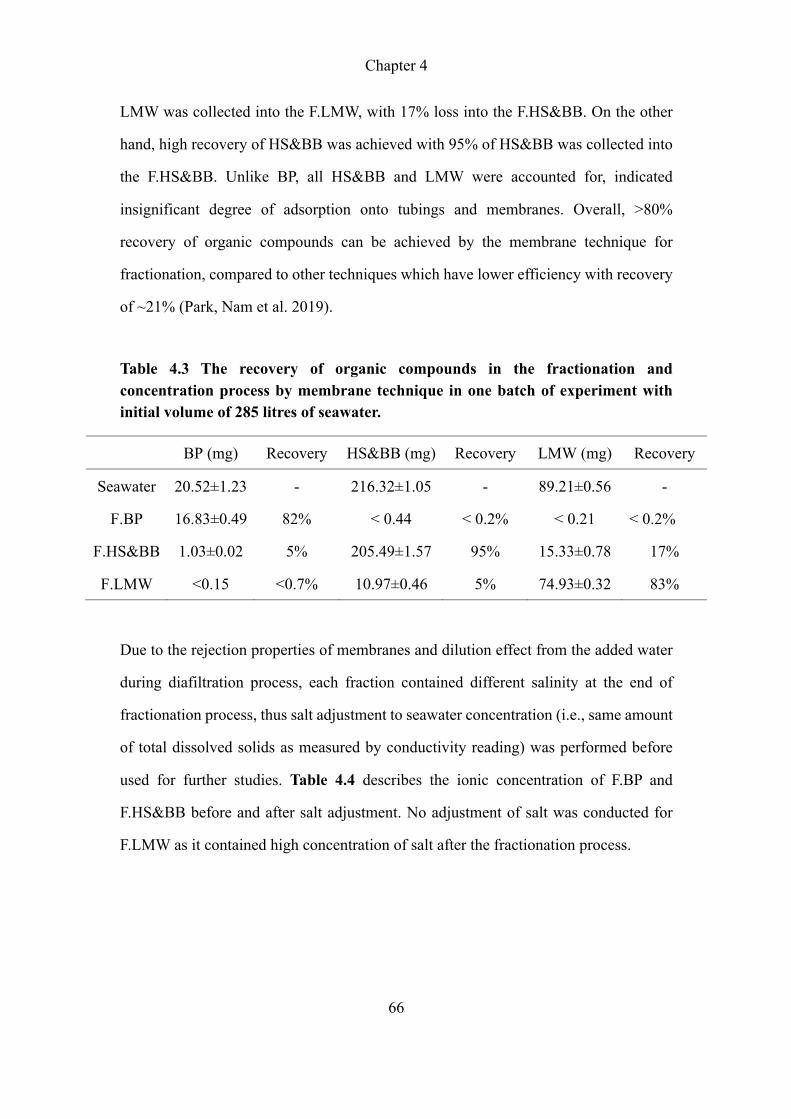
Chapter 4
66
LMW was collected into the F.LMW, with 17% loss into the F.HS&BB. On the other
hand, high recovery of HS&BB was achieved with 95% of HS&BB was collected into
the F.HS&BB. Unlike BP, all HS&BB and LMW were accounted for, indicated
insignificant degree of adsorption onto tubings and membranes. Overall, >80%
recovery of organic compounds can be achieved by the membrane technique for
fractionation, compared to other techniques which have lower efficiency with recovery
of ~21% (Park, Nam et al. 2019).
Table 4.3 The recovery of organic compounds in the fractionation and concentration process by membrane technique in one batch of experiment with initial volume of 285 litres of seawater.
BP (mg) Recovery HS&BB (mg) Recovery LMW (mg) Recovery
Seawater 20.52±1.23 - 216.32±1.05 - 89.21±0.56 -
F.BP 16.83±0.49 82% < 0.44 < 0.2% < 0.21 < 0.2%
F.HS&BB 1.03±0.02 5% 205.49±1.57 95% 15.33±0.78 17%
F.LMW <0.15 <0.7% 10.97±0.46 5% 74.93±0.32 83%
Due to the rejection properties of membranes and dilution effect from the added water
during diafiltration process, each fraction contained different salinity at the end of
fractionation process, thus salt adjustment to seawater concentration (i.e., same amount
of total dissolved solids as measured by conductivity reading) was performed before
used for further studies. Table 4.4 describes the ionic concentration of F.BP and
F.HS&BB before and after salt adjustment. No adjustment of salt was conducted for
F.LMW as it contained high concentration of salt after the fractionation process.

Chapter 4
67
Table 4.4 Ions concentrations in each organic fraction before and after salt adjustment.
� F.BP F.HS&BB F.LMW
after isolation
process Na CaMgNa
after isolation
process Na+ CaMgNa
after isolation
process CaMgNa
Ca2+ (mg/L) <0.30 <0.23 331.5
±1.5
64.51
±2.2 <1.29
450.9
±1.7
221.9
±3.3
462.4
±2.1
Mg2+ (mg/L) <1.32 <0.97
1287
±13
197.2
±2.4 <3.92
1292
±13
787.3
±21
1268
±22
Na+ (mg/L) <0.28
16600
±101
10510
±95
32.8
±4.15
17090
±85
10090
±67
10820
±88
10879
±54
Conductivity
(mS/cm) <0.13
47.93
±0.65
48.33
±0.36
5.78
±0.14
48.76
±0.62
48.25
±0.22
46.23
±0.85
49.31
±0.55
Note: N.D.: not detectable
4.3.2 Chemical Analysis and Fouling Potential of Model Organic Foulants and
Isolated Organic Fractions
Figure 4.5 shows the comparison of LC-OCD chromatograms of isolated organic
fractions and model foulants such as SA, BSA, and HA. Different elution times were
observed for SA (30 min) and BSA (34 min), which were corresponded to the two peaks
in F.BP, thus the biopolymers in seawater were mainly made up of polysaccharides-like
and protein-like compounds. Whereas the elution time of HA was 40 min, which
showed greater MW than the natural organics (HS&BB) in seawater. Both F.LMW and
AOM.LMW had similar elution time at ~70 min.
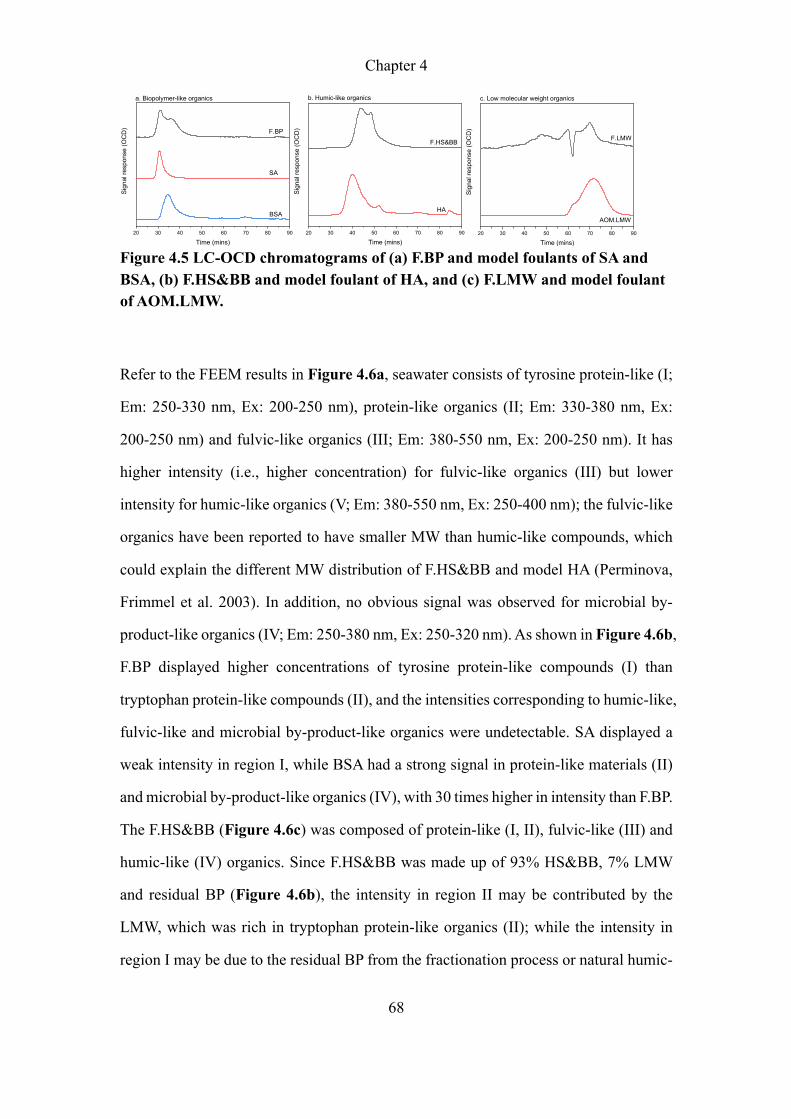
Chapter 4
68
Figure 4.5 LC-OCD chromatograms of (a) F.BP and model foulants of SA and BSA, (b) F.HS&BB and model foulant of HA, and (c) F.LMW and model foulant of AOM.LMW.
Refer to the FEEM results in Figure 4.6a, seawater consists of tyrosine protein-like (I;
Em: 250-330 nm, Ex: 200-250 nm), protein-like organics (II; Em: 330-380 nm, Ex:
200-250 nm) and fulvic-like organics (III; Em: 380-550 nm, Ex: 200-250 nm). It has
higher intensity (i.e., higher concentration) for fulvic-like organics (III) but lower
intensity for humic-like organics (V; Em: 380-550 nm, Ex: 250-400 nm); the fulvic-like
organics have been reported to have smaller MW than humic-like compounds, which
could explain the different MW distribution of F.HS&BB and model HA (Perminova,
Frimmel et al. 2003). In addition, no obvious signal was observed for microbial by-
product-like organics (IV; Em: 250-380 nm, Ex: 250-320 nm). As shown in Figure 4.6b,
F.BP displayed higher concentrations of tyrosine protein-like compounds (I) than
tryptophan protein-like compounds (II), and the intensities corresponding to humic-like,
fulvic-like and microbial by-product-like organics were undetectable. SA displayed a
weak intensity in region I, while BSA had a strong signal in protein-like materials (II)
and microbial by-product-like organics (IV), with 30 times higher in intensity than F.BP.
The F.HS&BB (Figure 4.6c) was composed of protein-like (I, II), fulvic-like (III) and
humic-like (IV) organics. Since F.HS&BB was made up of 93% HS&BB, 7% LMW
and residual BP (Figure 4.6b), the intensity in region II may be contributed by the
LMW, which was rich in tryptophan protein-like organics (II); while the intensity in
region I may be due to the residual BP from the fractionation process or natural humic-
20 30 40 50 60 70 80 90
BSA
SA
Sign
al re
spon
se (O
CD
)
Time (mins)
a. Biopolymer-like organics
F.BP
20 30 40 50 60 70 80 90
HA
F.HS&BB
Sign
al re
spon
se (O
CD
)
Time (mins)
b. Humic-like organics
20 30 40 50 60 70 80 90
c. Low molecular weight organics
Sign
al re
spon
se (O
CD
)
Time (mins)
F.LMW
AOM.LMW
Chapter 4
69
fulvic substances that contains protein-like materials (Rodriguez 2011, Yu, Song et al.
2014). The comparison of F.HS&BB and HA appeared to show significant difference
in their fluorescence intensities. This could be attributed to the fact that certain amount
of the organics in seawater are non-fluorescent. In another word, seawater contains
more photochemically degraded DOM or relatively less aromatic DOM compared to
other water sources such as ground water and surface water (Zhou, Guo et al. 2016).
On the other hand, AOM.LMW which was derived from marine algae, was rich in
tryptophan protein-like organics (II) similar to F.LMW.
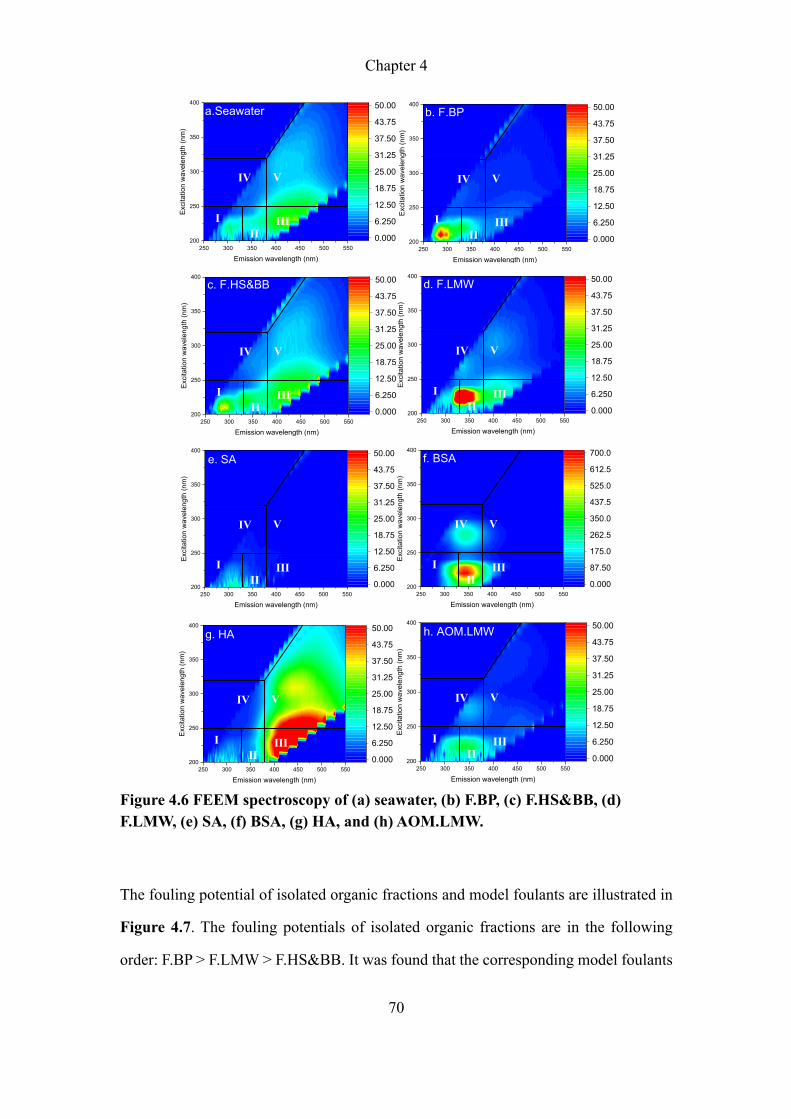
Chapter 4
70
Figure 4.6 FEEM spectroscopy of (a) seawater, (b) F.BP, (c) F.HS&BB, (d) F.LMW, (e) SA, (f) BSA, (g) HA, and (h) AOM.LMW.
The fouling potential of isolated organic fractions and model foulants are illustrated in
Figure 4.7. The fouling potentials of isolated organic fractions are in the following
order: F.BP > F.LMW > F.HS&BB. It was found that the corresponding model foulants
250 300 350 400 450 500 550200
250
300
350
400
VIV
IIIII
Emission wavelength (nm)
Exci
tatio
n w
avel
engt
h (n
m)
0.000
6.250
12.50
18.75
25.00
31.25
37.50
43.75
50.00a.Seawater
I
250 300 350 400 450 500 550200
250
300
350
400
Emission wavelength (nm)
Exci
tatio
n w
avel
engt
h (n
m)
0.000
6.250
12.50
18.75
25.00
31.25
37.50
43.75
50.00b. F.BP
IV V
III
III
250 300 350 400 450 500 550200
250
300
350
400
Emission wavelength (nm)
Exci
tatio
n w
avel
engt
h (n
m)
0.000
6.250
12.50
18.75
25.00
31.25
37.50
43.75
50.00c. F.HS&BB
IV V
III
III
250 300 350 400 450 500 550200
250
300
350
400
Emission wavelength (nm)
Exci
tatio
n w
avel
engt
h (n
m)
0.000
6.250
12.50
18.75
25.00
31.25
37.50
43.75
50.00d. F.LMW
IV V
III
III
250 300 350 400 450 500 550200
250
300
350
400
Emission wavelength (nm)
Exci
tatio
n w
avel
engt
h (n
m)
0.000
6.250
12.50
18.75
25.00
31.25
37.50
43.75
50.00e. SA
IV V
III
III
250 300 350 400 450 500 550200
250
300
350
400
Emission wavelength (nm)
Exci
tatio
n w
avel
engt
h (n
m)
0.000
87.50
175.0
262.5
350.0
437.5
525.0
612.5
700.0f. BSA
IV V
III
III
250 300 350 400 450 500 550200
250
300
350
400
Emission wavelength (nm)
Exci
tatio
n w
avel
engt
h (n
m)
0.000
6.250
12.50
18.75
25.00
31.25
37.50
43.75
50.00g. HA
IV V
III
III
250 300 350 400 450 500 550200
250
300
350
400
h. AOM.LMW
Emission wavelength (nm)
Exci
tatio
n w
avel
engt
h (n
m)
0.000
6.250
12.50
18.75
25.00
31.25
37.50
43.75
50.00
IV V
IIIII
I
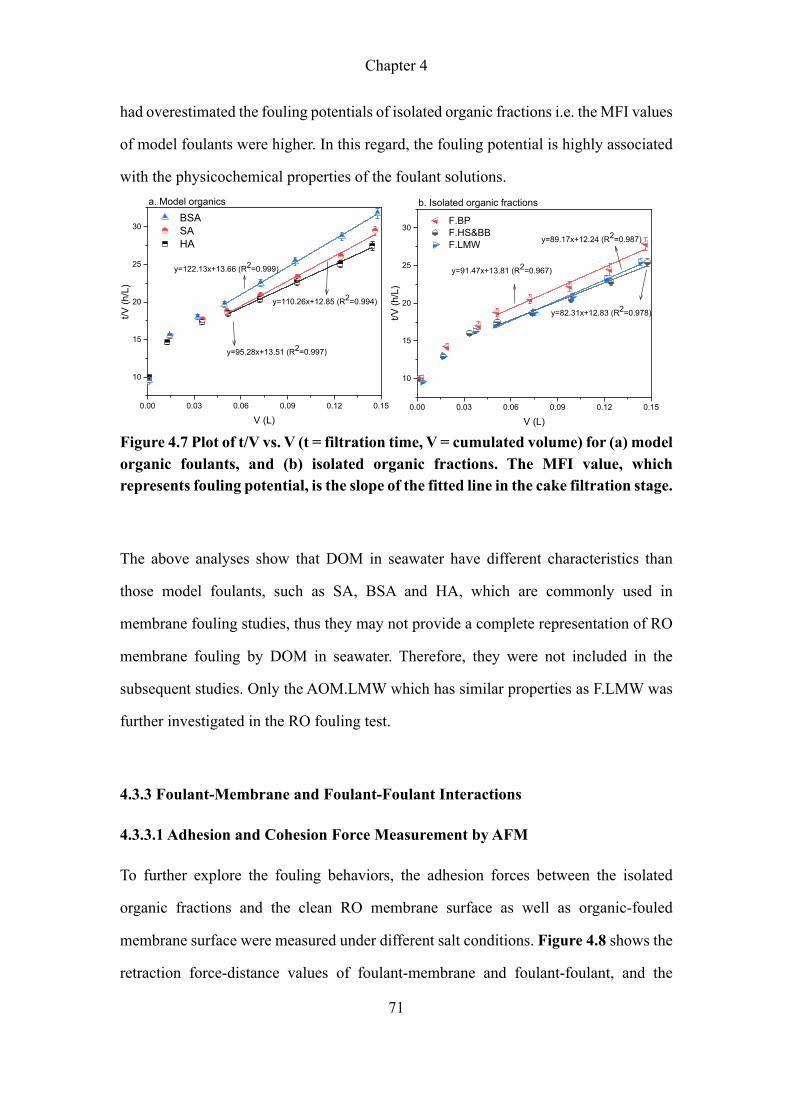
Chapter 4
71
had overestimated the fouling potentials of isolated organic fractions i.e. the MFI values
of model foulants were higher. In this regard, the fouling potential is highly associated
with the physicochemical properties of the foulant solutions.
Figure 4.7 Plot of t/V vs. V (t = filtration time, V = cumulated volume) for (a) model organic foulants, and (b) isolated organic fractions. The MFI value, which represents fouling potential, is the slope of the fitted line in the cake filtration stage.
The above analyses show that DOM in seawater have different characteristics than
those model foulants, such as SA, BSA and HA, which are commonly used in
membrane fouling studies, thus they may not provide a complete representation of RO
membrane fouling by DOM in seawater. Therefore, they were not included in the
subsequent studies. Only the AOM.LMW which has similar properties as F.LMW was
further investigated in the RO fouling test.
4.3.3 Foulant-Membrane and Foulant-Foulant Interactions
4.3.3.1 Adhesion and Cohesion Force Measurement by AFM
To further explore the fouling behaviors, the adhesion forces between the isolated
organic fractions and the clean RO membrane surface as well as organic-fouled
membrane surface were measured under different salt conditions. Figure 4.8 shows the
retraction force-distance values of foulant-membrane and foulant-foulant, and the
0.00 0.03 0.06 0.09 0.12 0.15
10
15
20
25
30
y=110.26x+12.85 (R2=0.994)
BSA SA HA
t/V (
h/L)
V (L)
y=122.13x+13.66 (R2=0.999)
y=95.28x+13.51 (R2=0.997)
a. Model organics
0.00 0.03 0.06 0.09 0.12 0.15
10
15
20
25
30
b. Isolated organic fractions
F.BP F.HS&BB F.LMW
t/V (
h/L)
V (L)
y=91.47x+13.81 (R2=0.967)
y=89.17x+12.24 (R2=0.987)
y=82.31x+12.83 (R2=0.978)
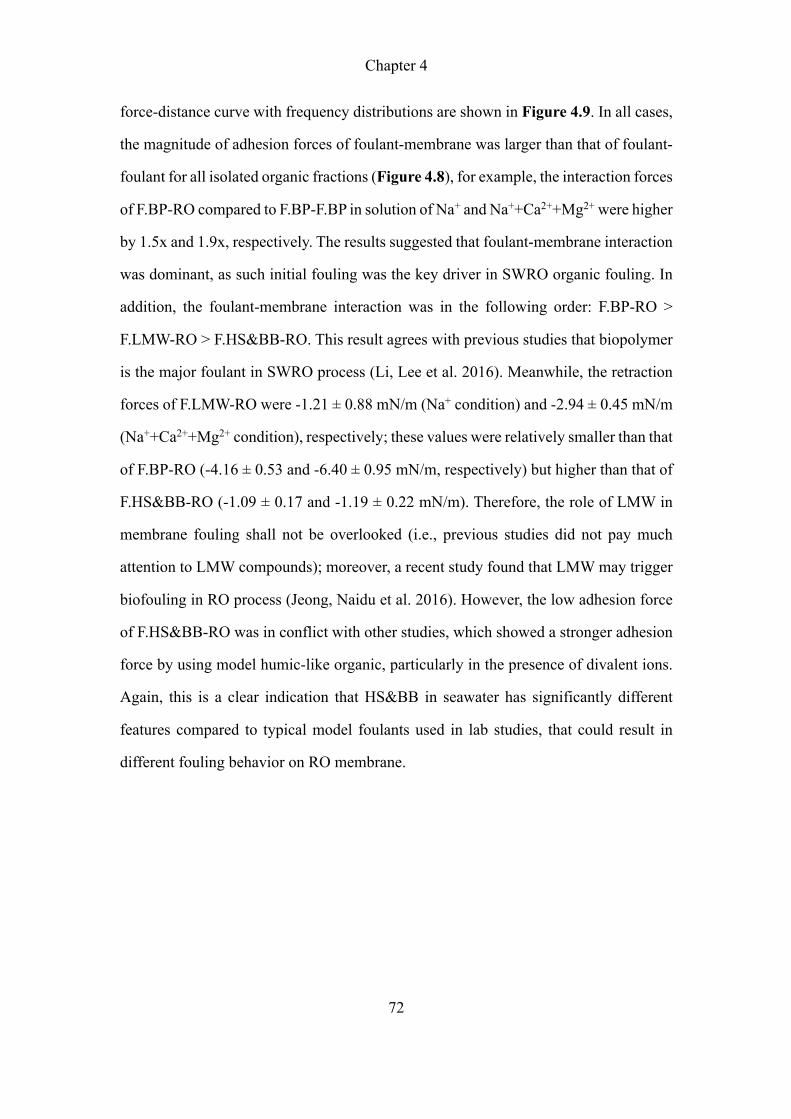
Chapter 4
72
force-distance curve with frequency distributions are shown in Figure 4.9. In all cases,
the magnitude of adhesion forces of foulant-membrane was larger than that of foulant-
foulant for all isolated organic fractions (Figure 4.8), for example, the interaction forces
of F.BP-RO compared to F.BP-F.BP in solution of Na+ and Na++Ca2++Mg2+ were higher
by 1.5x and 1.9x, respectively. The results suggested that foulant-membrane interaction
was dominant, as such initial fouling was the key driver in SWRO organic fouling. In
addition, the foulant-membrane interaction was in the following order: F.BP-RO >
F.LMW-RO > F.HS&BB-RO. This result agrees with previous studies that biopolymer
is the major foulant in SWRO process (Li, Lee et al. 2016). Meanwhile, the retraction
forces of F.LMW-RO were -1.21 ± 0.88 mN/m (Na+ condition) and -2.94 ± 0.45 mN/m
(Na++Ca2++Mg2+ condition), respectively; these values were relatively smaller than that
of F.BP-RO (-4.16 ± 0.53 and -6.40 ± 0.95 mN/m, respectively) but higher than that of
F.HS&BB-RO (-1.09 ± 0.17 and -1.19 ± 0.22 mN/m). Therefore, the role of LMW in
membrane fouling shall not be overlooked (i.e., previous studies did not pay much
attention to LMW compounds); moreover, a recent study found that LMW may trigger
biofouling in RO process (Jeong, Naidu et al. 2016). However, the low adhesion force
of F.HS&BB-RO was in conflict with other studies, which showed a stronger adhesion
force by using model humic-like organic, particularly in the presence of divalent ions.
Again, this is a clear indication that HS&BB in seawater has significantly different
features compared to typical model foulants used in lab studies, that could result in
different fouling behavior on RO membrane.
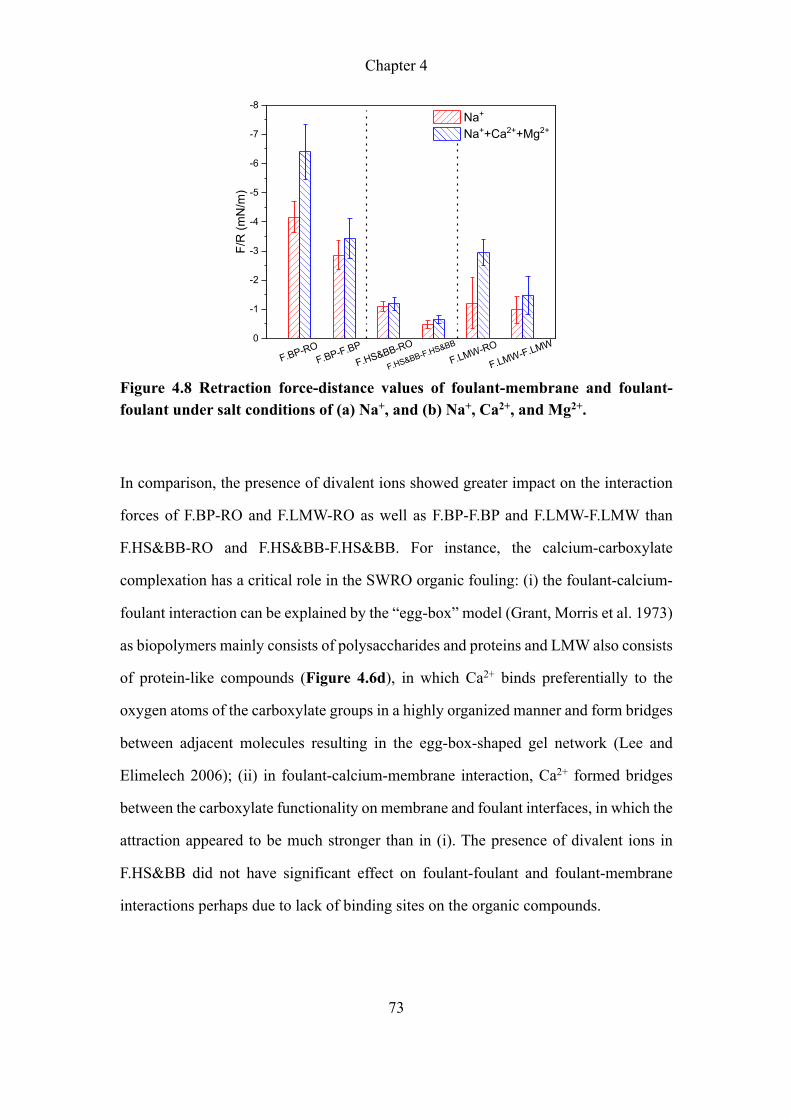
Chapter 4
73
Figure 4.8 Retraction force-distance values of foulant-membrane and foulant-foulant under salt conditions of (a) Na+, and (b) Na+, Ca2+, and Mg2+.
In comparison, the presence of divalent ions showed greater impact on the interaction
forces of F.BP-RO and F.LMW-RO as well as F.BP-F.BP and F.LMW-F.LMW than
F.HS&BB-RO and F.HS&BB-F.HS&BB. For instance, the calcium-carboxylate
complexation has a critical role in the SWRO organic fouling: (i) the foulant-calcium-
foulant interaction can be explained by the “egg-box” model (Grant, Morris et al. 1973)
as biopolymers mainly consists of polysaccharides and proteins and LMW also consists
of protein-like compounds (Figure 4.6d), in which Ca2+ binds preferentially to the
oxygen atoms of the carboxylate groups in a highly organized manner and form bridges
between adjacent molecules resulting in the egg-box-shaped gel network (Lee and
Elimelech 2006); (ii) in foulant-calcium-membrane interaction, Ca2+ formed bridges
between the carboxylate functionality on membrane and foulant interfaces, in which the
attraction appeared to be much stronger than in (i). The presence of divalent ions in
F.HS&BB did not have significant effect on foulant-foulant and foulant-membrane
interactions perhaps due to lack of binding sites on the organic compounds.
0
-1
-2
-3
-4
-5
-6
-7
-8
F.LMW-F.LMWF.LMW-RO
F.HS&BB-F.HS&BB
F.HS&BB-ROF.BP-F.BP
F/R
(mN
/m)
Na+
Na++Ca2++Mg2+
F.BP-RO
Chapter 4
74
Figure 4.9 Retraction force-distance curves of foulant-membrane and foulant-foulant under salt conditions of (a) Na+, and (b) Na+, Ca2+, and Mg2+, with frequency distribution histogram.
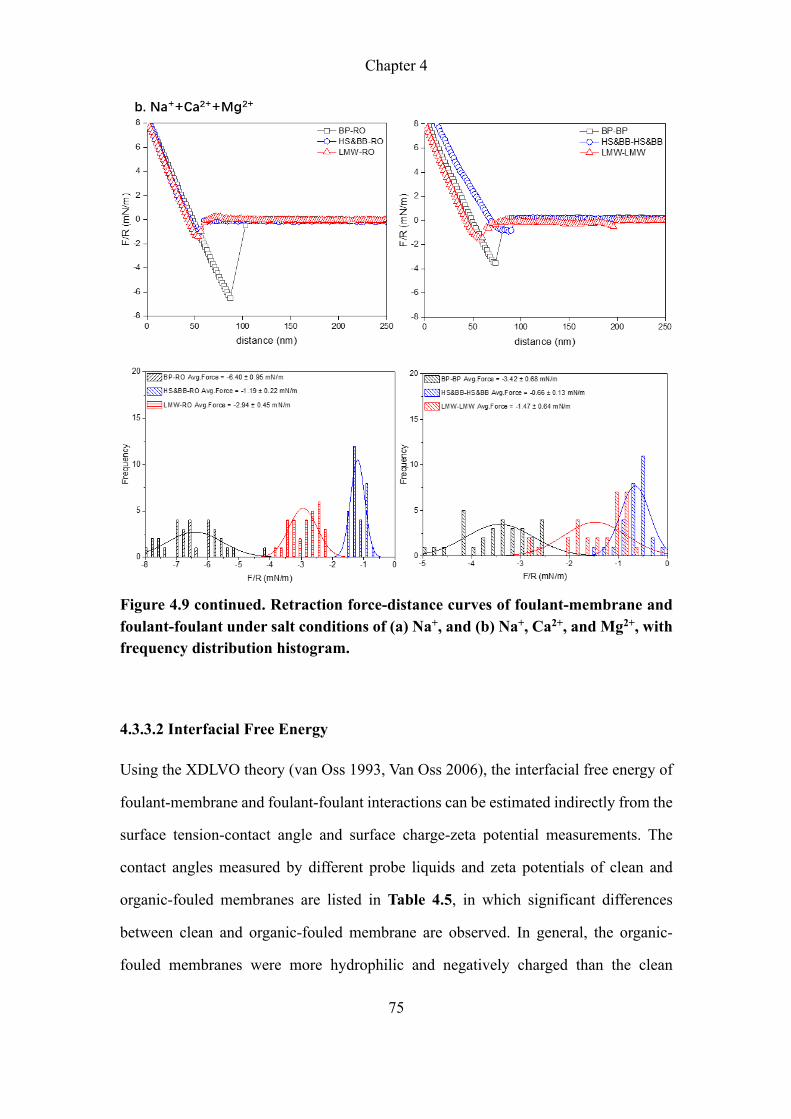
Chapter 4
75
Figure 4.9 continued. Retraction force-distance curves of foulant-membrane and foulant-foulant under salt conditions of (a) Na+, and (b) Na+, Ca2+, and Mg2+, with frequency distribution histogram.
4.3.3.2 Interfacial Free Energy
Using the XDLVO theory (van Oss 1993, Van Oss 2006), the interfacial free energy of
foulant-membrane and foulant-foulant interactions can be estimated indirectly from the
surface tension-contact angle and surface charge-zeta potential measurements. The
contact angles measured by different probe liquids and zeta potentials of clean and
organic-fouled membranes are listed in Table 4.5, in which significant differences
between clean and organic-fouled membrane are observed. In general, the organic-
fouled membranes were more hydrophilic and negatively charged than the clean
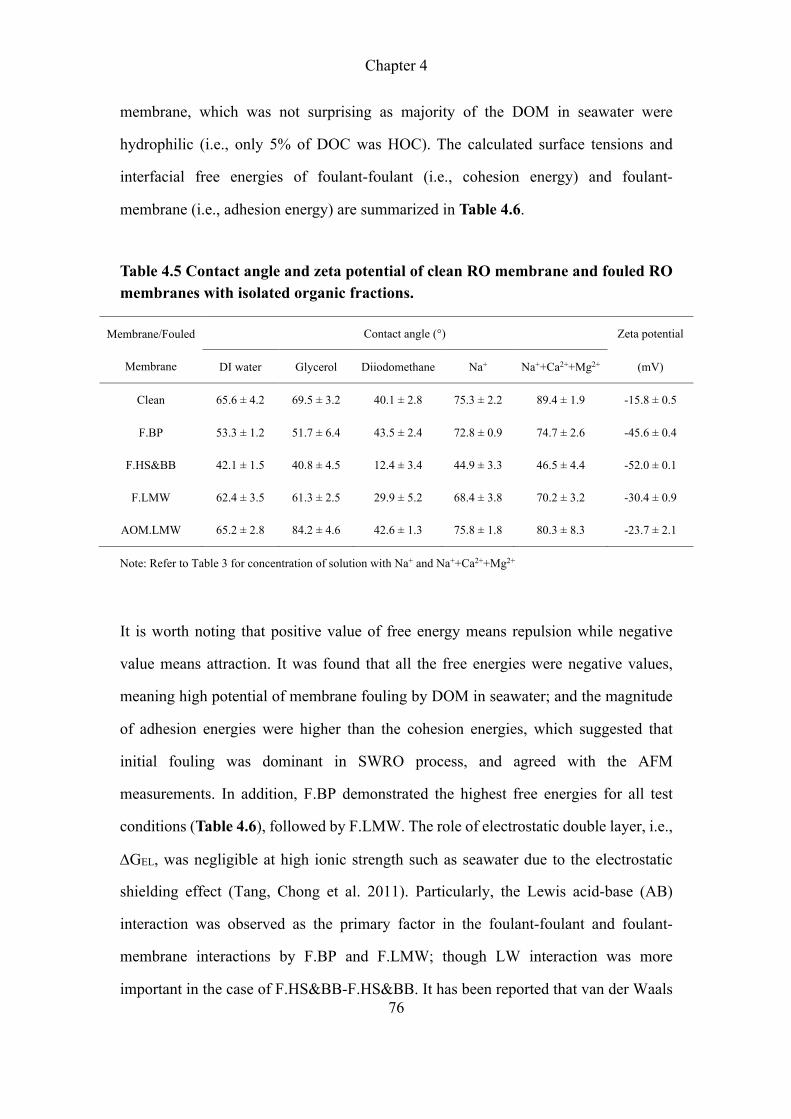
Chapter 4
76
membrane, which was not surprising as majority of the DOM in seawater were
hydrophilic (i.e., only 5% of DOC was HOC). The calculated surface tensions and
interfacial free energies of foulant-foulant (i.e., cohesion energy) and foulant-
membrane (i.e., adhesion energy) are summarized in Table 4.6.
Table 4.5 Contact angle and zeta potential of clean RO membrane and fouled RO membranes with isolated organic fractions.
Membrane/Fouled
Membrane
Contact angle (°) Zeta potential
DI water Glycerol Diiodomethane Na+ Na++Ca2++Mg2+ (mV)
Clean 65.6 ± 4.2 69.5 ± 3.2 40.1 ± 2.8 75.3 ± 2.2 89.4 ± 1.9 -15.8 ± 0.5
F.BP 53.3 ± 1.2 51.7 ± 6.4 43.5 ± 2.4 72.8 ± 0.9 74.7 ± 2.6 -45.6 ± 0.4
F.HS&BB 42.1 ± 1.5 40.8 ± 4.5 12.4 ± 3.4 44.9 ± 3.3 46.5 ± 4.4 -52.0 ± 0.1
F.LMW 62.4 ± 3.5 61.3 ± 2.5 29.9 ± 5.2 68.4 ± 3.8 70.2 ± 3.2 -30.4 ± 0.9
AOM.LMW 65.2 ± 2.8 84.2 ± 4.6 42.6 ± 1.3 75.8 ± 1.8 80.3 ± 8.3 -23.7 ± 2.1
Note: Refer to Table 3 for concentration of solution with Na+ and Na++Ca2++Mg2+
It is worth noting that positive value of free energy means repulsion while negative
value means attraction. It was found that all the free energies were negative values,
meaning high potential of membrane fouling by DOM in seawater; and the magnitude
of adhesion energies were higher than the cohesion energies, which suggested that
initial fouling was dominant in SWRO process, and agreed with the AFM
measurements. In addition, F.BP demonstrated the highest free energies for all test
conditions (Table 4.6), followed by F.LMW. The role of electrostatic double layer, i.e.,
DGEL, was negligible at high ionic strength such as seawater due to the electrostatic
shielding effect (Tang, Chong et al. 2011). Particularly, the Lewis acid-base (AB)
interaction was observed as the primary factor in the foulant-foulant and foulant-
membrane interactions by F.BP and F.LMW; though LW interaction was more
important in the case of F.HS&BB-F.HS&BB. It has been reported that van der Waals
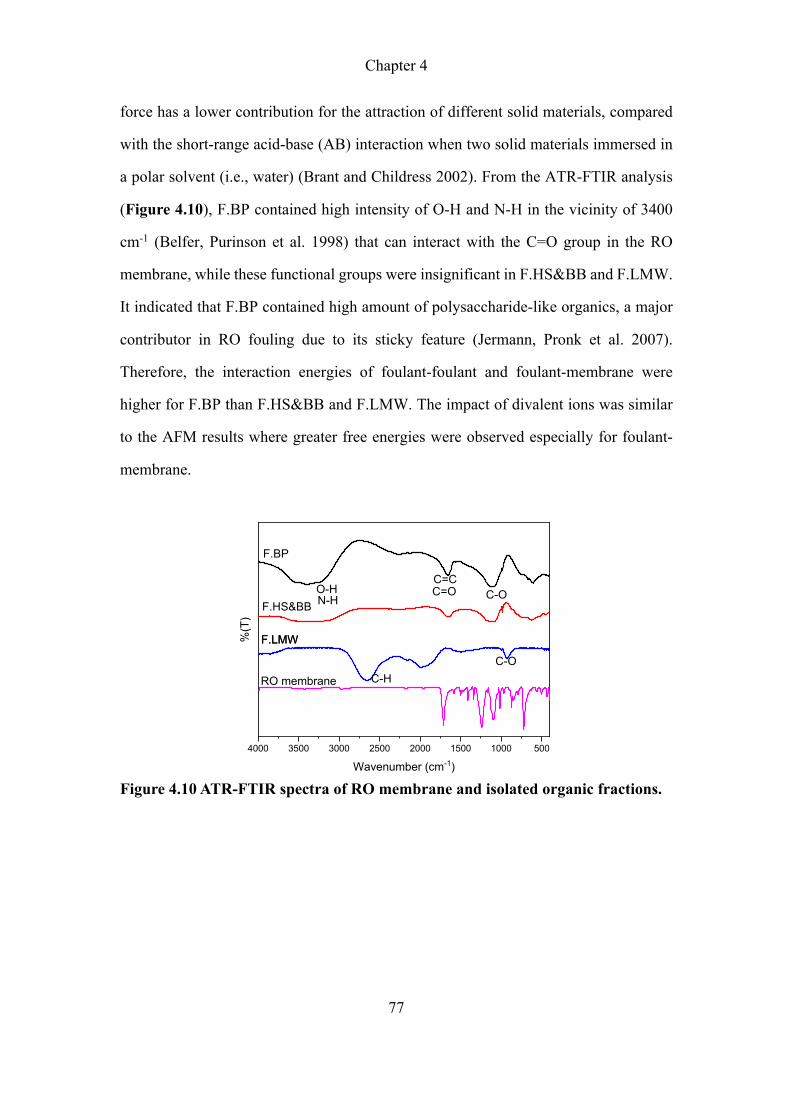
Chapter 4
77
force has a lower contribution for the attraction of different solid materials, compared
with the short-range acid-base (AB) interaction when two solid materials immersed in
a polar solvent (i.e., water) (Brant and Childress 2002). From the ATR-FTIR analysis
(Figure 4.10), F.BP contained high intensity of O-H and N-H in the vicinity of 3400
cm-1 (Belfer, Purinson et al. 1998) that can interact with the C=O group in the RO
membrane, while these functional groups were insignificant in F.HS&BB and F.LMW.
It indicated that F.BP contained high amount of polysaccharide-like organics, a major
contributor in RO fouling due to its sticky feature (Jermann, Pronk et al. 2007).
Therefore, the interaction energies of foulant-foulant and foulant-membrane were
higher for F.BP than F.HS&BB and F.LMW. The impact of divalent ions was similar
to the AFM results where greater free energies were observed especially for foulant-
membrane.
Figure 4.10 ATR-FTIR spectra of RO membrane and isolated organic fractions.
4000 3500 3000 2500 2000 1500 1000 500
C-O
C=O
C-H
O-HN-H C-O
C=C
RO membrane
F.LMW%(T
)
Wavenumber (cm-1)
F.HS&BB
F.BP
F.LMW
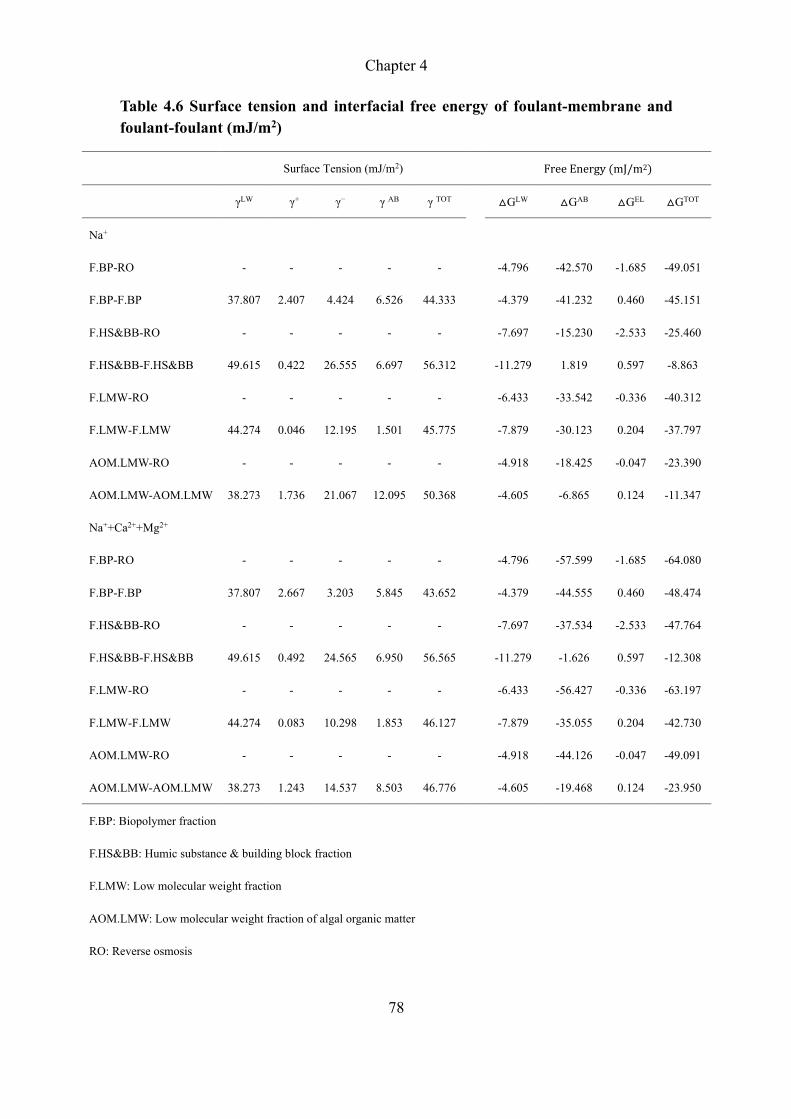
Chapter 4
78
Table 4.6 Surface tension and interfacial free energy of foulant-membrane and foulant-foulant (mJ/m2)
Surface Tension (mJ/m2) FreeEnergy(mJ/m2)
γLW γ+ γ− γ AB γ TOT � △GLW △GAB △GEL △GTOT
Na+
F.BP-RO - - - - - -4.796 -42.570 -1.685 -49.051
F.BP-F.BP 37.807 2.407 4.424 6.526 44.333
-4.379 -41.232 0.460 -45.151
F.HS&BB-RO - - - - - -7.697 -15.230 -2.533 -25.460
F.HS&BB-F.HS&BB 49.615 0.422 26.555 6.697 56.312
-11.279 1.819 0.597 -8.863
F.LMW-RO - - - - - -6.433 -33.542 -0.336 -40.312
F.LMW-F.LMW 44.274 0.046 12.195 1.501 45.775 -7.879 -30.123 0.204 -37.797
AOM.LMW-RO - - - - - -4.918 -18.425 -0.047 -23.390
AOM.LMW-AOM.LMW 38.273 1.736 21.067 12.095 50.368 -4.605 -6.865 0.124 -11.347
Na++Ca2++Mg2+
F.BP-RO - - - - - -4.796 -57.599 -1.685 -64.080
F.BP-F.BP 37.807 2.667 3.203 5.845 43.652
-4.379 -44.555 0.460 -48.474
F.HS&BB-RO - - - - - -7.697 -37.534 -2.533 -47.764
F.HS&BB-F.HS&BB 49.615 0.492 24.565 6.950 56.565
-11.279 -1.626 0.597 -12.308
F.LMW-RO - - - - - -6.433 -56.427 -0.336 -63.197
F.LMW-F.LMW 44.274 0.083 10.298 1.853 46.127 -7.879 -35.055 0.204 -42.730
AOM.LMW-RO - - - - - -4.918 -44.126 -0.047 -49.091
AOM.LMW-AOM.LMW 38.273 1.243 14.537 8.503 46.776 -4.605 -19.468 0.124 -23.950
F.BP: Biopolymer fraction
F.HS&BB: Humic substance & building block fraction
F.LMW: Low molecular weight fraction
AOM.LMW: Low molecular weight fraction of algal organic matter
RO: Reverse osmosis
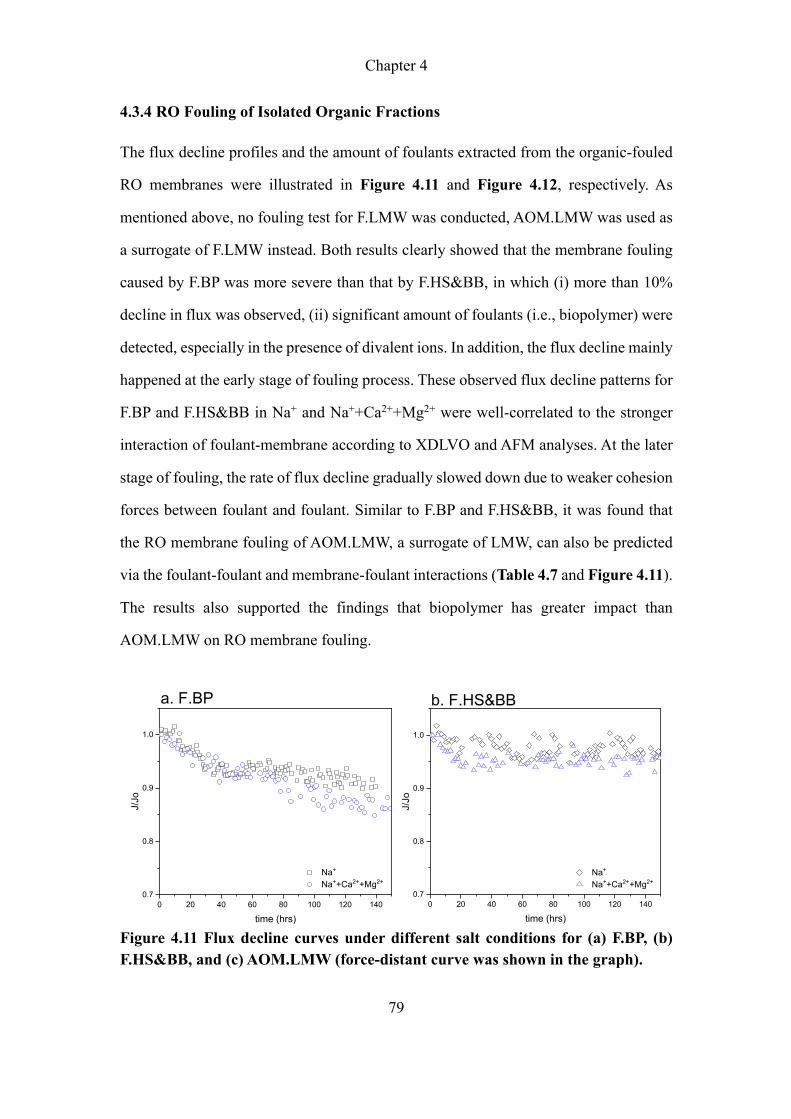
Chapter 4
79
4.3.4 RO Fouling of Isolated Organic Fractions
The flux decline profiles and the amount of foulants extracted from the organic-fouled
RO membranes were illustrated in Figure 4.11 and Figure 4.12, respectively. As
mentioned above, no fouling test for F.LMW was conducted, AOM.LMW was used as
a surrogate of F.LMW instead. Both results clearly showed that the membrane fouling
caused by F.BP was more severe than that by F.HS&BB, in which (i) more than 10%
decline in flux was observed, (ii) significant amount of foulants (i.e., biopolymer) were
detected, especially in the presence of divalent ions. In addition, the flux decline mainly
happened at the early stage of fouling process. These observed flux decline patterns for
F.BP and F.HS&BB in Na+ and Na++Ca2++Mg2+ were well-correlated to the stronger
interaction of foulant-membrane according to XDLVO and AFM analyses. At the later
stage of fouling, the rate of flux decline gradually slowed down due to weaker cohesion
forces between foulant and foulant. Similar to F.BP and F.HS&BB, it was found that
the RO membrane fouling of AOM.LMW, a surrogate of LMW, can also be predicted
via the foulant-foulant and membrane-foulant interactions (Table 4.7 and Figure 4.11).
The results also supported the findings that biopolymer has greater impact than
AOM.LMW on RO membrane fouling.
Figure 4.11 Flux decline curves under different salt conditions for (a) F.BP, (b) F.HS&BB, and (c) AOM.LMW (force-distant curve was shown in the graph).
0 20 40 60 80 100 120 1400.7
0.8
0.9
1.0
Na+
Na++Ca2++Mg2+
J/Jo
time (hrs)
a. F.BP
0 20 40 60 80 100 120 1400.7
0.8
0.9
1.0
Na+
Na++Ca2++Mg2+
J/Jo
time (hrs)
b. F.HS&BB
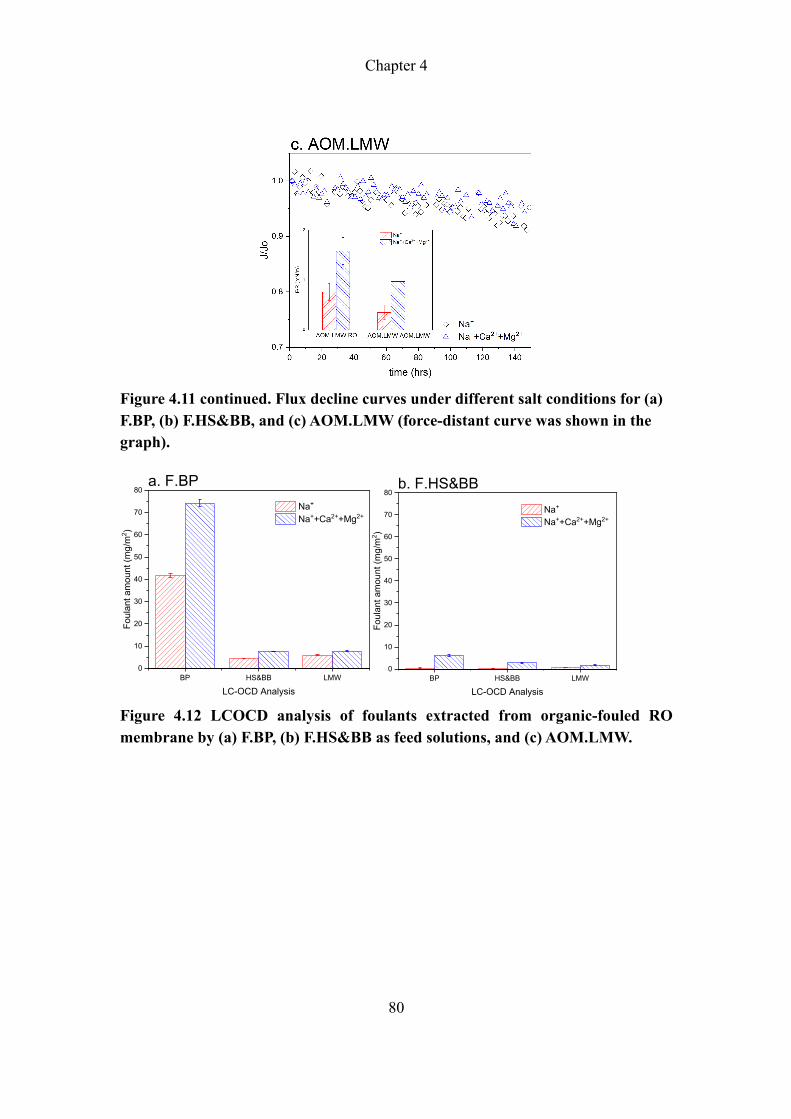
Chapter 4
80
Figure 4.11 continued. Flux decline curves under different salt conditions for (a) F.BP, (b) F.HS&BB, and (c) AOM.LMW (force-distant curve was shown in the graph).
Figure 4.12 LCOCD analysis of foulants extracted from organic-fouled RO membrane by (a) F.BP, (b) F.HS&BB as feed solutions, and (c) AOM.LMW.
BP HS&BB LMW0
10
20
30
40
50
60
70
80
Fou
lant
am
ount
(m
g/m
2 )
LC-OCD Analysis
Na+
Na++Ca2++Mg2+
a. F.BP
BP HS&BB LMW0
10
20
30
40
50
60
70
80b. F.HS&BB
Foul
ant a
mou
nt (m
g/m
2 )
LC-OCD Analysis
Na+
Na++Ca2++Mg2+
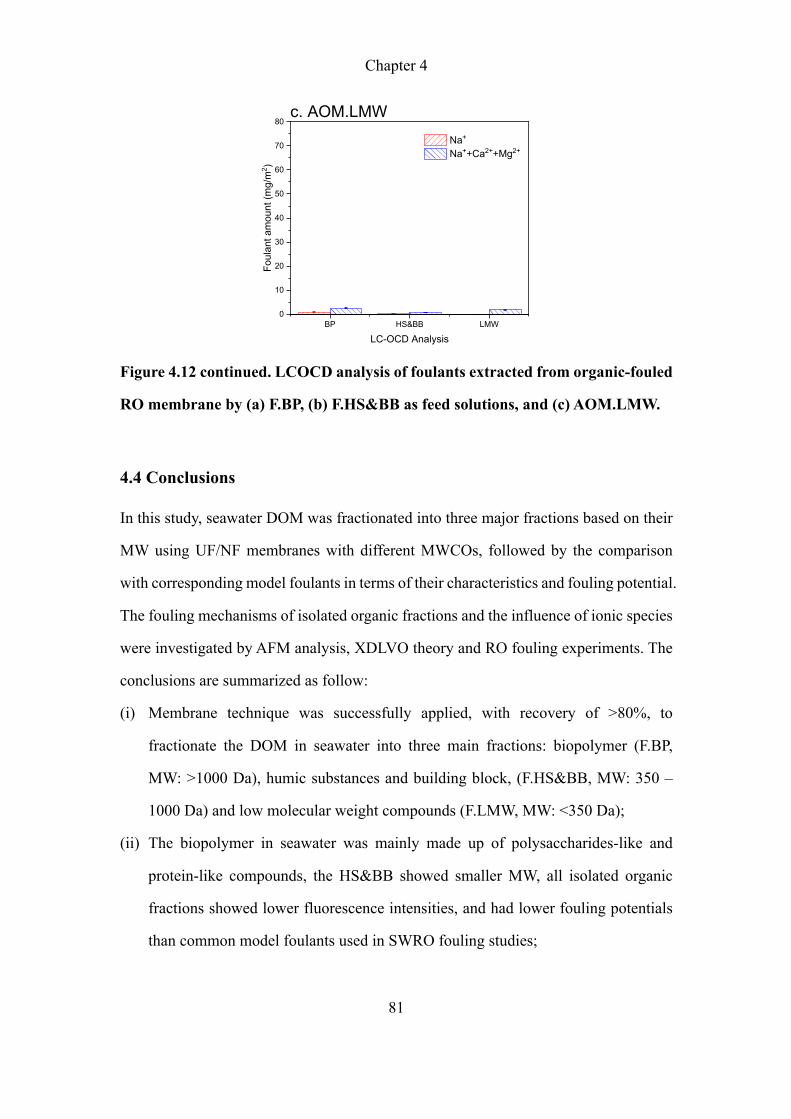
Chapter 4
81
Figure 4.12 continued. LCOCD analysis of foulants extracted from organic-fouled
RO membrane by (a) F.BP, (b) F.HS&BB as feed solutions, and (c) AOM.LMW.
4.4 Conclusions
In this study, seawater DOM was fractionated into three major fractions based on their
MW using UF/NF membranes with different MWCOs, followed by the comparison
with corresponding model foulants in terms of their characteristics and fouling potential.
The fouling mechanisms of isolated organic fractions and the influence of ionic species
were investigated by AFM analysis, XDLVO theory and RO fouling experiments. The
conclusions are summarized as follow:
(i) Membrane technique was successfully applied, with recovery of >80%, to
fractionate the DOM in seawater into three main fractions: biopolymer (F.BP,
MW: >1000 Da), humic substances and building block, (F.HS&BB, MW: 350 –
1000 Da) and low molecular weight compounds (F.LMW, MW: <350 Da);
(ii) The biopolymer in seawater was mainly made up of polysaccharides-like and
protein-like compounds, the HS&BB showed smaller MW, all isolated organic
fractions showed lower fluorescence intensities, and had lower fouling potentials
than common model foulants used in SWRO fouling studies;
BP HS&BB LMW0
10
20
30
40
50
60
70
80c. AOM.LMW
Foul
ant a
mou
nt (m
g/m
2 )
LC-OCD Analysis
Na+
Na++Ca2++Mg2+
Chapter 4
82
(iii) From the SWRO fouling tests, AFM measurements and XDLVO theory analysis,
the F.BP was found to be the major contributor, followed by F.LMW, while
F.HS&BB showed negligible impact to membrane fouling. In addition, initial
fouling (i.e., foulant-membrane interaction) was the key driver and fouling was
exacerbated in the present of divalent ions, i.e., Ca2+-carboxylate complexation
between foulant and membrane as well as foulant and foulant;
This chapter offered a detailed protocol of fractionation process from seawater organic
matters, which provided the possibility to explore more information from these
fractions on membrane fouling. Isolated organic fractions are more competitive with
the model organics. In addition, in this chapter, the implication is that existing seawater
pre-treatment method such as MF/UF is only able to partially remove the large MW
biopolymer, and not effective towards the small MW biopolymer, humic substances as
well as LMW, thus the RO fouling may only be delayed but cannot be prevented. The
NF membrane (i.e., MWCO ~ 300-500 Da) can remove majority of the DOMs in
seawater but the cost associated with NF pre-treatment needs to be considered. In
addition, the biofouling potential and the role of these DOMs in seawater on SWRO
fouling are not fully understood, and need further investigations in future studies.
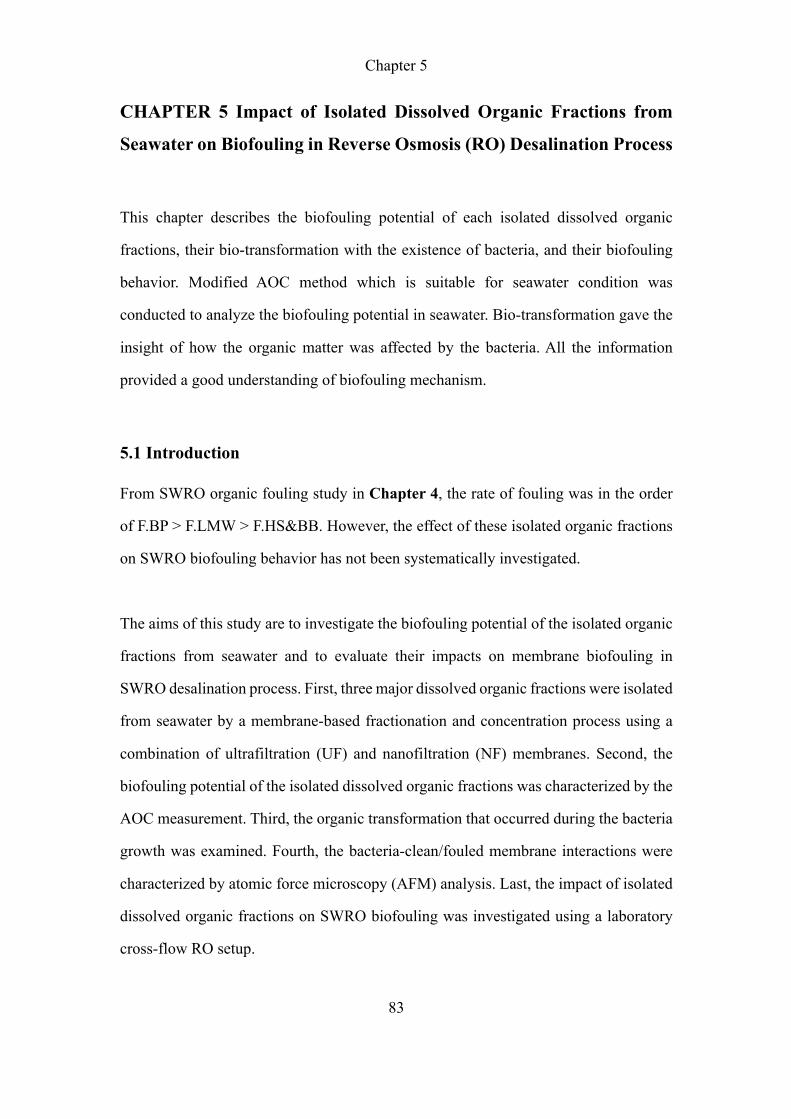
Chapter 5
83
CHAPTER 5 Impact of Isolated Dissolved Organic Fractions from
Seawater on Biofouling in Reverse Osmosis (RO) Desalination Process
This chapter describes the biofouling potential of each isolated dissolved organic
fractions, their bio-transformation with the existence of bacteria, and their biofouling
behavior. Modified AOC method which is suitable for seawater condition was
conducted to analyze the biofouling potential in seawater. Bio-transformation gave the
insight of how the organic matter was affected by the bacteria. All the information
provided a good understanding of biofouling mechanism.
5.1 Introduction
From SWRO organic fouling study in Chapter 4, the rate of fouling was in the order
of F.BP > F.LMW > F.HS&BB. However, the effect of these isolated organic fractions
on SWRO biofouling behavior has not been systematically investigated.
The aims of this study are to investigate the biofouling potential of the isolated organic
fractions from seawater and to evaluate their impacts on membrane biofouling in
SWRO desalination process. First, three major dissolved organic fractions were isolated
from seawater by a membrane-based fractionation and concentration process using a
combination of ultrafiltration (UF) and nanofiltration (NF) membranes. Second, the
biofouling potential of the isolated dissolved organic fractions was characterized by the
AOC measurement. Third, the organic transformation that occurred during the bacteria
growth was examined. Fourth, the bacteria-clean/fouled membrane interactions were
characterized by atomic force microscopy (AFM) analysis. Last, the impact of isolated
dissolved organic fractions on SWRO biofouling was investigated using a laboratory
cross-flow RO setup.
Chapter 5
84
5.2. Materials and Methods
5.2.1 Fractionation and Concentration of Dissolved Organic Fractions from
Seawater
The collection of seawater was described in Section 3.3.1. Additional inorganic salts
such as NaCl, MgSO4·6H2O, and CaCl2 were added to adjust the ions concentrations to
level similar to seawater. ICP-OES was used to measure the ionic concentration.
5.2.2 Assimilable Organic Carbon (AOC) Measurement
As shown in Figure 5.1, to obtain the growth medium, each isolated dissolved organic
fraction (10 mL, ~0.5 mg-C/L) was first filtered through a 0.22 μm PES syringe filter
(Millipore, USA) into a 40 mL AOC-free vial. The protocol of AOC measurement can
refer to Section 3.4.4.
Figure 5.1 The illustrations of (i) inoculum preparation, (ii) sample preparation and (iii) cell count measurement in AOC analysis.
Chapter 5
85
5.2.3 Organic Transformation During Bacteria Growth in Isolated Dissolved
Organic Fractions
Vibrio sp. B2 was selected as model bacterium. The preparation of the stock solution
was described in Section 3.3.4. The preparation of growth medium of isolated dissolved
organic fraction was same as described in Figure 5.1(ii). The Vibrio sp. B2 inoculum
was injected into each vial to achieve an approximate cell count of 6×10⁵ cells/mL, then
was incubated at 30℃ and 40 rpm for 3 days. A blank test with only the salts solution,
i.e., carbon-free synthetic seawater, was conducted to analyze the background from the
inoculum alone (Supporting Information). The organic compounds in each test solution
were characterized by the LC-OCD and F-EEM analyses.
5.2.4 Atomic Force Microscopy (AFM) Measurement
The adhesion and cohesion force between bacteria-virgin RO membrane, bacteria-F.BP,
bacteria-F.HS&BB, bacteria-F.LMW, and bacteria-bacteria were examined by AFM.
The procedure was described in Section 3.4.9.
5.2.5 Impact of Isolated Dissolved Organic Fractions on SWRO biofouling
5.2.5.1 RO system and Biofouling Experiment
The RO setup has been described in Section 3.1.1. The commercial RO membrane
(SW30-HR, DOW FilmTec, USA) with an effective area of 0.0045 m2 was used. The
RO membrane was soaked in DI water for 24 h prior use and was compacted at 6.1
MPa for at least 12 hours with DI water to achieve a stabilized permeate flux. Then, the
DI water in feed tank was replaced to the test solution with isolated dissolved organic
fraction (DOC = 0.5 mg-C/L). The initial flux was set at 30 L/m2h and crossflow
velocity of 0.17 m/s. The RO system was operated in a fully recycled mode, where the
retentate and permeate were returned to the feed tank to maintain constant volume and
Chapter 5
86
concentration. To initiate biofouling, the Vibrio sp. B2 stock solution (Section 3.3.4)
was injected at a flowrate of 0.5 mL/min by an injection pump (ELDEX, Model 5979
OptosPump 2HM) into the feed line to achieve an average cell concentration of 1.5×10⁴
cells/mL. The bacteria stock solution was replaced every 2 days. To prevent the feed
tank from turning into a bioreactor, 2 units of 0.2 µm cartridge filters were installed at
the retentate line before returning to the feed tank and the feed solution was replenished
daily. The biofouling experiments lasted for 6 days.
5.2.5.2 Membrane Autopsy Analysis
The fouled membrane was taken out from RO crossflow cell after 6-day operation. The
extraction of foulant can refer to Section 4.2.3. The foulant solution was further
analyzed using LC-OCD, F-EEM, and EPS analysis. Biofilm on membrane surface was
analyzed by confocal laser scanning microscopy (CLSM). The procedure of CLSM was
summarized in Section 3.4.5.
5.3 Results and Discussion
5.3.1 Isolated Dissolved Organic Fractions from Seawater
As shown in Figure 5.2, the dissolved organic content in seawater contained 6% BP,
52% HS&BB and 42% LMW. These dissolved organic compounds were successfully
fractionated and concentrated into three major fractions, i.e., F.BP (MW >1000 Da),
F.HS&BB (MW 350-1000 Da) and F.LMW (MW <350 Da). For each fraction, the final
organic concentration was adjusted to DOC = 0.5 mg-C/L while the ions concentrations
were adjusted to level similar to the original seawater as summarized in Table 5.1.
These solutions will be used in the subsequent tests.
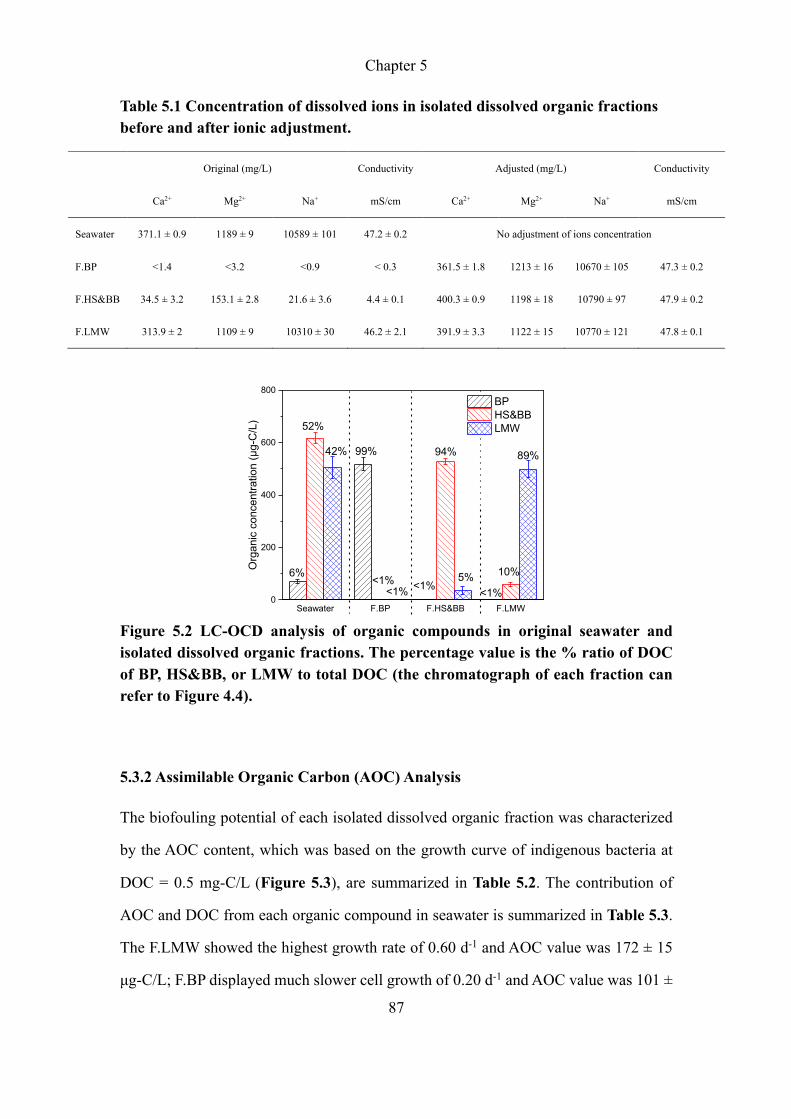
Chapter 5
87
Table 5.1 Concentration of dissolved ions in isolated dissolved organic fractions before and after ionic adjustment.
Original (mg/L) Conductivity Adjusted (mg/L) Conductivity
Ca2+ Mg2+ Na+ mS/cm Ca2+ Mg2+ Na+ mS/cm
Seawater 371.1 ± 0.9 1189 ± 9 10589 ± 101 47.2 ± 0.2 No adjustment of ions concentration
F.BP <1.4 <3.2 <0.9 < 0.3 361.5 ± 1.8 1213 ± 16 10670 ± 105 47.3 ± 0.2
F.HS&BB 34.5 ± 3.2 153.1 ± 2.8 21.6 ± 3.6 4.4 ± 0.1 400.3 ± 0.9 1198 ± 18 10790 ± 97 47.9 ± 0.2
F.LMW 313.9 ± 2 1109 ± 9 10310 ± 30 46.2 ± 2.1 391.9 ± 3.3 1122 ± 15 10770 ± 121 47.8 ± 0.1
Figure 5.2 LC-OCD analysis of organic compounds in original seawater and isolated dissolved organic fractions. The percentage value is the % ratio of DOC of BP, HS&BB, or LMW to total DOC (the chromatograph of each fraction can refer to Figure 4.4).
5.3.2 Assimilable Organic Carbon (AOC) Analysis
The biofouling potential of each isolated dissolved organic fraction was characterized
by the AOC content, which was based on the growth curve of indigenous bacteria at
DOC = 0.5 mg-C/L (Figure 5.3), are summarized in Table 5.2. The contribution of
AOC and DOC from each organic compound in seawater is summarized in Table 5.3.
The F.LMW showed the highest growth rate of 0.60 d-1 and AOC value was 172 ± 15
μg-C/L; F.BP displayed much slower cell growth of 0.20 d-1 and AOC value was 101 ±
Seawater F.BP F.HS&BB F.LMW0
200
400
600
800
10%
<1%5%
<1%<1% <1%
89%94%99%42%
52%
Org
anic
con
cent
ratio
n (μ
g-C
/L)
6%
BP HS&BB LMW

Chapter 5
88
32 μg-C/L; F.HS&BB showed the lowest cell growth of 0.16 d-1 and AOC value was
43 ± 13 μg-C/L. Thus, the AOC/DOC ratio was in the sequence of F.LMW (~35%) >
F.BP (~19%) > F.HS&BB (~8%). Typically, humic substances showed high resistance
to biodegradation (van der Kooij, Hijnen et al. 1989), thus there was poor correlation
between AOC and HS&BB (Jeong and Vigneswaran 2015). Unlike HS&BB, LMW
which composed of high proportion of protein-like organics (Chapter 4) as well as BP
which mainly composed of protein and polysaccharides (Villacorte, Ekowati et al.
2017), could serve as the nutrient source in supporting microbial growth, thus both gave
higher AOC/DOC readings. In addition, when comparing F.LWM with F.BP, the cell
growth rate was ~ ×3 higher while the AOC concentration was only about ×1.7 higher,
could be attributed to the smaller molecular weight of LMW (MW <350 Da) compared
to BP (MW >1000 Da), which was more readily consumed by microorganisms (Passow
2002, Villacorte, Ekowati et al. 2017). This finding was important as water samples
with the same amount of AOC but different organic compositions, could potentially
result in different SWRO biofouling rates.
Figure 5.3 Growth curve of indigenous inoculum in different isolated dissolved organic fractions from seawater. Initial concentration of organic in each fraction = 0.5 mg-C/L (Error bars for n = 3).
0 1 2 3 4 5 6 7 8 9 100
2
4
6
8
10
12
14
16
18
20
22
24
Nor
mal
ized
live
cel
l cou
nt (×
106 c
ells
/L)
Time (days)
Seawater F.BP F.HS&BB F.LMW
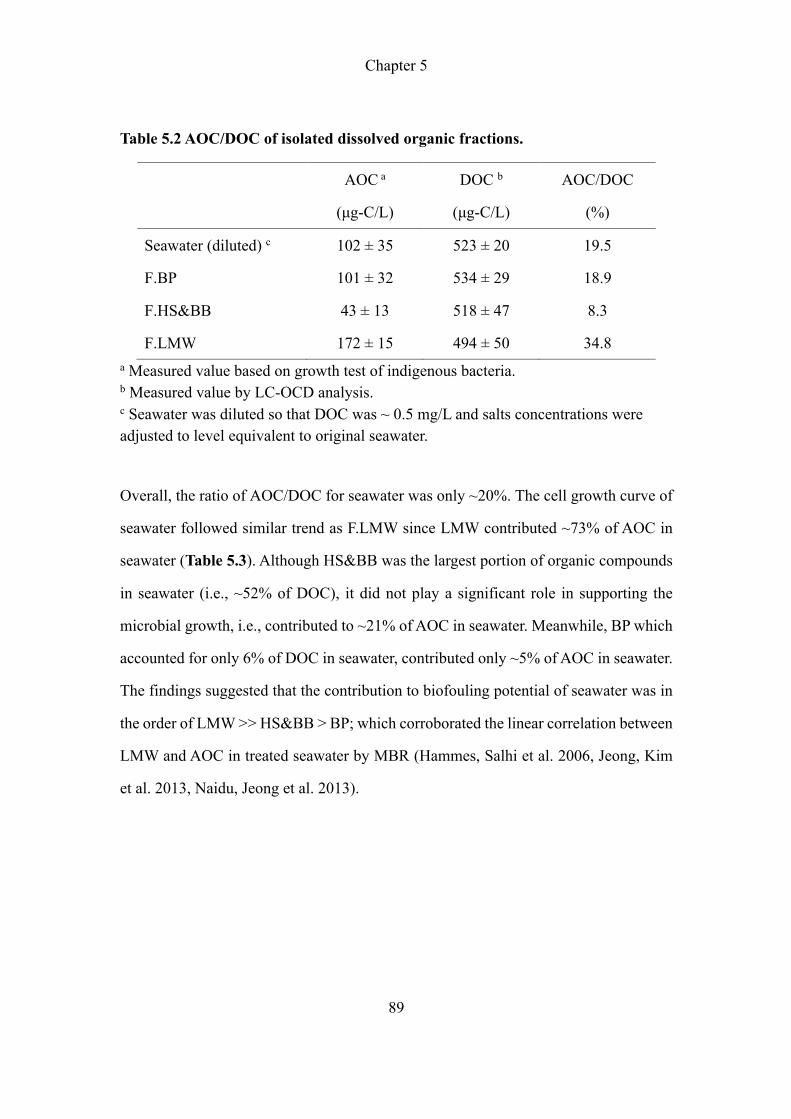
Chapter 5
89
Table 5.2 AOC/DOC of isolated dissolved organic fractions.
AOC a
(μg-C/L)
DOC b
(μg-C/L)
AOC/DOC
(%)
Seawater (diluted) c 102 ± 35 523 ± 20 19.5
F.BP 101 ± 32 534 ± 29 18.9
F.HS&BB 43 ± 13 518 ± 47 8.3
F.LMW 172 ± 15 494 ± 50 34.8 a Measured value based on growth test of indigenous bacteria. b Measured value by LC-OCD analysis. c Seawater was diluted so that DOC was ~ 0.5 mg/L and salts concentrations were adjusted to level equivalent to original seawater.
Overall, the ratio of AOC/DOC for seawater was only ~20%. The cell growth curve of
seawater followed similar trend as F.LMW since LMW contributed ~73% of AOC in
seawater (Table 5.3). Although HS&BB was the largest portion of organic compounds
in seawater (i.e., ~52% of DOC), it did not play a significant role in supporting the
microbial growth, i.e., contributed to ~21% of AOC in seawater. Meanwhile, BP which
accounted for only 6% of DOC in seawater, contributed only ~5% of AOC in seawater.
The findings suggested that the contribution to biofouling potential of seawater was in
the order of LMW >> HS&BB > BP; which corroborated the linear correlation between
LMW and AOC in treated seawater by MBR (Hammes, Salhi et al. 2006, Jeong, Kim
et al. 2013, Naidu, Jeong et al. 2013).
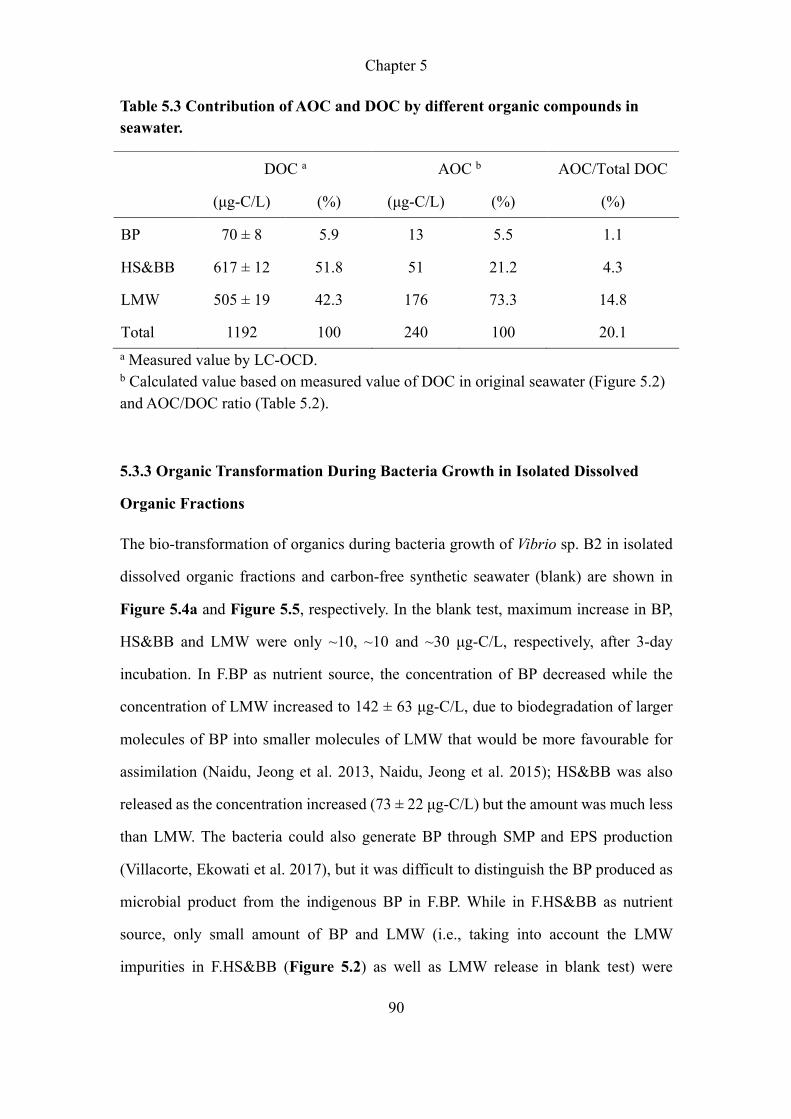
Chapter 5
90
Table 5.3 Contribution of AOC and DOC by different organic compounds in seawater.
DOC a AOC b AOC/Total DOC
(μg-C/L) (%) (μg-C/L) (%) (%)
BP 70 ± 8 5.9 13 5.5 1.1
HS&BB 617 ± 12 51.8 51 21.2 4.3
LMW 505 ± 19 42.3 176 73.3 14.8
Total 1192 100 240 100 20.1 a Measured value by LC-OCD. b Calculated value based on measured value of DOC in original seawater (Figure 5.2) and AOC/DOC ratio (Table 5.2).
5.3.3 Organic Transformation During Bacteria Growth in Isolated Dissolved
Organic Fractions
The bio-transformation of organics during bacteria growth of Vibrio sp. B2 in isolated
dissolved organic fractions and carbon-free synthetic seawater (blank) are shown in
Figure 5.4a and Figure 5.5, respectively. In the blank test, maximum increase in BP,
HS&BB and LMW were only ~10, ~10 and ~30 μg-C/L, respectively, after 3-day
incubation. In F.BP as nutrient source, the concentration of BP decreased while the
concentration of LMW increased to 142 ± 63 μg-C/L, due to biodegradation of larger
molecules of BP into smaller molecules of LMW that would be more favourable for
assimilation (Naidu, Jeong et al. 2013, Naidu, Jeong et al. 2015); HS&BB was also
released as the concentration increased (73 ± 22 μg-C/L) but the amount was much less
than LMW. The bacteria could also generate BP through SMP and EPS production
(Villacorte, Ekowati et al. 2017), but it was difficult to distinguish the BP produced as
microbial product from the indigenous BP in F.BP. While in F.HS&BB as nutrient
source, only small amount of BP and LMW (i.e., taking into account the LMW
impurities in F.HS&BB (Figure 5.2) as well as LMW release in blank test) were
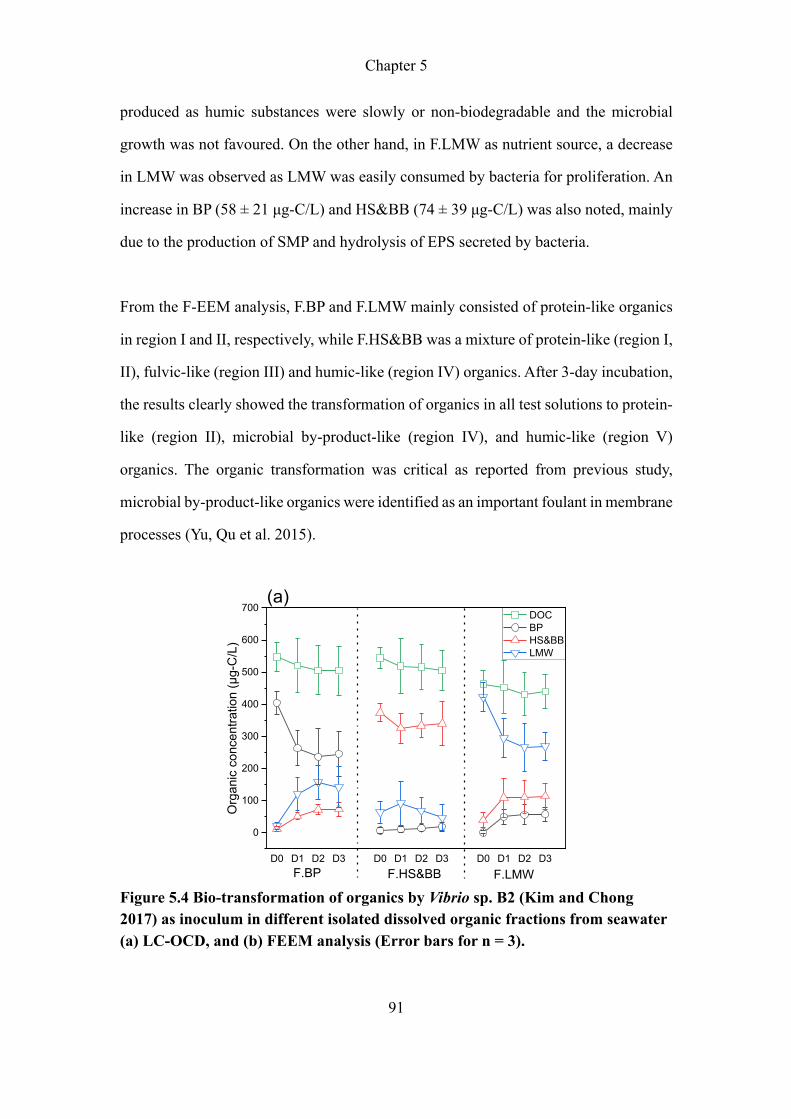
Chapter 5
91
produced as humic substances were slowly or non-biodegradable and the microbial
growth was not favoured. On the other hand, in F.LMW as nutrient source, a decrease
in LMW was observed as LMW was easily consumed by bacteria for proliferation. An
increase in BP (58 ± 21 μg-C/L) and HS&BB (74 ± 39 μg-C/L) was also noted, mainly
due to the production of SMP and hydrolysis of EPS secreted by bacteria.
From the F-EEM analysis, F.BP and F.LMW mainly consisted of protein-like organics
in region I and II, respectively, while F.HS&BB was a mixture of protein-like (region I,
II), fulvic-like (region III) and humic-like (region IV) organics. After 3-day incubation,
the results clearly showed the transformation of organics in all test solutions to protein-
like (region II), microbial by-product-like (region IV), and humic-like (region V)
organics. The organic transformation was critical as reported from previous study,
microbial by-product-like organics were identified as an important foulant in membrane
processes (Yu, Qu et al. 2015).
Figure 5.4 Bio-transformation of organics by Vibrio sp. B2 (Kim and Chong 2017) as inoculum in different isolated dissolved organic fractions from seawater (a) LC-OCD, and (b) FEEM analysis (Error bars for n = 3).
DOC BP HS&BB LMW
D0 D1 D2 D3 D0 D1 D2 D3 D0 D1 D2 D3
0
100
200
300
400
500
600
700
F.LMWF.HS&BB
Org
anic
con
cent
ratio
n (μ
g-C
/L)
F.BP
(a)
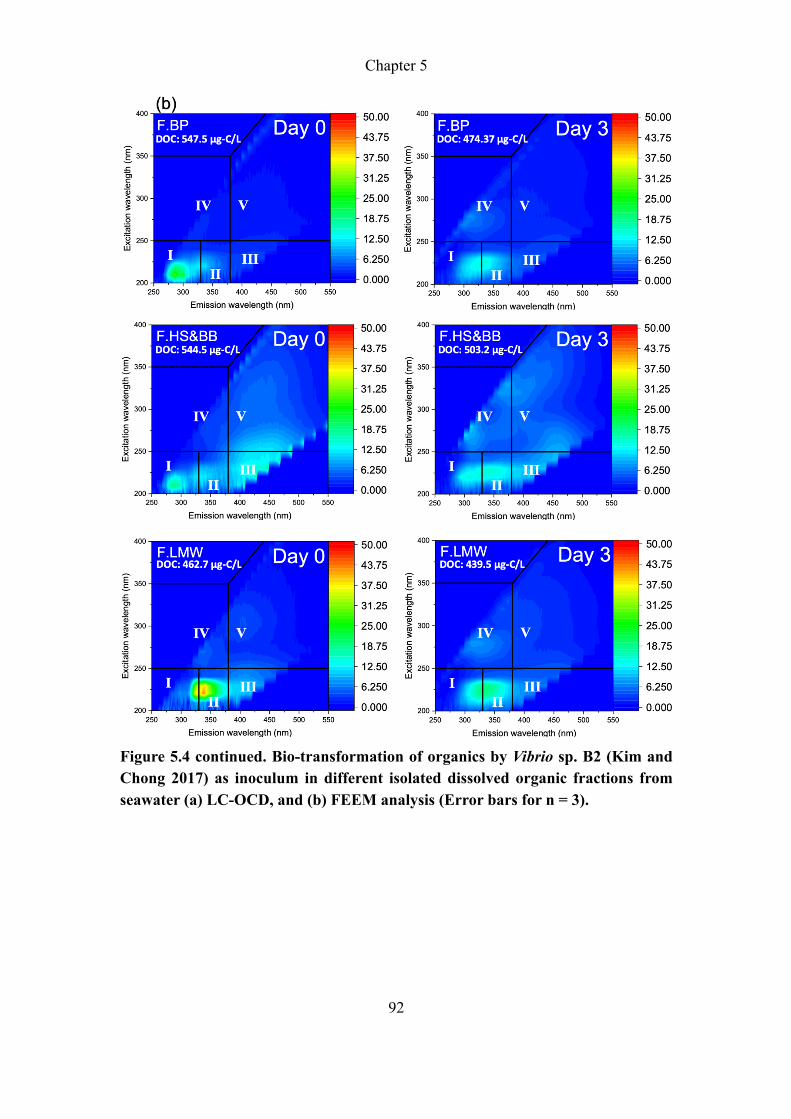
Chapter 5
92
Figure 5.4 continued. Bio-transformation of organics by Vibrio sp. B2 (Kim and Chong 2017) as inoculum in different isolated dissolved organic fractions from seawater (a) LC-OCD, and (b) FEEM analysis (Error bars for n = 3).
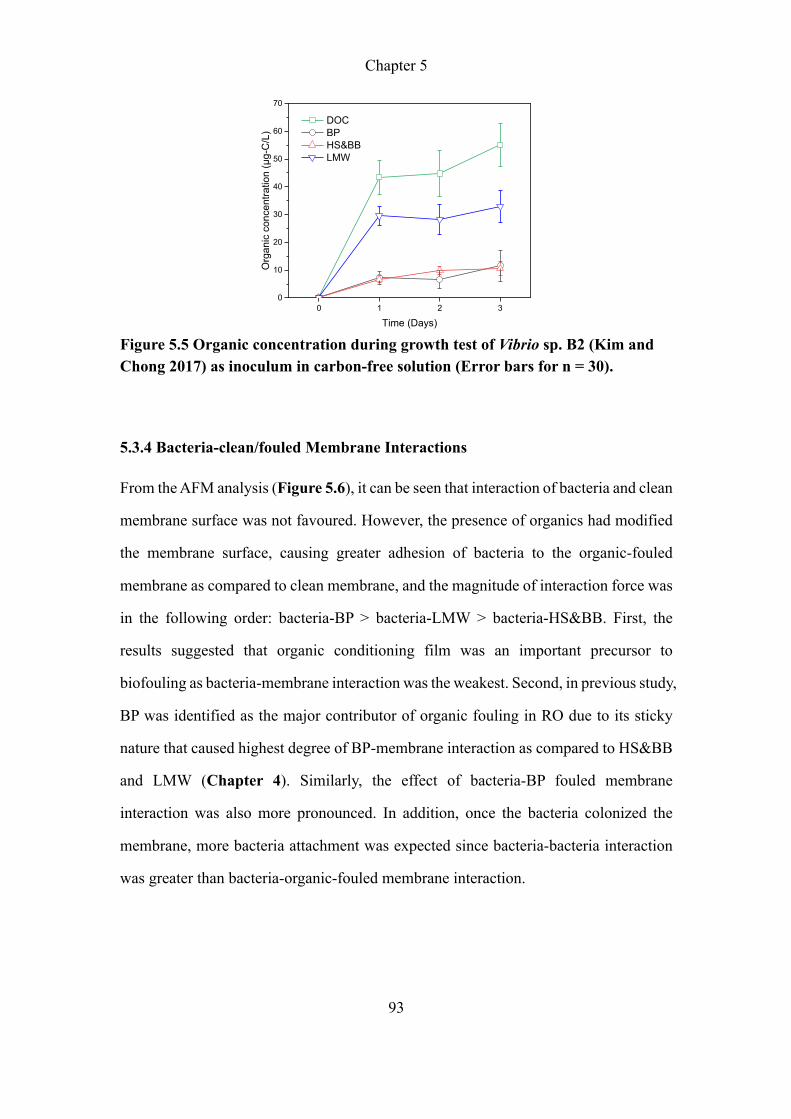
Chapter 5
93
Figure 5.5 Organic concentration during growth test of Vibrio sp. B2 (Kim and Chong 2017) as inoculum in carbon-free solution (Error bars for n = 30).
5.3.4 Bacteria-clean/fouled Membrane Interactions
From the AFM analysis (Figure 5.6), it can be seen that interaction of bacteria and clean
membrane surface was not favoured. However, the presence of organics had modified
the membrane surface, causing greater adhesion of bacteria to the organic-fouled
membrane as compared to clean membrane, and the magnitude of interaction force was
in the following order: bacteria-BP > bacteria-LMW > bacteria-HS&BB. First, the
results suggested that organic conditioning film was an important precursor to
biofouling as bacteria-membrane interaction was the weakest. Second, in previous study,
BP was identified as the major contributor of organic fouling in RO due to its sticky
nature that caused highest degree of BP-membrane interaction as compared to HS&BB
and LMW (Chapter 4). Similarly, the effect of bacteria-BP fouled membrane
interaction was also more pronounced. In addition, once the bacteria colonized the
membrane, more bacteria attachment was expected since bacteria-bacteria interaction
was greater than bacteria-organic-fouled membrane interaction.
0 1 2 30
10
20
30
40
50
60
70
Org
anic
con
cent
ratio
n (μ
g-C
/L)
Time (Days)
DOC BP HS&BB LMW
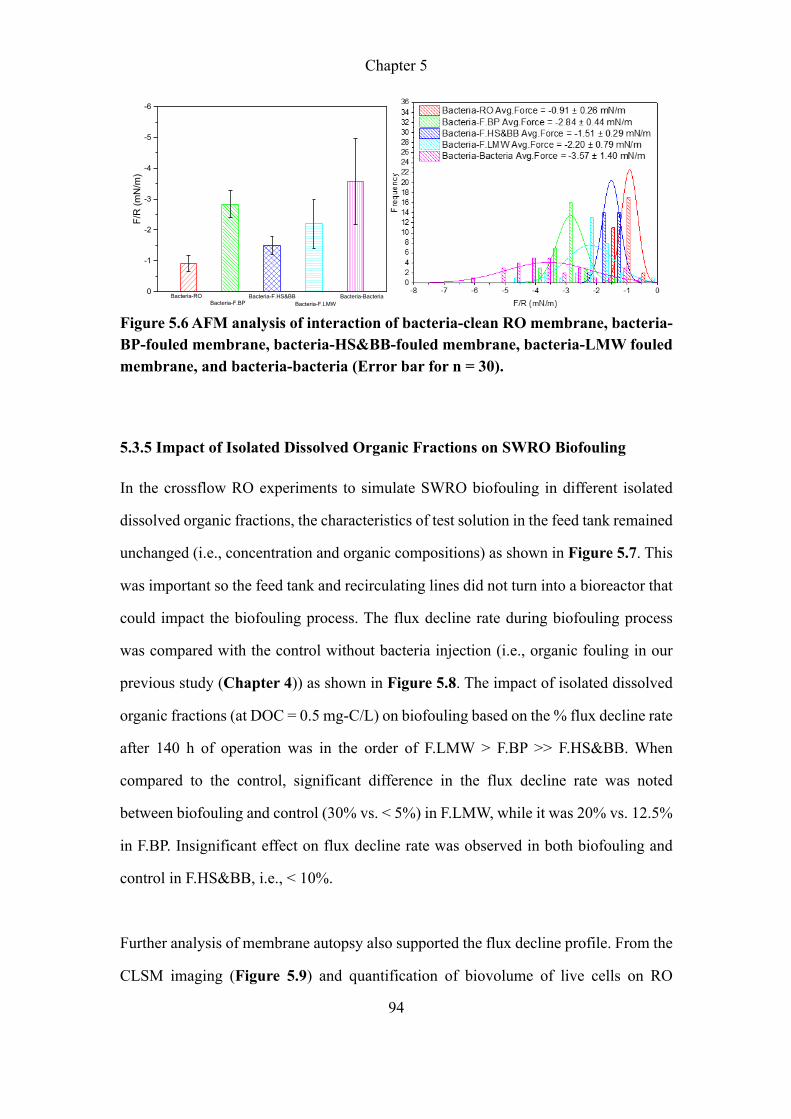
Chapter 5
94
Figure 5.6 AFM analysis of interaction of bacteria-clean RO membrane, bacteria-BP-fouled membrane, bacteria-HS&BB-fouled membrane, bacteria-LMW fouled membrane, and bacteria-bacteria (Error bar for n = 30).
5.3.5 Impact of Isolated Dissolved Organic Fractions on SWRO Biofouling
In the crossflow RO experiments to simulate SWRO biofouling in different isolated
dissolved organic fractions, the characteristics of test solution in the feed tank remained
unchanged (i.e., concentration and organic compositions) as shown in Figure 5.7. This
was important so the feed tank and recirculating lines did not turn into a bioreactor that
could impact the biofouling process. The flux decline rate during biofouling process
was compared with the control without bacteria injection (i.e., organic fouling in our
previous study (Chapter 4)) as shown in Figure 5.8. The impact of isolated dissolved
organic fractions (at DOC = 0.5 mg-C/L) on biofouling based on the % flux decline rate
after 140 h of operation was in the order of F.LMW > F.BP >> F.HS&BB. When
compared to the control, significant difference in the flux decline rate was noted
between biofouling and control (30% vs. < 5%) in F.LMW, while it was 20% vs. 12.5%
in F.BP. Insignificant effect on flux decline rate was observed in both biofouling and
control in F.HS&BB, i.e., < 10%.
Further analysis of membrane autopsy also supported the flux decline profile. From the
CLSM imaging (Figure 5.9) and quantification of biovolume of live cells on RO
0
-1
-2
-3
-4
-5
-6
Bacteria-BacteriaBacteria-F.LMW
Bacteria-F.HS&BBBacteria-F.BP
F/R
(mN
/m)
Bacteria-RO

Chapter 5
95
membranes (Figure 5.8a), higher value of 15.5±0.5 μm3/μm2 was noted for bio-fouled
membrane in F.LMW than 12.5±1.3 μm3/μm2 in F.BP. Whereas lowest value of 4.9±1.1
μm3/μm2 was reported in F.HS&BB. It shall be noted that the biovolume of dead cells
on RO membranes was negligible. The results agreed well with the AOC measurement,
i.e., F.LMW > F.BP > F.HS&BB, where greatest microbial growth rate was observed in
F.LMW as nutrient source.
Figure 5.7 Monitoring of organic profile in feed tank during SWRO biofouling test with different isolated dissolved organic fractions from seawater as RO feed (a) F.BP, (b) F.HS&BB, and (c) F.LMW.
Figure 5.8 Flux decline profile of RO biofouling by Vibrio sp. B2 (Kim and Chong 2017) in different isolated dissolved organic fractions from seawater. The control experiments were tests without the presence of bacteria, taken from our previous work (Chapter 4). Concentration of organic in each fraction = 0.5 mg-C/L.
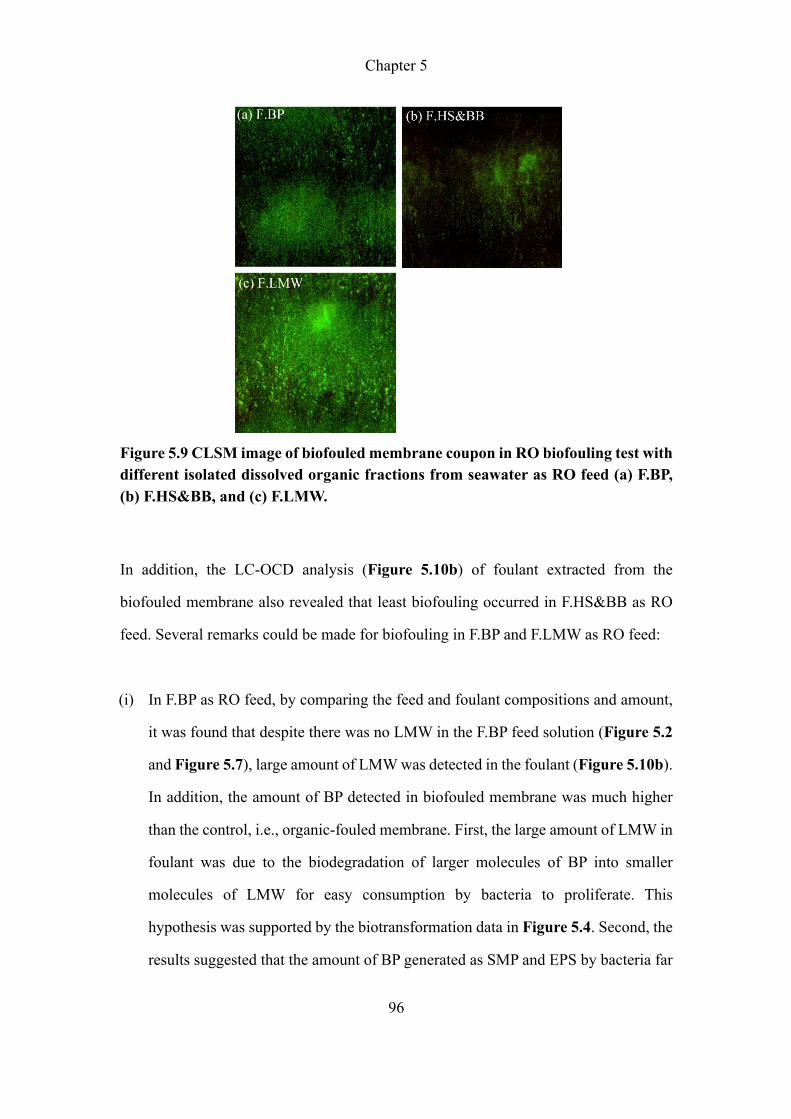
Chapter 5
96
Figure 5.9 CLSM image of biofouled membrane coupon in RO biofouling test with different isolated dissolved organic fractions from seawater as RO feed (a) F.BP, (b) F.HS&BB, and (c) F.LMW.
In addition, the LC-OCD analysis (Figure 5.10b) of foulant extracted from the
biofouled membrane also revealed that least biofouling occurred in F.HS&BB as RO
feed. Several remarks could be made for biofouling in F.BP and F.LMW as RO feed:
(i) In F.BP as RO feed, by comparing the feed and foulant compositions and amount,
it was found that despite there was no LMW in the F.BP feed solution (Figure 5.2
and Figure 5.7), large amount of LMW was detected in the foulant (Figure 5.10b).
In addition, the amount of BP detected in biofouled membrane was much higher
than the control, i.e., organic-fouled membrane. First, the large amount of LMW in
foulant was due to the biodegradation of larger molecules of BP into smaller
molecules of LMW for easy consumption by bacteria to proliferate. This
hypothesis was supported by the biotransformation data in Figure 5.4. Second, the
results suggested that the amount of BP generated as SMP and EPS by bacteria far
Chapter 5
97
exceeded the deposition of indigenous BP from F.BP feed solution. Note that LMW
could also be generated as part of the SMP and EPS.
(ii) In F.LMW as RO feed, the deposition of LMW originated from F.LMW onto clean
RO membrane was less favourable compared to BP in F.BP due to weaker LMW-
membrane interaction (Chapter 4). However, when LMW was consumed for
microbial growth, BP was generated as SMP and EPS, i.e., biotransformation of
LMW by bacteria as shown in Figure 5.4. Hence, RO membrane surface could be
modified as such it promoted subsequent bacteria deposition. Since the amount of
BP produced via biotransformation was relatively lower than the availability of BP
in F.BP, the initial biofouling rate in F.LMW was slower than F.BP (Figure 5.8,
from 0 to 30 h). However, once the BP conditioning layer was formed on the
membrane, with the continuous supply of LMW in F.LMW, in which the amount
was much higher than LMW obtained from the biodegradation of BP in F.BP,
resulted in greater microbial growth and production of SMP and EPS (i.e., BP and
LMW), thus the biofouling rate in F.LMW surpassed F.BP beyond 30 h (i.e., 30%
vs. 20% in flux decline after 140 h).
(iii) By comparing the flux decline profile and compositions of foulants extracted from
fouled membranes and controls, it was noted the sequence of flux decline was
F.LMW (30%) > F.BP (20%) > control F.BP (12.5%) >> control F.LMW (<5%),
the amount of BP in foulant was in the order of F.LMW > F.BP > control F.BP >>
control F.LMW, the amount of LMW in foulant was in the order of F.BP >
F.LMW >> control F.BP > control F.LMW. There was a good correlation between
flux decline and amount of BP in foulant. Note that majority of BP in foulant was
accumulated through generation of SMP and EPS rather than from deposition of
indigenous species. Based on these results and CLSM analysis, it was suggested
that biofilm with high number of cells embedded in matrix of SMP and EPS (i.e.,
in particular BP) could result in high hydraulic resistance and biofilm enhanced
Chapter 5
98
osmotic pressure effect that lower the flux.
The EPS (Figure 5.10c) and F-EEM analyses of foulants extracted from biofouled
membranes also supported the remarks above. The amount of EPS in foulant was in the
order of F.LMW > F.BP > F.HS&BB. It was noted that proteins occupied a large portion
of EPS compared to polysaccharides, which agreed well with previous work (Jeong et
al. 2013). Similarly, F-EEM analysis revealed that the foulant was mainly composed of
tyrosine protein-like (Region I), protein-like organics (Region II), and microbial by-
product-like organics (Region IV).
Overall, these findings are critical in providing the guidance for selection of efficient
seawater pretreatment method to mitigate membrane biofouling. Most of the reported
work focused on removing the biopolymer fraction by methods such as
coagulation/flocculation and membrane filtration or combinations prior RO process
(Jeong, Kim et al. 2013, Shutova, Karna et al. 2016). However, based on the AOC/DOC
ratio of organics in seawater (Table 5.2) and SWRO biofouling test in this study, the
role of indigenous BP in SWRO biofouling was less critical owing to its relatively low
concentration (i.e., only accounted for 6% of DOC and 5% of AOC in seawater). On
the other hand, LMW which accounted for >70% of AOC and 42% of DOC in seawater,
played a significant role in SWRO biofouling by supporting microbial growth that
contributed to the build-up of SMP and EPS (i.e., generation of BP). Even though
HS&BB occupied about 52% of DOC in seawater, i.e., major organic compound, it had
marginal role in SWRO biofouling. Therefore, seawater pretreatment prior RO process
shall focus on the removal of AOC rather than the removal of biopolymer.

Chapter 5
99
Figure 5.10 (a) Biovolume (μm3/μm2) of live and dead cells, (b) LC-OCD, (c) EPS (protein and polysaccharide), (d) FEEM of biofouled RO membranes by Vibrio sp. B2 (Kim and Chong 2017) in different isolated dissolved organic fractions from seawater. The control experiments in (b) were tests without the presence of bacteria, taken from our previous work (Chapter 4).
F.BP F.HS&BB F.LMW0
2
4
6
8
10
12
14
16
Biov
olum
e (μ
m3 /μ
m2 )
Live Dead
(a)
F.BP F.HS&BB F.LMW0
50
100
150
200
250
300
350
400Biofouling
Foul
ant a
mou
nt (m
g/m
2 )
BP HS&BB LMW
Control Control Biofouling Control Biofouling
AOM.LMW F.LMW
(b)
F.BP F.HS&BB F.LMW0
100
200
300
400
500
Foul
ant a
mou
nt (m
g/m
2 )
Protein Polysaccharide
(c)
250 300 350 400 450 500 550200
250
300
350
400
Emission wavelength (nm)
Exci
tatio
n w
avel
engt
h (n
m)
0.000
87.50
175.0
262.5
350.0
437.5
525.0
612.5
700.0(i) F.BP
VIV
III
III
(d)
250 300 350 400 450 500 550200
250
300
350
400
Emission wavelength (nm)
Exci
tatio
n w
avel
engt
h (n
m)
0.000
87.50
175.0
262.5
350.0
437.5
525.0
612.5
700.0(ii) F.HS&BB
IV V
III
III
250 300 350 400 450 500 550200
250
300
350
400
Emission wavelength (nm)
Exci
tatio
n w
avel
engt
h (n
m)
0.000
87.50
175.0
262.5
350.0
437.5
525.0
612.5
700.0(iii) F.LMW
IV V
III
III
Chapter 5
100
5.4. Conclusions
Natural organic matters (NOM) in seawater are critical in supporting bacterial growth
and biofilm formation that eventually lead to severe membrane biofouling in the
seawater reverse osmosis (SWRO) desalination process. To study the mechanisms of
SWRO biofouling, isolation and concentration was performed using a membrane-
based technique to separate the dissolved organic compounds in seawater into 3 major
fractions according to their molecular weights (MWs), namely, fractions of
biopolymers (F.BP, MW >1000 Da), humic substances and building blocks
(F.HS&BB, MW 350-1000 Da), and low molecular weight compounds (F.LMW, MW
<350 Da). The biofouling potential of the isolated dissolved organic fractions was
characterized by assimilable organic carbon (AOC) content and their impact on
SWRO biofouling was evaluated using Vibrio sp. B2 as model bacteria in a crossflow
RO system. The findings are summarized below:
(i) The AOC/DOC ratio of the isolated dissolved organic fractions was in the order
of F.LMW (~35%) > F.BP (~19%) > F.HS&BB (8%), and for seawater was ~20%.
The organic compositions of seawater were BP ~6%, HS&BB ~52% and LMW
~42%, thus the main contributor to AOC in seawater was LMW (>70%);
(ii) In SWRO biofouling study using isolated dissolved organic fractions at DOC =
0.5 mg-C/L as RO feed, F.LMW caused the most severe flux decline (30%),
followed by F.BP (20%), while insignificant effect in F.HS&BB (<10%). The
membrane autopsies data (i.e., CLSM, LC-OCD, EPS and FEEM analysis)
supported these findings;
(iii) In F.BP as RO feed, the BP preferentially formed a conditioning layer on the RO
membrane due to strong interaction of BP-membrane, followed by the deposition
of bacteria due to greater interaction of bacteria-BP than bacteria-membrane. The
BP was then biodegraded to LMW, which could be easily assimilated by bacteria
for proliferation. BP and LMW was generated as SMP and EPS. Note that the
hypothesis of biotransformation of organics was supported by the data obtained
from microbial growth in batch test;
(iv) On the other hand, in F.LMW as RO feed, due to weaker interaction of LMW-
membrane, the deposition of LMW onto membrane was not favourable. But
bacteria consumed LMW and produced BP as a by-product, which could then
Chapter 5
101
form a conditioning layer on the membrane surface. This process was slower
than the direct deposition of BP in F.BP, thus slower flux decline rate was
observed in F.LMW as compared to F.BP during the initial stage of biofouling.
However, due to continuous supply of LMW in F.LMW, in which the amount
was much higher than the amount of LMW generated through biodegradation of
BP in F.BP, rapid microbial growth and generation of SMP and EPS were
observed, thus biofouling rate in F.LMW surpassed F.BP at the later stage of
biofouling process;
(v) The large amount of BP and LMW presence (i.e., HS&BB was insignificant) in
the foulants of biofouled membranes in F.BP and F.LMW as RO feed were not
from the deposition of indigenous BP and LMW from the bulk feed solution, but
rather from the generation of BP and LMW during microbial growth on the
membrane surface through biodegradation of BP in F.BP and production of SMP
and EPS in both F.BP and F.LMW. The accumulation of bacteria cells embedded
in matrix of SMP and EPS (i.e., in particular BP) formed a biofilm that caused
an increase in hydraulic resistance and biofilm-enhanced osmotic pressure effect,
thus decline in flux.
Based on the above information obtained for isolated dissolved organic fractions,
when translated to actual seawater, the following conclusion could be made. Even
though HS&BB was the major organic compound in seawater (~52%), it had
marginal role in SWRO biofouling. Meanwhile, the role of indigenous BP in SWRO
biofouling was less critical owing to its relatively low concentration. On the other
hand, LMW which accounted for >70% of AOC and ~42% of DOC in seawater,
played a significant role in SWRO biofouling by supporting microbial growth that
contributed to the build-up of SMP and EPS (i.e., in particular BP). Therefore,
seawater pretreatment prior RO process shall focus on the removal of LWM (i.e.,
AOC) rather than the removal of biopolymer.
Chapter 6
102
CHAPTER 6 Mitigating Reverse Osmosis (RO) Fouling in Seawater
Desalination Process by Removing Low Molecular Weight (LMW)
Organic Compounds with Nanofiltration (NF) Pretreatment
This chapter describes the fouling mitigation by using NF pretreatment. Chapter 4 &
5 have discussed the organic fouling and biofouling mechanisms, therefore, a novel
pretreatment method was came up with to effectively reduce the fouling in SWRO
process. Many studies have shown the advantages of using UF membrane as the
pretreatment process, but with the development of the material science, ground-
breaking membrane fabrication process has thrived. Therefore, using NF membrane
as the pretreatment process could be an alternative option in seawater desalination
process.
6.1 Introduction
Conventional pretreatment such as ultrafiltration (UF), pore size 0.1 – 0.001 µm,
could only remove particulate matters and large molecular weight (MW) organic
compounds based on size exclusion mechanisms (Anis, Hashaikeh et al. 2019,
Badruzzaman, Voutchkov et al. 2019). As shown in Chapter 6, LMW (MW < 350
Da) accounted for more than >70% of AOC in seawater, thus resulted in severe
SWRO biofouling. Therefore, seawater pretreatment prior RO process shall focus on
the removal of AOC (i.e., LMW). In this study, NF pretreatment was assessed and its
performance was compared with conventional UF pretreatment. SWRO fouling
phenomenon by using NF permeate as RO feed water was also examined.
6.2 Materials and Methods
6.2.1 NF pretreatment and RO fouling experiment
The collection of seawater has been described in Section 3.3.1. The schematic
diagram of seawater treatment process is illustrated in Figure 6.1. In this study, one
type of hollow fiber UF membrane and three types of NF membranes (i.e., NF270,
Chapter 6
103
NF1, and NF2) were employed to pretreat the raw seawater (Section 3.2). MWCOs
of NF membranes were determined followed the method in Section 4.2.1.2. It should
be noted that a crossflow setup (with an effective area of 0.0186 m2) was used for
NF270 pretreatment process. The operating pressure of NF process was set at 4 bars.
All NF processes were divided into two stages to evaluate the membrane performance:
(i) concentration stage up to 50% recovery (i.e., against the elevated concentration of
organic/inorganic substances), where the retentate was completely recycled to the
feed tank, while the permeate was collected into a container. 20 L of raw seawater
(i.e., feed water) was used to obtain 10 L of permeate; and (ii) long-term performance
at concentration equivalent to 50% recovery (i.e., extended test for another 72 hours
after step (i)). Here, the retentate and permeate were fully recycled back to the feed
tank.
Then, the collected permeates from pretreatment process were further employed as
feed water for the downstream RO process. A crossflow RO setup (with effective area
of 0.0045 m2) was used for the fouling study. Commercial SW-30HR was used in this
study. The description of the RO system can refer to Section 3.1.1. Initial water flux
was set at 30 L/m2h. The flux decline profile was regarded as fouling indicator and
the operation duration was 6 days.
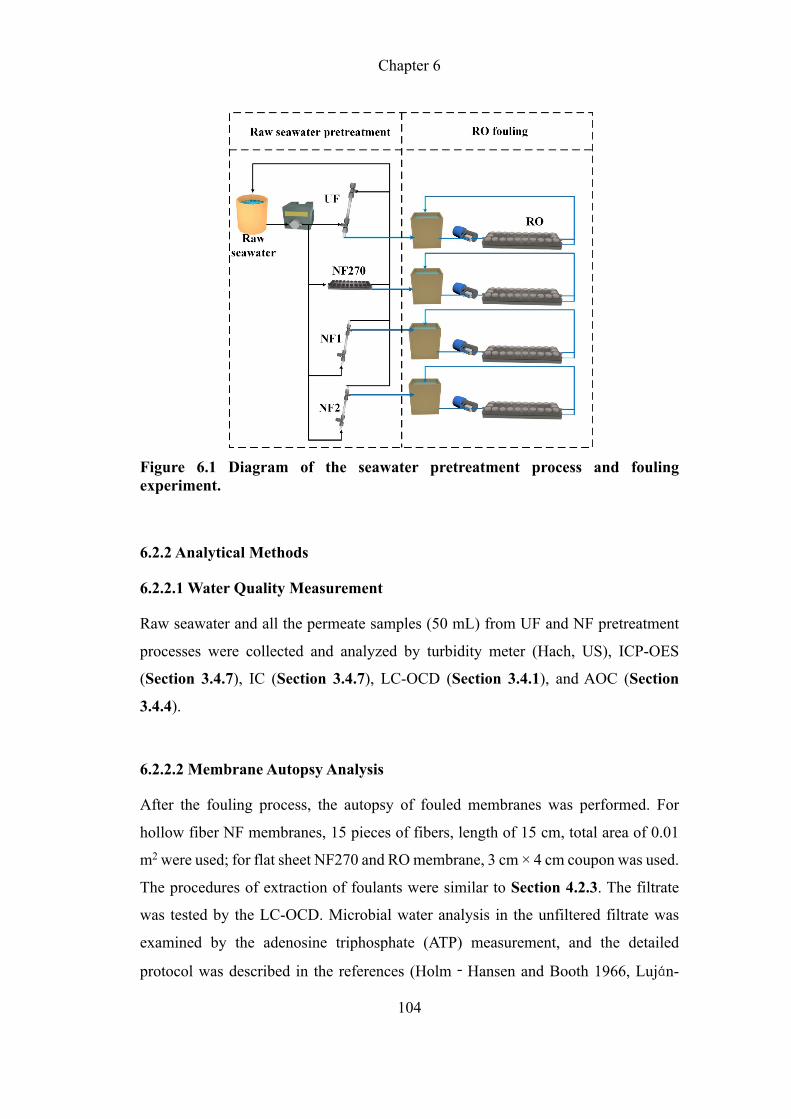
Chapter 6
104
Figure 6.1 Diagram of the seawater pretreatment process and fouling experiment.
6.2.2 Analytical Methods
6.2.2.1 Water Quality Measurement
Raw seawater and all the permeate samples (50 mL) from UF and NF pretreatment
processes were collected and analyzed by turbidity meter (Hach, US), ICP-OES
(Section 3.4.7), IC (Section 3.4.7), LC-OCD (Section 3.4.1), and AOC (Section
3.4.4).
6.2.2.2 Membrane Autopsy Analysis
After the fouling process, the autopsy of fouled membranes was performed. For
hollow fiber NF membranes, 15 pieces of fibers, length of 15 cm, total area of 0.01
m2 were used; for flat sheet NF270 and RO membrane, 3 cm × 4 cm coupon was used.
The procedures of extraction of foulants were similar to Section 4.2.3. The filtrate
was tested by the LC-OCD. Microbial water analysis in the unfiltered filtrate was
examined by the adenosine triphosphate (ATP) measurement, and the detailed
protocol was described in the references (Holm�Hansen and Booth 1966, Luj�n-
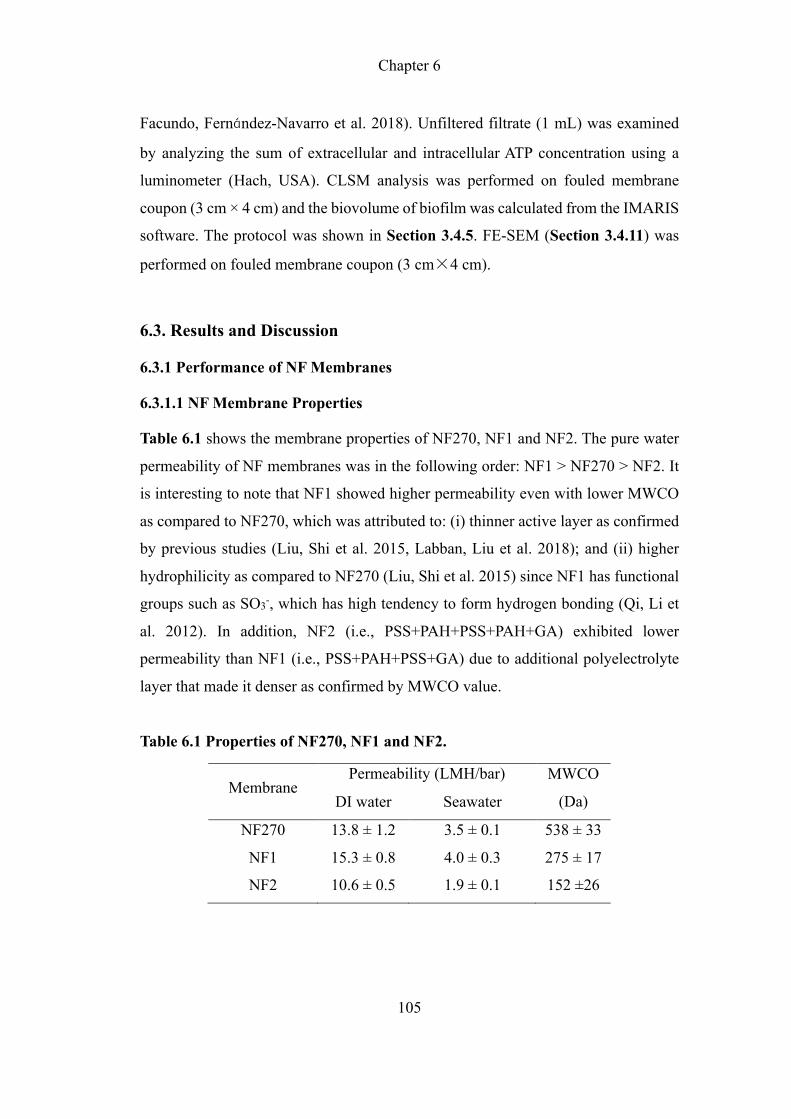
Chapter 6
105
Facundo, Fern�ndez-Navarro et al. 2018). Unfiltered filtrate (1 mL) was examined
by analyzing the sum of extracellular and intracellular ATP concentration using a
luminometer (Hach, USA). CLSM analysis was performed on fouled membrane
coupon (3 cm × 4 cm) and the biovolume of biofilm was calculated from the IMARIS
software. The protocol was shown in Section 3.4.5. FE-SEM (Section 3.4.11) was
performed on fouled membrane coupon (3 cm�4 cm).
6.3. Results and Discussion
6.3.1 Performance of NF Membranes
6.3.1.1 NF Membrane Properties
Table 6.1 shows the membrane properties of NF270, NF1 and NF2. The pure water
permeability of NF membranes was in the following order: NF1 > NF270 > NF2. It
is interesting to note that NF1 showed higher permeability even with lower MWCO
as compared to NF270, which was attributed to: (i) thinner active layer as confirmed
by previous studies (Liu, Shi et al. 2015, Labban, Liu et al. 2018); and (ii) higher
hydrophilicity as compared to NF270 (Liu, Shi et al. 2015) since NF1 has functional
groups such as SO3-, which has high tendency to form hydrogen bonding (Qi, Li et
al. 2012). In addition, NF2 (i.e., PSS+PAH+PSS+PAH+GA) exhibited lower
permeability than NF1 (i.e., PSS+PAH+PSS+GA) due to additional polyelectrolyte
layer that made it denser as confirmed by MWCO value.
Table 6.1 Properties of NF270, NF1 and NF2.
Membrane Permeability (LMH/bar) MWCO
(Da) DI water Seawater
NF270 13.8 ± 1.2 3.5 ± 0.1 538 ± 33
NF1 15.3 ± 0.8 4.0 ± 0.3 275 ± 17
NF2 10.6 ± 0.5 1.9 ± 0.1 152 ±26

Chapter 6
106
6.3.1.2 Organic and Salt Rejection
Table 6.2 summarizes the water quality of raw seawater, UF and NF permeates. Only
27% of the large size biopolymers (BP) was removed by the UF with MWCO of 150
kDa, whereas humic substances (HS), building blocks (BB), and low molecular
weight (LMW) compounds are not captured, thus became the potential foulants for
the downstream RO process. In contrast, it is not surprising that the dissolved organic
carbon (DOC) rejection of the NF was much higher than UF with the following order
of NF2 (77%) > NF1 (71%) > NF270 (61%). In addition, the assimilable organic
carbon (AOC) removal was in the order of NF2 > NF1 > NF270 > UF. UF was poor
in AOC removal because majority of AOC in seawater was contributed by LMW,
which was not captured by UF (i.e., almost no removal of LMW). NF membranes
was shown to remove >50% of AOC in seawater, thus could significantly reduce the
biofouling potential of RO feed water.
In general, UF membrane did not remove any salts due to large pore size. The NF
membranes showed relatively high rejection of Ca2+, Mg2+, and SO42- with minimal
rejection of Na+. As shown in Table 6.2, NF1 and NF2 membranes showed better
multivalent rejection as compared to NF270, where NF2 removed ~75% of Ca2+ and
~90% of Mg2+ and SO42- which was comparable to commercial NF90 which required
much higher operating pressure (i.e., > 30 bar) to achieve similar performance (Kaya,
Sert et al. 2015). NF1 showed 66% of Ca2+ rejection and 80% of Mg2+ rejection,
which was lower than that of NF2 but higher than NF270 whose Ca2+ and Mg2+
rejection were 41% and 32%, respectively. However, the rejection of SO42- of NF1
(85%) was lower than that of NF270 (92%), owing to the surface charge where
NF270 appeared more negative charge than NF1. The higher rejection of Mg2+
compared to Ca2+ can be described by the ionic diffusivity and Stoke radius of Mg2+
and Ca2+ (Wadekar and Vidic 2017). The higher rejection of SO42- compared to Ca2+
can be explained by electrical interactions (Labban, Liu et al. 2017). The higher
rejection properties of NF1 and NF2 towards Ca2+ and Mg2+ were due to electrostatic
repulsion with the positively charged surface fabricated from layer-by-layer (LBL)
polyelectrolyte deposition followed by the glutaraldehyde (GA) crosslinking,
whereas NF270 was made from polyamides with negatively charged surface. In
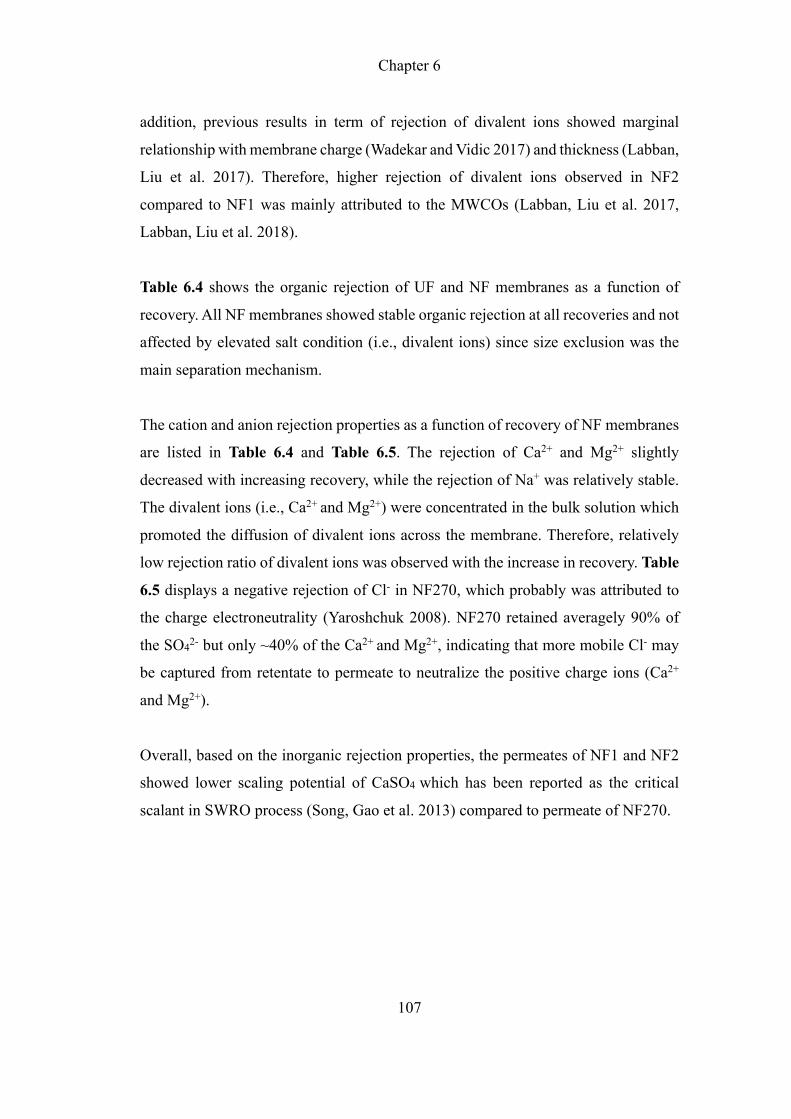
Chapter 6
107
addition, previous results in term of rejection of divalent ions showed marginal
relationship with membrane charge (Wadekar and Vidic 2017) and thickness (Labban,
Liu et al. 2017). Therefore, higher rejection of divalent ions observed in NF2
compared to NF1 was mainly attributed to the MWCOs (Labban, Liu et al. 2017,
Labban, Liu et al. 2018).
Table 6.4 shows the organic rejection of UF and NF membranes as a function of
recovery. All NF membranes showed stable organic rejection at all recoveries and not
affected by elevated salt condition (i.e., divalent ions) since size exclusion was the
main separation mechanism.
The cation and anion rejection properties as a function of recovery of NF membranes
are listed in Table 6.4 and Table 6.5. The rejection of Ca2+ and Mg2+ slightly
decreased with increasing recovery, while the rejection of Na+ was relatively stable.
The divalent ions (i.e., Ca2+ and Mg2+) were concentrated in the bulk solution which
promoted the diffusion of divalent ions across the membrane. Therefore, relatively
low rejection ratio of divalent ions was observed with the increase in recovery. Table
6.5 displays a negative rejection of Cl- in NF270, which probably was attributed to
the charge electroneutrality (Yaroshchuk 2008). NF270 retained averagely 90% of
the SO42- but only ~40% of the Ca2+ and Mg2+, indicating that more mobile Cl- may
be captured from retentate to permeate to neutralize the positive charge ions (Ca2+
and Mg2+).
Overall, based on the inorganic rejection properties, the permeates of NF1 and NF2
showed lower scaling potential of CaSO4 which has been reported as the critical
scalant in SWRO process (Song, Gao et al. 2013) compared to permeate of NF270.
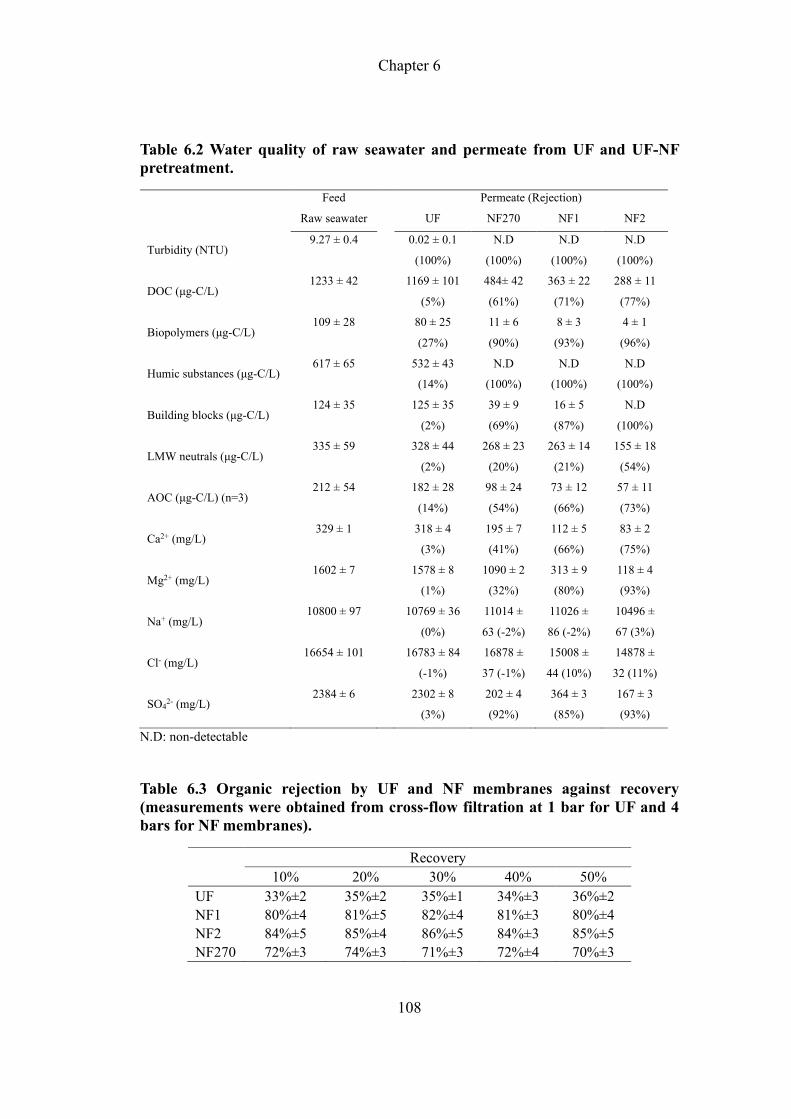
Chapter 6
108
Table 6.2 Water quality of raw seawater and permeate from UF and UF-NF pretreatment.
� Feed Permeate (Rejection)
Raw seawater UF NF270 NF1 NF2
Turbidity (NTU) 9.27 ± 0.4 0.02 ± 0.1
(100%)
N.D
(100%)
N.D
(100%)
N.D
(100%)
DOC (μg-C/L) 1233 ± 42 1169 ± 101
(5%)
484± 42
(61%)
363 ± 22
(71%)
288 ± 11
(77%)
Biopolymers (μg-C/L) 109 ± 28 80 ± 25
(27%)
11 ± 6
(90%)
8 ± 3
(93%)
4 ± 1
(96%)
Humic substances (μg-C/L) 617 ± 65 532 ± 43
(14%)
N.D
(100%)
N.D
(100%)
N.D
(100%)
Building blocks (μg-C/L) 124 ± 35 125 ± 35
(2%)
39 ± 9
(69%)
16 ± 5
(87%)
N.D
(100%)
LMW neutrals (μg-C/L) 335 ± 59 328 ± 44
(2%)
268 ± 23
(20%)
263 ± 14
(21%)
155 ± 18
(54%)
AOC (μg-C/L) (n=3) 212 ± 54 182 ± 28
(14%)
98 ± 24
(54%)
73 ± 12
(66%)
57 ± 11
(73%)
Ca2+ (mg/L) 329 ± 1 318 ± 4
(3%)
195 ± 7
(41%)
112 ± 5
(66%)
83 ± 2
(75%)
Mg2+ (mg/L) 1602 ± 7 1578 ± 8
(1%)
1090 ± 2
(32%)
313 ± 9
(80%)
118 ± 4
(93%)
Na+ (mg/L) 10800 ± 97 10769 ± 36
(0%)
11014 ±
63 (-2%)
11026 ±
86 (-2%)
10496 ±
67 (3%)
Cl- (mg/L) 16654 ± 101 16783 ± 84
(-1%)
16878 ±
37 (-1%)
15008 ±
44 (10%)
14878 ±
32 (11%)
SO42- (mg/L) 2384 ± 6 2302 ± 8
(3%)
202 ± 4
(92%)
364 ± 3
(85%)
167 ± 3
(93%)
N.D: non-detectable
Table 6.3 Organic rejection by UF and NF membranes against recovery (measurements were obtained from cross-flow filtration at 1 bar for UF and 4 bars for NF membranes).
Recovery 10% 20% 30% 40% 50% UF 33%±2 35%±2 35%±1 34%±3 36%±2 NF1 80%±4 81%±5 82%±4 81%±3 80%±4 NF2 84%±5 85%±4 86%±5 84%±3 85%±5 NF270 72%±3 74%±3 71%±3 72%±4 70%±3
Chapter 6
109
6.3.1.3 Membrane Fouling in NF
It was found that the amount of extracted foulants on NF membranes was in the order
of NF270 > NF2 > NF1 (Appendix B, Figure B.1) while flux decline was in the
order of NF2 > NF270 > NF1 (Appendix B, Figure B.2). In general, membrane
fouling is governed by the interplay among water chemistries, membrane properties
and operating parameters. In this case, all three factors varied simultaneously because
the NF membranes used have different permeabilities and rejection properties that
increased the degree of complexity. Thus, a clear explanation of the fouling
mechanism and trend observed between the three NF membranes could not be
established. This is beyond the scope of this study and further work is required.
Nonetheless, the quality of the treated seawater or RO feed is the focus in this study.
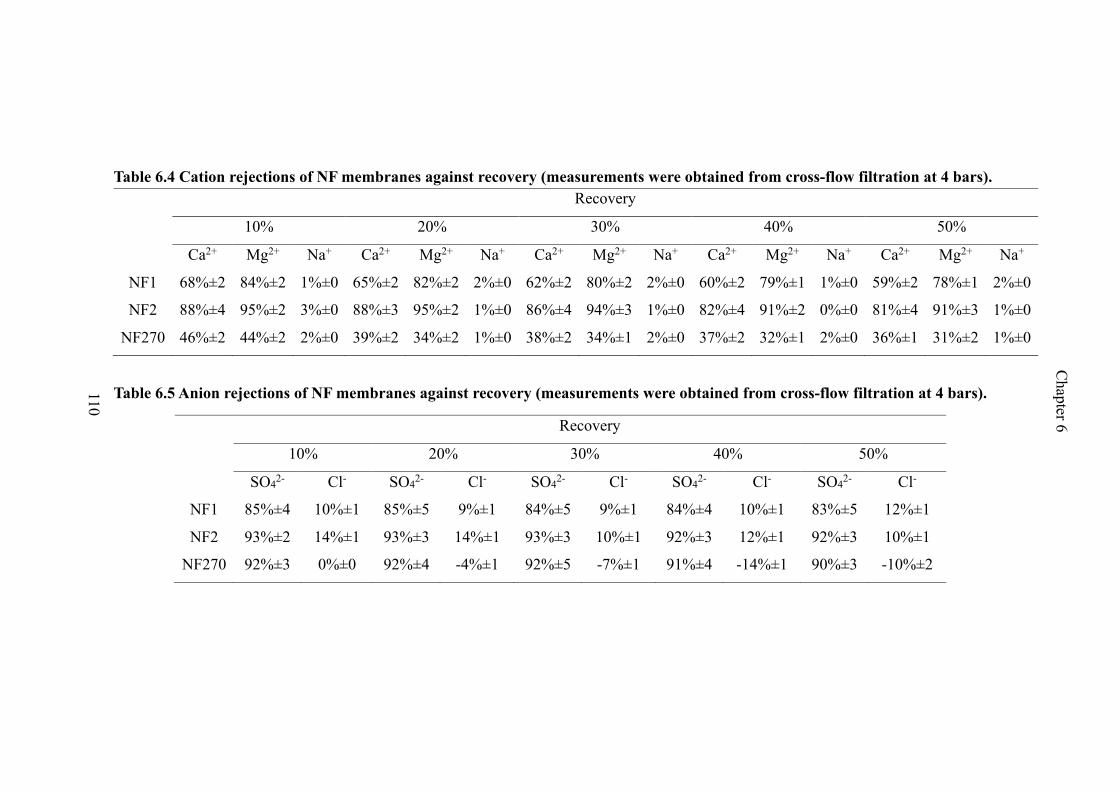
110
Chapter 6
Table 6.4 Cation rejections of NF membranes against recovery (measurements were obtained from cross-flow filtration at 4 bars).
Table 6.5 Anion rejections of NF membranes against recovery (measurements were obtained from cross-flow filtration at 4 bars).
Recovery
10% 20% 30% 40% 50%
SO42- Cl- SO42- Cl- SO42- Cl- SO42- Cl- SO42- Cl-
NF1 85%±4 10%±1 85%±5 9%±1 84%±5 9%±1 84%±4 10%±1 83%±5 12%±1
NF2 93%±2 14%±1 93%±3 14%±1 93%±3 10%±1 92%±3 12%±1 92%±3 10%±1
NF270 92%±3 0%±0 92%±4 -4%±1 92%±5 -7%±1 91%±4 -14%±1 90%±3 -10%±2
Recovery
10% 20% 30% 40% 50%
Ca2+ Mg2+ Na+ Ca2+ Mg2+ Na+ Ca2+ Mg2+ Na+ Ca2+ Mg2+ Na+ Ca2+ Mg2+ Na+
NF1 68%±2 84%±2 1%±0 65%±2 82%±2 2%±0 62%±2 80%±2 2%±0 60%±2 79%±1 1%±0 59%±2 78%±1 2%±0
NF2 88%±4 95%±2 3%±0 88%±3 95%±2 1%±0 86%±4 94%±3 1%±0 82%±4 91%±2 0%±0 81%±4 91%±3 1%±0
NF270 46%±2 44%±2 2%±0 39%±2 34%±2 1%±0 38%±2 34%±1 2%±0 37%±2 32%±1 2%±0 36%±1 31%±2 1%±0
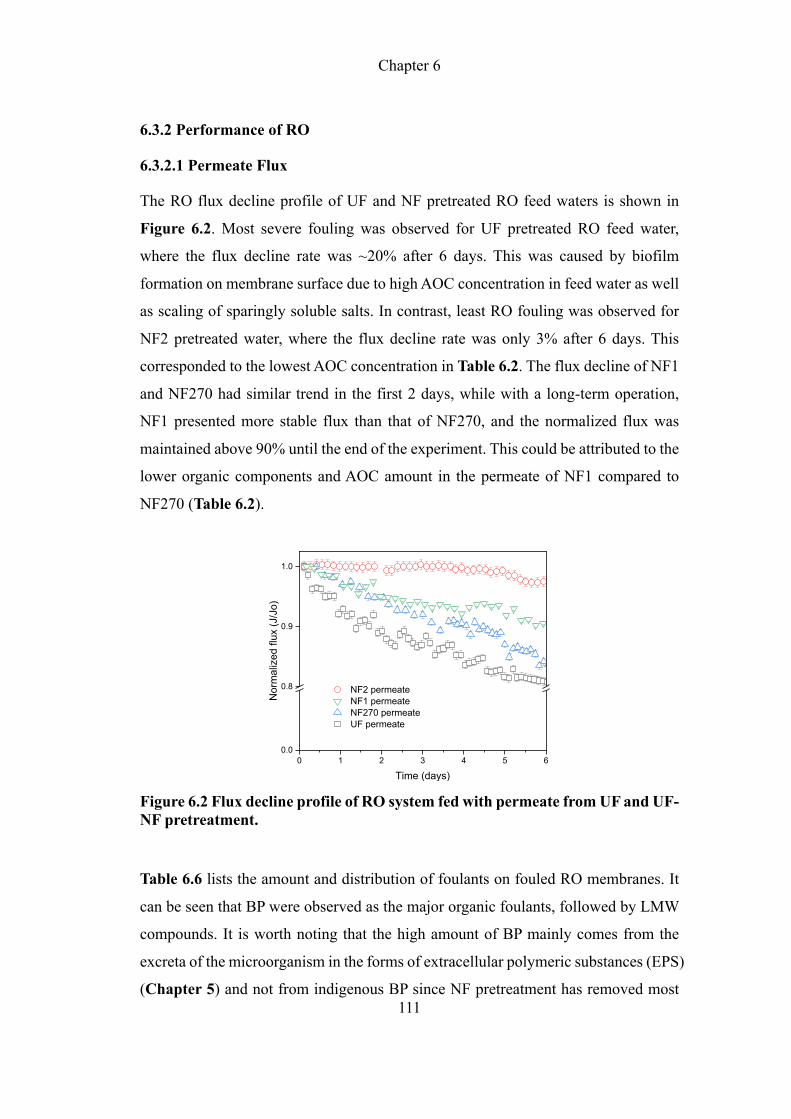
Chapter 6
111
6.3.2 Performance of RO
6.3.2.1 Permeate Flux
The RO flux decline profile of UF and NF pretreated RO feed waters is shown in
Figure 6.2. Most severe fouling was observed for UF pretreated RO feed water,
where the flux decline rate was ~20% after 6 days. This was caused by biofilm
formation on membrane surface due to high AOC concentration in feed water as well
as scaling of sparingly soluble salts. In contrast, least RO fouling was observed for
NF2 pretreated water, where the flux decline rate was only 3% after 6 days. This
corresponded to the lowest AOC concentration in Table 6.2. The flux decline of NF1
and NF270 had similar trend in the first 2 days, while with a long-term operation,
NF1 presented more stable flux than that of NF270, and the normalized flux was
maintained above 90% until the end of the experiment. This could be attributed to the
lower organic components and AOC amount in the permeate of NF1 compared to
NF270 (Table 6.2).
Figure 6.2 Flux decline profile of RO system fed with permeate from UF and UF-NF pretreatment.
Table 6.6 lists the amount and distribution of foulants on fouled RO membranes. It
can be seen that BP were observed as the major organic foulants, followed by LMW
compounds. It is worth noting that the high amount of BP mainly comes from the
excreta of the microorganism in the forms of extracellular polymeric substances (EPS)
(Chapter 5) and not from indigenous BP since NF pretreatment has removed most
0 1 2 3 4 5 60.0
0.8
0.9
1.0
NF2 permeate NF1 permeate NF270 permeate UF permeate
Nor
mal
ized
flux
(J/J
o)
Time (days)
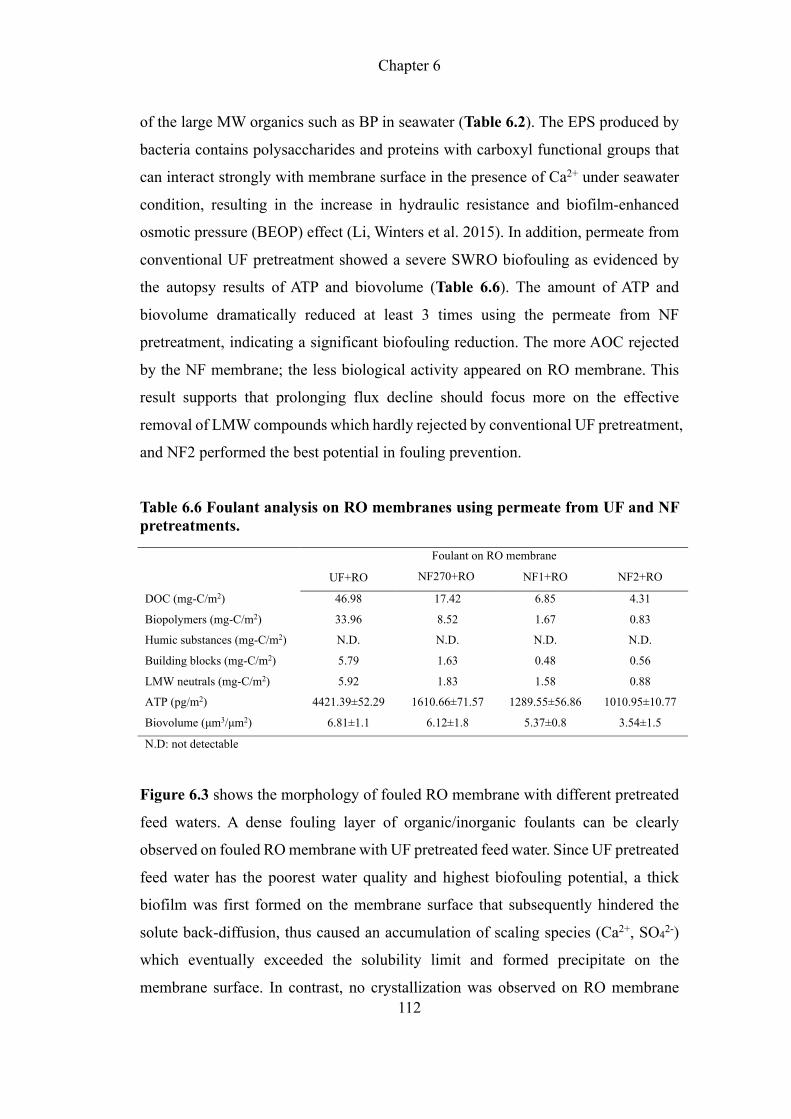
Chapter 6
112
of the large MW organics such as BP in seawater (Table 6.2). The EPS produced by
bacteria contains polysaccharides and proteins with carboxyl functional groups that
can interact strongly with membrane surface in the presence of Ca2+ under seawater
condition, resulting in the increase in hydraulic resistance and biofilm-enhanced
osmotic pressure (BEOP) effect (Li, Winters et al. 2015). In addition, permeate from
conventional UF pretreatment showed a severe SWRO biofouling as evidenced by
the autopsy results of ATP and biovolume (Table 6.6). The amount of ATP and
biovolume dramatically reduced at least 3 times using the permeate from NF
pretreatment, indicating a significant biofouling reduction. The more AOC rejected
by the NF membrane; the less biological activity appeared on RO membrane. This
result supports that prolonging flux decline should focus more on the effective
removal of LMW compounds which hardly rejected by conventional UF pretreatment,
and NF2 performed the best potential in fouling prevention.
Table 6.6 Foulant analysis on RO membranes using permeate from UF and NF pretreatments.
� Foulant on RO membrane
UF+RO NF270+RO NF1+RO NF2+RO
DOC (mg-C/m2) 46.98 17.42 6.85 4.31
Biopolymers (mg-C/m2) 33.96 8.52 1.67 0.83
Humic substances (mg-C/m2) N.D. N.D. N.D. N.D.
Building blocks (mg-C/m2) 5.79 1.63 0.48 0.56
LMW neutrals (mg-C/m2) 5.92 1.83 1.58 0.88
ATP (pg/m2) 4421.39±52.29 1610.66±71.57 1289.55±56.86 1010.95±10.77
Biovolume (μm3/μm2) 6.81±1.1 6.12±1.8 5.37±0.8 3.54±1.5
N.D: not detectable
Figure 6.3 shows the morphology of fouled RO membrane with different pretreated
feed waters. A dense fouling layer of organic/inorganic foulants can be clearly
observed on fouled RO membrane with UF pretreated feed water. Since UF pretreated
feed water has the poorest water quality and highest biofouling potential, a thick
biofilm was first formed on the membrane surface that subsequently hindered the
solute back-diffusion, thus caused an accumulation of scaling species (Ca2+, SO42-)
which eventually exceeded the solubility limit and formed precipitate on the
membrane surface. In contrast, no crystallization was observed on RO membrane
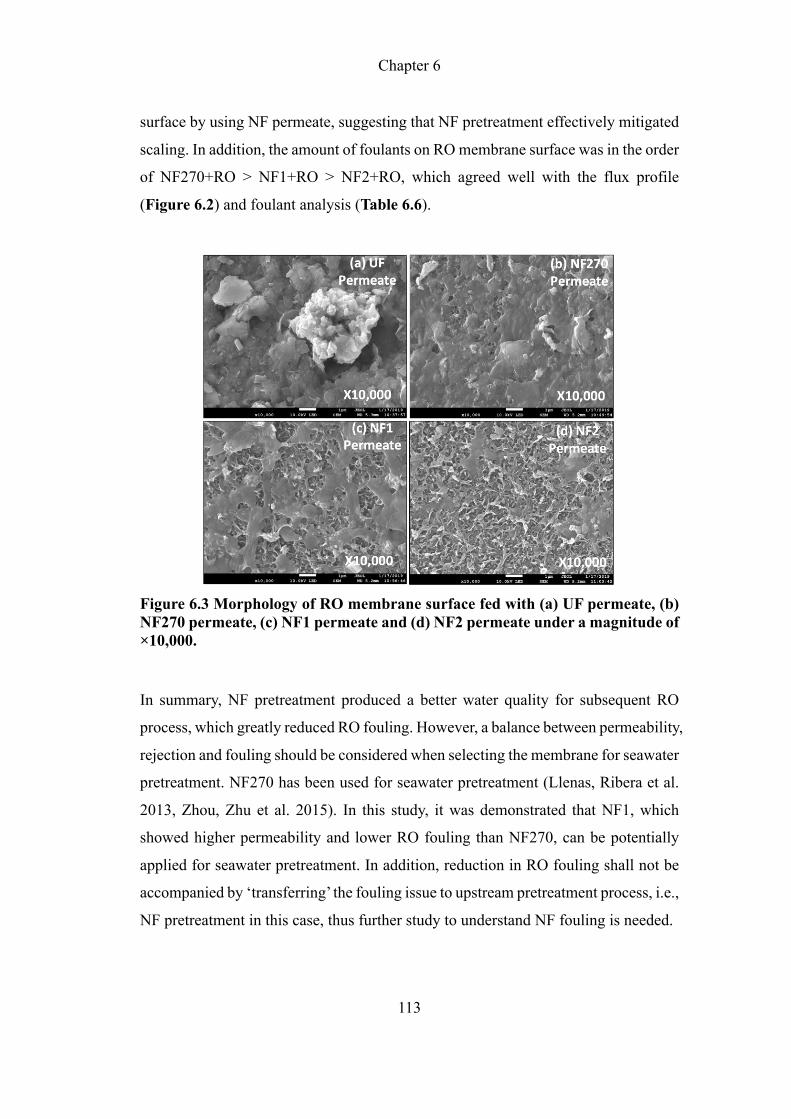
Chapter 6
113
surface by using NF permeate, suggesting that NF pretreatment effectively mitigated
scaling. In addition, the amount of foulants on RO membrane surface was in the order
of NF270+RO > NF1+RO > NF2+RO, which agreed well with the flux profile
(Figure 6.2) and foulant analysis (Table 6.6).
Figure 6.3 Morphology of RO membrane surface fed with (a) UF permeate, (b) NF270 permeate, (c) NF1 permeate and (d) NF2 permeate under a magnitude of ×10,000.
In summary, NF pretreatment produced a better water quality for subsequent RO
process, which greatly reduced RO fouling. However, a balance between permeability,
rejection and fouling should be considered when selecting the membrane for seawater
pretreatment. NF270 has been used for seawater pretreatment (Llenas, Ribera et al.
2013, Zhou, Zhu et al. 2015). In this study, it was demonstrated that NF1, which
showed higher permeability and lower RO fouling than NF270, can be potentially
applied for seawater pretreatment. In addition, reduction in RO fouling shall not be
accompanied by ‘transferring’ the fouling issue to upstream pretreatment process, i.e.,
NF pretreatment in this case, thus further study to understand NF fouling is needed.
Chapter 6
114
6.4 Conclusion
LMW compounds are difficult to be removed by conventional pretreatment process.
In this study, the feasibility of NF membranes (i.e., NF1, NF2, and NF270) for
seawater pretreatment was studied. Conventional UF pretreatment was used as
comparison. Organic/inorganic rejection rate was measured and permeate was
collected for further study of SWRO fouling process. Conclusions are drawn:
(i) Organic (in term of LMW) rejection of NF membranes were in the order of
NF2 (54%) > NF1 (22%) > NF270 (20%) > UF (2%);
(ii) While the rate of RO fouling was in the order of NF2 (3%) < NF1 (10%) <
NF270 (16%) < UF (20%). The results were supported by membrane autopsy
results;
(iii) Although NF pretreatment showed greater performance on fouling reduction
compared with UF pretreatment, economical factor needs to be considered. The
results suggested that NF membrane can be optimized to achieve excellent
removal of LMW, but a balance between permeability, rejection and fouling
shall be considered when selecting the membrane for seawater pretreatment.
For instance, NF2 membrane with the lowest permeability (~1.9 LMH/bar) was
less competitive even though it showed the lowest SWRO fouling (i.e., flux
decline ~3%) as compared to NF 1 (permeability of 4.0 LMH/bar, flux decline
~10%).

Chapter 7
115
CHAPTER 7 Conclusions and Future Works
7.1 Overall Conclusions
Reverse osmosis (RO) membrane is currently the most commonly used technology
for producing high quality water from seawater. However, organic and biofouling as
well as the interplay between them are still the major challenge in SWRO desalination
process. This thesis mainly focused on the membrane fouling in seawater reverse
osmosis (SWRO) desalination process. The overall contributions of this thesis is
shown below:
Hum
ic s
ubst
ance
s
Build
ing
bloc
ks
Biop
olym
ers
Seawater
LMW Compounds
20 30 40 50 60 70 80 90
rel.
Sign
al R
espo
nse
(OC
D)
Time (mins)
F.HS&BBF.BP F.LMW
Fractionation by membrane
technology
Degree of interaction by AFM & XDLVO
RO
StrongVery
Strong
RO
Weak Weak
RO
Moderate Moderate
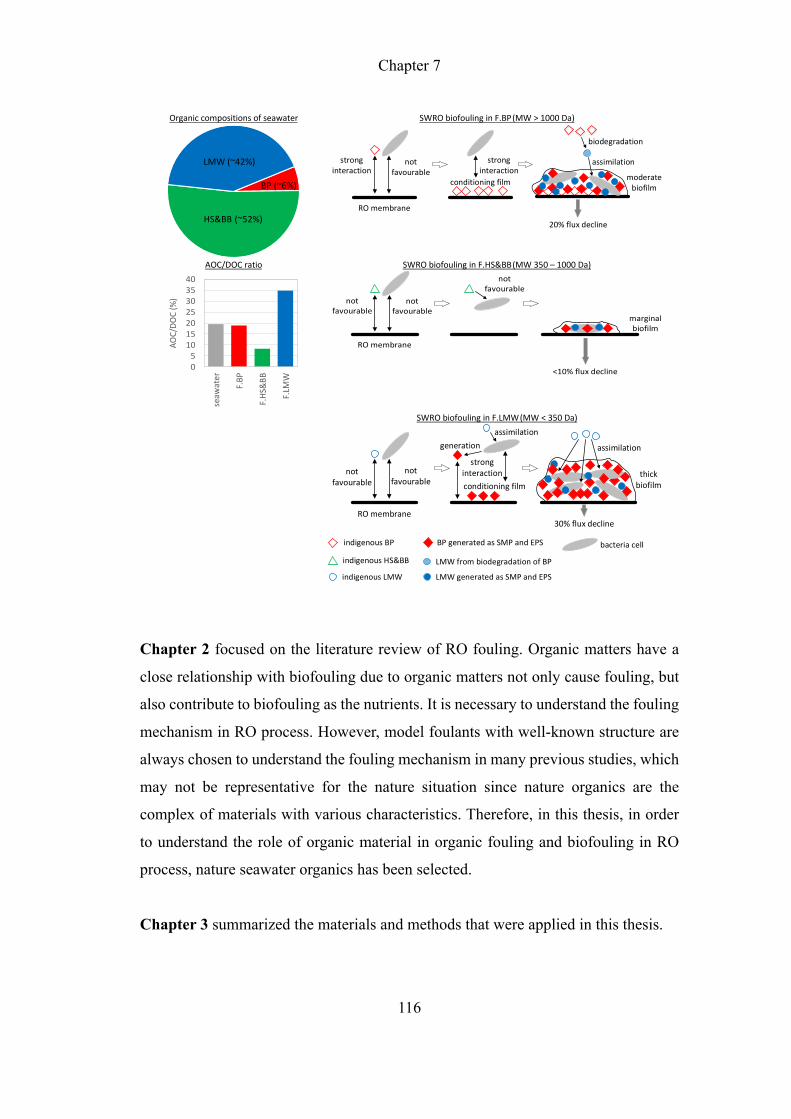
Chapter 7
116
Chapter 2 focused on the literature review of RO fouling. Organic matters have a
close relationship with biofouling due to organic matters not only cause fouling, but
also contribute to biofouling as the nutrients. It is necessary to understand the fouling
mechanism in RO process. However, model foulants with well-known structure are
always chosen to understand the fouling mechanism in many previous studies, which
may not be representative for the nature situation since nature organics are the
complex of materials with various characteristics. Therefore, in this thesis, in order
to understand the role of organic material in organic fouling and biofouling in RO
process, nature seawater organics has been selected.
Chapter 3 summarized the materials and methods that were applied in this thesis.
Organic compositions of seawater
SWRO biofouling in F.BP (MW > 1000 Da)
AOC/DOC ratio
SWRO biofouling in F.HS&BB (MW 350 – 1000 Da)
SWRO biofouling in F.LMW (MW < 350 Da)
LMW (~42%)
HS&BB (~52%)
BP (~6%)
strong interaction
strong interaction
not favourable
conditioning film
biodegradation
assimilation
moderatebiofilm
20% flux decline
RO membrane
05
10152025303540
seaw
ater
F.BP
F.HS
&BB
F.LM
W
AOC/
DOC
(%) not
favourablemarginalbiofilm
<10% flux decline
RO membrane
not favourable
not favourable
strong interactionnot
favourable
assimilation
thickbiofilm
30% flux declineRO membrane
not favourable conditioning film
assimilationgeneration
bacteria cellindigenous BP
indigenous HS&BB
indigenous LMW
BP generated as SMP and EPS
LMW generated as SMP and EPS
LMW from biodegradation of BP
Chapter 7
117
Chapter 4 presented the organic fouling mechanism in seawater reverse osmosis
(SWRO) process. In this chapter, dissolved organic matter (DOM) in seawater was
fractionated and concentrated by membrane technique into three major fractions,
namely, F.BP, F.HS&BB, F.LMW. Overall recovery of >80% was attained. Results
showed that biopolymer in seawater was mainly made up of polysaccharides-like and
protein-like compounds, the HS&BB showed smaller MW, all isolated organic
fractions showed lower fluorescence intensities, and had lower fouling potentials than
common model foulants used in SWRO fouling studies. Initial fouling (i.e., foulant-
membrane interaction) was the main driver in SWRO organic fouling with
biopolymer fraction as the major contributor followed by low molecular weight
fraction. In addition, divalent ions were found to enhance the RO fouling by
increasing the adhesion and cohesion forces between foulant-membrane and foulant-
foulant.
Chapter 5 studied the SWRO biofouling mechanism by using the isolated organic
fractions. The AOC/DOC ratio was in the order of F.LMW (~35%) > F.BP (~19%) >
F.HS&BB (~8%); AOC/DOC of seawater was ~20%; organic compositions of
seawater were BP ~6%, HS&BB ~52% and LMW ~42%; thus LMW accounted
for >70% of AOC in seawater. In SWRO biofouling study, F.LMW caused the most
severe flux decline (30%), followed by F.BP (20%), while insignificant effect in
F.HS&BB (<10%). In F.BP as RO feed, the BP preferentially formed a conditioning
layer on the RO membrane due to strong interaction of BP-membrane, followed by
the deposition of bacteria due to greater interaction of bacteria-BP than bacteria-
membrane. The BP was then biodegraded to LMW, which could be easily assimilated
by bacteria for proliferation. BP and LMW was generated as SMP and EPS. On the
other hand, in F.LMW as RO feed, due to weaker interaction of LMW-membrane, the
deposition of LMW onto membrane was not favourable. But bacteria consumed
LMW and produced BP as a by-product, which could then form a conditioning layer
on the membrane surface. This process was slower than the direct deposition of BP
in F.BP, thus slower flux decline rate was observed in F.LMW as compared to F.BP
during the initial stage of biofouling. However, due to continuous supply of LMW in
F.LMW, in which the amount was much higher than the amount of LMW generated
Chapter 7
118
through biodegradation of BP in F.BP, rapid microbial growth and generation of SMP
and EPS were observed, thus biofouling rate in F.LMW surpassed F.BP at the later
stage of biofouling process. The large amount of BP and LMW presence (i.e.,
HS&BB was insignificant) in the foulants of biofouled membranes in F.BP and
F.LMW as RO feed were not from the deposition of indigenous BP and LMW from
the bulk feed solution, but rather from the generation of BP and LMW during
microbial growth on the membrane surface through biodegradation of BP in F.BP and
production of SMP and EPS in both F.BP and F.LMW. The accumulation of bacteria
cells embedded in matrix of SMP and EPS (i.e., in particular BP) formed a biofilm
that caused an increase in hydraulic resistance and biofilm-enhanced osmotic
pressure effect, thus decline in flux.
Chapter 6 focused on the LMW removal by using low-pressure NF pretreatment
process and the subsequent impact on SWRO fouling. Three different membranes
were evaluated: NF270 was a commercial membrane based on polyamide thin film
composite, NF1 and NF2 were glutaraldehyde cross-linked layer-by-layer
polyelectrolyte membranes. The organic/inorganic rejection of NF membranes
followed the order of NF2 > NF1 > NF270 while pure water permeability (PWP) was
in the order of NF1 > NF270 > NF2. Meanwhile the degree of RO fouling in term of
flux decline and foulant amount was in the order of NF270 > NF1 > NF2. In addition,
the results suggested that NF membrane can be optimized to achieve excellent
removal of LMW, but a balance between permeability, rejection and fouling shall be
considered when selecting the membrane for seawater pretreatment.
7.2 Recommendations for Future Works
Potential works in the future are listed below:
(i) It is necessary to continue the improvement of the fractionation process on
extracting organic matters, especially for LMW compounds. LMW compounds
failed to be isolated due to high salt concentration. Therefore, future study should
integrate forward osmosis (FO) and electrodialysis (ED) techniques to
concentrate and desalt the LMW organics;

Chapter 7
119
(ii) Natural organic matter is a complex mixture of compounds. However, organic
compositions have not been well understood. Fractionation process has huge
potential to be applied to other type of water (e.g., surface water, wastewater, etc.)
and the organic fractions can further be analyzed in terms of their seasonal
change and impact of fouling. In addition, organic characterization can offer a
helpful information and principle to select suitable pretreatment methods;
(iii) In practice, fouling is a result of the interplay of various foulant with different
characteristics, including the interaction among different foulants and the
interaction between different foulants and membranes. Future study can
investigate the interplay between different organic fractions, understanding the
synergistic effect on the RO membrane;
(iv) NF pretreatment can significantly reduce RO fouling, but NF membrane itself
still faces the challenge of fouling. Due to different fabrication materials of NF
membrane, the fouling mechanism is also different. Therefore, understanding the
fouling mechanism of NF membrane is important for the future study.
Appendix A
120
Appendix A
A.1 Electrodialysis (ED) Setup
The electrodialysis stack (PCCell, GmbH, Germany) consisted of 25 cell pairs
assembled with standard cation exchange membrane (PC-SK), and standard anion
exchange membrane (PC-SA). The electrodes were equipped with anode (Pt/Ir-MMO
coated Ti-stretched metal) and cathode (stainless steel). The membrane size was 12.5
× 26 cm with an active membrane area of 0.02 m2. The spacer type was 0.35 mm of
silicone/polyester. The power supply had 3.5 digits display of voltage and current.
The range of output voltage was 1-60 V, and the range of output amperage was 0-15
A. Different voltages (i.e., 10 V, 30 V, 60 V) was applied to study the transport
efficiency in ED process.
The diluate solution was prepared by using different organic solutions (with volume
of 5 L), i.e., 0.2 μm filtered seawater, humic acids (HA) solution with 5 mg-C/L,
F.HS&BB solution with 5 mg-C/L from the fractionation process, sucrose solution
(Sigma Aldrich, USA) with 5 mg-C/L, and algal organic matter with MW of <350 Da
(labelled as AOM.LMW) with 100 mg-C/L at voltage of 60V. AOM.LMW was
extracted from Thalassiosira Pseudonana. The protocol of incubation of
Thalassiosira Pseudonana was reported in previous work (Sim, Suwarno et al. 2019).
To extract the AOM.LMW, the culture solution was first filtered by a 0.2 μm cartridge
filter to remove the suspended particles/algae, followed by a 500 Da membrane to
separate the LMW compound. The organic matter was detected by the LC-OCD. The
concentrate solution (5 L) was prepared by mixing 3.5 g NaCl with 1 L DI water. The
diluate and concentrate was recirculated back to each original container. The
electrolyte was prepared by using 0.1 M of sulfamic acid monosodium salt
(NaNH2SO3, BOC Science, USA). Samples from diluate and concentrate were
collected and analyzed by LC-OCD with interval of 10 mins.
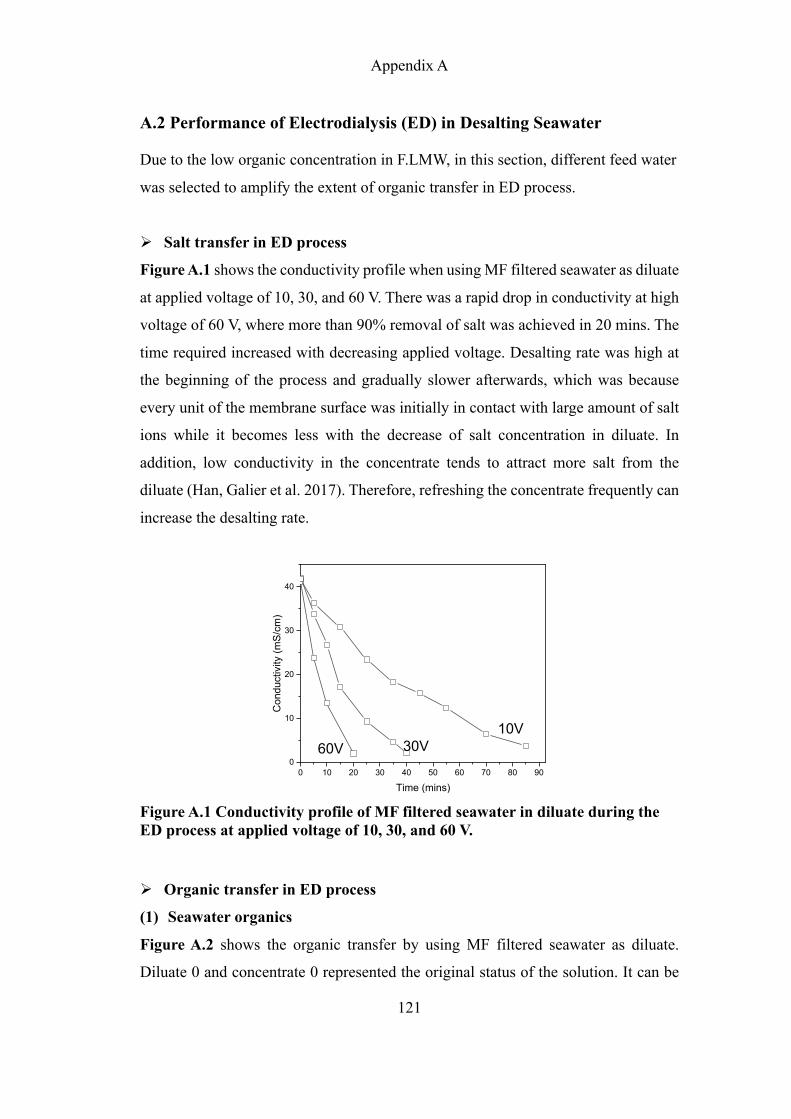
Appendix A
121
A.2 Performance of Electrodialysis (ED) in Desalting Seawater
Due to the low organic concentration in F.LMW, in this section, different feed water
was selected to amplify the extent of organic transfer in ED process.
Ø Salt transfer in ED process
Figure A.1 shows the conductivity profile when using MF filtered seawater as diluate
at applied voltage of 10, 30, and 60 V. There was a rapid drop in conductivity at high
voltage of 60 V, where more than 90% removal of salt was achieved in 20 mins. The
time required increased with decreasing applied voltage. Desalting rate was high at
the beginning of the process and gradually slower afterwards, which was because
every unit of the membrane surface was initially in contact with large amount of salt
ions while it becomes less with the decrease of salt concentration in diluate. In
addition, low conductivity in the concentrate tends to attract more salt from the
diluate (Han, Galier et al. 2017). Therefore, refreshing the concentrate frequently can
increase the desalting rate.
Figure A.1 Conductivity profile of MF filtered seawater in diluate during the ED process at applied voltage of 10, 30, and 60 V.
Ø Organic transfer in ED process
(1) Seawater organics
Figure A.2 shows the organic transfer by using MF filtered seawater as diluate.
Diluate 0 and concentrate 0 represented the original status of the solution. It can be
0 10 20 30 40 50 60 70 80 900
10
20
30
40
10V30V
Con
duct
ivity
(mS/
cm)
Time (mins)
60V
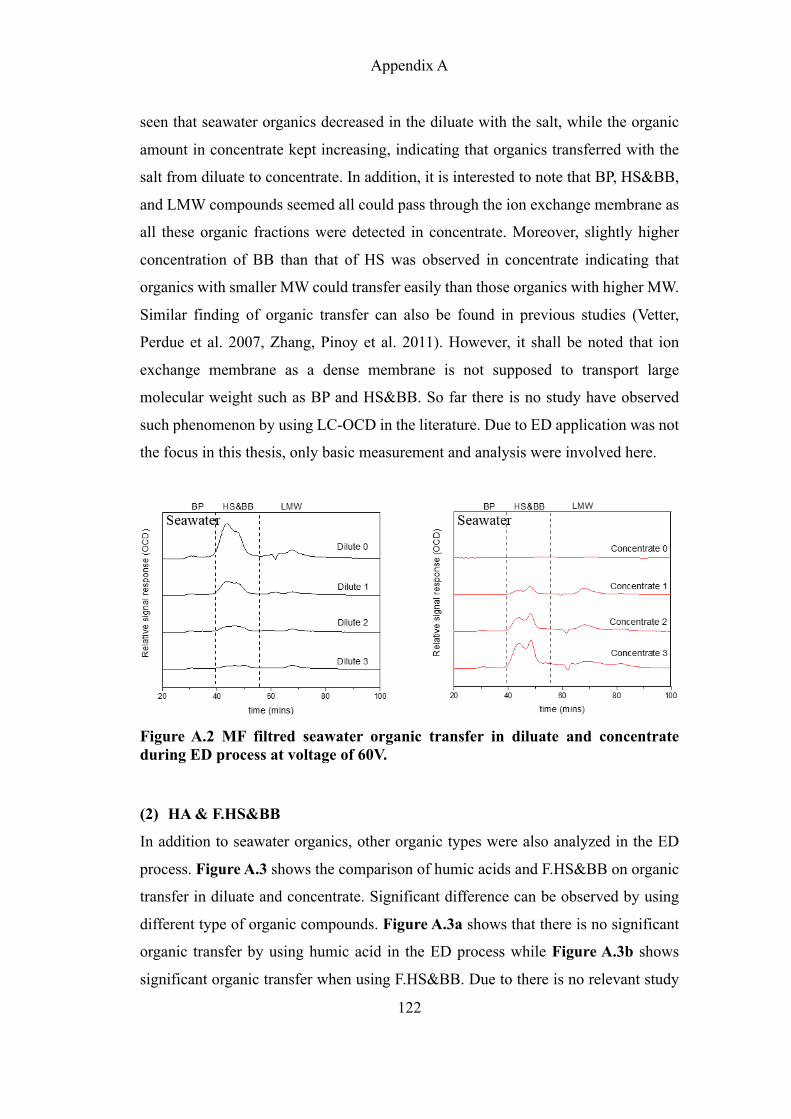
Appendix A
122
seen that seawater organics decreased in the diluate with the salt, while the organic
amount in concentrate kept increasing, indicating that organics transferred with the
salt from diluate to concentrate. In addition, it is interested to note that BP, HS&BB,
and LMW compounds seemed all could pass through the ion exchange membrane as
all these organic fractions were detected in concentrate. Moreover, slightly higher
concentration of BB than that of HS was observed in concentrate indicating that
organics with smaller MW could transfer easily than those organics with higher MW.
Similar finding of organic transfer can also be found in previous studies (Vetter,
Perdue et al. 2007, Zhang, Pinoy et al. 2011). However, it shall be noted that ion
exchange membrane as a dense membrane is not supposed to transport large
molecular weight such as BP and HS&BB. So far there is no study have observed
such phenomenon by using LC-OCD in the literature. Due to ED application was not
the focus in this thesis, only basic measurement and analysis were involved here.
Figure A.2 MF filtred seawater organic transfer in diluate and concentrate during ED process at voltage of 60V.
(2) HA & F.HS&BB
In addition to seawater organics, other organic types were also analyzed in the ED
process. Figure A.3 shows the comparison of humic acids and F.HS&BB on organic
transfer in diluate and concentrate. Significant difference can be observed by using
different type of organic compounds. Figure A.3a shows that there is no significant
organic transfer by using humic acid in the ED process while Figure A.3b shows
significant organic transfer when using F.HS&BB. Due to there is no relevant study
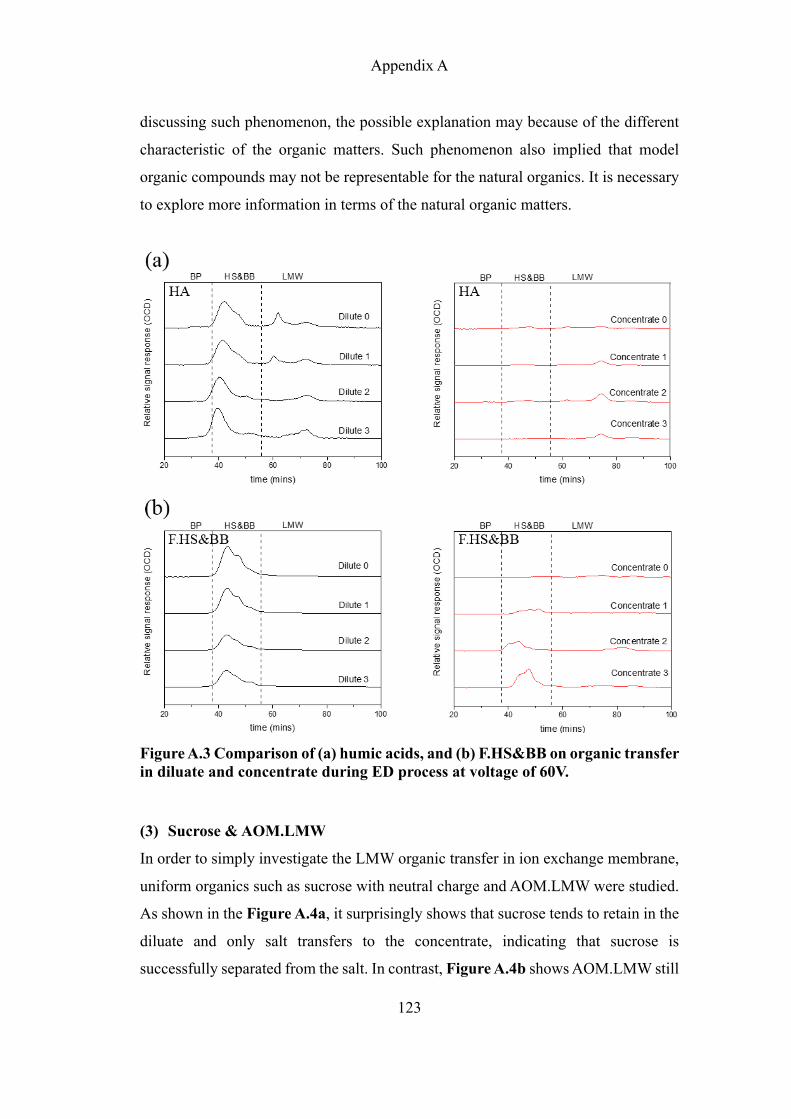
Appendix A
123
discussing such phenomenon, the possible explanation may because of the different
characteristic of the organic matters. Such phenomenon also implied that model
organic compounds may not be representable for the natural organics. It is necessary
to explore more information in terms of the natural organic matters.
Figure A.3 Comparison of (a) humic acids, and (b) F.HS&BB on organic transfer in diluate and concentrate during ED process at voltage of 60V.
(3) Sucrose & AOM.LMW
In order to simply investigate the LMW organic transfer in ion exchange membrane,
uniform organics such as sucrose with neutral charge and AOM.LMW were studied.
As shown in the Figure A.4a, it surprisingly shows that sucrose tends to retain in the
diluate and only salt transfers to the concentrate, indicating that sucrose is
successfully separated from the salt. In contrast, Figure A.4b shows AOM.LMW still
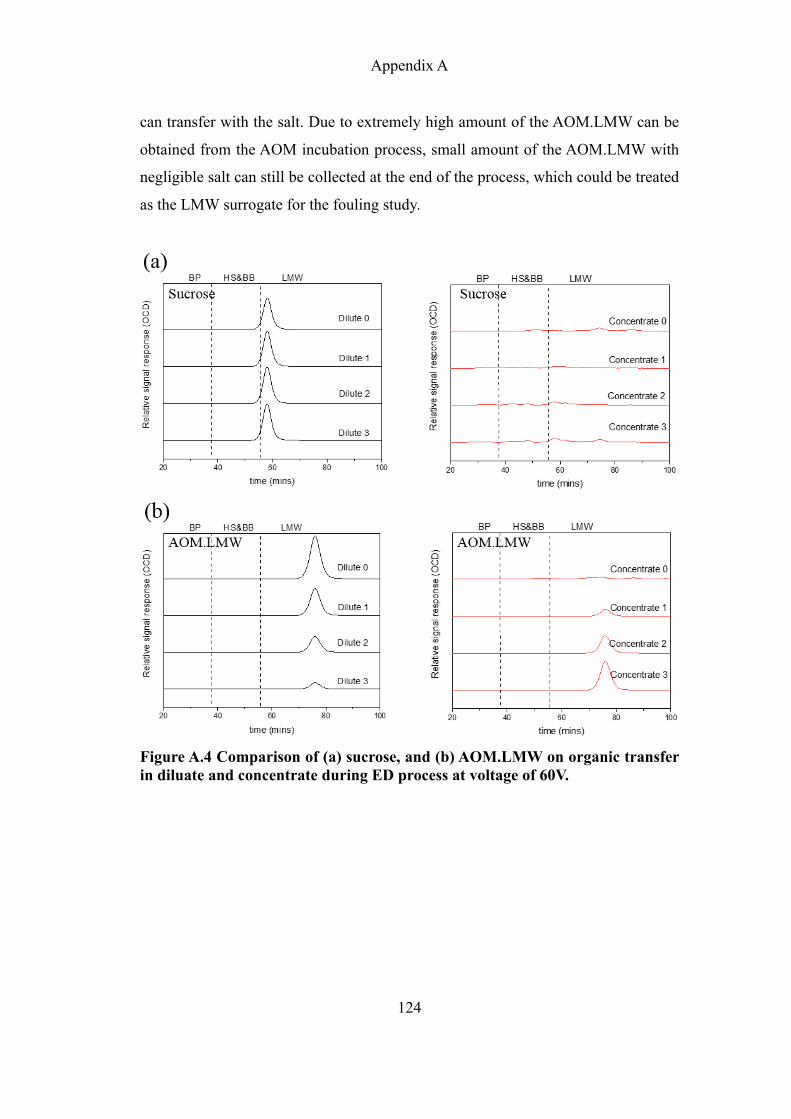
Appendix A
124
can transfer with the salt. Due to extremely high amount of the AOM.LMW can be
obtained from the AOM incubation process, small amount of the AOM.LMW with
negligible salt can still be collected at the end of the process, which could be treated
as the LMW surrogate for the fouling study.
Figure A.4 Comparison of (a) sucrose, and (b) AOM.LMW on organic transfer in diluate and concentrate during ED process at voltage of 60V.
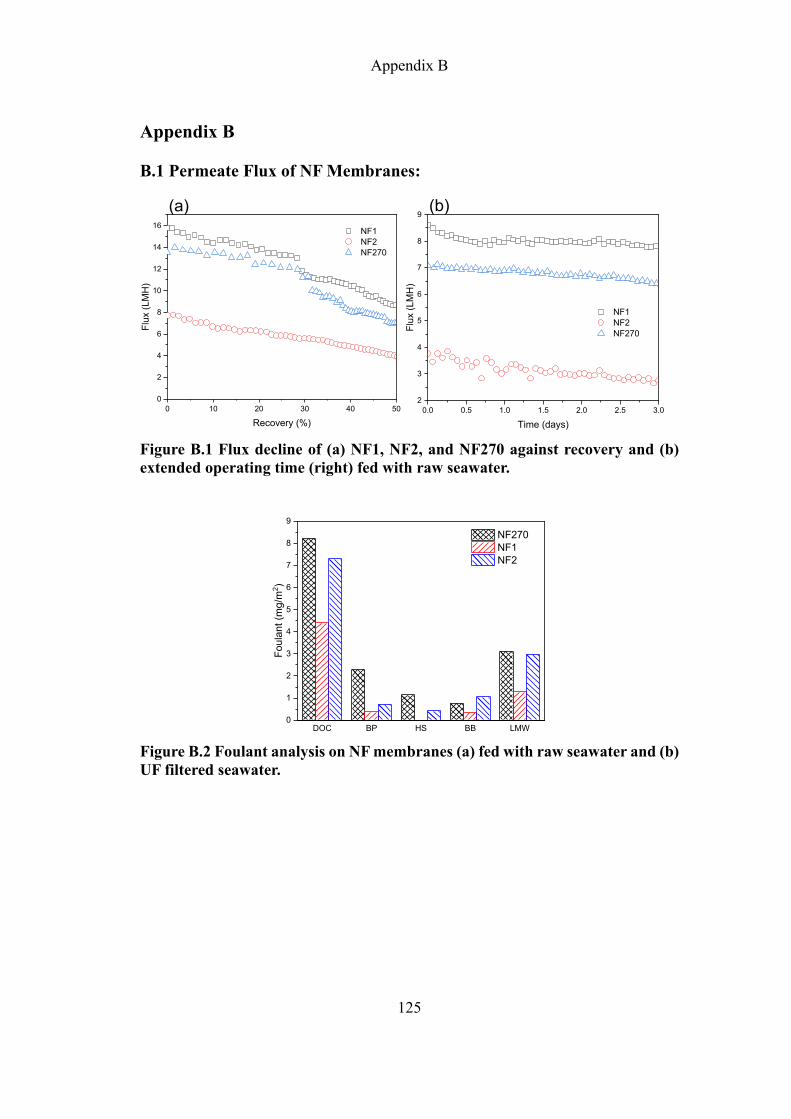
Appendix B
125
Appendix B
B.1 Permeate Flux of NF Membranes:
Figure B.1 Flux decline of (a) NF1, NF2, and NF270 against recovery and (b) extended operating time (right) fed with raw seawater.
Figure B.2 Foulant analysis on NF membranes (a) fed with raw seawater and (b) UF filtered seawater.
0 10 20 30 40 500
2
4
6
8
10
12
14
16 NF1 NF2 NF270
Flux
(LM
H)
Recovery (%)
(a)
0.0 0.5 1.0 1.5 2.0 2.5 3.02
3
4
5
6
7
8
9(b)
NF1 NF2 NF270Fl
ux (L
MH
)Time (days)
DOC BP HS BB LMW0
1
2
3
4
5
6
7
8
9
Foul
ant (
mg/
m2 )
NF270 NF1 NF2
References
126
REFERENCES
Abdelkader, B. A., M. A. Antar and Z. Khan (2018). "Nanofiltration as a Pretreatment
Step in Seawater Desalination: A Review." Arabian Journal for Science and
Engineering: 1-20.
Abdelkareem, M. A., M. E. H. Assad, E. T. Sayed and B. Soudan (2018). "Recent
progress in the use of renewable energy sources to power water desalination plants."
Desalination 435: 97-113.
Achilli, A., T. Y. Cath, E. A. Marchand and A. E. Childress (2009). "The forward
osmosis membrane bioreactor: a low fouling alternative to MBR processes."
Desalination 239(1-3): 10-21.
Akhondi, E., B. Wu, S. Sun, B. Marxer, W. Lim, J. Gu, L. Liu, M. Burkhardt, D.
McDougald and W. Pronk (2015). "Gravity-driven membrane filtration as
pretreatment for seawater reverse osmosis: linking biofouling layer morphology with
flux stabilization." water research 70: 158-173.
Alizadeh Tabatabai, S. A., J. C. Schippers and M. D. Kennedy (2014). "Effect of
coagulation on fouling potential and removal of algal organic matter in ultrafiltration
pretreatment to seawater reverse osmosis." Water Research 59: 283-294.
Amy, G., N. Ghaffour, Z. Li, L. Francis, R. V. Linares, T. Missimer and S. Lattemann
(2017). "Membrane-based seawater desalination: Present and future prospects."
Desalination 401: 16-21.
Ang, W. S. and M. Elimelech (2007). "Protein (BSA) fouling of reverse osmosis
membranes: Implications for wastewater reclamation." Journal of Membrane Science
296(1–2): 83-92.
Ang, W. S. and M. Elimelech (2007). "Protein (BSA) fouling of reverse osmosis
membranes: implications for wastewater reclamation." Journal of Membrane Science
296(1-2): 83-92.
Ang, W. S., A. Tiraferri, K. L. Chen and M. Elimelech (2011). "Fouling and cleaning
of RO membranes fouled by mixtures of organic foulants simulating wastewater
effluent." Journal of Membrane Science 376(1-2): 196-206.
Anis, S. F., R. Hashaikeh and N. Hilal (2019). "Reverse osmosis pretreatment
technologies and future trends: A comprehensive review." Desalination 452: 159-195.
References
127
Ao, L., W. Liu, L. Zhao and X. Wang (2016). "Membrane fouling in ultrafiltration of
natural water after pretreatment to different extents." Journal of Environmental
Sciences 43: 234-243.
APHA (2012). "StandardMethods for the Examination ofWater andWastewater (22nd
ed.)." American Public Health Association, AmericanWater Works Association,Water
Environment Federation, Washington, D.C.
Badruzzaman, M., N. Voutchkov, L. Weinrich and J. G. Jacangelo (2019). "Selection
of pretreatment technologies for seawater reverse osmosis plants: A review."
Desalination 449: 78-91.
Barker, D. J. and D. C. Stuckey (1999). "A review of soluble microbial products (SMP)
in wastewater treatment systems." Water research 33(14): 3063-3082.
Bartels, C. R., M. Wilf, K. Andes and J. Iong (2005). "Design considerations for
wastewater treatment by reverse osmosis." Water science and technology 51(6-7):
473-482.
Belfer, S., Y. Purinson and O. Kedem (1998). "Surface modification of commercial
polyamide reverse osmosis membranes by radical grafting: An ATR‐FTIR study."
Acta Polymerica 49(10‐11): 574-582.
Bhattacharjee, S., A. Sharma and P. K. Bhattacharya (1996). "Estimation and
Influence of Long Range Solute. Membrane Interactions in Ultrafiltration." Industrial
& Engineering Chemistry Research 35(9): 3108-3121.
Boo, C., S. Hong and M. Elimelech (2018). "Relating Organic Fouling in Membrane
Distillation to Intermolecular Adhesion Forces and Interfacial Surface Energies."
Environmental science & technology 52(24): 14198-14207.
Bowen, W. R., N. Hilal, R. W. Lovitt and P. M. Williams (1996). "Atomic force
microscope studies of membranes: surface pore structures of Diaflo ultrafiltration
membranes." Journal of colloid and interface science 180(2): 350-359.
Brant, J. A. and A. E. Childress (2002). "Assessing short-range membrane–colloid
interactions using surface energetics." Journal of Membrane Science 203(1-2): 257-
273.
Brant, J. A. and A. E. Childress (2002). "Assessing short-range membrane–colloid
interactions using surface energetics." Journal of Membrane Science 203(1–2): 257-
273.
References
128
Brant, J. A. and A. E. Childress (2002). "Membrane–colloid interactions: comparison
of extended DLVO predictions with AFM force measurements." Environmental
Engineering Science 19(6): 413-427.
Brehant, A., V. Bonnelye and M. Perez (2002). "Comparison of MF/UF pretreatment
with conventional filtration prior to RO membranes for surface seawater
desalination." Desalination 144(1-3): 353-360.
Brehant, A., V. Bonnelye and M. Perez (2002). "Comparison of MF/UF pretreatment
with conventional filtration prior to RO membranes for surface seawater
desalination." Desalination 144(1): 353-360.
Carlson, C. A. and D. A. Hansell (2015). DOM sources, sinks, reactivity, and budgets.
Biogeochemistry of marine dissolved organic matter, Elsevier: 65-126.
Charnock, C. and O. Kjønnø (2000). "Assimilable organic carbon and biodegradable
dissolved organic carbon in Norwegian raw and drinking waters." Water Research
34(10): 2629-2642.
Chen, L., Y. Tian, C.-q. Cao, J. Zhang and Z.-n. Li (2012). "Interaction energy
evaluation of soluble microbial products (SMP) on different membrane surfaces: role
of the reconstructed membrane topology." Water research 46(8): 2693-2704.
Chen, W., P. Westerhoff, J. A. Leenheer and K. Booksh (2003). "Fluorescence
Excitation−Emission Matrix Regional Integration to Quantify Spectra for Dissolved
Organic Matter." Environmental Science & Technology 37(24): 5701-5710.
Chian, E. S., J. P. Chen, P.-X. Sheng, Y.-P. Ting and L. K. Wang (2007). Reverse
osmosis technology for desalination. Advanced Physicochemical Treatment
Technologies, Springer: 329-366.
Chong, T., F. Wong and A. Fane (2008). "The effect of imposed flux on biofouling in
reverse osmosis: role of concentration polarisation and biofilm enhanced osmotic
pressure phenomena." Journal of Membrane Science 325(2): 840-850.
Chong, T. H., F. S. Wong and A. G. Fane (2007). "Enhanced concentration
polarization by unstirred fouling layers in reverse osmosis: Detection by sodium
chloride tracer response technique." Journal of Membrane Science 287(2): 198-210.
Chua, K., M. Hawlader and A. Malek (2003). "Pretreatment of seawater: results of
pilot trials in Singapore." Desalination 159(3): 225-243.
References
129
Clever, M., F. Jordt, R. Knauf, N. Räbiger, M. Rüdebusch and R. Hilker-Scheibel
(2000). "Process water production from river water by ultrafiltration and reverse
osmosis." Desalination 131(1): 325-336.
Dalvi, A. G. I., R. Al-Rasheed and M. A. Javeed (2000). "Studies on organic foulants
in the seawater feed of reverse osmosis plants of SWCC." Desalination 132(1-3):
217-232.
Darton, E. G. and M. S. Gallego (2007). "Simple laboratory techniques improve the
operation of RO pre-treatment systems." IDA World Congr. Canar: 1-11.
Deng, L., H.-H. Ngo, W. Guo and H. Zhang (2019). "Pre-coagulation coupled with
sponge-membrane filtration for organic matter removal and membrane fouling
control during drinking water treatment." Water Research 157: 155-166.
Ding, Q., H. Yamamura, H. Yonekawa, N. Aoki, N. Murata, A. Hafuka and Y.
Watanabe (2018). "Differences in behaviour of three biopolymer constituents in
coagulation with polyaluminium chloride: Implications for the optimisation of a
coagulation–membrane filtration process." Water research 133: 255-263.
Ding, S., Y. Yang, C. Li, H. Huang and L. A. Hou (2016). "The effects of organic
fouling on the removal of radionuclides by reverse osmosis membranes." Water
Research 95: 174-184.
Dreizin, Y., A. Tenne and D. Hoffman (2008). "Integrating large scale seawater
desalination plants within Israel’s water supply system." Desalination 220(1-3): 132-
149.
Elhadidy, A. M., M. I. Van Dyke, S. Peldszus and P. M. Huck (2016). "Application of
flow cytometry to monitor assimilable organic carbon (AOC) and microbial
community changes in water." Journal of Microbiological Methods 130: 154-163.
Fan, L., J. L. Harris, F. A. Roddick and N. A. Booker (2001). "Influence of the
characteristics of natural organic matter on the fouling of microfiltration
membranes." Water Research 35(18): 4455-4463.
Filloux, E., W. Gernjak, H. Gallard and J.-P. Croue (2016). "Investigating the relative
contribution of colloidal and soluble fractions of secondary effluent organic matter to
the irreversible fouling of MF and UF hollow fibre membranes." Separation and
Purification Technology 170: 109-115.
References
130
Flemming, H.-C. (1997). "Reverse osmosis membrane biofouling." Experimental
thermal and fluid science 14(4): 382-391.
Flemming, H.-C. (2011). Microbial biofouling: unsolved problems, insufficient
approaches, and possible solutions. Biofilm highlights, Springer: 81-109.
Fritzmann, C., J. Löwenberg, T. Wintgens and T. Melin (2007). "State-of-the-art of
reverse osmosis desalination." Desalination 216(1): 1-76.
Grant, G. T., E. R. Morris, D. A. Rees, P. J. Smith and D. Thom (1973). "Biological
interactions between polysaccharides and divalent cations: the egg‐box model."
FEBS letters 32(1): 195-198.
Ham, Y., Y. Kim, Y. Ju, S. Lee and S. Hong (2013). "Characterization of natural
organic matters using flow field-flow fractionation and its implication to membrane
fouling." Desalination and Water Treatment 51(31-33): 6378-6391.
Hammes, F., M. Berney, Y. Wang, M. Vital, O. Köster and T. Egli (2008). "Flow-
cytometric total bacterial cell counts as a descriptive microbiological parameter for
drinking water treatment processes." Water Research 42(1–2): 269-277.
Hammes, F., E. Salhi, O. Köster, H.-P. Kaiser, T. Egli and U. von Gunten (2006).
"Mechanistic and kinetic evaluation of organic disinfection by-product and
assimilable organic carbon (AOC) formation during the ozonation of drinking water."
Water Research 40(12): 2275-2286.
Hammes, F. A. and T. Egli (2005). "New Method for Assimilable Organic Carbon
Determination Using Flow-Cytometric Enumeration and a Natural Microbial
Consortium as Inoculum." Environmental Science & Technology 39(9): 3289-3294.
Han, L., S. Galier and H. Roux-de Balmann (2017). "A phenomenological model to
evaluate the performances of electrodialysis for the desalination of saline water
containing organic solutes." Desalination 422: 17-24.
Harlev, N., A. Bogler, O. Lahav and M. Herzberg (2019). "Acidification and
decarbonization in seawater: Potential pretreatment steps for biofouling control in
SWRO membranes." Desalination 467: 86-94.
Harvey, G. R., D. A. Boran, L. A. Chesal and J. M. Tokar (1983). "The structure of
marine fulvic and humic acids." Marine Chemistry 12(2): 119-132.
Hassan, A., M. Al-Sofi, A. Al-Amoudi, A. Jamaluddin, A. Farooque, A. Rowaili, A.
Dalvi, N. Kither, G. Mustafa and I. Al-Tisan (1998). "A new approach to membrane
References
131
and thermal seawater desalination processes using nanofiltration membranes (Part
1)." Desalination 118(1-3): 35-51.
Hassan, A., A. Farooque, A. Jamaluddin, M. Al-Sofi, A. Al-Ajlan, O. Hamed, A. Al-
Amoudi, A. Al-Rubaian, N. Kither and A. Al-Azzaz (2002). Conversion and
operation of the commercial Umm Lujj SWRO plant from a single SWRO
desalination process to the new dual NF-SWRO desalination process. IDA
Conference, Manama Bahrain.
Hem, L. J. and H. Efraimsen (2001). "Assimilable organic carbon in molecular weight
fractions of natural organic matter." Water Research 35(4): 1106-1110.
Herzberg, M. and M. Elimelech (2007). "Biofouling of reverse osmosis membranes:
role of biofilm-enhanced osmotic pressure." Journal of Membrane Science 295(1-2):
11-20.
Herzberg, M., S. Kang and M. Elimelech (2009). "Role of Extracellular Polymeric
Substances (EPS) in Biofouling of Reverse Osmosis Membranes." Environmental
Science & Technology 43(12): 4393-4398.
Holm‐Hansen, O. and C. R. Booth (1966). "The Measurement of Adenosine
Triphosphate in the Ocean and its Ecological SIGNIFICANCE1." Limnology and
Oceanography 11(4): 510-519.
Hong, S. and M. Elimelech (1997). "Chemical and physical aspects of natural organic
matter (NOM) fouling of nanofiltration membranes." Journal of Membrane Science
132(2): 159-181.
Hozalski, R. M., E. J. Bouwer and S. Goel (1999). "Removal of natural organic matter
(NOM) from drinking water supplies by ozone-biofiltration." Water science and
technology 40(9): 157-163.
Huang, W.-J., G.-C. Fang and C.-C. Wang (2005). "The determination and fate of
disinfection by-products from ozonation of polluted raw water." Science of the Total
Environment 345(1-3): 261-272.
Huber, S. A., A. Balz, M. Abert and W. Pronk (2011). "Characterisation of aquatic
humic and non-humic matter with size-exclusion chromatography--organic carbon
detection--organic nitrogen detection (LC-OCD-OND)." Water Res 45(2): 879-885.
References
132
Huck, P. M. (1990). "Measurement of Biodegradable Organic Matter and Bacterial
Growth Potential in Drinking Water." Journal (American Water Works Association)
82(7): 78-86.
Huehmer, R. P. (2009). MF/UF pretreatment in seawater desalination: applications
and trends. Proceedings of World Congress in Desalination and Reuse, International
Desalination Association, IDAWC/DB09-253, Dubai, UAE.
Hureiki, L., J.-P. Croué and B. Legube (1994). "Chlorination studies of free and
combined amino acids." Water Research 28(12): 2521-2531.
Hwang, G., C.-H. Lee, I.-S. Ahn and B. J. Mhin (2011). "Determination of reliable
Lewis acid–base surface tension components of a solid in LW–AB approach." Journal
of Industrial and Engineering Chemistry 17(1): 125-129.
Jamaly, S., N. Darwish, I. Ahmed and S. Hasan (2014). "A short review on reverse
osmosis pretreatment technologies." Desalination 354: 30-38.
Jeong, S., S.-J. Kim, L. Hee Kim, M. Seop Shin, S. Vigneswaran, T. Vinh Nguyen
and I. S. Kim (2013). "Foulant analysis of a reverse osmosis membrane used
pretreated seawater." Journal of Membrane Science 428: 434-444.
Jeong, S., S.-J. Kim, C. M. Kim, S. Vigneswaran, T. V. Nguyen, H.-K. Shon, J.
Kandasamy and I. S. Kim (2013). "A detailed organic matter characterization of
pretreated seawater using low pressure microfiltration hybrid systems." Journal of
membrane science 428: 290-300.
Jeong, S., G. Naidu and S. Vigneswaran (2013). "Submerged membrane adsorption
bioreactor as a pretreatment in seawater desalination for biofouling control."
Bioresource technology 141: 57-64.
Jeong, S., G. Naidu, S. Vigneswaran, C. H. Ma and S. A. Rice (2013). "A rapid
bioluminescence-based test of assimilable organic carbon for seawater." Desalination
317: 160-165.
Jeong, S., G. Naidu, R. Vollprecht, T. Leiknes and S. Vigneswaran (2016). "In-depth
analyses of organic matters in a full-scale seawater desalination plant and an autopsy
of reverse osmosis membrane." Separation and Purification Technology 162: 171-
179.
References
133
Jeong, S., S. A. Rice and S. Vigneswaran (2014). "Long-term effect on membrane
fouling in a new membrane bioreactor as a pretreatment to seawater desalination."
Bioresource technology 165: 60-68.
Jeong, S. and S. Vigneswaran (2015). "Practical use of standard pore blocking index
as an indicator of biofouling potential in seawater desalination." Desalination 365: 8-
14.
Jermann, D., W. Pronk, S. Meylan and M. Boller (2007). "Interplay of different NOM
fouling mechanisms during ultrafiltration for drinking water production." Water
Research 41(8): 1713-1722.
Jiang, S., Y. Li and B. P. Ladewig (2017). "A review of reverse osmosis membrane
fouling and control strategies." Science of The Total Environment 595: 567-583.
Jin, X., X. Huang and E. M. V. Hoek (2009). "Role of Specific Ion Interactions in
Seawater RO Membrane Fouling by Alginic Acid." Environmental Science &
Technology 43(10): 3580-3587.
Jin, Y., H. Lee, Y. O. Jin and S. Hong (2017). "Application of multiple modified
fouling index (MFI) measurements at full-scale SWRO plant." Desalination 407: 24-
32.
Kaplan, L. A., T. L. Bott and D. J. Reasoner (1993). "Evaluation and simplification
of the assimilable organic carbon nutrient bioassay for bacterial growth in drinking
water." Applied and environmental microbiology 59(5): 1532-1539.
Karabelas, A. J., M. Kostoglou and C. P. Koutsou (2015). "Modeling of spiral wound
membrane desalination modules and plants – review and research priorities."
Desalination 356: 165-186.
Katsoufidou, K., S. G. Yiantsios and A. J. Karabelas (2007). "Experimental study of
ultrafiltration membrane fouling by sodium alginate and flux recovery by
backwashing." Journal of Membrane Science 300(1–2): 137-146.
Kaya, C., G. Sert, N. Kabay, M. Arda, M. Yüksel and Ö. Egemen (2015). "Pre-
treatment with nanofiltration (NF) in seawater desalination—Preliminary integrated
membrane tests in Urla, Turkey." Desalination 369: 10-17.
Khan, M. T., P.-Y. Hong, N. Nada and J. P. Croue (2015). "Does chlorination of
seawater reverse osmosis membranes control biofouling?" Water research 78: 84-97.
References
134
Kim, L. H. and T. H. Chong (2017). "Physiological Responses of Salinity-Stressed
Vibrio sp. and the Effect on the Biofilm Formation on a Nanofiltration Membrane."
Environmental science & technology 51(3): 1249-1258.
Kitade, T., B. Wu, T. H. Chong, A. G. Fane and T. Uemura (2013). "Fouling reduction
in MBR-RO processes: the effect of MBR F/M ratio." Desalination and Water
Treatment 51(25-27): 4829-4838.
Kunacheva, C. and D. C. Stuckey (2014). "Analytical methods for soluble microbial
products (SMP) and extracellular polymers (ECP) in wastewater treatment systems:
a review." Water Research 61: 1-18.
Labban, O., C. Liu and T. H. Chong (2017). "Fundamentals of low-pressure
nanofiltration: Membrane characterization, modeling, and understanding the multi-
ionic interactions in water softening." Journal of Membrane Science 521: 18-32.
Labban, O., C. Liu, T. H. Chong and J. H. Lienhard (2018). "Relating transport
modeling to nanofiltration membrane fabrication: Navigating the permeability-
selectivity trade-off in desalination pretreatment." Journal of Membrane Science 554:
26-38.
LeChevallier, M. (2013). "Measurement of biostability and impacts on water
treatment in the US." Microbial Growth in Drinking Water Supplies: 33.
LeChevallier, M. W., N. E. Shaw, L. A. Kaplan and T. L. Bott (1993). "Development
of a rapid assimilable organic carbon method for water." Applied and Environmental
Microbiology 59(5): 1526-1531.
Lee, S. and M. Elimelech (2006). "Relating Organic Fouling of Reverse Osmosis
Membranes to Intermolecular Adhesion Forces." Environmental Science &
Technology 40(3): 980-987.
Lee, S., S. Kim, J. Cho and E. M. V. Hoek (2007). "Natural organic matter fouling
due to foulant–membrane physicochemical interactions." Desalination 202(1-3):
377-384.
Lee, S., S. R. Suwarno, B. W. H. Quek, L. Kim, B. Wu and T. H. Chong (2019). "A
comparison of gravity-driven membrane (GDM) reactor and biofiltration+ GDM
reactor for seawater reverse osmosis desalination pretreatment." Water research 154:
72-83.
References
135
Leenheer, J. (1994). "Chemistry of dissolved organic matter in rivers, lakes, and
reservoirs." Advances in Chemistry[ADV. CHEM. SER.]. 1994.
Leparc, J., S. Rapenne, C. Courties, P. Lebaron, J. P. Croué, V. Jacquemet and G.
Turner (2007). "Water quality and performance evaluation at seawater reverse
osmosis plants through the use of advanced analytical tools." Desalination 203(1-3):
243-255.
Li, Q. and M. Elimelech (2004). "Organic Fouling and Chemical Cleaning of
Nanofiltration Membranes: Measurements and Mechanisms." Environmental
Science & Technology 38(17): 4683-4693.
Li, Q. and M. Elimelech (2006). "Synergistic effects in combined fouling of a loose
nanofiltration membrane by colloidal materials and natural organic matter." Journal
of Membrane Science 278(1-2): 72-82.
Li, Q., Z. Xu and I. Pinnau (2007). "Fouling of reverse osmosis membranes by
biopolymers in wastewater secondary effluent: Role of membrane surface properties
and initial permeate flux." Journal of Membrane Science 290(1–2): 173-181.
Li, S., S.-T. Lee, S. Sinha, T. Leiknes, G. L. Amy and N. Ghaffour (2016).
"Transparent exopolymer particles (TEP) removal efficiency by a combination of
coagulation and ultrafiltration to minimize SWRO membrane fouling." Water
research 102: 485-493.
Li, S., H. Winters, L. Villacorte, Y. Ekowati, A.-H. Emwas, M. Kennedy and G. L.
Amy (2015). "Compositional similarities and differences between transparent
exopolymer particles (TEPs) from two marine bacteria and two marine algae:
significance to surface biofouling." Marine Chemistry 174: 131-140.
Li, X., J. Li, B. Van der Bruggen, X. Sun, J. Shen, W. Han and L. Wang (2015).
"Fouling behavior of polyethersulfone ultrafiltration membranes functionalized with
sol–gel formed ZnO nanoparticles." RSC Advances 5(63): 50711-50719.
Lin, T., Z. Lu and W. Chen (2014). "Interaction mechanisms and predictions on
membrane fouling in an ultrafiltration system, using the XDLVO approach." Journal
of Membrane Science 461: 49-58.
Liu, C., L. Shi and R. Wang (2015). "Crosslinked layer-by-layer polyelectrolyte
nanofiltration hollow fiber membrane for low-pressure water softening with the
presence of SO42− in feed water." Journal of Membrane Science 486: 169-176.
References
136
Llenas, L., G. Ribera, X. Martínez-Lladó, M. Rovira and J. de Pablo (2013).
"Selection of nanofiltration membranes as pretreatment for scaling prevention in
SWRO using real seawater." Desalination and Water Treatment 51(4-6): 930-935.
Luján-Facundo, M., J. Fernández-Navarro, J. Alonso-Molina, I. Amorós-Muñoz, Y.
Moreno, J. Mendoza-Roca and L. Pastor-Alcañiz (2018). "The role of salinity on the
changes of the biomass characteristics and on the performance of an OMBR treating
tannery wastewater." Water research 142: 129-137.
Ma, W., Y. Zhao and L. Wang (2007). "The pretreatment with enhanced coagulation
and a UF membrane for seawater desalination with reverse osmosis." Desalination
203(1-3): 256-259.
Mänttäri, M., L. Puro, J. Nuortila-Jokinen and M. Nyström (2000). "Fouling effects
of polysaccharides and humic acid in nanofiltration." Journal of Membrane Science
165(1): 1-17.
Matilainen, A., E. T. Gjessing, T. Lahtinen, L. Hed, A. Bhatnagar and M. Sillanpää
(2011). "An overview of the methods used in the characterisation of natural organic
matter (NOM) in relation to drinking water treatment." Chemosphere 83(11): 1431-
1442.
Matin, A., Z. Khan, S. M. J. Zaidi and M. C. Boyce (2011). "Biofouling in reverse
osmosis membranes for seawater desalination: Phenomena and prevention."
Desalination 281: 1-16.
Matthiasson, E. and B. Sivik (1980). "Concentration polarization and fouling."
Desalination 35: 59-103.
Meagher, L., C. Klauber and R. M. Pashley (1996). "The influence of surface forces
on the fouling of polypropylene microfiltration membranes." Colloids and Surfaces
A: Physicochemical and Engineering Aspects 106(1): 63-81.
Meinders, J., H. Van der Mei and H. Busscher (1995). "Deposition efficiency and
reversibility of bacterial adhesion under flow." Journal of Colloid and Interface
Science 176(2): 329-341.
Meng, F., S.-R. Chae, A. Drews, M. Kraume, H.-S. Shin and F. Yang (2009). "Recent
advances in membrane bioreactors (MBRs): membrane fouling and membrane
material." Water research 43(6): 1489-1512.
References
137
Meylan, S., F. Hammes, J. Traber, E. Salhi, U. von Gunten and W. Pronk (2007).
"Permeability of low molecular weight organics through nanofiltration membranes."
Water Res 41(17): 3968-3976.
Miao, R., L. Wang, D. Deng, S. Li, J. Wang, T. Liu, M. Zhu and Y. Lv (2017).
"Evaluating the effects of sodium and magnesium on the interaction processes of
humic acid and ultrafiltration membrane surfaces." Journal of Membrane Science 526:
131-137.
Miao, R., L. Wang, M. Zhu, D. Deng, S. Li, J. Wang, T. Liu and Y. Lv (2017). "Effect
of Hydration Forces on Protein Fouling of Ultrafiltration Membranes: The Role of
Protein Charge, Hydrated Ion Species, and Membrane Hydrophilicity."
Environmental Science & Technology 51(1): 167-174.
Miyoshi, T., M. Hayashi, K. Shimamura and H. Matsuyama (2016). "Important
fractions of organic matter causing fouling of seawater reverse osmosis (SWRO)
membranes." Desalination 390: 72-80.
Mo, H., K. G. Tay and H. Y. Ng (2008). "Fouling of reverse osmosis membrane by
protein (BSA): Effects of pH, calcium, magnesium, ionic strength and temperature."
Journal of Membrane Science 315(1–2): 28-35.
Mulder, J. (2012). Basic principles of membrane technology, Springer Science &
Business Media.
Naidu, G., S. Jeong and S. Vigneswaran (2015). "Interaction of humic substances on
fouling in membrane distillation for seawater desalination." Chemical Engineering
Journal 262: 946-957.
Naidu, G., S. Jeong, S. Vigneswaran and S. A. Rice (2013). "Microbial activity in
biofilter used as a pretreatment for seawater desalination." Desalination 309: 254-260.
Nejati, S., S. A. Mirbagheri, D. M. Warsinger and M. Fazeli (2019). "Biofouling in
seawater reverse osmosis (SWRO): Impact of module geometry and mitigation with
ultrafiltration." Journal of Water Process Engineering 29: 100782.
Nilson, J. A. and F. A. DiGiano (1996). "Influence of NOM composition on
nanofiltration." American Water Works Association. Journal 88(5): 53.
Ogawa, H. and E. Tanoue (2003). "Dissolved organic matter in oceanic waters."
Journal of Oceanography 59(2): 129-147.
References
138
Park, J., K. Jeong, S. Baek, S. Park, M. Ligaray, T. H. Chong and K. H. Cho (2019).
"Modeling of NF/RO membrane fouling and flux decline using real-time
observations." Journal of membrane science 576: 66-77.
Park, S., T. Nam, J. You, E.-S. Kim, I. Choi, J. Park and K. H. Cho (2019). "Evaluating
membrane fouling potentials of dissolved organic matter in brackish water." Water
research 149: 65-73.
Passow, U. (2002). "Transparent exopolymer particles (TEP) in aquatic
environments." Progress in oceanography 55(3-4): 287-333.
Penru, Y., F. X. Simon, A. R. Guastalli, S. Esplugas, J. Llorens and S. Baig (2013).
"Characterization of natural organic matter from Mediterranean coastal seawater."
Journal of Water Supply: Research and Technology - Aqua 62(1): 42-51.
Perminova, I. V., F. H. Frimmel, A. V. Kudryavtsev, N. A. Kulikova, G. Abbt-Braun,
S. Hesse and V. S. Petrosyan (2003). "Molecular Weight Characteristics of Humic
Substances from Different Environments As Determined by Size Exclusion
Chromatography and Their Statistical Evaluation." Environmental Science &
Technology 37(11): 2477-2485.
Potts, D. E., R. C. Ahlert and S. S. Wang (1981). "A critical review of fouling of
reverse osmosis membranes." Desalination 36(3): 235-264.
Powell, L., N. Hilal and C. Wright (2017). "Atomic force microscopy study of the
biofouling and mechanical properties of virgin and industrially fouled reverse
osmosis membranes." Desalination 404: 313-321.
Qi, S., W. Li, Y. Zhao, N. Ma, J. Wei, T. W. Chin and C. Y. Tang (2012). "Influence
of the properties of layer-by-layer active layers on forward osmosis performance."
Journal of membrane science 423: 536-542.
Richardson, S. D. (2003). "Disinfection by-products and other emerging
contaminants in drinking water." TrAC Trends in Analytical Chemistry 22(10): 666-
684.
Ridgway, H. F., J. Orbell and S. Gray (2017). "Molecular simulations of polyamide
membrane materials used in desalination and water reuse applications: Recent
developments and future prospects." Journal of Membrane Science 524: 436-448.
References
139
Rodriguez, S. G. S. (2011). Particulate and Organic Matter Fouling of Seawater
Reverse Osmosis Systems: Characterization, Modelling and Applications. UNESCO-
IHE PhD Thesis, CRC Press.
Schäfer, A. I., U. Schwicker, M. M. Fischer, A. G. Fane and T. D. Waite (2000).
"Microfiltration of colloids and natural organic matter." Journal of Membrane
Science 171(2): 151-172.
Servais, P., G. Billen and M.-C. Hascoët (1987). "Determination of the biodegradable
fraction of dissolved organic matter in waters." Water research 21(4): 445-450.
Shon, H. K., S. H. Kim, S. Vigneswaran, R. Ben Aim, S. Lee and J. Cho (2009).
"Physicochemical pretreatment of seawater: fouling reduction and membrane
characterization." Desalination 238(1): 10-21.
Shon, H. K., S. Vigneswaran and J. Cho (2008). "Comparison of physico-chemical
pretreatment methods to seawater reverse osmosis: Detailed analyses of molecular
weight distribution of organic matter in initial stage." Journal of Membrane Science
320(1–2): 151-158.
Shutova, Y., B. L. Karna, A. C. Hambly, B. Lau, R. K. Henderson and P. Le-Clech
(2016). "Enhancing organic matter removal in desalination pretreatment systems by
application of dissolved air flotation." Desalination 383: 12-21.
Siddiqui, M. F., M. Rzechowicz, H.-S. Oh, N. Saeidi, L. J. Hui, H. Winters, A. G.
Fane and T. H. Chong (2015). "The efficacy of tannic acid in controlling biofouling
by Pseudomonas aeruginosa is dependent on nutrient conditions and bacterial
density." International Biodeterioration & Biodegradation 104: 74-82.
Sim, L. N., T. H. Chong, A. H. Taheri, S. Sim, L. Lai, W. B. Krantz and A. G. Fane
(2017). "A review of fouling indices and monitoring techniques for reverse osmosis."
Desalination.
Sim, L. N., S. R. Suwarno, D. Y. S. Lee, E. R. Cornelissen, A. G. Fane and T. H.
Chong (2019). "Online monitoring of transparent exopolymer particles (TEP) by a
novel membrane-based spectrophotometric method." Chemosphere 220: 107-115.
Simon, F. X., Y. Penru, A. R. Guastalli, S. Esplugas, J. Llorens and S. Baig (2013).
"NOM characterization by LC-OCD in a SWRO desalination line." Desalination and
Water Treatment 51(7-9): 1776-1780.
References
140
Song, L. and M. Elimelech (1995). "Theory of concentration polarization in
crossflow filtration." Journal of the Chemical Society, Faraday Transactions 91(19):
3389-3398.
Song, L. and S. Yu (1999). "Concentration polarization in cross-flow reverse
osmosis." American Institute of Chemical Engineers. AIChE Journal 45(5): 921.
Song, Y., X. Gao and C. Gao (2013). "Evaluation of scaling potential in a pilot-scale
NF–SWRO integrated seawater desalination system." Journal of membrane science
443: 201-209.
Suwarno, S. R., X. Chen, T. H. Chong, V. L. Puspitasari, D. McDougald, Y. Cohen,
S. A. Rice and A. G. Fane (2012). "The impact of flux and spacers on biofilm
development on reverse osmosis membranes." Journal of Membrane Science 405-
406: 219-232.
Tang, C. Y., T. H. Chong and A. G. Fane (2011). "Colloidal interactions and fouling
of NF and RO membranes: a review." Adv Colloid Interface Sci 164(1-2): 126-143.
Tang, C. Y., Y.-N. Kwon and J. O. Leckie (2009). "The role of foulant–foulant
electrostatic interaction on limiting flux for RO and NF membranes during humic
acid fouling—Theoretical basis, experimental evidence, and AFM interaction force
measurement." Journal of Membrane Science 326(2): 526-532.
Teng, C., M. Hawlader and A. Malek (2003). "An experiment with different
pretreatment methods." Desalination 156(1-3): 51-58.
Terry, L. G. and R. S. Summers (2018). "Biodegradable organic matter and rapid-rate
biofilter performance: A review." Water research 128: 234-245.
Thurman, E. M. (1985). Organic geochemistry of natural waters, Springer Science &
Business Media.
Thwala, J. M., M. Li, M. C. Wong, S. Kang, E. M. Hoek and B. B. Mamba (2013).
"Bacteria–polymeric membrane interactions: atomic force microscopy and XDLVO
predictions." Langmuir 29(45): 13773-13782.
Tiraferri, A., Y. Kang, E. P. Giannelis and M. Elimelech (2012). "Superhydrophilic
thin-film composite forward osmosis membranes for organic fouling control: fouling
behavior and antifouling mechanisms." Environmental science & technology 46(20):
11135-11144.
References
141
Uhlinger, R. A. (2001). Desalination method and apparatus utilizing nanofiltration
and reverse osmosis membranes, Google Patents.
van der Kooij, D. (1992). "Assimilable organic carbon as an indicator of bacterial
regrowth." Journal (American Water Works Association): 57-65.
van der Kooij, D., W. A. M. Hijnen and J. C. Kruithof (1989). "The Effects of
Ozonation, Biological Filtration and Distribution on the Concentration of Easily
Assimilable Organic Carbon (AOC) in Drinking Water." Ozone: Science &
Engineering 11(3): 297-311.
van der Kooij, D., A. Visser and W. A. M. Hijnen (1982). "Determining the
concentration of easily assimilable organic carbon in drinking water." Journal
(American Water Works Association) 74(10): 540-545.
Van Oss, C., A. Docoslis, W. Wu and R. Giese (1999). "Influence of macroscopic and
microscopic interactions on kinetic rate constants: I. Role of the extended DLVO
theory in determining the kinetic adsorption constant of proteins in aqueous media,
using von Smoluchowski’s approach." Colloids and Surfaces B: Biointerfaces 14(1-
4): 99-104.
van Oss, C. J. (1993). "Acid—base interfacial interactions in aqueous media."
Colloids and Surfaces A: Physicochemical and Engineering Aspects 78: 1-49.
Van Oss, C. J. (2006). Interfacial forces in aqueous media, CRC press.
Vetter, T., E. Perdue, E. Ingall, J.-F. Koprivnjak and P. Pfromm (2007). "Combining
reverse osmosis and electrodialysis for more complete recovery of dissolved organic
matter from seawater." Separation and purification Technology 56(3): 383-387.
Villacorte, L., Y. Ekowati, H. Calix-Ponce, V. Kisielius, J. Kleijn, J. S. Vrouwenvelder,
J. Schippers and M. Kennedy (2017). "Biofouling in capillary and spiral wound
membranes facilitated by marine algal bloom." Desalination 424: 74-84.
Villacorte, L. O., Y. Ekowati, T. R. Neu, J. M. Kleijn, H. Winters, G. Amy, J. C.
Schippers and M. D. Kennedy (2015). "Characterisation of algal organic matter
produced by bloom-forming marine and freshwater algae." water research 73: 216-
230.
Voutchkov, N. and R. Semiat (2008). "Seawater desalination." Advanced membrane
technology and applications: 47-86.
References
142
Wadekar, S. S. and R. D. Vidic (2017). "Influence of active layer on separation
potentials of nanofiltration membranes for inorganic ions." Environmental science &
technology 51(10): 5658-5665.
Wang, Q., T. Tao, K. Xin, S. Li and W. Zhang (2014). "A review research of
assimilable organic carbon bioassay." Desalination and Water Treatment 52(13-15):
2734-2740.
Water, D. and P. Solutions (2005). "FILMTEC™ Reverse Osmosis Membranes
Technical Manual." Dow Water and Process Solutions: Midland, MI, USA.
Weinrich, L., C. N. Haas and M. W. LeChevallier (2013). "Recent advances in
measuring and modeling reverse osmosis membrane fouling in seawater desalination:
a review." Journal of Water Reuse and Desalination 3(2): 85-101.
Weinrich, L., M. LeChevallier and C. N. Haas (2016). "Contribution of assimilable
organic carbon to biological fouling in seawater reverse osmosis membrane
treatment." Water Res 101: 203-213.
Wright, J. (1995). Seawater: its composition, properties, and behaviour, Pergamon.
Wu, B., T. Christen, H. S. Tan, F. Hochstrasser, S. R. Suwarno, X. Liu, T. H. Chong,
M. Burkhardt, W. Pronk and A. G. Fane (2017). "Improved performance of gravity-
driven membrane filtration for seawater pretreatment: Implications of membrane
module configuration." Water Research 114: 59-68.
Yang, X., C. Shang and P. Westerhoff (2007). "Factors affecting formation of
haloacetonitriles, haloketones, chloropicrin and cyanogen halides during
chloramination." Water Research 41(6): 1193-1200.
Yaroshchuk, A. E. (2008). "Negative rejection of ions in pressure-driven membrane
processes." Advances in colloid and interface science 139(1-2): 150-173.
Yu, H., F. Qu, H. Chang, S. Shao, X. Zou, G. Li and H. Liang (2015). "Understanding
ultrafiltration membrane fouling by soluble microbial product and effluent organic
matter using fluorescence excitation–emission matrix coupled with parallel factor
analysis." International Biodeterioration & Biodegradation 102: 56-63.
Yu, H., Y. Song, R. Liu, B. Xi, E. Du and S. Xiao (2014). "Variation of dissolved
fulvic acid from wetland measured by UV spectrum deconvolution and fluorescence
excitation-emission matrix spectrum with self-organizing map." Journal of soils and
sediments 14(6): 1088.
References
143
Yuan, W. and A. L. Zydney (1999). "Humic acid fouling during microfiltration."
Journal of Membrane Science 157(1): 1-12.
Zhang, Y., L. Pinoy, B. Meesschaert and B. Van der Bruggen (2011). "Separation of
small organic ions from salts by ion‐exchange membrane in electrodialysis." AIChE
Journal 57(8): 2070-2078.
Zhao, L., L. Shen, Y. He, H. Hong and H. Lin (2015). "Influence of membrane surface
roughness on interfacial interactions with sludge flocs in a submerged membrane
bioreactor." Journal of colloid and interface science 446: 84-90.
Zhou, D., L. Zhu, Y. Fu, M. Zhu and L. Xue (2015). "Development of lower cost
seawater desalination processes using nanofiltration technologies—A review."
Desalination 376: 109-116.
Zhou, Z., L. Guo and E. C. Minor (2016). "Characterization of bulk and
chromophoric dissolved organic matter in the Laurentian Great Lakes during summer
2013." Journal of Great Lakes Research 42(4): 789-801.
Zularisam, A. W., A. F. Ismail and R. Salim (2006). "Behaviours of natural organic
matter in membrane filtration for surface water treatment — a review." Desalination
194(1): 211-231.