Embed Size (px)
Citation preview

FOUCHÉ, JOHANN
An Interactive Multimedia Program for the Teaching of Electrical Principles to Senior Secondary Pupils.
M.Ed. UP 1995

An Interactive Multimedia Program for the Teaching of Electrical Principles to Senior Secondary Pupils.
A mini-dissertation by
Johann Fouché
submitted in partial fulfilment of the requirements for the degree
Magister Educationis
in
Computer-Assisted Education
in the Department of Didactics
of the Faculty of Education
University of Pretoria
Supervisor: Prof. Dr. J.C. Cronjé
October 1995

SAMEVATTING
'n Interaktiewe Multimedia Program vir die Onderrig van Elektriese Beginsels aan Senior Sekondêre Leerlinge
'n Skripsie deur
Johann Fouché
Studieleier: Prof. Dr. J.C. Cronjé
Departement: Didaktiek
Graad: M.Ed. (RGO)
Die doel van hierdie navorsing was die ontwikkeling van 'n multimedia program vir
die aanleer van elektriese beginsels en om verslag te doen oor die β-toetsing van die
produk.
Die standpunt van die ontwerper/navorser was dat die kenmerk van 'n suksesvolle
program is dat die denkmodelle van gebruikers en ontwerper oor die program
ooreenstem.
Die navorser het verskeie metodes gebruik om die denkmodelle van gebruikers te
beskryf. Verskille in denkmodelle wat bestaan het tussen gebruikers en
ontwerper/navorser, is gebruik om aanbevelings te maak ter verbetering van die
program.
Datatendense is as hipoteses geïdentifiseer wat in opvolgstudies aangespreek kan
word.
i

ACKNOWLEDGEMENTS
“ To the only wise God be glory forevermore through Jesus Christ ...” Romans. 16:27
This study would not have been possible without the help from Above, and the help
from very special people. My sincere thanks to:
• Johannes, my supervisor, mentor and coach, for your enduring support and
encouragement;
• my wife, Dorothy, for all the encouragement, love, support and prayers, for taking
over many of the responsibilities at home and enduring the state of my desk over
many months;
• my three sons, Johann, Stéfan and Handré for your ideas and your being there to
help me in the testing of the program;
• my mother and mother-in-law for their moral assistance and prayers;
• my fellow M.Ed. students for the wonderful class atmosphere over the past two
years;
• Siemens Nixdorf for sponsoring the development of the program;
• Annelise Kachelhoffer, Cheryl Hodgkinson, Johan Knoetze, Irene le Roux and
Johan Möller for sharing your knowledge and wisdom;
• my colleague, Lukas du Plessis, for your help during the pilot testing of the
product;
• the students from the two schools who so willingly helped me to assess the
program.
ii

TABLE OF CONTENTS
CHAPTER 1 INTRODUCTION 1
1. Introduction 1
2. The scope of the project 1
3. The educational soundness of multimedia 2
4. The research problem and sub-problems 4
5. Aims of the study 5
6. Hypothesis 5
7. Previous research 5
8. The research plan 6
8.1 The research strategy 6
8.1.1 Mental modelling as a research strategy 6 8.1.2 Conditions to be met for mental modelling as a research
strategy 7
8.2 Methods and procedures 7
8.3 Identification of target group 8
8.4 Data collection 9
8.5 Data analysis 10
9. Value of the research 10
CHAPTER 2 LITERATURE STUDY 11
1. Introduction 11
2. The term "multimedia" 11
3. The computer as a cognitive tool 12
3.1 Constructivism and cognitive theory 13
3.1.1 Assumptions of constructivism 13 3.1.1.1 Learning is constructed 13
iii

3.1.1.2 Interpretation is personal 13 3.1.1.3 Learning is active 13 3.1.1.4 Learning is collaborative 14 3.1.1.5 Learning is situated 14 3.1.1.6 Testing is integrated into learning 15
3.1.2 Constructivism and instructional design 15 3.1.3 Cognitive apprenticeship and cognitive scaffolding 16
4. Mental models 16
4.1 What are mental models? 16
4.2 Mental models and interactive learning systems 17
4.3 Mental models and learning style 18
4.4 Construction of a mental model 19
4.5 The value of mental model research 19
5. Mental models and interface design 20
5.1 The interface 20
5.2 Principles for interface design 21
5.3 Memory models and interface design 22
6. The computer as an interactive tool 23
6.1 Interactivity 23
6.2 The goals of interactivity 24
6.3 Levels of interactivity 24
6.4 Learner control 26
7. The South African science syllabus 27
8. CAI programs and the teaching of electrical principles 30
8.1 Introduction 30
8.2 Commercial software 30
8.3 Need for locally developed software 31
iv

CHAPTER 3 PROGRAM DESCRIPTION 33
1. Introduction 33
2. Why design an interactive multimedia program? 33
3. Program design principles 34
4. Theoretical principles incorporated into the program 35
4.1 Cognitive learning theory incorporated into the program design 35
4.1.1 Constructed learning sequences 35 4.1.2 Personal interpretation screens 37 4.1.3 Screen designs to enhance active learning 39 4.1.4 Collaborative learning and screen design 40 4.1.5 Realistic screens to provide for situated learning 41 4.1.6 Integrated testing 41 4.1.7 Cognitive apprenticeship and cognitive scaffolding 42
4.2 Mental models 43
4.3 Interactivity 44
4.4 Learner control 45
5. Topics covered by the program 45
6. Designing the program 46
6.1 Program description 46
6.2 Program flow 47
7. Developing the program 48
7.1 Programming tools 48
7.1.1 Authoring tools 48 7.1.2 Graphic tools 49 7.1.3 Animation tools 49 7.1.4 Sound tools 49
7.2 Some multimedia components 49
7.2.1 Graphic design principles 49 7.2.2 Animation 50 7.2.3 Sound 51
v

7.2.4 Video 51
7.3 Navigation 51
CHAPTER 4 RESEARCH PROCEDURES 54
1. Introduction 54
2. Qualitative vs. quantitative research 54
3. Identification of a target group 56
4. Measuring mental models 56
4.1 Methods employed in existing mental models research 56
4.2 Methods employed by the researcher 59
4.2.1 Observation of users using the system 59 4.2.2 Sketches 60 4.2.3 Performance tests 60 4.2.4 Navigational pathways 60 4.2.5 Questionnaires 60 4.2.6 Other methods to obtain mental models 61
4.3 Summary of methods used to obtain mental models 61
CHAPTER 5 RESEARCH RESULTS AND DISCUSSION OF RESULTS 62
1. Introduction 62
2. Demographic variables 63
2.1 Cultural background 63
2.2 Gender 63
2.3 Differences in academic ability 63
2.4 Previous computer experience 64
3. The use of the system 65
3.1 Observation of users using the system 65
3.1.1 Use of the mouse 66 3.1.2 Password problems 67 3.1.3 Using Help 68
vi

4. The use of the program 68
4.1 Affective aspects 68
4.1.1 Interaction 70 4.1.1.1 Interaction results 70 4.1.1.2 Discussion of the results of Table 11 70
4.1.2 Interface 72 4.1.2.1 Interface results 72 4.1.2.2 Discussion of the results of Table 12 73
4.1.3 Involvement 74 4.1.3.1 Involvement results 74 4.1.3.2 Discussion of the results of Table 13 74
4.1.4 Motivation 75 4.1.4.1 Motivation results 75 4.1.4.2 Discussion of the results of Table 14 75
4.1.5 Rate 77 4.1.5.1 Rate results 77 4.1.5.2 Discussion of the results of Table 15 77
4.2 Time spent with the program 78
4.3 Navigation 79
4.3.1 Navigation through the program 79 4.3.2 Navigational pathways 79
5. Program content 86
5.1 Acquisition of learning – concepts 86
5.1.1 The concept “atom” 86 5.1.2 Concept “electricity” 90
5.2 Performance tests 91
6. Conclusion 92
CHAPTER 6 INTERPRETATION OF RESULTS 94
1. Introduction 94
2. The research questions 94
3. Tentative answers to the research questions 95
vii

4. Mental models and interface design 95
5. Description of users’ mental models 95
6. Using users’ mental models for program improvement 97
7. Using users’ mental models to describe the acquisition of learning – concepts 99
7.1 The concept “atom” 99
7.2 The concept “electricity” 100
8. User factors 100
8.1 Demographic variables and navigation 100
8.1.1 Gender and navigational path 101 8.1.2 Previous computer experience 101 8.1.3 Cultural background 101
8.2 Navigational pathways and the outcome of learning 102
8.3 Learner control 102
8.4 Affective characteristics and learning from the program 102
9. Limitations of the study 104
10. Recommendations 104
10.1 Recommendations with regard to the program design 105
10.2 Recommendations for further research 105
11. Conclusion 106
REFERENCES 107
INTRODUCTION TO BASIC ELECTRICITY VERSION 1 INSTALLATION NOTES 127
1. Minimum system requirements 127
2. System configuration considerations 127
3. Installing Introduction to Basic Electricity 128
4. Starting and quitting Introduction to Basic Electricity. 129
5. Incompatibilities and other known problems 129
viii

ix

LIST OF TABLES
Table 1. Target group identification matrix 9
Table 2. Data collection matrix: Reeves (1993) 10
Table 3. Electrostatic topics covered in the Standard 6 - 10 syllabus 27
Table 4. Topics in current electricity covered in the Standard 6 - 10 syllabus 28
Table 5. Electrical effects covered in the Standard 6 - 10 syllabus 29
Table 6. Methods used to obtain users' mental models 61
Table 7. Computer experience of the test group. 64
Table 8. Students having problems with drag-and-drop mouse actions 66
Table 9. Students who experienced password problems 67
Table 10. Students accessing the help facility 68
Table 11. Students' opinions on interaction 70
Table 12. Students' opinions on the interface 72
Table 13. Students' opinions on involvement 74
Table 14. Students' opinions on motivation 75
Table 15. Students' opinions about the rate 77
Table 16. Historical development of the atomic model 87
Table 17. Sketches of atoms 88
Table 18. Categories of atom concepts 88
Table 19. Changes in users' models of the concept "atom" 89
Table 20. Sketches of the concept "electricity" 90
Table 21. Changes in the mental models users have of the concept "Electricity" 91
Table 22. Results of the on-line test 92
Table 23. Description of the mental models of the researcher and program users 96
Table 24. Gender and navigation 101
x
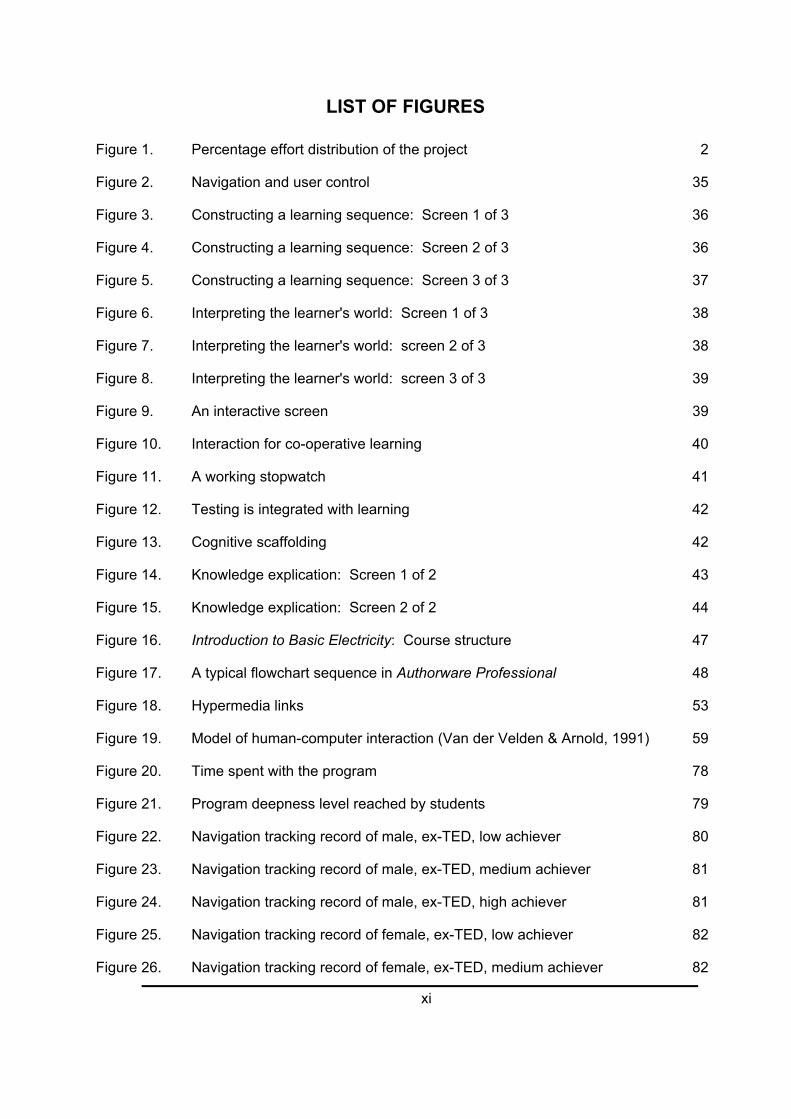
LIST OF FIGURES
Figure 1. Percentage effort distribution of the project 2
Figure 2. Navigation and user control 35
Figure 3. Constructing a learning sequence: Screen 1 of 3 36
Figure 4. Constructing a learning sequence: Screen 2 of 3 36
Figure 5. Constructing a learning sequence: Screen 3 of 3 37
Figure 6. Interpreting the learner's world: Screen 1 of 3 38
Figure 7. Interpreting the learner's world: screen 2 of 3 38
Figure 8. Interpreting the learner's world: screen 3 of 3 39
Figure 9. An interactive screen 39
Figure 10. Interaction for co-operative learning 40
Figure 11. A working stopwatch 41
Figure 12. Testing is integrated with learning 42
Figure 13. Cognitive scaffolding 42
Figure 14. Knowledge explication: Screen 1 of 2 43
Figure 15. Knowledge explication: Screen 2 of 2 44
Figure 16. Introduction to Basic Electricity: Course structure 47
Figure 17. A typical flowchart sequence in Authorware Professional 48
Figure 18. Hypermedia links 53
Figure 19. Model of human-computer interaction (Van der Velden & Arnold, 1991) 59
Figure 20. Time spent with the program 78
Figure 21. Program deepness level reached by students 79
Figure 22. Navigation tracking record of male, ex-TED, low achiever 80
Figure 23. Navigation tracking record of male, ex-TED, medium achiever 81
Figure 24. Navigation tracking record of male, ex-TED, high achiever 81
Figure 25. Navigation tracking record of female, ex-TED, low achiever 82
Figure 26. Navigation tracking record of female, ex-TED, medium achiever 82
xi

Figure 27. Navigation tracking record of female, ex-TED, high achiever 83
Figure 28. Navigation tracking record of male, ex-DET, low achiever 83
Figure 29. Navigation tracking record of male, ex-DET, medium achiever 84
Figure 30. Navigation tracking record of male, ex-DET, high achiever 84
Figure 31. Navigation tracking record of female, ex-DET, low achiever 85
Figure 32. Navigation tracking record of female, ex-DET, medium achiever 85
Figure 33. Navigation tracking record of female, ex-DET, high achiever 86
xii

LIST OF APPENDICES
Appendix A. The pre-program questionnaire 118
Appendix B. Post-program questionnaire 120
Appendix C. An example of tracking data 122
Appendix D. Program deepness level 126
Appendix E. Program installation notes 127
xiii

Chapter 1 Introduction
1. Introduction
During the 1990s, there has been a world-wide explosion in the development and
utilisation of multimedia. Multimedia can be defined as the provision and integration
of music, voice, still pictures, text, animation and motion video by means of a
computer interface program (compare Kellner, 1991; Magel, 1990; Strothman, 1991).
Berk & Devlin (1990) view multimedia in a much wider context: "...to qualify for the
title multimedia, an application needs only to incorporate two or more of the following:
still or animated graphics, still or motion video, audio, or text and numerical data” (p.
15). Galbreath (1992) agreed with this: “...multimedia of today usually means the
integration of two or more communications media that can be controlled or
manipulated by the user via a computer” (p. 15).
Much of the development and most of the implementation of multimedia seem,
however, to be guided by habit, intuition, prejudice, economic factors and guesswork.
The rush to bring multimedia products to market or to disseminate the technology
throughout education and training, has led to the fact that a solid research base
seems largely absent. (Reeves, 1993).
2. The scope of the project
This project consists of two major components, which should be judged as a whole.
The most important component is the development of an interactive multimedia
program to teach the principles of electricity to adolescents. About 70% of the total
effort put into the project, went into the development of the product. The second
component is a dissertation of about 110 pages which reports on the field testing (β
testing) of the product.
Figure 1 on page 2 is a graphical representation of the distribution of effort of the
project.
Chapter 1. Introduction. 1

Figure 1. Percentage effort distribution of the project
Effort Distribution
Programming50%
Preparation10%
Preparation10%
Alphatesting 10%
Beta testing(dissertation)
30%
3. The educational soundness of multimedia
Currently, international business interests are constantly promoting the idea that
multimedia can provide students with a learning environment that is unparalleled in
its effectiveness. On the other hand, the assumption that multimedia will
automatically support learning should be carefully examined. Clark (1983) states that
media are "...mere vehicles that deliver instruction but do not influence student
achievement any more than the truck that delivers our groceries causes changes in
our nutrition" (p 445). Multimedia can not and will not guarantee learning any more
than an encyclopaedia or a library in a school can.
Chapter 1. Introduction. 2

However, it is also true that many people can learn from an encyclopaedia without
any instructional assistance being provided. In the same way, students can possibly
learn, incidentally or intentionally, from a multimedia program without pedagogical
rules being incorporated into the program.
On the other hand, many industrially available software programs claim to be
“educational” software. These claims tend to be unsubstantiated by research
(Reeves, 1993). The creators of these products also prefer to emphasise the
technical, rather than the pedagogical aspects of their programs. (Shuell &
Schueckler, 1989; Knussen et. al., 1991).
Clark (1985) points out that "media advocacy" is one of the more "...predictable,
reoccurring enthusiasms" in education. He cites televised instruction and computer-
based instruction (CBI) as two major "enthusiasms", and his work specifically
examines computer based instruction (although it can be generalised to apply to
multimedia).
Clark feels that most research on computer- based education is confounded, i.e., it
confuses and mingles the variables involved. "Whenever computers are used to
deliver instruction, any resulting change in student learning or performance may be
attributed to the uncontrolled effects of different instruction methods, content, and/or
novelty." (Clark, 1985). He points out that computer-based instruction often involves
a different instructor and an order of magnitude more preparation than that of the
classroom instruction to which it is being compared. The CBI may also involve a
curriculum reform or innovation not present in the classroom "control".
Clark has recently updated his position, which essentially remains unchanged, about
educational media (Clark, 1991, 1994). He emphasises that methods are what
influence learning; he feels any method can be delivered through a variety of media.
Programmed instruction (PI) on the computer demonstrates a superiority to other
instructional methods, but it also shows a superiority when it is administered with
text. PI is associated with the computer, but it is not the computer necessarily that
makes it successful. PI, as a method, is more structured, has shorter steps, has
reduced verbal loads, and is more self-pacing than other methods. He feels the
method is the independent variable, not the computer.
Chapter 1. Introduction. 3

Findings suggest that when teachers judge a piece of instructional software, they rely
on published reviews prepared by individuals and groups with priorities quite different
from their own (Borton & Rossett, 1989; compare Burger, 1991; Owston et. al.,
1988; Preece, 1985). But, even ratings from software review services are not valid
indicators of the educational value of software. (Jolicoeur & Berger, 1988). When
software is judged only on the basis of subjective factors, as is the case with most
software evaluation services, one cannot assume students will learn from it. (Zahner
et. al., 1992).
There is thus a need for objective information on the effectiveness of educational
software programs. Reeves (1993) supports this fact: “When interactive multimedia
programs are designed intentionally to support learning, some level of pedagogy is
required” (p. 81).
4. The research problem and sub-problems
This study tries to answer the following major research questions and sub-questions:
1. What design factors should be incorporated into the design of an interactive
multimedia program, developed to teach electrical principles to adolescents?
2. Which user factors should be catered for in the design of this interactive
multimedia program?
2.1. How do gender, previous computer experience and cultural
background influence navigation of learners through the interactive
multimedia program?
2.2. How do the navigational pathways of learners through the program
relate to the outcome of learning?
2.3. What learner control is advisable in a multimedia tutorial program?
3. How will certain affective characteristics of users influence their learning from
this developed program?
Chapter 1. Introduction. 4

5. Aims of the study
The aims of this study are thus two-fold:
1. to design and develop an interactive multimedia program, Introduction to
Basic Electricity, to teach principles of electricity to adolescents; (70% of the
project) and
2. to identify human factors that will influence the effectiveness of the program
(30% of the project).
6. Hypothesis
This study is hypothesis-generating (Mouton, 1992). Therefore, it is descriptive,
rather than empirical. Due to this fact, this study will use the following pseudo-
hypothesis:
1. An interactive multimedia program can be developed to teach electrical
principles to adolescents;
2. Demographic variables such as sex, age, education and previous experience
with computers will significantly influence the mental models of the specific
learner; and
3. Demographic variables such as sex, age, education and previous experience
with computers will significantly influence the navigational pathways through
an interactive multimedia program.
7. Previous research
Clark (1992, 1994), Janniro (1993), Lanza & Roselli (1991) and various other
researchers have used comparative research methods to investigate the
effectiveness of computer based approaches to other approaches. Many of these
findings have revealed no significant differences.
Chapter 1. Introduction. 5

Ross & Morrison (1989) have done media replication or attribute isolation research
methods where they have attempted to isolate an attribute or dimension of computer-
based instruction (for example, learner control) and estimate its effectiveness in a
variety of implementations. Ross & Morrison concluded that their findings have been
inconsistent, but more frequently negative than positive. Reeves (1992) described
numerous theoretical and methodological flaws in existing media replication studies.
Phillips (1980), Reeves (1990, 1992, 1993), Sanders (1991) criticised existing
studies in detail. According to these criticisms, media comparison and media
replication are inadequate as scientific foundations for instructional design of
interactive multimedia.
8. The research plan
Reeves (1993) calls for a multi-faceted approach to research, which includes the
conduct of intensive case studies, and the application of mental modelling.
Furthermore, the aim of these studies should be the construction of prescriptive
theory. Investigations of interactive multimedia should include both observational
and regression methods.
For this study, observational methods as well as questionnaires and electronic
tracking programs were used to identify and describe the mental models formed by
users while working through the interactive multimedia program. Once these models
had been identified, the models were be used to evaluate the effectiveness of the
developed interactive multimedia program.
8.1 The research strategy
8.1.1 Mental modelling as a research strategy
Learning results in organising memory into definite structures or mental models
(Merrill, 1991). Therefore, mental modelling (Sasse, 1991) was used as the research
strategy. The following steps were taken:
1. an interactive multimedia program was developed for use in the teaching of
electrical principles to adolescents;
Chapter 1. Introduction. 6

2. a theoretical model of learning via interactive multimedia, including input,
context, process and outcome dimensions was adopted;
3. the dimensions of the mental models of the users using the developed
interactive multimedia program in a practical education context were
measured;
4. the mental models of the users were analysed in order to establish the
effectiveness of the developed interactive multimedia program; and
5. possible research questions on the design and use of interactive multimedia
for future research were identified. (See Reeves, (1993)).
8.1.2 Conditions to be met for mental modelling as a research strategy
Reeves (1993) states that the following conditions should be met when determining
users’ mental models:
1. The learners should be involved in purposeful learning, driven by either
intrinsic or extrinsic motivation;
2. The learners should spend ample time (rather than a few minutes) interacting
with the software;
3. The population of the learners should be diverse. Individual differences
among learners with respect to aptitude, knowledge, skill, attitudes,
personality, characteristics, previous experience, motivation, etc. should be
accounted for.
Application of these conditions implies that a target group was selected out of a
diverse population with respect to previous experience, skill, academic achievement,
and social conditions. The target group consisted of students who had a need for
training in electrical principles. The learners were allowed to interact with the
program for a maximum of 1½ hours.
8.2 Methods and procedures
The following procedures were followed in this study (compare Muller, 1985):
Chapter 1. Introduction. 7

1. An interactive multimedia program, Introduction to Basic Electricity, designed
to teach electrical principles, was developed using Authorware Professional
as an authoring tool.
2. Questionnaires were used to assess the demographic variables sex, age,
education and previous experience with computers.
3. A questionnaire addressing the affective domain of the user was completed.
4. The learners were then allowed to interact with the developed interactive
multimedia program for a maximum of 90 minutes. An electronic tracking
program was built into the developed interactive multimedia program to trace
the learners’ paths through the program as well as their responses to queries.
5. While the users worked with the program, their mental models were assessed
through careful observation of their reactions.
6. On-line tests and interviews were used to assess that learning did take place.
8.3 Identification of target group
A sample of 12 pupils was identified according to the following representation matrix:
Chapter 1. Introduction. 8

Table 1. Target group identification matrix
Academic ability
Low Medium High
Male, former TED-school mtl mtm mth
Female, former TED-school ftl ftm fth
Male, former DET-school mdl mdm mdh
Female, former DET-school fdl fdm fdh
Code: mtl = male, former TED, low ability; fdh = female, former DET, high ability, etc.
Standard 8 pupils from two schools were invited to attend extra classes in Physical
Science. During these extra classes, students worked through the developed
interactive multimedia program.
8.4 Data collection
The data collection matrix (Table 2, page 10) sums up methods of data collection that
enabled the researcher to obtain answers to the questions set out above.
Chapter 1. Introduction. 9

Table 2. Data collection matrix: Reeves (1993)
Questions Anec
dota
l Rec
ords
Obs
erva
tions
Use
r Que
stio
nnai
res
Use
r Int
ervi
ews
Trac
king
log
On-
Line
Dat
a
What design factors should be incorporated into the design of an interactive multimedia program, developed to teach electrical principles to adolescents?How do gender, previous computer experience and cultural background influence the navigational pathways of learners through the interactive multimedia program?
How do the navigational pathways of learners through the program relate to the outcome of learning?
What learner control is advisable in a multimedia tutorial program?How will certain affective characteristics of users influence the learning from this developed program?
8.5 Data analysis
Since the data was mostly anecdotal, it was inductively analysed through the
processes of inductive generalisation and abstraction.
9. Value of the research
1. It is hoped that the research will result in a well designed and educationally
sound interactive multimedia program to teach electrical principles to
standard 6 to 10 pupils, developed specifically for the South African market,
which could be used effectively in and outside the classroom.
2. Laurel (1990) states that presently, what we know about interface design is
much more of an art than a science. Therefore, this research project, done
on a program specifically designed for education and training, should
contribute to the field of instructional design.
Chapter 1. Introduction. 10
Chapter 2 Literature Study
1. Introduction
This study can be subdivided into two main components, to be judged as a whole.
The most important component (70% of the effort) is the design of an interactive
multimedia program to teach the principles of electricity to adolescents. The other
component consists of the beta-testing of the product.
Taking the above into account, the literature study will focus on
1. the instructional design of multimedia programs; and
2. how the impact that a multimedia program has on its users, can be evaluated.
The purpose of this chapter is thus to provide an overview of the use of the computer
as a cognitive tool in computer-assisted instruction (CAI) using an interactive
multimedia program. Research findings on constructivism and the relationship to
mental model theory and interface design are discussed. The importance of
interactivity and the limitations of total learner control are reviewed.
A brief overview is provided of available CAI programs on the teaching of electricity,
and limitations and constraints of these programs are pointed out.
2. The term "multimedia"
Christensen et. al. (1993), define multimedia as the use of multiple media which are
controlled and/or created by a computer, while hypermedia is seen as the
combination of multimedia and hypertext where pieces of information represented in
multiple media are connected by meaningful links.
Ralston (1991), is of the opinion that the term hypermedia should be used instead of
the term multimedia: “... the term multimedia is redundant; media is already plural in
character. Moreover, multimedia has previously been widely applied as describing a
Chapter 2. Literature study 11

far different entertainment industry....Using hypermedia instead in microcomputer
discussions today is a better choice. It correctly connotes its interactive desktop
computer driven character. This property distinguishes hypermedia from those song-
and-dance multimedia concerts and shows of the 1960s that gave the latter its earlier
and still predominant meaning..." (p. 58).
To Kommers (1994), the difference between (multi) media and hypermedia is that
(multi) media takes the user along in a consistent sequence of episodes that refers to
a lay-out, story or scenario that can be understood. The scenario or layout can in
some way or another be predicted from cultural experience and prior knowledge.
Hypermedia, on the other hand, allows the user to jump away from a current piece of
information to a certain aspect which is only an arbitrary detail of the previous scope.
Although the argument of Ralston does make some sense, the term multimedia will
be used throughout the study according to the definition of Kommers (1994),
because of the fact that the developed program does not really make use of
hypertext (Nelson, 1974) in the presentation of new information, although the
program does use hypertext in the help-screens.
Multimedia is also an extension of the classroom presentation: "...We have always
been instructed by methods that targeted more than one of our senses. Classroom
instructors lecture (to our hearing) and gesture (sight); they lecture and write on the
blackboard; we read aloud to our parents or are read to aloud. We intuitively "know"
illustrations and demonstrations help us to learn, but our instructors have been
limited physically as to how much visual material could be presented. Multimedia
and other electronic presentations are really just an extension of classroom
presentations, a way of capturing for repeated use, the best demonstrations and
illustrations, a way of allowing an educator's work to be honed to an educationally
sharp edge and then be preserved for consumption by many more students than
could fit in one classroom." (Christensen et. al., 1993, p. 20).
3. The computer as a cognitive tool
Kozma (1987, 1994) defines cognitive tools as software programs that use the
control capabilities of the computer to amplify, extend or enhance human cognition.
Chapter 2. Literature study 12

These programs are designed to aid users in task-relevant, cognitive components of
a performance, while leaving the performance open-ended and controlled by the
learner.
3.1 Constructivism and cognitive theory
Over the recent past, there has been a shift away from the emphasis on behavioural
theories of teaching and learning towards cognitive learning theory. A natural outflow
of this has been a shift towards instructional theories and strategies that will facilitate
cognitive learning processes. The shift towards cognitive theory has placed an
emphasis on the learner as an active processor of information who is trying to make
sense of the presented material (Mayer, 1992).
3.1.1 Assumptions of constructivism
Cognitive constructivist theorists assume the following:
3.1.1.1 Learning is constructed
Knowledge is constructed from experience. Learning is a process where the learner
builds an internal representation of previous knowledge, while building up structures
of experience (Bednar et. al., 1991; Cunningham, 1991).
3.1.1.2 Interpretation is personal
Learning is a personal interpretation of the world and there is no shared reality.
Learners do not transfer knowledge from the external world into their memories,
rather, they create interpretations of the world based upon their past experiences and
their interaction in the world (Bednar et. al., 1991; Cunningham, 1991; Duffy &
Jonassen, 1991).
3.1.1.3 Learning is active
Learning is an active process in which meaning is developed on the basis of
experience. (Benbar et. al., 1991). To Merrill (1991) an instructional transaction is
the same as an active learner. An instructional transaction is, according to Merrill, a
Chapter 2. Literature study 13

mutual, dynamic, real-time, give-and-take between an instructional system and a
student during which an exchange of information is actively taking place.
3.1.1.4 Learning is collaborative
The sharing of multiple perspectives leads to conceptual growth. These multiple
perspectives lead to the changing of the learner's internal representations. The role
of education should thus be to promote collaborations with others to show the
multiple perspectives that can exist pertaining to a particular problem. The learner
then has to choose his own perspective from where he can commit himself.
(Cunningham, 1991; compare Bednar et. al., 1991; Duffy & Jonassen, 1991).
3.1.1.5 Learning is situated
Learning should occur in realistic settings. It should be situated and anchored in a
rich context, reflective of the real world contexts. (Bednar et. al., 1991).
Perkins (1991) mentions the following five facets of a learning environment:
1. Information Banks
The textbook can be considered to be the classic information bank. An
information bank is any resource that, more than anything else, serves as a
source of explicit information about topics. We should not forget the human
information bank – the teacher.
2. Symbol Pads
The function of an educational environment is to provide a surface for the
construction and manipulation of symbols.
3. Construction Kits
Construction kits, for example Lego, are kits that can be fruitfully utilised in
classroom teaching. Construction kits for a variety of experiments in physics,
chemistry and biology are commercially available and can be found in most
classrooms.
Chapter 2. Literature study 14

4. Phenomenaria
A phenomenarium is an area for the specific purpose of presenting
phenomena and making them accessible to scrutiny and manipulation. In
computer terms, a computer simulation is a good example of a
phenomenarium.
5. Task Managers
Task managers are elements in the environment that set tasks to be
undertaken in the course of learning, guide and sometimes help with the
execution of those tasks, and provide feedback regarding process and/or
product. In this regard, the computer has the ability to be an excellent task
manager.
3.1.1.6 Testing is integrated into learning
Testing should be integrated with the task and should not be a separate activity. The
measurement of learning should be to find how instrumental the learner's knowledge
is in facilitating thinking in the content field. Assessment is through seeing if the
students can successfully construct plausible solutions to the tasks they are
presented with. (Benbar et. al., 1991; Cunningham, 1991).
Testing has two main functions:
1. to evaluate learning; and
2. to rank students according to specified criteria.
The aim of this study is the continuous evaluation of the amount of learning that took
place during the interaction with the program.
3.1.2 Constructivism and instructional design
Constructivists' ideas, as explained in paragraph 3.1.1, regarding learning contexts
and multiple learning exposures are extremely important if designers are to be
concerned with the transfer of skills from the learning site to the site at which they will
be used (Dick, 1991).
Chapter 2. Literature study 15

3.1.3 Cognitive apprenticeship and cognitive scaffolding
Cognitive apprenticeship is an instructional strategy that is particularly appropriate to
provide authentic experiences. (Duffy & Jonassen, 1991). Scaffolds are forms of
support provided by the teacher (or another student) to help students bridge the gap
between their current abilities and the intended goal (Rosenshine & Meister, 1992).
Perkins (1991) distinguishes between BIG constructivism and WIG constructivism.
BIG stands for "beyond the information given" while WIG is an acronym for "without
the information given".
A BIG approach introduces contrast, using imaginistic mental models, perhaps
computer-based, to clarify it. The learners will then have the opportunity to work
through a number of thought-oriented activities that will challenge them to apply and
generalise their initial understandings.
A WIG approach will supply the necessary equipment needed, and the learners will
be encouraged to make sense of a phenomenon, with scaffolding as necessary,
using their existing mental models.
4. Mental models
4.1 What are mental models?
Merrill (1991), developed the Second Generation Instructional Design Theory (ID2),
which is a cognitive rather than behavioural model. The ID2 theory starts from the
basic assumption that learning results in the organising of memory into structures,
termed mental models. Johnson-Laird (1983), is of the opinion that mental models
are constructed from procedures provided by schema, while Gentner & Stevens
(1983), viewed the mental model theory as an attempt to model and explain human
understanding of objects and phenomenon.
Therefore, the impact study for this program will centre around the mental models
generated by the interaction with the developed multimedia program in order to use
these models to determine the effectiveness of the program.
Chapter 2. Literature study 16

Mental models are constructed by experiences and modified as a result of every new
experience. Therefore, the student needs a variety of experiences to construct an
adequate mental model. (Merrill, 1991). Mental models will thus colour all human
behaviour. This implies that an awareness and managing of our mental models can
provide us with some control over our experience and proficiency in specific tasks.
A mental model is not a formal model. The model can be analogical, incomplete, and
sometimes very fragmentary with respect to its representation of how an integrated
learning system functions (Norman, 1983). Users change their mental models while
constructing them through the interaction with the system.
Mental models affect such factors as the effort we devote to tasks, our persistence,
our expectation and prediction of results, and our levels of satisfaction after task
execution (Jih & Reeves, 1992).
Ackermann and Greutmann's (1990) research on the role of mental models in
programming shows that there are great variations among individual mental models.
Mental models can be either verbal and propositional or visual and spatial (Rouse
and Morris, 1985). Mental models are frequently pictorial or image-like rather than
symbolic and representational. Malamed (1991) supports this view by suggesting
that animations, for instance, could make abstract contents tangible, resulting in the
formation of a mental model.
4.2 Mental models and interactive learning systems
Norman (1983) makes a clear distinction between a system, the conceptual model of
the system, and the mental model of the system:
1. target system – the actual thing, in this case, the computer system.
2. conceptual model – a correct description of the target system, as far as the
human-machine interface is concerned, developed by the teacher and / or
designer.
3. mental model – the knowledge structure the user applies in his interaction
with the computer.
Chapter 2. Literature study 17

The existence and value of mental models lie in the fact that the quality of interaction
within integrated learning systems depends upon the functionality of the learners'
mental models of the systems. When learners possess an adequate mental model of
the structure and functions of hypertext or other complex integrated learning
systems, they are less likely to become disoriented and they are more likely to learn.
(Jih & Reeves, 1992).
Gentner & Stevens (1983) argues that because a mental model is a model that
evolves in the mind of a user as he or she learns and interacts with a computer
system, the mental model will represent the structure and internal relationships of a
system.
To van der Veer (1989), the user's mental model is the source of the user's
expectations about the effects of actions and therefore it can guide navigation or
planning of actions and contribute to the interpretation of feedback.
An ideal user's working mental model is one that is consistent with the conceptual
model of the interface developed by designers. Strong or accurate mental models
show a functional or spatial similarity to the system or to the image the system
presents to the users (Norman, 1983). Weak, inaccurate mental models lack key
components or features of the actual system. Fisher (1991) did a qualitative study on
users' usage patterns of a complex system. The study revealed that their mental
models contained concepts that did not exist in the system, and further, that there
were subsets of the system of which users were unaware. (Reported by Jih &
Reeves, 1992).
4.3 Mental models and learning style
Payne (1987) reported that users create different mental models in order to meet the
needs of their various styles of learning. Briggs (1990) found that the roles of
learners' mental models vary according to whether the learners are engaged in
internally or externally directed learning processes.
Externally driven interactive learning contexts involve some sort of highly structured
computer tutorial. In such a context, the learner's own mental model serves as the
Chapter 2. Literature study 18

communication aid between the tutorial program and that learner. (Jih & Reeves,
1992).
On the other hand, when learning involves internally driven processes, such as is the
case in many hypertext based multimedia programs, the mental model plays a more
important role in directing the learning experience. Jih & Reeves, (1992) state that
when learners rely on trial and error, the guidance of a manual, or on another
learner’s advice, they tend to learn only what they think they need to know and skip
everything else.
In many such internally driven contexts, learners form inaccurate or inappropriate
mental models. According to Briggs (1990), a good manual or on-line help system
could help for this type of learning.
4.4 Construction of a mental model
Waern (1990) suggests that there are two approaches to constructing mental
models, depending upon whether or not learners have prior knowledge about the
system. The bottom-up approach is used by learners who react to incoming bits and
pieces of information, interact with the system, and gradually build a more consistent
and complete mental model from the ground upward.
In the top-down approach, learners fall back on existing knowledge, modify it, and
reconstruct it into a new mental model according to the information they perceive
while interacting with the system. Most users use the top-down approach to
construct their mental models, but new learners tend to use the bottom-up approach.
Mayer (1981) concluded that users systematically develop a mental model for any
task environment in which they engage.
4.5 The value of mental model research
Mental model research is based on the assumption that knowledge of how users
represent systems and how users should represent systems will lead to a better
understanding of usable systems (Ackermann & Tauber, 1990). Merrill (1991)
remarked that a complex mental model enables the learner to engage in some
complex human enterprise or integrated activity.
Chapter 2. Literature study 19

To Jih & Reeves (1992), mental models and the research on mental models are of
the utmost importance. “Since our understanding of human perception does (or
should) play a crucial role in the design of interfaces, research on mental models is a
promising approach to analysing human-computer interaction and improving
interface designs.” (Jih & Reeves, 1992, p. 44). According to de Kleer & Brown,
(1985), current theories of mental models suggest the potential effectiveness of
qualitative models in teaching students about scientific systems.
5. Mental models and interface design
Mental models or internal representations for objects, events and ideas can also be
applied to interface design (Marchionini, 1991). The mental models are active, called
into play to explain the world and to predict which actions to take. Mental models are
incomplete and often inaccurate, but they help people deal with the world on a daily
basis.
The interface is the basis for the mental models that users develop when interacting
with computer displays. Designers should therefore be concerned with ways in
which to assist users in quickly developing accurate and meaningful mental models
for their systems.
5.1 The interface
The human-computer interface is a communication channel between the user and
the computer (Marchionini, 1991). The interface includes
1. physical components which include input devices such as keyboards, mice,
touch panels; and output devices such as visual displays and sound or
speech synthesisers; and
2. conceptual components which include selection methods such as command
languages, menus, and manipulation, and representation schemes such as
screen layout and graphic/text mixes.
Chapter 2. Literature study 20

Computer interface styles consistent with this model include menus, query-by-
example, and direct manipulation. Beginners will prefer menus to command
languages because recognising an option is easier than remembering a command.
Direct manipulation interfaces (kiosks, touch panels, input devices for video games)
share the load between physical and cognitive activity. In addition, their immediate
feedback and reversibility invite user exploration.
5.2 Principles for interface design
Marchionini (1991), proposes the following principles for interface design:
1. The interface should compensate for human physical and cognitive limitations
whenever possible. However, the interface should be "transparent", not
getting in the way of the user's actions or impeding his or her progress.
Unnecessary "bells and whistles" could interfere or distract from the task at
hand.
2. The physical components of the interface should be ergonomically designed.
Selection buttons should be close to text to minimise unnecessary mouse
movement.
3. The interface should be consistent. Selection methods, positioning of
important text and buttons, text fonts and styles, and window layout and
management should be consistent in parts of the interface.
4. Non-command interaction styles such as direct manipulation and menus are
preferable to command languages. This implies that multiple choice
responses are preferable to text-input type of responses.
5. The interface should handle errors by providing simple and concise error
messages. These messages should assist the user in error recovery and
future avoidance.
6. The interface should support reversible actions (e.g. the BACK button, or the
UNDO capability).
Chapter 2. Literature study 21

7. The interface should be subjected to formative testing early in the design
process.
8. The interface should be designed around the needs of the user rather than
added after a system has been completed.
5.3 Memory models and interface design
Marchionini (1991), developed the Information Processing Model of Cognition which
provides a foundation for interface design. This model establishes that:
1. humans have a working memory limited to five to seven chunks of
information;
2. humans must have their attention refreshed frequently; and
3. recalling information requires more cognitive effort than recognising
information.
In their Cognitive Flexibility Theory, Spiro, et al. (1990) describe the advantages that
hypermedia can bring to education with respect to complex, ill-structured fields. They
advocate the breaking down of larger concepts into smaller (more manageable)
pieces, rather than the traditional instructional approach of early simplification,
followed by incremental additions of complexity.
Kozma (1987), postulates that human memory can resemble computer memory. He
distinguished two types of memory:
1. Short-term memory.
The capacity of short-term memory is limited to five to seven chunks of
information. Where work of learning is done - capacity of - chunking - must
be continually refreshed or rehearsed. (Kozma, 1987; Bergers, 1994). This
means that in a multi-media system the amount of information that has to be
remembered by the user has to be minimised. If users have to remember
information for some time, make sure the total amount of items to be held in
memory does not exceed five.
Chapter 2. Literature study 22

2. Long-term memory
Not all information stored in short-term memory is passed to long-term
memory. The longer information stays in short-term memory, or the longer it
is operated on or transformed there, the more likely it is that it will enter long-
term memory. Once it has entered long-term memory, it will be stored
permanently.
Long-term memory is organised in several overlapping ways (Bergers, 1994).
The basic organisation of long-term memory is thought to be semantic. Data
are stored in terms of linguistically based concepts linked together in a highly
developed network of meaningful categories.
Information is stored in long-term memory in two forms: verbal or pictorial. Verbal
memory consists of a large number of schemata (a set of verbal ideas that
are interconnected, in the same lines as a hypertext system.)
6. The computer as an interactive tool
"Computers are not self-implementing. Like any tool, they do the work to which they
are applied, but the quality of the result depends upon the skill of the craftsperson
who uses that tool." (Fulton 1993, p. 5).
6.1 Interactivity
For media, including relatively passive ones such as books and video, some degree
of interactivity is involved. According to Jih & Reeves (1992), a major advantage of
interactive learning materials over other instructional media lies in the kind of
"interactivity" that they demand of learners. Borsook, et. al. (1991, p. 11), agree to
this: "What makes the computer unique in the long history of educational media is its
potential for interactivity". Multimedia, as computer-based learning, can offer optimal
levels of interactivity to students (Christensen et. al. 1993). "Interactivity is the
reason d’être of CBI; without it there is seldom any compelling reason to use
computers for instruction." (Kearsley, 1985, p. 210).
Chapter 2. Literature study 23

Jaspers (1991a, p. 21), notes: "...because of the growing availability of
microcomputers and computer assisted learning and other 'interactive delivery
systems' such as simulation programs, hypertext, database resources, interactive
video etc., the learner is becoming more and more emancipated from the control of
the school, the teacher...".
In passive media, the interactivity is more dependent upon the existing mental
processes and internal motivations of the learner than in interactive learning systems.
(Jih & Reeves, 1992).
6.2 The goals of interactivity
The interfaces presented in interactive learning systems are specifically designed to
engage the learner in external actions such as making choices, answering questions,
and solving problems. (Jih & Reeves, 1992). These interactive behaviours have the
goal to engage cognitive processes and / or increase motivation. Interactivity is
assumed to lead to increased learner motivation and to enhanced performance and
productivity (Malone, 1981).
6.3 Levels of interactivity
Jaspers (1991a) outlines various degrees of interactivity for specific types of
instructional media:
1. Linear media — overt and cognitive interactions by the students are
necessary to avoid mere “page turning”.
2. Feedback media — students get feedback from their reaction to a specific
action initiated by the medium.
3. Adaptive media — the reactions of the students will determine the objective,
route, difficulty level followed within the program.
4. Communications media — students are allowed to feed questions, decisions,
problems, and information into medium's system, to be reacted on by the
medium.
Chapter 2. Literature study 24

Borsook, et. al. (1991) identify the following variables that they feel are necessary to
provide some degree of interactivity:
1. Immediacy of response
2. Non-sequential access of information
3. Adaptability
4. Feedback
To them feedback is essential to an interactive program. "Interactivity stands on the
shoulders of feedback". (Borsook, et. al. (1991), p. 12).
Price (1991) accentuates individualisation. To be interactive, the exchange of
information, responses, and feedback between the learner and the computer should
be as individualised, adaptive, and personal as possible.
Interactivity can also be seen as communication between the user and the program.
To Burns et. al., (1991), the ideal type of interactivity for interactive learning systems
is approximating the exchanges that occur between a human tutor and a student.
Merrill et. al. (1990) support this view. According to them, interaction in the learning
process is an instructional transaction in which the learner and teacher – human or
otherwise – mutually and dynamically exchange information within the instructional
system.
The learner is an active participant in the teaching-learning process (Jonassen,
1985).
Interactive learning is indeed a simple and crucial idea, but a difficult goal to achieve.
(Jih & Reeves, 1992). To most designers, the idea of increasing interactivity in
instruction is very high on the priority list, but for the most part they continue to use
less interactive tools for education and training, such as lectures, textbooks, films,
slides, and videotapes (Becker, 1992).
Chapter 2. Literature study 25

6.4 Learner control
Although studies of the nature of the interactions between humans and interactive
learning systems have involved issues such as learner control (for example,
Steinberg, (1989)), additional research is needed on the interactions between
learners and the dimensions of the interface used to guide interactivity (Kozma,
1991; Reeves, 1992).
Barker’s reactive paradigm (Barker, 1990), is an essential part of the functionality of
the electronic media. This paradigm is defined as the facilities that allow students to
select and control:
1. what is learned;
2. the pace of learning;
3. the direction of learning; and
4. the style of learning.
Christensen et. al. (1993), argue that in the traditional classroom, control, by
necessity, had to remain firmly with the instructor. In a group situation, only one
person at a time could talk, and a class could only be conducted at one pace at a
time. Interaction with the instructor took place at the expense of the instructor's
lecture time and at the expense of the time of the other students. Hypermedia, and
other computer-based instructional methods are a way of allowing a number of
students to interact simultaneously with the instructor, and all at different paces, if
necessary. Research has shown that this form of learner control is motivating and
educationally productive (Kinzie, 1990; Ross & Morrison, 1989).
Jaspers (1991a, p. 21), notes, "...because of the growing availability of
microcomputers and computer assisted learning and other ‘interactive delivery
systems' such as simulation programs, hypertext, database resources, interactive
video etc., the learner is becoming more and more emancipated from the control of
the school, the teacher...".
Total learner control of a program is not recommendable. According to Borsook &
Higginbotham-Wheat (1991), empirical data show that total learner control is only
Chapter 2. Literature study 26

beneficial to those knowledgeable in the cognitive domain or those who are high
achievers. Rosselli (1991), studied the use of hypertext in the teaching of Pascal,
and found that the approach did not result in better overall performance but it did
result in better performance for the more independent and highly motivated students.
7. The South African science syllabus
Electrical topics covered in the South African syllabus for General Science and
Physical Science, can be categorised into three main topics: Electrostatics,
Electrical Current and the Effects of an Electrical Current.
Table 3. Electrostatic topics covered in the Standard 6 - 10 syllabus
Electrostatics
Standard Topic Practical work and demonstrations
6
7 Van de Graaff generator. Charge through friction. Effect of charged objects on one another – types of charges. Limitations of particle model – positive nucleus and negative electrons. Conservation of charge. The electroscope: charge by contact. Indication of presence and type of charge.
Demonstrations of static electrical effects.
8
9 HG
10 HG Force between charges – coulomb as unit of charge. Coulomb’s Law. Electric fields. Charge in an electric field experiences a force – potential energy. The volt. Quantisation of charge – Millikan’s experiment.
Electrical fields: around a point charge; Between two point charges; Between two parallel plates.
Chapter 2. Literature study 27

Table 4. Topics in current electricity covered in the Standard 6 - 10 syllabus
Current Electricity Standard Topic Practical work and
demonstrations 6 Cells; batteries; connectors; switches; light bulbs;
conductors; insulators. Positive / negative poles of a cell; conventional current. The series circuit. Cells in series: effect on current as indicated by light bulb. Light bulbs in series: concept of resistance.
Light bulbs in simple circuits. One / two / more than two cells in series.
7 Current. The ampére. Ammeter. Measuring current in different parts of circuit (series and parallel). Current as movement of charge. Unit of charge (Coulomb). Volt as energy transferred per unit charge. Voltmeter. Measuring potential using a voltmeter. Resistance as opposition to current flow. Ohm’s Law. Factors determining resistance: material; length; thickness; temperature. Series and parallel connection of cells and resistors. Ammeter and voltmeter readings. Circuits and circuit diagrams. Household wiring: mains, mains switch, fuses. Parallel connections. Safety measures: danger of unknown voltages; wiring of electric plugs, earthing; overloading of sockets.
Electrical measurements in a circuit.
8 Current: current as rate of flow of charge. Ammeter. Coulomb as unit of charge. Potential difference: Concept as energy per unit charge. The volt. Connecting a voltmeter. Resistance. Ohm’s Law. EMF of a cell Quantitative calculations.
Electrical measurements in a circuit. Ohm’s Law.
9 HG 10 HG Current as the flow of charge.
Resistance and Ohm’s law. Ohm’s Law.
Chapter 2. Literature study 28

Table 5. Electrical effects covered in the Standard 6 - 10 syllabus
Effects of an Electrical Current
Standard Topic Practical work and demonstrations
6 Heating; energy transformation; fuses. Chemical: energy transformations Magnetic: movement of compass needle; electromagnets. Hand rule for polarity of a solenoid.
Heating by electrical current. Fuses. Electrical decomposition of copper(II)chloride solution. Electromagnets
7
8 Rise in temperature. Magnetic effects. Lifting magnet, relay, loudspeaker, telephone, electric bell. Electromagnetic induction. AC dynamo. Principle of the transformer.
Heating effect. Electro-magnetic effect. Electromagnetic induction
9 HG
10 HG Force experienced by a current-bearing conductor in a magnetic field. Force between current-bearing conductors – definition of the ampére. Heating effect – calculations.
Electro-magnetic effect. Force between two current-bearing conductors. Heating effect.
Chapter 2. Literature study 29

8. CAI programs and the teaching of electrical principles
8.1 Introduction
In the USA, it is not strange to find a computer in virtually every classroom
(McCarthy, 1993). For instance, at Sandy Creek High School in Atlanta, Georgia,
each classroom comes equipped with a Macintosh LCII teacher / student workstation
– each of which, in turn, is networked to a central file server. The high school also
has five computer laboratories, each with 26 networked machines. In order to make
the maximum use of the technology, each teacher is required to attend training
sessions on instructional strategies to implement the computer. It follows logically
that in order to fully utilise the computer, substantial software must be available.
8.2 Commercial software
Numerous science programs are available that are specifically aimed at the
American market. A few programs were reviewed:
Science 2000 is a multimedia program that provides the resources needed to deliver
a solid, activity-based science course. All the aspects of physical science for the
middle school science curriculum are covered in this program. High School Science
(Mindplay) is a science package running on the Macintosh.
Unfortunately, much of the content covered in these programs do not fit into the
South African syllabus.
The Electric Chemistry Building (Snowbird Software) is a simulation program of
inorganic, physical and organic chemistry laboratories. The program allows students
to perform laboratory-less experiments either individually or with instruction. This
excellent program looks deeper into the fundamentals of electro-chemistry, but do
not address the physical aspects of electricity. Quarky and Quaysoo’s Turbo
Science is aimed at children ages 9 – 14. The program provides a game
environment to learn about science topics such as electricity, aerodynamics, gravity
and states of matter. The program contains over 2000 science-related questions.
Chapter 2. Literature study 30

The goal of the program is for students to correctly answer the questions in the least
amount of time with the help of two space elves, Quarky and Quaysoo.
The tutorial Physics Topics Electricity (William K Bradford) covers the following
topics for grades 9-12: electrical charge, electrical potential, capacitance, current
and resistance and multiple resistors. This program is written for the Macintosh.
Advanced Physics (William K Bradford) is a fully illustrated, animated review of topics
for advanced high school physics students. The program covers advanced topics in
physics, which is well beyond that required by the South African syllabus. The
program Physical Science Topics (William K Bradford) is an interactive tutorial which
offers instruction through text and pictures, aimed at students grades 7 – 12. The
program runs on a Macintosh. A DOS version of the program is also available.
Electricity topics covered are: electric charge, electrical potential, current and
resistance. The program makes use of very simple animations and low-resolution
graphics.
Electric Circuits (William K Bradford) is a program written for the Apple II range of
computers. The program consists of three modules. Ohm’s Law is a simulation of
Ohm’s Law using a water-flow model. Circuit Lab allows the user to create 25
electrical circuits, while Circuit Builder is an open-ended circuit board to construct
and test student designed circuits.
8.3 Need for locally developed software
Not all software is portable. Collis. & De Diana (1990) defined software portability as
the feasibility of software usage with or without adaptation, in an educational
environment other from that for which the software was originally designed and
produced.
Multimedia programs for Physical Science, specifically addressing the electrical
topics covered in the South African syllabus, simply do not exist. Multimedia
software used in South African schools, should fit into the South African syllabus.
Although every subject has its own subject specific content that universally overlaps,
it is also true that every syllabus places specific emphasis on certain subject areas.
For instance, the American Civil War does not receive the same emphasis (in fact, it
Chapter 2. Literature study 31

is hardly mentioned) in the South African syllabus, as it receives in the States.
Therefore, it can happen that subject specific multimedia developed in other
countries, could add little or no value to the needs of the South African learner.
American English presents a problem on both spelling and pronunciation. If a good
multimedia program, designed for teaching, teaches a child to spell "color", and the
teacher marks it wrong, who is to blame – the learner, the program, the author of the
program, or the teacher?
More specifically, USA- type electrical wiring conventions and standards are different
to the South African convention. In the USA, users typically use a 5 Amp fuse
incorporated in a two pin power plug when connecting an electrical device to the
main power source. They also have access to 110 V alternating current (AC). In
South Africa, we seldom use a fuse directly incorporated in our three pin power plug,
while we have access to 220 – 250 V AC power sources.
There is thus a need for a locally developed program on the teaching of electrical
principles that caters specifically for the needs of the South African market.
Chapter 2. Literature study 32

Chapter 3 Program Description
1. Introduction
The development of the program Introduction to Basic Electricity formed the major
part of this project. About 70% of the effort put into the project, went into the
development of an interactive multimedia program Introduction to Basic Electricity
designed to teach the principles of basic electricity. (See Figure 1, page 2).
2. Why design an interactive multimedia program?
When deciding on the type of CBI to develop, the researcher decided to develop a
multimedia program, because of the reasons proposed by Christensen et. al. (1993).
According to them, multimedia
1. can reach multiple senses and support different learning styles;
2. as computer-based learning, can offer optimal levels of interactivity to
students.;
3. offers special advantages for teaching about complex knowledge domains;
and
4. makes learning more interesting, more fun, more memorable.
The researcher took note of the following problems inherent to multimedia:
1. When evaluating multimedia in the educational process, we need to clearly
distinguish between the medium and the message.
2. The potential for users to get lost in the "hyperspace" of multi / hypermedia
requires that authors supply users with clear navigational aids.
3. Hypermedia gives more control to students, which can be to the greater
benefit of some students, with lesser benefits to others.
Chapter 3. Program description 33

After choosing the type of software, the researcher started extensive preparations for
the development of the software.
3. Program design principles
The design principles followed in the design of the multimedia program Introduction
to Basic Electricity, were similar to those suggested by Hewett (1987).
Therefore, the program was designed to:
1. give the user an appropriate level of control;
2. provide the user with an easy and consistent means to move from one place
to another and to quit when done;
3. give the user with enough information for the user's goal;
4. provide multiple paths through the information structure;
5. give the user an appropriate level of interactivity;
6. present information as attractively as possible, demonstrating exemplary use
of a full range of techniques of hypertext, multimedia and hypermedia; and
7. establish effective cues that aid the user in remembering the structure and
contents of the program and the user's place in the information space.
Figure 2, page 35, is an example of a screen where the first five principles outlined
above, were applied.
Chapter 3. Program description 34

Figure 2. Navigation and user control
4. Theoretical principles incorporated into the program
In Chapter 2, an extensive literature overview on modern trends in the development
of multimedia software was presented. The role of the computer as a cognitive tool in
computer assisted instruction was described and research findings on constructivism
and the relationship to mental model theory and interface design were discussed.
The importance of interactivity and the limitations of total learner control were also
highlighted.
Familiarity with the above is a necessary part in the development of computer-based
lessons. Therefore, the researcher planned and implemented the following elements
into the program design:
4.1 Cognitive learning theory incorporated into the program design
4.1.1 Constructed learning sequences
Because cognitive learning theory accepts the fact that knowledge is constructed
from experience, the researcher specifically designed screens incorporating this
Chapter 3. Program description 35

aspect. The following screen sequences from the module Introduction to Static
Electricity illustrate this principle:
Figure 3. Constructing a learning sequence: Screen 1 of 3
Figure 4. Constructing a learning sequence: Screen 2 of 3
Chapter 3. Program description 36

Figure 5. Constructing a learning sequence: Screen 3 of 3
4.1.2 Personal interpretation screens
According to cognitive learning theory, learning takes place by interpreting the
learner’s own personal world.
In the following screen sequences (Figure 6, page 38, Figure 7, page 38 and Figure
8, page 39) from the module Introduction to Static Electricity, the user first has to
comb his hair. When moving the comb towards the pieces of paper, (by dragging the
comb with the mouse), the pieces of paper are attracted to the comb. The learner
has to interpret this fact based on his previous experience in the program (learning
about the concept charge).
Static electrical effects are a part of everyday life. By interpreting these everyday
phenomena, and relating them to the theory of static electricity, learning will take
place.
Chapter 3. Program description 37

Figure 6. Interpreting the learner's world: Screen 1 of 3
Figure 7. Interpreting the learner's world: screen 2 of 3
Chapter 3. Program description 38

Figure 8. Interpreting the learner's world: screen 3 of 3
4.1.3 Screen designs to enhance active learning
Figure 9. An interactive screen
Because learning is an active process, numerous active interactions have been
designed and integrated into the program. For example, in the glass rod interaction
(Figure 9, page 39), the user has to move a glass rod towards a suspended sphere.
Chapter 3. Program description 39

As the rod is dragged towards the sphere, the sphere is repelled. The user is now
asked to draw conclusions from the experimental results.
4.1.4 Collaborative learning and screen design
In a classroom setting, this program is ideal to be used in a collaborative way
(Johnson & Johnson, 1985). Although this program has only been tested by
individuals, some interactions (for example, Coulomb’s Law – the Law, Figure 10,
page 40) have been designed in such a way that co-operative learning techniques
can be used in a class-room setting, in order to provide multiple perspectives to
assist the learner in the formation of his own internal representations.
Figure 10. Interaction for co-operative learning
Chapter 3. Program description 40

4.1.5 Realistic screens to provide for situated learning
Figure 11. A working stopwatch
Realistic screens have been designed to ensure that learning occurs in realistic
settings. For example, the simulation of a working stopwatch (Figure 11, page 41)
provides learners with the opportunity of operating a stopwatch. Ample
phenomenaria are designed within the program with the specific purpose of
presenting phenomena and making them accessible to manipulation.
4.1.6 Integrated testing
Apart from the normal tutorial type of questions and answers, two testing modules
have been built into the Static Electricity module (Figure 12, page 42). Apart from
this, provision is made for more formal tests. The learner can also optionally take a
quiz.
Chapter 3. Program description 41

Figure 12. Testing is integrated with learning
4.1.7 Cognitive apprenticeship and cognitive scaffolding
Figure 13. Cognitive scaffolding
The researcher used the WIG approach (Perkins, 1991) throughout in developing the
program. The unit Ohm’s Law – the Law is an example where the WIG approach
has been used. The user has to perform two experiments. By analysing the
Chapter 3. Program description 42

experimental results, the user is challenged to apply and generalise the initial
understandings.
In analysing the data, cognitive scaffolds (Rosenshine & Meister, 1992; Figure 13,
page 42) are provided to help the user to reach the intended goal – discovering and
formulating Coulomb’s Law.
4.2 Mental models
Under most circumstances, learning is goal driven. The goal for knowledge
acquisition for users using this system, is to form or update a mental model on the
principles of electricity, which could be used for deriving how-to-do-it knowledge
when specific tasks, for instance, how to wire a three-pin electrical plug, are faced.
In order to allow for such derivations, the knowledge which is only implicitly contained
in the mental model must be made explicit, because without this knowledge
explication in the knowledge acquisition phase, the demands for performing specific
tasks later could not be met (compare Schmalhofer & Kühn, 1991).
Figure 14. Knowledge explication: Screen 1 of 2
Chapter 3. Program description 43

Figure 15. Knowledge explication: Screen 2 of 2
Figure 14 on page 43 and Figure 15 on page 44 illustrate a screen sequence where
the knowledge acquired and the mental models referring to an electrical field inside a
ring, are used to derive knowledge on lightning protection.
4.3 Interactivity
Interactivity is not just using a mouse instead of the keyboard, or clicking a push-
button instead of using a pull-down menu. Interactivity is, as has been pointed out in
Chapter 2, really a very simple term for a potentially complex design paradigm. The
objective of a design paradigm focused on user interaction is to map the user’s
mental model, his understanding of the task and the tool, onto the interface and the
whole application (Hugo, 1994).
The researcher tried to design interactivity into the program, making it an integral part
of the interface, such that the interface as such could be transparent to the user. In
fact, some of the users that were part of the beta-testing of the product, gave the
following feedback: “It seemed as if the computer spoke back to us ...”.
Chapter 3. Program description 44

4.4 Learner control
Although it has been pointed out in Chapter 2 that total learner control of a program
is not recommendable, the researcher decided to allow maximum learner control –
even for low test scores, in order to address the question what learner control is
advisable in a multimedia tutorial program.
Therefore, it was assumed that the initiative for learning should reside within the
learner. If the learner is intrinsically motivated, he should have the option to proceed,
even if he has not yet fully mastered certain content. The program allows for this, but
also reminds the learner who has not yet mastered the content, to “come back at a
later stage to revise”.
5. Topics covered by the program
The researcher decided to create an integrated multimedia program dealing with the
electrical topics as outlined in Table 3, page 27, Table 4, page 28 and Table 5, page
29. By integrating all electrical components into one single multimedia program, the
user should be able to develop a global model of electricity.
To be able to cover the different topics in depth, the researcher had to become a
student again. To quote Alessi & Trollip (1991):” ... For the researcher, learning the
content includes interviewing the expert, reading texts and other instructional
materials, and generally becoming a student again. You cannot develop effective
instruction which challenges the student in creative ways unless you become
thoroughly familiar with the content. Shallow understanding can only produce a
shallow lesson.” (p. 248).
This meant that the researcher had to read through all the collected resource
materials, comparing the different sources and making notes on content and the
different approaches taken by different authors. The fact that the researcher has 24
years experience in the teaching of General Science and Physical Science,
facilitated this process.
Chapter 3. Program description 45

6. Designing the program
6.1 Program description
According to Alessi & Trollip (1991), successful instruction should include at least the
following four activities:
1. Presentation of information or modelling of skills;
2. Student guidance through the initial use of the information or skills;
3. Re-enforcement of skills and knowledge for retention and fluency; and
4. Assessment of student learning.
Tutorial lessons aim to satisfy the first two components of instruction, and usually do
not engage in extended practice or assessment.
For the purpose of this dissertation, a multimedia tutorial can be defined as a tutorial
incorporating multimedia components.
A simulation is a powerful technique that teaches about some aspect of the world by
imitating or replicating it (Alessi & Trollip, 1991). Students are motivated by
simulations, and learn by interacting with them in a manner similar to the real-life
situation (Zwart et. al., 1994). A multimedia simulation is a simulation that contains
animation, video, graphics, text, sound and other multimedia components.
The program Introduction to Basic Electricity can be classified as a multimedia
tutorial, incorporating extensive simulations. Using interactive computer simulations,
learners can explore a specific domain by conducting experiments and observing the
effects of these interactions (Zwart et. al., 1994). The program is specifically
designed not to provide extensive practice to students, although the students do
have the choice of doing a quiz or taking a test. The option of doing a quiz / taking a
test is not activated in this version of the program, because this part of the program is
still under development and therefore was not included in the research.
Chapter 3. Program description 46

6.2 Program flow
The systematic planning and progression from conceptual ideas to paper ideas to
implementation on a computer is aimed at ensuring that the creative process is fully
exploited. If the programmer wishes to make full use of the potential of a computer,
careful planning is essential to ensure a superior program.
To ensure logical program and information flow, a detailed structure should be built
into the program. Figure 16 on page 47 details the course structure of the developed
program.
Figure 16. Introduction to Basic Electricity: Course structure
Introduction
IntroductionAtomicstructureChargedObjectsConservationof charge
Atoms andElectrical Charge
The UnitThe LawCalculations(under development)
Coulomb'sLaw
IntroductionMore aboutfieldsWhat is a volt?(under development)Millikan(under development)Calculations(under development)
ElectricalFields
StaticElectricity
Still underdevelopment
CurrentElectricity
Still underdevelopment
ElectricalEffects
Still underdevelopment
Experimentsin Electricity
Basic ElectricityMain Menu
Logon Screen
Basic Electricity
Chapter 3. Program description 47

7. Developing the program
7.1 Programming tools
7.1.1 Authoring tools
Creating multimedia today, generally mean using an authoring tool to create a
production (Heid, 1991). The researcher decided to use Authorware Professional
Version 2 (Macromedia, 1993) as the main authoring tool for the project. The power
and simplicity of Authorware support effective authoring procedures. Authorware
provides an object authoring, event-orientated environment, meaning that the design
icons provide full authoring functionality. The built-in flowcharting provided in the
program eliminates the tedious task of drawing pencil-and-paper flowcharts. Figure
17 on page 48 represents a typical flowchart sequence in Authorware Professional.
Figure 17. A typical flowchart sequence in Authorware Professional
Chapter 3. Program description 48

7.1.2 Graphic tools
In creating the different screens, the researcher used the package CorelDraw!
version 5 (Corel Corporation, 1994) as the primary graphics package. The fact that
the specific program allows for both vector graphics and bit-mapped graphics,
enabled the researcher to incorporate high quality graphics (640 x 480 x 256 colours)
in the program. The researcher took into account that the delivering platform for the
program will in many cases only allow for 640 x 480 x 256 colours.
All the photographs in the package were taken by the author and scanned into the
Corel Photo-Paint module for further editing.
7.1.3 Animation tools
If a picture is worth one thousand words, an animation must be worth ten thousand
words. All the animations in the program were created using the CorelMove module.
The resulting animations were then exported to Windows .AVI-format and converted
to .FLC format for use with Authorware Professional.
7.1.4 Sound tools
The different sound effects in the program were recorded by the researcher and
edited using a Windows-type wave editor.
7.2 Some multimedia components
7.2.1 Graphic design principles
In relation to print material, Fleming and Levie (1993) indicate that “although the
results of research on the effects of using graphics are neither consistent nor
compelling, most authorities and professionals are convinced that in many
circumstances graphics help readers (especially poor readers) to use and
understand instructional text (p. 41). ...Although research has failed to demonstrate
conclusively that using pictures in courseware (in this context text-based material) is
related to motivation, their instincts tell many designers that good pictures really do
motivate learners” (p. 46).
Chapter 3. Program description 49

Paivio (1986) theorises that long-term memory consists of two separate but
interdependent coding mechanisms, verbal (semantic) and visual. The two codes
have additive effects; if information is dually coded, it is more likely to be
remembered. The availability of the two codes is different for verbal and visual
information. Pictures are more likely to be dually coded than words (words can be
visually encoded through our imagination, but we do not always do so). When
information is dually encoded, the probability of retrieval is increased. Kobayashi
(1986) agrees to this, but he feels that more research needs to be done on this
aspect. On the other hand. Rieber (1991) feels the dual coding theory is empirically
supported.
In the context of message-design variables and with respect to the perception of
pictures, Fleming and Levie present eight design guidelines. Their first and main
guideline is that “pictures are usually more memorable than words, and are thus
useful when information has to be remembered” (p. 86). Their second guideline is
that “pictures play many roles in instruction. It is therefore necessary to know
precisely what a picture’s function is intended to be before it is designed” (p. 86).
Following these two design principles, the graphics used by the researcher in the
program can be divided into two classes, according to their respective functions:
1. background graphics are used to create a visually pleasing background for
display objects and text; and
2. display objects, specifically photographed or drawn are used to highlight or
illustrate specific principles, in order to convey a specific message.
7.2.2 Animation
The program makes ample use of animations to illustrate important concepts. This
version of the program uses more than 40 different externally created animation
sequences, excluding the simple animations (movement of text and objects)
internally created using the authoring tool. Following the suggestions of Malamed
(1991), animations are used to:
1. focus attention to important elements through animated guides and cues;
2. review and apply knowledge to new situations;
Chapter 3. Program description 50
3. present new information; and
4. make abstract contents visually “tangible” to aid the formation of mental
models.
7.2.3 Sound
Jaspers (1991b) found that when audio and visuals are presented simultaneously,
the visually presented information will be dominant. Presentations which focus on
two senses or use two channels including an iconic presentation and a linguistic
approach (text or audio) are superior to a presentation using only one channel. The
most powerful result of using multi-channel presentation forms is its positive impact
on the motivation of the learner.
According to Little (1991), the term 'multimedia' describes a new application-oriented
technology that is based on the multi-sensory nature of humans and the evolving
ability of computers to convey diverse types of information, including audio.
For this version of the program, the researcher decided not to supplement visual text
and graphics with audio commentary, because of the nature of the project and the
fact that this project is the first phase of a multi-phase project. The researcher,
however, did incorporate sound effects into some interactions.
7.2.4 Video
Video should be an integral part of all multimedia systems. A system should provide
students with easy access to video sequences relating to subject specific content
that they cannot obtain from any other medium (Hall et. al., 1989). The researcher
decided not to incorporate video clips into this beta version of the product, because
of the nature of the project and the fact that this project is the first phase of a multi-
phase project. The researcher also did not have access to a video capture board.
Extensive video is planned for integrating into future versions of the program.
7.3 Navigation
Figure 18 on page 53 illustrates the learner control and hypermedia links that are
available in the program. Apart from relative free movement between sources of
Chapter 3. Program description 51

information, the user can at any time access all the pull down menus (the test-your-
knowledge menu, the main concept menu, tools menu and the help menu). The user
can navigate using either push-buttons, pull-down menus or hot-spots.
The researcher has followed the principles proposed by Barker (1990) in allowing
students to select and control:
1. what is learned;
2. the pace of learning;
3. the direction of learning; and
4. the style of learning.
Chapter 3. Program description 52

Figure 18. Hypermedia links
Chapter 3. Program description 53

Chapter 4 Research Procedures
1. Introduction
This project consists of two major components, of which the most important
component (70% of the effort) involved the design of an interactive multimedia
program to teach the principles of electricity to adolescents, while the second
component comprises of a report on the β testing and evaluation of the product.
Therefore, in the pilot test (Alessi & Trollip, p. 379), the researcher
1. selected a small test group;
2. explained the procedure to them;
3. found out how much they know about static electricity and atoms using
mental modelling methods;
4. observed them working through the lesson;
5. interviewed them afterwards; and
6. assessed their learning, using mental modelling and other techniques.
After careful consideration, the researcher chose the following procedures to find
answers to the research questions posed in Chapter 1 of this study:
2. Qualitative vs. quantitative research
In his research, the researcher could have followed two main approaches, namely
the quantitative approach or the qualitative approach. The nature of the research
problem and the type of data sought, will usually determine which of the two
approaches should be followed.
Chapter 4. Research procedures. 54

According to Mouton & Marais (1990), the quantitative approach is more formalised,
and explicitly controlled. The research should, after statistical analysis, reveal
generalisations. The quantitative approach is characterised by:
1. sample sizes which allow for the application of inferential and parametric
statistical analyses;
2. efforts to control the research environment; and
3. the formulation of a hypothesis.
When working with humans, it is often difficult to exactly quantify certain types of
results. In this specific study, it is, for instance, impossible to quantify the formation
of a mental model – it can only be described.
The qualitative approach allows for
1. a less formalised approach;
2. less explicit instructions;
3. the breadth of the study is less important than the depth of the study, resulting
in smaller sample sizes;
4. the collection of descriptive data; and
5. the application of non-parametric statistics.
From the above, we can thus conclude that the main features which distinguish the
qualitative research process from the quantitative research design are:
1. there are no standard experimental designs – different methods are used in
combination with each other; and
2. data collection and data analysis could occur concurrently through the use of
observational and anecdotal information.
In this study, the researcher used a qualitative approach to find answers to the
research problems stated in chapter 1. Being a hypothesis generating study,
observations lead to several questions deserving further research.
Chapter 4. Research procedures. 55

3. Identification of a target group
Table 1 (Chapter 1, page 9) represents a matrix identifying the target group. The
researcher tried to select a target group representing two opposite poles. Therefore,
a leading secondary school from the former Transvaal Education Department (TED),
situated in a wealthy suburb where mainly academic and professional people reside,
and a secondary farm school, situated in a rural area and catering for the needs of
deprived black children from the former Department of Education and Training (DET),
were approached. Each school was asked to identify three male and three female
students in standard 8. The three male students and three female students had to
come from respectively academically strong, academically medium and academically
low achievement groups. The six students per school were selected using the
following procedure:
1. Male students in standard 8 and female students in standard 8 were
separately ranked according to their academic achievement.
2. Both ranking lists were then divided into three groups of the same size
(bottom third, middle third, and high third.)
3. The male student and female student closest to the middle of each subgroup,
were selected as the experimental group.
4. Measuring mental models
4.1 Methods employed in existing mental models research
The mental models of learners are not available for direct observation. Kyllonen and
Shute (1989) regard mental models as the most complex type of knowledge in a
taxonomy that consists of propositional statements, schemata, rules, general rules,
skills, general skills, automatic skills, and mental models. They assert that mental
models require "the concerted exercise of multiple skills applied to elaborate
schemata" (p. 132), and recommend measuring mental models with sophisticated
simulations and performance tests.
Chapter 4. Research procedures. 56

Sasse (1991) argues that most experimental studies in the area of mental models
suffer from two methodological shortcomings:
1. over-interpretation of performance data - often the only dependent variables
in the design, and lack of ecological validity - the devices used are often
rather artificial; and
2. on-off studies with a short time of interaction between users and system tend
to concentrate on static aspects of one model the user is supposed to hold.
Sasse suggested that mental models could be obtained by observing
• users using the system;
• users explaining the system;
• users predicting the behaviour of the system; and
• users learning the system.
She designed and conducted studies using five different approaches to measuring
users' mental models:
1. Observing users using a word processor program.
2. Asking users to explain the program to a new learner.
3. Asking users to predict behaviours of the program.
4. Asking users to describe using the word processor.
5. Observing users learning a new word processor program with a co-learner.
Sasse suggested that approaches based on a teach-back, constructive interactive
technique, i.e., methods 2 and 5 above, were most effective for eliciting mental
models.
Chapter 4. Research procedures. 57

Jih (1991, as reported in Jih & Reeves, 1992), utilised the teach-back method along
with "pop-up" questions to assess the mental models of learners engaged in a
training integrated learning system. The pop-up questions, which appeared in
separate windows over the main program, asked learners to identify their reasons for
their actions within the integrated learning system, e.g., moving to a new section
without completing a previous one.
It is important to differentiate between
1. the mental models learners construct of the content encountered in computer-
assisted instruction; and
2. the mental models they construct of the instruction (computer) system.
In research that requires measuring learners' mental models of a complex,
generalizable activity, e.g., troubleshooting electrical circuits, Kyllonen and Shute's
(1989) recommendation of using simulations and performance tests should be
followed.
According to Van der Velden & Arnold (1991), the quality of an interface is largely
determined by the degree to which it contributes to the formation of adequate mental
models of the system in the mind of the user. The user develops one or more mental
models of the computer system by using the system, by interpreting the current state
and output of the system, and therefore in determining what to do next.
Van der Velden & Arnold (1991) distinguish between system models or system
outcomes (Norman, 1983) and user outcomes, which are determined by the
characteristics of the task at hand and the characteristics of the user.
If the system does not support the development of mental models for the user, it may
result in a premature end of the task-execution (system outcomes) and / or user
frustration (user outcomes).
Chapter 4. Research procedures. 58

Figure 19. Model of human-computer interaction (Van der Velden & Arnold, 1991)
Model of human-computerinteraction
user task system
system outcomes individual outcomes
taskperformance
Characteristics
Van der Velden & Arnold suggest that the characteristics of the user may influence
the end results. Aspects like a priori knowledge, e.g. (computer / mouse experience),
style of information processing (verbal vs. image), general intelligence, etc., may
influence the final mental model of the user. It is thus very important to keep these
factors in mind when trying to describe the mental model developed by the user.
4.2 Methods employed by the researcher
Following the suggestions of Sasse (1991), Jih (1991) and Kyllonen and Shute
(1989), the researcher decided not to settle for one particular method, but to use
several methods in gathering the required data on systems models and content
models.
4.2.1 Observation of users using the system
Users of the system were observed by the researcher, while a video camera
captured the reactions of the users. Photographs were taken of users working with
the system.
Chapter 4. Research procedures. 59

Users were asked to explain the working of the system using a teach-back “show me
how to ... “ procedure. They were also asked to provide reasons for specific program
responses.
The observations by the researcher and responses from the users were duly
recorded.
4.2.2 Sketches
Users were asked to sketch the concept “electricity” and the concept “atom” before
they started to work with the program. After working with the program for a maximum
of 1½ hours, they were again asked to sketch both concepts.
4.2.3 Performance tests
A performance test was integrated into the program. Because the amount of user
control was one of the questions the researcher tried to answer, maximum user
control was allowed. Students had the option either to do the test or to skip it.
4.2.4 Navigational pathways
A navigational pathway tracker is built into the program. This tracker sequentially
recorded both the path taken by the user, as well as the time spent at an interaction.
An example of the data supplied by the navigational tracker, can be found in
Appendix C on page 122.
4.2.5 Questionnaires
Before starting the program, users were asked to complete a pre-program
questionnaire, (Appendix A, page 107). After working through the program, a post-
program questionnaire was completed (Appendix B, page 120). The researcher
decided to use a nine-point scale for the questionnaires, because he wanted to allow
for “neutral” or “not sure” responses. Neutral or “not sure” responses could highlight
students’ uncertainties.
Chapter 4. Research procedures. 60

4.2.6 Other methods to obtain mental models
Other means to measure or determine mental models, do exist. For instance, the
researcher could have asked the students to draw mind maps or concept diagrams of
the system. He could also have used heuristic if / then / else statements.
Due to the fact that the β-testing of the product only amounts to 30% of the total
project effort, it was decided not to implement these methods.
4.3 Summary of methods used to obtain mental models
Table 6 on page 61 summarises the methods the researcher have used to identify
the mental models users formed respectively of the (computer) system and of the
content.
Table 6. Methods used to obtain users' mental models
Method System Content
Observation of users using the system
Sketches
Performance tests
Navigational pathways
Questionnaires
Chapter 4. Research procedures. 61

Chapter 5 Research results and discussion of results
1. Introduction
The aim of this chapter is to discuss the data that has been collected, using the
research procedures which were discussed in Chapter 4.
To obtain answers to the research questions stated in paragraph 4 on page 4, the
researcher used certain techniques to describe some of the mental models of the
users of the program have on
• the system;
• the program; and
• specific content within the program.
The aim of this research was to use the mental models developed by the users to
refine and improve the program. The researcher was not interested in obtaining
masses of data which could be quantified, but chose to look at the research
questions from different perspectives, using mental models as well as data recorded
by the electronic tracking program, as a research tool.
In order to identify and describe these mental models, the researcher used
observational techniques, questionnaires, sketches and electronic tracking programs.
Since much of the findings were anecdotal, the researcher has focused on the
description of the findings, commenting where appropriate.
The research findings will be grouped under four headings, namely
• acquisition of demographic variables;
• student use of the system;
• student views on the program; and
Chapter 5. Research results and discussion of results. 62

• students’ acquisition of certain learning concepts.
2. Demographic variables
Most of the demographic information, such as gender and cultural background, was
established through the selection procedure of the test group, while other
demographic variables were obtained via the pre-program questionnaire, Appendix
A, page 118).
2.1 Cultural background
The selection of the test group was such that the members of the test group came
from diverse cultural backgrounds. Six students came from a school that was
previously under control of the Transvaal Education Department (TED). This school
is situated in a stable community, where mostly academics and professional people
reside.
The other six students came from a rural school previously under the control of the
Department of Education and Training (DET). This school caters for the needs of
deprived students coming from an unstable community where many residents are
unemployed.
2.2 Gender
The test group consisted of six male and six female students.
2.3 Differences in academic ability
Following the suggestions of Alessi and Trollip (1991), the researcher selected as
part of the test group, students who are much like those for whom the program is
designed. Although Alessi and Trollip mention a minimum of three participants in a
pilot study, the researcher decided to use a pilot group of 12 students, or six students
per school, to allow for maximum symmetric diversity.
Chapter 5. Research results and discussion of results. 63

Of the six students selected per school, two students (one male and one female
student) represented the best of the potential students, two students (one male and
one female student) represented the average student, while two students (one male
and one female) represented the slowest of the students that would use the lesson.
The method by which the above students were selected, is described in Chapter 4,
Paragraph 3 on page 56.
2.4 Previous computer experience
Table 7 on page 64 shows the computer experience level of the test group.
Table 7. Computer experience of the test group.
Academic ability
Low Medium High
Male, former TED-school Games Computer Studies
Computer Studies
Female, former TED-school Games Games Computer Studies
Male, former DET-school 5 sessions CAI
PLATO
5 sessions CAI
PLATO
5 sessions CAI
PLATO
Female, former DET-school 5 sessions CAI
PLATO
5 sessions CAI
PLATO
5 sessions CAI
PLATO
All the students had some previous computer experience. The students from the
former DET-school had been exposed to 5 sessions on a PLATO system installed at
their school. These students had no mouse experience at all – in fact, when the
researcher showed a mouse to these students, they did not know what it was used
for. Therefore, the researcher had to teach them how to use a mouse. He allowed
each student about 10 minutes practising time, in which they had to arrange 20 icons
alphabetically by clicking and dragging.
Chapter 5. Research results and discussion of results. 64
All the students from the former TED school had extensive previous computer
experience. Three of the students have previously used the computer mainly to play
games, while three students were taking Computer Studies as an additional subject
at school. All of these students were totally familiar with the use of a mouse.
3. The use of the system
3.1 Observation of users using the system
Observation is a technique that can often reveal group- or individual characteristics
which would not have been possible to discover by other means. This technique
allows the researcher to collect a variety of information that provides depth to the
analysis. The observer can view a situation firsthand as it develops. Recording of
the observation takes place immediately, thus reducing the possibility of biased
recall.
According to Mouton & Marais (1992), observation should be considered in the
following situations:
1. when investigating the activities or behaviour of people; and
2. when needing to corroborate opinions about a particular intervention.
Observation is time-consuming and usually is limited to a small sample. Observed
events could be subject to the subjectivity and bias of the observer. The observations
were supplemented by video because events could also happen so quickly that it
becomes impossible to record every detail.
Observation was selected as one of the methods for data acquisition because it gave
the researcher the opportunity to obtain firsthand information concerning the
problems experienced with the execution and learning from the program.
The following observations were made while the students were working on the
system:
Chapter 5. Research results and discussion of results. 65

3.1.1 Use of the mouse
Seven of the twelve students had problems using the mouse in a drag-and-drop
interaction. Two of the seven students who had problems, indicated that they had
had ample computer experience. (Table 8, page 66).
Table 8. Students having problems with drag-and-drop mouse actions
Academic ability
Low Medium High
Male, former TED-school ∗ ∗ ∗
Female, former TED-school • • ∗
Male, former DET-school ♦ ♦ ∗
Female, former DET-school ♦ ♦ ♦
• Previous computer experience; experienced mouse problems. ♦ Limited computer experience; experienced mouse problems. ∗ Did not experience any mouse problems.
The two students from the former TED school who experienced mouse problems,
indicated that they had previously used the mouse to play games. When the
researcher asked them about this, they said that they were used to pointing-and-
clicking, but that they had seldom used the mouse for clicking-and-dragging. These
students had never before used the computer as an electronic tool that can be used
to simplify daily tasks, such as using the computer as a word-processor or calculation
aid.
It is obvious that the mental models that these students had about the computer
system, were limited to a model of a machine allowing them to play games. Although
these students aware that a computer is much more than a gaming machine, this
knowledge had not been transferred to that of a working model allowing them to use
the computer as a working tool.
Chapter 5. Research results and discussion of results. 66

3.1.2 Password problems
Five of the twelve students had problems remembering the passwords they had
selected (Table 9, page 67). When the program asked them for a password, they
just typed a keyboard sequence, and when it asked them to retype the password,
they were unable to retype it.
Table 9. Students who experienced password problems
Academic ability
Low Medium High
Male, former TED-school ∗ ∗ ∗
Female, former TED-school • ∗ ∗
Male, former DET-school ♦ ♦ ∗
Female, former DET-school ♦ ♦ ∗
• Previous computer experience; experienced password problems.
♦ Limited computer experience; experienced password problems. ∗ Did not experience any password problems.
From the observations as illustrated by Table 9, it is clear that most of the students
who had limited computer experience, experienced password problems. The reason
for this could be that these users lacked the necessary keyboard experience to
enable them to type faultlessly. The mental model that the researcher had of the
user of the system, was that all users will be able to type without any typing error.
The password log-on procedure could thus present a problem to users, and should
be redesigned in future versions of the program.
On the other hand, some of the users considered the password and password
security, as one of the users put it, as a “James Bond- type of protection” built into
the system to restrict anybody else accessing their information. Therefore, this user
selected a complicated password, a password so complicated that she was unable to
retype it. Although this user had the correct mental model of passwords and system
security, she had difficulty applying this model in a practical situation.
Chapter 5. Research results and discussion of results. 67

3.1.3 Using Help
Although a full on-line hypertext help facility was available, it was only accessed by
one student (Table 10, page 68). This specific student accessed help at the end of
the session, after she had already worked through the whole program. When asked
why she chose the Help-facility, she answered “I am just curious what the program
can do...”.
Table 10. Students accessing the help facility
Academic ability
Low Medium High
Male, former TED-school ∗ ∗ ∗
Female, former TED-school ∗ ∗ ◊
Male, former DET-school ∗ ∗ ∗
Female, former DET-school ∗ ∗ ∗
◊ Accessed the help facility. ∗ Did not access the help facility.
The results as illustrated by Table 10, might indicate that the users’ mental models of
the system did not include the tools available to assist them when working with the
system. The focus of the users could have been be so task-oriented that they did not
see the help-facilities as being part of the system.
4. The use of the program
4.1 Affective aspects
Certain aspects were determined through the use of affective questionnaires.
Asking good questions, is one of the secrets of meaningful research. Questionnaires
are a relatively simple and easy method of obtaining data as items can be
Chapter 5. Research results and discussion of results. 68

constructed easily. They are a rapid and efficient method of gathering large amounts
of information (Marsh, 1982).
Some of the items in both the pre-program and post-program questionnaires were
adapted from questionnaires used in research conducted by Howey (1983).
The pre-program questionnaires (Appendix A, page 118) were distributed to the
students, after they had been briefed about the aim of the study, to complete before
they started to work with the program. After completion of the program, the students
were once-again asked to complete the post-program questionnaire (Appendix B ,
page 120).
The main aim of the pre- and post program questionnaires was to obtain the
students’ opinions about certain design features of the program, as well as to assess
a possible change in the mental models learners have formed from the system.
Both the pre-program and the post-program questionnaires can be grouped into the
following 5 sections:
1. Interaction
2. Interface
3. Involvement
4. Motivation
5. Rate
A nine-point checklist format was used to assess sections 1 to 5. The reason for
using a nine-point checklist was that the researcher wanted to allow for a neutral or a
“not sure” response to highlight users’ uncertainties. In reporting the data, a
response of 1, 2 or 3 was taken as “disagree”, a response of 4, 5 or 6 was taken as
“not sure”, while a response of 7, 8 or 9 was reported as “agree”.
Chapter 5. Research results and discussion of results. 69

4.1.1 Interaction
4.1.1.1 Interaction results
Table 11. Students' opinions on interaction
Pre-program questionnaire n = 12
Post-program questionnaire n = 12
Agree Not sure Disagree Agree Not sure Disagree
I would love it if the computer could speak back to me
I felt as if someone was engaged in conversation with me
9 2 1 5 2 5
I always guess the answer for multiple choice questions.
I guessed the answers to some questions.
2 1 9 5 2 5
I hate it if a teacher marks my problems wrong and writes a long story about it.
I was encouraged by the responses given to my answers of questions.
1 3 8 8 2 2
In class, the teacher provides me with answers, but I still do not understand.
I was given answers, but still do not understand the questions.
4 3 5 4 2 6
I think computer based education programs are boring.
The feedback was boring
1 2 9 3 1 8
4.1.1.2 Discussion of the results of Table 11
The wording I felt as if someone was engaged in conversation with me on the
post-program questionnaire was not understood by everyone. Students mdl, mdm,
fdl, and fdm (all students from the ex-DET school) indicated that they disagreed with
the statement. When they were asked why they disagreed with the statement, they
responded that they “heard nothing”.
Chapter 5. Research results and discussion of results. 70

In the pre-program questionnaire student mth indicated that he thought that computer
based programs were boring. In the post-program questionnaire, students mtl and
mtm joined the views of student mth and indicated that the feedback was boring. All
three these students were male students from the ex-TED school. During interviews,
these students indicated that they would like to see more of a “bells and whistles”
type of feedback. Student mth also wanted audio / video feedback.
Two of the three male students from the ex-TED school also indicated that they
disagreed with the statement I was encouraged by the responses given to my
answers of questions, while one of them was unsure.
Students mtl, ftl, mdl and fdm indicated that they did not understand all the questions,
although they were given answers. It is interesting to note that these students were
low to average achievers at school.
If only the specific opinions of the test group outlined above are taken into account,
without considering the rest of the data, one might be inclined to deduce that this
program could be too easy for the high achiever, and at the same time too difficult to
be of any use to the low achiever. As will be pointed out in later paragraphs, other
data do exist that might indicate the opposite.
Chapter 5. Research results and discussion of results. 71

4.1.2 Interface
4.1.2.1 Interface results
Table 12. Students' opinions on the interface
Pre-program questionnaire n = 12
Post-program questionnaire n = 12
Agree Not sure Disagree Agree Not sure Disagree
I love animations! I did not like the animations in the program
12 0 0 1 0 11
I consider myself as being “artistically inclined”
I did not like the screen layout at all
9 3 0 1 0 11
I always organise my learning: e.g. I will complete my Mathematics first before
starting my science
I like the fact that I can jump from one topic directly to another topic
6 4 2 12 0 0
A red and orange screen would look nice I loved the colours
6 0 6 11 0 1
I always use sketches when I learn The animations in the program made the contents easy to understand
5 5 2 11 1 0
Computers normally frustrate me The program frustrated me
2 1 9 1 2 9
When trying something, I give up easily if I do not succeed
Sometimes I felt completely lost
3 2 7 2 2 8
It is normally easy to work with a computer
The program is very easy to work with
10 1 1 12 0 0
Chapter 5. Research results and discussion of results. 72

4.1.2.2 Discussion of the results of Table 12
Except for student mth, who expected still more video, sound and animation, all the
students responded positively on the interface and interface design.
In the pre-programme questionnaire, students mdl and fdh indicated that computers
normally frustrated them. In the post-programme questionnaire, these students
indicated that the program as such did not frustrate them. Student mth was
frustrated because he had expected more multimedia components in the program.
Student mth indicated that he did not like the screen layout at all. In the pre-program
questionnaire, he admitted that he was not sure if he could be described as an
“artistically inclined” person.
Although 50% of the students indicated that they were organised learners, these
students liked the freedom provided by the program to jump from one topic directly to
another topic. The mental models these students have on learner control and
navigation could be that maximum learner control will ensure maximum learning.
In the post-program questionnaire everyone, except student mth, indicated that they
loved the colours used in the program. Six students indicated in the pre-program
questionnaire that a red and orange screen would look nice. The response to the
pre-program question might indicate that the views of these students on screen
colour should possibly not be taken too seriously.
During the interview, student mth indicated that he preferred brighter colours to the
autumn colours used in the program. Although he did not like the animations in the
program, he acknowledged that the animations in the program had simplified the
content.
Two students (fdl and mdl) indicated that sometimes they felt completely lost. In the
pre-program questionnaire, these students also indicated that they gave up easily if
they did not succeed with something.
Chapter 5. Research results and discussion of results. 73

4.1.3 Involvement
4.1.3.1 Involvement results
Table 13. Students' opinions on involvement
Pre-program questionnaire n = 12
Post-program questionnaire n = 12
Agree Not sure Disagree Agree Not sure Disagree
I prefer the computer based type of lesson to traditional instruction
I prefer the computer based type of lesson to traditional instruction
8 3 1 10 1 0
When starting a new year at school, I am concerned that I may not be able to cope
with the work
I was concerned that I might not be able to understand the material
3 2 7 2 2 8
I hate science! My feeling towards the course material after I had completed the program was
favourable.
1 1 10 9 2 1
The lessons in class are mostly dull The lessons in the program were dull and difficult to follow
5 4 3 2 0 10
4.1.3.2 Discussion of the results of Table 13
After working with the program, more students favoured the computer based type of
instruction. Student mth was the only student whose neutral views on computer
based type of instruction remained unchanged.
Student mth indicated in the pre-program questionnaire that he agreed to the fact
that the lessons in class were mostly dull. In the post-program questionnaire, he
indicated that the lessons were difficult to follow and that they were dull. During the
interview, he admitted that the lessons were not difficult to follow, but they were dull
in that he had expected more of an action-type of feedback.
Chapter 5. Research results and discussion of results. 74

4.1.4 Motivation
4.1.4.1 Motivation results
Table 14. Students' opinions on motivation
Pre-program questionnaire n = 12
Post-program questionnaire n = 12
Agree Not sure Disagree Agree Not sure Disagree
I really think I would like to learn more about atoms and electricity
As a result of having studied by this method, I am interested in learning more
about the subject matter
6 4 2 10 2 0
I tense easily I felt quite tense when I worked through the program
3 1 8 1 4 7
I think a computer program will make the normal classwork much easier
I think that what I have learned from the program, should make the normal
classroom and laboratory work easier to understand
11 0 1 12 0 0
I think extra classes are mostly a waste of time
I think working through the program was a waste of time
4 0 8 0 1 11
I am always totally involved in class The lessons were interesting and really kept me involved
8 3 1 10 1 1
My teachers always challenge me to do my best
The program challenged me to do my best
10 2 0 10 0 2
4.1.4.2 Discussion of the results of Table 14
All the students acknowledged that working through the program was a stimulating
and motivating experience, although students mth and fth indicated that they were of
the opinion that the program did not challenge them to do their best. In the pre-
Chapter 5. Research results and discussion of results. 75

questionnaire, both students indicated that even the teachers did not always
challenge them to do their best. Student mth also indicated that the program did not
really keep him involved.
In the pre-program questionnaire, 6 students had indicated that they would not really
like to learn more about atoms and electricity. After working with the program, the
two students who had indicated in the pre-program questionnaire that they did not
want to learn more about atoms and electricity, showed more interest in this topic.
In the pre-program questionnaire, student mth indicated that he thought that a
computer program will not make the normal classwork easier. After working through
the program, his views on the usefulness of the computer in a class-room changed
completely.
In the pre-program questionnaire, four students indicated that to them, extra classes
were a waste of time. None of these students thought that working through the
program was a waste of time, although student mth was relatively neutral on this
aspect.
If one compares the pre-program and post-program responses, one can definitely
see that most of the students were positively motivated through the use of the
program.
Chapter 5. Research results and discussion of results. 76

4.1.5 Rate
4.1.5.1 Rate results
Table 15. Students' opinions about the rate
Pre-program questionnaire n = 12
Post-program questionnaire n = 12
Agree Not sure Disagree Agree Not sure Disagree
I learn best when I feel I am pressed for time
I could have learned more if I hadn’t felt pushed
10 2 0 4 2 6
I love to work at my own pace, without being pushed
I felt that I could work at my own pace
12 0 0 12 0 0
Sometimes the teacher goes too slow because he keeps on explaining things to
the rest of the class
The course material was presented too slowly
6 2 4 3 2 7
I consider myself to be a patient person The program ran much too fast
10 1 1 3 0 9
4.1.5.2 Discussion of the results of Table 15
All the students of the ex-TED school indicated that they were pressed for time while
working with the program. This is true, because they had a limited time available to
work with the program. All the students indicated that despite the limited time
available, they felt that they could work at their own pace.
For students mth, fth and mdl the course material was presented too slowly, although
student mdl also indicated that the program ran much too fast.
Chapter 5. Research results and discussion of results. 77

4.2 Time spent with the program
The only instructions given to students before starting the program were that they
should work through the program. No indication of maximum time allowed or any
other indication concerning time was given to the students, although the researcher
has decided beforehand to allow a maximum of 1½ hours per student. The students
were not briefed on how long the program would take, in order to allow the students
to proceed at their own pace.
Unfortunately, the group from the ex-TED school indicated that they had limited time
to help evaluate the program. Therefore, they spent less time working on the
program than the group from the ex-DET school, although more content was covered
by the first group than the second group.
Figure 20 on page 78 graphically represents the time taken by the students working
with the program.
Figure 20. Time spent with the program
Time spent with the program.
0:000:100:200:300:400:501:001:101:201:30
mtl
mtm mth ftl ftm fth mdl
mdm mdh fd
l
fdm fdh
Student
Tim
e (h
:mm
)
Chapter 5. Research results and discussion of results. 78

4.3 Navigation
4.3.1 Navigation through the program
To represent visually the tracking information and the navigational paths followed
through the program, the researcher developed a “deepness level” scale (Appendix
D, page 126). This scale quantifies the simplest sequential route through the
program.
Some students probed very deeply into the program while missing out on important
information, while other students sequentially completed about 50% of the program.
Figure 21 on page 79 represents the deepness level reached by the students while
using the program.
Figure 21. Program deepness level reached by students
Deepness level reached
0
200
400
600
800
1000
1200
mtl
mtm mth ftl ftm fth mdl
mdm mdh fd
l
fdm fdh
Student
Dee
pnes
s le
vel
4.3.2 Navigational pathways
A navigational tracking program was built into the developed multimedia program, as
explained in Chapter 4, paragraph 4.2.4 on page 60. Although all the candidates
were allowed to interact with the program for a maximum of 1½ hours, many
candidates indicated that they had worked through the program using less time.
Chapter 5. Research results and discussion of results. 79

The navigational pathways of the different students through the program are
presented visually in Figure 22, on page 80 to Figure 33 on page 86. Although the
pathways are commented, the reader is asked to compare the navigational pathways
with the data supplied in Appendix D, on page 126, for more detailed information.
Only four of the students (students mdl, mdm, mdh and fdl) spent more than one
hour working with the program (compare Figure 20 on page 78). A careful analysis
of the tracking data of these students, have shown that the navigational patterns
through the program had been established within the first hour of working with the
program. Therefore, only the data generated within the first 60 minutes of working
with the program, are visually represented in Figure 22 to Figure 33.
Figure 22. Navigation tracking record of male, ex-TED, low achiever
0
200
400
600
800
1000
1200
0:00
0:10
0:20
0:30
0:40
0:50
1:00
Time
Prog
ram
leve
l
mtl
Introduction
Atoms
Coulomb's Law
Electric Fields
Linear path
Student mtl spent 12 minutes working on the first module Introduction. He jumped back to the menu and once again worked through the first module. He jumped to module Atoms and did the test. Although the program advised him to again revise the first section, he ignored the advice, skipped the next section of the module Atoms and completed the last section of this module.
Comment : Although student mtl worked twice through the introduction module, he still only got 20% for the on-line test. When he was asked the reasons for his low score, he answered that he did not know that he would be tested on this module.
Chapter 5. Research results and discussion of results. 80

Figure 23. Navigation tracking record of male, ex-TED, medium achiever
0
200
400
600
800
1000
1200
00:0
0
10:0
0
20:0
0
30:0
0
40:0
0
50:0
0
00:0
0Time
Prog
ram
leve
lmtm
Introduction
Atoms
Coulomb's Law
Electric Fields
Linear pathStudent mtm started off with the Introduction module, but jumped back to the menu after he completed only the first three interactions. Then he jumped to Atoms, did the quiz, got 0%, chose to continue, jumped directly to Coulomb’s Law, did the first section, jumped back to Atoms, and after completing all the sections, jumped to Coulomb’s Law and continued with the second section.
Comment: The navigational record of student mtm seems to confirm Waern’s (1990) view in that experienced users first try a top-down approach. (See also page 19).
Figure 24. Navigation tracking record of male, ex-TED, high achiever
0
200
400
600
800
1000
1200
0:00
0:10
0:20
0:30
0:40
0:50
1:00
Time
Prog
ram
leve
l
mth
Introduction
Atoms
Coulomb's Law
Electric Fields
Linear pathStudent mth started the
Introduction to Static
Electricity - module. Two
interactions before the end of
the module, he jumped to
Electric Fields, and
completed all the sections.
He then jumped back to
Coulomb’s Law and
completed the first section.
Comment: After starting off linearly, student mth used the top-down approach (Waern, 1990) for the rest of the program. He jumped to the topic Electrical Fields and completed all the sections of this module. In the interview he mentioned that he jumped to this section because they had not yet done this topic in class. This was also the reason why he skipped Atoms, because he thought that he knew enough of the topic.
Chapter 5. Research results and discussion of results. 81

Figure 25. Navigation tracking record of female, ex-TED, low achiever
0
200
400
600
800
1000
1200
0:00
0:10
0:20
0:30
0:40
0:50
1:00
Time
Prog
ram
leve
lftl
Introduction
Atoms
Coulomb's Law
Electric Fields
Linear pathStudent ftl started with the Introduction – module. Halfway through the module, she jumped to the module Electric fields and completed the first and third sections. She jumped back to the module Atoms and after completing the second section of the module, (bypassing the on-line test), she jumped to Coulomb’s Law, completed the first section, and jumped back to Atoms to complete the third section of this module.
Comment: Student ftl also used started with the top-down approach (Waern, 1990), but continued using the bottom-up approach.
Figure 26. Navigation tracking record of female, ex-TED, medium achiever
0
200
400
600
800
1000
1200
0:00
0:10
0:20
0:30
0:40
0:50
1:00
Time
Prog
ram
leve
l
ftm
Introduction
Atoms
Coulomb's Law
Electric Fields
Linear pathStudent ftm worked through
the program in a linear
fashion, except that she
skipped the first section of
the module Atoms, thus
bypassing the on-line test.
She also skipped the first
section of the module
Coulomb’s Law.
Comment: Student ftm used the bottom-up approach (Waern, 1990), working through the program at a rapid rate, skipping sections.
Chapter 5. Research results and discussion of results. 82

Figure 27. Navigation tracking record of female, ex-TED, high achiever
0
200
400
600
800
1000
1200
0:00
0:10
0:20
0:30
0:40
0:50
1:00
Time
Prog
ram
leve
lfth
Introduction
Atoms
Coulomb's Law
Electric Fields
Linear pathStudent fth worked very fast
through the program in a linear
fashion. She skipped the first
section of the module Atoms
(thus bypassing the on-line
test), as well as all the
experiments in the module
Coulomb’s Law. She
completed the first section of
the module Electric Fields.
Comment: Student fth also used the bottom-up approach (Waern, 1990), racing through the program at an average rate of less than 4 seconds per interaction screen.
Figure 28. Navigation tracking record of male, ex-DET, low achiever
0
200
400
600
800
1000
1200
0:00
0:10
0:20
0:30
0:40
0:50
1:00
Time
Prog
ram
leve
l
mdl
Introduction
Atoms
Coulomb's Law
Electric Fields
Linear pathStudent mdl started off with the module Introduction. After completing three interactions of this module, he jumped back and restarted the module. After completing the module, he jumped to the module Atoms. He did the on-line test and followed the program prompt to revise the first module. After completion of this module, he redid the test (scoring 40%), and followed a linear path through the program.
Comment: The fact that student mdl scored 40% after following the program prompt to revise, could indicate that the student went through the first module focusing on specific facts. In the process, he learnt something.
Chapter 5. Research results and discussion of results. 83

Figure 29. Navigation tracking record of male, ex-DET, medium achiever
0
200
400
600
800
1000
1200
0:00
0:10
0:20
0:30
0:40
0:50
1:00
Time
Prog
ram
leve
lmdm
Introduction
Atoms
Coulomb's Law
Electric Fields
Linear pathStudent mdm started off
linearly, twice repeating the
first module. After
completing the on-line test in
the module Atoms, he
decided to ignore the advice
of the program to revise the
first section, and continued to
work linearly through this
module.
Comment: The first time student mdm went through the first module very quickly, repeating it very slowly the second time. The fact that he only got 20% for the on-line test, might mean that he worked through the first module in an unfocused fashion.
Figure 30. Navigation tracking record of male, ex-DET, high achiever
0
200
400
600
800
1000
1200
0:00
0:10
0:20
0:30
0:40
0:50
1:00
Time
Prog
ram
leve
l
mdh
Introduction
Atoms
Coulomb's Law
Electric Fields
Linear pathStudent mdh used the utility
to write a note as he linearly
worked through the program
at a very slow rate.
He got a mark of 80% for the
on-line- test. He linearly
completed module 1 and the
first two sections of
module 2.
Comment: The researcher observed that this student worked through each screen, reading every bit of information on the screen, and duly recorded it in a note book. He did not consult the notebook during the on-line test. He took 1½ hours to complete module 2.
Chapter 5. Research results and discussion of results. 84

Figure 31. Navigation tracking record of female, ex-DET, low achiever
0
200
400
600
800
1000
1200
0:00
0:10
0:20
0:30
0:40
0:50
1:00
Time
Prog
ram
leve
lfdl
Introduction
Atoms
Coulomb's Law
Electric Fields
Linear pathStudent fdl jumped to the second module Atoms after working through the first two interactions of the first module. She decided not to take the on-line test , and jumped to the second section where she spent about 30 minutes working on it. After completing section 3, she returned to section 2 of the same module, and, after working through the first 3 interactions, started to jump randomly to different sections in the program.
Comment: After completing the module Atoms, student fdl jumped back to the menu, and then she started to jump, apparently randomly, to different sections in the program. The researcher offered some help, and she told him that she was once again trying to find the Atoms and electricity module. It appears as if she got “lost in hyperspace” for a short time. These unintentional jumps might possibly be ascribed to limited computer experience.
Figure 32. Navigation tracking record of female, ex-DET, medium achiever
0
200
400
600
800
1000
1200
0:00
0:10
0:20
0:30
0:40
0:50
1:00
Time
Prog
ram
leve
l
fdm
Introduction
Atoms
Coulomb's Law
Electric Fields
Linear pathStudent fdm started off with the first module Introduction, did the first screen, jumped to the second module Atoms, took the on-line test, got 0%, redid the test two more times, again getting 0%.
She ignored the advice of the program to restart, and jumped to the second section. She linearly completed the rest of the sections of the module Atoms.
Comment: Student fdm indicated the necessity to complete the first module of the program before starting the second module.
Chapter 5. Research results and discussion of results. 85

Figure 33. Navigation tracking record of female, ex-DET, high achiever
0
200
400
600
800
1000
1200
0:00
0:10
0:20
0:30
0:40
0:50
1:00
Time
Prog
ram
leve
lfdh
Introduction
Atoms
Coulomb's Law
Electric Fields
Linear pathAfter working for 24 minutes
on the module Introduction,
student fdh repeated the
same module. She then
jumped to the module Atoms,
did the test and got 60%.
She skipped the second
section of this module. She
twice repeated section 3 of
module 2.
Comment: Student fth worked very slowly through the program.
5. Program content
5.1 Acquisition of learning – concepts
5.1.1 The concept “atom”
To be able to categorise the mental model of the concept “atom”, one should look at
the historical development of the model of an atom and the mental models scientists
have formed of the atom over the years (Table 16 on page 87).
Chapter 5. Research results and discussion of results. 86

Table 16. Historical development of the atomic model
Year Model developed by Model also known as 1803 – 1807 Dalton Billiard ball model
1898 Thomson Plum pudding model
1910 Rutherford
1913 Bohr Planetary model
1925 Schrödinger Wave mechanical model
Users were asked to sketch the concept “atom” both before and after using the
program. The results are summarised in Table 17 on page 88.
Chapter 5. Research results and discussion of results. 87

Table 17. Sketches of atoms
Pre-program sketches Post program sketches Academic ability Academic ability Low Medium High Low Medium High
mt
ft
md
fd
Code mt = male, ex-TED school; ft = female, ex-TED school; md = male, ex DET school; fd = female, ex-DET school.
Table 18, page 88 shows a classification of the results from Table 17 using the
categories of Table 16 as a basis, while Table 19 on page 89 graphically illustrates
the changes in the concepts that took place.
Table 18. Categories of atom concepts
Category Pre-program Post-program Other mdl
Billiard ball model mtl, mtm, ftl, fth, mdh
Plum pudding model / Rutherford
mth, mdm, fdl, fdm, fdh mtl, ftl, mdl, mdh, fdl
Planetary model ftm mtm, mth, ftm, fth, mdm, fdm, fdh
Code: mdl = male, ex-DET, low academic ability ftm = female, ex-TED, medium academic ability, etc.
Chapter 5. Research results and discussion of results. 88

Table 19. Changes in users' models of the concept "atom"
Schrödinger
Bohr
Rutherford
Thomson
Dalton
Other mtl mtm mth ftl ftm fth mdl mdm mdh fdl fdm fdh
From the data, as illustrated in Table 17, Table 18 and Table 19, it is clear that the
pre-program mental model users had of the atom, had changed for all the students
after working with the program, except for students fdl and ftm. If one assumes that
the mental models scientists held of the atom had cognitively reached higher levels
through history, it can also be assumed that the mental models that the students had
of the atom had cognitively reached higher levels through the interaction with the
program.
Chapter 5. Research results and discussion of results. 89

5.1.2 Concept “electricity”
The users of the program were asked to sketch the concept “electricity” to attempt to
visualise both the pre-program and post-program model users have of this concept.
The sketches drawn by the test group are shown in Table 20 on page 90.
Table 20. Sketches of the concept "electricity"
Pre-program sketches Post program sketches
Academic ability Academic ability
Low Medium High Low Medium High
mt
ft
md
fd
Code mt = male, ex-TED school; ft = female, ex-TED school; md = male, ex DET school; fd = female, ex-DET school.
The mental models of the concept “Electricity” for 6 students have remained
unchanged, while the changes in the mental models of this concept for the other six
students are highlighted in Table 21 on page 91.
Chapter 5. Research results and discussion of results. 90

Table 21. Changes in the mental models users have of the concept "Electricity"
Student Pre-program model Post-program model
mth
ftl
ftm
fth
mdl
fdl
The pre-program models these users had of electricity were limited to the concepts
being taught in class. The post-program models of electricity show that knowledge
transfer has taken place. For instance, student ftm, who previously associated
electricity with a simple cell, now associates electricity with power cables distributing
the electricity. To students ftl, mdl and fdl, “electricity” is not anymore limited to
electrical circuits and circuit diagrams, but their concept of electricity has been
expanded to include static electrical effects, for instance lightning.
Students mth and fth now associate electricity with dynamically moving charges,
where they have previously associated this concept with a static electrical circuit.
It is thus clear that a cognitive change in the concept “electricity” has taken place
(compare Bloom et. al., 1956).
5.2 Performance tests
A performance test was built into the program where users had the option to take a
quiz or skip it. Of the 12 candidates, 4 bypassed (unknowingly) the quiz, 1 skipped
the quiz, while 7 took the test.
Chapter 5. Research results and discussion of results. 91

Table 22. Results of the on-line test
Academic ability
Low Medium High
Male, former TED-school 20% 0% bypass
Female, former TED-school bypass bypass bypass
Male, former DET-school * 0% 40%
20% 80%
Female, former DET-school skip test
0% 60%
* Student mdl got 0% for the on-line test. After following the program prompt to revise, he completed the revision, redid the test and got 40%.
If one compares the navigational pathways through the program with the test results,
it is clear that it is essential to complete the Introduction to Static Electricity module
before attempting the quiz. Students mtm and fdm did not start off in a linear fashion,
and had to do the test before they completed the Introduction. Student fdm tried the
test three times in a row. Although all the students who got less than 60% in the test
were advised by the program to go back and revise, only one student made use of
this option. The rest decided to continue with the program.
6. Conclusion
In this chapter, the research findings were discussed and commented upon. The
research findings were grouped under four main headings, namely,
1. Acquisition of demographic variables
2. Student use of the system
3. Student views on the program
4. Students’ acquisition of learning concepts
Chapter 5. Research results and discussion of results. 92

The evaluation instruments used to generate data, were questionnaires, observation
schedules, tracking records recorded electronically from within the program, and an
on-line test.
The researcher was able to describe the mental models users had about the system,
about the program, as well as the conceptual models users had about certain
program content.
The researcher had commented on important and significant data, suggesting
possible reasons for specific findings.
Generally speaking, the students demonstrated a positive attitude towards the
program and indicated that it met their learning needs. Even the most critical student
commented that the program is excellent.
The significant differences between the pre-program and post-program responses,
tend to support these findings, but need to be interpreted with caution due to the
small sample size.
Chapter 5. Research results and discussion of results. 93

Chapter 6 Interpretation of results
1. Introduction
This chapter will revisit the data as presented in Chapter 5, and will try to provide
answers to the research questions posed in Chapter 1 by interpretation of the data.
Because this study, being a qualitative study, will be hypothesis generating, the
recommendations will address the future development of the program, and will
identify certain trends flowing from this study that deserve further investigation.
2. The research questions
In Chapter 1 it was stated that the following questions will direct the study:
1 What design factors should be incorporated into the design of an interactive
multimedia program, developed to teach electrical principles to adolescents?
2 Which user factors should be catered for in the design of this interactive
multimedia program?
2.1 How do gender, previous computer experience and cultural
background influence navigation of learners through the interactive
multimedia program?
2.2 How do the navigational pathways of learners through the program
relate to the outcome of learning?
2.3 What learner control is advisable in a multimedia tutorial program?
3 How will certain affective characteristics of users influence their learning from
this developed program?
In Chapter 4, methods and procedures were described to show how the data had been acquired. This data was reported and commented upon in Chapter 5. In the
Chapter 6. Interpretation of results. 94

following paragraphs, tentative answers will be provided, where possible, to each of the questions posed above.
3. Tentative answers to the research questions
In Chapter 1 it was shown that this project consists of two major components, of which the most important component (70% of the effort) involved the design of an interactive multimedia program to teach the principles of electricity to adolescents, while the second component comprised of a report on the β testing and evaluation of the product.
The research strategy used for this β testing and evaluation of the project, was to identify and describe the mental models users had formed of the computer system, the developed program, as well as to describe the mental models or concepts users had formed of certain subject-specific content.
Due to the fact that this study is a hypothesis generating study, final answers to the research questions cannot be given. At best certain data trends were identified that could seed further investigation and research.
4. Mental models and interface design
As has been shown in Chapter 2, the ideal user's working mental model of a program is one that is consistent with the conceptual model of the program developed by designer. A user’s accurate mental model shows a model functional to the program. Weak or inaccurate mental models lack key components or features of the actual program.
In order to evaluate the program, using the mental models users had of it, one should determine if users had certain mental models that contained concepts that did not exist in the program, and further, if there were subsets of the program of which users were unaware. Once these mental models are determined and described, suggestions for program improvement can be made.
5. Description of users’ mental models
Table 23 on page 96 highlights the differences and similarities between the mental models of the researcher/ designer and the users. The data from Table 23 will be used to suggest improvements to the program.
Chapter 6. Interpretation of results. 95

Table 23. Description of the mental models of the researcher and program users
#. Designer’s model Users’ model Users’ model held by
Refer to
1 The computer is a didactic tool The computer is a game machine
2 students Table 8, p.66
2 Everybody will type without any typing errors
The computer will automatically correct typing errors
5 students Table 9, p. 67
3 All users will access the help pull-down menu when experiencing problems
The help-facility is not part of the program
11 users Table 10, p. 68
4 Everybody will understand figurative speech and expressions
Wordings of questions should be taken literally
5 users from the ex-DET school
Table 11, p. 70
5 Too much audio and video effects could shift the focus from important concepts towards cosmetic extras
Multimedia programs should contain “bells and whistles”, video and much more audio
3 male users from the ex-TED school
Table 11, p. 70
6 All users will always understand all the questions if answers are given
A computer program should always explain everything in detail
6 users Table 11, p. 70
7 Graphics and animations simplify contents
Graphics and animations simplify contents
all Table 12, p. 72
8 Maximum learner control might ensure maximum learning
Maximum learner control will ensure maximum learning
all users Table 12, p. 72
9 Constant, visually pleasing colours should be used in a presentation
Bright colours should be used in a presentation
one user Table 12, p. 72
10 A computer-based type of lesson might be preferable to normal class instruction
A computer-based type of lesson is preferable to normal class instruction
all users Table 13, p. 74
11 The program Introduction to Basic Electricity might motivate students
The use of program Introduction to Basic Electricity was a motivating experience
all users Table 14, p. 75
12 A computer-based type of lesson will allow the user to work at his own pace
A computer-based type of lesson will allow the user to work at his own pace
all Table 15, p. 77
Chapter 6. Interpretation of results. 96

6. Using users’ mental models for program improvement
One of the aims of this research was to use the mental models developed by the
users to refine and improve the program. Therefore, in the following paragraphs, the
data as illustrated in Table 23 on page 96 will be used as a basis for suggestions that
could lead to factors that could be incorporated into the design of Introduction to
Basic Electricity in order to improve the program.
1. Incorporate games into the program
Games are a powerful instructional tool that can provide an environment that
facilitates learning or the acquisition of skills (Alessi & Trollip, 1991).
Because many users do associate a computer to a gaming machine,
extensive use of this mode could be made in future versions of the program.
2. Make provision for typing errors
The existing log-on interface did present problems to users. A possible
solution could be to redesign the log-on interaction in such a way that the
program uses only the first three characters typed by the user as a password.
During the retype interaction, the program will again test only to see if the first
three characters typed by the user, correspond. If a typing error was made
after typing in the first three characters, the password checking procedure will
not pick it up, allowing the user to proceed with the program.
3. Make the help-facility an integral part of the program
Many users do not view the help-facility as being a part of the program.
Although the help pull-down menu was always available, users did not focus
on the pull down menus, because they were busy with an interaction that took
place somewhere else on the screen.
A solution could be to show a perpetual push-button, icon or hot spot on
every screen, allowing the user free access to the help system.
Chapter 6. Interpretation of results. 97

4. Reword questions
Some questions, both in the program and in future questionnaires, should be
reworded to ask precisely and directly, using exact language, the information
that is needed.
5. Allow for cosmetic motivators
Many users had previously used a wide range of multimedia programs, and
expected extensive audio and video to be integrated into the program.
Therefore, extensive use of audio and video clips should be made in future
versions of the program.
6. Ensure all the users understand everything
Many more questions could be built into the program. Automatic remediation
paths could be incorporated into the program to ensure that learning did take
place.
7. Graphics and animation
Although extensive use has been made of graphics and animation in the
present version of the program, this aspect should not be neglected in future
versions of the program.
8. Navigation and learner control
From the navigational path records of the users, it is clear that maximum
learner control is not advisable in a multimedia tutorial. Navigational freedom
should be allowed in relation to the computer skills and the existing
knowledge of the user. Therefore, jumps to specific modules should not be
allowed if the user does not possess the pre-knowledge base necessary to
successfully complete the module.
9. Colours
Where possible, the user could be allowed to change the colour palette of
certain screens to allow for individual preferences. Further research to
Chapter 6. Interpretation of results. 98

investigate the relationship between colour and successful learning should be
conducted.
10. Computer based type of lessons in the class-room
The program should be integrated into the whole learning task by the
development of a complete teacher/ parent manual to help and direct
teachers and/ or parents in the optimal use of the program in class and at
home.
11. Motivational aspects
Comparing the results from the pre- and post program questionnaires show
that the program could be a motivational factor in the learning of users. Due
to the small test group, further research is necessary to confirm this
deduction.
12. Users may work at their own pace
Although the program successfully allowed users to work at their own pace,
this has lead to the fact that some of the users did not complete all the
modules. A tracking program could be incorporated within the program that
records the progress data of the users. This data should be made accessible
to the teacher.
This implies that an administrative module should be added to the program to
monitor and manage the progress of every student.
7. Using users’ mental models to describe the acquisition of learning – concepts
7.1 The concept “atom”
In Chapter 5, paragraph 5.1.1 on page 86, the pre-program and post-program mental
models users had of the concept “atom”, were described and commented upon.
Chapter 6. Interpretation of results. 99

Table 19 on page 89 highlights the changes which occurred in the mental models
that users held of the concept “atom”. From the data, it is clear that significant and
fundamental changes did occur in the conceptual models of the atom users had
before working with the program, and the models users had of this concept after
working with the program.
7.2 The concept “electricity”
In Chapter 5, paragraph 7.2 on page 100, the changes that occurred in the pre-
program and post-program concepts users held of the concept “electricity”, were
reported and commented upon. From the data, one can conclude that the changes
that did occur, where concepts have changed from concrete concepts obtained in the
class situation to more cognitive concepts, could be attributed to the interaction with
the developed program.
8. User factors
Because this program is designed to be a program to be used interactively by
individual users, the data reported in Chapter 5 seem to indicate that individual users
reacted differently to the program. The following paragraphs will try to identify
specific user factors that played a role in the interaction with the program.
8.1 Demographic variables and navigation
The second research question to be answered, is how gender, previous computer
experience and cultural background of the users influenced their navigation through
the interactive multimedia program.
Navigation in the program may be classified as either a top-down approach or a
bottom-up approach (Waern, 1990). The data in Table 24 on page 101 represents a
summary of the navigational paths illustrated in Figure 22 through Figure 33.
Chapter 6. Interpretation of results. 100

Table 24. Gender and navigation
Academic ability
Low Medium High
Male, former TED-school B T T
Female, former TED-school T B B
Male, former DET-school B B B
Female, former DET-school B B B
Code: B = Bottom-up approach; T = Top down approach
8.1.1 Gender and navigational path
From the data in Table 24, it is clear that there no significant difference in the
approaches taken by the male and female students from the former DET school.
There might be a difference in the approaches taken by the male and female
students from the former TED school, but no final conclusions could be made due to
the small sample size.
8.1.2 Previous computer experience
If the data as illustrated by Table 24 is compared to the previous computer
experience of the test group (Table 7 on page 64), it seems as if there might be a
relationship between computer literacy and the navigational paths through the
program. The two students who took a mainly top-down approach, were highly
computer literate, while the rest of the students took a bottom-up approach. All the
students who took a bottom-up approach, except one, had limited computer
experience.
8.1.3 Cultural background
The researcher noticed a definite relationship between the rate of progress through
the program, and the cultural background of the test group. The students from the
ex-DET school progressed through the program at a much slower rate than the
students from the ex-TED school.
Chapter 6. Interpretation of results. 101

On the other hand, the differences that did exist in the rate with which the users
worked through the program, could also be ascribed to other external factors.
Factors, such as previous computer experience, as well as unforeseen factors (such
as limited time to work with the program) could have influenced the working rate of
the users while working through the program.
8.2 Navigational pathways and the outcome of learning
It is interesting to note that the users who followed a bottom-up and worked linearly
through the program, did better in the on-line test than those who used a top-down
approach or those who followed a linear path through the program, but skipped the
introduction. Therefore, it seems as if students who follow a linear path through the
program, completing all the section in every module, will learn more than those who
follow a top-down approach or those who skip sections.
Due to the small size of the test group, no final answer could be given to the question
whether the navigational path followed through the program would influence the
outcome of learning. This question should be investigated further.
8.3 Learner control
In paragraph 6 on page 97 of this chapter, it was concluded that the experimental
results indicate that full user control for this program is not advisable. This
conclusion tends to support the views of Borsook & Higginbotham-Wheat (1991),
(see page 26).
8.4 Affective characteristics and learning from the program
The last research question dealt with the affective characteristics of the learners and
how these characteristics would influence the learning from the developed program.
In order to identify the affective characteristics of learners, the following aspects of
the program were evaluated using the pre- and post program questionnaires:
1. interaction;
2. interface;
Chapter 6. Interpretation of results. 102

3. involvement;
4. motivation; and
5. rate
The data obtained from the questionnaires, were reported and commented upon in
Chapter 5, paragraphs 4.1.1 to 4.1.5.
A global look at the data acquired through the pre- and post program questionnaires,
showed the following trends:
1. Interaction
• When using multiple choice type of questions, many students will
guess the answers. Therefore, good feedback should be given to
both correct and incorrect responses.
• Students with previous multimedia experience, prefer video / audio
feedback to plain graphics / text feedback.
2. Interface
• Animations can be positively used to enhance learning.
• The screen layout in the program was positively received by most of
the users.
• Even organised learners prefer the freedom allowed by the program.
On the other hand, it is doubtful whether the maximum learner control
allowed by the program, resulted in optimal learning.
• Where possible, users should be allowed to select a screen palette
according to their own individual preferences.
3. Involvement
• Students generally prefer the computer based type of lesson to
traditional instruction.
Chapter 6. Interpretation of results. 103

4. Motivation
• Users are interested in learning more about electricity as a result of
using the program.
• Students are of the opinion that computer based type of programs will
contribute to make normal classwork easier.
5. Rate
• All the students felt that they could work at their own pace.
9. Limitations of the study
Babbie (1989) maintains that small samples pose a serious problem to research
because it is difficult to identify and apply some generalisations that could apply to
the larger community. The test group could also have been influenced by the
“Hawthorne effect” (Neale & Liebert, 1986) in that pupils might have worked harder to
improve their performance owing to the fact that they were aware that they were
being observed by the researcher.
The fact that the students from the ex-TED school had less time available to interact
with the program than the students from the ex-DET school, could also have
influenced the data.
The researcher was not able to evaluate the program in an one-on-one session with
screen design experts. Such interaction would have improved the depth of the data
for the project, and the interaction between expert and researcher could have proved
invaluable.
This study was a report on the β - testing of the product. Because of the small size of
the test group, recommendations with regard to the program design should be
implemented with caution.
10. Recommendations
The recommendations will be divided into two groups:
Chapter 6. Interpretation of results. 104
• recommendations with regard to the program; and
• recommendations for further research.
10.1 Recommendations with regard to the program design
The following recommendations concern the further development of the program,
taking into account that these recommendations stem from a β - testing of the
product involving a small test group:
1. Incorporate a gaming module into the program.
2. Redesign the log-on interaction.
3. Redesign the interface, allowing for push-buttons, icons and hot-spots to access
help.
4. Allow for a full integration of video and audio in future versions of the program.
5. Limit learner control, and make more use of the potential of the computer to
control and direct learning.
6. Allow users to choose their own colour palette, where appropriate, and if deemed
necessary.
7. Develop a complete teacher / parent manual to help and direct teachers and / or
parents in the optimal use of the program in class and at home.
8. Build an administrative module into the program that will monitor and manage the
learning of every student.
10.2 Recommendations for further research
In Chapter 1 it was stated that this study will be hypothesis-generating. From the
data acquired through this study, additional research should be conducted to verify
the following hypotheses:
Chapter 6. Interpretation of results. 105

1. Incorporating games into a multimedia tutorial will enhance learning from the
program.
2. All users make typing errors.
3. Maximum learner control is not advisable for a multimedia tutorial.
4. Students who use the program Introduction to Basic Electricity, will be motivated
to study further in this field.
5. Gender will determine navigation through a multimedia program.
6. Previous computer experience will determine a user’s navigation through a
multimedia program.
7. The cultural background of users will determine the rate with which they work
through a multimedia program.
8. Navigation through a multimedia program will determine learning outcomes.
9. The affective value of screen colours will have a significant impact on learning.
11. Conclusion
The development and design of effective CAI programs depend on the careful
planning of the design. Instructional design principles should be adhered to in the
development of a computer assisted instructional program.
Thorough evaluation of the product is a necessity, using a variety of evaluation
techniques.
The researcher hopes that this study will stimulate further interest in computer
assisted instruction in South Africa, and that many programs addressing the needs of
the South African learner will be developed in the near future.
Chapter 6. Interpretation of results. 106

References
1. Ackermann, D. & Greutmann, T. (1990). Experimental Reconstruction and
Simulation of Mental Models. In D. Ackermann & M.J. Tauber (Eds.), Mental
Models and Human-Computer Interaction 1. Human Factors in Information
Technology No. 3. Amsterdam: Elsevier.
2. Ackermann, D. & Tauber, M.J. (1990). Mental Models and Human-Computer
Interaction 1. Human Factors in Information Technology No. 3. Amsterdam:
Elsevier.
3. Alessi, S.M. & Trollip, S.R. (1991). Computer Based Instruction: Methods
and Development. 2nd Edition. Englewood Cliffs, NJ: Prentice Hall.
4. Authorware Professional for Windows v.2. (1993). [Computer Program].
Macromedia. Minneapolis, MN: Authorware, Inc.
5. Babbie, E. (1989). The Practice of Social Research. California: Wadsworth.
6. Barker, p. (1990). Designing Interactive Learning Systems. Education and
Training Technology International, 27(2), 125-150.
7. Becker, H.J. (1992). Computer Education. In M.C. Alkin (Ed.),
Encyclopaedia of Educational Research. p. 232-235. New York: Macmillan.
8. Bednar, A.K., Cunningham, D., Duffy, T.M., and Perry, J.D. (1991). Theory
into Practice: How do we link? In G.J. Anglin (Ed.), Instructional Technology:
Past, Present, and Future. Englewood, CO: Libraries Unlimited.
9. Bergers, L. (1994). Human Factors and User-Interface Design. In J.
Schoenmaker & I. Stanchev (Eds.), Visualisation: Principles and Tools for
Instructional Visualisation. Enschede: Anderson Consulting.
10. Berk, E. and Devlin, J., (1990). An Overview of Multimedia Computing. Data
Pro Reports on Document Imaging Systems, February, p.15.
107

11. Bloom, B.S., Engelhart, M.D., Furst, D.J., Hill, W.H. & Krathwohl, D.R. (1956).
Taxonomy of Educational Objectives: The Classifications of Educational
Goals. New York: David McKay.
12. Borsook, T., & Higginbotham-Wheat, N. (1991). Interactivity: What is it and
what can it do for Computer-Based Instruction. Educational Technology,
31(10), 11-17.
13. Borton, W. & Rossett, A. (1989). Educational Software And Published
Reviews: Congruence of Teacher, Developer and Evaluator Perceptions.
Education, 109(4), 434-444.
14. Briggs, p. (1990). The role of the user model in learning as an internally and
externally directed activity. In D. Ackermann & M.J. Tauber (Eds.) Mental
Models and Human-Computer Interaction 1. Human Factors in Information
Technology No. 3. Amsterdam: Elsevier.
15. Burger, M. (1991). Kriteria en prosedures vir die evaluering van
opvoedkundige rekenaarprogramme. Informedia, Mei, 4-6.
16. Burns, H., Parlett, J.W., & Redfield, C.L. (Eds.). (1991). Intelligent Tutoring
Systems: Evolutions in Design. Hullsdale, NJ: Lawrence Erlbaum.
17. Christensen, M., Giamo, M., Jones, T. & Simpson, L. (1993). Using
hypermedia to teach about hypermedia. Ed-Tech Review, (Autumn/Winter
1993), 17-26.
18. Clark, R.E. (1983). Reconsidering research on learning from media. Review
of Educational Research, 53(4), 445-459.
19. Clark, R.E. (1985). Confounding in educational research. Journal
Educational Computing Research, 1(2), 130-141
20. Clark, R.E. (1991). When researchers swim upstream: Reflections on an
unpopular argument about learning from media. Educational Technology
31(2)
21. Clark, R.E. (1994). Media Will Never Influence Learning. Educational
Technology Research and Development, 42(2), 21-29.
108

22. Collis, B.A. & De Diana, I. (1990). The portability of computer-related
educational resources: an overview of issues and directions. Journal of
Research on computing in Education, 23(2), 147-159
23. CorelDraw! Version 5. (1994). [Computer Program]. Dublin: Corel
Corporation Limited.
24. Cunningham, D.J. (1991). Assessing Constructions and Constructing
Assessments: A Dialogue. Educational Technology, 31(5), 13-17
25. de Kleer, J. & Brown, J.S. (1985) A qualitative physics based on
confluences. In D.G. Bobrow (Ed.), Qualitative reasoning about physical
systems, (pp. 7-83). Cambridge, MA: MIT Press.
26. Department of Education and Culture, Administration: House of Assembly
(1987). National Examinations Syllabus for Physical Science (Standard
Grade) Standard 9. Pretoria: Government Printer.
27. Department of Education and Culture, Administration: House of Assembly
(1987). National Examinations Syllabus for Physical Science (Higher Grade)
Standard 9. Pretoria: Government Printer.
28. Department of Education and Culture, Administration: House of Assembly
(1988). National Examinations Syllabus for Physical Science (Higher Grade)
Standard 10. Pretoria: Government Printer.
29. Department of Education and Culture, Administration: House of Assembly
(1988). National Examinations Syllabus for Physical Science (Standard
Grade) Standard 10. Pretoria: Government Printer.
30. Department of Education and Training. (1985). Syllabus for General Science
Standard 6. Pretoria: Government Printer.
31. Department of Education and Training. (1986). Syllabus for Physical
Science: Standard 8. Pretoria: Government Printer.
32. Department of Education and Training. (1986). Syllabus for General Science
Standard 7. Pretoria: Government Printer.
109

33. Dick, W. 1991 An Instructional Designer's View of Constructivism.
Educational Technology, 31(5), 41-44.
34. Duffy, M.D. & Jonassen, D.H. (1991). Constructivism: New Implications for
Instructional Technology? Educational Technology, 31(5). pp 7-11.
35. Fleming, M., & Levie, W.H. (1993). Instructional Message Design: Principles
from the Behavioural and Cognitive Sciences. Englewood Cliff, NJ:
Educational Technology Publications.
36. Fox, J., (1991). When Worlds Collide: Demystifying Multimedia. PC Today,
June, p. 6.
37. Fulton, K. (1993). Teaching Matters: The role of technology in education.
Ed-Tech Review, (Autumn/Winter 1993), 5-10.
38. Galbreath, J. (1992). The educational buzzword of the 1990's: Multimedia,
or is it Hypermedia, or Interactive Multimedia, or...? Educational Technology
32(4), 15-19
39. Gentner, D. & Stevens, A.L. (1983). Mental Models. Hillsdale, NJ:
Lawrence Erlbaum.
40. Hall, W., Thorogood, P. et al (1989). Using Hypercard and interactive video
in education: An application in cell biology. Educational and Training
Technology International, 26(3), 207-214.
41. Hannifin, M.J. & Peck, K.L. (1988). The design, development, and evaluation
of instructional software. New York: Macmillan Publishing Company
42. Heid, J., (1991). Getting Started with Multimedia. MacWorld, May, p.225.
43. Hewitt, T.T. (1987). The Drexel Disk: An Electronic Guidebook. In D.
Diapers & R. Winder (Eds.); People and Computers III. Cambridge, U.K.:
Cambridge University Press.
44. Howey, L. (1983). The Effects of Different Feedback Strategies on the
Attitude of Students Involved in Computer Assisted Instruction. Unpublished
Ph.D. thesis. Detroit, Michigan: Wayne State University.
110

45. Hugo, J. (1994). Human Factors in Multimedia. Paper presented at
Hypermedia '94: 2nd Southern African conference on Multimedia and
Hypermedia. Pretoria, 23 - 25 March, 1994.
46. Janniro, M.J. (1993) Effects of computer-based instruction on student
learning of psychophysiological detection of deception test question
formulation. Journal of Computer-Based Instruction, 20(2). 58-62.
47. Jaspers, F. (1991a). Interactivity or Instruction? A reaction to Merrill.
Educational Technology, 31(3).
48. Jaspers, F. (1991b). The relationship sound-image. International Journal of
Instructional Media, 18(2), 161-174.
49. Jih, H.J. & Reeves, T.C. (1992). Mental Models: A Research Focus on
Interactive Learning Systems. Educational Technology Research and
Development, 40(3). 39-53.
50. Johnson, D.W. & Johnson, R.T. (1986). Computer-assisted co-operative
learning. Educational Technology, 26(1), 12-28.
51. Johnson-Laird, P.N. (1983). Mental Models: Toward a Cognitive Science of
Language, Influence, and Consciousness. Cambridge, England: Cambridge
University Press.
52. Jolicoeur, K. & Berger, D.E. (1988a) Implementing educational software and
evaluating its academic effectiveness: Part I. Education Technology. 28(9),
7-13.
53. Jolicoeur, K. & Berger, D.E. (1988b) Implementing educational software and
evaluating its academic effectiveness: Part II. Education Technology.
28(10), 13-19.
54. Jonassen, D.H. (1985). Interactive Lesson Design: A Taxonomy.
Educational Technology, 25(6), 7-17.
55. Kearsley, G. (1985) Microcomputer software: Design and development
principles. Journal of Educational Computing Research, (1). 209-220
111
56. Kellner, M., (1991). Multimedia's Mounting Momentum. InfoWorld, October
21, 1991, p. 58.
57. Kinzie, M. (1990). Requirements and benefits of effective instruction:
Learner control, self-regulation, and continuing motivation. Educational
Technology, Research and Development, 38(1), 5-21.
58. Knight, P. (1992). Factors to consider in evaluating multimedia platforms for
widespread curricular adoption. Educational Technology, 32(5), 25-27.
59. Knussen, C., Tanner, G.R. & Kibby, M.R. (1991). An approach to the
evaluation of hypermedia. Computers in Education, 17(1), 13-24.
60. Kobayashi, S. (1986). Theoretical issues concerning superiority of pictures
over words and sentences on memory. Perceptual and Motor Skills, 63, 783-
792.
61. Kommers, p. (1994). Conceptual Metaphors for the Visualisation in
Interactive Learning. In J. Schoenmaker & I. Stanchev (Eds.), Visualisation:
Principles and Tools for Instructional Visualisation. Enschede: Anderson
Consulting.
62. Kozma, R.B. (1987). The implications of Cognitive Psychology for
Computer-Based Learning Tools. Educational Technology, 27(11), 20-25.
63. Kozma, R.B. (1991). Learning with Media. Review of Educational Research,
61, 179-211.
64. Kozma, R.B. (1994). Will Media Influence Learning? Reframing the Debate.
Educational Technology Research and Development, 42(2), 7 - 19.
65. Kyllonen, P.C., & Shute, V.J. (1989). A Taxonomy of Learning Skills. In
Ackerman, P.L., Sternberg, R.H. & Glaser, R. (Eds.), Learning and Individual
Differences: Advances in Theory and Research. New York: Freeman.
66. Lanza, A. & Roselli, T. (1991) Effects of the hypertexual approach versus
the structured approach on students' achievement. Journal of Computer-
Based Instruction, (18), 48-50
112

67. Laurel, B. (1990). The Art of Human Computer Interface Design. Reading,
MA: Addison-Wesley.
68. Little, T., (1991). Multimedia as a Network Technology. Business
Communications Review. May, p.65.
69. Magel, M., (1990). The Many Faces of Multimedia. A V Video, September, p.
68
70. Malamed, C. (1991). CBT Meets the Magic Kingdom. CBT Directions,
September, 10-15.
71. Malone, T.W. (1981). Towards a Theory of Intrinsically Motivating
Instruction. Cognitive Science, 5, 333-369.
72. Marchionini, G. (1988). Hypermedia and learning: Freedom and chaos.
Educational Technology, 28(11), 8-12.
73. Marchionini, G. (1991). Psychological Dimensions of User-Computer
Interfaces. ERIC Digest, ERIC Clearinghouse on Information Resources,
Syracuse, N.Y.
74. Marsh, C. (1982). The Survey Method. London: George Allen & Unwin.
75. Mayer, R.E. (1989). Models for Understanding. Review of Educational
Research, 59(1), 43-46.
76. Mayer, R.E. (1990). When Is an Illustration Worth Ten Thousand Words?
Journal of Educational Psychology, 82(4), 715-726
77. Mayer, R.E. (1992). Cognition and Instruction: Their Historic Meeting Within
Educational Psychology. Journal of Educational Psychology, 84(4), 405-412.
78. McCarthy, Robert. (1993). A Computer on Every Teacher's Desk. Electronic
Learning 12(7), 10-14.
79. Merrill, M.D. (1988). Don't Bother Me with Instructional Design - I'm Busy
Programming!: Suggestions for More Effective Educational Software.
Computers in Human Behaviour, 4(1), 37-52.
113

80. Merrill, M.D. (1991). Constructivism and Instructional Design. Educational
Technology, 30(5), 45-52.
81. Merrill, M.D., Li, S., & Jones, M.K. (1990). Second Generation Instructional
Design (ID2). Educational technology, 30(2), 7-14.
82. Mouton, J., & Marais, H.C. (1990). Basiese Begrippe: Metodologie van die
Geesteswetenskappe. Pretoria: RGN
83. Muller, E.W. (1985). Application of Experimental and Quasi-Experimental
Research Designs to Educational Software Evaluation. Educational
Technology, 25(10).
84. Neale, J.M. & Liebert, R.M. (1986). Science and Behaviour: An Introduction
to Methods of Research. Engelwood Cliffs, NJ: Prentice Hall.
85. Nelson, T. (1974) Dream machines. South Bend, IN: The Distributors.
86. Nelson, W. (1991). Mapping the structure of hypermedia documents.
Journal Hypermedia and Multimedia Studies, 1(3), 5-7.
87. Norman, D.A. (1983). Some Observations on Mental Models. In D. Gentner
& A.L. Stevens, (Eds.), Mental Models. Hillsdale, NJ: Lawrence Erlbaum.
88. Owston, R.D. & Dudley-Marling, C. (1988). A criterion-based approach to
software evaluation. Journal of Research in Computing in Education, 20(3).
89. Paivio, A. (1986). Mental Representations: A dual coding approach. New
York: Oxford Univ. Press.
90. Payne, S.J. (1987). Using Models of Users' Knowledge to Analyze
Learnability. In J. Long & A. Whitefield (Eds.), Cognitive Ergonomics and
Human-Computer Interaction. Cambridge, England: Cambridge University
Press.
91. Perkins, D.N. 1991 Technology Meets Constructivism: Do They Make a
Marriage? Educational Technology, 31(5), 18-22.
114

92. Preece, J. & Jones, A (1985). Training Teachers to Select Educational
Computer Software: Results of a Formative Evaluation of an Open University
Pack. British Journal of Educational Technology, 16(1).
93. Price, R.V. (1991). Computer-aided Instruction: A Guide for Authors.
Belmont, CA: Wadsworth.
94. Ralston, G., (1991). Hypermedia.. not Multimedia. The Expanded Desktop,
1(4), 58.
95. Reeves, T.C. (1992) Computer modelling: A research tool for computer-
based instruction. Interactive Learning International, 8, 3-13
96. Reeves, T.C. (1993) Research support for interactive multimedia: Existing
foundations and new directions. In C. Latchem., J. Williamson, &
Henderson-Lancett (Eds.), Interactive multimedia: Practice and promise.
London: Kogan Page.
97. Rieber, L. (1990). Animation in computer-based instruction. Educational
Technology Research and Development. 38(1), 77-86.
98. Rieber, L. (1990). Using computer graphics in science instruction with
children. Journal of Ed. Psychology, 82(1), 135-140.
99. Rieber, L. (1991). Animation, incidental learning and continuing motivation.
Journal of Ed. Psychology, 83(3), 318-328.
100. Rosenshine, B. & Meister, C. (1992). The Use of Scaffolds for Teaching
Higher-Level Cognitive Strategies. Educational Leadership, April 1992, 26-
33.
101. Rosenshine, B. & Stevens, R. (1986) Teaching functions, in Wittrock, M.C.
(Ed.), Handbook of Research on Teaching, 3rd edition. 328-375. Macmillan,
New York.
102. Ross, S.M. & Morrison, G.R. (1989). In search of a happy medium in
instructional technology research: Issues concerning external validity, media
replications, and learner control. Educational Technology Research and
Development, 37(1), 19-33
115

103. Ross, T.W. (1993). Bloom and hypertext: Parallel taxonomies? Ed-Tech
Review, (Autumn/Winter 1993), 11-16.
104. Rouse, W.B. & Morris, N.M. (1985). On Looking into the Black Box:
Prospects and Limits in the Search for Mental Models. Psychological Bulletin,
100, 349-363.
105. Sasse, Martina-Angela. (1991). How to T(r)ap Users' Mental Models. In M.
J. Tauber D. Ackermann (Eds.), Mental Models and Human-Computer
Interaction 2. Human Factors in Information Technology No. 7. Amsterdam:
Elsevier.
106. Schmalhofer, F. & Kühn, O. (1991). The Psychological Processes of
Constructing a Mental Model when Learning ... In M J. Tauber & D.
Ackermann (Eds.), Mental Models and Human-Computer Interaction 2.
Human Factors in Information Technology No. 7. Amsterdam: Elsevier.
107. Schueckler, L.M. & Shuell, T.J. (1989). A Comparison of Software
Evaluation Forms and reviews. Journal of Educational Computing Research,
5(1), 136-149
108. Shuell, T.J. & Schueckler, L.M. (1989). Toward Evaluating Software
According to Principles of Learning and Teaching. Journal of Educational
Computing Research, 5(2) .
109. Smith, D. & Keep, R. (1988). Eternal Triangulation: Case studies in the
Evaluation of Educational Software by Classroom-Based Teacher Groups.
Computer Education, 12(1).
110. Solomon, L. (1983). Development of reading-while-listening skills in the
primary grades. Reading Research Quarterly, XIX (1).
111. Spiro, R. & Jeng, H.C. (1990) Cognitive flexibility and hypertext: Theory and
technology for the non-linear and multidimensional traversal of complex
subject matter. In: D. Nix R. Spiro (Eds.), Cognition, Education, Multimedia,
163 - 205. Hillsdale, NJ: Lawrence Erlbaum Ass.
116

112. Steinberg, E.R. (1989). Cognition and Learner Control: A Literature Review,
1977 - 1988. Journal of Computer-Based Instruction, 16(4), 117-121.
113. Strong, G. & Strong, K. (1991). Visual guidance for information navigation:
Computer-human interface design principle derived from cognitive
neuroscience. Interacting with Computers, 3(2).
114. Strothman, J. (1991). Commodore Amiga, Multimedia Vet, Aids in
Presentations, Training. Computer Pictures, a supplement to A V Video,
January, p. S 14.
115. Tauber, M.J. & Ackermann, D. (1990). Mental Models and Human-Computer
Interaction 2. Human Factors in Information Technology No. 7. Amsterdam:
Elsevier.
116. Van der Veer, G.C. (1989). Individual Differences and the User Interface.
Ergonomics, 32(11), 1431-1449.
117. Van der Velden, J.M. & Arnold, A.G. (1991.) Mental Models and the
Evaluation of User Interfaces. In M.J. Tauber & D. Ackermann (Eds.), Mental
Models and Human-Computer Interaction 2. Human Factors in Information
Technology No. 7. Amsterdam: Elsevier.
118. Waern, Y. (1990). On the Dynamics of Mental Models. In D. Ackermann &
M.J. Tauber (Eds.), Mental Models and Human-Computer Interaction 1.
Human Factors in Information Technology No. 3. Amsterdam: Elsevier.
119. Zahner, J.E., Reiser, R.A., Dick, W. & Gill, B. (1992). Evaluating instructional
software: A simplified model. Educational Technology Research and
Development, 40(3), 55-62.
120. Zwart, W.J., Rhemrev, A.F.J., and Berloth, A.M. (1994). Adaptable
Educational Computer Simulations. In J.S. Schoenmaker & I. Stanchev
(Eds.), Visualisation: Principles and Tools for Instructional Visualisation.
Enschede: Anderson Consulting.
117

Appendix A. The pre-program questionnaire
PRE – PROGRAM QUESTIONNAIRE
Name Date of Birth
Male / female Previous computer experience?
Very strongly disagree
Very strongly
agree Interaction I would love it if the computer could speak back to
me. 1 2 3 4 5 6 7 8 9
Interaction I always guess the answer for multiple choice questions.
1 2 3 4 5 6 7 8 9
Interaction I hate it if a teacher marks my problems wrong and writes a long story about it.
1 2 3 4 5 6 7 8 9
Interaction In class, the teacher provides me with answers, but I still do not understand.
1 2 3 4 5 6 7 8 9
Interaction I think computer based education programs are boring.
1 2 3 4 5 6 7 8 9
Interface I love animations! 1 2 3 4 5 6 7 8 9 Interface I consider myself as being “artistically inclined”. 1 2 3 4 5 6 7 8 9 Interface I always organise my learning: e.g. I will complete
my Mathematics first, before starting my Science. 1 2 3 4 5 6 7 8 9
Interface A red and orange screen would look nice. 1 2 3 4 5 6 7 8 9 Interface I always use sketches when I learn. 1 2 3 4 5 6 7 8 9 Interface Computers normally frustrate me. 1 2 3 4 5 6 7 8 9 Interface When trying something, I give up easily if I do not
succeed. 1 2 3 4 5 6 7 8 9
Interface It is normally easy to work with a computer. 1 2 3 4 5 6 7 8 9 Involvement I prefer the computer based type of lesson to
traditional instruction. 1 2 3 4 5 6 7 8 9
Involvement When starting a new year at school, I am concerned that I may not be able to cope with the work.
1 2 3 4 5 6 7 8 9
Involvement I hate science! 1 2 3 4 5 6 7 8 9 Involvement The lessons in class are mostly dull. 1 2 3 4 5 6 7 8 9
118

Very strongly disagree
Very strongly
agree Motivation I really think I would like to learn more about atoms
and electricity. 1 2 3 4 5 6 7 8 9
Motivation I tense easily. 1 2 3 4 5 6 7 8 9 Motivation I think a computer program will make the normal
classwork much easier. 1 2 3 4 5 6 7 8 9
Motivation I think extra classes are mostly a waste of time. 1 2 3 4 5 6 7 8 9 Motivation I am always totally involved in class. 1 2 3 4 5 6 7 8 9 Motivation My teachers always challenge me to do my best.. 1 2 3 4 5 6 7 8 9 Rate I learn best when I feel I am pressed for time. 1 2 3 4 5 6 7 8 9 Rate I love to work at my own pace, without being
pushed. 1 2 3 4 5 6 7 8 9
Rate Sometimes the teacher goes too slow because he keeps on explaining things to the rest of the class.
1 2 3 4 5 6 7 8 9
Rate I consider myself to be a patient person. 1 2 3 4 5 6 7 8 9
119

Appendix B. Post-program questionnaire
POST – PROGRAM QUESTIONNAIRE
Name Date of Birth
Male / female Previous computer experience?
Very strongly disagree
Very strongly
agree Interaction I felt as if someone was engaged in conversation
with me. 1 2 3 4 5 6 7 8 9
Interaction I guessed the answers to some questions. 1 2 3 4 5 6 7 8 9 Interaction I was encouraged by the responses given to my
answers of questions. 1 2 3 4 5 6 7 8 9
Interaction I was given answers, but still do not understand the questions.
1 2 3 4 5 6 7 8 9
Interaction The feedback was boring. 1 2 3 4 5 6 7 8 9 Interface I did not like the animations in the program. 1 2 3 4 5 6 7 8 9 Interface I did not like the screen layout at all. 1 2 3 4 5 6 7 8 9 Interface I like the fact that I can jump from one topic directly
to another topic. 1 2 3 4 5 6 7 8 9
Interface I loved the colours. 1 2 3 4 5 6 7 8 9 Interface The animations in the program made the contents
easy to understand. 1 2 3 4 5 6 7 8 9
Interface The program frustrated me. 1 2 3 4 5 6 7 8 9 Interface Sometimes I felt completely lost 1 2 3 4 5 6 7 8 9 Interface The program is very easy to work with. 1 2 3 4 5 6 7 8 9 Involvement I prefer the computer based type of lesson to
traditional instruction. 1 2 3 4 5 6 7 8 9
Involvement I was concerned that I might not be able to understand the material.
1 2 3 4 5 6 7 8 9
Involvement My feeling towards the course material after I had completed the program was favourable.
1 2 3 4 5 6 7 8 9
Involvement The lessons in the program were dull and difficult to follow.
1 2 3 4 5 6 7 8 9
120

Very strongly disagree
Very strongly
agree Motivation As a result of having studied by this method, I am
interested in learning more about the subject matter. 1 2 3 4 5 6 7 8 9
Motivation I felt quite tense when I worked through the program 1 2 3 4 5 6 7 8 9 Motivation I think that what I have learned from the program,
should make the normal classroom and laboratory work easier to understand.
1 2 3 4 5 6 7 8 9
Motivation I think working through the program was a waste of time.
1 2 3 4 5 6 7 8 9
Motivation The lessons were interesting and really kept me involved.
1 2 3 4 5 6 7 8 9
Motivation The program challenged me to try my best. 1 2 3 4 5 6 7 8 9 Rate I could have learned more if I hadn’t felt pushed. 1 2 3 4 5 6 7 8 9 Rate I felt that I could work at my own pace. 1 2 3 4 5 6 7 8 9 Rate The course material was presented too slowly. 1 2 3 4 5 6 7 8 9 Rate The program ran much too fast. 1 2 3 4 5 6 7 8 9
121

Appendix C. An example of tracking data
Student Date Time Length Module Icon mth 05/07/1995 14:37 0:00 Main menu Click static electricity mth 05/07/1995 14:38 0:00 Static electricity:
Main menu buttons
mth 05/07/1995 14:38 0:00 Static electricity: Main menu
Introduction to static electricity
mth 05/07/1995 14:38 0:00 Static electricity: Main menu
Electric charge introduction
mth 05/07/1995 14:38 0:00 stat_int.app 20100 - charge introduction mth 05/07/1995 14:38 0:00 Static electricity:
Main menu buttons
mth 05/07/1995 14:38 0:00 Static electricity: Main menu
Introduction to static electricity
mth 05/07/1995 14:38 0:00 Static electricity: Main menu
Electric charge introduction
mth 05/07/1995 14:38 0:00 Introduction to static electricity
20100 - charge introduction
mth 05/07/1995 14:38 0:01 Introduction to static electricity
20200 - comb hair
mth 05/07/1995 14:38 0:03 Introduction to static electricity
20300 - balloons
mth 05/07/1995 14:38 0:03 Introduction to static electricity
20360 - carpet
mth 05/07/1995 14:38 0:03 Introduction to static electricity
20400 - Benjamin Franklin & glass rods
mth 05/07/1995 14:38 0:06 Introduction to static electricity
20500 - ebonite
mth 05/07/1995 14:38 0:08 Introduction to static electricity
20600 - conclusion
mth 05/07/1995 14:38 0:09 Introduction to static electricity
20700
mth 05/07/1995 14:38 0:10 Introduction to static electricity
20800
mth 05/07/1995 14:38 0:11 Introduction to static electricity
20900
mth 05/07/1995 14:38 0:12 Introduction to static electricity
quit(0)
mth 05/07/1995 14:51 0:00 Static electricity: Main menu
buttons
mth 05/07/1995 14:51 0:00 Static electricity: Main menu
Atoms and electrical charge
mth 05/07/1995 14:51 0:00 Static electricity: Main menu
Charge through the transfer of electrons
mth 05/07/1995 14:51 0:00 Atoms and static electricity
32327
122

Student Date Time Length Module Icon mth 05/07/1995 14:51 0:00 Atoms and static
electricity Static menu
mth 05/07/1995 14:51 0:00 Atoms and static electricity
quit(0)
mth 05/07/1995 14:51 0:00 Static electricity: Main menu
buttons
mth 05/07/1995 14:51 0:00 Static electricity: Main menu
Electricity menu
mth 05/07/1995 14:51 0:00 Main menu Click static electricity mth 05/07/1995 14:51 0:00 Static electricity:
Main menu buttons
mth 05/07/1995 14:51 0:00 Static electricity: Main menu
Electrical fields
mth 05/07/1995 14:51 0:00 Static electricity: Main menu
Electric fields
mth 05/07/1995 14:51 0:00 Electric Fields Introduction mth 05/07/1995 14:51 0:00 Electric Fields 50000 mth 05/07/1995 14:51 0:00 Electric Fields 51000 mth 05/07/1995 14:51 0:01 Electric Fields 52000 mth 05/07/1995 14:51 0:01 Electric Fields 51000 mth 05/07/1995 14:51 0:01 Electric Fields 52000 mth 05/07/1995 14:51 0:02 Electric Fields More about fields mth 05/07/1995 14:51 0:02 Electric Fields 60000 mth 05/07/1995 14:51 0:02 Electric Fields 60010 mth 05/07/1995 14:51 0:02 Electric Fields choices mth 05/07/1995 14:51 0:02 Electric Fields 60200 direction mth 05/07/1995 14:51 0:04 Electric Fields 60500 shapes mth 05/07/1995 14:51 0:04 Electric Fields 60530 mth 05/07/1995 14:51 0:05 Electric Fields positive negative mth 05/07/1995 14:51 0:05 Electric Fields 60530 mth 05/07/1995 14:51 0:05 Electric Fields positive positive mth 05/07/1995 14:51 0:06 Electric Fields 60530 mth 05/07/1995 14:51 0:06 Electric Fields parallel plates mth 05/07/1995 14:51 0:07 Electric Fields At point B mth 05/07/1995 14:51 0:07 Electric Fields At points A, B and C mth 05/07/1995 14:51 0:07 Electric Fields 60530 mth 05/07/1995 14:51 0:07 Electric Fields Back mth 05/07/1995 14:51 0:07 Electric Fields 60500 shapes mth 05/07/1995 14:51 0:07 Electric Fields 60530 mth 05/07/1995 14:51 0:07 Electric Fields parallel plates mth 05/07/1995 14:51 0:08 Electric Fields At points A, B and C mth 05/07/1995 14:51 0:08 Electric Fields 60530 mth 05/07/1995 14:51 0:08 Electric Fields Inside loop mth 05/07/1995 14:51 0:09 Electric Fields 60530 mth 05/07/1995 14:51 0:09 Electric Fields Back
123

Student Date Time Length Module Icon mth 05/07/1995 14:51 0:09 Electric Fields 61000 Strength of an electrical field mth 05/07/1995 14:51 0:09 Electric Fields 61010 Strength text mth 05/07/1995 14:51 0:10 Electric Fields 61020 Balance and sphere mth 05/07/1995 14:51 0:10 Electric Fields 61030 Move charge interaction mth 05/07/1995 14:51 0:10 Electric Fields 61040 Move and take
measurements mth 05/07/1995 14:51 0:11 Electric Fields 61050 definition of field strength mth 05/07/1995 14:51 0:11 Electric Fields 61060 versterking field strength mth 05/07/1995 14:51 0:12 Electric Fields 61070 unit mth 05/07/1995 14:51 0:12 Electric Fields Electrical fields menu mth 05/07/1995 15:04 0:00 Static electricity:
Main menu buttons
mth 05/07/1995 15:04 0:00 Static electricity: Main menu
Coulomb's law
mth 05/07/1995 15:04 0:00 Static electricity: Main menu
The law of Coulomb
mth 05/07/1995 15:05 0:00 Coulomb’s Law The Unit mth 05/07/1995 15:05 0:00 Coulomb’s Law 32000 mth 05/07/1995 15:05 0:00 Coulomb’s Law 33000 mth 05/07/1995 15:05 0:01 Coulomb’s Law 34000 mth 05/07/1995 15:05 0:01 Coulomb’s Law 35000 mth 05/07/1995 15:05 0:01 Coulomb’s Law 35060 mth 05/07/1995 15:05 0:02 Coulomb’s Law 36000 mth 05/07/1995 15:05 0:03 Coulomb’s Law 37000 mth 05/07/1995 15:05 0:05 Coulomb’s Law Unit last mth 05/07/1995 15:05 0:05 Coulomb’s Law Static menu mth 05/07/1995 15:10 0:00 Static electricity:
Main menu buttons
mth 05/07/1995 15:10 0:00 Static electricity: Main menu
Electrical fields
mth 05/07/1995 15:10 0:00 Static electricity: Main menu
Electric fields
mth 05/07/1995 15:10 0:00 Static electricity: Main menu
buttons
mth 05/07/1995 15:10 0:00 Static electricity: Main menu
Time
mth 05/07/1995 15:10 0:00 All about static electricity
Time Utility
mth 05/07/1995 15:10 0:00 Static electricity: Main menu
Time
mth 05/07/1995 15:10 0:00 All about static electricity
Time Utility
124

Student Date Time Length Module Icon mth 05/07/1995 15:10 0:00 Static electricity:
Main menu Write a note
mth 05/07/1995 15:10 0:00 Static electricity: Main menu
Logoff
125

Appendix D. Program deepness level
Topic Deepness level Electrical fields end 1170 Strength of an electrical field 1100 Shape of an electrical field – parallel plates 1060 Shape of an electrical field – two positive charges 1050 Shape of an electrical field – positive / negative charge 1040 Shape of an electrical field 1020 Direction of an electrical field 1010 More about fields 970 Introduction to fields 960 Introduction to fields 930 Electric fields menu 920 Coulomb’s law – final interaction 890 Coulomb’s law – conclusions 870 Coulomb’s law – second experiment – conclusions 860 Coulomb’s law – cognitive scaffolding 750 Coulomb’s Law – first experiment conclusions 690 Coulomb’s Law – first experiment 670 Coulomb’s Law – introduction 640 Coulomb’s Law – the law 580 Coulomb’s Law – the unit: final interaction 570 Coulomb’s Law: the unit 510 Coulomb’s Law menu 490 Conservation of charge – final interaction 480 Conservation of charge 430 Charged objects – final interaction 420 Charged objects 380 Atoms and electrical charge – final interaction 370 Atoms and electrical charge 270 Choose “let me review” 250 Choose “I want to continue” 240 Atoms – take quiz 200 Atoms – introduction 180 Charge through the transfer of electrons 170 Introduction module – final interaction 140 Introduction module 30 Static menu 20 Log-on / Quit / Logoff 0
126

Appendix E. Program installation notes
Introduction to Basic Electricity Version 1 Installation notes
1. Minimum system requirements
• 486 DX2 – 50 MHz processor; 486 DX2 66 MHz processor or higher
recommended
• Microsoft Windows 3.1 or higher
• 8 MB RAM, 16 MB RAM recommended
• 30 MB free hard disk space
• 640x480, 256 colour display
• MPC-compatible sound card
2. System configuration considerations
Because of the many multimedia aspects of Introduction to Basic Electricity, a
sufficient amount of DOS memory is needed for proper operation. It is suggested
that the system has at least 550 KB free at the DOS prompt before starting Windows.
This can be checked by typing CHKDSK at the DOS prompt. The program will run
with less memory, but may eventually have trouble running some of the animations.
If one does not have enough free DOS memory, try freeing up some by removing
non-essential device drivers (network, etc.) from the system's CONFIG.SYS and/or
AUTOEXEC.BAT files. Another good way to make more memory available is to use
the DOS command MEMMAKER if it is available in the version of DOS installed on
the computer. See the MS-DOS User Guide for more information about running
MEMMAKER.
127

Although the program might run on a 386 DX2 50 MHz with 4 MB of memory, it will
run VERY slowly. The only way to increase the speed, will be to upgrade to a
minimum of 8 MB RAM, and at least a 486 DX2 66 MHz machine.
Introduction to Basic Electricity is a regular 16-bit Windows 3.1 application. It is not a
32-bit application. Although it will run in 32-bit mode, it has not been thoroughly
tested in this mode.
Testing has shown that making the size of the fixed disk buffer (sometimes called
"cache") larger can improve performance.
Another speedup can be made by configuring the system to run SmartDrive
(SMARTDRV.EXE) in the autoexec.bat file. SmartDrive is a disk cache utility that will
cache all disks that exist when it is loaded.
Configuring a permanent Swap File may also increase the performance of the
system. From Control Panel, select 386-Enhanced, and reconfigure Virtual Memory
to create a permanent Swap File.
Please see Incompatibilities and other known problems below for more information.
3. Installing Introduction to Basic Electricity
To install Introduction to Basic Electricity, the file INSTALL.BAT on the distribution
disks, must be run.
Place disk 1 of the distribution diskettes into drive A (or B).
1. From DOS, make the drive that you want to install from, the default drive by
typing A: or B: and pressing <ENTER>.
2. Type INSTALL <source drive>: <destination drive>: where <source drive> is
the letter of the drive you install from (A or B), and <destination drive> is the
drive you want to install to (C or D).
For example, if you install from drive A to drive D, you would type in
INSTALL A: D: and press <ENTER>.
3. Follow the instructions on the screen.
128

4. Starting and quitting Introduction to Basic Electricity.
1. Start Windows.
2. From Program Manager, choose Run from the File menu.
3. Click the <Browse> push-button.
4. In the Drives window, select the drive where the program is installed.
5. In the Directories window, double click on the directory <electric>.
6. in the File Name window, double click on the file <ELECTRIC.EXE>.
7. Click <OK>.
5. Incompatibilities and other known problems
If no sound in the animations is experienced, or a GP fault comes up when the
program starts or an animation is launched, please try these solutions:
• Remove the background bitmap (wallpaper) from the desktop. This is done by
running Control Panel, selecting Desktop, and changing the Wallpaper file to
None ("None" is at the top of the list).
• Another solution is not to run any other applications (especially those that adjust
the palette) while Introduction to Basic Electricity is running.
• Restarting Windows may also be a solution. It was found that on a small
percentage of computers, if the system palette is changed by another program or
a background picture, the animations experience problems the second time
Introduction to Basic Electricity is run within a single Windows session.
• A 256-colour video display mode is recommended when running Introduction to
Basic Electricity. A minimum of 256 colours is required. Using more than 256
colours (sometimes called millions of colours, 24 bit mode, 32,000 colours, or
64,000 colours) could cause some systems to use too much memory or run very
slowly. If the animations in the program do not work properly, this may be the
reason. Video display modes can be changed by running SETUP, normally
found in the Main program group.
129

• If palette problems (psychedelic colours), blank white areas, and improper
painting exist, these problems can only be addressed by contacting the
manufacturer of the video display adapter card and driver. An updated video
driver is most likely what is needed to fix these kinds of problems. One might
also try the Windows For Workgroups-supplied Super VGA video drivers if
display problems are encountered. These drivers work well with many different
types of video display adapter boards, although they may not provide access to
special features provided on the video board. To change to the Super VGA
drivers, run Windows SETUP in the Main program group (or SETUP.EXE from
the DOS prompt when in the Windows directory). Change the Display Option to
one of the "Super VGA" 256 colour modes. 640x480 resolution is the safest to try
first. Then restart Windows. If Windows does not restart properly, run
SETUP.EXE in the Windows directory from the DOS prompt, and select the
previous video driver setting.
• Some screen savers interact poorly with many of the animations. Crashes when
the screen saver activates, or an invisible mouse cursor when the screen saver
deactivates have been found to occur with some screen savers. If difficulties are
encountered, please disable the screen saver while running Introduction to Basic
Electricity.
• Introduction to Basic Electricity will work with MPC compliant sound boards.
Some sound boards are not MPC compliant, and these do not work properly. If
sound problems are encountered, (no sound or poor quality sound), check that
the sound board is MPC compliant. Another solution for sound problems is to use
the Windows-supplied Sound Blaster drivers instead of the drivers that were
included with the sound board. This works if the sound card offers a Sound
Blaster emulation mode. Check the sound board user's guide for instructions
about turning on Sound Blaster emulation in the sound card; some do it
automatically but others require you to run a utility program to enable Sound
Blaster emulation.
• Other products that change the screen palette may interact poorly with
Introduction to Basic Electricity. These include some screen savers. Switching
between them and Introduction to Basic Electricity may sometimes cause
130

incorrect palettes (psychedelic colours) to occur. If this happens, one will need to
close Introduction to Basic Electricity before switching to those applications.
• Some Program Manager replacements may have trouble starting or running
Introduction to Basic Electricity. Program Manager replacements that are 100%
compatible with the real Windows Program Manager do not cause any problems.
131

• The following software programs were referred to in the text:
•
•
132