Embed Size (px)
Citation preview
Forwards versus Options:
Effectiveness in Hedging Currency Risk in International Portfolios
Authors: Cecilia Alvarado-Vargas1, and Khwanchanok Kessakorn2
Supervisor: Anders Vilhelmsson
Degree Project in Finance, 15 ECTS credits
Lund University
Spring 2013
1 [email protected] 19880223-T400 2 [email protected] 19880919-T227
2
ABSTRACT
This paper aims to examine effectiveness of currency hedging of forward contracts and
options in international portfolio, consisting of assets denominated in Chinese Yuan and
Indian Rupee. Instead of applying Markowitz’s portfolio optimization, mean-CVaR
framework is used in order to deal with non-normality of return of financial assets as well as
exchange rates. In this paper, the finding shows that hedging strategies, either with forwards
or options yield better performance compared to unhedged strategy. In this research, there is
no clear conclusion whether forward contracts or put options outperforms one another. The
conclusion is different at different level of strike prices. Forward contract is more effective
compared to put option with strike price of 1%, 5% and 10% above spot rate whereas put
option with strike price of 15% above spot rate is more effective compared to forwards in
term of hedging currency risk in international portfolio.
Keywords: Currency Hedging, International Portfolios Diversification, Currency Forward
Contracts, Currency Put Options.

3
ACKNOWLEDGMENTS
We would like to give a special thanks to our supervisor, professor Anders Vilhelmsson, for
his greatly knowledge, feedback, and supervision throughout the writing of this degree
project. Moreover, we would like to give thanks to the discussants Lena Azzawi Al and
Alejandro Esteban Lombana Bentancourt for their valuable comments in the midterm
seminar.
Cecilia Alvarado-Vargas Khwanchanok Kessakorn
4
TABLE OF CONTENTS
1. INTRODUCTION ------------------------------------------------------------------------------------- 5
1.1 Background ----------------------------------------------------------------------------------------- 5
1.2 Problem Discussion -------------------------------------------------------------------------------- 5
1.3 Research Question --------------------------------------------------------------------------------- 7
1.4 Scope and Delimitation --------------------------------------------------------------------------- 7
1.5 Disposition ------------------------------------------------------------------------------------------ 7
2. LITERATURE REVIEW ----------------------------------------------------------------------------- 8
3. THEORETICAL BACKGROUND----------------------------------------------------------------11
3.1 Currency Hedging Tools: Forwards and Options --------------------------------------------11
3.2 Downside Risk Measure -------------------------------------------------------------------------12
3.3 Portfolio Optimization ---------------------------------------------------------------------------15
4. DATA ---------------------------------------------------------------------------------------------------18
5. METHODOLOGIES ---------------------------------------------------------------------------------21
5.1 Mean-CVaR Portfolio Optimization Framework -----------------------------------------------21
5.2 Hedging Strategies Implementation ------------------------------------------------------------22
5.3 Hedge Ratio ----------------------------------------------------------------------------------------24
5.4 Performance Measure ----------------------------------------------------------------------------24
6. FINDINGS AND EMPERICAL RESULTS ------------------------------------------------------26
6.1 Optimal Hedge Ratio of forwards and put options -------------------------------------------26
6.2 Portfolio composition of each hedging strategies --------------------------------------------28
6.3 Hedging effectiveness ----------------------------------------------------------------------------30
7. LIMITATIONS ----------------------------------------------------------------------------------------33
8. SUMMARY AND CONCLUDING REMARKS ------------------------------------------------34
NOTES -----------------------------------------------------------------------------------------------------36
APPENDIX -----------------------------------------------------------------------------------------------37
1. CVaR Framework in MATLAB Code ----------------------------------------------------------37
2. Portfolio Efficient Frontier Graphs for the Three Strategies ---------------------------------37
REFERENCES -------------------------------------------------------------------------------------------41
5
1. INTRODUCTION
1.1 Background
Since 1990s, international financial integration has increased dramatically. Many individual
investors and institutional portfolio managers do not only invest domestically, but also
diversify their capital to other foreign countries. It is assumed that international assets have a
low correlation, relative to domestic assets. Consequently, international investment is
expected to reduce volatility, and help increase diversification. The move toward
international investment could be seen in significant growth in annual gross cross-border
flows [1], from approximately 5% of world GDP in the mid-1990s to around 20% in 2007
(OECD, 2011).
International portfolio is inevitably exposed to currency risk, as its market value is subject to
fluctuation in exchange rate. International investors are at risk of incurring losses, when
converting investment return from foreign back into base currencies. Therefore, it is
important for financial institutions as well as investors to consider currency hedging as a
mean to mitigate currency risk; hence the expected return of the investment can be
maintained. The basic principle behind currency hedging is to “convert or exchange the
currency while the rate of exchange is favorable, and then make the investment with currency
that is native to the country of origin where the investment is based” (Patil, 2012). This
approach is adopted to protect the investor against fluctuation in currency exchange rate, and
thereby preventing monetary loss.
1.2 Problem Discussion
Forward contracts and options are tools that are commonly used to hedge against currency
risk. Though many researches have been studying the effectiveness of forwards and options
in currency risk hedging; there is no consensus which tool outperforms one another. The
performance of each hedging tool, in terms of currency risk hedging, varies across different
papers. Eun and Resnick (1997) as well as Topaloglou, et al. (2007) found that forward-
hedged portfolio appeared to outperform optimally-hedged portfolio with put option. On the
contrary, Maurer and Valiani (2007) concluded that European put in-the-money option has
potential to substitute portfolio that is optimally hedged with forward. In
6
their paper, it appeared that small investment in European put in-the-money option could
yield currency hedging benefit, as much does the optimally forward-hedged portfolio.
In the past years, most of the empirical research in the field of international diversification
has focused on investment in assets denominated in currencies of developed countries. Only a
few studies have examined currency hedging in emerging markets. For example, Lessard
(1973) mainly focused on Latin American countries. Hauser et al, (1994) compared
international portfolios invested in developed and emerging markets. Bekaert and Urias
(1996) focused in the emerging markets such as in Latin America, Asia, and the Middle East.
Moreover, Bugar and Maurer (2002) explored the benefits of investing in emerging European
countries such as Hungary.
International portfolios with only assets denominated in currencies of developed countries no
longer reflect real-world situation. Therefore, many financial institutions and individual
investors are starting to shift their investments from developed regions into emerging
markets. Capital flows to emerging economies have surged dramatically after Subprime crisis
in 2008. Moreover, less stringent monetary policy in developed countries, particularly in
United States makes investment return in this region unattractive. Additionally, significant
economic growths as well as higher interest rates make emerging markets more appealing
among investors. Capital inflows to emerging economics are expected to increase from
$1,080 billion in 2012, to $1,118 billion in 2013. The inflows are anticipated to increase even
more in 2014, to $1,150 billion (Institute of International Finance, 2013).
Interestingly, emerging Asia is considered to be attractive investment destination, compared
to other emerging markets. Real GDP growth of emerging Asia is estimated to be
approximately around 7% in 2013 and 2014, which is higher relative to 3% to 4% growth of
the rest of emerging markets. Share of emerging Asia in total private capital flows to
emerging markets is forecasted to be average 46% in 2013. Among countries in emerging
Asia, China and India appear to be appealing to many investors. Capital inflows to China
have increased sharply over the past decade. Chinese inflows account for about 40% of all
inflows in 30 major emerging market economies. The total capital inflow for the year 2012
was of $370.4 billion, and capital inflow is expected to be $313.1 billion in 2013, and $312.6
billon in 2014. India capital inflows are also increasing rapidly. India total capital inflow in
7
the year 2012 was of $7.6 billion; and expected to be $21 billion in 2013 (Institute of
International Finance, 2013).
Since few literatures in the field of international hedging have been focusing on emerging
countries such as Latin America, Hungary, South East Asia, and the Middle East; together
with outstanding performance of India and China in global economy, this paper aims to fill a
missing gap and take an opportunity to study currency hedging effectiveness of international
portfolio that take into account Chinese and Indian market.
1.3 Research Question
‘Which hedging tools, forward or option outperforms one another, in terms of currency
hedging in international portfolio, consisting of assets denominated in Chinese Yuan and
Indian Rupee?’
1.4 Scope and Delimitation
This paper examines currency-hedging effectiveness in international portfolios from the
viewpoint of European investors. The international portfolio consists of equities and
government bonds denominated in five different currencies, which are British Pounds, US
Dollars, Euro, Indian Rupee, and Chinese Yuan. Among these currencies, British Pounds, US
Dollars, Euro are considered to be the currencies of developed countries, while Indian Rupee
and Chinese Yuan are accounted to be the currencies of emerging countries. Portfolio
performance would be assessed at one-month horizon. The period starts from January 2005
until December 2012.
1.5 Disposition
The structure of this research will be as follows: Section 2 discusses literature review, section
3 gives some necessary theoretical background, section 4 briefly describes the data that is
used for the analysis. Whereas section 5 explains methodologies applied to measure hedging
effectiveness, section 6 is finding and empirical results. Finally, section 7 provides summary
and concluding remarks of this research.

8
2. LITERATURE REVIEW
Many research papers have been studying the effectiveness of forwards and options in
currency risk hedging. Lessard (1973) took the viewpoint of a US-investor and studied the
diversification benefits of an investment into Latin American countries, which included
Colombia, Chile, Argentina, and Brazil. He applied multivariate analysis to determine
diversification benefit in international portfolio, and concluded that investing in Latin
America created gains within the portfolio, which is attractive to non-Latin American
investors.
Hauser, et al, (1994) compared hedged and unhedged equity portfolios in developed and
emerging markets. In his study, Value-at-Risk portfolio optimization framework was
implemented. He found that hedging currency risk in emerging markets enhances portfolio
performance, but at a cost of substantial increase in risk. Only investor who can tolerate more
risk can take advantage of diversifying their portfolio into emerging markets.
Harvey (1995) compared the benefits of investing in emerging markets. His research included
six Latin American markets (Argentina, Brazil, Chile, Colombia, Mexico, Venezuela), eight
Asian markets (India, Indonesia, Korea, Malaysia, Pakistan, Philippines, Taiwan, Thailand),
three European markets (Greece, Portugal, Turkey), and two African markets (Nigeria,
Zimbabwe). In his research, he used mean-variance portfolio optimization framework. He
concluded that it is possible to lower portfolio risk when participating in emerging markets.
This result is due to the correlations of equity returns in emerging market tend to have low
correlation with those of developed countries.
Eun and Resnick (1997) implemented two strategies used to hedge against currency exchange
risk. First strategy applied forwards contracts; and second strategy used protective put option
to mitigate the currency risk exposure. Their research focused on developed markets which
included Canada, France, Germany, Japan, Switzerland, UK, and US. They used mean-
variance framework to optimize international portfolios, and concluded that the use of
forward contracts yield better performance in comparison with the protective put options.
Roon, et al. (1999) tested the performance of using forward contracts in terms of hedging
currency risk in international stock portfolio from a US investor perspective. The paper
9
focused only in developed markets within G5 countries, which includes United States,
France, Germany, Japan, and United Kingdom. In this paper, regression framework is used to
assess hedging performance in three different cases which are mean-variance case, non mean-
variance case and case with nontraded risk. The paper concluded that “static hedging with
currency forwards does not lead to improvements in portfolio performance for a US investor
that holds a stock portfolio from the G5 countries. On the other hand, hedges that are
conditional on the current interest rate spread do lead to significant performance
improvements” (Roon, et al 1999,p.1).
Lien and Tse (2001) studied hedging effectiveness of futures and options in portfolio
denominated in three currencies the British Pound, the Deutsche Mark, and the Japanese Yen.
In this paper, Lower Partial Moment (LPM) is used in order to evaluate hedging effectiveness
of futures contracts and options. The paper concluded that the use of currency future
contracts almost always outperforms the use of option in currency hedging. “The only
situation in which options outperforms futures is when the individual hedger is optimistic
(with a large target return) and not too concerned about larger losses (so that large losses do
not impose greater weights than small losses)” (Lien and Tse, 2001, p.13).
Bugar and Maurer (2002) contrasted the benefits from international diversification with
futures in a developed stock market, Germany, with those in an emerging market, Hungary.
Throughout their paper, mean-variance framework is used to generate three different
investment strategies. Different hedging policies are also implemented in this paper in order
to observe hedging effectiveness. The study concluded that global investment yields better
investment performance compared to domestic investment. It found out that gains from
international diversification in the perspective of Hungarian investors are more observable
compared to that of German investors. Moreover, the paper suggested that optimally hedged
portfolio does not necessarily yield better performance than the fully hedged one.
Maurer and Valiani (2007) explored diversification benefit of forward contracts and
European put options for hedging currency risk. The research paper included five developed
countries, which are Switzerland, Japan, Germany, US, and UK. Also, it included the mean-
lower partial moment (LPM) to determine performance of forward and European put option
in mitigating risk in multi-currency portfolio. They found that forward-hedged portfolio
appeared to outperform optimally-hedged portfolio with European put option. Only European
10
put in-the-money option has potential to substitute the portfolio that is optimally hedged with
forward. In their paper, it appeared that small investment in European put option could yield
currency hedging benefit, as much does the optimally forward-hedged portfolio.
Topaloglou, et al. (2007) evaluated performance of forward contracts and currency put
options, consisting of assets denominated in British Pound, German Mark, and Japanese Yen.
The research paper employed mean-CVaR framework to minimize the excess losses beyond
predetermined thresholds, and concluded that international portfolio with forward appeared to
be superior than portfolio hedged with currency put options. However, when combining
several put options with different strike prices, different expiration, or even long and short
positions together, complex put option strategy e.g. Bear Spread strategy [2] yielded a better
result compared to forward contracts.
Campbell (2010) considered hedging strategies of stocks and bonds denominated in seven
major developed-market currencies which included: US Dollar, Euro, Japanese Yen, Swiss
Franc, British Pound, Canadian Dollar and Australian Dollar. In his paper mean-variance
portfolio optimization framework was implemented to evaluate the different portfolio
strategies. The paper concluded that risk-minimizing currency strategy for a global bond
investor is close to a full currency hedge; the optimal position of these seven currencies is to
long the US Dollar, Swiss Franc, and Euro; and simultaneously short the remaining
currencies.
Despite the fact forward contracts appears to outperform options in many literatures, there is
no consensus whether forwards or options outperforms one another. The performance of each
hedging tool, in terms of currency risk hedging, varies across different settings. Moreover,
only few literatures study about hedging effectiveness in emerging market. For this reason,
this paper aims to fill a missing gap and take an opportunity to study currency hedging
effectiveness of forwards and options in international portfolio that take into account
emerging markets of China and India.
11
3. THEORETICAL BACKGROUND
3.1 Currency Hedging Tools: Forwards and Options
There are two very common tools used for hedging against currency exchange risk, which
include forward contracts and options. A currency forward contract is an agreement that
obligates two parties either to buy (long position) or sell (short position) foreign currency at a
current spot rate, at a certain specified future date, and at a specified forward exchange rate.
On the other hand, a currency options is a contract that gives the right but not the obligation
to buy or sell foreign currency at a specific exchange rate at or before a specified date.
However, option holders need to pay the premium in any circumstance of fluctuation in
exchange rate. There are two different types of options, which are a call and a put option. A
call option gives the holder the right to buy foreign currency at a specified rate at a
determined date. A put option gives the holder the right to sell foreign currency at a specified
rate at a determined date.
Both forwards and options have advantages and disadvantages. Forward contracts help create
stability to both ends of the transaction are ensured to receive exact amount of money,
regardless of fluctuations in exchange rate in the future. Although forwards limit the losses in
the case of unfavorable change in exchange rate, the contracts also limit positive potential
gains and extra profits that investors are entitle to get in the event of a favorable movement in
exchange rate (Western Union Business Solutions, 2013). Similarly, options also help protect
against unfavorable fluctuation in exchange rate. In addition, options have comparative
advantage in term of flexibility. The holders could choose to abandon options in the event of
favorable movement in exchange rate, and exercise the contracts in the event of unfavorable
movement in exchange rate. Thus, options help limit loss up to option premium, but not limit
upside gain. Nevertheless, flexibility comes with cost. Option holders are required to pay
option premium, which could not be recovered in any circumstance.
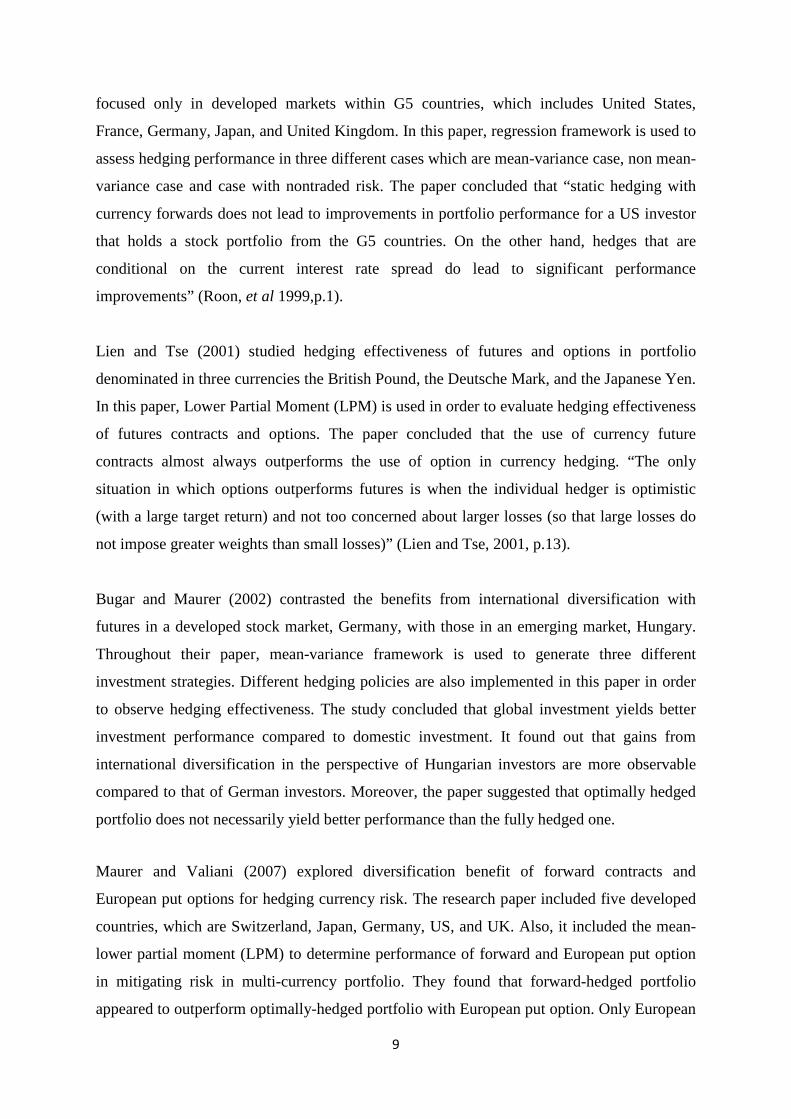
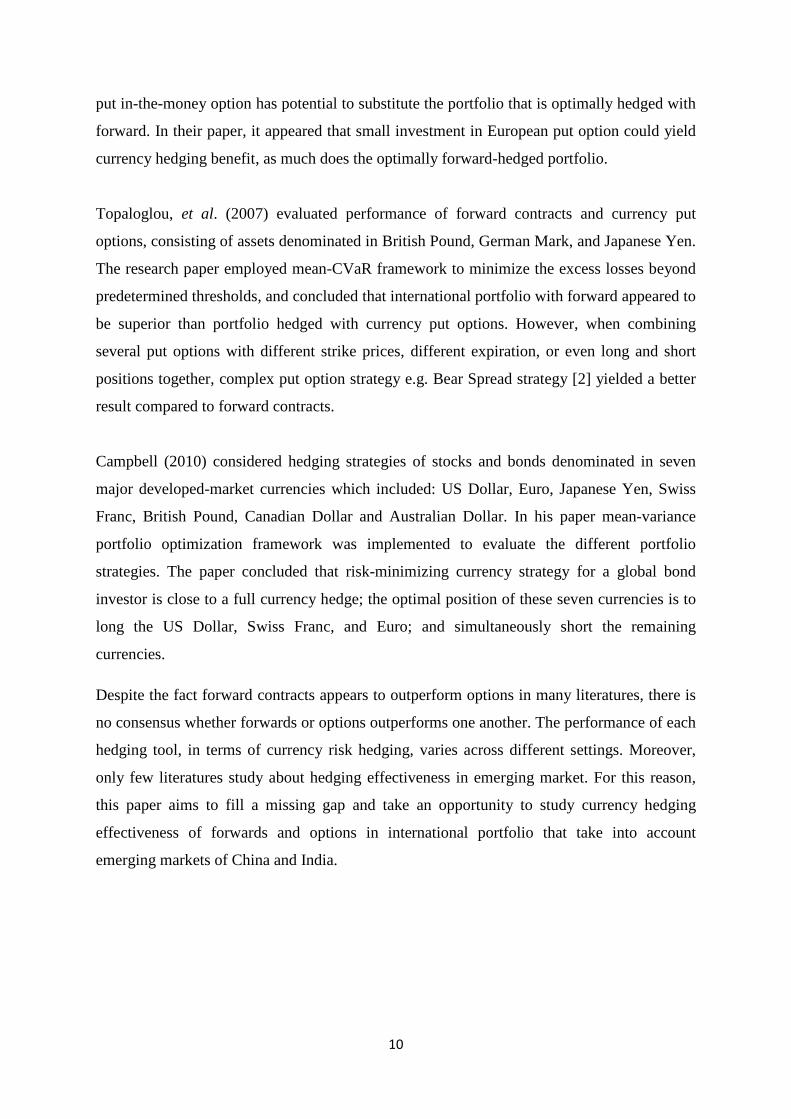
Forwards and options could be used differently to hedge against currency risk, depending on
the effect of fluctuation in exchange rate on particular agents. For agents who need to buy
foreign currencies with local currencies, appreciation in foreign currencies would have
negative impact to them. This is because more local currencies are needed in order to afford
same amount of foreign currencies. In other words, this type of agent has to pay more when
foreign currencies appreciate. In order to hedge against foreign currency appreciation, the
12
agent would take long position in forward, or buy call option to lock the exchange rate that
will be applied when they have to buy foreign currencies in the future.
On the other hand, currency depreciation in foreign currencies tends to have negative effect
on agents who need to sell foreign currency in exchange for local currencies. This is because
less local currencies would receive out of same amount of foreign currencies when foreign
currencies depreciate. To hedge against foreign currency depreciation, this type of agent
would take short position in forward, or buy put option to lock the rate they have to sell
foreign currencies in exchange for local currencies in the future.
Figure 1: Currency Hedging
Currency Appreciation Currency Depreciation
Long position in forwards
Long position in foreign currency call options
Short position in forwards
Long position in foreign currency put options
3.2 Downside Risk Measure
In finance theory, risk is defined as loss of investment. There are different kinds of risks in
finance industry. However, it appears that symmetric risk is commonly used in finance
industry, due to its simplicity. By definition, symmetric risk is described as “a gain that
occurs when the move in the underlying asset in one direction is similar to the loss when the
underlying asset moves in the opposite direction” (Barron’s Insurance Dictionary, 2013).
Nevertheless, symmetric risk is subject to criticism for treating return and loss equally.
“Intuitively, it makes more sense to punish the investor or fund manager for low returns, and
reward for high returns” (Bourachnikova and Yusupov, 2009).
Due to the criticism, downside risk is introduced in order to capture negative returns. This
risk could be calculated with different measures, especially with Value-at-Risk (VaR) and
Conditional Value-at-Risk (CVaR) as following
Value at Risk (VaR)
Value-at-Risk (VaR) is a percentile of a loss distribution. 𝑉𝑎𝑅𝛼(𝑋) is defined as a lower α-
percentile of the loss (X). In the paper of Sarykalin et al (2008), 𝑉𝑎𝑅𝛼(𝑋) is derived
mathematically as following,
13
𝑉𝑎𝑅𝛼(𝑋) = 𝑚𝑖𝑛{𝑧|𝐹𝑋(𝑧) ≥ 𝛼} ; α ∈ [0 , 1]
where X is a random variable, which in this case is loss
𝐹𝑋(𝑧) is cumulative distribution function, 𝐹𝑋(𝑧) = 𝑃{𝑋 ≤ 𝑧}
Conditional Value at Risk (CVaR)
Conditional Value-at-risk (CVaR) was introduced by Rockafellar and Uryasev (2000). It is
often proposed as an alternative percentile measure of risk. CVaR is also known as Expected
Shortfall (ES), and usually defined as the expected value of losses exceeding VaR. In the
paper of Sarykalin et al (2008), 𝐶𝑉𝑎𝑅𝛼(𝑋) is derived mathematically as following
𝐶𝑉𝑎𝑅𝛼(𝑋) = ∫ 𝑧𝑑𝐹𝑋∝∞
−∞ (z) ; α ∈ [0 , 1]
0, when z < 𝑉𝑎𝑅𝛼(𝑋),
𝑤ℎ𝑒𝑟𝑒 𝐹𝑋∝(z) =
𝐹𝑥 (𝑧)− 𝛼 1−𝛼
, when z ≥ 𝑉𝑎𝑅𝛼(𝑋).
Based on Acerbi (2002), CVaR can also be equivalently derived as following,
𝐶𝑉𝑎𝑅𝛼(𝑋) = 1 𝛼 ∫ 𝑉𝑎𝑅𝛽(𝑋)𝑑∞
0 β
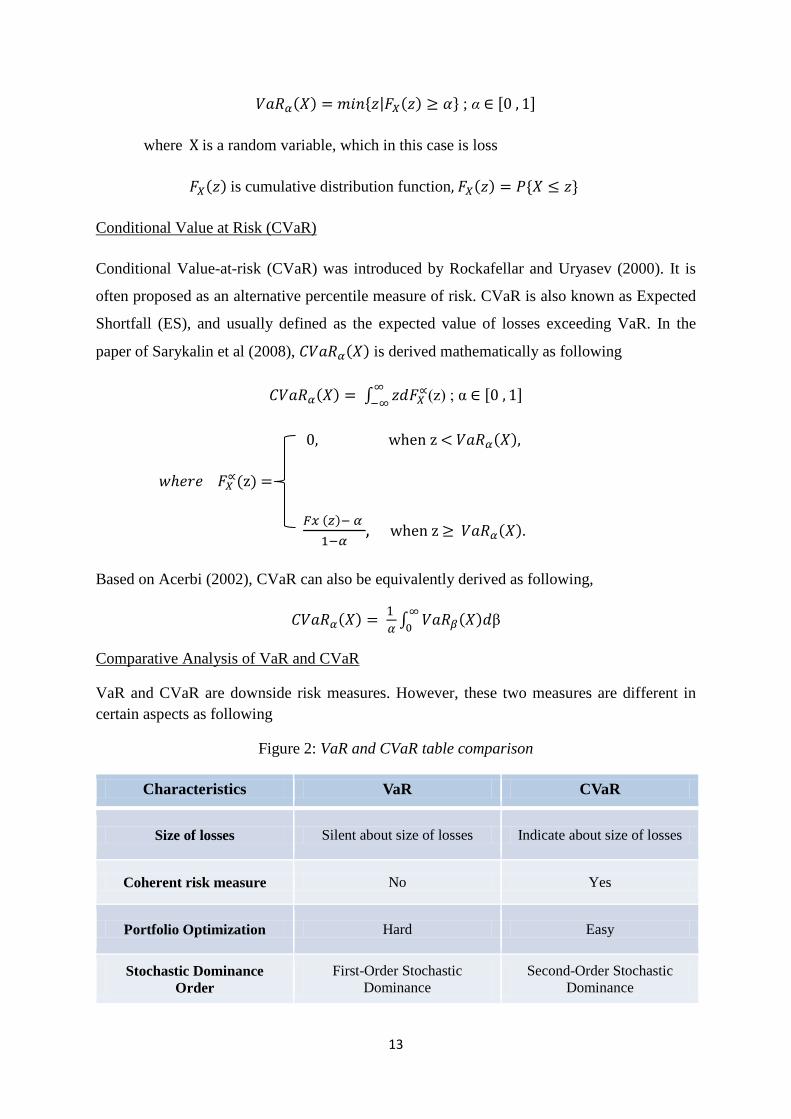
Comparative Analysis of VaR and CVaR
VaR and CVaR are downside risk measures. However, these two measures are different in certain aspects as following
Figure 2: VaR and CVaR table comparison
Characteristics VaR CVaR
Size of losses Silent about size of losses Indicate about size of losses
Coherent risk measure No Yes
Portfolio Optimization Hard Easy
Stochastic Dominance Order
First-Order Stochastic Dominance
Second-Order Stochastic Dominance
14
By definition, VaR indicates only how much one could lose with specified confidence level,
but is silent about magnitude of the losses if tail events happen. In other words, VaR does not
indicate about maximum possible losses. Unlike VaR, CVaR quantifies size of loss given that
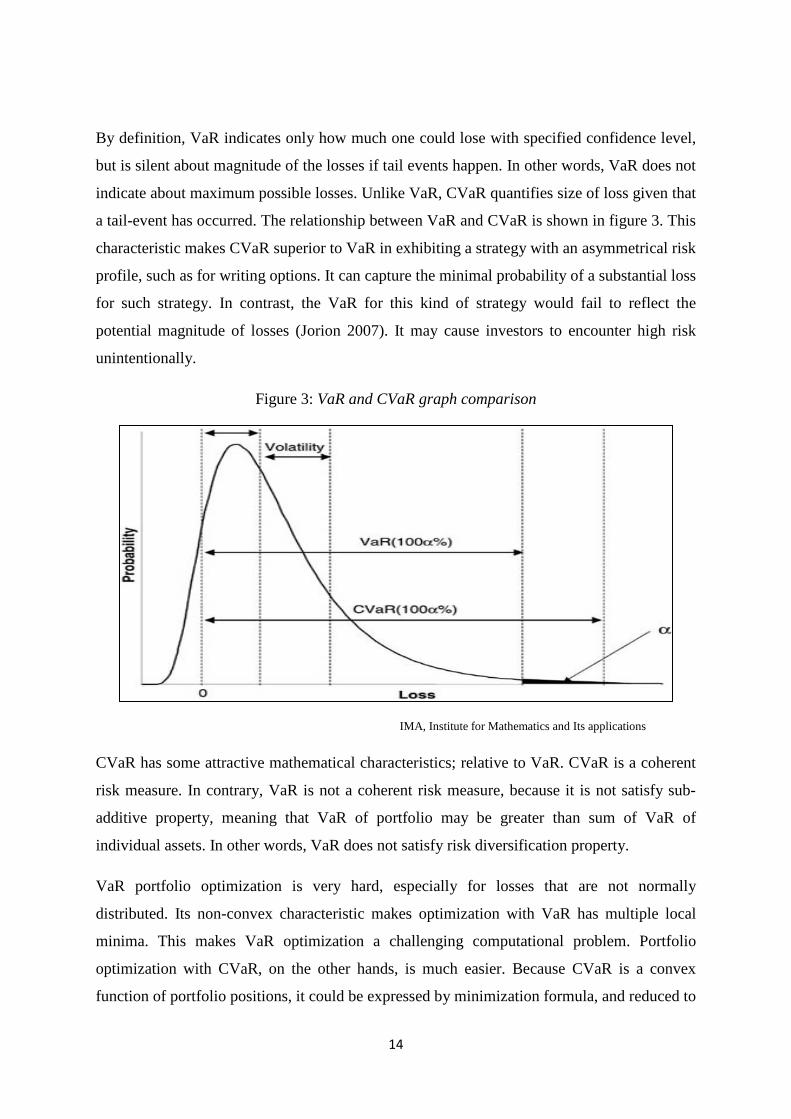
a tail-event has occurred. The relationship between VaR and CVaR is shown in figure 3. This
characteristic makes CVaR superior to VaR in exhibiting a strategy with an asymmetrical risk
profile, such as for writing options. It can capture the minimal probability of a substantial loss
for such strategy. In contrast, the VaR for this kind of strategy would fail to reflect the
potential magnitude of losses (Jorion 2007). It may cause investors to encounter high risk
unintentionally.
Figure 3: VaR and CVaR graph comparison
IMA, Institute for Mathematics and Its applications
CVaR has some attractive mathematical characteristics; relative to VaR. CVaR is a coherent
risk measure. In contrary, VaR is not a coherent risk measure, because it is not satisfy sub-
additive property, meaning that VaR of portfolio may be greater than sum of VaR of
individual assets. In other words, VaR does not satisfy risk diversification property.
VaR portfolio optimization is very hard, especially for losses that are not normally
distributed. Its non-convex characteristic makes optimization with VaR has multiple local
minima. This makes VaR optimization a challenging computational problem. Portfolio
optimization with CVaR, on the other hands, is much easier. Because CVaR is a convex
function of portfolio positions, it could be expressed by minimization formula, and reduced to

15
linear programming. This is confirmed by Rockafellar and Uryasev (2000). They showed that
when portfolio losses are estimated using a nonparametric method, portfolio risk is more
easily optimized by using CVaR than VaR.
VaR and CVaR are also different in term of stochastic dominance order. “VaR is consistent
with expected utility maximization only if portfolio can be ranked by first order stochastic
dominance; while CVaR is consistent with expected utility maximization if portfolios can be
ranked by second order stochastic dominance” (Nilsson, 2013).
3.3 Portfolio Optimization
Markowitz’s Portfolio Optimization
Mean-variance portfolio optimization of Markowitz (1952) indicates that agents optimally
select mean-variance efficient portfolios based on tradeoff between mean and variance of
portfolio. Based on the theory, efficient portfolio should yield the lowest risk for a given
expected return. This model is a cornerstone of modern portfolio theory, and widely used in
many financial applications. It is employed in determining optimal asset allocation,
measuring gains from international diversification, and evaluating portfolio performance
(Alexander et al., 2007).
The classical mean-variance portfolio optimization is formulated as following
Minimize ∑ 𝑤𝑖 𝑛𝑖,𝑗=1 𝑤𝑗 𝜎𝑖𝑗
Subject to
∑ 𝑤𝑖 𝑁𝑖= 1 𝐸(𝑅𝑖 ) = 𝑅𝑝
∑ 𝑤𝑖 𝑁𝑖= 1 = 1 where 𝑤𝑖 ≥ 0, i = 1, 2, …, N
where 𝑤𝑖 is the optimal weight of portfolio allocated to asset i
𝑤𝑖 ≥ 0 means short-sales are excluded because we focus on institutional investor
𝑅𝑖 is return of individual assets
𝑅𝑝 is the expected portfolio return
Mean-CVaR Portfolio Optimization
Mean-CVaR portfolio optimization is an extension of classical mean-variance model. In their
paper, Rockafellar and Uryasev (2000) defined a substitute function of CVaR as following
16
𝐹𝛼(x, ζ) = ζ + 11−𝛼
𝐸{[𝑓(𝑥, 𝑦) − 𝜁]+}
where 𝑓(𝑥, 𝑦) is a loss function with decision vector x and vector y of risk factor.
For example, loss function of portfolio with two assets could be written as
𝑓(𝑥, 𝑦) = −(𝑥1𝑦1+𝑥2𝑦2)
where 𝑥1𝑎𝑛𝑑 𝑥2 are weights of the portfolio
𝑦1𝑎𝑛𝑑 𝑦2 are rates of returns of two assets
In this sense, 𝐹𝛼(x, ζ) optimization would yield same result as CVaR optimization. 𝐹𝛼(x, ζ)
can be used to replace CVaR in optimization as following
Minimize 𝐹𝛼(x, ζ) = ζ + 11−𝛼
𝐸{[𝑓(𝑥, 𝑦) − 𝜁]+}
Subject to 𝑓(𝑥, 𝑦) − 𝜁 − η𝑘 ≤ 0
η𝑘 ≥ 0, k = 1, 2, …, N
where ζ is 𝑉𝑎𝑅𝛼
η𝑘 = [𝑓(𝑥, 𝑦) − 𝜁]+
Consequently, mean-CVaR portfolio optimization is formulated as following
Minimize 𝐹𝛼(x, ζ) = ζ + 11−𝛼
𝐸{[𝑓(𝑥, 𝑦) − 𝜁]+}
Subject to ∑ 𝑤𝑖 𝑁𝑖= 1 𝐸(𝑅𝑖 ) = 𝑅𝑝
∑ 𝑤𝑖 𝑁𝑖= 1 = 1
𝑓(𝑥, 𝑦) − 𝜁 − η𝑘 ≤ 0
η𝑘 ≥ 0, k = 1, 2, …, N
𝑤𝑖 ≥ 0, i = 1, 2, …, N
17
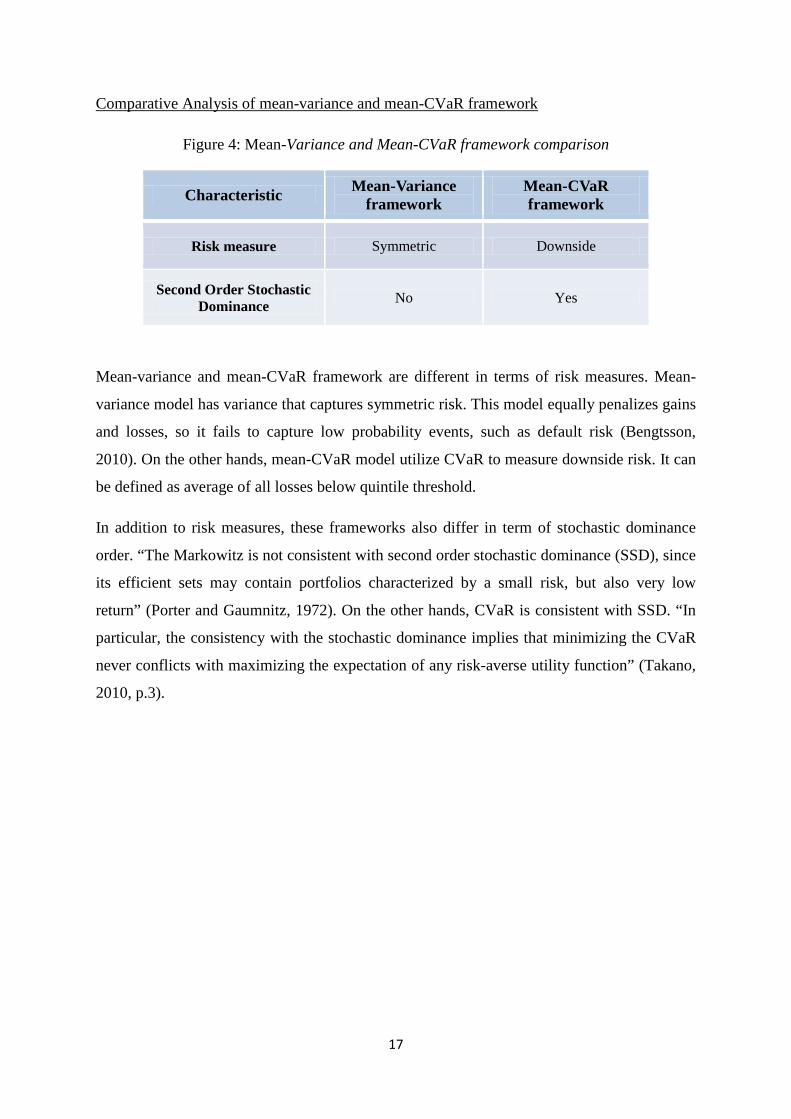
Comparative Analysis of mean-variance and mean-CVaR framework
Figure 4: Mean-Variance and Mean-CVaR framework comparison
Characteristic Mean-Variance framework
Mean-CVaR framework
Risk measure Symmetric Downside
Second Order Stochastic Dominance No Yes
Mean-variance and mean-CVaR framework are different in terms of risk measures. Mean-
variance model has variance that captures symmetric risk. This model equally penalizes gains
and losses, so it fails to capture low probability events, such as default risk (Bengtsson,
2010). On the other hands, mean-CVaR model utilize CVaR to measure downside risk. It can
be defined as average of all losses below quintile threshold.
In addition to risk measures, these frameworks also differ in term of stochastic dominance
order. “The Markowitz is not consistent with second order stochastic dominance (SSD), since
its efficient sets may contain portfolios characterized by a small risk, but also very low
return” (Porter and Gaumnitz, 1972). On the other hands, CVaR is consistent with SSD. “In
particular, the consistency with the stochastic dominance implies that minimizing the CVaR
never conflicts with maximizing the expectation of any risk-averse utility function” (Takano,
2010, p.3).
18
4. DATA
Equities indices are used as representative of equity market in each country. In this paper,
MSCI equities indices, consisting of MSCI EMU E, MSCI USA, MSCI UK, and MSCI
INDIA are used as representative of equity market in Europe, United States, United Kingdom
and India. In addition, Shanghai Stock Exchange Composite Index is used to represent
Chinese equity market. Note that every equity indices are value-weighted of major companies
based on market capitalization.
In addition, government bond indices are used as representative of bond markets in each
country. In this paper, clean price index of UK benchmark 10-year government bond index,
EMU benchmark 10-year government bond index, US benchmark 10-year index, as well as
FTSE Chinese government bond index 10+ years are used to represent long-term bond
market in United Kingdom, Europe, United States and China. Moreover, total return index of
India benchmark 8+ years government bond index is used to represent long-term bond market
in India.
As this paper aims to investigate hedging effectiveness in the view of European-based
investors, exchange rates and forward rates in term of domestic currency per foreign currency
are used as parts of our data. To be more precise, exchange rate and one-month forward
exchange rate of Euro per British Pound, Euro per US Dollar, Euro per Chinese Yuan, and
Euro per Indian Rupee are used within this research.
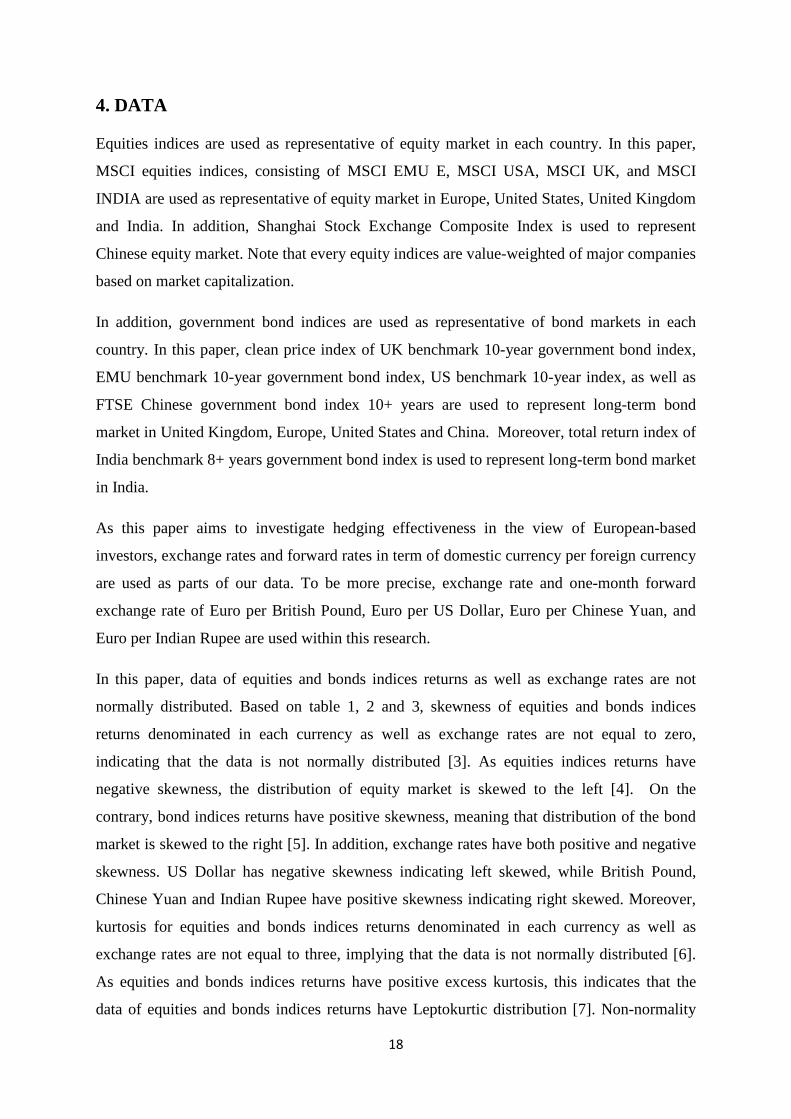
In this paper, data of equities and bonds indices returns as well as exchange rates are not
normally distributed. Based on table 1, 2 and 3, skewness of equities and bonds indices
returns denominated in each currency as well as exchange rates are not equal to zero,
indicating that the data is not normally distributed [3]. As equities indices returns have
negative skewness, the distribution of equity market is skewed to the left [4]. On the
contrary, bond indices returns have positive skewness, meaning that distribution of the bond
market is skewed to the right [5]. In addition, exchange rates have both positive and negative
skewness. US Dollar has negative skewness indicating left skewed, while British Pound,
Chinese Yuan and Indian Rupee have positive skewness indicating right skewed. Moreover,
kurtosis for equities and bonds indices returns denominated in each currency as well as
exchange rates are not equal to three, implying that the data is not normally distributed [6].
As equities and bonds indices returns have positive excess kurtosis, this indicates that the
data of equities and bonds indices returns have Leptokurtic distribution [7]. Non-normality
19
characteristic of equities and bonds indices returns as well as exchange rates are also
confirmed by Jarque-Bera (J/B) test [8]. Based on table 1, 2 and 3, most of the returns of
equities and bonds indices as well as exchange rates are statistically significant at 5 percent
significant level. Thus, null-hypothesis of normal distribution is rejected.
Table 1: Descriptive Statistics of Equities Indices Equities Indices
Returns EUROZONE US UK CHINA INDIA
Mean 0.000586 0.002137 0.001950 0.009793 0.011312 Median 0.010732 0.013122 0.010867 0.014848 0.022258
Maximum 0.125244 0.112848 0.086087 0.199945 0.210252 Minimum -0.220184 -0.235000 -0.200310 -0.284278 -0.295632 Std. Dev. 0.055146 0.044954 0.043108 0.072182 0.072902 Skewness -0.890794 -1.758469 -1.376960 -0.572854 -0.897552 Kurtosis 5.208951 10.25887 7.307978 5.088311 6.031038
Jarque-Bera 31.87850 257.5293 103.4817 22.45836 49.12130 Probability 0.000000 0.000000 0.000000 0.000013 0.000000
Table 2: Descriptive Statistics of Bond Indices Bond Indices
Return EUROZONE US UK CHINA INDIA
Mean 0.002449 0.002443 0.002773 0.001663 0.003289 Median 0.002201 0.002446 0.001911 -0.000827 0.002076
Maximum 0.048577 0.094240 0.071103 0.066383 0.119930 Minimum -0.030087 -0.047832 -0.055420 -0.038084 -0.066778 Std. Dev. 0.015207 0.019471 0.017342 0.015791 0.021941 Skewness 0.481814 1.103566 0.596702 1.085573 1.547286 Kurtosis 3.550090 7.771608 5.855998 5.895353 11.06142
Jarque-Bera 4.873408 109.4070 37.92455 51.84206 295.1447 Probability 0.087449 0.000000 0.000000 0.000000 0.000000
Table 3: Descriptive Statistics of Exchange Rates
Exchange rate (per €)
US DOLLAR BRITISH POUND CHINESE YUAN INDIAN RUPEE
Mean 0.748385 1.288953 0.105650 0.016322 Median 0.755663 1.252361 0.103941 0.016192
Maximum 0.848838 1.506925 0.127660 0.019105 Minimum 0.634593 1.086653 0.090735 0.013940 Std. Dev. 0.051247 0.144164 0.009879 0.001436 Skewness -0.239460 0.252954 0.496467 0.187159 Kurtosis -0.482993 -1.603737 -0.760459 -1.186994
Jarque-Bera 48.927399 84.907576 59.877581 69.947849 Probability 0.000000 0.000000 0.000000 0.000000
20
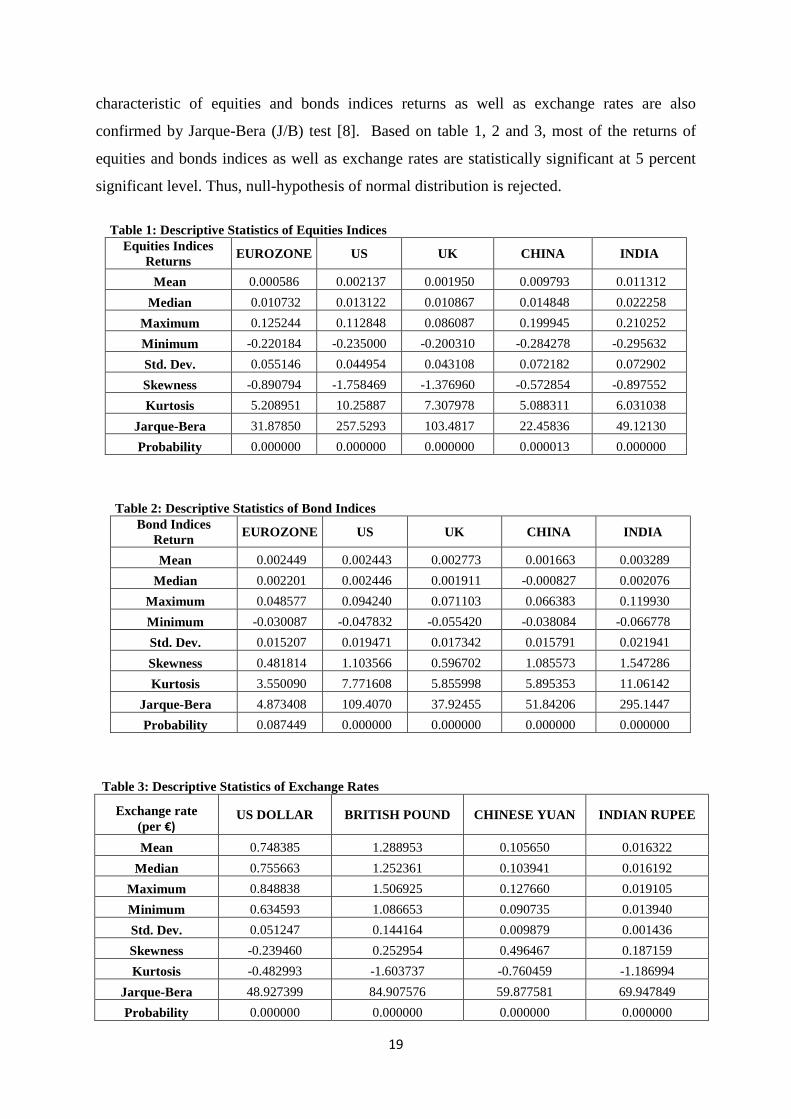
There is no data of currency put option price available on Datastream. Consequently, price of
European currency put option [9] is calculated based on option pricing model derived by
Biger and Hull (1983) and Garman and Kohlhagen (1983). The formula of European put
option price is as following,
𝑃𝑡 = - 𝑆𝑋𝑡 exp (- 𝑟𝑓 ( T – t ) ) N(- 𝑑1) + K exp( -r ( T – t )) N(- 𝑑2)
where
𝑑1= 𝑙𝑛�𝑆𝑋𝑡
𝐾 � + (𝑟 – 𝑟𝑓)(𝑇 – 𝑡)
Ϭ√𝑇−𝑡 + (1/2)Ϭ√𝑇 − 𝑡
𝑑2= 𝑙𝑛�𝑆𝑋𝑡
𝐾 � + (𝑟 – 𝑟𝑓)(𝑇 – 𝑡)
Ϭ√𝑇−𝑡 - (1/2)Ϭ√𝑇 − 𝑡
where 𝑃𝑡 is price of a European put option that mature at time t
𝑆𝑋𝑡 is spot exchange rate at time t (local currency/foreign currency)
𝑟 is risk-free rate in local currencies (Euro)
𝑟𝑓 is risk-free rate in foreign currencies
𝑇 − 𝑡 is time to maturity (1 month)
Ϭ is volatility of return on log of spot rates [10]
𝐾 is the strike price
For the purpose of evaluating hedging effectiveness, at-the-money and out-of-the-money put
options are disregarded; and only in-the-money put options are focused in this paper. This is
because at-the-money and out-of-the-money put options are not going to be lapsed. Investors
are going to trade currency in spot market instead of using put options. For this reason, at-the-
money and out-of-the-money put options are considered to expose to fluctuation in exchange
rates, not different from unhedged strategy. Only in-the-money put options would be focused
in this paper.
Note that strike prices of currency put options are not available on DataStream. As a result,
assumption about the strike prices needs to be made. Because strike prices are settled at
transaction date of options; thus, this paper assumes that strike prices are determined at the
beginning of each month. As only in-the-money put options are emphasized in this paper,
strike prices of put options are assumed to be higher than spot rate at the beginning of each
month by 1%, 5%, 10% and 15%.
21
5. METHODOLOGIES
5.1 Mean-CVaR Portfolio Optimization Framework
For a long period of time, mean-variance framework has been used to construct the optimal
portfolio. In this framework, variance has been used to measure portfolio risk. However, this
framework is not applicable for this research for the following reasons described below.
Mean-variance framework is not applicable in the context of currency risk management. It is
not efficient in capturing downside risk, which is the main emphasis of this research. As this
paper aims to evaluate hedging effectiveness of forwards and put options, it is appropriate to
apply other models that better capture unfavorable fluctuation in exchange rate. As a result,
this paper opts in to apply mean-CVaR framework, which is more efficient in terms of
measuring downside risk.
Moreover, mean-variance framework is based on assumptions of symmetric return
distribution, which is inconsistent with return distribution in this paper. According to table 1,
2 and 3 presented in previous section, returns of stock and bond indices as well as exchange
rates are not normally distributed. As paper of Cotter (2011) suggests hedgers to use CVaR,
instead of traditional variance in the case of asymmetric distribution; thus it is more
applicable to apply mean-CVaR model in this scenario.
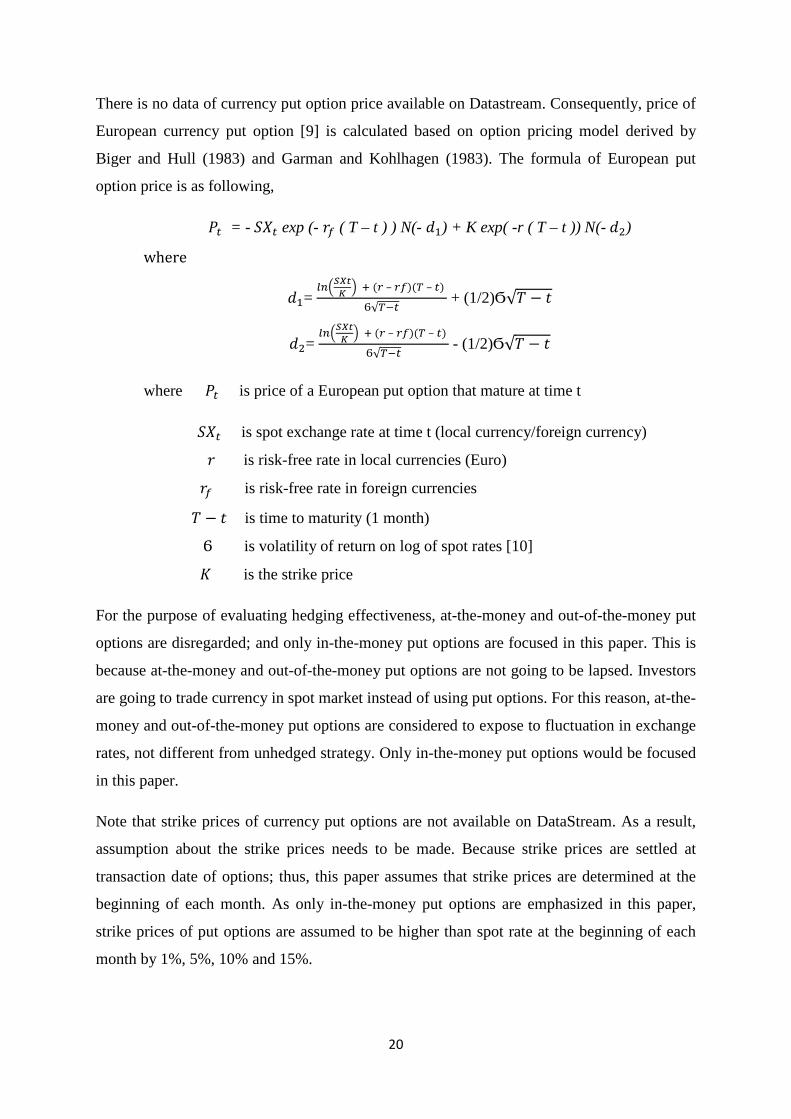
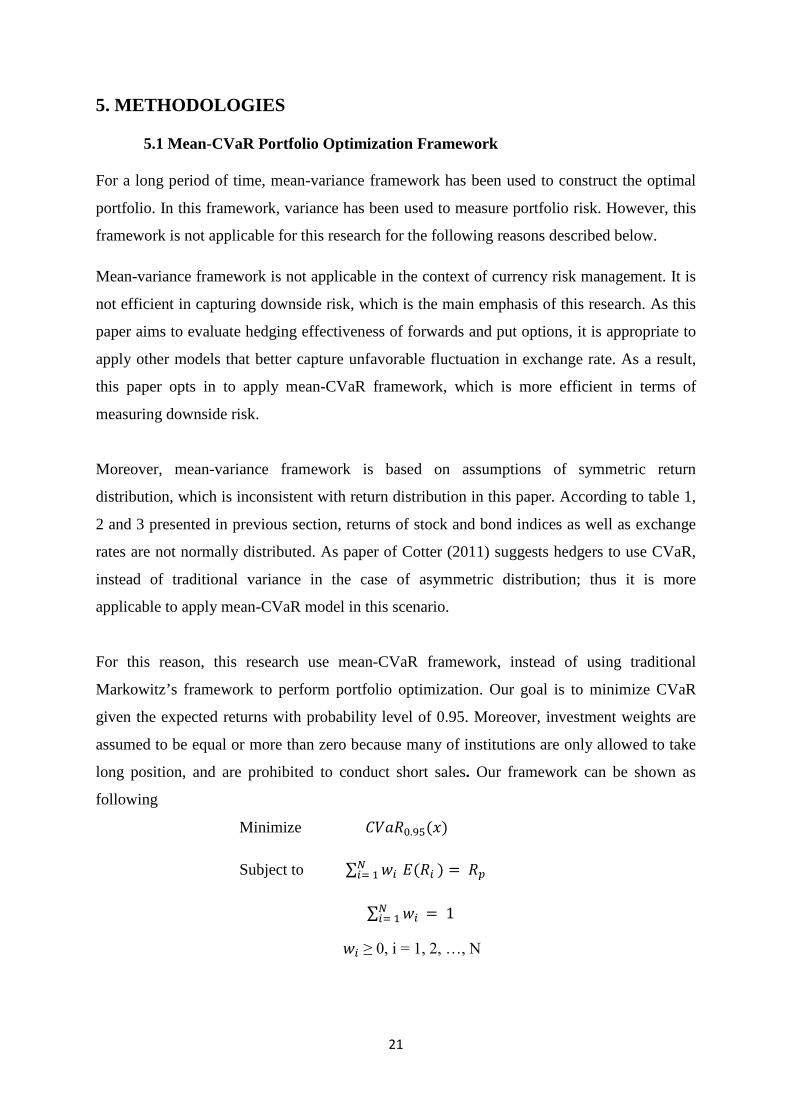
For this reason, this research use mean-CVaR framework, instead of using traditional
Markowitz’s framework to perform portfolio optimization. Our goal is to minimize CVaR
given the expected returns with probability level of 0.95. Moreover, investment weights are
assumed to be equal or more than zero because many of institutions are only allowed to take
long position, and are prohibited to conduct short sales. Our framework can be shown as
following
Minimize 𝐶𝑉𝑎𝑅0.95(𝑥)
Subject to ∑ 𝑤𝑖 𝑁𝑖= 1 𝐸(𝑅𝑖 ) = 𝑅𝑝
∑ 𝑤𝑖 𝑁𝑖= 1 = 1
𝑤𝑖 ≥ 0, i = 1, 2, …, N

22
This framework is estimated by using MATLAB, which the code is available in appendix
section. By using this software, 𝑉𝑎𝑅0.95(𝑥) would be calculated in order to
obtain 𝐶𝑉𝑎𝑅0.95(𝑥). In MATLAB, 𝐶𝑉𝑎𝑅0.95(𝑥) is calculated based on following equation
𝐶𝑉𝑎𝑅0.95(𝑥) = 𝑉𝑎𝑅0.95(𝑥) + 11− 0.95
∫ max{0, (𝑓(𝑥, 𝑦) − 𝑉𝑎𝑅0.95(𝑥)}p(y)dy
5.2 Hedging Strategies Implementation
In this paper, there is one unhedged strategy, and two hedging strategies with forwards and
options. Since this research only concentrates on European institutional investors, who need
to sell foreign currencies in exchange for Euro, only currency depreciation of foreign
currencies against domestic currencies (in this case Euro) would be considered to be
currency risk in this context. Consequently, this paper only focuses on two currency hedging
strategies which are 1.) short position in forward and 2.) long position in put option.
This paper incorporates three different hedging strategies through asset returns (𝑅𝑖 ) in
portfolio optimization framework as following,
Unhedged strategy
Unhedged strategy refers to the strategy, which does not incorporate currency hedging in
international portfolio. This means that the portfolio is fully exposed to fluctuation in
exchange rates.
Return of unhedged strategy is derived in the following equation:
𝑅𝑖 = 𝑅𝑖,𝑓 + 𝑒𝑓 + 𝑅𝑖,𝑓 ∗ 𝑒𝑓
where 𝑅𝑖,𝑓 is the rate of return of assets in the currency based in Euro
𝑒𝑓 = 𝑆𝑋𝑡+1− 𝑆𝑋𝑡𝑆𝑋𝑡
represents rate of appreciation or depreciation of foreign currencies
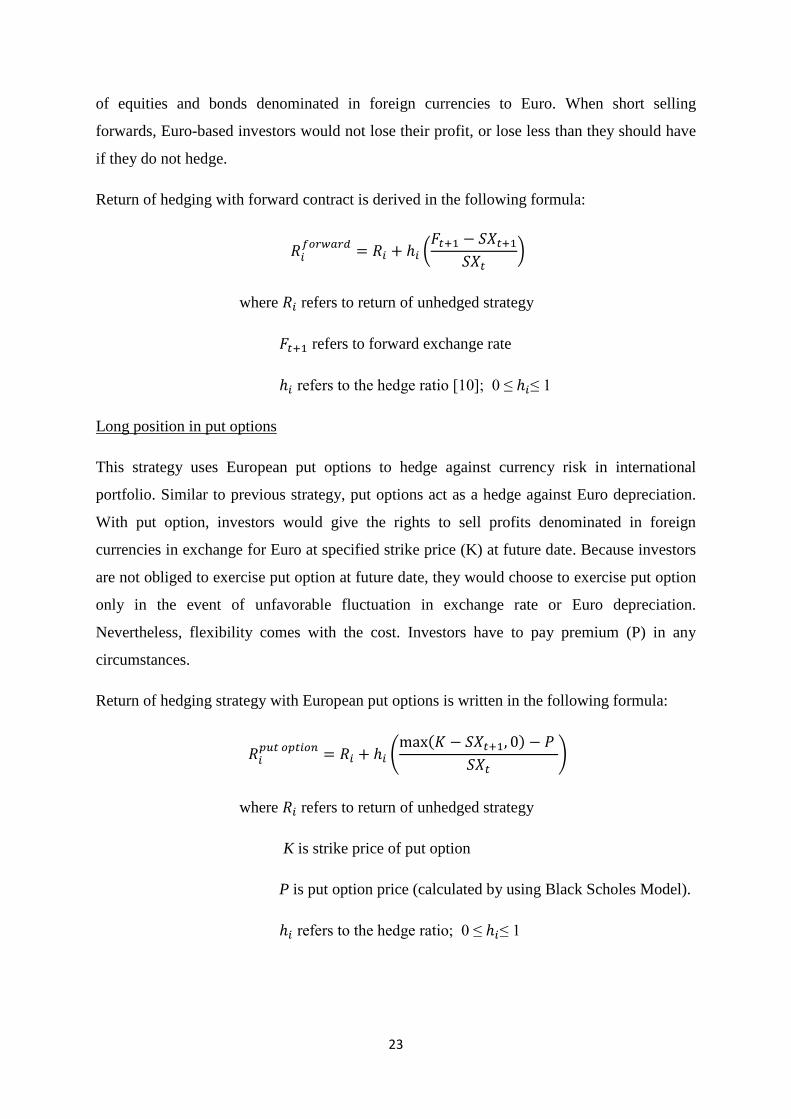
Short position in forwards
This strategy applies forward to hedge against exchange rate risk in international portfolio.
By applying short position in forwards, the contract acts as a hedge in the event of
depreciation in other foreign currencies against Euro. Basically, short position in forwards
locks exchange rate that investors are entitle to sell, or convert total return received from sale
23
of equities and bonds denominated in foreign currencies to Euro. When short selling
forwards, Euro-based investors would not lose their profit, or lose less than they should have
if they do not hedge.
Return of hedging with forward contract is derived in the following formula:
𝑅𝑖𝑓𝑜𝑟𝑤𝑎𝑟𝑑 = 𝑅𝑖 + ℎ𝑖 �
𝐹𝑡+1 − 𝑆𝑋𝑡+1
𝑆𝑋𝑡�
where 𝑅𝑖 refers to return of unhedged strategy
𝐹𝑡+1 refers to forward exchange rate
ℎ𝑖 refers to the hedge ratio [10]; 0 ≤ ℎ𝑖≤ 1
Long position in put options
This strategy uses European put options to hedge against currency risk in international
portfolio. Similar to previous strategy, put options act as a hedge against Euro depreciation.
With put option, investors would give the rights to sell profits denominated in foreign
currencies in exchange for Euro at specified strike price (K) at future date. Because investors
are not obliged to exercise put option at future date, they would choose to exercise put option
only in the event of unfavorable fluctuation in exchange rate or Euro depreciation.
Nevertheless, flexibility comes with the cost. Investors have to pay premium (P) in any
circumstances.
Return of hedging strategy with European put options is written in the following formula:
𝑅𝑖𝑝𝑢𝑡 𝑜𝑝𝑡𝑖𝑜𝑛 = 𝑅𝑖 + ℎ𝑖 �
max(𝐾 − 𝑆𝑋𝑡+1, 0) − 𝑃 𝑆𝑋𝑡
�
where 𝑅𝑖 refers to return of unhedged strategy
K is strike price of put option
P is put option price (calculated by using Black Scholes Model).
ℎ𝑖 refers to the hedge ratio; 0 ≤ ℎ𝑖≤ 1
24
5.3 Hedge Ratio
Hedging refers to reducing exposure of currency risk when investing in international
portfolios. By definition, “the conventional optimal hedge ratio is the percent of non-
domestic currency exposure that when converted back to domestic currency exposure
minimizes total portfolio volatility, it can also be defined in terms of maximizing return”
(Knupp, 2009).
However, the extent of optimal hedging is still questionable. Unitary hedge ratio or full hedge
does not necessarily yield optimal performance. From theoretical point of view, “the unitary
hedge ratio is the optimal one only if the exchange rate returns and local returns are
uncorrelated and the forward exchange premium is an unbiased predictor of the future
exchange rate returns” (Bugar and Maurer, 2002). Yet, this is unlikely to happen in practice.
Each hedging assets tend to have different optimal hedge ratios.
For this reason, this paper assumes four different hedge ratios of 0.25, 0.5, 0.75 and 1.00
(unitary hedge ratio). Within these four hedge ratios, the one that yields highest Conditional
Sharpe Ratio (CSR), and at the same time gives the lowest Conditional Value-at-Risk
(CVaR) would be said to be the closest to optimal hedge ratio.
5.4 Performance Measure
After obtaining efficient frontier from mean-CVaR framework, minimum-risk portfolio
(MRP) would be used as a criterion to select optimal portfolio for each hedging strategies.
MRP refers to the criterion that selects “the portfolio that gives the minimum level of risk, in
terms of shortfall expectation” (Maurer and Valiani, 2007)
By definition, hedging effectiveness is defined as “the extent to which hedging an investment
actually reduces risk” (Ferlex Financial Dictionary, 2012). As forward contracts and put
options are used to hedge against currency risk of international portfolio, risk-adjusted return
would be used as a benchmark to evaluate hedging effectiveness.
Since this paper applies mean-CVaR framework, Conditional Sharpe ratio (CSR) is used
instead of traditional Sharpe ratio to obtain risk-adjusted returns. CSR can be defined as
following
25
Conditional Sharpe Ratio (CSR) = 𝑅𝑝−𝑅𝑓
𝐶𝑉𝑎𝑅𝛼
In this research, CSR is implemented to international portfolios with different hedging
strategies. Then, CSR of each strategy is compared in order to measure hedging effectiveness.
Hedging strategy with the highest CSR can considered the most effective strategy to hedge
currency risk in international portfolio with asset denominated in currencies of emerging
countries.

26
6. FINDINGS AND EMPERICAL RESULTS
6.1 Optimal Hedge Ratio of forwards and put options
In this paper, it is found that hedge ratio of 1.00 is optimal hedge ratio for forward contracts
among other hedge ratio of 0.25, 0.50 and 0.75. An optimal hedge ratio of 1.00 means that it
is optimal for investors to fully hedge with forward contract against currency risk. Based on
table 4, international portfolio with forward with hedge ratio of 1.00 yields highest CSR of
16.08% relative to other international portfolio. In addition, international portfolio with
forward with hedge ratio of 1.00 gives the lowest CVaR of 1.72% compared to other
forward-hedged portfolio.
Table4: Forward Hedged Strategy
Forwards Hedged Strategy
Hedge Ratio Hi=0.25 Hi=0.50 Hi=0.75 Hi=1.00
Portfolio Return 0.26% 0.27% 0.28% 0.39%
Excess Return 0.14% 0.15% 0.17% 0.28%
Portfolio CvaR 1.77% 1.76% 1.74% 1.72%
CSR 8.19% 8.74% 9.48% 16.08%
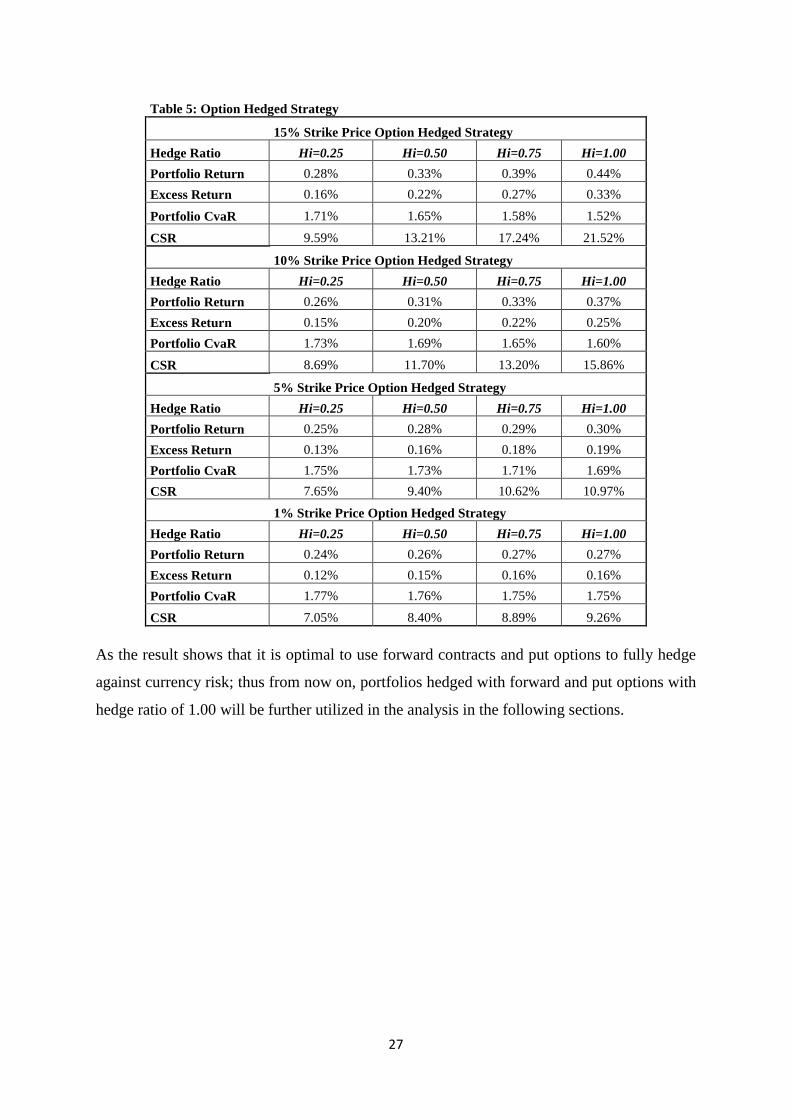
Similarly, it is found that hedge ratio of 1.00 is optimal for put options for every strike price
of 1%, 5%, 10% and 15% above spot rate. An optimal ratio of 1.00 means that it is optimal
for investor to fully hedge with put option against currency risk. Based on table 5,
international portfolios hedged with different put options with 1.00 hedge ratio yield highest
CSR as well as lowest portfolio risk compared to other hedge ratio of 0.25, 0.50 and 0.75. For
portfolio with put option with strike price 15% above the spot rate, it yields highest CSR of
21.52% and lowest CVaR of 1.52%. For portfolio with put option with strike price 10%
above the spot rate, it yields highest CSR of 15.86% and lowest CVaR of 1.60%. For
portfolio with put option with strike price 5% above the spot rate, it yields highest CSR of
10.97% and lowest CVaR of 1.69%. For portfolio with put option with strike price 1% above
the spot rate, it yields highest CSR of 9.26% and lowest CVaR of 1.75%.
27
Table 5: Option Hedged Strategy
15% Strike Price Option Hedged Strategy Hedge Ratio Hi=0.25 Hi=0.50 Hi=0.75 Hi=1.00 Portfolio Return 0.28% 0.33% 0.39% 0.44% Excess Return 0.16% 0.22% 0.27% 0.33%
Portfolio CvaR 1.71% 1.65% 1.58% 1.52%
CSR 9.59% 13.21% 17.24% 21.52%
10% Strike Price Option Hedged Strategy Hedge Ratio Hi=0.25 Hi=0.50 Hi=0.75 Hi=1.00 Portfolio Return 0.26% 0.31% 0.33% 0.37% Excess Return 0.15% 0.20% 0.22% 0.25% Portfolio CvaR 1.73% 1.69% 1.65% 1.60%
CSR 8.69% 11.70% 13.20% 15.86%
5% Strike Price Option Hedged Strategy Hedge Ratio Hi=0.25 Hi=0.50 Hi=0.75 Hi=1.00 Portfolio Return 0.25% 0.28% 0.29% 0.30% Excess Return 0.13% 0.16% 0.18% 0.19% Portfolio CvaR 1.75% 1.73% 1.71% 1.69% CSR 7.65% 9.40% 10.62% 10.97% 1% Strike Price Option Hedged Strategy Hedge Ratio Hi=0.25 Hi=0.50 Hi=0.75 Hi=1.00 Portfolio Return 0.24% 0.26% 0.27% 0.27% Excess Return 0.12% 0.15% 0.16% 0.16% Portfolio CvaR 1.77% 1.76% 1.75% 1.75%
CSR 7.05% 8.40% 8.89% 9.26%
As the result shows that it is optimal to use forward contracts and put options to fully hedge
against currency risk; thus from now on, portfolios hedged with forward and put options with
hedge ratio of 1.00 will be further utilized in the analysis in the following sections.
28
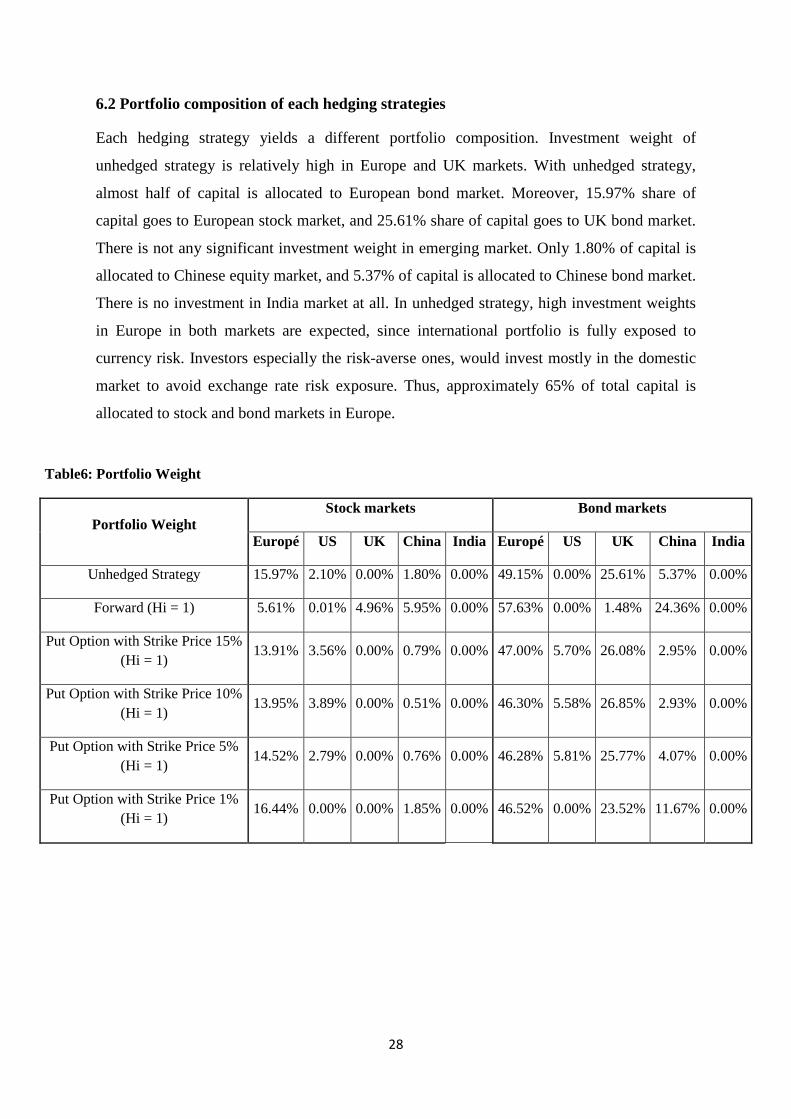
6.2 Portfolio composition of each hedging strategies
Each hedging strategy yields a different portfolio composition. Investment weight of
unhedged strategy is relatively high in Europe and UK markets. With unhedged strategy,
almost half of capital is allocated to European bond market. Moreover, 15.97% share of
capital goes to European stock market, and 25.61% share of capital goes to UK bond market.
There is not any significant investment weight in emerging market. Only 1.80% of capital is
allocated to Chinese equity market, and 5.37% of capital is allocated to Chinese bond market.
There is no investment in India market at all. In unhedged strategy, high investment weights
in Europe in both markets are expected, since international portfolio is fully exposed to
currency risk. Investors especially the risk-averse ones, would invest mostly in the domestic
market to avoid exchange rate risk exposure. Thus, approximately 65% of total capital is
allocated to stock and bond markets in Europe.
Table6: Portfolio Weight
Portfolio Weight Stock markets Bond markets
Europé US UK China India Europé US UK China India
Unhedged Strategy 15.97% 2.10% 0.00% 1.80% 0.00% 49.15% 0.00% 25.61% 5.37% 0.00%
Forward (Hi = 1) 5.61% 0.01% 4.96% 5.95% 0.00% 57.63% 0.00% 1.48% 24.36% 0.00%
Put Option with Strike Price 15% (Hi = 1)
13.91% 3.56% 0.00% 0.79% 0.00% 47.00% 5.70% 26.08% 2.95% 0.00%
Put Option with Strike Price 10% (Hi = 1)
13.95% 3.89% 0.00% 0.51% 0.00% 46.30% 5.58% 26.85% 2.93% 0.00%
Put Option with Strike Price 5% (Hi = 1)
14.52% 2.79% 0.00% 0.76% 0.00% 46.28% 5.81% 25.77% 4.07% 0.00%
Put Option with Strike Price 1% (Hi = 1)
16.44% 0.00% 0.00% 1.85% 0.00% 46.52% 0.00% 23.52% 11.67% 0.00%
Investment weight of forward-hedged strategy tends to be different from unhedged strategy.
Comparing with unhedged strategy, investment weights of international portfolio with
forward contracts are diversified away from Western markets to emerging markets, especially
Chinese market. Based on table 3, investment weight in European market decreases from
65.12% to 63.24%, investment weight in UK market significant declines from 25.61% to
6.44%, and investment weight in US market decreases from 2.01% to 0.01%. On the
contrary, investment weight in Chinese financial market increases from 7.17% to 30.31%.
With forward contracts, 24.36% of capital is allocated to Chinese bond market and 5.95% of
capital is allocated to Chinese equity market.
Unlike forward-hedged strategy, option-hedged strategy resembles that of unhedged strategy.
Only small investment diversification away from local market could be realized. Compared
to unhedged strategy, investment weights in European bond market with put options with
different strike prices of 1%, 5%, 10% and 5% above spot rate reduce from 49.15% to
46.52%, 46.28%, 46.30% and 47% respectively. Investment weights in European equity
market with put options with different strike prices of 5%, 10% and 5% above spot rate
decrease from 15.97% to 14.52%, 13.95% and 13.91% compared to unhedged strategy.
Moreover, more capitals shift away from emerging region to developed markets as the strike
price increase from 1% to 15% above spot rate. Based on table 6, investment weight in
Chinese bond market of option-hedged strategy with strike price 1%, 5%, 10% and 15%
above spot rate decrease from 11.67%, 4.07%, 2.93% and 2.95% respectively. On the
contrary, investment weight in US stock market of option-hedged strategy with strike price
1%, 5%, 10% and 15% above spot rate increase from 0.00% to 2.97%, 3.89% and 3.56%
respectively. Investment weight in US bond market of option-hedged strategy with strike
price 1%, 5%, 10% and 15% above spot rate increase from 0.00% to 5.81%, 5.58%, 5.70%
respectively. Investment weight in UK bond market of option-hedged strategy with strike
price 1%, 5%, 10% and 15% above spot rate increase from 23.52% to 25.77%, 26.85% and
26.08% respectively.
30
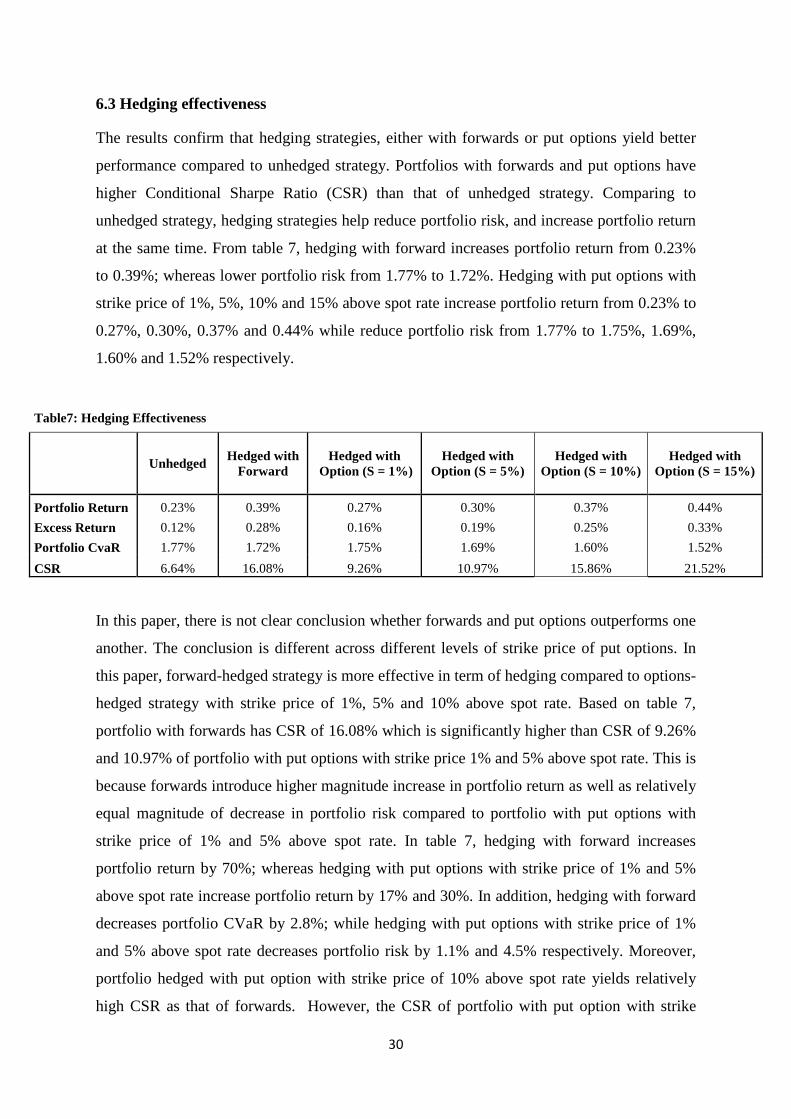
6.3 Hedging effectiveness
The results confirm that hedging strategies, either with forwards or put options yield better
performance compared to unhedged strategy. Portfolios with forwards and put options have
higher Conditional Sharpe Ratio (CSR) than that of unhedged strategy. Comparing to
unhedged strategy, hedging strategies help reduce portfolio risk, and increase portfolio return
at the same time. From table 7, hedging with forward increases portfolio return from 0.23%
to 0.39%; whereas lower portfolio risk from 1.77% to 1.72%. Hedging with put options with
strike price of 1%, 5%, 10% and 15% above spot rate increase portfolio return from 0.23% to
0.27%, 0.30%, 0.37% and 0.44% while reduce portfolio risk from 1.77% to 1.75%, 1.69%,
1.60% and 1.52% respectively.
Table7: Hedging Effectiveness
Unhedged Hedged with Forward
Hedged with Option (S = 1%)
Hedged with Option (S = 5%)
Hedged with
Option (S = 10%)
Hedged with Option (S = 15%)
Portfolio Return 0.23% 0.39% 0.27% 0.30% 0.37% 0.44% Excess Return 0.12% 0.28% 0.16% 0.19% 0.25% 0.33% Portfolio CvaR 1.77% 1.72% 1.75% 1.69% 1.60% 1.52% CSR 6.64% 16.08% 9.26% 10.97% 15.86% 21.52%
In this paper, there is not clear conclusion whether forwards and put options outperforms one
another. The conclusion is different across different levels of strike price of put options. In
this paper, forward-hedged strategy is more effective in term of hedging compared to options-
hedged strategy with strike price of 1%, 5% and 10% above spot rate. Based on table 7,
portfolio with forwards has CSR of 16.08% which is significantly higher than CSR of 9.26%
and 10.97% of portfolio with put options with strike price 1% and 5% above spot rate. This is
because forwards introduce higher magnitude increase in portfolio return as well as relatively
equal magnitude of decrease in portfolio risk compared to portfolio with put options with
strike price of 1% and 5% above spot rate. In table 7, hedging with forward increases
portfolio return by 70%; whereas hedging with put options with strike price of 1% and 5%
above spot rate increase portfolio return by 17% and 30%. In addition, hedging with forward
decreases portfolio CVaR by 2.8%; while hedging with put options with strike price of 1%
and 5% above spot rate decreases portfolio risk by 1.1% and 4.5% respectively. Moreover,
portfolio hedged with put option with strike price of 10% above spot rate yields relatively
high CSR as that of forwards. However, the CSR of portfolio with put option with strike
31
price of 10% above spot rate is slightly lower than CSR of portfolio hedged with forward
contracts of 16.08%. Though portfolio hedged with put options with strike price of 10%
above spot rate introduces higher magnitude of reduction in portfolio risk of 9.6%, compared
to portfolio hedged with forwards; yet magnitude of increase in portfolio returns of 60% is
not as significant as 70% of that of portfolio hedged with forwards. Consequently, portfolio
hedged with forwards slightly outperforms portfolio hedged with put options with strike price
of 10% above spot rate.
On the contrary, option-hedged strategy with strike price of 15% above spot rate outperforms
forward-hedged strategy. Unlike other portfolio with put options, portfolio hedged with put
options with strike price of 15% above spot rate yields higher CSR of 21.52% compared to
portfolio hedged with forwards with CSR of 16.08%. This is because put options with strike
price of 15% above spot rate introduce higher magnitude increase in portfolio return as well
as higher magnitude decrease in portfolio risk. According to table 7, hedging with put options
with strike price of 15% increases portfolio return by 91% whereas hedging with forwards
increases portfolio return by 70%. In addition, hedging with put options with strike price of
15% above spot rate reduce portfolio risk by 14% while hedging with forward decrease
portfolio risk by 2.8%.
Moreover, forwards is more effective in term of hedging with Chinese Yuan rather than
British Pound and US Dollar. Based on table 7, investment weight in Chinese financial
market increases from 7.17% to 30.31%; while investment weight in in UK market
significant declines from 25.61% to 6.44%, and investment weight in US market decreases
from 2.01% to 0.01%. This is because short position in forward yields relatively higher
payoff when foreign currency depreciate against local currency. As Chinese government try
to intervene very hard to prevent their currency to appreciate against Western currencies,
Chinese Yuan tends to depreciate against Western currencies, including Euro. Consequently,
forwards is more effective in term of hedging fluctuation in Chinese Yuan rather than British
Pound and US Dollar.
Unlike short selling forward contracts, taking long position in put options is more effective in
term of hedging fluctuation in US Dollar and British pound rather than Chinese Yuan. Based
on table 7, investment weight in US market of option-hedged strategy with strike price 5%,
10% and 15% above spot rate increase from 2.10% to 8.60%, 9.47% and 9.26% respectively.
Investment weight in UK market of option-hedged strategy with strike price 5%, 10% and

32
15% above spot rate increase from 25.61% to 25.77%, 26.85% and 26.08% respectively. This
is because long position in put options allows investors to take advantage of convexity when
market is volatile. If exchange rate moves against investors, then convexity help ensure that
investors lose at decreasing rate. On the other hands, if exchange rate moves in favor
investors, then convexity help ensure that investors gain money at increasing rate
(Labuszewski, 2013). As US Dollar and British Pound have relatively higher volatility
compared to Chinese Yuan, purchasing put option tends to be more effective in term of
hedging British Pound relative to Chinese Yuan. Based on table 3, US Dollar has standard
deviation of 0.051247, British Pound has standard deviation of 0.144164, and Chinese Yuan
has standard deviation of 0.009879.
Nevertheless, levels of strike price play important role in determining hedging effectiveness
of put options. The higher the strike price set above spot rate, the higher the portfolio CSR.
From table 7, portfolios with put options with strike price of 1%, 5%, 10% and 15% above
spot rate have CSR of 9.26%, 10.97%, 15.86% and 21.52% respectively. This is because
higher put option strike prices ensure higher protection against currency risk. With higher
strike price (K), investors are entitled to receive higher payoff (K – SX) to cover increasing
premium (P).
33
7. LIMITATIONS
This paper has two main limitations. One limitation is that option prices calculated by a
theoretical formula fails to take into account positive or negative shocks in daily market,
which plays significant role in option prices. This is because the formula assumes risk-free
rates and volatilities are constant, contrast to the reality that risk-free and volatility fluctuates
according to the conditions of the market. Moreover, the model assumes option prices are
continuous and that large changes such as those occur after M&A announcement do not occur
(Yeow Khoon, 2006). Consequently, option prices which are calculated with formula can be
overpriced or underpriced compared to real option prices available in the market.
Moreover, this paper is only applicable for high risk-averse investor with relative low risk
tolerance. As this research is dealing with hedging that aims to mitigate currency risk, only
risk-averse agent would be considered to be relevant. Moreover, minimum risk portfolio
(MRP) is used as a criterion to select portfolio, instead of traditional tangency portfolio (TP).
Though TP is relevant to risk-averse; yet the extent of risk tolerance is relatively higher
compared to MRP. TP takes into account risk-return tradeoff when selecting optimal
portfolio. It picks portfolio with lowest risk for given return. Unlike TP, MRP selects
portfolio with lowest risk regardless of expected return. Consequently, this paper should be
relevant to high risk-averse agents such as traditional mutual funds and pension funds, not
agents with low risk aversion such as hedge funds.
34
8. SUMMARY AND CONCLUDING REMARKS
This paper measures currency hedging effectiveness of two hedging tools which are forward
contracts and put options in international portfolio from the viewpoint of European
institutional investors. The international portfolio consists of equities and government bonds
denominated in five different currencies, including British Pounds, US Dollars, Euro, Indian
Rupee, and Chinese Yuan. Mean-CVaR framework is applied to conduct portfolio
optimization, and Conditional Sharpe Ratio (CSR) is used to evaluate currency hedging
effectiveness of forwards and put options.
In this research, there is no clear conclusion whether forward contracts or put options
outperforms one another. The conclusion is different at different level of strike prices.
Forward contract is more effective compared to put option with strike price of 1%, 5% and
10% above spot rate whereas put option with strike price of 15% above spot rate is more
effective compared to forwards in term of hedging currency risk in international portfolio.
Moreover, forward is found to be relatively more effective in term of hedging against
fluctuation in Chinese Yuan; while put option is found to be relatively more effective in term
of hedging against fluctuation in British Pound and US Dollar. Lastly, levels of strike price
play important role in determining hedging effectiveness of put options. The higher the strike
price set above spot rate, the more effective in term of currency hedging.
This finding has implication for international investors, especially Euro-based investors to
select financial tools to hedge against currency risk. There is no definite conclusion whether
investors should either choose forward contracts or put options. The selection between
forward contracts and put options depends on affordability and investment objective of each
investor. Forwards would be recommended for investors with relatively low affordability
because forward contracts do not require premium upfront. On the other hands, put options
would be recommended for investors with relatively high affordability. This is because
investors are required to pay relatively high premium for put option to provide better
protection against currency risk compared to forward contracts. In this paper, investors have
to pay relatively high premium to substitute forward contracts with in-the money options with
strike price of 15% above the spot rate. Otherwise, they would be better of hedging with
forward contracts, rather than using put options.
Based on investment objective, forward would be suggested to investors who intend to
diversify their investment to emerging market particularly China. This is because Chinese
35
Yuan tends to depreciate against currencies of developed nations due to government
intervention. Moreover, hedging against Chinese Yuan fluctuation with put options would not
be beneficial to investors. As Chinese government adopts managed exchange rate policy;
exchange rate is only allowed to fluctuate within small band. This indicates that Chinese
Yuan tends to have relatively low volatility, so investors can not take advantage from
convexity characteristic of put options due to relatively volatility. On the contrary, put
options would be suggested to investors who aim to invest in financial markets of United
States and United Kingdom. Unlike China, these countries do not put strict control on
exchange rate and allow their currencies to float in the market. With floating exchange rate
policy, US Dollar and British Pound tend to have relatively high volatility compared to
Chinese Yuan. Consequently, hedging US Dollar and British Pound with put options would
be recommended to investors because they are allowed to benefit from convexity.
Nevertheless, this recommendation is drawn from specific scenario in this paper. Introduction
of changes in certain variables may lead to alteration in the finding. Thus, further researches
are encouraged in order to have more reliable recommendation in term of currency hedging in
the future. The researches could be developed in different areas. For example, the research
could be conducted in different time periods. Changing time periods would introduce
different characteristic in exchange rate that may lead to changes in investment
recommendations. In addition, different portfolio selections could be used to replace
minimum-risk portfolio (MRP) in order to reflect different types of investors. Introduction of
new hedging tools such as currency swap or even hedging strategies with combination of
options could also be applied in order to evaluate currency hedging effectiveness. By doing
so, valuable recommendations could be generated that would be beneficial for international
investors in the future.
36
NOTES
(1) Annual gross cross-border flows are measured by the acquisition of assets abroad.
These assets include equity and debt securities, cross-border lending and deposits, and
foreign direct investment or FDI. (OECD, 2011).
(2) Bear Spread strategy is applied in a situation of downturn market. “It involves buying
an at-the-money put option and selling an out-of-the-money put option that has a
lower strike price” (Clarke and Clarke, 2012)
(3) Requirement for a distribution to be considered normally distributed is that skewness
value has to be zero.
(4) Skewed to the left means that left tail is longer relative to the right tail.
(5) Skewed to the right means that the right tail is longer relative to the left tail
(6) Requirement for a distribution to be considered normally distributed is that the
kurtosis must have a value of three or the excess kurtosis must be close to zero.
(7) An excess kurtosis that has a positive value is called a leptokurtic distribution. These
distributions have higher peaks than normal. Leptokurtic distributions also have thick
tails on both sides.
(8) The J/B tests whether the data have the skewness and kurtosis requirements that
match a normal distribution. The null hypothesis of the test is skewness and excess
kurtosis equal to zero implying a normal distribution; while the alternative hypothesis
is having a non-normal distribution.
(9) Options can be divided into American options and European options. American
options can be exercised at any point in time until the option reaches its maturity date,
while European options can only be exercised only on the expiration date. (10) To calculate monthly volatility, standard deviation of the daily log spot rates is
calculated. Then, monthly volatility is estimated by taking average of daily volatility.
Because there are 2,085 daily observations and 96 months; as a result, this paper
assigns 22-day trading window in order to estimate monthly volatility.
37
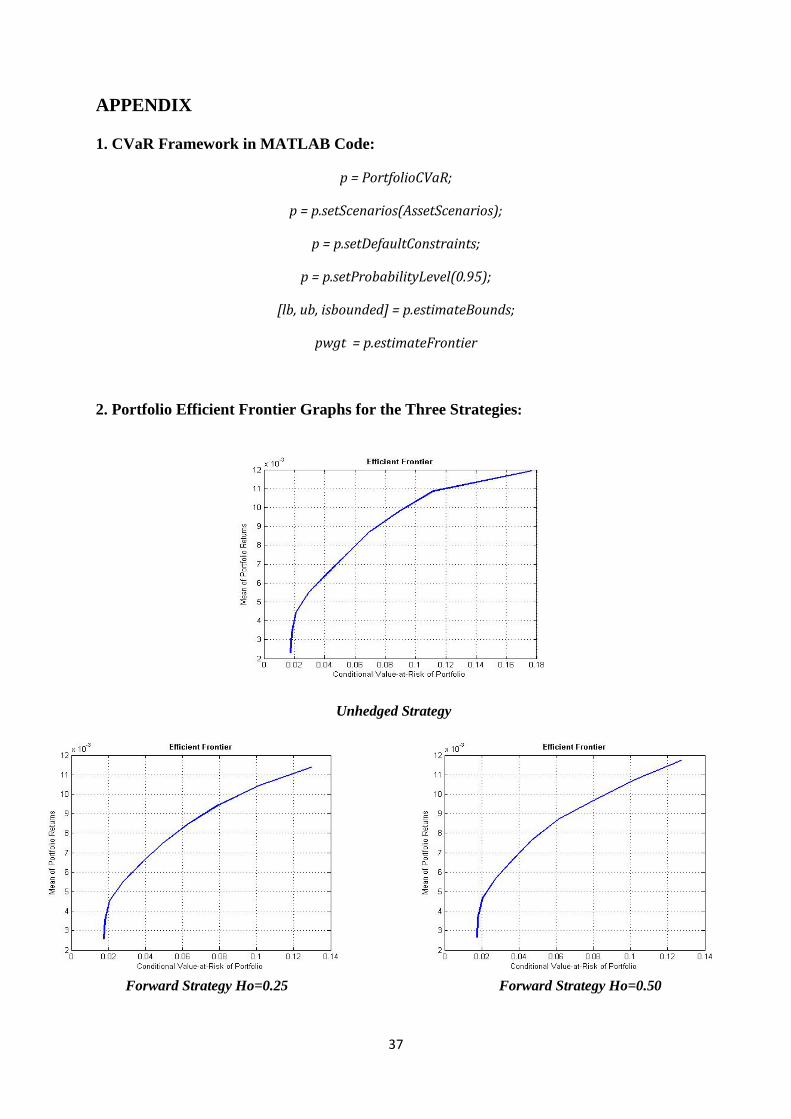
APPENDIX
1. CVaR Framework in MATLAB Code:
p = PortfolioCVaR;
p = p.setScenarios(AssetScenarios);
p = p.setDefaultConstraints;
p = p.setProbabilityLevel(0.95);
[lb, ub, isbounded] = p.estimateBounds;
pwgt = p.estimateFrontier
2. Portfolio Efficient Frontier Graphs for the Three Strategies:
Unhedged Strategy
Forward Strategy Ho=0.25
Forward Strategy Ho=0.50
38
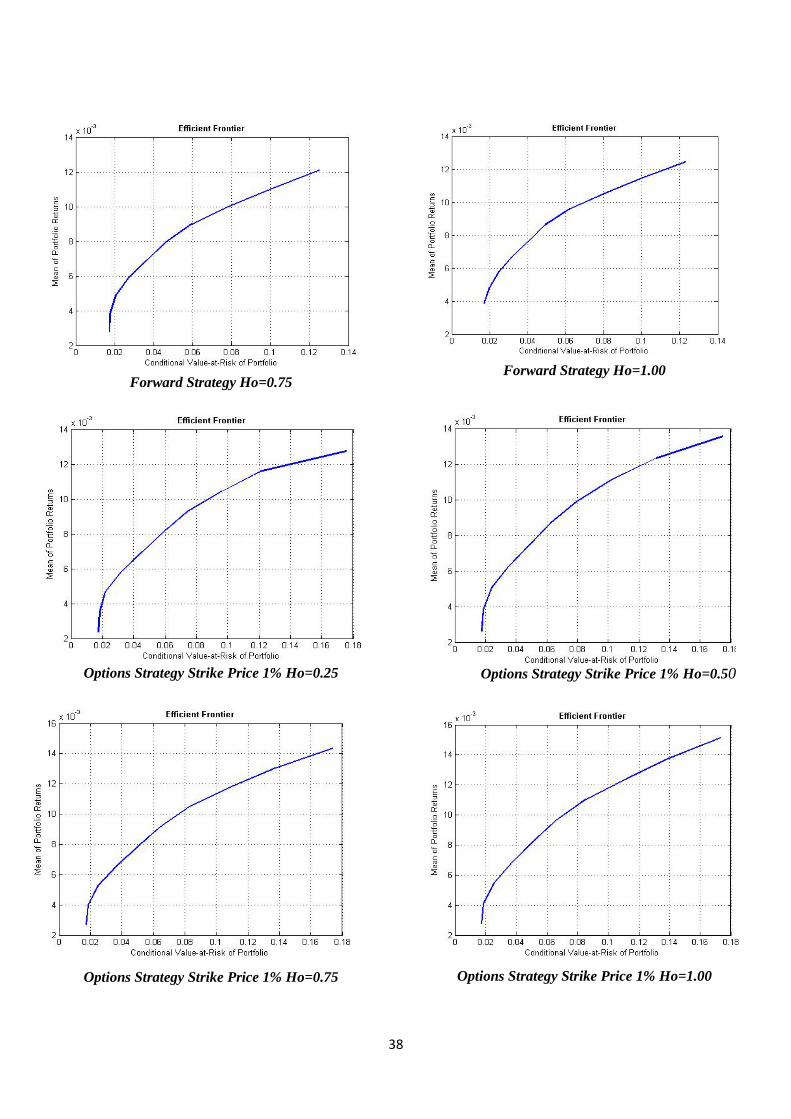
Forward Strategy Ho=0.75
Forward Strategy Ho=1.00
Options Strategy Strike Price 1% Ho=0.25
Options Strategy Strike Price 1% Ho=0.50
Options Strategy Strike Price 1% Ho=0.75
Options Strategy Strike Price 1% Ho=1.00
39
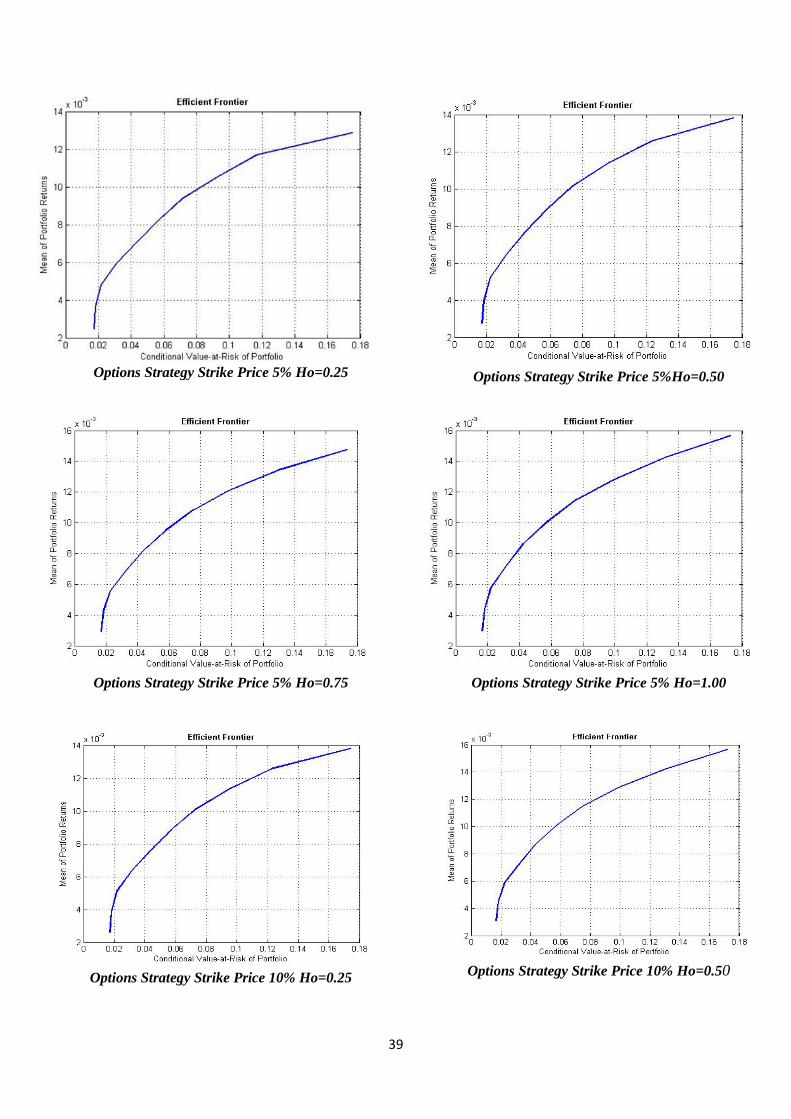
Options Strategy Strike Price 5% Ho=0.25
Options Strategy Strike Price 5%Ho=0.50
Options Strategy Strike Price 5% Ho=0.75
Options Strategy Strike Price 5% Ho=1.00
Options Strategy Strike Price 10% Ho=0.25
Options Strategy Strike Price 10% Ho=0.50

40
Options Strategy Strike Price 10% Ho=0.75
Options Strategy Strike Price 10% Ho=1.00
Options Strategy Strike Price 15% Ho=0.25
Options Strategy Strike Price 15% Ho=0.50
Options Strategy Strike Price 15% Ho=0.75
Options Strategy Strike Price 15% Ho=1.00
41
REFERENCES
Acerbi, C. (2002), “Spectral Measures of Risk: A Coherent Representation of Subjective Risk Aversion”, Journal of Banking and Finance. Vol. 26, pp. 1505 – 1518.
Albuquerque, R. (2003), “Optimal Currency Hedging”, Global Finance Journal. Vol. 18, pp. 16-33.
Alexander Gordon J., Baptista Alexandre M., and Yan Shu, (2007), “Mean-variance Portfolio Selection with ‘At-Risk’ Constraints and Discrete Distributions”, Journal of Banking and Finance, Vol. 31, pp. 3761-3781.
Ang, A., Chen, J. and Xing, Y. (2006), “Downside Risk”, The Review of Financial Studies, Vol.19 No.4, pp. 1191-1239. Artzner Philippe, Delbaen Freddy, Eber Jean-Marc, Heath David (1999). “Coherent Measures of Risk”. Mathematical Finance 9, pp. 203–228. Barron’s Insurance Dictionary (2013), “Symmetric Risk Exposure”, Barron’s Educational Series, Inc. http://www.answers.com/topic/symmetric-risk-exposure Bekaert, G. and Urias, M.S. (1996), “Diversification, Integration and Emerging Market Closed-End Funds”, National Bureau of Economic Research, Working Paper No.4990, pp. 1-24.
Bengtsson, P. (2010), “Exploring the properties of CVaR and Mean-Variance for portfolio optimization”, Lund University.
Biger, N. and Hull, J. (1983), “The Valuation of Currency Option Hedges”, Journal of Financial Economics, Vol. 10, pp. 178-201.
Bindelli, L. and Traviglia, G. (2013), “Currency Hedging in an International Portfolio Context”, Trends, pp. 12-17.
Bourachnikova, O. and Yusupov, N. (2009), “Symmetric vs. Downside Risk: Does It Matter for Portfolio Choice?”, Institut de Finance de Strasbourg.
Bugar, G. and Maurer, R. (2002), “International Equity Portfolios and Currency Hedging: the Viewpoint of German and Hungarian investors”, Astin Bulletin, Vol. 32 No.1, pp. 171-197.
Call Options. (2013), “In The Money Call and Put Option”, http://www.call-options.com/definition/in-the-money.html Campbell, John Y., Karine Serfaty-De Medeiros, and Luis M. Viceira, 2010, “Global Currency Hedging”, Journal of Finance, Vol. 65, pp. 87-121.
42
Cho, W. (2008), “Robust Portfolio Optimization Using Conditional Value At Risk”, Imperial College London.
Clarke, J. and Clarke, D. (2012), “Options Made Simple: A Beginner’s Guide To Trading Options For Success”, John Wiley & Sons Australia, Ltd.
Cotter, J. (2011), “Hedging Effectiveness under Conditions of Asymmetry”, University College Dublin, Blackrock, Co.
DerivActiv (2013), “Foreign Exchange Hedge Strategy Examples”, 2011 DerivActiv, LLC, http://www.derivactiv.com/products/foreign-exchange/foreign-exchange-hedge-strategy-examples.
Dearborn, G. (2000), “Currency Risk Management: Currency Options”, Fitzroy Dearborn Publishers, Chicago and London, pp.11-12.
Engels, M. (2004), “Portfolio Optimization: Beyond Markowitz”, Leiden University, the Netherlands.
Eun, Cheol S. and Resnick, Bruce G. (1997), “International Equity Investment with Selective Hedging Strategies”, Journal of International Financial Markets, Institutions and Money, Vol. 7. No. 1, pp. 21-42.
Farlex Financial Dictionary. (2012), “Hedging Effectiveness”, Farlex, Inc.
Fonseca, R. (2008), “International Portfolio Optimization and Currency Hedging”, Imperial College London.
Forextraders (2013), “Currency Options Explained”, Blue Stripe Incubator AB, 2013, http://www.forextraders.com/forex-analysis/forex-fundamental-analysis/currency-options-explained.html
Garman, G. and Kohlhagen, C. (1983), “Foreign Currency Option Values”, Journal of International Money and Finance, Vol. 2, pp. 231-237.
Giddy, I., “Deconstructing Myths About Foreign Exchange Options” New York
University, 4TUhttp://people.stern.nyu.edu/igiddy/options.htm U4T
Harvey, C., (1995), "Predictable Risk and Returns in Emerging Markets", The Review of Financial Studies Fall 1995, Vol. 8 No.3.pp 773-816. Hauser, S., Marcus, M., and Yaari, U. (1994), “Investing in emerging stock markets: is it worthwhile hedging foreign exchange risk?”, The Journal of Portfolio Management, pp. 76-81.
Hull John C. “Options, Futures, & Other Derivatives” (2006). Pearson Prentice Hall, Upper Saddle River, NJ.
43
Institute for Mathematics and Its applications, IMA (2013), “Methods for CVaR Optimization for a Portfolio of Equities”. 2013 The University of Minnesota. www.ima.umn.edu/2009-2010/MM8.2-11.10/abstracts.html
Institute of International Finance. (2013), “Capital Flow to Emerging Market Economies”, Institute of International Finance, Inc.
Jorion Philippe (2007). “Value at Risk: The New Benchmark for Managing Financial Risk”. McGraw-HilL, New York 3rd ed. pp. 114–118. Kameel, A., and Meera, M. “Hedging Foreign Exchange Risk with Forwards, Futures, Options and the Gold Dinar: A Comparison Note”, International Islamic University Malaysia.
Kidd, D. (2012). “Value at Risk and Conditional Value at Risk: A Comparison”. CFA Institute: Investment Risk and Performance. Kim, S. and Park, H., “Examining the Effect of Investment Horizon on the Mutual Fund Performance Measures”, Kyungpook National University, pp. 2.
Knupp, E., and Associates, (2009). “An Optimal Hedge Ratio Discussion-One Size Does Not Fit All”. Knupp E. & Associates, Inc.
Labuszewski, J. W. (2013), “Managing Currency Risks with Options”, CME Group. http://www.cmegroup.com/.
Lessard, D.R. (1973) “International Portfolio Diversification: Multivariate Analysis for a Group of Latin American Countries”, The Journal of Finance, Vol.28 No.3, pp. 619-633.
Lien, D., and Tse, Y.K. (2001), “Hedging Downside Risk: Futures vs. Options”, International Review of Economics and Finance. Vol. 10, pp. 159-169.
Macroption. “Value At Risk (VaR) Limitations and Disadvantages”, Macroption 2013, http://www.macroption.com/value-at-risk-var-limitations-disadvantages/.
Markowitz, H.M. (1952), “Portfolio selection”, Journal of Finance, Vol.7, pp.77-91.
Maurer, R. and Valiani, S (2007), “Hedging the Exchange Rate Risk in International Portfolio Diversification”, Emerald Group Publishing Limited, Vol.33 No.9,pp. 667-692.
Nilsson, B. (2013), “Coherent Risk Measure”, Lund University.
OECD. (2011), “Getting the most out of International Capital Flows”, OECD Economic Outlook, Vol. 1, pp. 290-297.

44
Parkinson, C. (2002). “Management of Currency Risk: The Choice between Fixed Forward and Option Contracts”, Chartered Institute of Management Accountants.
Patil, S. (2012), “Foreign Currency Hedging”, Buzzle LLC 2000-2012. http://www.buzzle.com/articles/foreign-currency-hedging.html.
Porter, R.B and Gaumnitz, J.E. (1972). “Stochastic Dominance versus Mean-Variance Portfolio Analysis”, The American Economic Review, Vol. 64, pp.200-204.
Rockafellar Tyrrell T., Uryasev Stanislav (2000). “Optimization of Conditional Value-at-Risk”. Journal of Risk, Vol. 2, pp. 21-41. Roon, F., Nijman, T, and Werker, B. (1999), “Currency Hedging for International Stock Portfolios: A General Approach”, Tilburg University.
Sarykalin, S., Serraino, G. and Uryasev, S. (2008), “Value-at-Risk vs. Conditional Value-at-Risk in Risk Management and Optimization”, Tutorials in Operation Research.
Takano, Y. (2010), “Solutions to VaR/CVaR Optimization Problems for Decision Making under Uncertainty”, Graduate School of Systems and Information Engineering, University of Tsukuba, pp. 1-121
Topaloglou, N., Vladimirou, H., and Zenios, S. (2007), “Controlling Currency Risk with Options or Forwards”, HER-MES European Center of Excellence on Computational Finance and Economics, Working Paper, pp. 1-27.
UnifiedTrust (2013), “Asset Allocation Optimization Using Downside Risk Analysis”, UnifiedTrustCompany.N.A.https://www.unifiedtrust.com/documents/AssetAllocationDRA0207.pdf. Western Union Business Solutions (2013), “Forward Contract”, Western Union Holdings, Inc. 2013, http://business.westernunion.com/resource-center/fx-101/forward-contract/
Yeow Khoon, J. (2006), “The Black-Scholes Model”, Copyright 2006-2013 Masters O. Equity Asset Management. http://www.optiontradingpedia.com/freeblackscholesmodel.html.