Embed Size (px)
Citation preview

FORUM OF REGULATORS
STUDY ON IMPACT OF ELECTRIC VEHICLES ON THE GRID
September 2017

FORUM OF REGULATORS
STUDY ON IMPACT OF ELECTRIC VEHICLES ON THE GRID
Assisted By :
MP Ensystems Advisory Private Limited ([email protected] /[email protected])

Study on Impact of Electric Vehicles on the Grid
Forum of Regulators i
Contents
LIST OF TABLES III
LIST OF FIGURES IV
ABBREVIATIONS V
EXECUTIVE SUMMARY VII
ES.1. BACKGROUND AND OBJECTIVES OF THE STUDY VII
ES.2. LESSONS LEARNT FROM INTERNATIONAL EXPERIENCE VII
ES.3. TECHNICAL IMPACT OF EVS ON THE GRID IX
ES.4. LEGAL ASPECTS AND POSSIBLE BUSINESS MODELS IX
ES.5. TARIFF IMPACT OF INVESTMENTS IN EV CHARGING INFRASTRUCTURE X
ES.6. RECOMMENDATIONS X
CHAPTER 1: INTRODUCTION 1
CHAPTER 2: INTERNATIONAL BEST PRACTICES AND CASE STUDIES 3
2.1 COUNTRY STRATEGIES AND INCENTIVES FOR PROMOTING EVS 3
2.1.1. UNITED STATES: EV EVERYWHERE GRAND CHALLENGE 3
2.1.2. NORWAY EV STRATEGY 6
2.1.3. FRANCE – EV DEPLOYMENT 8
2.1.4. CHINA EV STRATEGY 9
2.1.5. DEVELOPMENT OF EVS IN JAPAN 10
2.2 EV GRID INTEGRATION PILOTS 12
2.2.1 DESIGNING EFFECTIVE RATE STRUCTURES TO SHIFT EV CHARGING TIMES USING DEMAND RESPONSE 14
2.3 INTERNATIONAL BUSINESS MODELS FOR INVESTMENT IN PUBLIC CHARGING INFRASTRUCTURE 16
2.3.1 MANUFACTURER OR BUSINESS OWNER FUNDING: 16
2.3.2 PRIVATE SECTOR CHARGING SERVICE PROVIDERS: 16
2.3.3 UTILITY FUNDED INSTALLATIONS: 17
2.4 KEY TAKEAWAYS FROM INTERNATIONAL EXPERIENCE 19
CHAPTER 3: TECHNICAL IMPACT ASSESSMENT OF EVS ON THE GRID 20
3.1 SELECTION OF A SIMULATION PLATFORM 20
3.2 DETAILS OF THE MATLAB MODEL 21
3.3 MODEL CUSTOMISATION 21
3.4 ASSUMPTIONS MADE IN THE MODEL 23
3.5 CASE AND SCENARIO DEVELOPMENT FOR ANALYSIS 23
3.5.1. RESIDENTIAL FEEDER 23
3.5.2. COMMERCIAL FEEDER 25
3.6 RESULTS 26
3.6.1. RESULTS FOR CASE 1 (SLOW CHARGING) 26
3.6.2. RESULTS FOR CASE 2 & CASE 3 (FAST CHARGING) 26
3.6.3. RESULTS FOR CASE 4 29
3.6.4. RESULTS FOR COMMERCIAL FEEDER 30
3.7 CONCLUSIONS AND RECOMMENDATIONS 31
Study on Impact of Electric Vehicles on the Grid
Forum of Regulators ii
3.8 LIMITATIONS OF THE SIMULATIONS 32
CHAPTER 4: LEGAL ASPECTS AND POSSIBLE BUSINESS MODELS 33
CHAPTER 5: ECONOMIC IMPACT ASSESSMENT OF EVS 37
5.1 TARIFF SETTING PRINCIPLES 37
5.2 SCENARIOS PRESENTED AND CORRESPONDING ASSUMPTIONS 38
5.2.1. NEMMP SCENARIO 38
5.2.2. NEMMP+ SCENARIO 39
5.3 TARIFF IMPACT RESULTS FOR NEMMP AND NEMMP+ SCENARIOS 40
5.4 POSSIBLE TARIFFS FOR SPECIAL EV CATEGORY 42
5.4.1. BASE TARIFFS 43
5.4.2. TIME-OF-DAY (TOD) STRUCTURES 44
CHAPTER 6: CHARGING STANDARDS AND REGULATORY PROVISIONS FOR GRID INTERCONNECTION 45
6.1. INDIAN ELECTRICITY GRID CODE 45
6.2. CHARGING STANDARDS 45
6.3. BIS STANDARDS 46
6.4. CEA PLANS 46
CHAPTER 7: CONCLUSIONS AND WAY FORWARD 47
7.1. KEY FINDINGS AND RECOMMENDATIONS 47
7.1.1. TECHNICAL IMPACT ON THE GRID 47
7.1.2. LEGAL ASPECTS AND POSSIBLE BUSINESS MODELS 47
7.1.3. COMMERCIAL ASPECTS- TARIFF IMPACTS 47
7.1.4. POLICY AND REGULATORY INTERVENTIONS 48
BIBLIOGRAPHY 49
ANNEXURE I: LIST OF EXPERTS CONTACTED AND QUESTIONNAIRE USED 53
ANNEXURE II. RATE STRUCTURE FOR EV CHARGING BY INTERNATIONAL ELECTRICTY DISTRIBUTION
COMPANIES 55
PGE RATE STRUCTURE FOR EV CHARGING 55
SDGE RATE STRUCTURE FOR EV CHARGING 56
SCE RATE STRUCTURE FOR EV CHARGING 56
XCEL ENERGY EV CHARGING RATE 56
ANNEXURE III: KEY INTERNATIONAL POLICIES IMPLEMENTED FOR VEHICLE GRID INTEGRATION 57
ANNEXURE IV: TECHNICAL SIMULATION RESULTS 60
ANNEXURE V: DRAFT FRANCHISEE AGREEMENT FOR SETTING UP EV CHARGING INFRASCRUCTURE 79
ANNEXURE VI: ECONOMIC IMPACT ASSESSMENT RESULTS 96
NEMMP SCENARIO 96
NEMMP+ SCENARIO 98
TARIFF IMPACT ESTIMATION 100
NEMMP LOW GROWTH SCENARIO 101
NEMMP HIGH GROWTH SCENARIO 103
NEMMP+ LOW GROWTH SCENARIO 105
NEMMP+ HIGH GROWTH SCENARIO 107
EXAMPLE: MSEDCL 109
ANNEXURE VII: BROAD PRINCIPLES FOR SPECIAL EV TARIFFS 110

Study on Impact of Electric Vehicles on the Grid
Forum of Regulators iii
List of Tables
TABLE 1: COMPARATIVE ANALYSIS OF BEST PRACTICES FROM CASE STUDIES .................................................................................... VIII
TABLE 2: LEVELIZED TARIFF IMPACT FOR INVESTMENT IN PUBLIC EV CHARGING INFRASTRUCTURE ......................................................... X
TABLE 3: OVERVIEW OF THE DRIVE ELECTRIC VERMONT SCHEME ................................................................................................... 5
TABLE 4: OVERVIEW OF CALIFORNIA EV PROGRAM ..................................................................................................................... 6
TABLE 5: OVERVIEW OF NORWAY EV STRATEGY ......................................................................................................................... 8
TABLE 6: OVERVIEW OF FRANCE EV PROGRAM .......................................................................................................................... 9
TABLE 7: OVERVIEW OF CHINA EV PROGRAM .......................................................................................................................... 10
TABLE 8: OVERVIEW OF JAPAN EV PROGRAM .......................................................................................................................... 11
TABLE 9: EV CHARGING PLANS OF EVGO ................................................................................................................................ 17
TABLE 10: SUMMARY OF APPROVED PROGRAMS FOR CALIFORNIAN DISCOMS ................................................................................ 18
TABLE 11: INPUT VALUES FOR INDUCTANCE (I) AND RESISTANCE (R) ............................................................................................. 23
TABLE 12: CASE AND SCENARIOS ANALYSED............................................................................................................................. 24
TABLE 13: DEVELOPED SCENARIOS FOR ASSESSMENT ................................................................................................................. 25
TABLE 14: VOLTAGE, CURRENT AND DEMAND EXPERIENCED BY TRANSFORMER UNDER CASE 1 ........................................................... 26
TABLE 15: VOLTAGE, CURRENT AND DEMAND EXPERIENCED BY TRANSFORMER AFTER ADDITION OF EV LOAD UNDER CASE 1 ................... 26
TABLE 16: MAXIMUM VOLTAGE, CURRENT AND DEMAND EXPERIENCED BY TRANSFORMER FOR BASELINE SCENARIO FOR CASE 2 AND 3 .... 27
TABLE 17: VOLTAGE, CURRENT AND DEMAND EXPERIENCED BY TRANSFORMER FOR SCENARIO 1, 2, 3, 4 ............................................. 27
TABLE 18: % VOLTAGE DROPS AND INCREASE IN MAXIMUM DEMAND ACROSS SCENARIOS COMPARED TO THE BASELINE SCENARIO .......... 27
TABLE 19: VOLTAGE, CURRENT AND DEMAND EXPERIENCED BY TRANSFORMER FOR SCENARIO 5 ........................................................ 28
TABLE 20: CURRENT DRAWL VARIATIONS FOR DIFFERENT BATTERY CAPACITIES ................................................................................ 28
TABLE 21: VOLTAGE, CURRENT AND DEMAND EXPERIENCED BY TRANSFORMER UNDER CASE 4 ........................................................... 29
TABLE 22: PERCENTAGE VOLTAGE DROPS AND RISE IN MAXIMUM DEMAND UNDER CASE 4 ............................................................... 29
TABLE 23: MAXIMUM VOLTAGE, CURRENT AND DEMAND EXPERIENCED BY TRANSFORMER FOR BASELINE SCENARIO ............................. 30
TABLE 24: MAXIMUM VOLTAGE, CURRENT AND DEMAND EXPERIENCED BY TRANSFORMER AFTER ADDITION OF EV LOAD (FAST CHARGING)
UNDER SCENARIO 6 .................................................................................................................................................... 30
TABLE 25: MAXIMUM VOLTAGE, CURRENT AND DEMAND EXPERIENCED BY TRANSFORMER AFTER ADDITION OF EV LOAD (SLOW CHARGING)
UNDER SCENARIO 7 AND 8 ........................................................................................................................................... 30
TABLE 26: VOLTAGE DROPS ACROSS SCENARIOS COMPARED TO THE BASELINE SCENARIO (CASE 1 AND CASE 2) ..................................... 31
TABLE 27: VOLTAGE DROPS FOR EACH SCENARIO UNDER CASE 4, RESIDENTIAL FEEDER .................................................................... 31
TABLE 28: PROS AND CONS OF THE SUGGESTED BUSINESS MODELS .............................................................................................. 36
TABLE 29: VEHICLE STOCK AS PER NEMMP-2020 DOCUMENT .................................................................................................. 38
TABLE 30: CHARGING INFRASTRUCTURE AS PER NEMMP DOCUMENT ......................................................................................... 39
TABLE 31: VEHICLE STOCK IN NEMMP+ SCENARIO .................................................................................................................. 39
TABLE 32: CHARGING INFRASTRUCTURE REQUIRED FOR NEMMP + SCENARIO ............................................................................... 40
TABLE 33: ANNUAL ELECTRICITY CONSUMPTION FROM VEHICLE STOCK USING PUBLIC INFRASTRUCTURE UNDER NEMMP ....................... 41
TABLE 34: ANNUAL ELECTRICITY CONSUMPTION FROM VEHICLE STOCK USING PUBLIC INFRASTRUCTURE UNDER NEMMP+ ..................... 41
TABLE 35: MODEL RESULTS FOR TARIFF IMPACT ....................................................................................................................... 42
TABLE 36: BASE TARIFF FOR THE EV CATEGORY FOR MSEDCL AS AN EXAMPLE .............................................................................. 43
TABLE 37: STRANDED ASSETS AND FIXED COSTS FOR MSEDCL .................................................................................................... 44
TABLE 38: COMPUTATION OF TOD INCENTIVES CORRESPONDING TO USAGE OF STRANDED ASSETS FOR MSEDCL ................................. 44

Study on Impact of Electric Vehicles on the Grid
Forum of Regulators iv
List of Figures
FIGURE 1: BUSINESS MODELS FOR EV CHARGING INFRASTRUCTURE ............................................................................................... IX
FIGURE 2: LAAFB PROJECT LAYOUT ....................................................................................................................................... 13
FIGURE 3: LAYOUT OF THE MODEL FROM MATLAB LIBRARY ........................................................................................................ 21
FIGURE 4: LINE DIAGRAM OF THE ALTERED MODEL FOR SIMULATION ............................................................................................. 22
FIGURE 5: BUSINESS MODELS FOR EV CHARGING INFRASTRUCTURE .............................................................................................. 35

Study on Impact of Electric Vehicles on the Grid
Forum of Regulators v
Abbreviations
AIS Automotive Industry Standards ARAI Automotive Research Association of India BEV Battery Electric Vehicle BMS Battery management system CAISO California Independent System Operator CCS Combined Charging System CEA Central Electricity Authority CERC Central Electricity Regulatory Commission CO2 Carbon Dioxide CPP Critical Power Pricing CPUC California Public Utilities Commission CTU Central Transmission Utility DC Direct Current Discom Electricity Distribution Company DoER Department of Energy Resources DR Demand Response DSO Distribution System Operators EU European Union EVPP Edison EV Virtual Power Plant EVs Electric Vehicles EVSE EV Supply Equipment FAME Faster Adoption and Manufacturing of (Hybrid &) Electric Vehicles in India FOR Forum of Regulators HEV Hybrid Electric Vehicle IEA International Energy Agency IEC International Electrotechnical Commission IEGC Indian Electricity Grid Code IOT Internet-of-things ISGS Inter-state Generating Stations ISO International Organization for Standardization ISP internet service provider ISTS Inter-state Transmission Stations kV Kilo-Volt KVA Kilo-Volt Ampere kW Kilo-Watt kWh kilo-watt hour LAAFB Los Angeles Air Force Base METI Ministry of Economy, Trade and Industry, Japan MOST Ministry of Science and Technology, China MUs Million Units NDRC National Development and Reform Commission NEMMP National electric Mobility Mission Plan NGR Non-Generating Resource NLDC National Load Dispatch Centre NVE Norwegian Water Resources and Energy Directorate PEVs Plug-in electric vehicles PG&E Pacific Gas and Electric PHEV Plug-in Hybrid Electric Vehicle

Study on Impact of Electric Vehicles on the Grid
Forum of Regulators vi
PIVCO Personal Independent Vehicle Company PSB Vermont Public Service Board RE Renewable Energy RFP Request for Proposal RLDC Regional Load Dispatch Centre RTP Real-time pricing SCE South California Edison SDG&E San Diego Gas and Electric SERC State Electricity Regulatory Commission SLDC State Load Dispatch Centre SOC State of Charge STU State Transmission Utility ToD Time of Day ToU Time of Use USD US Dollar USDOE U.S. Department of Energy VAT Value Added Tax VEIC Vermont Energy Investment Corporation VGI Vehicle Grid Integration VLITE Vermont Low Income Trust for Electricity WDAT Wholesale Distribution Access Tariff ZEM2ALL Zero Emission Mobility to All ZEV Zero-Emission Vehicle

Study on Impact of Electric Vehicles on the Grid
Forum of Regulators vii
Executive Summary
ES.1. Background and Objectives of the study
The transport sector is the largest user of oil and second largest source of CO2 emissions world-wide.
Indian transportation sector accounts for one-third of the total crude oil consumed in the country, where
80% is being consumed by road transportation alone. It also accounts for around 11% of total CO2
emissions from fuel combustion. The National Electric Mobility Mission Plan 2020, notified by the
Department of Heavy Industry, Ministry of Heavy Industries and Public Enterprises, Government of India
seeks to enhance national energy security, mitigate adverse environmental impacts from road transport
vehicles and boost domestic manufacturing capabilities for Electric Vehicles (EVs). The Indian
Government under the FAME scheme is incentivizing the use of EVs and development of the required
ecosystem. As per a recent report, policy think-tank Niti Aayog also supports incentivizing electric vehicle
(EV) while discouraging privately-owned petrol and diesel-fueled vehicles. As more EVs populate the
roads, utilities are likely to become increasingly concerned with managing and making use of these
‘mobile assets’, to avoid any adverse impact on the Indian electricity grid. Facilitative framework created
by regulators, related to enabling business models and attractive tariffs can offer interesting system
benefits.
Forum of Regulators (FOR), taking a pro-active stance, commissioned this study to assess the techno-
economic impact of large scale penetration of electric vehicles, on the grid; and to evolve appropriate
regulatory framework to facilitate roll out of the electric vehicles in the country. The study was carried
out to answer the following questions – (1) What are the international best practices for EV integration
and promotion? (2) What has been the role of regulators and distribution distribution licensees in the
uptake of EVs?, (3) What would be the impact of EV load on the local distribution system?, (4) What
business models can be developed for public charging infrastructure development in the context of the
Electricity Act, 2003?, and (5) What would be the tariff impact of a distribution utility’s investment in
public charging infrastructure? These questions are explored in the report and summarized here.
ES.2. Lessons Learnt from International Experience
Electricity regulators have played a pro-active role in promotion of EVs and have directed or in some
cases mandated electricity distribution companies to invest in EV charging infrastructure. Key
interventions made by the regulators and the electricity distribution companies are listed below.
1. Regulators in California and Vermont have approved the capital expenditure towards EV Supply
Equipment (EVSE)1 installations as a part of rate base.
2. Electricity distribution companies have offered attractive time-of-day tariffs to promote off-peak
charging.
3. They have also played a key role in the development of public charging infrastructure.
1 EVSE referes to the the physical charger, cable, connector and management software necessary to safely deliver
electricity to charge the batteries of an electric vehicle.

Study on Impact of Electric Vehicles on the Grid
Forum of Regulators viii
4. Besides, electricity distribution companies in US, Japan and China are experimenting with utilization
of EVs as grid assets, either by using them as a demand response resource or for providing ancillary
services through Vehicle-to-Grid technologies.
Review of international policies also bring forward importance of fiscal interventions by the
Governments, which are listed below.
1. Governments across the world offer substantial direct and indirect incentives to EVs. Direct incentives
include purchase subsidy for EVs and subsidy for installation of chargers while indirect benefits range
from tax breaks to access to reserved lanes and parking spots,
2. France offers an CO2 emission based “feebate” system, which subsidizes electric vehicle purchase
while penalizing higher-emission vehicles.
Table 1 below summarizes policy, fiscal and regulatory best practices and presence of market-players
from key global market leaders.
Table 1: Comparative analysis of best practices from case studies
US
Norway France China Japan Vermont California
Policy Support
Targets for EVs Government commitments / legislation for EVs
Fiscal incentives provided
Direct subsidies on EV purchase
Upfront
Offered to leased vehicles
Available for Company vehicles
Available for a definite period
Indirect incentives (Road tax waiver, VAT waiver, access to reserved lanes, free parking)
Regulatory directives and role of utilities
Directives from regulator on EVs
Regulatory orders
Approval of Budget/electrical tariff Utility initiatives and programs
Time of use tariff
Domestic EV Auto Industry
Local EV manufacturer
Battery manufacturing
EVSE business
Private players
Utility/Government Support available High support available

Study on Impact of Electric Vehicles on the Grid
Forum of Regulators ix
ES.3. Technical impact of EVs on the Grid
The electrical vehicle load is non-linear and can cause harmonic distortion, DC offset, phase imbalance,
and voltage deviations in the distribution network. However, with approximately 5000 MW of EV related
additional load expected to come on to the system, at the national grid level, the impact is negligible. In
this study, Matlab/Simulink platform was used to analyze the effect of charging of batteries on different
feeder systems. Based on EV charging profiles considered in the simulations; a baseline 50% loaded
commercial feeder can safely absorb up to 20% of additional EV load from fast charging, similarly the
residential feeder, can be safely handle a ratio of 60%:40% from Residential load and EV load (fast
charging) respectively. However, the peak co-incident charging scenario showed that a loading of around
20% from fast chargers should be the threshold. This implies that should such high loading conditions
occur, the distribution licensees should build resilience by network expansion. The impact from slow
charging on both the feeders was negligible.
ES.4. Legal aspects and possible business models
In the context of Electricity Act 2003 (The Act) and its provisions, the following observations are made:
1. As per The Act, the provision of public EV charging service to the users amounts to distribution/supply
of electricity.
2. Specific amendments to the Act can be made, allowing EV charging businesses to resell the electricity
without specific licensing arrangements,
3. In the current legal provisions, following three business models are feasible, which are detailed in
Figure 1: Business models:
a. Distribution Licensee owned EV charging infrastructure,
b. Distribution Licensee Franchised EV charging infrastructure, and
c. Privately-owned battery swapping stations
Figure 1: Business models for EV charging infrastructure
Supply of electricity to vehicle owners would be part of the activities of the Distribution Licensee
Distribution Licensee-owned EV charging
infrastructure
The retail supply tariff for supplying to the electric vehicle owners will be determined by the SERC
Utility can authorize a third party (Franchisee) to install and/or operate charging stations on its behalf in its area of supply. The franchisee can also be a public private partnership (PPP)
Distribution Licensee franchised EV charging
infrastructure
Charging stations can receive electricity at a single point as bulk supply. The single point supply tariff as well as the tariff cap for retail sale will be determined by the SERC
Franchisee can be allowed to purchase power through open access without applying Cross Subsidy Surcharge
Utility, its distribution franchisee or any other third party can aggregate the demand for batteries and set up battery swapping stations
Privately-owned battery swapping stations
Battery swapping will not amount to electricty resale and hence third parties can set up the stations with intimation to the Distribution Licensee to avail special category tariff.
The Charging Station can receive electricity in bulk at single point from a distribution licensee or through open access to charge the batteries, as per provisions of the Act.
The bulk supply tariff/single point supply tariff will be determined by the SERC

Study on Impact of Electric Vehicles on the Grid
Forum of Regulators x
ES.5. Tariff impact of investments in EV charging infrastructure
As EV penetration in India requires substantial boost through development of EV charging infrastructure,
the tariff impact of distribution licensee’s investment is estimated through the following scenarios.
1. Two primary scenarios were studied for their tariff impacts –
(i) NEMMP targets and corresponding EV charging infrastructure requirements and
(ii) An aggressive target termed the NEMMP+ aligned with the Ministry of Power’s draft note
highlighting expected vehicle stock,
2. Both NEMMP and NEMMP+ scenarios use Low Growth and High Growth options
3. In both the scenarios, the study used specific assumptions related to the cost of EV charging
infrastructure as no specific market data is available,
4. Tariff impact assessment was carried out in two formats –
(i) Entire investment socialized to all the consumers of the licensee and
(ii) Investments charged only to the EV category
5. Insignificant tariff impact is noticed in both the scenarios as seen in Table 2
Table 2: Levelized tariff impact for investment in public EV charging infrastructure
Scenario Business models Growth
options
Tariff Impact
(Rs./kWh)
NEMMP
Scenario 1A: Investments socialized to all the consumers Low Growth 0.0007
High Growth 0.0010
Scenario 1B: Investments charged only to EV category
sales
Low Growth 0.2810
High Growth 0.2097
NEMMP+
Scenario 2A: Investments socialized to all the consumers Low Growth 0.0013
High Growth 0.0040
Scenario 2B: Investments charged only to EV category
sales
Low Growth 0.1912
High Growth 0.1790
By promoting night time charging, the fixed charges or capex investments paid by the utility to generators
can also be capitalized by offering aggressive time-of-day (ToD) tariffs. The report discusses the possible
special category tariffs and ToD tariff, taking a distribution licensee (MSEDCL) as an example.
ES.6. Recommendations
While the Regulatory aspects will have to be dealt with by the Appropriate Commission, it would be
advisable for the sake of uniformity and harmony of Regulations, to have suitable provisions in the Tariff
Policy or in the Rules, on the following interventions:
1. Regulators to allow pass through of investments made in EV charging infrastructure by the
Dsitribution licensees in tariffs
2. Create simplified framework for franchise agreements between the distribution licensees and
private sector/interested Public Sector Undertakings/associations for setting up public charging
infrastructure.

Study on Impact of Electric Vehicles on the Grid
Forum of Regulators xi
3. Allow distribution licensees to appoint multiple and non-exclusive franchisees within its area of
supply for setting up public charging infrastructure. Annexure V to this report includes suggested
“Draft Franchisee Agreement for EV Charging Infrastructure Operators” to be signed with the
incumbent distribution licensee.
4. Create new tariff category for EVs by allowing recovery of incremental cost of infrastructure
through wheeling charges over and above the average cost of service. Annexure VII to this report
includes suggestions on “Broad Principles of Special Category Tariff”.
5. Allow special ToD structure for EV charging infrastructure accounting for use of backed-down
assets in the night time
6. Allow Open Access to EV charging infrastructure aggregators without cross subsidy surcharge. Also
allow banking of RE generation to promote reduced tariffs.
7. In order to encourage the use of renewable energy to meet the demand created by EVs, either
directly or by way of substitution; appropriate incentive mechanism should be designed for such
consumption.

Study on Impact of Electric Vehicles on the Grid
Forum of Regulators 1
Chapter 1: Introduction
The transport sector is the largest user of oil and second largest source of CO2 emissions world-wide.
Indian transportation sector accounts for one-third of the total crude oil consumed in the country with
80% of this being consumed by road transportation alone. It also accounts for around 11% of total CO2
emissions from fuel combustion. The National Electric Mobility Mission Plan 2020, notified by the
Department of Heavy Industry, Ministry of Heavy Industries and Public Enterprises, Government of India
seeks to enhance national energy security, mitigate adverse environmental impacts from road transport
vehicles and boost domestic manufacturing capabilities for Electric Vehicles (EVs). It is envisaged that EVs
are expected to play a significant role in India’s transition to a low-carbon eco-system.
Distribution Licensees (DLs or Discoms) and Electricity Regulatory Commissions are expected to be
amongst the most critical stakeholders in the EV landscape. As more EVs populate roads, distribution
licensees are likely to become increasingly concerned with managing and making use of these ‘mobile
assets’. Distribution licensees thus need to be informed about the benefits that they can derive from EVs
and about the innovative mechanisms that they can devise to avoid adding stress to the grid from
charging of EVs. Distribution licensees should not perceive EVs as an additional burden on the grid, which
could hinder the large-scale adoption of EVs. Similarly, regulators need to create an enabling framework
and attractive rate structures for charging, such that peak hour charging is avoided and is shifted to off-
peak hours. Hence it is very important to equip both regulatory and utility personnel with the technical
and managerial aspects of the EV landscape.
Recognizing this need, Forum of Regulators (FOR) mandated MP Ensystems to study and assess the
impact of electric vehicles on grid requirements and capacity and develop the necessary framework to
enable implementation. Specific questions explored under this study are listed here:
(1) What are the international best practices for EV integration and promotion?
(2) What has been the role of regulators and distribution distribution licensees in the uptake of EVs?
(3) What would be the impact of EV load on the local distribution system?
(4) What business models can be developed for public charging infrastructure development in the context
of the Electricity Act, 2003?
(5) What would be the tariff impact of a distribution utility’s investment in public charging infrastructure?
In this report, literature reviews and best practices followed by international leaders have been assessed,
a basic techno-economic assessment of the impact of EVs on the grid has been carried out and legal
provisions of Electricty Act, 2003 were studied to identify possible business models for creation of public
charging infrastructure. This report has been organized in the following six chapters:
1. In Chapter 2, the policies and best practices of leading countries with the highest share of EVs in the
vehicle population has been analyzed along with current and completed EV-grid integration pilots and
the business models for public charging infrastructure
2. In Chapter 3 , the impact of EVs on local distribution transformers is assessed on the Matlab/Simulink
platform

Study on Impact of Electric Vehicles on the Grid
Forum of Regulators 2
3. In Chapter 4, possible business models for investment in Public EV Charging Infrastructure in the
context of the Electricity Act, 2003, have been assessed
4. In Chapter 5, a detailed economic assessment of EVs and their value to the distribution licensees
including the tariff impact for investment in public charging infrastructure has been carried out
5. In Chapter 6, the Grid Code and draft Automotive Industry Standards (AIS) for EV Charging has been
reviewed in addition to listing of current efforts at the Bureau of Indian Standards (BIS) and Central
Electricity Authority (CEA)
6. In Chapter 7, provides the recommendations and way forward.
7. The report has two specific Annexures that can be used as guidelines. These are Annexure V: Draft
Franchisee Agreement for EV Charging Infrastructure Operators and Annexure VII: Broad Principles
of Special Category Tariff.

Study on Impact of Electric Vehicles on the Grid
Forum of Regulators 3
Chapter 2: International best practices and case studies
Recognizing the importance of EVs in the future of sustainable mobility, several countries have launched
and announced their ambitious electric mobility missions and are supporting EV charging infrastructure
development. This chapter is divided into three sections:
1. Country level commitments and promotional policies for incentivizing use of EVs (2.1)
2. Completed and ongoing EV gird integration pilots (2.2)
3. Business models followed world-wide for development of public charging infrastructure (2.3)
2.1 Country Strategies and Incentives for Promoting EVs
The Governments and different energy market structures have led to a wide variety of programs that
support and adapt to EVs, and a number of trends and best practices have begun to emerge across
jurisdictions. This study has focused on assessing the national strategies and best practices followed by
the following countries:
i. United States – States of Vermont and California;
ii. Norway
iii. France
iv. China
v. Japan.
Further, the EV strategies and best practices in these countries have been assessed on the following
parameters:
i. Drivers
ii. Policy support
iii. Incentives provided
iv. Regulatory directives and role of utilities
v. Public investment/expenditure
vi. Pricing models for EV charging
vii. Impact on Grid
viii. Policy Impact on share of EVs/consumer perception.
2.1.1. United States: EV Everywhere Grand Challenge
EV Everywhere is an umbrella effort by the U.S. Department of Energy (DOE) to increase the adoption and
use of plug-in electric vehicles (PEVs). EV Everywhere was announced in March 2012, with the aim of
enabling plug-in electric vehicles to be as affordable and convenient as gasoline-powered vehicles by
2022 (Department of Energy, 2017). Under this challenge various states and cities have initiated and
enhanced their push for electric vehicles.
2.1.1.1. Drive Electric Vermont
The Drive Electric Vermont (DEV) Program was formulated in 2012 and is a public-private partnership
between three Vermont State agencies and the nonprofit Vermont Energy Investment Corporation (VEIC),
aimed to increase the use of electrified transportation in the State (VEIC, 2017).

Study on Impact of Electric Vehicles on the Grid
Forum of Regulators 4
Parameter Details
Drivers
i. Incentives and Grants complemented by State Government, Government Agencies’, Foundations and utilities
ii. Early and broad stakeholder involvement iii. Extensive involvement of the utility in setting-up of infrastructure iv. Strategic outreach and education activities to raise public awareness v. Receptive PEV culture in Vermont
Policy Support i. Part of the EV Everywhere Grand Challenge of US Department of Energy2 ii. Member state for zero-emission vehicle (ZEV) program, which targets to have at least
3.3 million ZEVs operating on roadways by 2025 in member states
Incentives provided
i. Purchase incentives3 ii. Federal Tax Credits for the Purchase of Electric Vehicles up to USD 7,500 depending on
the size of the battery iii. Federal Tax Credits for Electric Vehicle Charging Equipment 30% tax credit up to USD
1,000 for residential 30% tax credit up to USD 30,000 for commercial property owners iv. Bill credits from utilities for purchase of plug-in electric vehicles
Regulatory directives and Initiatives by utilities
i. Vermont Comprehensive Energy Plan includes provisions supporting the use of PEVs ii. Tier III category of Vermont’s Renewable Energy Standard requires utilities to offset
customer fossil fuel usage, most commonly by incentivizing use of PEVs4 iii. Vermont Public Service Board (PSB) has reviewed and approved fees/tariffs charged by
the distribution Utilities at their public charging locations 5 iv. Utilities have made significant amount of investment in EV Supply Equipment (EVSE)
by buying and coordinating placement of EVSE.6
Utility Specific Actions
Green Mountain Power Owns and hosts charging stations and has a broader partnership with NRG Energy (EV infrastructure provider).
Installs EVSE on its own cost, while the host pays the cost to run electrical service by paying a monthly fee
Offers incentives for stations connected with solar rooftop
Burlington Electric Department
Covers the cost of the equipment and installation out of their capital budget
Washington Electric Co-Op
Provides the cost for installation (covered by a USD 1,47,000 grant from VLITE7), Offers free lease to and free service contract to host for 5 years
2DOE during 2013-14 invested USD 225 million in research and development (R&D) efforts which led to substantial reduction in
the production cost of batteries 3
Utility Incentive
Burlington Electric Department
USD 1,200 rebate on the purchase or lease of a new All Electric Vehicle or USD 600 on a Plug-in Hybrid Electric Vehicle priced below USD 50,000
Green Mountain Power in partnership with Nissan
USD 10,000 purchase rebate on new 2017 Nissan LEAF electric vehicles
Vermont Electric Coop USD 250 bill credit for the purchase of a new or used plug-in electric vehicle, USD 50 bill credit for leased vehicles for each year of the lease
4 Ibid at 2, (Public Service Board, 2017) 5 Communication with Mr. David Roberts, VEIC
6 (Wagner, Roberts, Francfort, & White, 2016)

Study on Impact of Electric Vehicles on the Grid
Forum of Regulators 5
Parameter Details
Stowe Electric Offers a cost share of 75% of the equipment cost (funding from VLITE), with the hosts providing the balance 25%
Public Investment/ Expenditure
Total public expenditure incurred on the program except the purchase incentives USD 1,15,000 as one-time cost and USD 95,000 as recurring cost8
Pricing structure for EV charging
Pricing models Utility rate structure for paid public charging stations
i. Most locations offer free charging
ii. Monthly memberships iii. Hourly payment (often
with higher fee for the first hour followed by a lower hourly fee for the remaining hours)
iv. Flat “access fee” in addition to the hourly rate
v. Energy-based, where the user is charged per kWh drawn from the EVSE
Utility Rate
Green Mountain Power
monthly fee (typically USD 69 for dual port).
Burlington Electric Department
“kick-off fee” of USD 1 per hour after 4 hours
Washington Electric Co-Op
No separate EV charging tariff
Stowe Electric USD 1.93 as hook-up fee, USD 0.48 per hour for the first 4 hours, and 0.96 cents per hour thereafter
Impact on Grid
The current population of the PEVs is 1% of the vehicle population and hence grid impact is minimal9.
Department of Energy Resources (DOER), Massachusetts announced its Vehicle-to-Grid Electric School Bus pilot program, targeting reduction of petroleum use by approximately 22,680 gallons of gasoline equivalent.
EV Population The number of PEVs grew from 88 in July 2012 to 1,113 in January 2016. The number of PEV charging stations grew from 17 in January 2013 to 111 in January 201610.
Table 3: Overview of the Drive Electric Vermont scheme
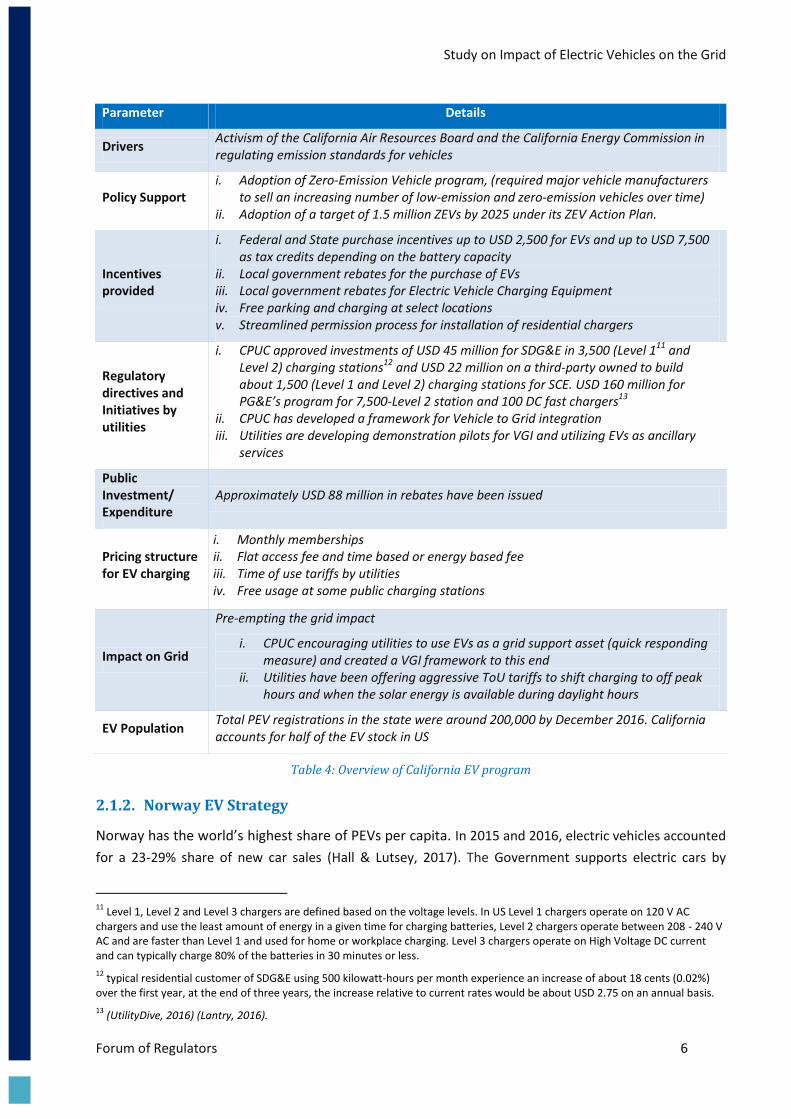
2.1.1.2. California EV Program
California has historically had an aggressive regulatory strategy for automobiles to reduce air pollution in
its auto dependent cities. With its Zero Emission Vehicles (ZEVs) regulations and high technology industry,
it is home to advanced vehicle manufacturing facilities.
7 Vermont Low Income Trust for Electricity (VLITE), a public benefit, non-profit corporation
8 Ibid at 4
9 Communication with Mr. David Roberts, VEIC
10 (Wagner, Roberts, Francfort, & White, 2016).
Study on Impact of Electric Vehicles on the Grid
Forum of Regulators 6
Parameter Details
Drivers Activism of the California Air Resources Board and the California Energy Commission in regulating emission standards for vehicles
Policy Support i. Adoption of Zero-Emission Vehicle program, (required major vehicle manufacturers
to sell an increasing number of low-emission and zero-emission vehicles over time) ii. Adoption of a target of 1.5 million ZEVs by 2025 under its ZEV Action Plan.
Incentives provided
i. Federal and State purchase incentives up to USD 2,500 for EVs and up to USD 7,500 as tax credits depending on the battery capacity
ii. Local government rebates for the purchase of EVs iii. Local government rebates for Electric Vehicle Charging Equipment iv. Free parking and charging at select locations v. Streamlined permission process for installation of residential chargers
Regulatory directives and Initiatives by utilities
i. CPUC approved investments of USD 45 million for SDG&E in 3,500 (Level 111 and Level 2) charging stations12 and USD 22 million on a third-party owned to build about 1,500 (Level 1 and Level 2) charging stations for SCE. USD 160 million for PG&E’s program for 7,500-Level 2 station and 100 DC fast chargers13
ii. CPUC has developed a framework for Vehicle to Grid integration iii. Utilities are developing demonstration pilots for VGI and utilizing EVs as ancillary
services
Public Investment/ Expenditure
Approximately USD 88 million in rebates have been issued
Pricing structure for EV charging
i. Monthly memberships ii. Flat access fee and time based or energy based fee iii. Time of use tariffs by utilities iv. Free usage at some public charging stations
Impact on Grid
Pre-empting the grid impact
i. CPUC encouraging utilities to use EVs as a grid support asset (quick responding measure) and created a VGI framework to this end
ii. Utilities have been offering aggressive ToU tariffs to shift charging to off peak hours and when the solar energy is available during daylight hours
EV Population Total PEV registrations in the state were around 200,000 by December 2016. California accounts for half of the EV stock in US
Table 4: Overview of California EV program
2.1.2. Norway EV Strategy
Norway has the world’s highest share of PEVs per capita. In 2015 and 2016, electric vehicles accounted
for a 23-29% share of new car sales (Hall & Lutsey, 2017). The Government supports electric cars by
11
Level 1, Level 2 and Level 3 chargers are defined based on the voltage levels. In US Level 1 chargers operate on 120 V AC chargers and use the least amount of energy in a given time for charging batteries, Level 2 chargers operate between 208 - 240 V AC and are faster than Level 1 and used for home or workplace charging. Level 3 chargers operate on High Voltage DC current and can typically charge 80% of the batteries in 30 minutes or less.
12 typical residential customer of SDG&E using 500 kilowatt-hours per month experience an increase of about 18 cents (0.02%)
over the first year, at the end of three years, the increase relative to current rates would be about USD 2.75 on an annual basis.
13 (UtilityDive, 2016) (Lantry, 2016).

Study on Impact of Electric Vehicles on the Grid
Forum of Regulators 7
employing “polluter pays principle” in the car tax system (high taxes for high emission cars and lower
taxes for low and zero emission cars), which also impacts fiscal revenue.
Parameter Details
Drivers
i. Heavy reliance on cars for passenger transport, conditioned by relatively low population
density and limited rail network
ii. Stricter commitments for CO2 level reduction to curb the transport sector’s
environmental impactundance of cheap hydro power
iii. Extensive investment in public charging infrastructure
iv. Innovations in vehicle technology – focus on lightweight automotive bodies instead of
increasing the battery size and capacity (PIVCO)
v. Ambitious targets legitimatized by the NGOs, and not-for-profits BEV interest groups
vi. High price of gas to consumers. Unlike many oil producing countries, Norway does not
subsidize gas prices and in fact, includes significant federal taxes.
vii. Push by government, local bodies, industry association and not-for-profit bodies
Policy Support
i. Agreement on Climate Policy (Klimaforliket) with a commitment to greenhouse gas reduction target of 44 Gt of CO2e per year by 2020, including a commitment to reduce emissions from the transportation sector14.
ii. CO2 standard for new passenger cars to be 85 g/km by 202015. iii. Goal of having all new car sales as either zero emission (electric or hydrogen) or low
(plug-in hybrids) emission by 2025. iv. A limit of 120–140 g CO2 /km for new vehicle acquisitions in the government fleet
(Norwegian government, 2007) and goal of having a CO2-neutral fleet by 2020.
Incentives provided
i. No purchase/import taxes ii. Exemption from 25% VAT on purchase iii. Low annual road tax iv. No charges on toll roads or ferries v. Free municipal parking vi. Access to bus lanes vii. 50% reduced company car tax viii. Exemption from 25% VAT on leasing ix. Exemption from registration tax. Given the construct of the registration tax, PEVs are
cheaper than conventional vehicles x. Special registration plate for BEVs using the prefix “EL.” These special registration plates
also increase the visibility of EVs 16
Regulatory directives and role of utilities
The Norwegian Water Resources and Energy Directorate (NVE) determines general principles and approves the budget cap for Distribution System Operators (DSO). DSOs have been actively involved in installing public charging stations across their service areas. Fortum, an electricity supplier has the highest share of charging infrastructure. The network includes more than 1000 charging units (400 are quick chargers) across the nordic countries.
Public Investment/ Expenditure
By 2014, the program had cost the government USD 450 million (according to the Norwegian Ministry of Climate and Environment) including USD 7.4 million for charging station infrastructure17, around USD 350 million of this is revenue foregone from VAT and registration tax revenues, and other indirect incentives.
14
(Vergis, Turrentine, Fulton, & Fulton, 2014) 15
(Tietge, Mock, Lutsey, & Campestrini, 2016) 16
(Elbil, 2017) 17
(Phillips, 2015)

Study on Impact of Electric Vehicles on the Grid
Forum of Regulators 8
Parameter Details
Pricing Models for EV Charging
i. Energy based pricing models - Charges for per kWh used ii. Minute based pricing iii. Free Charging locations
Impact on Grid Nord-Trondelag Elektrisitetsverk, national power grid operator, demonstrated that system can handle up to 20 percent penetration without system reliability breaches, if vehicles are less physically concentrated18.
EV Population • Norway had a stock of more than 135,000 EVs as on December 2016
• More than 20% of all new vehicles sold in Norway are 100% electric
Table 5: Overview of Norway EV strategy
2.1.3. France – EV Deployment
The adoption of plug-in electric vehicles in France is actively supported by the French government
through various incentives. The government provides subsidies towards the purchase of all-electric
vehicles and plug-in hybrids with low CO2 emissions. The stock of light-duty plug-in electric vehicles
registered in France passed the 100,000 units milestone in October 2016, making it the second largest
plug-in market in Europe after Norway, and the world's fifth.
Parameter Details
Drivers
i. Ambitious CO2 emission reduction targets
ii. To acheive higher energy independence and a shift towards a less oil intensive
transport sector
iii. To prioritize the development of EV technology with the aim to pioneer the technology
and keep the value chain in the country
iv. To achieve technological advancements and cost reductions across the EV value chain
Policy Support
i. The French Energy Transition for Green Growth Act of 2014 ii. French government’s 14-point plan, which aims to bring 2 million EVs on roads by
2020 iii. Environmental legislation, Grenelle II19
Incentives provided
i. Feebates - penalizing vehicles penalty upto USD 8,960 with comparatively high CO2 emissions values (≥130 g/km) and subsidizing vehicles with low emissions (≤110 g/km) with bonus up to USD 1,120.
ii. “super bonus” for scrapping old diesel upto USD 4,150 iii. Tax benefits based on CO2 emission values20
Regulatory directives and role of utilities
Regulatory Activism
i. Commission de régulation de l’énergie (French Regulatory Commission of Energy) issued direction for the utilities to facilitate development of EV charging businesses and recommended that energy code can specify that recharging is not considered as electricity supply21
18
Ibid 19
(IEA, 2017)
20 (ICCT, 2016)
21 (CRE, 2014)

Study on Impact of Electric Vehicles on the Grid
Forum of Regulators 9
Parameter Details
Utility initiatives
i. State-owned energy utility Électricité de France (EDF) plans to install 200 fast charging stations, also offers rebates on electricity during off-peak hours
ii. Partly publicly owned energy utility, Compagnie Nationale du Rhône plans to install an additional 52 fast charging points
Pricing structure for EV charging
Pricing models Pricing structure of private players22
Mix of public and private battery-charging stations.
i. Utilities offer a ToU price for EV charging.
Recharging method
Examples of prices for recharging (including parking and other services)
Slow recharge
(3 kW)
Paris, Autolib’: ~USD 9.53 during peak hours and ~USD 4.76 during off-peak hours, after an initial registration fee of ~USD 17.86
Lyon, BlueLy: ~USD 21.43 during peak hours and ~USD 42.87 during off-peak hours + a set monthly fee of ~USD 17.86
Saint Germain en Laye, Château car park: ~USD 2.86
Mayenne, SDEGM: ~USD 9.53
Toulouse, Law faculty: ~USD 14.29
Toulouse, Compans Cafarelli: ~USD 14.29
Fast recharge (22 kW)
Mayenne, SDEGM: ~USD 9.53
Ultrafast recharge (44 kW)
Ultrafast recharging stations in public locations are generally free
Impact on Grid
As per the French transmission network operator RTE, the peak from the fleet of two million electric vehicles (targeted by 2020), could add between 3 and 6 gigawatts (GW) of peak demand, which may affect the grid adversely (Reuters, 2013). However, investment in smart grid and off-peak charging can manage the grid impacts.
EV Population France had more than 1 lakh light duty electric vehicle by the end of December 2016
Table 6: Overview of France EV program
2.1.4. China EV Strategy
China’s EV development is driven by a top-down approach. The central government is the initiator and
main driver for EV development and supports every stage of the system from R&D, demonstration and
promotion, commercialization to production and sales, scale-up, and charging infrastructure construction.
So far, the subsidy policy of government is the main driver for EV enterprises to produce EVs and for
consumers to buy EVs.
22
Ibid

Study on Impact of Electric Vehicles on the Grid
Forum of Regulators 10
Parameter Details
Drivers
i. Electric Vehicles offer an opportunity to be the industry leader
ii. EV strategy can help address the problem of high air pollution
iii. Reduced dependence of oil-based fuel in China
Policy Support
i. Notice on Continuing to Carry out The Promotion and Utilization of New Energy Vehicles (caijian [2013] No. 551)
ii. State Council's Plan of Energy-Saving and New Energy Vehicle Industry Development (2012-2020) (Guofa [2012] No.22)
iii. MOST's Twelfth Ten-Year Special Plan for Science and Technology Development of Electric Vehicle
iv. MOST's Energy-Saving and New Energy Vehicle Major Project under the Eleventh Five-Year Program
v. MOST’s Electric Vehicle Special Project under the Tenth Five-Year (2001-2005.)
Incentives provided
i. Tax credit for automakers ii. Reward to charging infrastructure construction iii. Subsidies for purchasing EV often matched by local governments iv. Tax reduction for purchasing EVs v. Mandated the use of electric vehicles by some government offices - In June 2014, the
National Government Offices Administration announced a measure that electric cars make up at least 30 percent of government vehicle purchases by 2016.
vi. Setting standards for electric vehicles
Regulatory directives and role of utilities
Chinese utilities have worked with cities to coordinate EVSE installations
China Southern Power Grid Company is planning to install two free EV charging poles for each Shenzhen EV driver, one at the home and another near the driver’s place of business.
Pricing structure for EV charging
Pricing models
ToU tariffs for EV charging i. Beijing electricity customers pay TOU (Time of Use) rates with seasonal adjustments23 ii. Shenzhen EV drivers can sign up for reduced electricity rates, including off- peak prices of
0.3 yuan (USD 0.05) per kWh 24
Impact on Grid No discerning impact on the grid seen yet
EV Population
i. 3,600 public charging and swap stations and 49,000 chargers had been built by August 2016 and has a goal of 4.8 million chargers, 12,000 charging stations and bringing No. EV/No. chargers ratio to 1:1 by 2020.
ii. Recently market has been opened to private players as well. iii. By December 2016, electric vehicle fleet of more than 951,000 vehicles including buses and
trucks25.
Table 7: Overview of China EV program
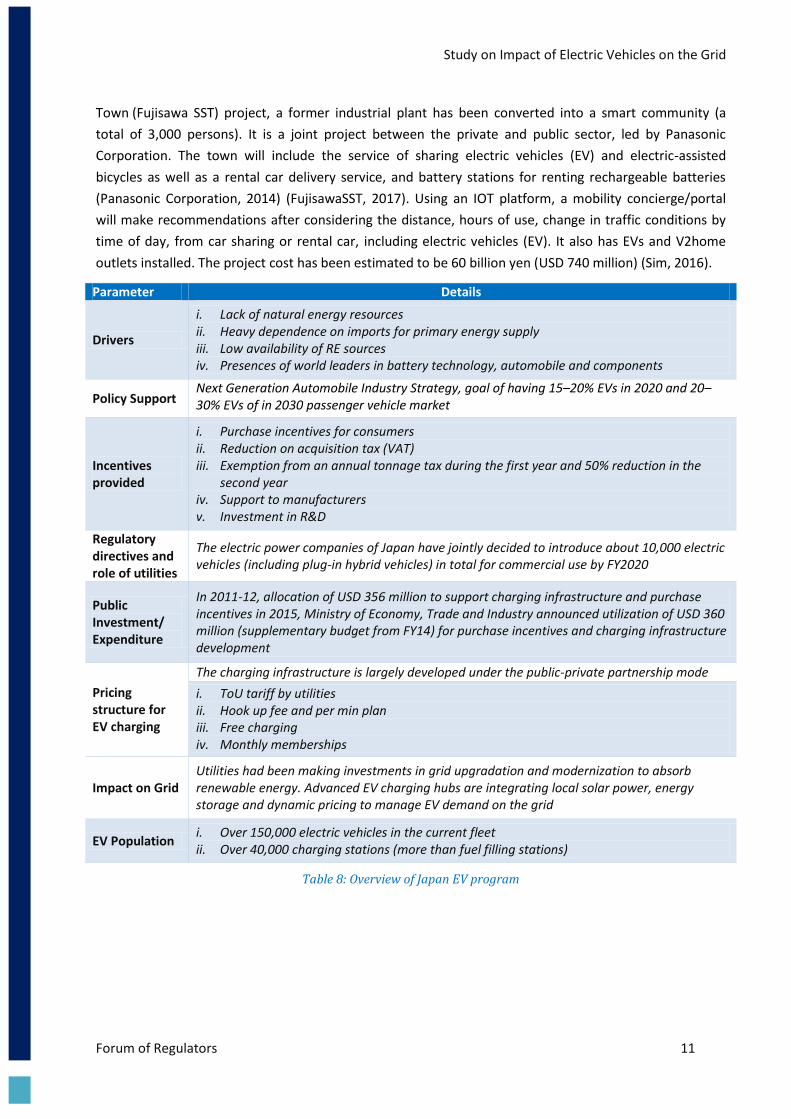
2.1.5. Development of EVs in Japan
The Japanese government has focused its PEV spending on vehicle incentives, subsidizing electric vehicle
charging infrastructure, and infrastructure research and development. Faced with natural resource
constraints, Japan is promoting sustainable and smart town concepts. In Fujisawa, Sustainable Smart
23
(Smith & Kim, 2016) 24
(ICCT, 2013) 25
(HybridCars.com, 2017)
Study on Impact of Electric Vehicles on the Grid
Forum of Regulators 11
Town (Fujisawa SST) project, a former industrial plant has been converted into a smart community (a
total of 3,000 persons). It is a joint project between the private and public sector, led by Panasonic
Corporation. The town will include the service of sharing electric vehicles (EV) and electric-assisted
bicycles as well as a rental car delivery service, and battery stations for renting rechargeable batteries
(Panasonic Corporation, 2014) (FujisawaSST, 2017). Using an IOT platform, a mobility concierge/portal
will make recommendations after considering the distance, hours of use, change in traffic conditions by
time of day, from car sharing or rental car, including electric vehicles (EV). It also has EVs and V2home
outlets installed. The project cost has been estimated to be 60 billion yen (USD 740 million) (Sim, 2016).
Parameter Details
Drivers
i. Lack of natural energy resources ii. Heavy dependence on imports for primary energy supply iii. Low availability of RE sources iv. Presences of world leaders in battery technology, automobile and components
Policy Support Next Generation Automobile Industry Strategy, goal of having 15–20% EVs in 2020 and 20–30% EVs of in 2030 passenger vehicle market
Incentives provided
i. Purchase incentives for consumers ii. Reduction on acquisition tax (VAT) iii. Exemption from an annual tonnage tax during the first year and 50% reduction in the
second year iv. Support to manufacturers v. Investment in R&D
Regulatory directives and role of utilities
The electric power companies of Japan have jointly decided to introduce about 10,000 electric vehicles (including plug-in hybrid vehicles) in total for commercial use by FY2020
Public Investment/ Expenditure
In 2011-12, allocation of USD 356 million to support charging infrastructure and purchase incentives in 2015, Ministry of Economy, Trade and Industry announced utilization of USD 360 million (supplementary budget from FY14) for purchase incentives and charging infrastructure development
Pricing structure for EV charging
The charging infrastructure is largely developed under the public-private partnership mode
i. ToU tariff by utilities ii. Hook up fee and per min plan iii. Free charging iv. Monthly memberships
Impact on Grid Utilities had been making investments in grid upgradation and modernization to absorb renewable energy. Advanced EV charging hubs are integrating local solar power, energy storage and dynamic pricing to manage EV demand on the grid
EV Population i. Over 150,000 electric vehicles in the current fleet ii. Over 40,000 charging stations (more than fuel filling stations)
Table 8: Overview of Japan EV program

Study on Impact of Electric Vehicles on the Grid
Forum of Regulators 12
2.2 EV Grid Integration Pilots
Electricity distribution companies across the world have played a pro-active role in development of EV
ecosystems. Utilities offer discounted electricity prices for EV charging, especially to encourage grid-
friendly charging. Time-of-day tariffs are used as price signals to promote off-peak charging. Besides,
utilities in US, Japan and China are experimenting with utilization of EVs as grid asset either by using them
as demand response resource or for providing ancillary services through Vehicle-to-Grid technologies.
This study documents the following EV grid integration pilots that have been undertaken by utilities or
are currently underway:
i. SDG&E Application VGI Rate Pilot, California (San Diego Gas & Electric, 2014): This was designed to
expand access to EV charging stations and collect data on the ability of different pricing structures to
impact charging times. It was approved by the California Public Utilities Commission in January 2016
and is scheduled to last four years. Specific measures include:
EV charging station construction in multi-unit dwellings: SDG&E proposed to build 3,500
charging installations in a mix of workplace and multi-unit dwellings. These new charging stations
will also provide data for the rest of the project.
Data collection on price signals’ impact on charging behavior: SDG&E has developed a variable
Vehicle Grid Integration (VGI) Pilot Rate for EV owners, which will display hourly differences in
electricity rates on a day-ahead basis, reflecting different grid conditions. Customers can view
these rates on the VGI Pilot Program smart phone application or website and plan their charging
accordingly. The data collected from the pilot will be utilized to understand how it affects
charging behavior and grid utilization.
ii. BMW i ChargeForward Program, California (Boeriu, 2015), (Pacific Gas and Electric, 2015), (BMW,
2016): The BMW i ChargeForward program is a joint program between vehicle manufacturer BMW
and California utility Pacific Gas & Electric (PG&E) Company. BMW served as an aggregator allowing
the EVs of its consumers to act as a resource for PG&E’s DR program. The specific actions taken by
BMW include:
BMW allowed 100 owners of BMW i3 EVs to sign up for its initial 18-month program. During
periods of high demand, the participants received alerts through a smartphone app asking
them to delay charging of their EV. If accepted, software in the charging equipment allows
BMW to halt the charging remotely. Participants were paid USD 1,000 up-front (in the form of
a BMW gift card) as well as additional payments depending on how many charging delays
they accept.
Utilization of retired EV batteries: BMW provided “second life” EV batteries from its EV
demonstration vehicles, which served as stationary storage. These batteries can also provide
grid balancing for absorbing intermittent renewable energies.
iii. Grid integration pilot at Los Angeles Air base, California, US: Los Angeles Air Force Base (LAAFB) is a
non-flying United States Air Force Base located in El Segundo, California. A proof-of-concept for
demonstrating that battery storage of Plug-in Electric Vehicle (PEV) fleets can provide energy and
ancillary services to the CAISO markets to generate additional revenues has been undertaken at the
base. The project was started in February 2012 and intends to demonstrate retail peak shaving for
the Air Force Base as well as the demonstration of providing wholesale service as a Non-Generating

Study on Impact of Electric Vehicles on the Grid
Forum of Regulators 13
Resource (NGR) providing ancillary services. The fleet has 42 vehicles, with 34 vehicles having V2G
capability with 655 kW instantaneous demand or capacity (Southern California Edison, 2016)
Figure 2: LAAFB Project layout
iv. Enel and Nissan V2G pilot, UK: Integrated energy company Enel and Japanese car manufacturer
Nissan partnered to develop an energy management solution that uses a Vehicle-to-Grid (V2G)
recharging device which allows car owners as well as energy users to operate as individual “energy
hubs” – able to draw, store and return electricity to the grid, thus providing grid balancing services.
Under the UK pilot, 100 V2G units would be installed and connected at locations agreed by private
and fleet owners of Nissan LEAF and the e-NV200 electric vans. This will enable customers to connect
and recharge electric cars when energy cost is at its lowest while using the electricity stored in their
car batteries at any time, releasing the rest back into the network, with a reasonable economic
return.
v. ZEM2All Project, Spain: Zero Emission Mobility to All (ZEM2ALL) Project in Malaga (Spain) was a
result of an agreement signed in Japan between Endesa and Mitsubishi Corporation, under the
Spanish-Japanese collaboration JSIP (Japan Spain Innovation Program). The four-year project, which
ended on February 2016, was designed to assess the usage patterns of electric vehicle on a day-to-
day basis and aimed to develop a new energy management model in large cities, taking maximum
advantage of the modern technologies of e-mobility and smart electric infrastructure. The project
comprised 200 EVs (Nissan Leafs & Mitsubishi iMiEV). It featured 220 conventional charging points
and 23 CHAdeMO DC fast charging points including 6 bidirectional chargers capable of providing V2G
functionalities. The EVs would support the integration of intermittent renewable sources by
absorbing the excess power produced by the RES (Renewable Energy Source) and supply back to the
grid at the times of peak demand (i.e. V2G). The project has accounted for 4.6 million kilometers with
zero emissions, more than 100,000 charges and the prevention of 330 ton of CO2 emissions (Endesa,
2016).
vi. EDISON Project, Denmark: The EDISON project was developed by IBM, DONG energy, the regional
energy company of Oestkraft, Technical University of Denmark, Siemens, Eurisco, and the Danish
Energy Association. The project successfully demonstrated optimal system solutions for EV
integration including network issues, market solutions and integration of high levels of variable

Study on Impact of Electric Vehicles on the Grid
Forum of Regulators 14
renewable energy into the Danish power grid. The project explored using an aggregator (fleet
operator) to aggregate the consumption of several EVs and handle their interaction with the grid as
one single unit, which gives the EVs an opportunity to participate in the electricity market. To
demonstrate this, an Edison EV Virtual Power Plant (EVPP) was developed. EVPP was the resulting
server-side management system containing analytics technology and featuring standards based
interfaces to DERs and grid stakeholders. These EVPPs took on the role of Fleet Operators (FO) for
individual EVs in real-time coordinating their charging in private homes, company parking lots and at
charging stations. Besides the development of “Intelligent Charging”, research was also conducted to
gain more knowledge of battery technology and understanding various charging schemes that could
influence battery lifetime. Laboratory tests showed that with adequate knowledge of the batteries
and BMS, intelligent charging schemes can be performed without any negative influence on the
battery lifetime. The project recommended development of standardization for fast deployment of
EVs.
vii. Jeju Island Smart Grid Test-Bed, South Korea: The Jeju Smart Grid Test-bed is located at Gujwa-eup
in the northeastern part of Jeju Island, where wind farms were already in operation. The pilot project
was implemented from December 2009 through May 2013 (Jeju Government, 2009).
Government funding and partnership with industry: During the implementation period, USD
248 million were invested into the pilot, of which USD 76 million came from the government
and the rest from the private sector. A total of 186 companies in different sectors
participated in the pilot, forming 12 consortiums to focus on different areas.
Integration of five focus areas: Smart Place, Smart Transportation, Smart Renewable, Smart
Power Grid, Smart Electricity Service were identified.
High EV penetration and corresponding charging infrastructure development in Jeju.
Impacts of the pilot:
o Establishment of infrastructure for integrating EVs, DR, and renewable energy.
o Relevant technologies verified for application, and new business models explored
successfully.
o V2G successfully tested for the first time in Korea.
o EVs, DR, and renewable energy integration given priority for immediate application
and scale-up in the project expansion phase.
2.2.1 Designing Effective Rate Structures to Shift EV Charging Times using Demand
Response
Electric vehicles are clearly an additional source of revenue for electricity distribution companies and with
proper planning, can result in more efficient and less costly operation of the grid. EVs will also provide
ancillary services, lower electricity prices for ratepayers and facilitate greater integration of renewable
energy resources. EVs can offer the dual benefit of RE integration as well as load flattening for discoms.
EVs are a “flexible load,” i.e. their charging times can be coordinated with renewable energy generation,
to ensure effective uptake of RE in the grid thus allowing discoms to meet their RPOs as well as for load
flattening.
A study, modeling this type of approach, concluded that based on expected renewable energy
penetration in California by 2030, this type of demand-side management (DSM) could reduce oversupply
Study on Impact of Electric Vehicles on the Grid
Forum of Regulators 15
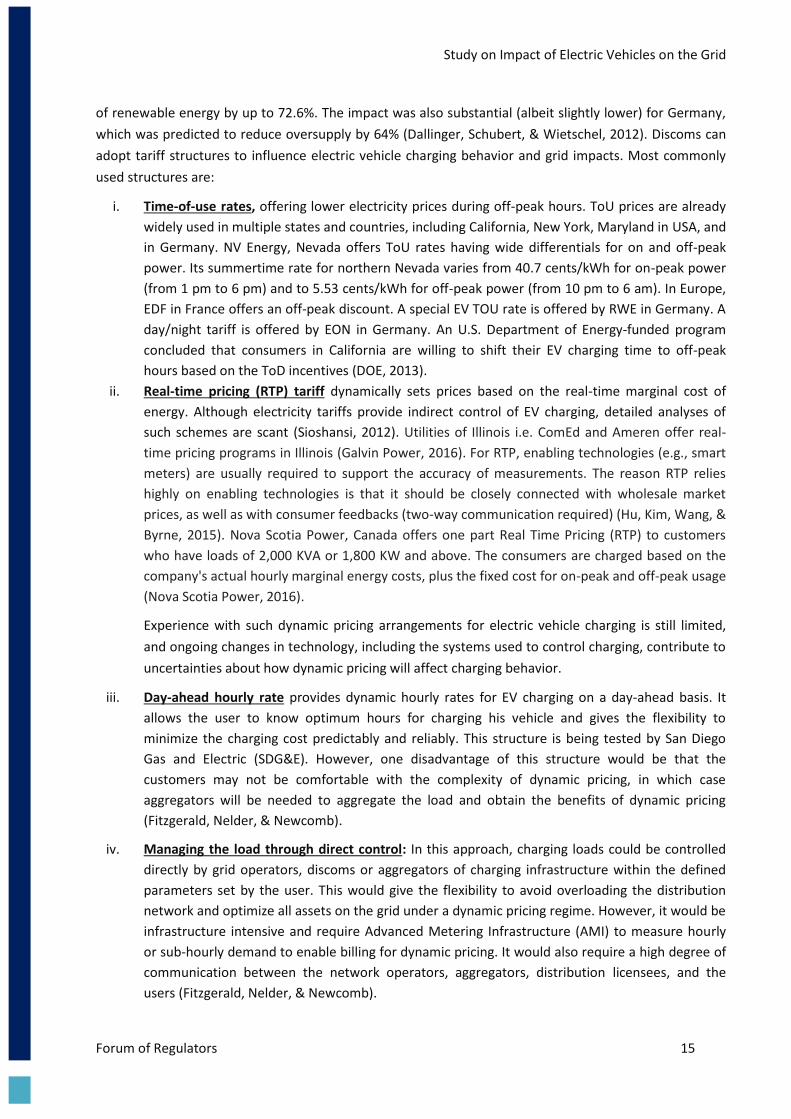
of renewable energy by up to 72.6%. The impact was also substantial (albeit slightly lower) for Germany,
which was predicted to reduce oversupply by 64% (Dallinger, Schubert, & Wietschel, 2012). Discoms can
adopt tariff structures to influence electric vehicle charging behavior and grid impacts. Most commonly
used structures are:
i. Time-of-use rates, offering lower electricity prices during off-peak hours. ToU prices are already
widely used in multiple states and countries, including California, New York, Maryland in USA, and
in Germany. NV Energy, Nevada offers ToU rates having wide differentials for on and off-peak
power. Its summertime rate for northern Nevada varies from 40.7 cents/kWh for on-peak power
(from 1 pm to 6 pm) and to 5.53 cents/kWh for off-peak power (from 10 pm to 6 am). In Europe,
EDF in France offers an off-peak discount. A special EV TOU rate is offered by RWE in Germany. A
day/night tariff is offered by EON in Germany. An U.S. Department of Energy-funded program
concluded that consumers in California are willing to shift their EV charging time to off-peak
hours based on the ToD incentives (DOE, 2013).
ii. Real-time pricing (RTP) tariff dynamically sets prices based on the real-time marginal cost of
energy. Although electricity tariffs provide indirect control of EV charging, detailed analyses of
such schemes are scant (Sioshansi, 2012). Utilities of Illinois i.e. ComEd and Ameren offer real-
time pricing programs in Illinois (Galvin Power, 2016). For RTP, enabling technologies (e.g., smart
meters) are usually required to support the accuracy of measurements. The reason RTP relies
highly on enabling technologies is that it should be closely connected with wholesale market
prices, as well as with consumer feedbacks (two-way communication required) (Hu, Kim, Wang, &
Byrne, 2015). Nova Scotia Power, Canada offers one part Real Time Pricing (RTP) to customers
who have loads of 2,000 KVA or 1,800 KW and above. The consumers are charged based on the
company's actual hourly marginal energy costs, plus the fixed cost for on-peak and off-peak usage
(Nova Scotia Power, 2016).
Experience with such dynamic pricing arrangements for electric vehicle charging is still limited,
and ongoing changes in technology, including the systems used to control charging, contribute to
uncertainties about how dynamic pricing will affect charging behavior.
iii. Day-ahead hourly rate provides dynamic hourly rates for EV charging on a day-ahead basis. It
allows the user to know optimum hours for charging his vehicle and gives the flexibility to
minimize the charging cost predictably and reliably. This structure is being tested by San Diego
Gas and Electric (SDG&E). However, one disadvantage of this structure would be that the
customers may not be comfortable with the complexity of dynamic pricing, in which case
aggregators will be needed to aggregate the load and obtain the benefits of dynamic pricing
(Fitzgerald, Nelder, & Newcomb).
iv. Managing the load through direct control: In this approach, charging loads could be controlled
directly by grid operators, discoms or aggregators of charging infrastructure within the defined
parameters set by the user. This would give the flexibility to avoid overloading the distribution
network and optimize all assets on the grid under a dynamic pricing regime. However, it would be
infrastructure intensive and require Advanced Metering Infrastructure (AMI) to measure hourly
or sub-hourly demand to enable billing for dynamic pricing. It would also require a high degree of
communication between the network operators, aggregators, distribution licensees, and the
users (Fitzgerald, Nelder, & Newcomb).

Study on Impact of Electric Vehicles on the Grid
Forum of Regulators 16
A study conducted in Spain observed that ToU, CPP and RTP pricing succeeded in shifting charging times
to the off-peak periods, given the hypothetical penetration of EVs based on EU target rates of EV
adoption in 2030. However, system congestion was observed due to large numbers of EV owners
scheduling their vehicle charging for the start of a low-price period (Cruz-Zambrano, et al., 2011).
To manage system congestion, Southern California Edison, a Californian utility, offered a service of
programming the ‘end-time’ for EV charging. This technology, already available in many EVs, allows a
utility to stagger the load from EV charging throughout the off-peak periods. It was found to be useful in
minimizing the impact of EVs on grid functioning (Southern California Edison, 2013).
2.3 International Business Models for Investment in Public Charging
Infrastructure
Predominantly three types of business models are being used worldwide for investment in EV charging
infrastructure.
2.3.1 Manufacturer or Business Owner Funding:
A large business that benefits from EV sales and usage (such as an automaker or a battery supplier), or
that seeks to gain a marketing advantage (such as a retail or restaurant chain) could contribute funding to
subsidize the deployment of DC fast charging network for inter-regional EV travel. It happens either
through the manufacturer’s own investment in developing infrastructure, or by availing service of a third-
party provider.
a. Own installations
i. Tesla built a network of fast-charging Superchargers along highways throughout North
America, Europe, and Asia, which are available to Roadster, Model S, and Model X owners for
free. Tesla has built over 5,400 Superchargers and around 9,000 Destination Charging
connectors similar to Tesla Wall Connectors, for the current population of 200,000 vehicle
owners. It plans to double the network to 10,000 Superchargers and 15,000 Destination
Charging connectors around the world.
ii. 400 kWh Supercharger credits are awarded annually to the users, after which they are
charged based on either per kWh or per minute.
b. Partnering with service providers
i. BMW Chargenow: BMW partnered with ChargePoint, to allow its users to access the
ChargePoint’s network through a smart card.
ii. Nissan No-Charge to Charge Supported by EVGo: Two years of complimentary public DC fast
and Level 2 charging at participating stations
2.3.2 Private Sector Charging Service Providers:
Private sector players sell their hardware to the host (either lease or monthly EMIs) develop
infrastructure and take a share of the revenue from charging events. e.g. ChargePoint, EVGo,
CarCharging, Volta
a. ChargePoint – The company designs, builds and supports all the technology, from charging station
hardware to energy management software to a mobile app and provides mainly Level 2 Chargers

Study on Impact of Electric Vehicles on the Grid
Forum of Regulators 17
conforming to SAE standards. It does not own the station but provides the hardware and the
software for charger installations for the hosts with fixed payments aligned to usage. The host is free
to set the tariff for charging of EVs. Users uses smart cards to pay for charging on the mobile app,
which is remitted to the hosts. It has built a network of more than 35,800 charging spots across
North America. The company raises investments from private investors, manufacturers and avails tax
credit and the subsidies provided by Government.
b. EVGo – EVGo network of charging stations were initially installed by NRG Energy (Utility), but was
later sold to Colorado-based sustainable-energy investment firm Vision Ridge Partners. It works with
automakers to develop charging stations and installs, operates and maintain its own fast charging
network. EVGo has the largest network of fast charging stations in US, it operated around 900 fast
charging stations in addition to the individual charging stations at homes, and other retail outlets our
growing network.
The different charging plans are designed based on the need of the users (Table 9). It can also be
installed at business and retailers premises. The chargers conform to CHADeMO and CCS standards.
The company also partners with discoms to expand the network.
Table 9: EV charging plans of EVGo
DC Fast Level 2 (Plug-ins) FLEX (Low usage)
Monthly Fee USD 14.95 USD 5.95 None
DC Fast 10 cents / min. 10 cents / min. USD 4.95 session + 20 cents /min.
Level 2 USD 1.00 / hr. USD 1.00 / hr. USD 1.50 / hr.
Contract Term 12 months 12 months month-to-month
Setup Fee None None USD 4.95
Early Termination USD 29 USD 29 None
c. Volta – It installs EV chargers which are free for usage for EV drivers and free for host for installation.
The company leverages advertising revenues. It has installed around 300 charging stations across US.
2.3.3 Utility Funded Installations:
Distribution licensees install EVSE as a part of their business and get the budget approved from the
Commission as a part of their annual budget (PGE, SDGE, SCE). The utility either provides tariff incentives
to the users or aggregate the EV installation and appoint a service provider to provide standardized
chargers to the consumers.
a. Tariff incentives for EV users: EV users are offered rebates if they have a separate connection for EV
charging. The charger is installed and maintained by the hosts. The rate structure of different discoms
is provided in Annexure II.
b. Discoms aggregating the EV installation and appointing third party service providers: Utility invites
RFP for installation and maintenance and empanels a few vendors. Hosts can choose from the list of
selected vendors for installation. The Host also gets federal rebates for installation of chargers. Utility
installs and maintains the EV service connection and electrical infrastructure, the tariff structure for
charging is decided by Commission and the investment is recovered through the tariffs socialized
across the consumer base. A few pilots have been approved by CPUC for PG&E, SDG&E and SCE. The

Study on Impact of Electric Vehicles on the Grid
Forum of Regulators 18
programs are in support of the Zero-Emission Vehicle goals. A summary of the approved programs is
given in following table:
Table 10: Summary of approved programs for Californian Discoms
SDG&E PG&E SCE
Scope
Up to 3,500 L1 & L2 at 350 sites over 3 years
7,500 L2 100 DCFC over 3 years
At least 1,250 L1 & L2 in at least 12 months
Approved budget (USD)
45 million 160 million 22 million
Ownership of the charger
SDG&E owned PG&E owned Site host owned
Incentive 10% of average EVSE cost for Multi-unit dwellings (MUDs), 20% for workplaces Fee waived for Disadvantaged Communities, government, school, non-profit, small business and affordable housing sites
10% of EVSE cost for MUDs, 20% for private businesses; Fee waived for Disadvantaged Communities, government, and non-profit sites
Site host buys equipment 25-50% rebate from SCE 100% rebate for Disadvantaged Communities
Rates/Pricing Choice of VGI rate to driver or to site host
Choice of commercial TOU rate to driver or to site host
Site host pays commercial rate, site host sets Pricing
Load Management
VGI rate reflects grid conditions; if site host takes rate, must submit load management tactics
TOU rate reflects grid conditions; if site host takes rate, must submit load management tactics Develop DR program within 3 years
Evaluate load management strategies in Pilot Phase Develop DR program within 3 years
Site Host Recruitment
SDG&E + 3rd party partners PG&E + 3rd party partners
SCE + 3rd party partners
Battery swapping is another model that is being tried by manufacturers and third-party service providers.
A battery swapping (or switching) station is a place where a vehicle's discharged battery or battery pack
can be immediately swapped for a fully charged one, eliminating the waiting period for charging the
vehicle's battery. In recent years, Better Place, Tesla Motors and Mitsubishi Heavy Industries have used
this business model. Here is an overview of some of the players involved:
a. Voltia: Formerly Greenway Operator, Voltia, designs and runs proprietary battery swapping stations
(BSS) in Slovakia for switching the batteries in light commercial vehicles. The stations have been in
successful commercial operation since 2012.
b. BAIC: A subsidiary of Beijing Automotive Group (BAIC Group) has installed few battery-switch
stations for EV taxi in Beijing on November 2016. The company plans to rapidly expand its network of
battery swapping stations.
c. Better Place: Better Place launched its first battery-swapping station in Israel, in Kiryat Ekron,
near Rehovot in March 2011. However, owing to the lower than expected penetration of EVs, the
company went bankrupt.
Study on Impact of Electric Vehicles on the Grid
Forum of Regulators 19
d. Tesla Motors: Tesla Motors designed its Model S to allow fast battery swapping in June 2013, and
announced a plan for global deployment. However, the company currently is not pursuing its original
plan which was also subjugated by supercharging stations for Model S electric car drivers.
2.4 Key takeaways from international experience
The EV market is quickly growing, and many discoms are pro-actively adapting to and supporting electric
vehicle adoption. Around the world, electricity distribution companies have built electric vehicle charging
networks to build consumer range confidence and created programs to minimize grid impacts. High
penetration of electric vehicles will be a new source of electricity sales and offer new business
opportunities. Many electricity distribution companies and governments have worked proactively to
study the impacts of electric vehicles on the grid and the best ways to integrate them in a grid-friendly
manner. The following key lessons can be abstracted from the case studies:
Substantial fiscal incentives are the most important driver of EV uptake. However, fiscal incentives
need to be supplemented by developing consumer awareness.
Availability of charging infrastructure is another prerequisite for electric mobility because it helps
overcome range anxiety. Countries with dense public charging infrastructure have higher EV market
shares.
Electricity distribution companies have a key role to play in development of charging infrastructure
and establishing clear pricing policies for charging.
Regulators in regulated electricity markets have directed or mandated electricity distribution
companies to invest in EV charging infrastructure. CPUC and PSB, Vermont have approved the
capital expenditure against EVSE installation under their annual budgets.
Public private partnerships have been successful in deployment of infrastructure, supplementing the
consumer awareness efforts as well as providing independent incentives to the consumers.
Study on Impact of Electric Vehicles on the Grid
Forum of Regulators 20
Chapter 3: Technical Impact Assessment of EVs on the Grid
This chapter assesses the technical impact of EV charging on the distribution system. At the national level,
the penetration of 5 – 6 million EVs is likely to require no more than 5000 MW of additional capacity,
which would be equivalent to approximately 1.5% of the total current installed capacity (more than 330
GW as on 31 July 2017). Hence the impact of EVs on the grid at the national level is expected to be
negligible. This chapter focuses on the impact of EVs on the distribution feeders at the local level as there
may be certain pockets with high concentration of EVs charging coincident with the system peaks. This
chapter is divided into the following sub-sections:
Selection of modeling software platform used
Description of the basic model and modifications made to develop a near real-life scenario and
associated assumptions
Results and Inference
Conclusions and recommendations.
3.1 Selection of a simulation platform
The aim of this technical assessment is to understand the effect of electric vehicle integration into the
distribution grid, under different penetration levels at the distribution feeder levels. We compared three
common modelling tools used to assess the impact of loads on grids.
PLEXOS: PLEXOS is a power system model which focuses on power generation and provides technical as
well temporal detail. It can be used to forecast electricity market prices, analyze market power, analyze
production costs, resource operations, quantify fuel requirements and air emissions. However, it only
focuses on modelling the prices based on economic trends.
GridLAB-D™ is a power distribution system simulation and analysis tool, coupled with distribution
automation models and software integration tools. It can be used to create and validate rate structures,
examine consumer reaction and verify the interaction and dependence of programs with other
technologies and wholesale markets. However, it is not very user friendly and has not been widely used
for EV simulation studies.
Matlab/Simulink: Matlab is a programming language and computing environment which uses specialized
data types to integrate computation, visualization, and programming in familiar mathematical notation.
Simulink is a graphical programming environment for modelling, simulating and analyzing multi-domain
dynamic systems. Matlab/Simulink has been widely used by researchers to study the impact of EVs on
the grid and hence, it has been used in the current study to understand the interaction of EVs with local
distribution transformers.

Study on Impact of Electric Vehicles on the Grid
Forum of Regulators 21
3.2 Details of the Matlab Model
The model used for the assessment was taken from a library on the MATLAB directory. The network
layout available in the Matlab directory is shown in figure 3.
Figure 3: Layout of the model from Matlab Library
The library model consists of three major components: generating stations (Solar PV farm, Wind farm and
Diesel generator), the distribution lines and two 3-phase transformers and Loads (electrical vehicle and
residential load).
1. Generating stations: The system consists of three electricity generating sources with a total
installed capacity of 27.5 MW
2. 3-phase transformers and distribution network: Transformer A (25kV/25kV)(substation
transformer),connected to the generating sources. Transformer B (25kV/600V) connected to
Transformer A, which relays the electricity to the residential and electric vehicle module
3. Loads: Baseline residential and EV load.
3.3 Model Customisation
The available model exemplified to accommodate real-life loads and impedences as shown in figure 4.
Network scenario we used has the following components:
1. Generating stations: The electricity generation sources have been kept the same as in library
model. However, the capacities have been varied for different scenarios.
2. 3-phase transformers and distribution network: Line impedances26 were added between the line
between generating station and Transformer A as well as on the input side of Transformer B.
26
Transmission lines have an inherent property to oppose current flow, thereby leading to losses and heat generation which is
called impedance. This opposing force is due to line properties such as resistance, inductance and capacitance. In short
transmission lines (lengths < 80 kms), there are negligible current leakages due to the high quality of conductor used in the
distribution system. Using Matlab-Simulink, impedance block operators were introduced into the model. These blocks require

Study on Impact of Electric Vehicles on the Grid
Forum of Regulators 22
3. Impedance Blocks: The impedance block was added from Simulink library to account for network
impedances seen in real-life distribution networks.
4. Loads: Baseline residential and EV load
i. Residential Load Module: The residential load module is connected to a transformer that
provides electricity supply at 600 V. The module has an initial power factor of 0.95 with a
load size of 10 MW. The residential block has provisions for changing the load size and
power factor as required. However in this study, the power factor is kept constant.
ii. Electric Vehicle Module: The electric vehicle module taken from the MatLab directory
represents 100 cars. The library module also has the provision, similar to the residential
block, to change the motor and battery capacity as well as the number of cars. The
electric vehicle module from the directory includes 5 sub-modules, each representing a
particular charging and usage pattern. The sub-modules available from the library are
listed below with the number of cars mentioned in brackets.
a) Type A: People going to work with the possibility of charging the car at work plus
night charging at home (25 cars).
b) Type B: People going to work with the possibility of charging the car at work, with a
longer driving distance, compared to Type A, plus night charging at home (35 cars).
c) Type C: People going to work but have no possibility of charging the car at work,
implying charging at home only (10 cars).
d) Type D: People staying at home and have their cars connected to the grid at all time
(20 cars).
e) Type E: People working in the night shift and charge their cars during the day (10
cars).
*Z: impedance blocks
Figure 4: Line diagram of the altered model for simulation
5. Measurement Block: Modelling results for baseline and other cases are reported at Transformer
B (shown as Measurement Block in Figure 4).
inductance and resistance input parameters. Given the rigidity of the model, impedance blocks were added in locations that
would not eventually fail the simulation.

Study on Impact of Electric Vehicles on the Grid
Forum of Regulators 23
3.4 Assumptions made in the model
As described in the previous section, modelling exercise made a few specific changes to reflect real-life
scenarios. These changes included introduction of impedance and state-of-charge. These assumptions are
described below.
i. Impedance values: To represent a system of varying sizes, two different set of inductance and
resistance input parameters were considered as given in following table. Values related to
inductance and resistance reported as “input values” for two Sets are calculated in the model
using a standard formulation described in Annexure IV
Location Set 1 Set 2
Impedance Block Distance Input values Distance Input values
Diesel to Transformer A 1 Km I: 5*10^-4 R: 0.06
5 km I: 2.5*10^-3 R: 0.3
Solar PV to Transformer A 5 Km I: 2.5*10^-3 R: 0.3
10 km I: 7.5*10^-3 R: 0.9
Wind to Transformer A 5 Km I: 2.5*10^-3 R: 0.3
25 km I: 7.5*10^-3 + 5*10^-3 R: 0.9 + 0.6
Transformer A to Transformer B
- 5 km I: 2.5*10^-3 R: 0.3
Table 11: Input values for inductance (I) and resistance (R)
a. Set 1 represents a small network where RE generators are located within 5 kms and
diesel generator is located within 1 km from the point of demand
b. Set 2 represents a more realistic scenario where generators are located at different
points with Wind generator placed at a maximum of 25 kms away from the load.
Additional line impedance was considered between the two transformers to account for
all impedances from lines.
ii. State of Charge (SoC): A battery’s SoC is dependent on a variety of factors ranging from human
behavior (range anxiety), vehicle handling characteristics, distance travelled, age of the battery,
charging times to name a few. The following features were implemented:
a. In each of the Sub-modules, the cars discharge to 20% SoC, at least once during the day
except Type D
b. The boundary conditions for the battery charging are assumed to be within the range of
90% and 20% SOC.
3.5 Case and Scenario Development for Analysis
3.5.1. Residential Feeder
In order to conduct distinctive assessment of the impact of electric vehicles on a distribution network,
three cases were developed with two different system sizes. The model characteristics for each case are
presented in the following table with a description given below the table.

Study on Impact of Electric Vehicles on the Grid
Forum of Regulators 24
Case
Scenarios
Case 1 Slow Charging
Case 2 Fast DC Charging
Case 3 Fast DC Charging
Case 4 Fast DC Charging
Impedance Impedance values from set 2
- Impedance values from set 1
Impedance values from set 2
Baseline Residential Load (10 MW)
Residential load (10 MW)
Residential load (10 MW)
Varying EV and Residential
Loads
Scenario 1 Baseline Load + 0.66 MW EV load (24 kWh battery capacity) (100 cars)
Baseline Load + 4 MW EV load (85 kWh battery capacity)
Baseline Load + 4 MW EV load (85 kWh battery capacity)
Scenario 2 Baseline Load + 0.66 MW EV load (85 kWh battery capacity) (100 cars)
Baseline Load + 8 MW EV load (85 kWh battery capacity)
Baseline Load + 8 MW EV load (85 kWh battery capacity)
Scenario 3 Baseline Load + 1.32 MW EV load (24 kWh battery capacity) (200 cars)
Baseline Load + 8 MW EV load (24 kWh battery capacity)
Baseline Load + 8 MW EV load (24 kWh battery capacity)
Scenario 4 Baseline Load + 1.32 MW EV load (85 kWh battery capacity) (200 cars)
Baseline Load + 4 MW EV load (24 kWh battery capacity)
Baseline Load + 4 MW EV load (24 kWh battery capacity)
Scenario 5 (Peak coincident charging)
- Baseline Load + 4 MW EV load (85 kWh battery capacity)
Table 12: Case and Scenarios analysed
Case 1
This case was introduced to assess the impact on the transformer due to slow charging. Under this case,
the residential load was kept constant at 10 MW and the charger was assumed to have a rated power of
6.6 kW, corresponding to a Nissan Leaf on-board charger. Following scenarios were developed
i. Baseline Scenario: wherein the model is simulated with a base residential load only.
ii. Scenario 1: An electric vehicle load of 0.66 MW (6.6 kW and 100 vehicles) and with a battery
capacity of 24 kWh is added.
iii. Scenario 2: An electric vehicle load of 0.66 MW (6.6 kW and 100 vehicles) and with a battery
capacity of 85 kWh is added.
iv. Scenario 3: An electric vehicle load of 1.32 MW (6.6 kW and 200 vehicles) and with a battery
capacity of 24 kWh is added.
v. Scenario 4: An electric vehicle load of 1.32 MW (6.6 kW and 200 vehicles) and with a battery
capacity of 85 kWh is added.
Under all cases and scenarios, the system is simulated to reproduce results relevant for a period of 24
hours.

Study on Impact of Electric Vehicles on the Grid
Forum of Regulators 25
Case 2 and Case 3
While simulating the model under Case 2 and Case 3, the residential load was kept constant at 10 MW.
The rating of EV charger and battery capacities were varied, which formed the basis for various scenario.
The starting rated capcity was considered to be 40kW and was subsequently increased in steps of 40 kW.
Similarly, the battery capacity was altered to gauge the impact of battery size variations on the grid.
i. Baseline Scenario: wherein the model is simulated with a base residential load only.
ii. Scenario 1: An electric vehicle load of 4 MW (40 kW and 100 vehicles) and with a battery capacity
of 85 kWh is added.
iii. Scenario 2: An electric vehicle load of 8 MW (80 kW and 100 vehicles) and with a battery capacity
of 85 kWh is added.
iv. Scenario 3: An electric vehicle load of 8 MW (80 kW and 100 vehicles) and with a battery capacity
of 24 kWh is added.
v. Scenario 4: An electric vehicle load of 4 MW (40 kW and 100 vehicles) and with a battery capacity
of 24 kWh is added.
vi. Scenario 5: In the model, the residential load peaks between 5 pm to 9 pm. To ascertain the
performance characteristics of the transformer, the electric vehicle block is modified, where all
cars are made to start and finish charging between 5 pm and 9 pm, so that the EV charging
coincides with the residential peaking. This scenario was simulated to understand the impact on
transformer during peak co-incident charging conditions.
Case 4
In the model, there are two major load modules; residential and electric vehicle load. Both module load
sizes were varied and the impact studied. The details about the load size choices will be given under the
results.
3.5.2. Commercial Feeder
In the next step of the assessment, the impact of electric vehicles on a commercial distribution network is
assessed. The load module was modified to represent a commercial load profile. The load curve peaks at
12 noon with a over 95% of the total load acting on the transformer. The sub-profiles of the EV modules
was retained as the same in the case of residential load assessment.
The commercial load was also simulated for two power ratings of 6.6 kW and 40 kW with two different
battery capacities of 24 kWh and 85 kWh.
Cases Scenario
Case 1 (No Impedance) Case 2 (Set 1 Impedance)
Baseline Commercial Load (10 MW) Commercial Load (10 MW)
Scenario 6 Baseline + EV load (4 MW 85 kWh) Baseline + EV load (4 MW 85 kWh)
Scenario 7 Baseline + EV load (0.66 MW 24 kWh)
Scenario 8 Baseline + EV load (0.66 MW 85 kWh)
Table 13: Developed Scenarios for assessment

Study on Impact of Electric Vehicles on the Grid
Forum of Regulators 26
3.6 Results
3.6.1. Results for Case 1 (Slow Charging)
Under this simulation, the residential load was kept constant at 10 MW and EVs were assumed to be
charging through a slow charging EV Charger (6.6 kW).
The following results were obtained:
Case 4 (Baseline) Residential Load (10 MW)
Voltage (V) 530.14
Current (x10^4 amps) 1.648
Maximum Demand (MW) 8.74
Table 14: Voltage, current and demand experienced by transformer under Case 1
Case 1 Scenario 1 Scenario 2 Scenario 3 Scenario 4
EV load (24 kWh battery, 100 cars)
EV load (85 kWh battery, 100 cars)
EV load (24 kWh battery, 200 cars)
EV load (85 kWh battery, 200 cars)
Rating of the charger (kW) 6.6 6.6 1.32 1.32
Voltage (V) 530.07 530.13 530.17 530.13
Current x10^4 (A) 1.648 1.65 1.66 1.676
Maximum Demand (MW) 8.73 8.75 8.80 8.88
Voltage Drop (%) 0.013% 0.002% -0.006% 0.002%
Rise in Max. Demand (%) -0.08% 0.15% 0.72% 1.64%
Table 15: Voltage, current and demand experienced by transformer after addition of EV load under Case 1
Inference
On simulating the model, it was noted that the residential load had a major impact on the
transformer, when the model was limited to 100 cars.
On increasing the number of cars to 200, the electric vehicle load impacts the peak experienced
by the transformer.
It is noted that the transformer is not adversely impacted by the lower power rating or by the
increase in number of vehicles.
3.6.2. Results for Case 2 & Case 3 (fast charging)
As mentioned earlier, with scenarios for Case 2 and Case 3 being similar, the simulation results and
conclusions have been presented together.
3.6.2.1. Baseline Scenario:
On Simulink, the model is reviewed and simulated with a residential load size of 10 MW. In Case 3, the
impedance values are included into the model and the system is simulated to generate the following
results.

Study on Impact of Electric Vehicles on the Grid
Forum of Regulators 27
Parameters Residential load(Case 2) Residential Load (Case 3)
Voltage (V) 552.34 550.33
Current (x10^4 amps) 1.58 1.58
Maximum Demand (MW) 8.73 8.70
Table 16: Maximum Voltage, current and demand experienced by transformer for Baseline Scenario for Case 2
and 3
3.6.2.2. Scenario 1, 2, 3, 4
Following the simulation of the baseline scenario, the electric vehicle module of 4 MW with 85 kWh
battery capacity is added and the system is simulated (Scenario 1). Subsequently, Scenario 2, 3 and 4
were simulated to present a more discerning picture on the influence of varying battery sizes on the
transformer.
Scenario 1 Scenario 2 Scenario 3 Scenario 4
Residential + EV Load (Case 2)
Residential + EV Load (Case 3)
Residential +EV Load (Case 2)
Residential +EV Load (Case 3)
Residential + EV Load (Case 2)
Residential + EV Load (Case 3)
Residential + EV Load (Case 2)
Residential + EV Load (Case 3)
Voltage (V) 542.56 541.45 540.17 539.25 540.84 540.23 542.75 542.07
Current (Amps x10^4)
1.868 1.81 2.25 2.191 2.2 2.175 1.805 1.78
Maximum Demand Power (MW)
10.13 9.80 12.15 11.81 11.89 11.75 9.79 9.64
Increase in Max demand (MW)
1.40 1.10 3.42 3.11 3.16 3.05 1.06 0.94
Table 17: Voltage, current and demand experienced by transformer for Scenario 1, 2, 3, 4
Voltage Drop Increase in Maximum Demand
Case 2 (without impedance)
Case 3 (with impedance)
Case 2 (without impedance)
Case 3 (with impedance)
Scenario 1 1.70% 1.60% 16% 13%
Scenario 2 2.20% 2.00% 39% 36%
Scenario 3 2.20% 1.80% 36% 35%
Scenario 4 1.70% 1.50% 12% 11%
Table 18: % Voltage drops and increase in Maximum Demand across scenarios compared to the baseline scenario
3.6.2.3. Scenario 5 for Case 2
This scenario was assessed to understand the impact of co-incident peak charging of EVs on the
transformer and the results are reported in following table.
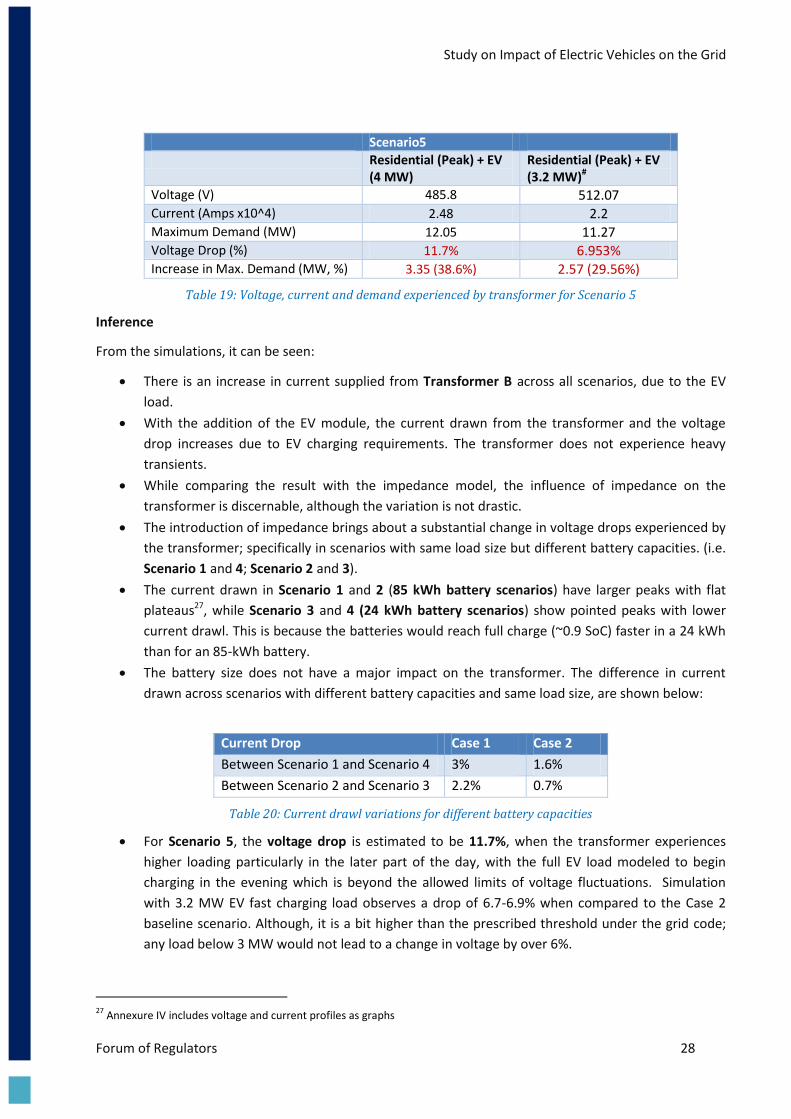
Study on Impact of Electric Vehicles on the Grid
Forum of Regulators 28
Scenario5
Residential (Peak) + EV (4 MW)
Residential (Peak) + EV (3.2 MW)#
Voltage (V) 485.8 512.07
Current (Amps x10^4) 2.48 2.2
Maximum Demand (MW) 12.05 11.27
Voltage Drop (%) 11.7% 6.953% Increase in Max. Demand (MW, %) 3.35 (38.6%) 2.57 (29.56%)
Table 19: Voltage, current and demand experienced by transformer for Scenario 5
Inference
From the simulations, it can be seen:
There is an increase in current supplied from Transformer B across all scenarios, due to the EV
load.
With the addition of the EV module, the current drawn from the transformer and the voltage
drop increases due to EV charging requirements. The transformer does not experience heavy
transients.
While comparing the result with the impedance model, the influence of impedance on the
transformer is discernable, although the variation is not drastic.
The introduction of impedance brings about a substantial change in voltage drops experienced by
the transformer; specifically in scenarios with same load size but different battery capacities. (i.e.
Scenario 1 and 4; Scenario 2 and 3).
The current drawn in Scenario 1 and 2 (85 kWh battery scenarios) have larger peaks with flat
plateaus27, while Scenario 3 and 4 (24 kWh battery scenarios) show pointed peaks with lower
current drawl. This is because the batteries would reach full charge (~0.9 SoC) faster in a 24 kWh
than for an 85-kWh battery.
The battery size does not have a major impact on the transformer. The difference in current
drawn across scenarios with different battery capacities and same load size, are shown below:
Current Drop Case 1 Case 2
Between Scenario 1 and Scenario 4 3% 1.6%
Between Scenario 2 and Scenario 3 2.2% 0.7%
Table 20: Current drawl variations for different battery capacities
For Scenario 5, the voltage drop is estimated to be 11.7%, when the transformer experiences
higher loading particularly in the later part of the day, with the full EV load modeled to begin
charging in the evening which is beyond the allowed limits of voltage fluctuations. Simulation
with 3.2 MW EV fast charging load observes a drop of 6.7-6.9% when compared to the Case 2
baseline scenario. Although, it is a bit higher than the prescribed threshold under the grid code;
any load below 3 MW would not lead to a change in voltage by over 6%.
27
Annexure IV includes voltage and current profiles as graphs

Study on Impact of Electric Vehicles on the Grid
Forum of Regulators 29
3.6.3. Results for Case 4
In this case, the model was simulated with varying load sizes. The electric vehicle load was varied from 4
MW to 20 MW and the residential load was varied from 4 MW to 20 MW. (However, the simulations
failed beyond 12 MW of Residential load and 16 MW of EV load and hence are not presented in Table 21).
A test simulation was conducted with a residential load of 10 MW and the voltage drops in relative terms
were simultaneously noted.
Residential Load (MW)
4 8 12
Electric Vehicle
Load (MW)
0
Voltage (V) 576.02 547.86 517.45
Current (I) 0.62*10^4 1.28*10^4 1.95*10^4
Maximum Demand (MW) 3.57 7.01 10.09
4
Voltage (V) 573.79 545.31 505.17
Current (I) 0.845*10^4 1.49*10^4 2.26*10^4
Maximum Demand (MW) 4.84 8.12 11.41
8
Voltage (V) 569.13 537.38 491.36
Current (I) 1.16*10^4 1.77*10^4 2.6*10^4
Maximum Demand (MW) 6.60 9.51 12.77
12
Voltage (V) 562.64 527.74 472.5
Current (I) 1.52*10^4 2.09*10^4 3.015*10^4
Maximum Demand (MW) 8.55 11.02 14.24
16
Voltage (V) 557.99 518.8 451.9
Current (I) 1.62*10^4 2.23*10^4 3.39*10^4
Maximum Demand (MW) 9.03 11.55 15.31
Table 21: Voltage, current and demand experienced by transformer under Case 4
Voltage Drop Increase in Maximum Demand
Residential Load -> 4 8 12 4 8 12
Elec
tric
V
ehic
le
Load
(M
W) 4 1.036% 0.465% 2.374% 36% 16% 13%
8 1.196% 1.913% 5.043% 85% 36% 27%
12 2.323% 3.672% 8.688% 139% 57% 41%
16 3.130% 5.304% 12.669% 153% 65% 52%
Table 22: Percentage Voltage drops and rise in maximum demand under Case 4
Inference
An increase in the residential load has a bigger impact on voltage drop in Transformer B than an
increase in electric vehicle load as shown in Table 22.
When simulations were conducted for loads exceeding 12 MW (for both components), there
were many transients present, especially during peak hours and hence, it is preferable to have
load sizes lower than 12 MW (>60%). EV load can be absorbed in a ratio of 2:3 of EV load to
baseline load under 60% baseline load.
In case of higher loading, proportion of electric vehicle load has lesser impact on voltage drop
than residential load.

Study on Impact of Electric Vehicles on the Grid
Forum of Regulators 30
3.6.4. Results for Commercial Feeder
3.6.4.1. Results for Baseline and Scenario 6
The model was simulated with a commercial load of 10 MW and subsequently an electric vehicle load of 4
MW (40 kW rated capacity charger – Fast charger) was added. On simulating the commercial load, the
following results were observed:
Parameters Case 1 Case 2
Voltage (V) 553.58 553.21
Current x10^4 (A) 1.6 1.58
Maximum Demand (MW) 8.86 8.74
Table 23: Maximum Voltage, current and demand experienced by transformer for Baseline Scenario
Parameters Case 1 + EV Case 2+ EV
Voltage (V) 550.03 549.54
Current x10^4 (A) 2.195 1.95
Maximum Demand (MW) 12.07 10.72
Drop in Voltage (V) 0.64% 0.66%
Increase in Max. Demand (MW) 3.22, 36% 1.98, 23%
Table 24: Maximum Voltage, current and demand experienced by transformer after addition of EV load (fast
charging) under Scenario 6
Inference
The voltage drop increases marginally for Scenario 6 in case 1 and case 2 respectively.
There is a considerable increase in current drawn from the transformer, although the voltage
variation is not drastic.
3.6.4.2. Results for Scenario 7 and Scenario 8 (slow charging)
In this scenario, the power rating of the charger was reduced to 6.6 kW, simiar to case 4 under the
residential section.
Parameters Scenario 7 Scenario 8
Voltage (V) 550.13 550.13
Current x10^4 (A) 1.61 1.61
Maximum Demand (MW) 8.855 8.855
Drop in Voltage (V) 0.56% 0.56%
Increase in Max. Demand (MW, %) 0.11, 1.31% 0.11, 1.31%
Table 25: Maximum Voltage, current and demand experienced by transformer after addition of EV load (slow
charging) under Scenario 7 and 8

Study on Impact of Electric Vehicles on the Grid
Forum of Regulators 31
Inference
On reducing the rated power of the chargers, the peak power exerted onto the transformer
reduces.
The voltage drop experienced by the transformer is around 0.5%, when compared to the
baseline.
The transformer does not experience any transients for all scenarios.
As expected, the impact of EV on the transformer is more discernible with fast charging.
3.7 Conclusions and Recommendations
The 20 MVA transformer can be expected to handle the addition of an electric vehicle load up to
8MW with a baseline load of 10 MW in a residential feeder as shown by Case 2 and Case 3.
For a constant residential load of 10 MW, the voltage drop ranges from 1.5% to 2.2%. Allowed
variation as per the conditions of supply for low voltage is +6% to -6%.
Voltage Drop Case 1 (without impedance)
Case 2 (with impedance)
Baseline 0% 0%
Scenario 1 1.70% 1.60%
Scenario 2 2.20% 2.00%
Scenario 3 2.20% 1.80%
Scenario 4 1.70% 1.50%
Table 26: Voltage drops across scenarios compared to the baseline scenario (Case 1 and Case 2)
Beyond 90% as vindicated by peak transformer loading under Scenario 5, transients occur and it
is recommended to lower the exposure of a transformer to long transient periods.
For the assumed input conditions, under Case 4 a safe operating zone as highlighted in green is
recommended.
Voltage Drop
Residential Load -> 4 8 12
Elec
tric
V
ehic
le
Load
(M
W) 4 1.036% 0.465% 2.374%
8 1.196% 1.913% 5.043%
12 2.323% 3.672% 8.688%
16 3.130% 5.304% 12.669%
Table 27: Voltage drops for each scenario under Case 4, Residential feeder
In case, when a new transformer system is being set up for an upcoming residential area, the
transformer can be safely loaded with a split of 60%-40% for electric vehicle and residential
loads respectively.
If individual electric vehicle and residential load sizes are lower than 50% of the transformer
capacity, then a split of 50%-50% from electric vehicles and residential buildings can be
connected to the transformer.
However, as observed from the peak coincident scenario with a 50% baseline load any load below
3 MW (around 20%) would not lead to a change in voltage by over 6%.
For a commercial feeder, with a baseline load of 50% an additional 20% of EV load can be safely
added.
Study on Impact of Electric Vehicles on the Grid
Forum of Regulators 32
Slow charging does not have any adverse impact on the transformers for both the feeders
3.8 Limitations of the simulations
Although, much effort has been made to cover every aspect associated with the impact that the EVs can
have on the local distribution network, the model has following limitations:
This model is designed on an existing Matlab model, making it a rigid model, with little room for
flexibility or changes. Several simulations failed when radical changes were made and hence left little
room for flexibility.
Assumption and other values considered are approximate estimates and it is recommended a detailed
study on the transformer loading profile be done by relevant authorities before integrating electric
vehicles.
The instantaneous load on the transformer or high residential load could be different from a real case
scenario. The unsystematic nature of these influencing variables compounds to the difficulty in
quantifying the accurate load demand exerted by electric vehicles on the grid.
The distances assumed while computing the inductance and resistance of lines would vary from a real
case scenario.

Study on Impact of Electric Vehicles on the Grid
Forum of Regulators 33
Chapter 4: Legal Aspects and Possible Business Models
EV charging business essentially involves the use of electricity. Hence, the purview of the Electricity Act,
2003 (The Act) needs to be evaluated to understand if the EV charging business would be governed by
provisions of The Act. Following propositions need to be considered in this regard:
i. Is the activity of EV charging covered in the definition of “electricity” in Sec.2(23)?
“(23) "electricity" means electrical energy-
(a) generated, transmitted, supplied or traded for any purpose; or
(b) used for any purpose except the transmission of a message;”
Conclusion drawn: This implies that the EV charging activity qualifies as sale of electricity
ii. Would setting up of EV charging infrastructure deemed to be “electricity system as defined. in Sec 2(20), (25) & (40), produced below and who should control this “electricity system”?
“(20) "electric line" means any line which is used for carrying electricity for any purpose and includes
(a) any support for any such line, that is to say, any structure, tower, pole or other thing in, on, by or from which any such line is, or may be, supported, carried or suspended; and
(b) any apparatus connected to any such line for the purpose of carrying electricity;”
“(25) "electricity system” means a system under the control of a generating company or licensee, as the case may be, having one or more -
(a) generating stations; or
(b) transmission lines; or
(c) electric lines and sub-stations;
and when used in the context”
“(40) “ line” means any wire, cable, tube, pipe, insulator, conductor or other similar thing (including its casing or coating) which is designed or adapted for use in carrying electricity and includes any line which surrounds or supports, or is surrounded or supported by or is installed in close proximity to, or is supported, carried or suspended in association with, any such line;”
Conclusion drawn: This implies that the EV charging infrastructure qualifies as “electricity line”
or “electricity system”
iii. Would EV charging stations fall within the definition of “works” as defined in Sec 2(77)
“works includes electric line, and any building, plant, machinery, apparatus and any other thing of whatever description required to transmit, distribute or supply electricity to the public and to carry into effect the objects of a license or sanction granted under this Act or any other law for the time being in force.”
Conclusion drawn: EV charging stations are used to “supply electricity to the public”. As such, the
EV charging stations would fall under the definition of “works”

Study on Impact of Electric Vehicles on the Grid
Forum of Regulators 34
iv. Does this activity of providing EV charging services, entail “Supply” as defined under Section 2(70) of The Act?
“Supply”, in relation to Electricity means the sale of Electricity to the licensee or consumer;
Conclusion drawn: EV charging would qualify as “resale” or “sale of electricity”. As such, this
would get included under the definition of “supply”
v. Would electric vehicles be treated as consumers as defined under Section 2(15) and would electric vehicle charging station fall within the meaning of “premises” or “structure” as defined under Section 2(51) or fall within the enlarged inclusive scope of the words “includes”?
“(15) "consumer" means any person who is supplied with electricity for his own use by a licensee or the Government or by any other person engaged in the business of supplying electricity to the public under this Act or any other law for the time being in force and includes any person whose premises are for the time being connected for the purpose of receiving electricity with the works of a licensee, the Government or such other person, as the case may be;”
“premises” includes any land, building or structure.
Conclusion drawn: EVs are supplied electricity for their own use; EVs get connected to the grid
for the purspose of receiving electricity, which qualify the EVs as “consumers”
vi. Would the charging station fall within the meaning of “Distribution system” as in Section 2 (19)? “(19) "distribution system" means the system of wires and associated facilities between the delivery points on the transmission lines or the generating station connection and the point of connection to the installation of the consumers;”
Conclusion drawn: As EVs are defined as consumers drawing electricity from the network, the EV
charging stations qualify as “distribution system”
vii. Can the charging station receive electricity in bulk at single point from the distribution licensee, and thereafter engage in the activity of supplying electricity to vehicle owners? Would this amount to “sub-distribution”?
Conclusion drawn: The MoP Rules only allow sub-distribution for Co-operative Group Housing
Societies. As the EV Charging Stations are not a part of sub-distribution for Co-operative Group
Housing Societies and distribution of electricity is a licensed activity, the charging infrastructure
needs to be an authorized activity by a licensee or to be carried out by the incumbent licensee
viii. Can EV charging stations be treated as open access consumers and Can the activity of supplying electricity to vehicle owners be done by a “franchisee” as defined in Sec 2(27)?
“(27) “franchisee means a person authorised by a distribution licensee to distribute electricity on its behalf in a particular area within his area of supply;”
Conclusion drawn: Any arrangement within the perview of the meaning of a “franchisee” would
be allowed.

Study on Impact of Electric Vehicles on the Grid
Forum of Regulators 35
Summary of conclusions:
i. Evaluation of the above propositions, within the context of The Act, suggests that provision of EV
charging service to EV users/drivers entails supply of electricity and hence would fall within the ambit
of electricity distribution which is a licensed activity and hence, within the jurisdiction of the
distribution utility.
ii. Through appropriate amendments in the The Act, the resale of electricity by any intermediary EV
charging infrastructure operators can be allowed. Such amendments would need additions of specific
provisos in licensing conditions.
iii. In the interim, within current ambit of The Act, following business models are possible:
a. Distribution licensee-owned EV charging infrastructure
b. Distribution licensee franchised EV charging infrastructure including public-private partnerships
c. Privately-owned battery swapping stations
As a part of this study, Draft Franchisee Agreement to be signed between the distribution licensee and
third parties was developed and included as Annexure V.
Details of business models that can be undertaken by various entities are given in figure 5.
Figure 5: Business models for EV charging infrastructure
Supply of electricity to vehicle owners would be part of the activities of the Distribution Licensee
Distribution Licensee-owned EV charging
infrastructure
The retail supply tariff for supplying to the electric vehicle owners will be determined by the SERC
Utility can authorize a third party (Franchisee) to install and/or operate charging stations on its behalf in its area of supply. The franchisee can also be a public private partnership (PPP)
Distribution Licensee franchised EV charging
infrastructure Charging stations can receive electricity at a single point as bulk supply. The single point supply tariff as
well as the tariff cap for retail sale will be determined by the SERC
Franchisee can be allowed to purchase power through open access without applying Cross Subsidy Surcharge
Utility, its distribution franchisee or any other third party can aggregate the demand for batteries and set up battery swapping stations
Privately-owned battery swapping stations
Battery swapping will not amount to electricty resale and hence third parties can set up the stations with intimation to the Distribution Licensee to avail special category tariff.
The Charging Station can receive electricity in bulk at single point from a distribution licensee or through open access to charge the batteries, as per provisions of the Act
The bulk supply tariff/single point supply tariff will be determined by the SERC

Study on Impact of Electric Vehicles on the Grid
Forum of Regulators 36
The pros and cons of the above mentioned models is given in the following table:
Table 28: Pros and Cons of the suggested business models
Investor O&M Responsibility
Risks Scalability Tariff Structure
Financial support accessibility
Ability to adopt new technology
Distribution licensee-owned EV charging infrastructure
Distribution licensees
Distribution Licensee could opt to appoint a third party operator
None, as they are passed on to the consumers
Low SERC will set tariffs (variable)
Low Low
Distribution licensee franchised EV charging infrastructure including public-private partnership
Franchisee Franchisee Franchisee Medium Pre-agreed tariff cap
High High
Privately-owned battery swapping stations
Third Party / Private player
Third party /private investors and operators
Third Party / Private player
Medium
With or Without Pre-agreed tariff cap
High; can attract private equity or partner with battery manufacturers for support
High

Study on Impact of Electric Vehicles on the Grid
Forum of Regulators 37
Chapter 5: Economic Impact Assessment of EVs
Infrastructure created to facilitate the EVs can be set up in two ways: (1) Direct investment by the
distribution licensees and (2) Investement by the appointed franchisees of the distribution licensees. The
third scenario described in Chapter 4 relates to an aggregator model.
This Chapter details the impact of investments made in the above-mentioned models and is organised in
the following manner: details the tariff-setting philosophy and the methodology used, Section 5.2 details
the scenarios and all the assumptions used in the current analysis, Section 5.3 reports the results from
the model runs and the tariff impacts; and lastly, Section 5.4 shows possible tariffs related to a few
DISCOMs with a special EV charging tariff.
5.1 Tariff setting principles
Based on the study of available regulations on the process for tariff-setting, it is clear that as the
investments are expected to be made by distribution licensees, Multi-year Tariff Regulations relevant to
distribution licensees need to be used as guiding principles. MERC MYT Regulations 2015 have been used
here, for the purpose of determining the tariff impact. As per the regulations, the tariffs are determined
for two separate businesses – one for the wires business and the other for retail supply business. Tariff
impact calculated here pertains to the wires business of a distribution licensee as this investment pertains
to creating EV charging infrastructure. Specific guiding financial principles used in our analysis are listed
below.
Debt: equity ratio is assumed as 70:30
As per the regulations, capital costs considered for calculations include expenditure incurred during
the construction and financing charges associated during the construction. In case any financial
support is received for the project, the same shall be excluded from the capital cost to determine the
debt: equity ratio. As such, any incentive offered either by the Department of Heavy Industries or by
Ministry of Power would be deducted in the calculations. However, the current analysis assumes no
incentives by DHI or MOP and the capital costs are considered as the cost of the EV infrastructure.
Return on equity related to wires business of the distribution licensee is considered as 15.5%
Depreciation value base is taken on the entire original capital cost; depreciated at 5.28% using
straight line method up to 70% of the value base; thereafter, remaining value is depreciated at equal
rate spread over remaining useful life (15 years is assumed as the useful life of the charger)
Repayment of loan is- considered from the first year of commercial operation and is equal to the
annual depreciation allowed.
As per the regulations, interest on loan shall be the weighted average rate of interest computed on
the basis of actual loan portfolio of the Discom; no moratorium is allowed. The calculations in this
report include value base and interest rate structure only for EV charging infrastructure investments.
Interest on working capital is recommended in the Regulations at base rate + 150 basis points. The
working capital is calculated as operation and maintenance expenses for one month, maintenance
spares at 1% of the Goss Fixed Assets and one-and-a-half months of expected revenue for use of
distribution wires at prevailing tariff. Working capital has not been reckoned in this analysis.
As per regulations, components for ARR include the following a) O&M expenses, b) Depreciation, c)
Interest of loan capital, d) Interest of working capital, e) Interest of deposits from consumers and

Study on Impact of Electric Vehicles on the Grid
Forum of Regulators 38
distribution system users, f) Provision for bad and doubtful debts, g) Contribution to contingency
reserves, h) Return of equity capital, i) Income tax minus j) not tariff income and k) Income from
other businesses. The analysis includes items at a), b) and c) as indicated above.
Tariffs are calculated as a summation of the following:
Wheeling charges related to investments in the EV charging infrastructure (incremental)
Current (or existing) wheeling charges
Energy charges
Cross subsidy surcharge in case of open access
5.2 Scenarios presented and corresponding assumptions
For public charging infrastructure28, it is assumed that Level 2 and DC fast chargers would be installed in
public places while Level 1 would be used for domestic installations only. Hence, tariff impact assessment
is carried out for investment in Level 2 and DC fast chargers. The investment in Public Charging
Infrastructure is assessed under two scenarios.
National Electric Mobility Mission Plan (NEMMP) 2020 targets – NEMMP proposes around 5
million BEVs by 2020. NEMMP targets talk about a range of EV saturation. The analysis uses the
bounds of the numbers as “Low growth” and “High growth” options.
NEMMP+ (Aggressive targets beyond NEMMP-2020) – assumes an aggressive growth in electric
public transportation modes specifically buses, in line with the stated objective of Ministry of
Power. Similar to the NEMMP scenario, two possibilities identified as “Low growth” and “High
growth” are used. This scenario assumes high growth in buses and target is considered as 10% of
the existing bus fleet replacement by electric buses in the high growth option.
5.2.1. NEMMP scenario
Table 29 below summarizes the vehicle stock according to the NEMMP document.
Table 29: Vehicle stock as per NEMMP-2020 document
Category Vehicle Stock Source
Low Growth High Growth
4 Wheelers 1,70,000 3,20,000 Table #29 at page
number 133 of NEMMP
2020 document
2 Wheelers 48,00,000 48,00,000
Buses 300 700
3 Wheelers 20,000 30,000
Light Commercial Vehicles 30,000 50,000
Low growth and High growth sum up to 5 million and 5.2 million vehicles. It is worth noting
predominance of 2-wheelers in the Low and High growth scenarios. The analysis presented in the
subsequent sections does not include investments in charging infrastructure for 2-wheelers and
28
The charging infrastructure broadly includes level 1 terminals, level 2 terminals (fast chargers) and level 3 terminals (rapid chargers). The typical time taken for charging by these chargers is 6-8 hours, 3-4 hours and less than 30 minutes respectively. (page number 108 of NEMMP 2020 document)
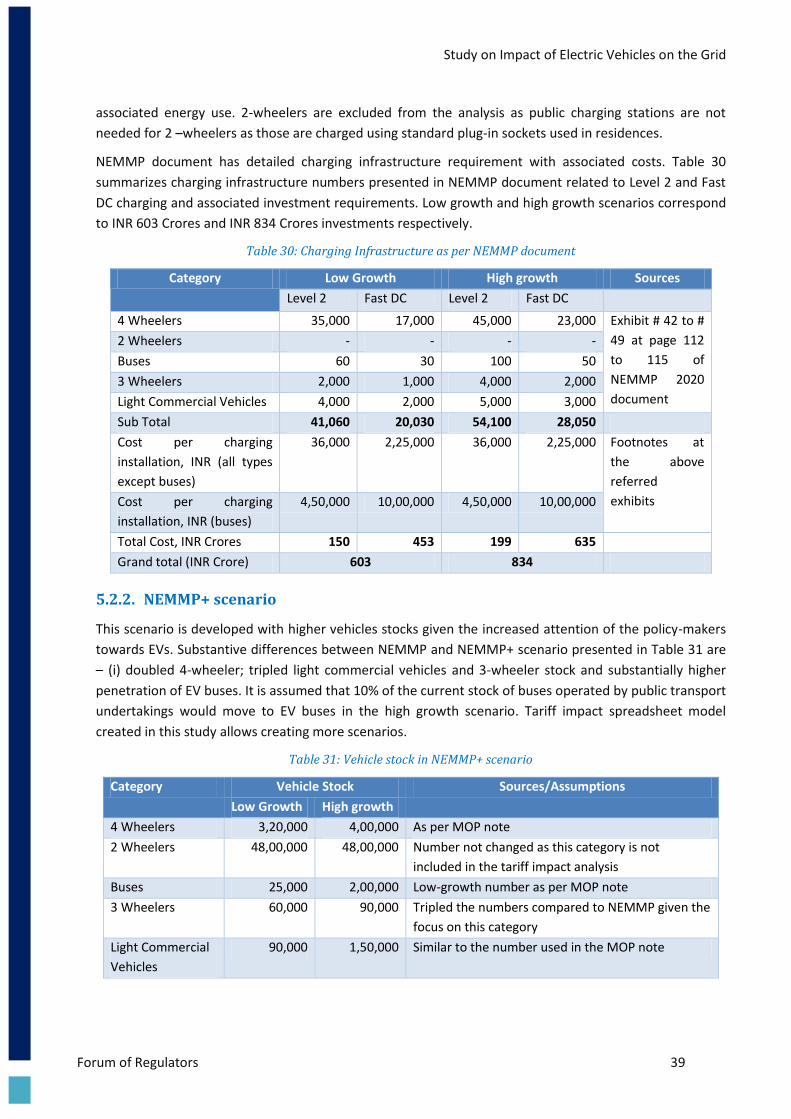
Study on Impact of Electric Vehicles on the Grid
Forum of Regulators 39
associated energy use. 2-wheelers are excluded from the analysis as public charging stations are not
needed for 2 –wheelers as those are charged using standard plug-in sockets used in residences.
NEMMP document has detailed charging infrastructure requirement with associated costs. Table 30
summarizes charging infrastructure numbers presented in NEMMP document related to Level 2 and Fast
DC charging and associated investment requirements. Low growth and high growth scenarios correspond
to INR 603 Crores and INR 834 Crores investments respectively.
Table 30: Charging Infrastructure as per NEMMP document
Category Low Growth High growth Sources
Level 2 Fast DC Level 2 Fast DC
4 Wheelers 35,000 17,000 45,000 23,000 Exhibit # 42 to #
49 at page 112
to 115 of
NEMMP 2020
document
2 Wheelers - - - -
Buses 60 30 100 50
3 Wheelers 2,000 1,000 4,000 2,000
Light Commercial Vehicles 4,000 2,000 5,000 3,000
Sub Total 41,060 20,030 54,100 28,050
Cost per charging
installation, INR (all types
except buses)
36,000 2,25,000 36,000 2,25,000 Footnotes at
the above
referred
exhibits Cost per charging
installation, INR (buses)
4,50,000 10,00,000 4,50,000 10,00,000
Total Cost, INR Crores 150 453 199 635
Grand total (INR Crore) 603 834
5.2.2. NEMMP+ scenario
This scenario is developed with higher vehicles stocks given the increased attention of the policy-makers
towards EVs. Substantive differences between NEMMP and NEMMP+ scenario presented in Table 31 are
– (i) doubled 4-wheeler; tripled light commercial vehicles and 3-wheeler stock and substantially higher
penetration of EV buses. It is assumed that 10% of the current stock of buses operated by public transport
undertakings would move to EV buses in the high growth scenario. Tariff impact spreadsheet model
created in this study allows creating more scenarios.
Table 31: Vehicle stock in NEMMP+ scenario
Category Vehicle Stock Sources/Assumptions
Low Growth High growth
4 Wheelers 3,20,000 4,00,000 As per MOP note
2 Wheelers 48,00,000 48,00,000 Number not changed as this category is not
included in the tariff impact analysis
Buses 25,000 2,00,000 Low-growth number as per MOP note
3 Wheelers 60,000 90,000 Tripled the numbers compared to NEMMP given the
focus on this category
Light Commercial
Vehicles
90,000 1,50,000 Similar to the number used in the MOP note

Study on Impact of Electric Vehicles on the Grid
Forum of Regulators 40
Notes: MOP draft document shared with CERC includes the following numbers: 400,000 for 4-wheelers including
taxicabs, 25,00 buses (considered here in the low-growth scenario). Numbers for LCV and 3-wheelers are similar to
the assumption made in this scenario.
Table 32 presents EV charging infrastructure investment numbers based on assumptions related number
of EV charging stations needed for specified stocks. Number of charging stations assumed in this analysis
are extrapolated from the baseline NEMMP scenario.
Table 32: Charging Infrastructure required for NEMMP + scenario
Category Low Growth High growth Sources
Level 2 Fast DC Level 2 Fast DC
4 Wheelers 45,000 23,000 56,250 28,750 Calculations
described in the
Notes section
2 Wheelers - - - -
Buses 5,000 2,500 40,000 20,000
3 Wheelers 6,000 3,000 9,000 4,500
Light Commercial Vehicles 12,000 6,000 20,000 10,000
Sub Total 68,000 34,500 1,25,250 63,250
Cost per charging
installation, INR (all types
except buses)
36,000 2,00,000 36,000 2,00,000 Target costs by
industry players
Cost per charging
installation, INR (buses)
2,50,000 6,00,000 2,50,000 6,00,000
Total Cost, INR Crores 352 790 1,307 2,065
Grand total (INR Crore) 1,142 3,372
Notes:
For the Low growth scenario, ratio of chargers to the number of vehicles in the respective categories are used to
come up with new number of chargers.
For High growth scenario, percentage increase in the vehicle stock compared to the low growth scenario times the
number of charges in the respective categories has been used
Projected investment is around INR 1,100 Crores and INR 3,400 Crores in the Low and High growth
scenarios respectively.
5.3 Tariff impact results for NEMMP and NEMMP+ scenarios
As described at the beginning of section 5.1, tariff impact analysis is carried out with stated procedures in
the MYT Regulations. One key component of tariff impact analysis is the energy use values. Energy
consumption by EVs is calculated using energy use numbers presented in the FAME guidelines included in
March 2015 office memorandum of the DHI. Table 33 and Table 34 report the energy use numbers
related to the NEMMP and NEMMP+ scenarios respectively29.
29
More details can be found in Annexure VI

Study on Impact of Electric Vehicles on the Grid
Forum of Regulators 41
Table 33: Annual electricity consumption from vehicle stock using public infrastructure under NEMMP
Category Average Distance
Travelled, km#
Electricity
consumption,
kWh/100km^
Electricity
consumption,
kWh/100km
Annual energy consumption,
MkWh (MUs)
Low Growth High growth
4 Wheelers 40,000 36 0.36 2,448 4,608
2 Wheelers 8,000 8 0.08 3,072 3,072
Buses 50,000 175 1.75 26 61
3 Wheelers 25,000 15 0.15 75 113
Light Commercial
Vehicles
30,000 36 0.36 324 540
Total with 2-wheelers 5,945 8,394
Total without 2-wheelers 2,873 5,322
Notes: #Average distance travelled are assumed based on interviews with the market players except for 4-wheelers. 4-
wheelers' distance travelled number is assumed as a weighted average of the numbers mentioned in the MOP
note. These numbers are 150 km/day for taxis and 50 km/day for other 4-wheelers. Weighted average works
out to be 120 kms/day, which is multiplied by 330 days/year of travel ^Electricity consumption numbers are from Office Memorandum of Department of Heavy Industries dated 26
March 2015 (highest number of the range of values are considered here)
Table 34: Annual electricity consumption from vehicle stock using public infrastructure under NEMMP+
Category Average Distance
Travelled, km#
Electricity
consumption,
kWh/100km^
Electricity
consumption,
kWh/100km
Annual energy consumption,
MkWh (MUs)
Low Growth High growth
4 Wheelers 40,000 36 0.36 4,608 5,760
2 Wheelers 8,000 8 0.08 3,072 3,072
Buses 50,000 175 1.75 2,188 17,500
3 Wheelers 25,000 15 0.15 225 338
Light Commercial
Vehicles
30,000 36 0.36 972 1,620
Total with 2-wheelers 11,065 28,290
Total without 2-wheelers 7,993 25,218
Notes: #Average distance travelled are assumed based on interviews with the market players except for 4-wheelers. 4-
wheelers' distance travelled number is assumed as a weighted average of the numbers mentioned in the MOP
note. These numbers are 150 km/day for taxis and 50 km/day for other 4-wheelers. Weighted average works
out to be 120 kms/day, which is multiplied by 330 days/year of travel ^Electricity consumption numbers are from Office Memorandum of Department of Heavy Industries dated 26
March 2015 (highest number of the range of values are considered here)
It is clear that the energy-use in the NEMMP scenario; 3 billion units and 5 billion units for Low and high
growth stocks except for 2-wheelers respectively; increases substantially to approximately 8 billion units
and 25 billion units in case of NEMMP+ scenario. These numbers correspond to 0.5% of national energy
consumption (approximately 1 trillion kWh) in case of NEMMP scenario and 2.5% in case of NEMMP+
scenario.
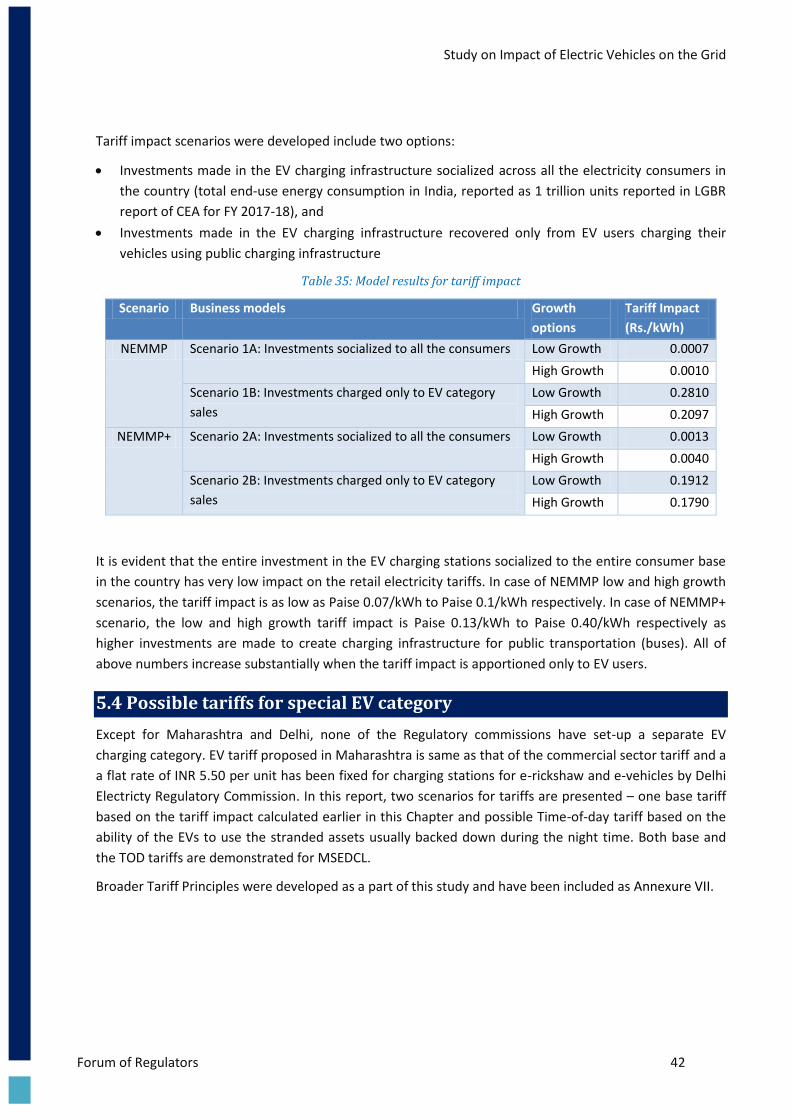
Study on Impact of Electric Vehicles on the Grid
Forum of Regulators 42
Tariff impact scenarios were developed include two options:
Investments made in the EV charging infrastructure socialized across all the electricity consumers in
the country (total end-use energy consumption in India, reported as 1 trillion units reported in LGBR
report of CEA for FY 2017-18), and
Investments made in the EV charging infrastructure recovered only from EV users charging their
vehicles using public charging infrastructure
Table 35: Model results for tariff impact
Scenario Business models Growth
options
Tariff Impact
(Rs./kWh)
NEMMP Scenario 1A: Investments socialized to all the consumers Low Growth 0.0007
High Growth 0.0010
Scenario 1B: Investments charged only to EV category
sales
Low Growth 0.2810
High Growth 0.2097
NEMMP+ Scenario 2A: Investments socialized to all the consumers Low Growth 0.0013
High Growth 0.0040
Scenario 2B: Investments charged only to EV category
sales
Low Growth 0.1912
High Growth 0.1790
It is evident that the entire investment in the EV charging stations socialized to the entire consumer base
in the country has very low impact on the retail electricity tariffs. In case of NEMMP low and high growth
scenarios, the tariff impact is as low as Paise 0.07/kWh to Paise 0.1/kWh respectively. In case of NEMMP+
scenario, the low and high growth tariff impact is Paise 0.13/kWh to Paise 0.40/kWh respectively as
higher investments are made to create charging infrastructure for public transportation (buses). All of
above numbers increase substantially when the tariff impact is apportioned only to EV users.
5.4 Possible tariffs for special EV category
Except for Maharashtra and Delhi, none of the Regulatory commissions have set-up a separate EV
charging category. EV tariff proposed in Maharashtra is same as that of the commercial sector tariff and a
a flat rate of INR 5.50 per unit has been fixed for charging stations for e-rickshaw and e-vehicles by Delhi
Electricty Regulatory Commission. In this report, two scenarios for tariffs are presented – one base tariff
based on the tariff impact calculated earlier in this Chapter and possible Time-of-day tariff based on the
ability of the EVs to use the stranded assets usually backed down during the night time. Both base and
the TOD tariffs are demonstrated for MSEDCL.
Broader Tariff Principles were developed as a part of this study and have been included as Annexure VII.

Study on Impact of Electric Vehicles on the Grid
Forum of Regulators 43
5.4.1. Base tariffs
Table 36: Base Tariff for the EV category for MSEDCL as an example
# Component Category NEMMP NEMMP+
Highest
incremental
charges
socialized
across
all consumers
Highest
incremental
charges with only
EV consumers
paying the
charges
Highest
incremental
charges
socialized
across
all consumers
Highest
incremental
charges with only
EV consumers
paying the
charges
1 Tariff impact as incremental
wheeling charges, INR/kWh
0.001 0.281 0.004 0.191
2a Current
approved
wheeling
charges,
INR/kWh
HT 0.58 0.58 0.58 0.58
2b LT 1.18 1.18 1.18 1.18
3a
Weighted
average Energy
Charges,
INR/kWh
HT-PWW 5.6 5.6 5.6 5.6
3b HT-other
public
services
9 9 9 9
3c LT-PWW 4.44 4.44 4.44 4.44
3d LT-other
public
services
7.29 7.29 7.29 7.29
4 ACoS, INR/kWh 6.36 6.36 6.36 6.36
5a Total charges at
par with PWW,
INR/kWh
(=1+2a+3a)
HT-PWW 6.18 6.46 6.18 6.37
5b Total charges at
par with other
services,
INR/kWh
(=1+2a+3b)
HT-other
public
services
9.58 9.86 9.58 9.77
5c Total charges at
par with PWW,
INR/kWh
(=1+2b+3c)
LT-PWW 5.62 5.90 5.62 5.81
5d Total charges at
par with other
services,
INR/kWh
(=1+2b+3d)
LT-other
public
services
8.47 8.75 8.47 8.66
6 Total charges at ACoS, INR/kWh
(=1+4)
6.36 6.64 6.36 6.55

Study on Impact of Electric Vehicles on the Grid
Forum of Regulators 44
5.4.2. Time-of-Day (TOD) structures
Primary rationale for proposing TOD structure for EV charging is that most generation assets in the
country are backed-down during the night lean period. EVs can utilize stranded assets, resulting in
capitalizing fixed charges paid by the distribution licensees to generators. TOD structure takes in to
account the following parameters:
Backed down capacity
Cost per MW paid for the backed-down capacity
Table 37: Stranded assets and fixed costs for MSEDCL
Unit FY 2016-17 Source
Back Down capacity (A) MW 6,379 MSEDCL MYT order (case 48 of 2016) Capacity Charges related to
Back down (B) INR Crore 3,988
Capacity charges per MW (B*10/A)
INR Crore/ MW 0.625
Penalty paid by the distribution licensee can be equated with the TOD incentives that can be offered to
the special ctagory tariff. Table 38 shows calculations pertaining to MSEDCL and also proposes the
maximum TOD incentive that can be offered based utilization of stranded assets and costs thereof.
Table 38: Computation of ToD incentives corresponding to usage of stranded assets for MSEDCL
NEMMP NEMMP+
Electricty consumed by EVs in MSEDCL area MUs 532 2521.75
Capacity utilization factor % 100% 100%
Annual hours* hours 3650 3650
Maximum stranded capacity that can be utilised MW 145.80 690.89
Total incentive to be offered to the EVs INR Crore 91.15 431.93
Maximum ToD incentives INR/kWh 1.71 1.71 Note: It is assumed that the investment and infrastructure in MSEDCL would 10% of the national level
Assuming night time charging period to be of 10 hours30
30
Refer to Annexure VI

Study on Impact of Electric Vehicles on the Grid
Forum of Regulators 45
Chapter 6: Charging standards and Regulatory Provisions for
Grid Interconnection
EV charging infrastructure gets connected to the grid through specific interconnection points either at the
HT or LT levels. We studied the current interconnection norms that exist in India. The Indian Electricity
Grid Code defines specifics of such interconnections detailed below.
6.1. Indian Electricity Grid Code
The Indian Electricity Grid Code (IEGC) describes the philosophy and responsibilities of planning and
operating of Indian power system specified by the Central Electricity Regulatory Commission in
accordance with sub section 1(h) of Section 79 of the Act. The IEGC mainly deals with Rules, Regulations,
Guidelines and Standards to be followed by participants in the system to plan, maintain and operate the
Power system in the most secure, economic and efficient manner, while facilitating healthy competition
in Generation and Supply of electricity. IEGC basically brings together single set of Technical and
Commercial Rules, encompassing all utilities connected to or using the Inter - State Transmission System
(ISTS). The IEGC also includes functioning of NLDC, RLDCs, SLDCs and optimal maintenance planning of
Generation/ Transmission facilities in the Grid. Scope of IEGC covers all users, SLDC, RLDC, NLDC, CEA,
CTU, STU, Licenses, RPCs and Power Exchanges (major players in the Generation and Transmission
business)
Even the Grid voltage limits (stated at Para 5.2S) of the IEGC indicate that all users, SLDC, RLDC, NLDC,
CTU, STUs shall take all possible measures to ensure that Grid Voltage always remains within a given
range (operating limits) for each voltage level.
Since EV charging is a load on the distribution system no modifications in IEGC (which basically covers
Regulations for ISGS, ISTS and Load Despatch Stations etc.) is envisaged.
Our analysis shows that no specific modification in the IEGC are needed for EV charging.
6.2. Charging Standards
The Automotive Research Association of India (ARAI) has published the draft EV charging standards which
heavily adapts from IEC and IS standards for EV Charging systems. The key features of the two standards
are given below:
a) AIS 138 (Part 1): Electric vehicle conductive AC charging system
o For charging electric road vehicles at standard AC supply voltages (as per IS 12360/IEC
60038) up to 1000 V and for providing electrical power for any additional services on the
vehicle if required when connected to the supply network.
o Applicable for
AC Slow Charging (230 V, 1 Phase, 15 A Outlet with connector IEC 60309)
AC Fast Charging (415 V, 3 Phase, 63 A Outlet with connector IEC 62196)
o Operation within the range of ±10 % of the standard nominal voltage as per IS 12360 and
within 50 Hz ± 3% range of frequency
o Grid Communication protocol has not been finalized

Study on Impact of Electric Vehicles on the Grid
Forum of Regulators 46
o The charging system shall be designed to limit the introduction of harmonic, DC and non-
sinusoidal currents
o EVSE Classification AC Slow A, B, C with Max. load of 1 kW, 2.2. kW, 3.3 kW and AC Fast
A, B, C, D with Max. load of10 kW, 12 kW, 23 kW and 45 kW respectively. AC Fast Class B,
C, D would need prior permission from the utility for installation
b) AIS 138 (Part 2): Electric vehicle conductive DC charging system
o The harmonic limits for the input current of the EVSE - DC, with no load connected, shall
be in accordance with IEC 61000-3-2.
o Conducted disturbances emitted at the input of the EVSE - DC, with a resistive load at its
rated output power, shall be less than the amplitude of the level defined in the standard
The Department of Heavy Industries has also released its report for public comments on standardization
of public EV chargers on 15 May 2017. The report specifies the classification and provides detailed
specifications for AC and DC public chargers.
6.3. BIS Standards
In order to standardize the EV charging standards in the country, the Bureau of Indian Standards have
constituted an incumbent committee. ETD-51 standards are being set-up under the Chairmanship of an
expert from the Department of Science & Technology. ETD-51 will attempt to finalize the EV Charger
Standards on fast track by the end of calendar year 2017.
6.4. CEA plans
Under the Chairmanship of Member (Planning) - CEA, a electricity storage/battery storage Committee of
Bureau of Indian Standards (BIS, ET 52) has been constituted. In addition to the ET52 process, CEA is
constituting a Standing Committee with representations from Ministry of Transport, Department of
Heavy Industries, Ministry of Urban Development, Director R&R (Ministry of Power), Power utilities,
CERC, POSOCO, NCR-PB, DMRC, TERI and Advisor, MOP/MNRE to draft a framework for developing
Charging Infrastructure. CEA is also exploring a long term approach for the charging arrangements to be
designed for reverse feed into the grid from the electric vehicles. In this case the charged electric vehicles
would be in a position to feed the power supply into the grid.

Study on Impact of Electric Vehicles on the Grid
Forum of Regulators 47
Chapter 7: Conclusions and Way forward
Technology development, fiscal incentives, innovative business models, and supportive policies have led
to growth of Electric Vehicles (EVs) across the world. The Forum of Regulators commissioned a techno-
economic study on the impact of electric vehicles on grid requirements and capacity and necessary
framework to enable implementation thereto.
The following questions have been examined as part of this study:
(1) What are the international best practices for EV integration and promotion?
(2) What has been the role of regulators and distribution distribution licensees in the uptake of EVs?
(3) What would be the impact of EV load on the local distribution system?
(4) What business models can be developed for public charging infrastructure development in the context
of the Electricity Act, 2003?
(5) What would be the tariff impact of a distribution utility’s investment in public charging infrastructure?
7.1. Key findings and Recommendations
7.1.1. Technical impact on the Grid
Matlab simulations carried out in this study to model impact of electric vehicle integration into the
distribution grid suggest no substantial impact on the grid voltages in residential, commercial and mixed
feeders.
It is recommended that CEA notify additional standards for grid connectivity of public charging
infrastructure.
7.1.2. Legal aspects and possible business models
As per provisions of the Electricity Act 2003 and its amendments thereof, the activities of charging of EVs
amounts to supply of electricity. Suitable legal framework and in the interim a clear provision in the
National Electricity Policy and/or Tariff Policy or the Rules would be desirable for enabling smooth
deployment of EV infrastructure.
Three potential business models are proposed:
i. Direct by Discom- Discoms creating EV charging infrastructure through their own investment and
selling electricity to EV owners;
ii. Franchise model- contractual agreement between Discoms and third parties, allowing EV charging
infrastructure to be set-up by third-parties and resale of electricity to EV owners;
iii. Battery swapping stations- aggregation of demand through battery swapping stations.
7.1.3. Commercial aspects- tariff impacts
The study analyzes two primary scenarios
(i) NEMMP targets
(ii) (ii) Incrementing NEMMP targets with heavy emphasis on public transport especially buses,
termed as NEMMP+.

Study on Impact of Electric Vehicles on the Grid
Forum of Regulators 48
i. Based on modelling of tariff impact, if charging infrastructure costs are socialized across the
national electricity use, the impact on per-unit-basis is minimal. Alternatively, if the investment
was to be paid for only by the EV consumers, still the incremental cost (over energy charges) is
not significant.
ii. Time-of-Day (ToD) structure: several generating stations in the country are backed-down during
the night time. Such backed down assets can be utilized for EV charging during the night, which
can improve their PLF.
7.1.4. Policy and Regulatory interventions
Internationally, EVs have received substantial push from national policies and incentives put in place by
the respective Governments. Regulators across North American markets have also allowed utility
investments as tariff pass-through, given the system benefits of EVs.
Government of India had announced the National Electric Mobility Mission Plan 2020 (NEMMP) in 2012,
along with Faster Adoption and Manufacturing of (Hybrid &) Electric Vehicles in India (FAME) guidelines in
2015 to provide incentives to EVs.
Whilst the Regulatory aspects will have to be dealt with by the Appropriate Commission, it would be
advisable for the sake of uniformity and harmony of Regulations to have suitable provisions in the Tariff
Policy or the Rules on the following interventions:
i. Regulators to allow pass through of investments made in EV charging infrastructure by the
distribution licensees in tariffs
ii. Create simplified framework for franchise agreements between the distribution licensees and
private sector/interested Public Sector Undertakings/associations for setting up public charging
infrastructure
iii. Allow distribution licensees to appoint multiple and non-exclusive franchisees within its area of
supply for setting up public charging infrastructure
iv. Create new tariff category for EVs by allowing recovery of incremental cost of infrastructure
through wheeling charges over and above the average cost of service
v. Allow special ToD structure for EV charging infrastructure accounting for use of backed-down
assets in the night time
vi. Allow Open Access to EV charging infrastructure/aggregators. Also allow banking of RE generation
to promote reduced tariffs.
vii. In order to encourage that the demand created by EVs is also met from renewable energy
sources either directly or by way of substitution, appropriate incentive mechanism should be
designed for such consumption.

Study on Impact of Electric Vehicles on the Grid
Forum of Regulators 49
Bibliography
1. Princeton Power Systems. (2014). L.A. Air Force Base EV Charging Stations Case Study. Retrieved
from http://www.princetonpower.com/: http://www.princetonpower.com/pdf-
new/LAAFB_Case_StudyC.pdf
2. Alfred Engler, N. S. (2006). Droop Control in LV Grids. Amsterdam: IEEE.
3. Arima, K. (2015, 12 24). Electric Cars: The Role of Standards in Japan and Abroad. Retrieved from
www.japanindustrynews.com: https://www.japanindustrynews.com/2015/11/electric-cars-role-
of-standards-in-japan-and-abroad/
4. BMW. (2016). BMW Chargeforward. Retrieved from www.bmwchargeforward.com:
https://www.bmwchargeforward.com/
5. Boeriu, H. (2015, 01 5). BMW Announces The BMW i ChargeForward Program. Retrieved from
www.bmwblog.com: http://www.bmwblog.com/2015/01/05/bmw-announces-bmw-
chargeforward-program/
6. California ISO. (2014). Vehicle-Grid Integration (VGI) Roadmap: Enabling vehicle-based grid
services. California.
7. Charged EVs. (2016, 03 14). 6 EV infrastructure lessons we can learn from Norway. Retrieved from
https://chargedevs.com: https://chargedevs.com/features/6-ev-infrastructure-lessons-we-can-
learn-from-norway/
8. China Business Review. (2015, 02 02). Opportunities and Challenges in China’s Electric Vehicle
Market. Retrieved from www.chinabusinessreview.com:
https://www.chinabusinessreview.com/opportunities-and-challenges-in-chinas-electric-vehicle-
market/
9. Concurrent Technologies Corporation. (2015, 03 26). Unveiling of a Plug-In Electric Vehicle-Vehicle
to Grid (PEV-V2G) Fleet at Los Angeles Air Force Base. Retrieved from
https://globenewswire.com: https://globenewswire.com/news-
release/2015/03/26/719178/10126511/en/Unveiling-of-a-Plug-In-Electric-Vehicle-Vehicle-to-
Grid-PEV-V2G-Fleet-at-Los-Angeles-Air-Force-Base.html
10. CRE. (2014, 06 12). Deliberations. Retrieved from www.cre.fr.
11. Cruz-Zambrano, M., Santandreu-Corretgé, A., Mora-Marin, M. R., Cairó-Molins, I., Sumper, A., &
Sudrià-Andreu, A. (2011). Demand Side Management And Electric Vehicle Integration (Verde).
Demand Side Management And Electric Vehicle Integration (Verde) (pp. 1-4). Frankfurt: CIRED.
12. Dallinger, D., Schubert, G., & Wietschel, M. (2012). Integration of intermittent renewable power
supply using grid-connected vehicles: A 2030 case study for California and Germany Working
paper sustainability and innovation. Retrieved from www.econstor.eu:
https://www.econstor.eu/dspace/bitstream/10419/57926/1/715337629.pdf
13. Department of Energy. (2017, 02 22). ABOUT ELECTRIC VEHICLES. Retrieved from Office of Energy
Effficiency and Renewable Energy: https://energy.gov/eere/electricvehicles/about-electric-
vehicles
14. DHI. (2013). National Electric Mobility Mission Plan. Delhi: Department of Heavy Industries.
15. DOE. (2013, 07). EV Project Electric Vehicle Charging Infrastructure Summary Report. Retrieved
from energy.gov:
https://energy.gov/sites/prod/files/2014/02/f8/evproj_infrastructure_q22013_0.pdf

Study on Impact of Electric Vehicles on the Grid
Forum of Regulators 50
16. DOE. (2017, 02 20). EV EVERYWHERE GRAND CHALLENGE BLUEPRINT. Retrieved from
ENERGY.GOV: https://energy.gov/sites/prod/files/2016/05/f31/eveverywhere_blueprint.pdf
17. Elbil. (2017, 02 18). Norwegian EV policy. Retrieved from elbil.no:
http://elbil.no/english/norwegian-ev-policy/
18. Electrek. (2017, 02 18). electrek. Retrieved from Electrek.co:
https://electrek.co/2015/08/10/bmw-is-testing-a-potential-solution-to-the-significant-electricity-
demand-evs-are-expected-to-create/
19. Endesa. (2016, 01 29). Press. Retrieved from https://www.endesa.com/:
https://www.endesa.com/en/press/news/d201601-zem2all-travels-46-million-kilometers-and-
prevents-the-emission-of-330-tn-co2-into-the-atmosphere.html
20. FEPC. (2014). Electricity review Japan. Retrieved from www.fepc.or.jp:
https://www.fepc.or.jp/english/library/electricity_eview_japan/__icsFiles/afieldfile/2014/07/11/
2014ERJ_full.pdf
21. Fitzgerald, G., Nelder, C., & Newcomb, J. (n.d.). Electric Vehciles as Distributed Energy Resources.
Washinsgton DC: Rocky Mountain Insititute.
22. Foosnæs, A. H., Rasmussen, J., Andersen, Claus, A., Gehrke, O., & Isbrandt, G. (2011). GRID CODES
AND REGULATION RELATED TO EVS. Denmark: Edison Consortium.
23. FujisawaSST. (2017, 03 03). Town Services Mobility. Retrieved from http://fujisawasst.com/:
http://fujisawasst.com/EN/service/mobility.html
24. Galvin Power. (2016). Real Time Illinois FAQs. Retrieved from
http://www.galvinpower.org/power-consumers/act/real-time-illinois/faq
25. Ge, S. y., Wanga, L., Liu, H., & Feng, L. (2012). The Impact of Electric Vehicles on the Distribution
Grid. Retrieved from www.atlantis-press.com: www.atlantis-
press.com/php/download_paper.php?id=3630
26. Hall, D., & Lutsey, N. (2017). Literature Review On Power Utility Best Practices Regarding Electric
Vehicles. Washington, DC: International Council on Clean Transportation.
27. Hu, Z., Kim, J.-h., Wang, J., & Byrne, J. (2015). Review of dynamic pricing programs in the U.S. and
Europe: Status quo and policy recommendations. Renewable and Sustainable Energy Reviews, 42,
743-751.
28. HybridCars.com. (2017, 01 17). The World Just Bought Its Two-Millionth Plug-in Car. Retrieved
from http://www.hybridcars.com: http://www.hybridcars.com/the-world-just-bought-its-two-
millionth-plug-in-car/
29. ICCT. (2013, 07). Electric Vehicle Grid Integration in the U.S., Europe, and China: Challenges and
Choices for Electricity and Transportation Policy. Retrieved from http://www.theicct.org:
http://www.theicct.org/sites/default/files/publications/EVpolicies_final_July11.pdf
30. ICCT. (2016, 05). Publications. Retrieved from http://www.theicct.org:
http://www.theicct.org/sites/default/files/publications/ICCT_EVpolicies-Europe-201605.pdf
31. IEA. (2017, 05 23). Hybrid and Electric Vehicle Technology Cooperation Programme. Retrieved
from http://www.ieahev.org/: http://www.ieahev.org/by-country/france-policy-and-legislation/
32. Jeju Government. (2009). News. Retrieved from www.jeju.go.kr:
http://www.jeju.go.kr/news/jeunews/new.htm?act=view&seq=966872
Study on Impact of Electric Vehicles on the Grid
Forum of Regulators 51
33. Lantry, L. (2016, 12 15). CPUC approves EV charging program. Retrieved from sierraclub.org:
http://content.sierraclub.org/press-releases/2016/12/california-public-utilities-commission-
unanimously-approves-electric-vehicle
34. Marnay, C., Chan, T., DeForest, N., Lai, J., MacDonald, J., Stadler, M., . . . Reid, E. (2013). Los
Angeles Air Force Base Vehicle to Grid Pilot Project. California: ERNEST ORLANDO LAWRENCE
BERKELEY NATIONAL LABORATORY.
35. Marquis, C., Zhang, H., & Zhou, L. (2013). China’s Quest to Adopt Electric Vehicles. Stanford:
Stanford Social Innovation Review.
36. METI. (2015, 03 12). Enhancement of the Initiatives Concerning the Promotion of Electric and
Other Vehicles. Retrieved from www.meti.go.jp:
http://www.meti.go.jp/english/press/2015/0312_02.html
37. MoRTH. (2016, 11). Road transport Year Book (2013-14 and 2014-15). Retrieved from
morth.nic.in: http://morth.nic.in/showfile.asp?lid=2495
38. National Academy of Sciences. (2013). Overcoming Barriers to Electric-Vehicle Deployment:
Interim Report. Washington DC: The National Academies Press.
39. Norsk Elbilforening. (2017, 02 22). Retrieved from http://info.nobil.no:
http://info.nobil.no/images/downloads/nobilbrosjyre.pdf
40. Nova Scotia Power. (2016). One Part Real Time Pricing (RTP). Retrieved 08 2016, from
http://www.nspower.ca/en/home/about-us/electricity-rates-and-regulations/rates/one-part-
real-time-pricing.aspx
41. NVE . (2017, 02 20). Norwegian Water Resources and Energy Directorate. Retrieved from
https://www.nve.no/: https://www.nve.no/
42. OECD, IEA. (2010). Energy Technology Perspectives. Paris: OECD/IEA.
43. Pacific Gas and Electric. (2015). PG&E and BMW Partner to Extract Grid Benefits from Electric
Vehicles. Retrieved from PG&E News Releases:
https://www.pge.com/en/about/newsroom/newsdetails/index.page?title=20150105_pge_and_b
mw_partner_to_extract_grid_benefits_from_electric_vehicles
44. Panasonic Corporation. (2014, 11 27). Fujisawa Sustainable Smart Town Goes Into Full-Scale
Operation Near Tokyo. Retrieved from http://news.panasonic.co.uk:
http://news.panasonic.co.uk/pressreleases/fujisawa-sustainable-smart-town-goes-into-full-scale-
operation-near-tokyo-1090848
45. Phillips, L. (2015). Norway’s electric vehicle revolution: Lessons for British Columbia. Pacific
Institute for Climate Solutions (PICS).
46. PR Newswire. (2015, 05 04). Global and China EV Charging Port Equipment Industry Report, 2014-
2015. Retrieved from http://www.prnewswire.com: http://www.prnewswire.com/news-
releases/global-and-china-ev-charging-port-equipment-industry-report-2014-2015-
300076995.html
47. Public Service Board. (2017, 02 21). RENEWABLE ENERGY STANDARD. Retrieved from State of
Vermont Public Service Board: http://psb.vermont.gov/electric/renewable-energy-standard
48. Reuters. (2013, 03 26). France's electric car push presents power grid challenge. Retrieved from
http://www.reuters.com: http://www.reuters.com/article/us-france-cars-electricity-
idUSBRE92P0CZ20130326

Study on Impact of Electric Vehicles on the Grid
Forum of Regulators 52
49. San Diego Gas & Electric. (2014, 04 11). Application of San Diego Gas & Electric Company (U 902-
E) For Authority to Implement A Pilot Program For Electric Vehicle-Grid Integration. Retrieved
from www.sdge.com:
https://www.sdge.com/sites/default/files/regulatory/VGI%20Application_FINAL.pdf
50. Sim, W. (2016, 12 20). Settle down in Fujisawa? What a smart choice. Retrieved from
www.straitstimes.com: http://www.straitstimes.com/asia/east-asia/settle-down-in-fujisawa-
what-a-smart-choice
51. Sioshansi, R. (2012). Modeling the Impacts of Electricity Tariffs on Plug-in Hybrid Electric Vehicle
Charging, Costs, and Emissions. OPERATIONS RESEARCH, 60(2), 1-11.
52. Smith, C., & Kim, H. (2016, 07). Creating the Grid-Connected Car: International Experiencces using
Demand Response with Electric Vehicles. Beijing: Natural Resources Defense Council (NRDC).
Retrieved from www.nrdc.org.
53. Southern California Edison. (2013, 08 6). Southern California Edison’s Key Learnings about Electric
Vehicles, Customers and Grid Reliability. Retrieved from http://newsroom.edison.com:
http://newsroom.edison.com/internal_redirect/cms.ipressroom.com.s3.amazonaws.com/166/fil
es/20136/SCE-EVWhitePaper2013.pdf
54. Southern California Edison. (2016, 05 03). Vehicle-to-Grid Pilot Overview. CPUC / CAISO Joint
Workshop on MULTI-USE APPLICATIONS. Los Angeles, US: U.S. Department of Defense.
55. Tietge, U., Mock, P., Lutsey, N., & Campestrini, A. (2016). Comparison Of Leading Electric Vehicle
Policy And Deployment In Europe. Berlin: International Council on Clean Transportation.
56. UtilityDive. (2016, 11 21). News. Retrieved from www.utilitydive.com:
http://www.utilitydive.com/news/how-california-utility-regulators-are-turning-electric-vehicles-
into-grid-r/430314/
57. VEIC. (2017, 02 22). About us. Retrieved from Drive Electric Vermont :
http://www.driveelectricvt.com/about-us
58. VEIC. (2017, 02 20). Media Room. Retrieved from www.veic.org: https://www.veic.org/media-
room/news/2016/06/02/vehicle-to-grid-electric-school-bus-pilot-project-underway-in-
massachusetts
59. Vergis, S. (2014, January). The Norwegian Electric Vehicle Market: A Technological Innovation
Systems Analysis. California: Institute of Transportation Studies, University of California, Davis.
60. Vergis, S., Turrentine, T. S., Fulton, L., & Fulton, E. (2014). Plug-In Electric Vehicles:A Case Study of
Seven Markets. California: Institute of Transportation Studies University of California, Davis.
61. Wagner, F., Roberts, D., Francfort, J., & White, S. (2016). Drive Electric Vermont Case Study. Idaho:
Idaho National Laboratory.

Study on Impact of Electric Vehicles on the Grid
Forum of Regulators 53
Annexure I: List of Experts Contacted and Questionnaire Used
List of Experts Contacted
S. No. Name Designation Organisation
1 Mr. Gopal Kartik Head – Strategy and Business Planning Mahindra Electric
2 Mr. Ketsu Zhang Regional Director, General Manager of BYD INDIA
BYD, China
3 Geisha J Williams President-Electric Pacific Gas and Electric (PG&E)
4 Christian Stav Chief Executive Officer NTE Energy
5 Hyoungmi Kim Senior Utility and Energy Efficiency Specialist
Natural Resources Defense Council, China
6 Prof. Willett Kempton Professor, School of Marine Science and Policy
University of Delaware
7 Dr. Jasna Tomic Director, Research Programs University of Delaware
8 Dr. Hartmut Schmeck Professor, Institute for Applied Informatics and Formal Description Methods (AIFB)
Karlsruher Institute of Technology
9 Dr. Christopher Cherry Associate Professor, Civil and Environmental Engineering
University of Tennessee
10 Prof. Mukesh Singh Assistant Professor Thapar University
11 Rish Ghatikar Scientist EPRI
12 Chris Marnay Scientist LBNL
13 Doug Houseman VP Technical Innovation Enernex
14 Scott Fischer Director, Market Development EVGo
15 Dr. Ahmad Faruqui Principal The Brattle Group
16 Dr. Jurgen Weiss Principal The Brattle Group
17 Mr. David Roberts Senior Advisor Vermont Energy Investment Corporation

Study on Impact of Electric Vehicles on the Grid
Forum of Regulators 54
Questionnaire – Experience on management of EVs and its impact on the grid
Background
Government of India has formulated a scheme, titled Faster Adoption and Manufacturing of (Hybrid &)
Electric Vehicles in India, under the National Electric Mobility Mission Plan 2020, to encourage the
progressive induction of reliable, affordable and efficient electric and hybrid vehicles. Therefore,
considerable growth is envisaged in the EVs market with greater adoption of EVs in India. It is also
envisaged that greater adoption of EVs in India would have a considerable impact on the electric grid. The
Forum of Regulators (FOR) (constituted by the Government of India in terms of Section 166 (2) of the
Electricity Act, 2003) has thus commissioned a study for a detailed technical and economic assessment of
the impact of electric vehicles on the grid. MP Ensystems is conducting the study on behalf of FOR which
would feed into the model EV regulations for India.
In this regard, we are conducting a detailed review of the pilots and demonstration projects undertaken
worldwide. Being an important stakeholder, we would appreciate if you could share your experiences.
This would help us design and optimal policy for integration of EVs with the grid.
1. General Details of the project (please write about the location, participants, number of vehicles)
2. Technical details (Please specify the technical details of the vehicles used (make, model and type),
software and hardware components used (battery management system, interconnection
requirements),
3. Please describe the distribution system upgrades undertaken?
4. Please describe the communication and protection standards/protocol used?
5. Please describe the Metering and settlement mechanism
6. What was the role of utilities and the regulators?
7. What were the technical challenges faced in the project and the solutions identified/suggested?
8. What were the management challenges encountered and the solutions identified/suggested?
9. What was the total cost associated with the project? (vehicles, infrastructure upgrades,
implementation and other associated costs)
10. Please describe the total system benefits realized?
11. Would you like to share the data on the impact of EVs charging on the local distribution grid
profile?

Study on Impact of Electric Vehicles on the Grid
Forum of Regulators 55
Annexure II. Rate Structure for EV Charging by International
electricty distribution companies
PGE Rate Structure for EV charging
Rate Description Total Energy Rates (USD per kWh)
EV-A (Non-tiered, Time-of-Use)
Single Meter: The price per kilowatt-hour varies depending on the time
Summer Usage: Peak - USD 0.45389, Part Peak -USD 0.24986, Off peak-USD 0.12225 Winter Usage: Peak-USD 0.32018, Part peak-USD 0.19794, Off peak-USD 0.12503
EV-B (Non-tiered, Time-of-Use)
Dual meters: The price for charging varies throughout the day. Your home energy use is measured separately
Summer Usage: Peak - USD 0.44738, Part Peak -USD .24660, Off peak-USD 0.12179 Winter Usage: Peak-USD 0.31325, Part peak-USD 0.19447, Off peak-USD 0.12453
E1 (Tiered) Single meter. Costs are based on three usage tiers
Baseline Usage (USD /kWh) - 0.19979, 101% - 400% of Baseline - 0.27612, High Usage Over 400% of Baseline - 0.40139
Time-of-Use Rate Plan - 3-8 p.m. (ETOU-A)
Single meter. credit for all usage up to your baseline allowance
Summer: Total Usage Peak USD 0.39336 Off-peak - USD 0.31778 Baseline Credit: Peak - USD 0.08830, Off peak - USD 0.08830 Winter: Total Usage Peak - USD 0.27539, Off-peak - USD 0.26109 Baseline Credit: Peak - USD 0.08830, Off peak - USD 0.08830
Time-of-Use Rate Plan - 4-9 p.m. (ETOU-B)
Single meter. Prices are higher in the summer than in the winter
Summer: Peak - USD 0.36335, Off-peak - USD 0.26029 Winter: Peak - USD 0.22588, Off-Peak - USD 0.20708
E6 - (Tiered, Time-of-Use)
Single meter. The price per kilowatt-hour is based on the time and the amount of electricity used
Discontinued now
Peak: 2:00 p.m. to 9:00 p.m Monday through Friday. 3:00 p.m. to 7:00 p.m. Saturday, Sunday and
Holidays. Partial-Peak: 7:00 a.m. to 2:00 p.m. and 9:00 p.m. to 11:00 p.m Monday through Friday, except
holidays. Off-Peak: All other hours. The summer season is May 1 through October 31 and the winter
season is November 1 through April 30

Study on Impact of Electric Vehicles on the Grid
Forum of Regulators 56
SDGE Rate Structure for EV charging
Summer - Electric Vehicle Time-of-Use Rate
EV-TOU
Rate On-Peak Super Off-Peak Off-Peak
Time-of Day Noon - 8:00 PM Midnight – 5:00 AM All other hours
Amount USD 0.49 USD 0.19 USD 0.23
EV-TOU-2
Rate On-Peak Super Off-Peak Off-Peak
Time-of Day Noon - 6:00 PM Midnight – 5:00 AM All other hours
Amount USD 0.49 USD 0.19 USD 0.24
Winter - Electric Vehicle Time-of-Use Rate
EV-TOU
Rate On-Peak Super Off-Peak Off-Peak
Time-of Day Noon - 8:00 PM Midnight – 5:00 AM All other hours
Amount USD 0.23 USD 0.20 USD 0.22
EV-TOU-2
Rate On-Peak Super Off-Peak Off-Peak
Time-of Day Noon - 6:00 PM Midnight – 5:00 AM All other hours
Amount USD 0.23 USD 0.20 USD 0.23
Summer rates are May through October. Winter rates are November through April. Rates valid as of
1/1/17.
SCE Rate Structure for EV charging
For separate EV meter Energy Charge -USD /kWh/Meter/Day
Summer Season - On-Peak 0.16790
Off-Peak 0.09155
Winter Season - On-Peak 0.16790
Off-Peak 0.09155
XCEL Energy EV charging rate
Metering Set-Up Monthly Charge
Off-Peak (9 p.m.– 9 a.m., holidays & weekends)
On-Peak (9:00:01 a.m.– 8:59:59 p.m., weekdays)
Separate Meter for the EV Only USD 4.95
USD 0.033/kWh USD 0.14170/kWh (other months) USD 0.17564/kWh (June–Sept.)

Study on Impact of Electric Vehicles on the Grid
Forum of Regulators 57
Annexure III: Key International Policies Implemented for
Vehicle Grid Integration
Entity Policy Description & Relevance
FERC
Federal Energy Regulatory Commission Order No. 784(Issued July 18, 2013)
Expands FERC 755 pay-for-performance requirements to account for speed and accuracy
Potentially affects payment for VGI services, depending on VGI capabilities
FERC
Federal Energy Regulatory Commission Order No. 792(Issued November 22, 2013)
Adjusts the Small Generator Interconnection Procedures (SGIP) and Small Generator Interconnection Agreement (SGIA) for generating facilities no larger than 20 MW
Will shape interconnection associated with storage devices
ISO/IEC
Standard ISO/IEC 15118(Stage 60.60: International Standard published as ofApril 16, 2013)
Creates a global standardization of communication interface
Will likely shape VGI enabling technologies
SAE Standard SAE J1772 (Most recent revision is October 15, 2012)
Establishes a recommended practice for EVSE
Will likely shape VGI enabling technologies
CPUC
Assembly Bill (AB) 2514 and CPUC Storage Proceeding Docket No. R. 10-12-007
Sets targets for the procurement of storage
States that EV capacity can contribute to the storage procurement targets
Potentially creates demand for VGI services, depending on how VGI compares to other options
CPUC Resource Adequacy (RA) Proceeding
Guides the resource procurement process and promotes infrastructure investment by requiring LSEs to provide capacity as needed by California ISO
Potentially influences demand for VGI services, depending on VGI capability to meet RA needs.
CPUC Demand Response (DR) Proceedings Docket No. R.07-01-041
Reviews and analyses demand response to assess its potential role in meeting the state’s energy needs
Potentially serves as a platform for clarifying rules about how EV may participate in DR
CPUC Rule 24 DR Direct Participation
Determines how customers might “directly participate” in, or bid services directly into, the wholesale market.
Potentially influences the process by which VGI services can offer wholesale market services.
CPUC
Rule 21 Interconnection and Net-metering (Docket No. R.11-09-011)
Describes the interconnection, operating and metering requirements for generation facilities of various sizes to be connected to a utility’s distribution system, over which the CPUC has jurisdiction.
May influence the interconnection requirements around VGI, where two-way power flows are possible
CPUC Wholesale Distribution Access Tariff (Docket No. ER11-2977-000)
Defines the tariffs architecture of energy transfer between California ISO and utilities or customers
Guides a portion of VGI payment processes
CPUC EV Proceedings Addresses barriers to widespread EV adoption, on which the VGI
market is dependent

Study on Impact of Electric Vehicles on the Grid
Forum of Regulators 58
Entity Policy Description & Relevance
Promotes communication among EV stakeholders, including those involved in VGI
Addresses EV sub-metering issues, which could influence VGI payment processes
Smart Grid Proceeding (Docket No. R.08-12-009)
Establishes standards, protocols, and policies which will affect Smart Grid
programs and strategies, such as VGI
CPUC framework for Vehicle grid integration
CPUC has developed a framework for Vehicle to grid integration (California ISO, 2014). CPUC has defined
four Regulatory issues in EV integration as:
1) Identifying the resource and determining at which point grid services are measured;
2) Determining what entities may aggregate the resources and interact with the wholesale markets;
3) Determining how to capture distribution system benefits, monetize those benefits, and distribute them
to the various actors; and
4) Determining the primacy among the potential VGI activities.
The framework for policy creation developed by CPUC in various scenarios are given below.
Proposed framework for developing VGI supportive regulations
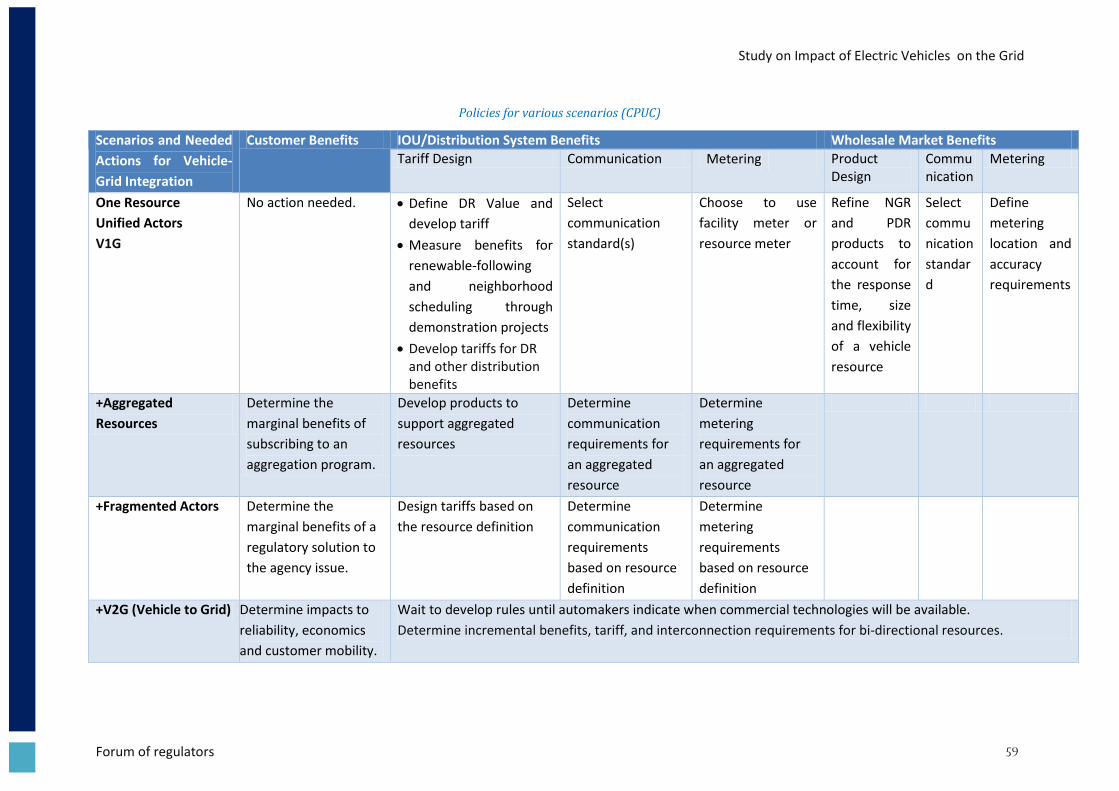
Study on Impact of Electric Vehicles on the Grid
Forum of regulators 59
Policies for various scenarios (CPUC)
Scenarios and Needed
Actions for Vehicle-
Grid Integration
Customer Benefits IOU/Distribution System Benefits Wholesale Market Benefits
Tariff Design Communication Metering
Product Design
Communication
Metering
One Resource
Unified Actors
V1G
No action needed.
Define DR Value and
develop tariff
Measure benefits for
renewable-following
and neighborhood
scheduling through
demonstration projects
Develop tariffs for DR and other distribution benefits
Select
communication
standard(s)
Choose to use
facility meter or
resource meter
Refine NGR
and PDR
products to
account for
the response
time, size
and flexibility
of a vehicle
resource
Select
commu
nication
standar
d
Define
metering
location and
accuracy
requirements
+Aggregated
Resources
Determine the
marginal benefits of
subscribing to an
aggregation program.
Develop products to
support aggregated
resources
Determine
communication
requirements for
an aggregated
resource
Determine
metering
requirements for
an aggregated
resource
+Fragmented Actors Determine the
marginal benefits of a
regulatory solution to
the agency issue.
Design tariffs based on
the resource definition
Determine
communication
requirements
based on resource
definition
Determine
metering
requirements
based on resource
definition
+V2G (Vehicle to Grid) Determine impacts to
reliability, economics
and customer mobility.
Wait to develop rules until automakers indicate when commercial technologies will be available.
Determine incremental benefits, tariff, and interconnection requirements for bi-directional resources.

Study on Impact of Electric Vehicles on the Grid
Forum of regulators 60
Annexure IV: Technical Simulation Results
Simulation for a residential feeder
All the figures given show the changes in the voltage (graph1), current (graph 2), apparent power (graph
3), true power (graph 4) and reactive power (graph 5). The focus is primarily focused on graphs 1 and 2
(voltage and current). This simulation is done to establish a baseline scenario.
As discussed, impedance model is considered as a short high voltage 3 phase system, for which there
would be considerable resistances and inductances, due to inherent properties. The resistance and
inductance of the grid oppose the flow of electricity in the system. On increasing the impedance of the
model, the variations in the transformers is assessed.
The impedance in the model is given by
Where
Z: Line Impedance
R: Resistance of the line
X: Per phase Inductance of the line
Standard values for different voltage systems
Type R (Ω/km) X(Ω/km)
Low Voltage 0.642 0.083
Medium Voltage 0.161 0.190
High Voltage 0.06 0.191
The values were obtained from a research paper that focuses on grid control in low voltage grids.
(Alfred Engler, 2006). The inductance of the line can be obtained by correlating the frequency and
the per phase inductance as shown below:
(
)
Where,
L: Inductance
𝞈: Angular frequency (~ 2*π*f)
f: system frequency (60 Hz)

Study on Impact of Electric Vehicles on the Grid
Forum of regulators 61
Baseline Residential Profile
Residential Load with Impedance

Study on Impact of Electric Vehicles on the Grid
Forum of regulators 62
Results for a residential transformer with EV load
Transformer with residential and EV load with impedance

Study on Impact of Electric Vehicles on the Grid
Forum of regulators 63
Results for Scenario 1, Case 1
Results for Scenario 1, Case 2

Study on Impact of Electric Vehicles on the Grid
Forum of regulators 64
Results of Scenario 2, Case 1
Results for Scenario 2, Case 2

Study on Impact of Electric Vehicles on the Grid
Forum of regulators 65
Results for Scenario 3, Case 1
Results for Scenario 3, Case 2

Study on Impact of Electric Vehicles on the Grid
Forum of regulators 66
Results for Scenario 4, Case 1
Results for Scenario 4, Case 2

Study on Impact of Electric Vehicles on the Grid
Forum of regulators 67
Results for Scenario 5, Case 2
Results for Case 3

Study on Impact of Electric Vehicles on the Grid
Forum of regulators 68
Results for 4 MW of Electric Vehicles with 4 MW of residential load
Results for 4 MW of Electric Vehicles with 8 MW of residential load
Results for 4 MW of Electric Vehicles with 12 MW of residential load

Study on Impact of Electric Vehicles on the Grid
Forum of regulators 69
Results for 8 MW of Electric Vehicles with 4 MW of residential load
Results for 8 MW of Electric Vehicles with 8 MW of residential load

Study on Impact of Electric Vehicles on the Grid
Forum of regulators 70
Results for 8 MW of Electric Vehicles with 12 MW of residential load
Results for 12 MW of Electric Vehicles with 4 MW of residential load

Study on Impact of Electric Vehicles on the Grid
Forum of regulators 71
Results for 12 MW of Electric Vehicles with 8 MW of residential load
Results for 12 MW of Electric Vehicles with 12 MW of residential load

Study on Impact of Electric Vehicles on the Grid
Forum of regulators 72
Results for 16 MW of Electric Vehicles with 4 MW of residential load
Results for 16 MW of Electric Vehicles with 8 MW of residential load

Study on Impact of Electric Vehicles on the Grid
Forum of regulators 73
Results for 16 MW of Electric Vehicles with 12 MW of residential load
Results for 20 MW of Electric Vehicles with 4 MW of residential load

Study on Impact of Electric Vehicles on the Grid
Forum of regulators 74
Results for 20 MW of Electric Vehicles with 8 MW of residential load
Results for 20 MW of Electric Vehicles with 12 MW of residential load

Study on Impact of Electric Vehicles on the Grid
Forum of regulators 75
Results for Case 4
Simulation results for Case 4 Scenario 1
Simulation results for Case 4 Scenario 2

Study on Impact of Electric Vehicles on the Grid
Forum of regulators 76
Simulation results for Case 4 Scenario 3
Simulation results for Case 4 Scenario 4

Study on Impact of Electric Vehicles on the Grid
Forum of regulators 77
Simulation results for Commercial feeder
Results observed for baseline commercial load
Result for commercial load (Impedance)

Study on Impact of Electric Vehicles on the Grid
Forum of regulators 78
Results for commercial integrated with EV load
Results for Commercial Load with EV load (Impedance)

Study on Impact of Electric Vehicles on the Grid
Forum of regulators 79
Annexure V: Draft Franchisee Agreement for setting up EV
Charging Infrascructure
[Draft Model Template]
This AGREEMENT entered into on this ________day of _________Two Thousand _____________
between________________________________________ having its registered office at
_______________________ (herein after referred to as Distribution Licensee which expression shall
unless repugnant to the context or meaning thereof include its successors and permitted assigns) as
party of the First part,
And
______________________________________ having its registered office at __________________
(herein after referred to as Franchisee (Electric Vehicles Charging Infrastructure) which expression
shall unless repugnant to the context or meaning thereof include its successors and permitted
assigns) as party of the
Second part.
Whereas the Ministry of Power, Government of India has stated an objective of supporting electric
vehicles offtake by consumers and to enable such a process has advised the Distribution Licensees to
create Electric Vehicles Charging Infrastructure on their own or by creating franchisees.
NOW, THEREFORE, IN VIEW OF THE FOREGOING PREMISES AND IN CONSIDERATION OF THE
MUTUAL COVENANTS AND CONDITIONS HEREIN SET FORTH, BOTH PARTIES HEREBY AGREE AS
FOLLOWS:
1. DEFINITION OF TERMS
For the purpose of this Franchise Agreement, and all Exhibits attached hereto, the following
terms, phrases, and their derivations shall have the meanings given below unless the context
clearly mandates a different interpretation. Where the context so indicates, the present
tense shall imply the future tense, words in plural include the singular, and words in the
singular include the plural. The word "shall" is always mandatory and not merely directory.
The definitions are applicable regardless of whether the term is capitalized.
Study on Impact of Electric Vehicles on the Grid
Forum of regulators 80
1.1 "Act/Statutory provisions" means application of its provisions and amendments if any
thereto and /or Rules, Guidelines, Circulars, Instructions issued there under by the
Government of India/ State Government.
1.2 "Annual Accounts" means the accounts of the franchised business prepared by the
Franchisee in the manner as may be prescribed by the Distribution Licensee.
1.3 "Complaint" means any written or electronic correspondence expressing dissatisfaction with
the products, services, or customer service of the Franchisee.
1.4 "Distribution" means the supply and conveyance of electricity by means of distribution
system.
1.5 "Distribution system" means the system of wires and associated facilities, which facilitates
connection to the point of connection of the installation of the consumer.
1.6 "Distribution system operating standards" means the standards related to the franchisee
operation of its distribution system as provided by the Distribution Licensee to the
Franchisee.
1.7 "Document" or "Records" means written or graphic materials, however produced or
reproduced, or any other tangible permanent record, including records maintained by
computer or other electronic or digital means, maintained by the Franchisee in the ordinary
course of conducting its business.
1.8 "Electric Vehicles Charging Infrastructure” or “EVCI” means provision of adequate
infrastructure that is created by the Franchisee for supply of electricity at retail tariff
prescribed from time to time in the Tariff Orders issued by State Electricity Regulatory
Commissions and “Electric Vehicles Charging Infrastructure Operator” means “EVCI
Operator”
1.9 "Franchise" means the right granted by the Distribution Licensee to operate and maintain
the Electric Vehicles Charging Infrastructure within the franchise area as embodied in this
agreement for providing power supply to the consumers within the franchise area.
1.10 "Franchise Agreement" or "Agreement" means this contract and any amendments, exhibits
or appendices hereto.
1.11 "Franchisee" means a person or an agency or a company authorised by the distribution
licensee to set-up Electric Vehicles Charging Infrastructure on its behalf within area of supply
of the distribution company; hereinafter Franchisee also refers to Electric Vehicles Charging
Infrastructure Operator means the _______ (Name of Project Developer) who shall develop
and operate Electric Vehicles Charging Infrastructure. Distribution Licensee reserves the
right to appoint multiple and non-exclusive Franchisees within its area of supply.

Study on Impact of Electric Vehicles on the Grid
Forum of regulators 81
1.12 "Franchised Business" means the Authorized business of the Electric Vehicles Charging
Infrastructure Operator for selling of electricity in the franchise area for the purposes of
charging electric vehicles.
1.13 "Gross Revenues" means all revenue derived directly or indirectly by the Electric Vehicles
Charging Infrastructure Operator.
1.14 "Major Incident" means as incident associated with the Generation, Distribution and Retail
Supply of electricity in the Franchise Area which results in a significant interruption of
service, substantial damage to equipment, or loss of life or significant injury to human beings
and shall include any other incident which the Distribution Licensee expressly declares to be
a major incident.
1.15 “Normal operating conditions” means service conditions within the control of Electric
Vehicles Charging Infrastructure Operator. Those conditions that are not within the control
of Electric Vehicles Charging Infrastructure Operator include, but not limited to, natural
disasters, civil disturbances, power outages, telephone network outages, and severe or
unusual weather conditions as detailed under Section 12.3
1.16 “Project Area” means specific area rented, leased or owned by the Electric Vehicles
Charging Infrastructure Operator; at which location the electricity is proposed to be sold to
the Electric Vehicles owners.
1.17 "Public Rights‐of‐Way" means the surface, the air space above the surface, and the area
below the surface of any public street, highway, lane, path, alley, sidewalk, bridge, tunnel,
parkway, waterway, easement, or similar property within the franchise area, which,
consistent with the purposes for which it was dedicated, may be used for the purpose of
installing and maintaining the System. No reference herein to a "Public Right‐of‐Way" shall
be deemed to be a representation or guarantee by the Distribution Licensee that its interest
or other right to control the use of such property is sufficient to permit its use for such
purposes, and Electric Vehicles Charging Infrastructure Operator shall be deemed to gain
only those rights to use as are properly in the Distribution Licensee and as the Distribution
Licensee may have the right and power to give.
1.18 "System Outage" means electricity supply Interruption.
2. GRANT OF FRANCHISE
2.1 Grant of Franchise
Study on Impact of Electric Vehicles on the Grid
Forum of regulators 82
Subject to the terms and conditions of this Agreement and the Electricity Act, 2003, the
Distribution Licensee hereby agrees that the Electric Vehicles Charging Infrastructure
Operator may sell electricity to the Electric Vehicles Owners/Operators and also operate and
maintain the electricity distribution system within the boundary area of the Electric Vehicles
Charging Infrastructure, for the purpose of providing electricity to Electric Vehicles
Owners/Operators. The Electric Vehicles Charging Infrastructure Operator shall operate as
an agency and in no case shall be treated as a "Licensee". The Licensee reserves the right to
appoint multiple franchisees to develop EV charging infrastructure within its Licence area.
2.2 Development of Infrastructure and its ownership:
The Electric Vehicles Charging Infrastructure Operator shall be permitted to develop
electricity distribution infrastructure required for the purposes of charging electric vehicles.
Electric Vehicles Charging Infrastructure Operator shall develop the infrastructure at its own
cost and shall be the owner of the electricity distribution infrastructure within the franchise
area created by them through their own resources in the course of its operation only for the
purposes of electric vehicles charging.
2.3 Source of Power:
The source of power to the Electric Vehicles Charging Infrastructure Operator shall be the
grid, sourced directly at a bulk supply tariff from the Distribution licensee or through Open
Access following norms set-out for those purposes separately.
2.4 Location of Electric Vehicles Charging Infrastructure:
The location of Electric Vehicles Charging Infrastructure shall be within the license area of
the distribution licensee defined under Project Area.
2.5 Duration of Franchise:
The term of this Franchise, and all rights, privileges, obligations, and restrictions pertaining
thereto, shall be up to the life of the Electric Vehicles Charging Infrastructure as determined
by the State Electricity Regulatory Commission or until the end of rent or lease or ownership
of the Project Area, whichever is earlier, from the effective date of this Franchise.
2.6 Effective Date:
The Effective Date of this Franchise shall be (indicate date), subject to approval by the
Distribution Licensee and its acceptance by the Electric Vehicles Charging Infrastructure
Operator, provided that if the Electric Vehicles Charging Infrastructure Operator fails to
accept the Franchise in writing within thirty (30) days following the communication of
written approval by the Distribution Licensee in this regard, it shall be deemed to be

Study on Impact of Electric Vehicles on the Grid
Forum of regulators 83
accepted by Electric Vehicles Charging Infrastructure Operator in line with its application
filed for seeking grant of Franchise.
2.7 Effect of Acceptance:
By accepting the Franchise and executing this Franchise Agreement, the Electric Vehicles
Charging Infrastructure Operator:
(A) Accepts and agrees to comply with each applicable provision of this Agreement and,
subject to relevant provisions of the Electricity Act, 2003;
(B) Agrees that it would not oppose intervention by the Distribution Licensee in the
interest of effective power supply system in other parts of the license area.
2.8 The Electric Vehicles Charging Infrastructure Operator shall comply with the Regulations,
Orders and Directions issued by the Distribution Licensee/SERC time to time and shall also
act, at all times, in accordance with the terms and conditions of this Agreement.
2.9 It is the intent of both the parties that each party shall enjoy all rights and be subject to all
obligations of this Franchise Agreement for the entire term of the Franchise and to the
extent any provisions have continuing effect, after its expiration.
3. ACTIVITIES OF THE ELECTRIC VEHICLES CHARGING INFRASTRUCTURE OPERATOR
3.1 The Electric Vehicles Charging Infrastructure Operator shall be responsible for activity
related to charging vehicles in the Franchise area.
3.2 The Electric Vehicles Charging Infrastructure Operator shall have to install and operate
charging infrastructure to supply of electricity to Electric Vehicles users.
3.3 The Electric Vehicles Charging Infrastructure Operator shall have to develop electricity
distribution infrastructure in the Franchise area at its own expenses.
Provided that Electric Vehicles Charging Infrastructure Operator shall comply with
performance standards for development of distribution infrastructure.
3.4 The Electric Vehicles Charging Infrastructure Operator shall be allowed to procure power
through open access provided that it complies with applicable Open Access Regulations.
3.5 The Electric Vehicles Charging Infrastructure Operator shall be responsible for all kinds of
electricity billing related activity in franchise area like electricity metering, meter reading,
electricity billing and bill collection.
3.5 The Electric Vehicles Charging Infrastructure Operator shall not, without the general or
special approval of the Distribution Licensee:

Study on Impact of Electric Vehicles on the Grid
Forum of regulators 84
(A) Resell electricity to any Consumers or otherwise for any purposes other than electric
vehicles; or
(B) purchase or otherwise acquire electricity for distribution except in accordance with
this Agreement and on the tariffs and terms and conditions as may be approved by
the Distribution Licensee; or
(C) undertake any transaction to acquire, by purchase or takeover or otherwise, the
Distribution Licensee of any other Supplier; or
(D) merge with any other entity; or
(E) transfer – by sale, lease, exchange or otherwise – the infrastructure assets of the
Distribution Licensee, either in whole or any part thereof; or
(F) enter into any agreement or arrangement with any other person to get any part of
the franchised business undertaken (with the exception of Co‐operative), provided
that any such agreement or arrangement shall be subject to the terms and
conditions of this Agreement including such other terms and conditions that may be
imposed by the Distribution Licensee; Further provided that the Electric Vehicles
Charging Infrastructure Operator shall continue to have the overall responsibility for
the due performance, by such other person and a breach of any of the terms and
conditions of this Agreement by such other person shall be deemed to be a breach
by the Electric Vehicles Charging Infrastructure Operator.
4. TECHNICAL CONDITIONS
4.1 Power Distribution:
(A) The Electric Vehicles Charging Infrastructure Operator shall always ensure supply of
electrical energy to the Consumers
4.2 Compliance with Standards:
(A) The Electric Vehicles Charging Infrastructure Operator shall take all reasonable steps
to ensure that all Consumers within the franchise area receive a safe, economical
and reliable supply of electricity as defined in the Standards specified by the
concerned SERC.
(B) The Electric Vehicles Charging Infrastructure Operator shall plan and operate the
Distribution System to ensure that, subject to the availability of adequate power of
appropriate quality, the Distribution System is capable of providing Consumers with
a safe, reliable and efficient Supply of electricity.

Study on Impact of Electric Vehicles on the Grid
Forum of regulators 85
(C) The Electric Vehicles Charging Infrastructure Operator shall undertake that adequate
arrangements for supply of electricity in the franchise area in consultation and co‐
ordination with the Distribution Licensee.
4.3 Security Standards, Distribution System Operating Standards, Overall Performance
Standards:
(A) The Electric Vehicles Charging Infrastructure Operator shall comply with the same
practices which are followed by the Distribution Licensee with such modifications as
may be permitted by the Distribution Licensee with regard to Security Standards and
Distribution System Operating Standards until any new Security Standards and
Distribution System Operating Standards are proposed by the Distribution Licensee
(B) If the Electric Vehicles Charging Infrastructure Operator fails to meet the Standards
specified by the Distribution Licensee, without prejudice to any penalty that may be
imposed or prosecution initiated, the Electric Vehicles Charging Infrastructure
Operator shall be liable to pay such compensation to the person affected as may be
determined by the Distribution Licensee, after allowing the Electric Vehicles
Charging Infrastructure Operator a reasonable opportunity of being heard.
(C) The Electric Vehicles Charging Infrastructure Operator shall conduct its franchised
business in the manner which it considers to be best calculated to achieve the
Overall Performance Standards in connection with provision of Supply services and
the promotion of the efficient use of electricity by Consumers, as may be prescribed
by the Distribution Licensee pursuant to the Electricity Act, 2003.
4.4 Consumer Service:
(A) Electricity Supply Code:
The Electric Vehicles Charging Infrastructure Operator shall
(i) Comply with the relevant provisions of the Electricity Supply Code (as may
be applicable for Electric Vehicles Charging Infrastructure) as approved by
the relevant SERC.
(ii) Bring to the notice of the Consumers the existence of the Supply Code (and
conditions of supply), including its substantive revision and their right to
inspect or obtain a copy in its latest form;
(iii) Make available a copy of the Code (and conditions of supply) revised from
time to time, for inspection by the public during normal working hours; and

Study on Impact of Electric Vehicles on the Grid
Forum of regulators 86
(iv) Provide free of charge a copy of the Code (and conditions of supply) as
revised from time to time to each new Consumer and to any other person
who requests it at a price not exceeding the cost of duplicating it.
(B) Consumer Complaint Handling Procedure:
The Electric Vehicles Charging Infrastructure Operator shall comply with the
Complaint Handling Procedure (as may be applicable for Electric Vehicles Charging
Infrastructure) approved by the Distribution Licensee/SERC. The Electric Vehicles
Charging Infrastructure Operator shall:
(i) Make available, on demand, a copy of the Complaint Handling Procedure,
revised from time to time, for inspection by the public at each of the
relevant premises during normal working hours; and
(ii) provide free of charge a copy of the Procedure revised from time to time to
each new Consumer, and to any other person who requests for it at a price
not exceeding the cost of duplicating it.
(C) Consumer’s Right to Information:
The Electric Vehicles Charging Infrastructure Operator, on request of the consumer,
to the extent that is reasonably available to the Electric Vehicles Charging
Infrastructure Operator, shall provide:
(i) Information on all services provided by the Electric Vehicles Charging
Infrastructure Operator including information on the charges, which may be
available to the consumers;
(ii) Information on meter readings for the electricity services provided to the
consumer by the Electric Vehicles Charging Infrastructure Operator; and
(iii) Information on the status of the consumer’s account with the Electric
Vehicles Charging Infrastructure Operator
(D) Consumer Rights‐Discrimination Prohibited:
All the Tariff rates and charges for the consumers in Project Area shall be as
applicable to the other consumers of Distribution Licensee belonging to similar
consumer categories and should be non-discriminatory. Electric Vehicles Charging
Infrastructure Operator shall establish similar rates and charges for all Consumers
receiving similar services, regardless of race, colour, religion, age, sex, marital or
economic status, sexual orientation and creed.

Study on Impact of Electric Vehicles on the Grid
Forum of regulators 87
4.5 Provision of Information to the Distribution Licensee:
(A) The Electric Vehicles Charging Infrastructure Operator shall furnish to the
Distribution Licensee without any delay such information, documents and details
related to the Generation and Distribution Business of the Electric Vehicles Charging
Infrastructure Operator, as the Distribution Licensee may require for its own
purposes.
(B) The Distribution Licensee may, at anytime during the subsistence of this Agreement,
authorize any Person(s) to inspect, verify and audit the performance, records and
accounts of the Electric Vehicles Charging Infrastructure Operator and the Electric
Vehicles Charging Infrastructure Operator shall be obliged to extend all cooperation,
assistance and facilities, as may be required, to such authorized Person(s).
(C) The Electric Vehicles Charging Infrastructure Operator shall notify the Distribution
Licensee of any Major Incident affecting any part of the Distribution System that has
occurred and shall at the earliest possible and in any event, by no later than 15 days
or such period as may be extended by the Distribution licensee from the date of
such Major Incident. The Electric Vehicles Charging Infrastructure Operator shall also
submit a report to the Distribution Licensee giving full details of the facts within the
knowledge of the Electric Vehicles Charging Infrastructure Operator regarding the
incident and its cause.
(D) The decision of the Distribution Licensee as to what is a Major Incident shall be final.
(E) The Distribution Licensee at its own discretion may require the submission of a
report on any incident or incidents to be prepared by an independent Person at the
expense of the Electric Vehicles Charging Infrastructure Operator to be included as
an expense in the determination of aggregate revenues made in accordance with
Section 5 of this Agreement.
4.6 Obligation to Connect Consumers:
(A) Subject to the other provisions of this Agreement, the Electric Vehicles Charging
Infrastructure Operator shall have the following obligations:
(i) Subject to the provisions of Electricity Act, 2003, the Electric Vehicles
Charging Infrastructure Operator shall, based on a desire by the Consumer,
give the necessary permission to the Consumers.
(ii) It shall be the duty of the Electric Vehicles Charging Infrastructure Operator
to provide, if required, requisite accessories or electric plant or electric line
for giving electric supply to the Consumers specified in sub‐clause (i) above,
Provided that no person shall be entitled to demand, or to continue to
Study on Impact of Electric Vehicles on the Grid
Forum of regulators 88
receive, from the Electric Vehicles Charging Infrastructure Operator a supply
of electricity unless he has agreed to pay to the Electric Vehicles Charging
Infrastructure Operator such price as may be determined by the Distribution
Licensee for the portion beyond the point of electricity access as defined
under Section 1.9.
(D) Subject to the provisions of the Electricity Act, 2003 and such conditions as may be
specified by the Distribution Licensee under section 4.5 of this Agreement, the
Electric Vehicles Charging Infrastructure Operator may refuse to supply, or may
disconnect the supply of electricity to any Consumer.
4.7 Obligation to Supply and Power Supply Planning Standards:
(A) The Electric Vehicles Charging Infrastructure Operator shall take all necessary steps
to ensure that all Consumers connected to the Electric Vehicles Charging
Infrastructure Operator’s Distribution System receive a safe, economical and reliable
Supply of electricity as provided in the performance standards referred to in this
Agreement, the Consumer Rights Statement and the Complaint Handling
Procedures, except where:
(i) the Electric Vehicles Charging Infrastructure Operator discontinues Supply to
certain Consumers under the relevant provisions of the Electricity Laws for
the reason of neglect or refusal to pay the charges due from the Consumer
to the Electric Vehicles Charging Infrastructure Operator or in accordance
with the Regulations contemplated under Section 4.5; or
(ii) the Electric Vehicles Charging Infrastructure Operator regulates the Supply
to Consumers as may be directed by the Distribution Licensee.
5. CONSUMER TARIFF
5.1 Consumer Tariff Determination:
Consumer Tariff applicable for the consumers of the Electric Vehicles Charging Infrastructure
Operator shall be same as applicable to the specific category of consumers of Distribution
Licensee covered under a special category of tariffs relevant to electric vehicles charging,
which includes base tariff same as Average Cost to Supply and a cap set-out in the Tariff
Orders, which shall include provisioning for investments, depreciation, debt servicing,
depreciation, Operation and Maintenance expenses and Return on Equity; or as specified by
the SERC from time-to-time. The cross subsidy surcharge for the consumers of EV Charging
infrastructure shall be waived off, should the power is procured through open access.
The Electric Vehicles Charging Infrastructure Operator shall be responsible to bill and collect
the revenue from consumers and shall also be allowed to retain the revenue from the
Study on Impact of Electric Vehicles on the Grid
Forum of regulators 89
Consumers, subject to any adjustment against any amount payable by the Distribution
Licensee to Electric Vehicles Charging Infrastructure Operator.
5.2 Powers of Electric Vehicles Charging Infrastructure Operator:
For Revenue Realization, Meter Tampering etc. Subject to the provision of the Electricity
Laws and the Rules framed there under and the applicable Regulations, the Electric Vehicles
Charging Infrastructure Operator shall have the power and authority, on behalf of the
Distribution Licensee, to take appropriate actions for:
(i) Metering at the point of supply of electricity;
(ii) Electricity billing and bill collection;
(iii) Revenue realization;
(iv) Prosecution for theft – of power; equipment or appliance;
(v) Prevention of meter tampering;
(vi) Prevention of diversion of electricity, and
(vii) Prevention of the unauthorized use of electricity;
(viii) Damage to public property; and
(ix) All such similar matters affecting electricity distribution.
6. TERMINATION AND BUY OUT
6.1 Termination:
This Franchisee Agreement shall automatically stand terminated in case the Electric Vehicles
Charging Infrastructure Operator fails to service the consumers or fails to comply with the
supply standards covered under Clause 4.7.
6.2 Buy Out:
Upon termination of Franchisee Agreement, the Distribution Licensee will acquire the
distribution infrastructure developed by the Electric Vehicles Charging Infrastructure
Operator and compensate Electric Vehicles Charging Infrastructure Operator at the
prevalent book value of the asset or reassign the Franchise to other entity desirous of
Electric Vehicles Charging Infrastructure Franchisee business.

Study on Impact of Electric Vehicles on the Grid
Forum of regulators 90
7. INSURANCE
7.1 Insurance:
(A) The Electric Vehicles Charging Infrastructure Operator shall maintain in full force and
effect, at its own cost and expense, during the term of the Franchise, the insurance
for the value as may be indicated by the Distribution Licensee based on the
depreciated cost of the electrical infrastructure.
(B) Such insurance shall be non‐cancellable except upon thirty (30) days prior written
notice to the Distribution Licensee. If the insurance is cancelled or materially altered
so as to be out of compliance with the requirements of this section within the term
of this Franchise, Electric Vehicles Charging Infrastructure Operator shall provide a
replacement policy. Electric Vehicles Charging Infrastructure Operator shall maintain
continuous uninterrupted insurance coverage, in at least the amounts required, for
the duration of this Franchise.
8. AUDIT AND ACCOUNTS
8.1 Audit:
Electric Vehicles Charging Infrastructure Operator will allow for yearly audit of assets and
inventories within the Franchise Area by Distribution Licensee.
Electric Vehicles Charging Infrastructure Operator shall allow yearly audit of the billing data
& bill collection data including the system and database and consumer service centre’s
operated within the scope of the Franchise Area.
Electric Vehicles Charging Infrastructure Operator shall also comply with all reporting
formats and data requirements prescribed by the Auditors.
8.2 Accounts:
(A) The financial year of the Electric Vehicles Charging Infrastructure Operator shall run
from the first of April to the following thirty‐first of March.
(B) The Electric Vehicles Charging Infrastructure Operator shall, in respect of the
Franchised Business:
(i) keep such accounting records as would be required to be kept in respect of
each such business so that the revenues, costs, assets, liabilities, reserves
and provisions of, or reasonably attributable to the Franchised Business are
separately identifiable in the books of the Electric Vehicles Charging

Study on Impact of Electric Vehicles on the Grid
Forum of regulators 91
Infrastructure Operator, from those of Other Business in which the Electric
Vehicles Charging Infrastructure Operator may be engaged;
(ii) prepare on a consistent basis from such accounting records and deliver to
the Distribution Licensee:
a) the Accounting Statements;
b) in respect of the first six months of each financial year, an interim
un‐audited profit and loss account, cash flow statement, funds flow
statement and provisional balance sheet;
c) in respect of the Accounting Statements prepared in accordance
with this Section with separate accounting information pertaining to
supply of electricity, an Auditor’s report for each financial year
stating whether in their opinion, these statements have been
properly prepared in accordance with this Section and give a true
and fair view of the revenues, costs, assets, liabilities, reserves and
provisions of, or reasonably attributable to such businesses to which
the statements relate; and
d) a copy of each interim un‐audited profit and loss account not later
than three months after the end of the period to which it relates,
and copies of the Accounting Statements and Auditor’s report not
later than nine months after the end of the financial year to which
they relate.
(C) Accounting Statements under Section 8.2(B) shall be prepared in accordance with
generally accepted Indian accounting standards and/or as may be prescribed by the
Distribution Licensee.
(D) References in this Section to costs or liabilities of, or reasonably attributable to the
franchised business shall be construed as excluding taxation, and capital liabilities
which do not relate principally to such business and interest thereon.
(E) The Distribution Licensee may, from such time it considers appropriate, require the
Electric Vehicles Charging Infrastructure Operator to comply with the provisions of
this Section 8.2(A) to 8.2(D) above treating the distribution business of the Electric
Vehicles Charging Infrastructure Operator as separate and distinct businesses.
(F) Notwithstanding anything contained in this Section, whenever deemed fit, the
Distribution Licensee may require the submission of a report prepared by an
independent Auditor at the expense of the Electric Vehicle Charging Infrastructure
Operator to be included as an expense in the determination of aggregate revenues
made in accordance with Section 5 of this Agreement.
Study on Impact of Electric Vehicles on the Grid
Forum of regulators 92
9. RECORDS:
Electric Vehicles Charging Infrastructure Operator shall maintain Records of Generation,
Distribution, Operations, Electricity Billing and Revenue Collection that are open and
accessible to the Distribution Licensee. The Distribution Licensee shall have the right to
inspect such Records of the Electric Vehicles Charging Infrastructure Operator as are
reasonably necessary.
10. REMEDIES FOR NONCOMPLIANCE
10.1 Termination:
(A) In the event of a material breach of this Franchise by the Electric Vehicles Charging
Infrastructure Operator, the Distribution Licensee may, without limitation, exercise
all rights and remedies provided for herein or otherwise available under the law,
including termination of the Franchise. Without limitation, the following shall
constitute material breaches of this Franchise:
(i) The Electric Vehicles Charging Infrastructure Operator 's failure or refusal to
pay any required amount payable to the Distribution Licensee.
(ii) Gross failure by Electric Vehicles Charging Infrastructure Operator to provide
required services desired under this agreement.
(B) In the event the Distribution Licensee intends to terminate this Franchise pursuant
to the previous subsection, the Distribution Licensee shall provide a written notice
to cure, identifying the nature of the breach with reasonable specificity, and advising
Electric Vehicles Charging Infrastructure Operator of the Distribution Licensee's
intent to terminate the Franchise.
(C) Any termination of this Franchise shall be by a written order issued by the
Distribution Licensee; provided, however, before any such recourse is adopted, the
Electric Vehicles Charging Infrastructure Operator must be provided an opportunity
to be heard by the Distribution Licensee regarding such proposed action before any
such action is taken.
11. RIGHTSOFWAY
11.1 Restoration of Property:

Study on Impact of Electric Vehicles on the Grid
Forum of regulators 93
Whenever Electric Vehicles Charging Infrastructure Operator disturbs the surface of any
Public Right‐of Way for any purpose, the Electric Vehicles Charging Infrastructure Operator
shall be responsible for restoration of such Public Right‐of‐Way and its surface within the
area affected or otherwise damaged to at least a comparable or better condition as it was in
prior to its disturbance by Electric Vehicles Charging Infrastructure Operator. Such
restoration shall be undertaken as quickly as possible at the Electric Vehicles Charging
Infrastructure Operator’s own cost.
11.2 Maintenance and Workmanship:
(A) The Electric Vehicles Charging Infrastructure Operator shall carry out its operations
as also maintenance of the infrastructure in such manner so as not to interfere with
other public property or relevant public agencies.
(B) Electric Vehicles Charging Infrastructure Operator shall also carry out its operations
in the manner so as to prevent injury to any person within the Distribution Licensee.
All safety practices required by law shall be used during the operations of the Rural
System Operator.
12. OTHER PROVISIONS
12.1 Compliance With Laws:
(C) Electric Vehicles Charging Infrastructure Operator shall comply with all applicable
central / state laws and abide by the rules and regulations adopted or established
pursuant to the Distribution Licensee's lawful authority.
12.2 Dispute Resolution:
(A) Any dispute between the Electric Vehicles Charging Infrastructure Operator and the
Distribution Licensee arising out of / or in connection with this Agreement shall be
first tried to be settled through mutual negotiation.
(B) In the event of such differences or disputes between the Electric Vehicles Charging
Infrastructure Operator and the Distribution Licensee not settled through mutual
negotiations within thirty days of such dispute, the matter shall be referred
individually (or jointly) to the SERC for reference to settlement of differences or
disputes by arbitration.
(C) The Electric Vehicles Charging Infrastructure Operator and the Distribution Licensee
shall undertake to carry out any decision relating to such dispute without delay.
12.3 Force Majeure:

Study on Impact of Electric Vehicles on the Grid
Forum of regulators 94
Neither party shall be responsible or liable for or deemed in breach hereof because of any
delay or failure in the performance of its obligations hereunder (except for obligations to
pay money due prior to occurrence of force majeure events under this Agreement) or failure
to meet milestone dates due to any event or circumstance (a force majeure event) beyond
the reasonable control of the party experiencing such delay or failure, including the
occurrence of the following:
(a) Acts of God;
(b) Typhoons, floods, lightening, cyclones, Hurricanes, draught, famine, epidemic, or
other natural calamities;
(c) Acts of war or Civil unrest;
(d) Any requirement, action or omission to act pursuant to any judgment or order of
any court or judicial authority;
(e) Earthquakes, explosions.
12.4 Terms as to Suspension and Revocation:
It is a condition of this Agreement that the Electric Vehicles Charging Infrastructure Operator shall
comply with all the Regulations, codes and standards and also orders and directions of the
Distribution Licensee. When Distribution Licensee expressly states that an order subjects the Electric
Vehicles Charging Infrastructure Operator to such compliance, failure to comply with that order will
render this Agreement liable to revocation without prejudice to the Distribution Licensee’s right to
revoke this Agreement on any other applicable grounds.
12.5 Severability:
If any Section, provision or clause of this Electric Vehicles Charging Infrastructure Operator is
held by a court of competent jurisdiction to be invalid or unenforceable, or is pre‐empted by
central or state laws or regulations, the remainder of this Franchise shall not be affected,
except as is otherwise provided in this Franchise.
13. DOCUMENTS TO BE PROVIDED BY THE DISTRIBUTION LICENSEE TO ELECTRIC VEHICLES
CHARGING INFRASTRUCTURE OPERATOR
13.1 Security Standards
13.2 Distribution System Operating Standards

Study on Impact of Electric Vehicles on the Grid
Forum of regulators 95
13.3 Guidelines for Accounting Procedure
Dated this ___________ day of _________________, 20_______________.
________________________________ ____________________________________
Electric Vehicles Charging Infrastructure Operator Distribution Licensee
By: By:
Title: Title:
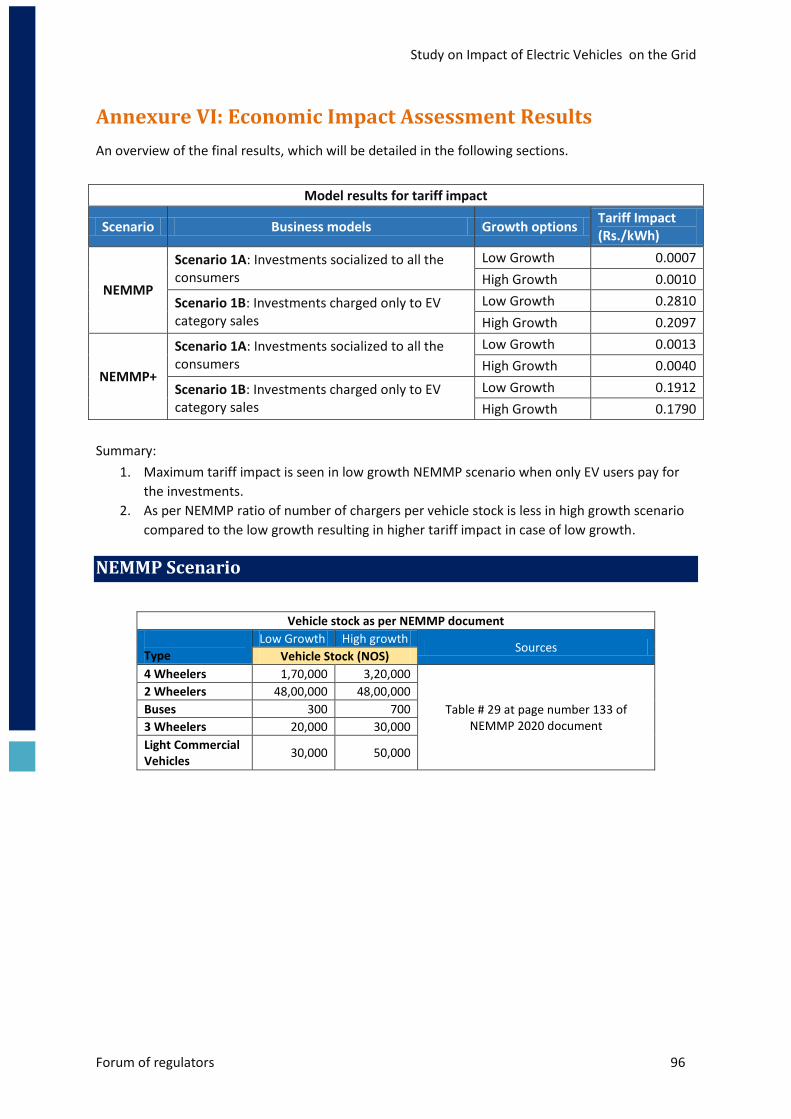
Study on Impact of Electric Vehicles on the Grid
Forum of regulators 96
Annexure VI: Economic Impact Assessment Results
An overview of the final results, which will be detailed in the following sections.
Model results for tariff impact
Scenario Business models Growth options Tariff Impact (Rs./kWh)
NEMMP
Scenario 1A: Investments socialized to all the consumers
Low Growth 0.0007
High Growth 0.0010
Scenario 1B: Investments charged only to EV category sales
Low Growth 0.2810
High Growth 0.2097
NEMMP+
Scenario 1A: Investments socialized to all the consumers
Low Growth 0.0013
High Growth 0.0040
Scenario 1B: Investments charged only to EV category sales
Low Growth 0.1912
High Growth 0.1790
Summary:
1. Maximum tariff impact is seen in low growth NEMMP scenario when only EV users pay for
the investments.
2. As per NEMMP ratio of number of chargers per vehicle stock is less in high growth scenario
compared to the low growth resulting in higher tariff impact in case of low growth.
NEMMP Scenario
Vehicle stock as per NEMMP document
Type
Low Growth High growth Sources
Vehicle Stock (NOS)
4 Wheelers 1,70,000 3,20,000
Table # 29 at page number 133 of NEMMP 2020 document
2 Wheelers 48,00,000 48,00,000
Buses 300 700
3 Wheelers 20,000 30,000
Light Commercial Vehicles
30,000 50,000

Study on Impact of Electric Vehicles on the Grid
Forum of regulators 97
Charging Infrastructure as per NEMMP document
Low Growth High growth Sources
Level 2 Fast DC Level 2 Fast DC
4 Wheelers 35,000 17,000 45,000 23,000 Exhibit # 42 to Exhibit # 49 at page numbers 112 to 115 of NEMMP 2020
document
2 Wheelers - - - -
Buses 60 30 100 50
3 Wheelers 2,000 1,000 4,000 2,000
Light Commercial Vehicles
4,000 2,000 5,000 3,000
Sub Total 41,060 20,030 54,100 28,050
Cost per unit, INR (all types except buses) 36,000 2,25,000 36,000 2,25,000 Footnotes at the above referred exhibits
Cost per unit, INR (buses) 4,50,000 10,00,000 4,50,000 10,00,000
Total Cost, INR Crores 150 453 199 635
Grand total (INR Crore) 603 834
Calculations related to annual electricity consumption from vehicle stock using public infrastructure
Vehicle Stock
Average Distance Travelled
(kms)
Electricity consumption, kWh/100km
Electricity consumption,
kWh/km
Annual energy consumption in MkWh (MUs)
Low Growth
High growth
4 Wheelers 40000 36 0.36 2448 4608
2 Wheelers 8000 8 0.08 3072 3072
Buses 50000 175 1.75 26.25 61.25
3 Wheelers 25000 15 0.15 75 112.5
Light Commercial Vehicles
30000 36 0.36 324 540
Total with 2-wheelers 5,945
8,394
Total without 2-wheelers 2,873
5,322
Notes:
1. Average distance travelled is assumed based on interviews with the market players except
for 4-wheelers. 4-wheelers' distance travelled number is assumed as 150 km/day for taxis
and 50 km/day for other 4-wheelers. Weighted average works out to be 120 kms/day,
which is multiplied by 330 days/year of travel.
2. Electricity consumption (kWh/100km) numbers are from Office Memorandum of
Department of Heavy Industries dated 26 March 2015 (highest number of the range of
values are considered here).

Study on Impact of Electric Vehicles on the Grid
Forum of regulators 98
NEMMP+ Scenario
Vehicle stock in NEMMP+ scenario
Type
Low Growth High growth Source
Vehicle Stock (NOS)
4 Wheelers 3,20,000 4,00,000 Assumption- NEMMP scenario numbers scaled up
2 Wheelers 48,00,000 48,00,000 Number same as NEMMP scenario
Buses 25,000 2,00,000 Assumption- with the focus on electrifying public transport, as announced by MoP recently
3 Wheelers 60,000 90,000 Tripled the numbers assumed in NEMMP, given the focus on this category
Light Commercial Vehicles
90,000 1,50,000 Assumption- NEMMP scenario numbers scaled up
Charging Infrastructure required for NEMMP + scenario
Low Growth High growth Sources
Level 2 Fast DC Level 2 Fast DC
4 Wheelers 45,000 23,000 56,250 28,750
Calculations described in the Notes section
2 Wheelers - - - -
Buses 5,000 2,500 40,000 20,000
3 Wheelers 6,000 3,000 9,000 4,500
Light Commercial Vehicles 12,000 6,000 20,000 10,000
Sub Total 68,000 34,500 1,25,250 63,250
Cost per unit, INR (all types except buses)
36,000 2,00,000 36,000 2,00,000 Target costs by industry players
Cost per unit, INR (buses) 2,50,000 6,00,000 2,50,000 6,00,000
Total Cost, INR Crores 352 790 1,307 2,065
Grand total (INR Crore) 1141.8 3371.9
Notes:
1. Ratio of chargers to the number of vehicles in respective categories as assumed in NEMMP
is used to determine the number of chargers for the Low growth scenario above. For the
High growth scenario, percentage increase in vehicle stock as compared to the Low growth
scenario times the number of chargers in the respective categories has been used.
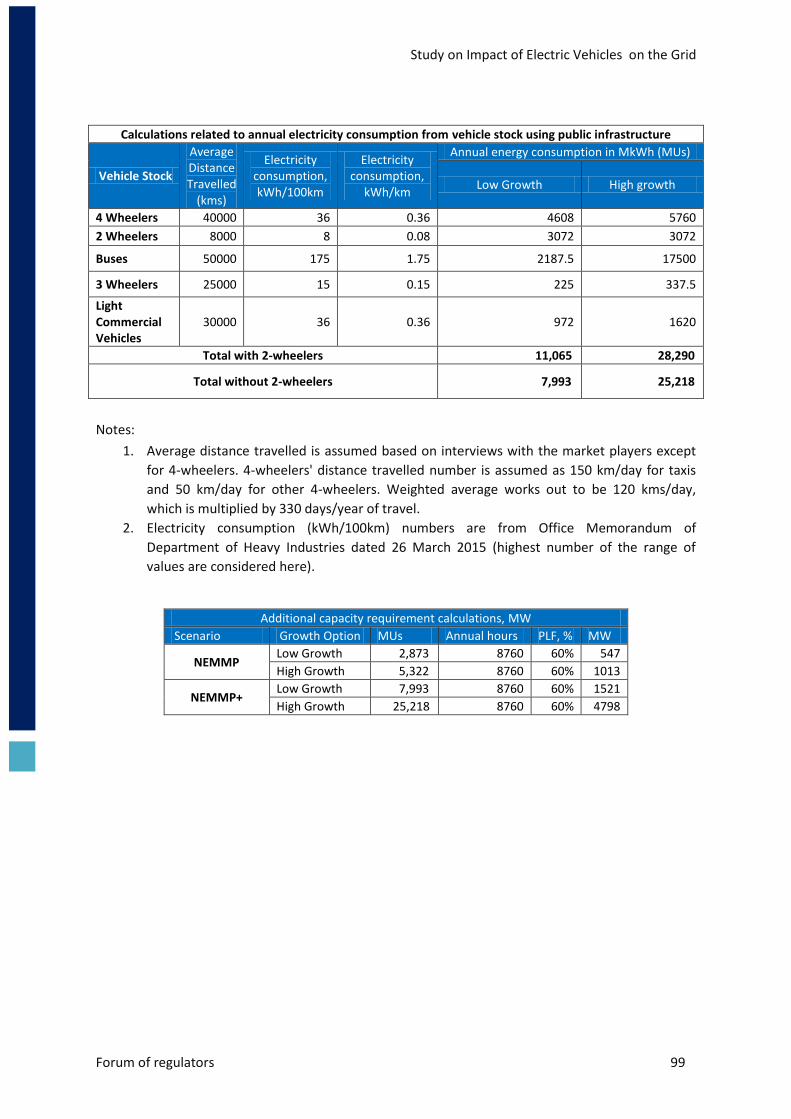
Study on Impact of Electric Vehicles on the Grid
Forum of regulators 99
Calculations related to annual electricity consumption from vehicle stock using public infrastructure
Vehicle Stock
Average Distance Travelled
(kms)
Electricity consumption, kWh/100km
Electricity consumption,
kWh/km
Annual energy consumption in MkWh (MUs)
Low Growth High growth
4 Wheelers 40000 36 0.36 4608 5760
2 Wheelers 8000 8 0.08 3072 3072
Buses 50000 175 1.75 2187.5 17500
3 Wheelers 25000 15 0.15 225 337.5
Light Commercial Vehicles
30000 36 0.36 972 1620
Total with 2-wheelers 11,065 28,290
Total without 2-wheelers 7,993 25,218
Notes:
1. Average distance travelled is assumed based on interviews with the market players except
for 4-wheelers. 4-wheelers' distance travelled number is assumed as 150 km/day for taxis
and 50 km/day for other 4-wheelers. Weighted average works out to be 120 kms/day,
which is multiplied by 330 days/year of travel.
2. Electricity consumption (kWh/100km) numbers are from Office Memorandum of
Department of Heavy Industries dated 26 March 2015 (highest number of the range of
values are considered here).
Additional capacity requirement calculations, MW
Scenario Growth Option MUs Annual hours PLF, % MW
NEMMP Low Growth 2,873 8760 60% 547
High Growth 5,322 8760 60% 1013
NEMMP+ Low Growth 7,993 8760 60% 1521
High Growth 25,218 8760 60% 4798

Study on Impact of Electric Vehicles on the Grid
Forum of regulators 100
Tariff Impact Estimation
Tariff impact Estimation
Particulars Unit Value Source
Actual energy availability in the country 2016-17
MUs 11,35,334 LGBR report, CEA 2017-18
Annual growth rate % 4%
O&M Cost % of capital cost 1%
Escalation on O&M costs % 5%
Debt % of capital cost 70%
MERC MYT Tariff Regulation, 2015
Equity % of capital cost 30%
Project Life years 15
Depreciation value base % of capital cost 100%
Rate of Depreciation p.a. 5.28%
Capital Parameters
Normative Return on Equity
p.a. 15.50%
MERC MYT Tariff Regulation, 2015; MSEDCL Tariff Order (case no. 48 of 2016 dated
3 November 2016
Interest on Debt p.a. 10%
Interest on working capital p.a. 14.75%
Discount Rate p.a. 10%
Term of Loan years 13

Study on Impact of Electric Vehicles on the Grid
Forum of regulators 101
Results of Cash Flows
NEMMP Low Growth Scenario
Scenario Option Tariff Impact (Rs./kWh)
Scenario 1A Low Growth ₹0.0007
Scenario 1B Low Growth ₹0.2809
Particulars Years 1 2 3 4 5 6 7 8 9 10 11 12 13 14 15
Capital cost for installation Rs. Crore 603
Total consumption MUs 11,35,334 11,80,747 12,27,977 12,77,096 13,28,180 13,81,307 14,36,560 14,94,022 15,53,783 16,15,934 16,80,572 17,47,795 18,17,706 18,90,415 19,66,031
Operation and Maintenance cost Rs. Crore 6.0 6.3 6.6 7.0 7.3 7.7 8.1 8.5 8.9 9.4 9.8 10.3 10.8 11.4 11.9
Depreciation Rs. Crore 31.8 31.8 31.8 31.8 31.8 31.8 31.8 31.8 31.8 31.8 31.8 31.8 31.8 94.6 94.6
Interest on Term Loan Rs. Crore 42.2 39.0 35.8 32.7 29.5 26.3 23.1 19.9 16.7 13.6 10.4 7.2 4.0 0.8 0.0
Return on Equity Rs. Crore 28.0 28.0 28.0 28.0 28.0 28.0 28.0 28.0 28.0 28.0 28.0 28.0 28.0 28.0 28.0
Total Fixed Cost Rs. Crore 108.1 105.2 102.4 99.5 96.7 93.9 91.1 88.3 85.5 82.8 80.1 77.4 74.7 134.8 134.5
Discount Factor Calculated 1 0.90909 0.82645 0.75131 0.68301 0.62092 0.56447 0.51316 0.46651 0.42410 0.38554 0.35049 0.31863 0.28966 0.26333
Total cost Rs/kWh 0.0010 0.0009 0.0008 0.0008 0.0007 0.0007 0.0006 0.0006 0.0006 0.0005 0.0005 0.0004 0.0004 0.0007 0.0007
Levelized Tariff Impact Rs/kWh ₹0.00071
Opening Balance Rs. Crore 422.1 390.3 358.4 326.6 294.7 262.9 231.1 199.2 167.4 135.6 103.7 71.9 40.0 8.2 0.0
Constant Repayment Rs. Crore 31.8 31.8 31.8 31.8 31.8 31.8 31.8 31.8 31.8 31.8 31.8 31.8 31.8 8.2 0.0
Closing Balance Rs. Crore 390.3 358.4 326.6 294.7 262.9 231.1 199.2 167.4 135.6 103.7 71.9 40.0 8.2 0.0 0.0
Interest on Loan Rs. Crore 42.2 39.0 35.8 32.7 29.5 26.3 23.1 19.9 16.7 13.6 10.4 7.2 4.0 0.8 0.0
Opening Balance Rs. Crore 603.0 571.2 539.3 507.5 475.6 443.8 412.0 380.1 348.3 316.5 284.6 252.8 220.9 189.1 94.6
Annual Depreciation Rs. Crore 31.8 31.8 31.8 31.8 31.8 31.8 31.8 31.8 31.8 31.8 31.8 31.8 31.8 94.6 94.6
Closing Balance Rs. Crore 571.2 539.3 507.5 475.6 443.8 412.0 380.1 348.3 316.5 284.6 252.8 220.9 189.1 94.6 0.0
Scenario 1A: Investments socialized to all the consumers - Utility Investments
Depreciation
Interest on Loan

Study on Impact of Electric Vehicles on the Grid
Forum of regulators 102
Particulars Years 1 2 3 4 5 6 7 8 9 10 11 12 13 14 15
Capital cost for installation Rs. Crore 603
Expected energy consumption from EVs MUs 2,873.3 2,988.2 3,107.7 3,232.0 3,361.3 3,495.7 3,635.6 3,781.0 3,932.2 4,089.5 4,253.1 4,423.2 4,600.2 4,784.2 4,975.5
Operation and Maintenance cost Rs. Crore 6.0 6.3 6.6 7.0 7.3 7.7 8.1 8.5 8.9 9.4 9.8 10.3 10.8 11.4 11.9
Depreciation Rs. Crore 31.8 31.8 31.8 31.8 31.8 31.8 31.8 31.8 31.8 31.8 31.8 31.8 31.8 94.6 94.6
Interest on Term Loan Rs. Crore 42.2 39.0 35.8 32.7 29.5 26.3 23.1 19.9 16.7 13.6 10.4 7.2 4.0 0.8 -
Return on Equity Rs. Crore 28.0 28.0 28.0 28.0 28.0 28.0 28.0 28.0 28.0 28.0 28.0 28.0 28.0 28.0 28.0
Total Fixed Cost Rs. Crore 108.1 105.2 102.4 99.5 96.7 93.9 91.1 88.3 85.5 82.8 80.1 77.4 74.7 134.8 134.5
Discount Factor Calculated 1 0.90909 0.82645 0.75131 0.68301 0.62092 0.56447 0.51316 0.46651 0.42410 0.38554 0.35049 0.31863 0.28966 0.26333
Total cost Rs/kWh 0.3763 0.3522 0.3294 0.3079 0.2876 0.2685 0.2505 0.2335 0.2175 0.2024 0.1883 0.1749 0.1624 0.2817 0.2704
Levelized Tariff Impact Rs/kWh ₹0.28090
Opening Balance Rs. Crore 422.1 390.3 358.4 326.6 294.7 262.9 231.1 199.2 167.4 135.6 103.7 71.9 40.0 8.2 0
Constant Repayment Rs. Crore 31.8 31.8 31.8 31.8 31.8 31.8 31.8 31.8 31.8 31.8 31.8 31.8 31.8 8.2 0
Closing Balance Rs. Crore 390.3 358.4 326.6 294.7 262.9 231.1 199.2 167.4 135.6 103.7 71.9 40.0 8.2 0.0 0
Interest on Loan Rs. Crore 42.2 39.0 35.8 32.7 29.5 26.3 23.1 19.9 16.7 13.6 10.4 7.2 4.0 0.8 0
Opening Balance Rs. Crore 603.0 571.2 539.3 507.5 475.6 443.8 412.0 380.1 348.3 316.5 284.6 252.8 220.9 189.1 94.6
Annual Depreciation Rs. Crore 31.8 31.8 31.8 31.8 31.8 31.8 31.8 31.8 31.8 31.8 31.8 31.8 31.8 94.6 94.6
Closing Balance Rs. Crore 571.2 539.3 507.5 475.6 443.8 412.0 380.1 348.3 316.5 284.6 252.8 220.9 189.1 94.6 0.0
Interest on Loan
Depreciation
Scenario 1B: Investments charged only to EV category sales - Franchise's Investments

Study on Impact of Electric Vehicles on the Grid
Forum of regulators 103
NEMMP High Growth Scenario
Scenario OptionTariff Impact
(Rs./kWh)
Scenario 1A High Growth ₹0.0010
Scenario 1B High Growth ₹0.2097
Particulars Years 1 2 3 4 5 6 7 8 9 10 11 12 13 14 15
Capital cost for installation Rs. Crore 833.9
Total consumption MUs 11,35,334 11,80,747 12,27,977 12,77,096 13,28,180 13,81,307 14,36,560 14,94,022 15,53,783 16,15,934 16,80,572 17,47,795 18,17,706 18,90,415 19,66,031
Operation and Maintenance cost Rs. Crore 8.3 8.8 9.2 9.7 10.1 10.6 11.2 11.7 12.3 12.9 13.6 14.3 15.0 15.7 16.5
Depreciation Rs. Crore 44.0 44.0 44.0 44.0 44.0 44.0 44.0 44.0 44.0 44.0 44.0 44.0 44.0 130.8 130.8
Interest on Term Loan Rs. Crore 58.4 54.0 49.6 45.2 40.8 36.4 32.0 27.6 23.1 18.7 14.3 9.9 5.5 1.1 0.0
Return on Equity Rs. Crore 38.8 38.8 38.8 38.8 38.8 38.8 38.8 38.8 38.8 38.8 38.8 38.8 38.8 38.8 38.8
Total Fixed Cost Rs. Crore 149.5 145.5 141.6 137.6 133.7 129.8 125.9 122.1 118.3 114.5 110.7 107.0 103.3 186.4 186.0
Discount Factor Calculated 1 0.90909 0.82645 0.75131 0.68301 0.62092 0.56447 0.51316 0.46651 0.42410 0.38554 0.35049 0.31863 0.28966 0.26333
Total cost Rs/kWh 0.0013 0.0012 0.0012 0.0011 0.0010 0.0009 0.0009 0.0008 0.0008 0.0007 0.0007 0.0006 0.0006 0.0010 0.0009
Levelized Tariff Impact Rs/kWh ₹0.00098
Opening Balance Rs. Crore 583.7 539.7 495.7 451.6 407.6 363.6 319.6 275.5 231.5 187.5 143.4 99.4 55.4 11.3 0.0
Constant Repayment Rs. Crore 44.0 44.0 44.0 44.0 44.0 44.0 44.0 44.0 44.0 44.0 44.0 44.0 44.0 11.3 0.0
Closing Balance Rs. Crore 539.7 495.7 451.6 407.6 363.6 319.6 275.5 231.5 187.5 143.4 99.4 55.4 11.3 0.0 0.0
Interest on Loan Rs. Crore 58.4 54.0 49.6 45.2 40.8 36.4 32.0 27.6 23.1 18.7 14.3 9.9 5.5 1.1 0.0
Opening Balance Rs. Crore 833.9 789.9 745.8 701.8 657.8 613.8 569.7 525.7 481.7 437.6 393.6 349.6 305.5 261.5 130.8
Annual Depreciation Rs. Crore 44.0 44.0 44.0 44.0 44.0 44.0 44.0 44.0 44.0 44.0 44.0 44.0 44.0 130.8 130.8
Closing Balance Rs. Crore 789.9 745.8 701.8 657.8 613.8 569.7 525.7 481.7 437.6 393.6 349.6 305.5 261.5 130.8 0.0
Scenario 1A: Investments socialized to all the consumers - Utility Investments
Depreciation
Interest on Loan

Study on Impact of Electric Vehicles on the Grid
Forum of regulators 104
Particulars Years 1 2 3 4 5 6 7 8 9 10 11 12 13 14 15
Capital cost for installation Rs. Crore 833.9
Expected energy consumption from EVs MUs 5,321.8 5,534.6 5,756.0 5,986.2 6,225.7 6,474.7 6,733.7 7,003.1 7,283.2 7,574.5 7,877.5 8,192.6 8,520.3 8,861.1 9,215.5
Operation and Maintenance cost Rs. Crore 8.3 8.8 9.2 9.7 10.1 10.6 11.2 11.7 12.3 12.9 13.6 14.3 15.0 15.7 16.5
Depreciation Rs. Crore 44.0 44.0 44.0 44.0 44.0 44.0 44.0 44.0 44.0 44.0 44.0 44.0 44.0 130.8 130.8
Interest on Term Loan Rs. Crore 58.4 54.0 49.6 45.2 40.8 36.4 32.0 27.6 23.1 18.7 14.3 9.9 5.5 1.1 -
Return on Equity Rs. Crore 38.8 38.8 38.8 38.8 38.8 38.8 38.8 38.8 38.8 38.8 38.8 38.8 38.8 38.8 38.8
Total Fixed Cost Rs. Crore 149.5 145.5 141.6 137.6 133.7 129.8 125.9 122.1 118.3 114.5 110.7 107.0 103.3 186.4 186.0
Discount Factor Calculated 1 0.90909 0.82645 0.75131 0.68301 0.62092 0.56447 0.51316 0.46651 0.42410 0.38554 0.35049 0.31863 0.28966 0.26333
Total cost Rs/kWh 0.2810 0.2629 0.2459 0.2299 0.2148 0.2005 0.1870 0.1743 0.1624 0.1512 0.1406 0.1306 0.1213 0.2103 0.2019
Levelized Tariff Impact Rs/kWh ₹0.20973
Opening Balance Rs. Crore 583.7 539.7 495.7 451.6 407.6 363.6 319.6 275.5 231.5 187.5 143.4 99.4 55.4 11.3 0
Constant Repayment Rs. Crore 44.0 44.0 44.0 44.0 44.0 44.0 44.0 44.0 44.0 44.0 44.0 44.0 44.0 11.3 0
Closing Balance Rs. Crore 539.7 495.7 451.6 407.6 363.6 319.6 275.5 231.5 187.5 143.4 99.4 55.4 11.3 0.0 0
Interest on Loan Rs. Crore 58.4 54.0 49.6 45.2 40.8 36.4 32.0 27.6 23.1 18.7 14.3 9.9 5.5 1.1 0
Opening Balance Rs. Crore 833.9 789.9 745.8 701.8 657.8 613.8 569.7 525.7 481.7 437.6 393.6 349.6 305.5 261.5 130.8
Annual Depreciation Rs. Crore 44.0 44.0 44.0 44.0 44.0 44.0 44.0 44.0 44.0 44.0 44.0 44.0 44.0 130.8 130.8
Closing Balance Rs. Crore 789.9 745.8 701.8 657.8 613.8 569.7 525.7 481.7 437.6 393.6 349.6 305.5 261.5 130.8 0.0
Depreciation
Interest on Loan
Scenario 1B: Investments charged only to EV category sales - Franchise's Investments

Study on Impact of Electric Vehicles on the Grid
Forum of regulators 105
NEMMP+ Low Growth Scenario
Scenario OptionTariff
Impact
Scenario 1A Low Growth ₹0.0013
Scenario 1B Low Growth ₹0.1912
Particulars Years 1 2 3 4 5 6 7 8 9 10 11 12 13 14 15
Capital cost for installation Rs. Crore 1141.8
Total consumption MUs 11,35,334 11,80,747 12,27,977 12,77,096 13,28,180 13,81,307 14,36,560 14,94,022 15,53,783 16,15,934 16,80,572 17,47,795 18,17,706 18,90,415 19,66,031
Operation and Maintenance cost Rs. Crore 11.4 12.0 12.6 13.2 13.9 14.6 15.3 16.1 16.9 17.7 18.6 19.5 20.5 21.5 22.6
Depreciation Rs. Crore 60.3 60.3 60.3 60.3 60.3 60.3 60.3 60.3 60.3 60.3 60.3 60.3 60.3 179.0 179.0
Interest on Term Loan Rs. Crore 79.9 73.9 67.9 61.8 55.8 49.8 43.8 37.7 31.7 25.7 19.6 13.6 7.6 1.6 0.0
Return on Equity Rs. Crore 53.1 53.1 53.1 53.1 53.1 53.1 53.1 53.1 53.1 53.1 53.1 53.1 53.1 53.1 53.1
Total Fixed Cost Rs. Crore 204.7 199.3 193.8 188.4 183.1 177.7 172.4 167.2 161.9 156.8 151.6 146.5 141.5 255.2 254.7
Discount Factor Calculated 1.00000 0.90909 0.82645 0.75131 0.68301 0.62092 0.56447 0.51316 0.46651 0.42410 0.38554 0.35049 0.31863 0.28966 0.26333
Total cost Rs/kWh 0.0018 0.0017 0.0016 0.0015 0.0014 0.0013 0.0012 0.0011 0.0010 0.0010 0.0009 0.0008 0.0008 0.0014 0.0013
Levelized Tariff Impact Rs/kWh ₹0.00135
Opening Balance Rs. Crore 799.3 739.0 678.7 618.4 558.1 497.8 437.5 377.3 317.0 256.7 196.4 136.1 75.8 15.5 0.0
Constant Repayment Rs. Crore 60.3 60.3 60.3 60.3 60.3 60.3 60.3 60.3 60.3 60.3 60.3 60.3 60.3 15.5 0.0
Closing Balance Rs. Crore 739.0 678.7 618.4 558.1 497.8 437.5 377.3 317.0 256.7 196.4 136.1 75.8 15.5 0.0 0.0
Interest on Loan Rs. Crore 79.9 73.9 67.9 61.8 55.8 49.8 43.8 37.7 31.7 25.7 19.6 13.6 7.6 1.6 0.0
Opening Balance Rs. Crore 1141.8 1081.5 1021.2 960.9 900.7 840.4 780.1 719.8 659.5 599.2 538.9 478.6 418.4 358.1 179.0
Annual Depreciation Rs. Crore 60.3 60.3 60.3 60.3 60.3 60.3 60.3 60.3 60.3 60.3 60.3 60.3 60.3 179.0 179.0
Closing Balance Rs. Crore 1081.5 1021.2 960.9 900.7 840.4 780.1 719.8 659.5 599.2 538.9 478.6 418.4 358.1 179.0 0.0
Scenario 1A: Investments socialized to all the consumers - Utility Investments
Depreciation
Interest on Loan

Study on Impact of Electric Vehicles on the Grid
Forum of regulators 106
Particulars Years 1 2 3 4 5 6 7 8 9 10 11 12 13 14 15
Capital cost for installation Rs. Crore 1141.8
Expected energy consumption from EVs MUs 7,992.5 8,312.2 8,644.7 8,990.5 9,350.1 9,724.1 10,113.1 10,517.6 10,938.3 11,375.8 11,830.9 12,304.1 12,796.3 13,308.1 13,840.4
Operation and Maintenance cost Rs. Crore 11.4 12.0 12.6 13.2 13.9 14.6 15.3 16.1 16.9 17.7 18.6 19.5 20.5 21.5 22.6
Depreciation Rs. Crore 60.3 60.3 60.3 60.3 60.3 60.3 60.3 60.3 60.3 60.3 60.3 60.3 60.3 179.0 179.0
Interest on Term Loan Rs. Crore 79.9 73.9 67.9 61.8 55.8 49.8 43.8 37.7 31.7 25.7 19.6 13.6 7.6 1.6 -
Return on Equity Rs. Crore 53.1 53.1 53.1 53.1 53.1 53.1 53.1 53.1 53.1 53.1 53.1 53.1 53.1 53.1 53.1
Total Fixed Cost Rs. Crore 204.7 199.3 193.8 188.4 183.1 177.7 172.4 167.2 161.9 156.8 151.6 146.5 141.5 255.2 254.7
Discount Factor Calculated 1.00000 0.90909 0.82645 0.75131 0.68301 0.62092 0.56447 0.51316 0.46651 0.42410 0.38554 0.35049 0.31863 0.28966 0.26333
Total cost Rs/kWh 0.2561 0.2397 0.2242 0.2096 0.1958 0.1828 0.1705 0.1589 0.1481 0.1378 0.1282 0.1191 0.1106 0.1918 0.1841
Levelized Tariff Impact Rs/kWh ₹0.19121
Opening Balance Rs. Crore 799.3 739.0 678.7 618.4 558.1 497.8 437.5 377.3 317.0 256.7 196.4 136.1 75.8 15.5 0
Constant Repayment Rs. Crore 60.3 60.3 60.3 60.3 60.3 60.3 60.3 60.3 60.3 60.3 60.3 60.3 60.3 15.5 0
Closing Balance Rs. Crore 739.0 678.7 618.4 558.1 497.8 437.5 377.3 317.0 256.7 196.4 136.1 75.8 15.5 0.0 0
Interest on Loan Rs. Crore 79.9 73.9 67.9 61.8 55.8 49.8 43.8 37.7 31.7 25.7 19.6 13.6 7.6 1.6 0
Opening Balance Rs. Crore 1141.8 1081.5 1021.2 960.9 900.7 840.4 780.1 719.8 659.5 599.2 538.9 478.6 418.4 358.1 179.0
Annual Depreciation Rs. Crore 60.3 60.3 60.3 60.3 60.3 60.3 60.3 60.3 60.3 60.3 60.3 60.3 60.3 179.0 179.0
Closing Balance Rs. Crore 1081.5 1021.2 960.9 900.7 840.4 780.1 719.8 659.5 599.2 538.9 478.6 418.4 358.1 179.0 0.0
Interest on Loan
Depreciation
Scenario 1B: Investments charged only to EV category sales - Franchise's Investments

Study on Impact of Electric Vehicles on the Grid
Forum of regulators 107
NEMMP+ High Growth Scenario
Scenario OptionTariff
Impact
Scenario 1A High Growth ₹0.0040
Scenario 1B High Growth ₹0.1790
Particulars Years 1 2 3 4 5 6 7 8 9 10 11 12 13 14 15
Capital cost for installation Rs. Crore 3371.9
Total consumption MUs 11,35,334 11,80,747 12,27,977 12,77,096 13,28,180 13,81,307 14,36,560 14,94,022 15,53,783 16,15,934 16,80,572 17,47,795 18,17,706 18,90,415 19,66,031
Operation and Maintenance cost Rs. Crore 33.7 35.4 37.2 39.0 41.0 43.0 45.2 47.4 49.8 52.3 54.9 57.7 60.6 63.6 66.8
Depreciation Rs. Crore 178.0 178.0 178.0 178.0 178.0 178.0 178.0 178.0 178.0 178.0 178.0 178.0 178.0 528.7 528.7
Interest on Term Loan Rs. Crore 236.0 218.2 200.4 182.6 164.8 147.0 129.2 111.4 93.6 75.8 58.0 40.2 22.4 4.6 0.0
Return on Equity Rs. Crore 156.8 156.8 156.8 156.8 156.8 156.8 156.8 156.8 156.8 156.8 156.8 156.8 156.8 156.8 156.8
Total Fixed Cost Rs. Crore 604.6 588.5 572.4 556.5 540.6 524.9 509.2 493.7 478.3 462.9 447.8 432.7 417.8 753.7 752.3
Discount Factor Calculated 1.00000 0.90909 0.82645 0.75131 0.68301 0.62092 0.56447 0.51316 0.46651 0.42410 0.38554 0.35049 0.31863 0.28966 0.26333
Total cost Rs/kWh 0.0053 0.0050 0.0047 0.0044 0.0041 0.0038 0.0035 0.0033 0.0031 0.0029 0.0027 0.0025 0.0023 0.0040 0.0038
Levelized Tariff Impact Rs/kWh ₹0.00398
Opening Balance Rs. Crore 2360.3 2182.3 2004.3 1826.2 1648.2 1470.1 1292.1 1114.1 936.0 758.0 580.0 401.9 223.9 45.9 0.0
Constant Repayment Rs. Crore 178.0 178.0 178.0 178.0 178.0 178.0 178.0 178.0 178.0 178.0 178.0 178.0 178.0 45.9 0.0
Closing Balance Rs. Crore 2182.3 2004.3 1826.2 1648.2 1470.1 1292.1 1114.1 936.0 758.0 580.0 401.9 223.9 45.9 0.0 0.0
Interest on Loan Rs. Crore 236.0 218.2 200.4 182.6 164.8 147.0 129.2 111.4 93.6 75.8 58.0 40.2 22.4 4.6 0.0
Opening Balance Rs. Crore 3371.9 3193.9 3015.8 2837.8 2659.8 2481.7 2303.7 2125.6 1947.6 1769.6 1591.5 1413.5 1235.5 1057.4 528.7
Annual Depreciation Rs. Crore 178.0 178.0 178.0 178.0 178.0 178.0 178.0 178.0 178.0 178.0 178.0 178.0 178.0 528.7 528.7
Closing Balance Rs. Crore 3193.9 3015.8 2837.8 2659.8 2481.7 2303.7 2125.6 1947.6 1769.6 1591.5 1413.5 1235.5 1057.4 528.7 0.0
Scenario 1A: Investments socialized to all the consumers - Utility Investments
Depreciation
Interest on Loan
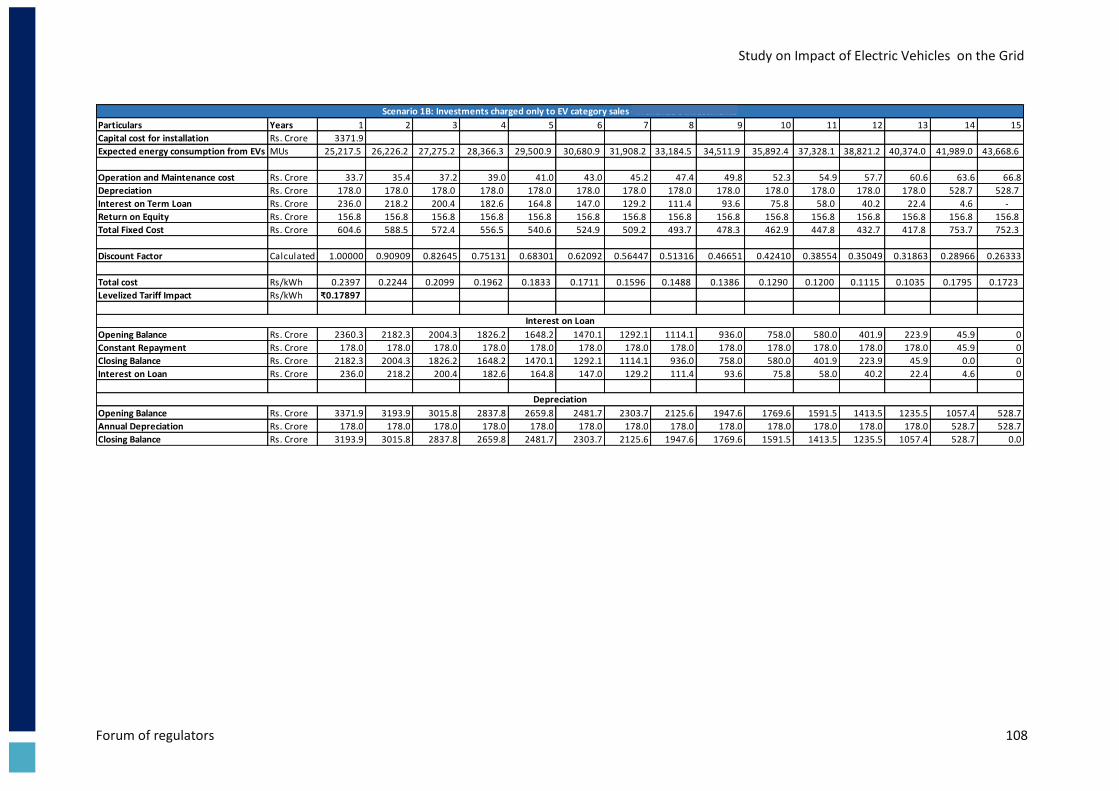
Study on Impact of Electric Vehicles on the Grid
Forum of regulators 108
Particulars Years 1 2 3 4 5 6 7 8 9 10 11 12 13 14 15
Capital cost for installation Rs. Crore 3371.9
Expected energy consumption from EVs MUs 25,217.5 26,226.2 27,275.2 28,366.3 29,500.9 30,680.9 31,908.2 33,184.5 34,511.9 35,892.4 37,328.1 38,821.2 40,374.0 41,989.0 43,668.6
Operation and Maintenance cost Rs. Crore 33.7 35.4 37.2 39.0 41.0 43.0 45.2 47.4 49.8 52.3 54.9 57.7 60.6 63.6 66.8
Depreciation Rs. Crore 178.0 178.0 178.0 178.0 178.0 178.0 178.0 178.0 178.0 178.0 178.0 178.0 178.0 528.7 528.7
Interest on Term Loan Rs. Crore 236.0 218.2 200.4 182.6 164.8 147.0 129.2 111.4 93.6 75.8 58.0 40.2 22.4 4.6 -
Return on Equity Rs. Crore 156.8 156.8 156.8 156.8 156.8 156.8 156.8 156.8 156.8 156.8 156.8 156.8 156.8 156.8 156.8
Total Fixed Cost Rs. Crore 604.6 588.5 572.4 556.5 540.6 524.9 509.2 493.7 478.3 462.9 447.8 432.7 417.8 753.7 752.3
Discount Factor Calculated 1.00000 0.90909 0.82645 0.75131 0.68301 0.62092 0.56447 0.51316 0.46651 0.42410 0.38554 0.35049 0.31863 0.28966 0.26333
Total cost Rs/kWh 0.2397 0.2244 0.2099 0.1962 0.1833 0.1711 0.1596 0.1488 0.1386 0.1290 0.1200 0.1115 0.1035 0.1795 0.1723
Levelized Tariff Impact Rs/kWh ₹0.17897
Opening Balance Rs. Crore 2360.3 2182.3 2004.3 1826.2 1648.2 1470.1 1292.1 1114.1 936.0 758.0 580.0 401.9 223.9 45.9 0
Constant Repayment Rs. Crore 178.0 178.0 178.0 178.0 178.0 178.0 178.0 178.0 178.0 178.0 178.0 178.0 178.0 45.9 0
Closing Balance Rs. Crore 2182.3 2004.3 1826.2 1648.2 1470.1 1292.1 1114.1 936.0 758.0 580.0 401.9 223.9 45.9 0.0 0
Interest on Loan Rs. Crore 236.0 218.2 200.4 182.6 164.8 147.0 129.2 111.4 93.6 75.8 58.0 40.2 22.4 4.6 0
Opening Balance Rs. Crore 3371.9 3193.9 3015.8 2837.8 2659.8 2481.7 2303.7 2125.6 1947.6 1769.6 1591.5 1413.5 1235.5 1057.4 528.7
Annual Depreciation Rs. Crore 178.0 178.0 178.0 178.0 178.0 178.0 178.0 178.0 178.0 178.0 178.0 178.0 178.0 528.7 528.7
Closing Balance Rs. Crore 3193.9 3015.8 2837.8 2659.8 2481.7 2303.7 2125.6 1947.6 1769.6 1591.5 1413.5 1235.5 1057.4 528.7 0.0
Depreciation
Interest on Loan
Scenario 1B: Investments charged only to EV category sales - Franchise's Investments

Study on Impact of Electric Vehicles on the Grid
Forum of Regulators 109
Example: MSEDCL
S.No Detail
NEMMP high growth (all consumers)
NEMMP high growth (only EV users)
NEMMP+ high growth (all consumers)
NEMMP+ high growth (only EV users)
1 Tariff impact as incremental wheeling charges, INR/kWh 0.001 0.281 0.004 0.191
Base tariff options
2A ACoS, INR/kWh 6.74 6.74 6.74 6.74
2Ba Commercial consumer base (HT) energy charges, INR/kWh
11.4 11.4 11.4 11.4
2Bb Commercial consumer base (HT) energy charges, INR/kWh
0.59 0.59 0.59 0.59
2C Average Power Procurement Cost, INR/kWh 4.01 4.01 4.01 4.01
2D Highest marginal cost from the merit order stock, INR/kWh 4.86 4.86 4.86 4.86
3 Differential between ACoS and APPC, , INR/kWh 2.73 2.73 2.73 2.73
Total charges including incremental wheeling charges, INR/kWh
4 Total charges at ACoS, INR/kWh (=1+2A) 6.74 7.02 6.74 6.93
5 Total charges at Commercial (HT), INR/kWh (=1+2Ba+2Bb) 11.99 12.27 11.99 12.18
6 Total charges at APPC, INR/kWh (=1+2A+3) 6.74 7.02 6.74 6.93
7 Total charges at highest marginal cost, INR/kWh (=1+2A+3) 7.59 7.87 7.59 7.78
ToD incentives corresponding to usage of stranded assets FY 2016-17 FY 2017-18 FY 2018-19 FY 2019-20
Back Down capacity MW 6,379 8,961 7,257 6463
Capacity Charges related to Back down INR Crore 3,988 4,357 4,027 3,710
Capacity charges per MW INR Crore/MW 0.625 0.486 0.555 0.574
Capacity utilization factor 100%
Annual hours 3650
Note:
1. Based on assumption that the investment and infrastructure in MSEDCL would 10% of the
national level.
NEMMP NEMMP+
Electricty consumed by EVs in MSEDCL area MUs 532 2521.75
Maximum stranded capacity that can be utilised MW 145.80 690.89
Total incentive to be offered to the Evs INR, Crore 91.15 431.93
Incentive INR Crore/MW 1.71 1.71
Maximum level of TOD incentives

Study on Impact of Electric Vehicles on the Grid
Forum of Regulators 110
Annexure VII: Broad principles for special EV Tariffs
1. Scope of these principles
1.1. The Regulatory Commission shall determine the Tariff, and Fees and Charges for public charging of
Electric Vehicles (EVs), including terms and conditions thereof, in accordance with these principles,
including the following: -
i. Supply of electricity by a Distribution Licensee or Franchisee of the Distribution Licensee to
owners of electric vehicles
ii. Bulk procurement of electricty by the Franchisee from the Distribution Licensee
iii. Rates and charges for recovering the investment made in establishing the required infrastructure
for public charging of electric vehicles
2. Components of tariff for Distribution of electricty to EV owners
2.1. It is recommended that a separate category of consumers is created for public charging of Electric
Vehicles by the respective Regulatory Commission.
2.2. The tariff for EV category should be close to Average Cost of Supply for a Distribution Licensee
computed as the ratio of the Aggregate Revenue Requirement of the Distribution Licensee for the
Year, determined in accordance with the applicable MYT Regulations, to the total sales of the
Distribution Licensee for the respective Year.
2.3. An incremental charge providing for the recovery of the investment in the required public EV
charging infrastructure should be added to the ACoS. Tariff for EV category thus, should be
comprising the following components:
(a) Average cost of supply (ACoS) of the Distribution Licensee
(b) the incremental tariff over and above the ACoS and comprising of following for the recovery of
the investment made in public EV charging infrastructure
i. Capital expenditure
ii. Operation and maintenance expenses;
iii. Depreciation;
iv. Interest on loan capital;
v. Interest on working capital;
vi. Return on equity capital;
vii. Provision for bad and doubtful debts; and
viii. Income tax

Study on Impact of Electric Vehicles on the Grid
Forum of Regulators 111
2.4. The Cross susbsidy surcharge shall be waived off for EV category if the power is procured through
open acess
2.5. The Tariff for retail supply may comprise of any combination of fixed/demand charges and energy
charges, for recovery from the consumers, as stipulated by the Commission. Option of utilizing pre-
paid meters can be explored as it will provide better visibility and control to the end user for
charging EVs.
2.6. The Distribution Licensee may offer a rebate to the consumers on the Tariff and charges determined
by the Commission, however, the impact of such rebates on the Distribution Licensee shall be borne
entirely by the Distribution Licensee and the impact of such rebate shall not be passed on to the
other consumers. Such rebates should not be offered selectively to any consumer/s, but to the entire
consumer category/sub-category/consumption slab in a non-discriminatory manner.
3. Capital Investment Plan
3.1. The Distribution Licensee shall submit a detailed Capital Investment Plan, financing plan and physical
targets for each year for strengthening and augmentation of its distribution network for serving EV
owners, meeting the requirement of load growth etc.
3.2. The Distribution Licensee shall submit separate details of Capital Investment being undertaken in
each Distribution Franchisee area within its License area.
4. Operation and Maintenance Expenses
4.1. The Distribution Licensees shall be permitted to recover Operation and Maintenance expenses as per
the norms specified by the respective Commissions in accordance with the Multi-Year Tariff
Regulations.
5. Financial Principles for Computation of Incremental Charges
As described in clause 2.3 the incremental tariff over and above the ACoS for EV category should
comprise the following for the investment made in public EV charging infrastructure.
5.1. Capital Expenditure and Cost
5.1.1. Capital cost for a capital investment Project shall include:
a. the expenditure incurred or projected to be incurred, including interest during construction
and financing charges

Study on Impact of Electric Vehicles on the Grid
Forum of Regulators 112
b. capitalized initial spares in accordance with MYT Regulations
c. expenses incurred by the Licensee on obtaining right of way
d. additional capital expenditure
5.1.2. The capital cost of the assets forming part of the Project but not put to use or not in use, shall be
excluded from the capital cost.
5.1.3. The approval and provision of any additional capital expenditure may be done by the respective
Commission in accordance with the MYT regulations.
5.2. Debt Equity Ratio
5.2.1. Debt-equity ratio as on the date of commercial operation shall be 70:30 of the amount of capital
cost approved by the respective Commission.
5.3. Depreciation
5.3.1. The depreciation on the value of fixed assets used in their respective Businesses, shall be computed
in the following manner:
a. The approved original cost of the fixed assets shall be the value base for calculation of
depreciation. It shall be allowed on the entire capitalised amount of the new assets after
reducing the approved original cost of the retired or replaced or de-capitalised assets.
b. Depreciation shall be computed annually based on the straight-line method at the applicable
rates specified by the respective Commission.
c. Once the individual asset is depreciated to the extent of seventy (70) percent, remaining
depreciable value as on 31st March of the year closing shall be spread over the balance useful
life of the asset.
d. The salvage value of the asset shall be considered at 10 per cent of the allowable capital cost
and depreciation shall be allowed up to a maximum of 90 per cent of the allowable capital cost
of the asset.
5.3.2. Land other than the land held under lease shall not be a depreciable asset and its cost shall be
excluded from the capital cost while computing depreciable value of the assets.
5.4. Return on Equity
5.4.1. Return on equity shall be allowed on the equity capital at the rate as determined by the respective
Commission in accordance with the MYT Regulations.

Study on Impact of Electric Vehicles on the Grid
Forum of Regulators 113
5.5. Interest on loan
5.5.1. The loans arrived on the assets put to use shall be considered as gross normative loan for
calculation of interest on loan.
5.5.2. The repayment during each year shall be deemed to be equal to the depreciation allowed for that
year.
5.5.3. Notwithstanding any moratorium period availed, the repayment of loan shall be considered from
the first year of commercial operation and shall be equal to the annual depreciation allowed.
5.5.4. The rate of interest shall be determined by the respective Commission.
5.6. Interest on Working Capital
5.6.1. The working capital requirement shall cover:
a. Operation and maintenance expenses for one month;
b. Maintenance spares at one per cent of the historical cost; and
c. One and half month’s equivalent of the expected revenue; minus
d. Amount held as security deposits in cash from consumers; and
e. One-month equivalent of cost of power purchased, based on the annual power procurement
plan
5.6.2. Rate of interest on working capital shall be determined by the respective Commission in
accordance with MYT Regulations.
5.7. Income Tax
5.7.1. The Income Tax payable shall be determined and approved by the respective Commission.-