Embed Size (px)
Citation preview
6
Formation of Dissipative Structures During Crystallization of Supercooled Melts
Leonid Tarabaev and Vladimir Esin* Institute of Metal Physics, Ural Division of the Russian Academy of Sciences
Russia
1. Introduction
The process of crystallization in a system far from equilibrium has features, which
manifest themselves in the morphology, crystal growth velocity, and segregation of
dissolved alloy components. So under conditions of high cooling rates of melt (R ~ 106
K/s), when the deep supercoolings are reached an irregular morphology of solidification,
nonequilibrium «trapping» of impurity, and coexistence of crystalline and amorphous
phases observed (Miroshnichenko, 1982). For sufficiently high growth velocities, i.e. for
certain critical undercooling the sharp transition to a partitionless regime of
crystallization will take place (Nikonova & Temkin, 1966). It afterwards was called as
kinetic phase transition (Chernov & Lewis, 1967; Chernov, 1980; Temkin, 1970). The
critical supercooling can reach large values: so for Ni-B alloy of ~ 200 ÷ 300 K (Eckler at
al., 1992). The dissipative structures formed in such system, essentially influence on set of
main properties of prepared material.
In the continuous growth model the boundary conditions for solute partitioning at the
crystal-melt interface are established (Aziz & Kaplan, 1988; Aziz, 1994; Kittl at al., 2000).
These conditions are used in models to explaining the experimental data on solute
trapping, in particular, in the phase-field models (Ahmad at al., 1998; Ramirez at al., 2004;
Wheeler at al., 1993). The dependences of the kinetic coefficient and the diffusion rate at
the interface on the temperature are not usually considered. In models of dendritic
growth used for the computation of the rapid solidification kinetics (Eckler at al., 1992,
1994) the diffusion rate and the kinetic coefficient in a collision-limited form are entered
as independent fitting parameters. The method of computer simulation (Tarabaev at al.,
1991a) allows study the formation of a complex morphology of the solid – liquid interface
and it dynamics during a crystallization of pure metals (Tarabaev at al., 1991b) and metal
alloys (Tarabaev & Esin, 2000, 2001). In this work the crystallization from one centre of a
binary essentially nonequilibrium system is investigated in computer model (Tarabaev &
Esin, 2007) that takes into account the temperature dependence of the diffusion coefficient
and the nonequilibrium partition of dissolved component of the alloy (Aziz & Kaplan,
1988).
* Corresponding Author
www.intechopen.com
Supercooling
106
2. Computer model
2.1 Kinetics of crystallization
The computer model is based on a finite difference method. The two–dimensional finite-difference grid divides the system into cells. Each cell is characterized by a volume fraction of a solid phase gS. Assuming the normal mechanism of crystal growth the velocity of an interface motion V in a two-phase cell (0 < gS < 1) can be written as follows:
V T , (1)
where ┚ - is anisotropic kinetic coefficient, ΔT - is kinetic supercooling at the interface:
0( 1 )E I M I IT T T T d mc T (2)
Here TE - is equilibrium temperature, TM - is temperature of melting of first component, d0 - is capillary length:
d0 = ┛SL/Q , (3)
Here ┛SL - is surface tension of crystal – melt interface, Q - is heat of melting, κ - is interface curvature, m - is the slope of the equilibrium liquidus line (without sign), TI and cI - are the temperature and the concentration in the liquid at the interface, respectively.
The nonequilibrium effect of solute partition at interface is described by expression (Aziz & Kaplan, 1988) for partition coefficient k:
( )1 (1 )
D eS
L D e L
V V kck V
c V V k c
, (4)
where cS and cL - are concentration in the solid and in the liquid at the interface, respectively,
0 0/ Aek k k , (5)
Here k0 and 0Ak - are the equilibrium partition coefficients of solute and solvent, respectively;
VD - is the rate of diffusion:
exp /D aV f a E RT D a , (6)
Here f - is geometric factor, υ - is the atomic vibration frequency, a - is interatomic spacing,
Ea - is the activation barrier for diffusion through the interface, D - is coefficient of diffusion at the interface. The partition coefficient depends on the ratio of velocity of crystallization V to rate of diffusion VD. Rate of diffusion is the ratio of the diffusion coefficient at interface to the interatomic spacing.
The kinetic effect includes both temperature and orientation dependences of the kinetic coefficient, whose polar diagram has the four-fold symmetry and the directions of the maxima ┚ coincide with the principal grid directions. Then the velocity of an interface motion V can be written as (Chernov, 1980; Miroshnichenko, 1982):
' exp 'a EV T f a E RT Q T RT T , (7)
www.intechopen.com
Formation of Dissipative Structures During Crystallization of Supercooled Melts
107
where ┚ - is the kinetic coefficient:
' exp 'a Ef a E RT Q RT T , (8)
'f - is a factor of anisotropy, 'aE - is the activation barrier for atomic kinetics. The ratio of
the interface velocity to the diffusion rate in (4) can be written as follows
''
exp a a
D E
f E EV Q T
V f RT RT T
, (9)
In the case when the energy of activation for atomic kinetics 'aE is equal to the energy of
activation for diffusion Ea at the interface from expression (9) follows that
'
D E
fV Q T
V f RT T
. (10)
The ratio V/VD characterizes of the deviation degree from equilibrium of the interface for
given temperature (ΔT/T) and entropy of melting (Q/RTE). That is in terms of the atomic
kinetics it signifies the ratio of a resulting flux of atoms to an exchange (equilibrium) flux at
the interface. And the ratio ( '/f f ) characterizes the degree of the anisotropy of crystal
growth rate. In case of V = VD from the equation (10) the expression for a supercooling
follows:
*
'1
E
E
TT
f f Q RT , (11)
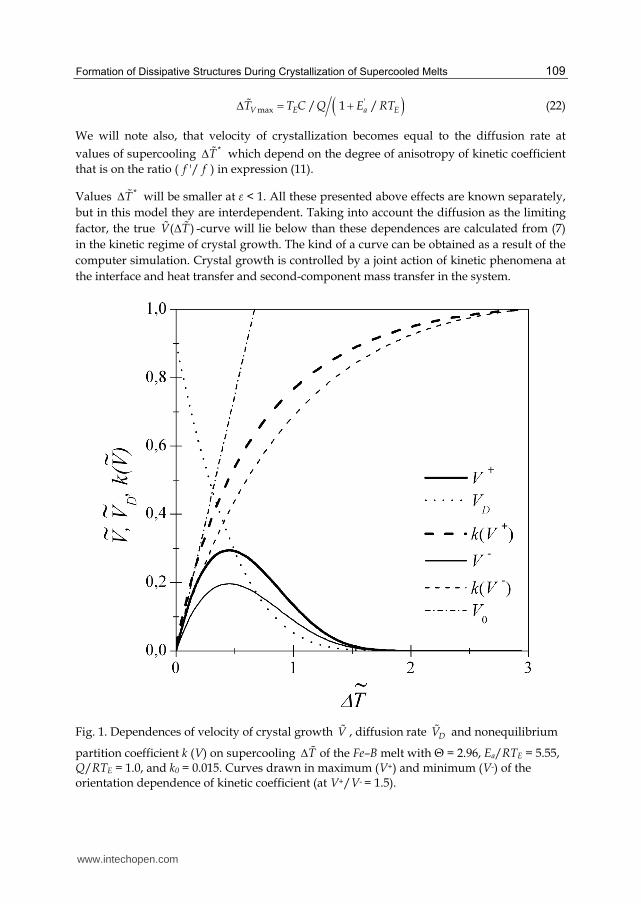
which can be the criterion of transition to nonequilibrium trapping of dissolved component of the alloy at interface at supercoolings larger than this value. Graphic presentation of the equations (1, 4, 6, and 7) for the system Fe-B is shown in Fig. 1.
2.2 Heat - and mass transfer in a system
For each volume element Ω of a system from conservation laws follow the equations for fields of cL , cS , and T:
(1 ) 1( ) ,L L S
L L LL L
c k c gg D T c dS
t g t g s
, (12)
( )S S S
L
c g gkc
t t
, (13)
2 ,ST gQT
t C t
(14)
where gS and gL - are fractions of solid and liquid phases, and C – is the thermal diffusivity
and capacity, respectively; the diffusion coefficient in the melt depends on the temperature:
www.intechopen.com
Supercooling
108
2( ) expL DD T a E RT (15)
Here, we neglect diffusion in the solid phase and the thermal diffusivity is accepted
identical in both phases. The source in equation (14) (also in (12)) is simulated by algorithm
developed in (Tarabaev at al., 1991a), using the expression for the change of a volume
fraction of a solid phase in two-phase cell of a system:
( ) ( )sg V n l n
t
, (16)
where n
- is the local normal to the interface segment in a two-phase cell and l ( n
) - is the
area of the interface segment. The finite-difference scheme of the problem was formulated with regard for these equations, and the corresponding computer program was modified (Tarabaev & Esin, 2007).
We now use the dimensionless quantities:
c = (c0/k0 – c)/Δ c0 , V = V/v0 , DV = VD/v0 , T = T C/Q.
Here, c0 - is the initial concentration of solute in melt,
Δc0 = c0 (1 – k0)/k0 v0 , (17)
v0 = ┚0 Q/C, (18)
┚0 - is isotropic kinetic coefficient at the phase equilibrium temperature. The relation between the diffusion rate and the kinetic coefficient at the equilibrium temperature has the form:
20( ) /D E EV T RT Q , (19)
where ε - is the factor which takes into account the difference between activation barriers for atomic kinetics and for the diffusion at the interface. We assume that
0( ) / /( / ) 0.9 D E EV T Q RT , (20)
here ε = 0.31 (ε = 1 at 'aE = Ea), and
Θ = ( / ) EC Q T . (21)
Dependence of growth velocity V on supercooling of the melt T is calculated in a
maximum (+) for max
'/f f = 1.5 and in minimum (-) for ( '/f f ) = 1 of orientation
dependence of a kinetic coefficient, which also depends on the temperature.
Velocity of crystallization 0V as function of supercooling in case of constant kinetic
coefficient (without temperature dependence) is presented in Fig. 1. At the large
supercoolings (dimensionless supercoolings are more approximately 0.2) the curve
calculated from (7) essentially deviates from the linear growth law. Velocity V as a function
of T has a maximum at the supercooling:
www.intechopen.com
Formation of Dissipative Structures During Crystallization of Supercooled Melts
109
'max / 1 /V E a ET T C Q E RT (22)
We will note also, that velocity of crystallization becomes equal to the diffusion rate at
values of supercooling *T which depend on the degree of anisotropy of kinetic coefficient
that is on the ratio ( '/f f ) in expression (11).
Values *T will be smaller at ε < 1. All these presented above effects are known separately,
but in this model they are interdependent. Taking into account the diffusion as the limiting
factor, the true ( )V T -curve will lie below than these dependences are calculated from (7)
in the kinetic regime of crystal growth. The kind of a curve can be obtained as a result of the
computer simulation. Crystal growth is controlled by a joint action of kinetic phenomena at
the interface and heat transfer and second-component mass transfer in the system.
Fig. 1. Dependences of velocity of crystal growth V , diffusion rate DV and nonequilibrium
partition coefficient k (V) on supercooling T of the Fe–B melt with Θ = 2.96, Ea/RTE = 5.55, Q/RTE = 1.0, and k0 = 0.015. Curves drawn in maximum (V+) and minimum (V-) of the orientation dependence of kinetic coefficient (at V+/V- = 1.5).
www.intechopen.com
Supercooling
110
3. Results of computer simulation
We consider the melt solidification from one centre in a two-dimensional system of different
sizes (N h x N h cells). Here h = 0.20 ( /v0) - is linear size of the unit cell.
The parameters of the problem approximately correspond to Fe-B system (Hansen &
Anderko, 1957; Hain & Burig, 1983): the iron melting temperature is FeMT = 1809 K, the
liquidus temperature is TE = 1803 K at an initial boron concentration c0 = 0.04 wt % B (Θ =
( / ) EC Q T = 2,96); Ea = 83.8 kJ/mol (Ea/RTE = 5,55), Q = 15.38 kJ/mol (Q/RTE ≈ 1), Q/C =
609K, the equilibrium partition coefficient is k0 = 0.015, and the slope of the liquidus line m =
-102 K/wt %. DL (TE) = 5 × 10⁻⁹ m2/s, SL = 0.12 J/m2, = 0.7 × 10⁻⁵ m2/s. The characteristic
scales of the problem ware as follows: the velocity v0 ≈ 1.2 × 10² m/s, length ( /v0 ) ≈ 1 ×
10-7 m, and time ( /v02 ) ≈ 1 × 10⁻⁹ s for 0 = 0.2 m/(s K).
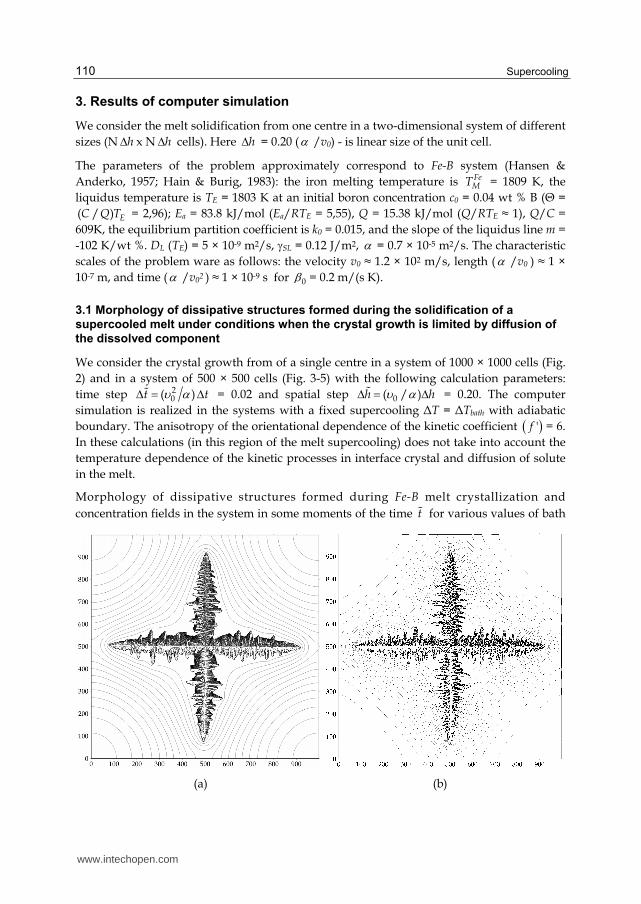
3.1 Morphology of dissipative structures formed during the solidification of a
supercooled melt under conditions when the crystal growth is limited by diffusion of
the dissolved component
We consider the crystal growth from of a single centre in a system of 1000 × 1000 cells (Fig.
2) and in a system of 500 × 500 cells (Fig. 3-5) with the following calculation parameters:
time step 20( )t t = 0.02 and spatial step 0( / )h h = 0.20. The computer
simulation is realized in the systems with a fixed supercooling ΔT = ΔTbath with adiabatic
boundary. The anisotropy of the orientational dependence of the kinetic coefficient 'f = 6.
In these calculations (in this region of the melt supercooling) does not take into account the
temperature dependence of the kinetic processes in interface crystal and diffusion of solute
in the melt.
Morphology of dissipative structures formed during Fe-B melt crystallization and
concentration fields in the system in some moments of the time t for various values of bath
(a) (b)
www.intechopen.com
Formation of Dissipative Structures During Crystallization of Supercooled Melts
111
(c) (d)
(e)
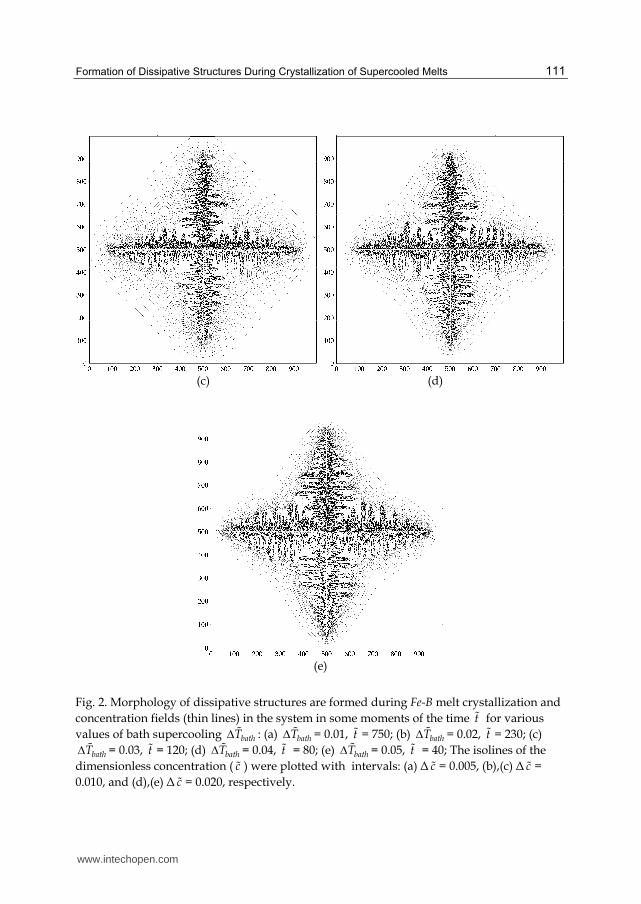
Fig. 2. Morphology of dissipative structures are formed during Fe-B melt crystallization and
concentration fields (thin lines) in the system in some moments of the time t for various
values of bath supercooling bathT : (a) bathT = 0.01, t = 750; (b) bathT = 0.02, t = 230; (c)
bathT = 0.03, t = 120; (d) bathT = 0.04, t = 80; (e) bathT = 0.05, t = 40; The isolines of the
dimensionless concentration ( c ) were plotted with intervals: (a) Δ c = 0.005, (b),(c) Δ c =
0.010, and (d),(e) Δ c = 0.020, respectively.
www.intechopen.com
Supercooling
112
(a) (b)
(c) (d)
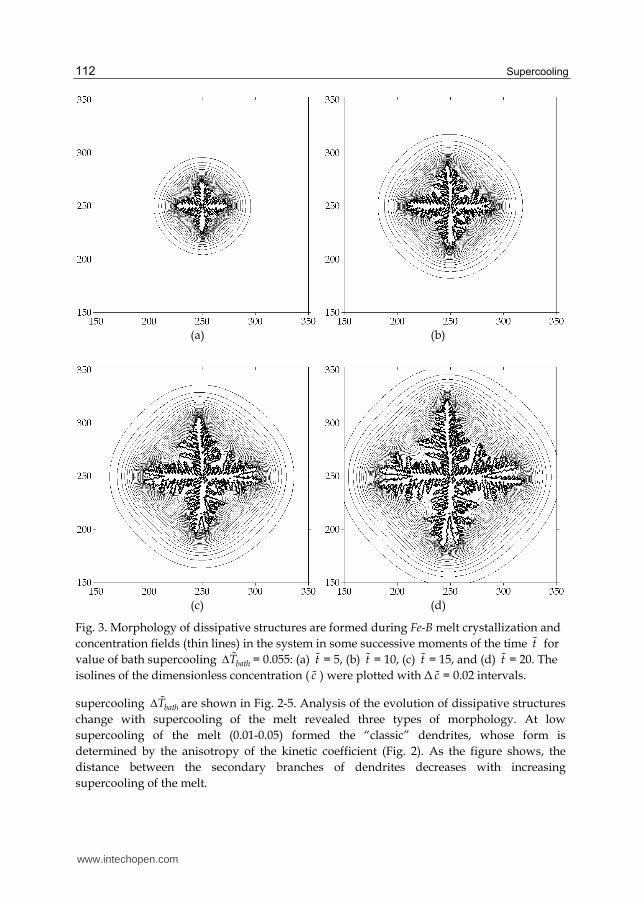
Fig. 3. Morphology of dissipative structures are formed during Fe-B melt crystallization and
concentration fields (thin lines) in the system in some successive moments of the time t for
value of bath supercooling bathT = 0.055: (a) t = 5, (b) t = 10, (c) t = 15, and (d) t = 20. The
isolines of the dimensionless concentration ( c ) were plotted with Δ c = 0.02 intervals.
supercooling bathT are shown in Fig. 2-5. Analysis of the evolution of dissipative structures
change with supercooling of the melt revealed three types of morphology. At low
supercooling of the melt (0.01-0.05) formed the “classic” dendrites, whose form is
determined by the anisotropy of the kinetic coefficient (Fig. 2). As the figure shows, the
distance between the secondary branches of dendrites decreases with increasing
supercooling of the melt.
www.intechopen.com
Formation of Dissipative Structures During Crystallization of Supercooled Melts
113
(a) (b)
(c) (d)
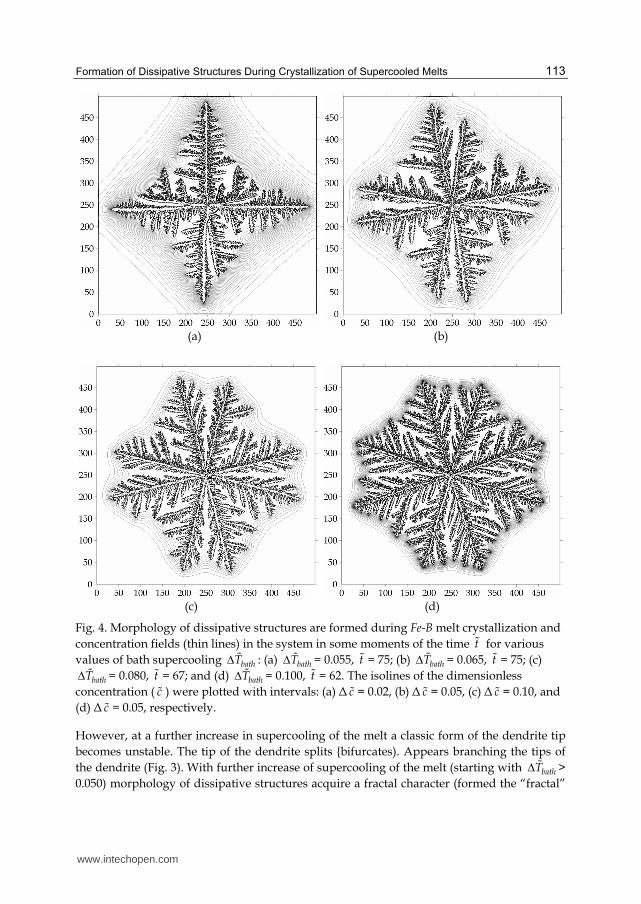
Fig. 4. Morphology of dissipative structures are formed during Fe-B melt crystallization and
concentration fields (thin lines) in the system in some moments of the time t for various
values of bath supercooling bathT : (a) bathT = 0.055, t = 75; (b) bathT = 0.065, t = 75; (c)
bathT = 0.080, t = 67; and (d) bathT = 0.100, t = 62. The isolines of the dimensionless
concentration ( c ) were plotted with intervals: (a) Δ c = 0.02, (b) Δ c = 0.05, (c) Δ c = 0.10, and
(d) Δ c = 0.05, respectively.
However, at a further increase in supercooling of the melt a classic form of the dendrite tip
becomes unstable. The tip of the dendrite splits {bifurcates). Appears branching the tips of
the dendrite (Fig. 3). With further increase of supercooling of the melt (starting with bathT >
0.050) morphology of dissipative structures acquire a fractal character (formed the “fractal”
www.intechopen.com
Supercooling
114
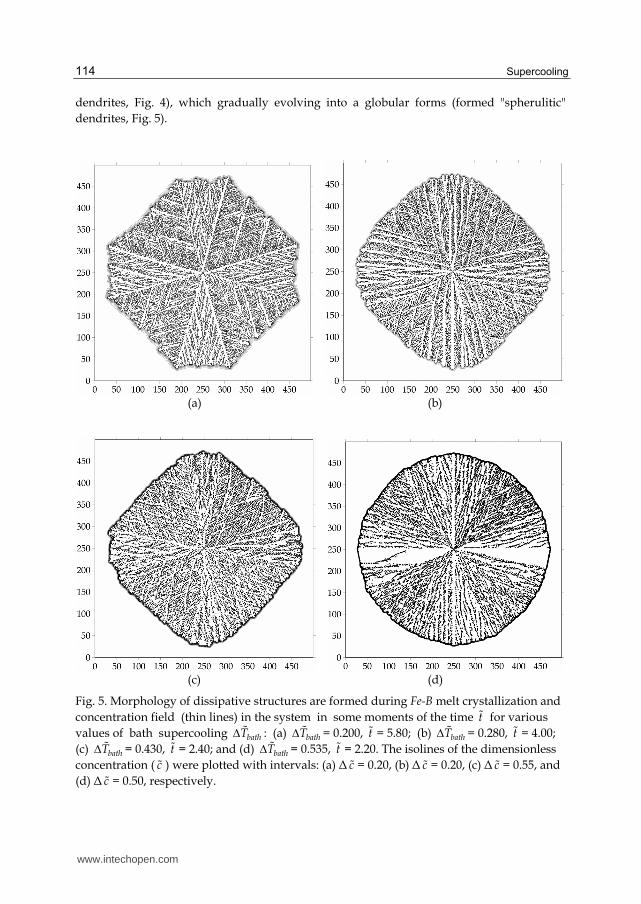
dendrites, Fig. 4), which gradually evolving into a globular forms (formed "spherulitic"
dendrites, Fig. 5).
(a) (b)
(c) (d)
Fig. 5. Morphology of dissipative structures are formed during Fe-B melt crystallization and
concentration field (thin lines) in the system in some moments of the time t for various
values of bath supercooling bathT : (a) bathT = 0.200, t = 5.80; (b) bathT = 0.280, t = 4.00;
(c) bathT = 0.430, t = 2.40; and (d) bathT = 0.535, t = 2.20. The isolines of the dimensionless
concentration ( c ) were plotted with intervals: (a) Δ c = 0.20, (b) Δ c = 0.20, (c) Δ c = 0.55, and
(d) Δ c = 0.50, respectively.
www.intechopen.com
Formation of Dissipative Structures During Crystallization of Supercooled Melts
115
The figure 3 shows the initial stage of crystal growth. Are seen differences of the concentration fields of the solute in the melt near the sharp and in the split tops of the dendrite. Growth rate of acute vertices of the dendrite is greater than its bifurcated tops. During further growth of the dendrite is a continuous branching its tops and trunks.
These figures show that with increasing supercooling of the melt increases the degree of branching of dendrites and decreases the length of the diffusion field the concentration of solute component in the melt.
At supercooling of the melt in which the formation of globular growth forms ("spherulitic" dendrite) the region of the diffusion changes in the concentration of the dissolved component is almost completely (entirely) are localized within the macroscopic solidification front (not beyond the radius of the "spherulitic" dendrite).
With the growth process development of the solid phase (with increasing the radius of “spherulitic” dendrite) decreases the curvature of the macroscopic surface of the crystallization front. This leads to the loss of morphological stability of the dissipative structure, to reduced the overall rate of phase transformation in terms of diffusion-limited growth of the solid phase and is responsible for the transition to a kinetic regime of growth under condition when the crystal growth controlled by processes of heat transfer in a system.
Observed in computer modeling of the evolution of the morphology of dissipative structures, formed during the solidification of a supercooled melts, is in full agreement with the paradigm of self-organized criticality, describing the general laws of the development of nonequilibrium, dynamic nonlinear systems. Its essence is that with the development of a nonlinear system, it will inevitably is approaching to the bifurcation point, its stability decreases, and there are conditions under which a small push can cause an avalanche.
The development of dissipative structures is a manifestation of self-organization in nonequilibrium nonlinear systems, providing a maximum rate of increase of entropy during the phase transformation (the principle of maximum rate of entropy increase). At the crystallization of supercooled binary melt the kinetic of phase transformation in the system is controlled by transport processes of the mass and heat (removal of solute and of heat that are released during the phase transformation at the interface), whose transport coefficients are (coefficients of diffusion and thermal conductivity) differ by three orders of magnitude. This causes the appearance of two cycles in the evolution of the morphology of dissipative structures and the kinetics of phase transformation with increasing supercooling of the melt.
3.2 Morphology of dissipative structures formed during the solidification of a supercooled melt under conditions when the crystal growth controlled by processes of heat and mass transfer in a system
We consider the melt solidification from one centre in a system of 250 × 250 cells with the
following calculation parameters: time step 20( )t t = 0.025 and spatial step
0( / )h h = 0.50. In special case the simulation is carried out for the time step t =
0.0125 and grid spacing h = 0.25 in a 1200 × 1200 system. The computer simulation is
realized for various initial and boundary conditions: the system is at the given supercooling
ΔT = ΔTbath with adiabatic boundary and the temperature on system boundary decreases
from some initial value Tinit < TE to T = TB with the given rate of melt cooling R.
www.intechopen.com
Supercooling
116
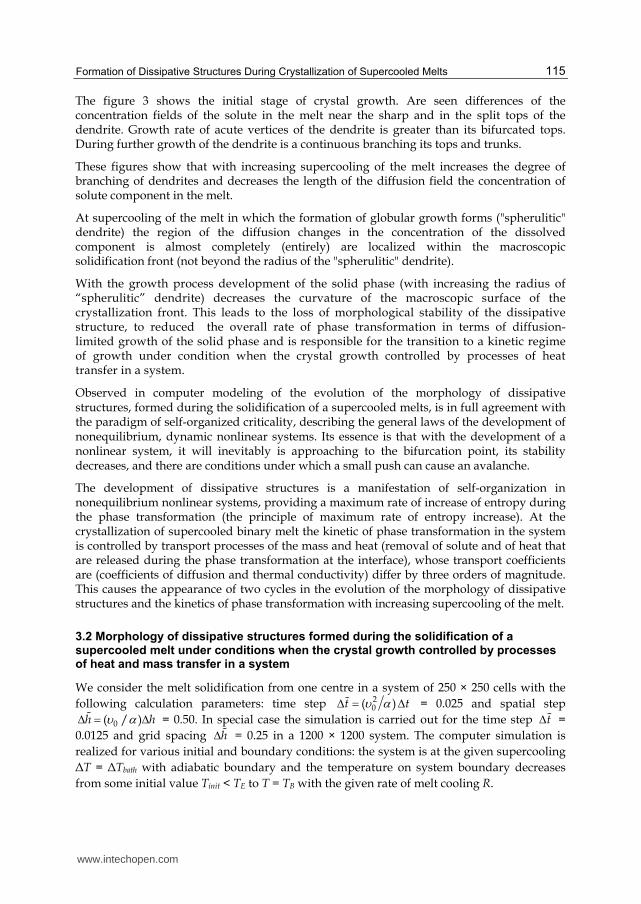
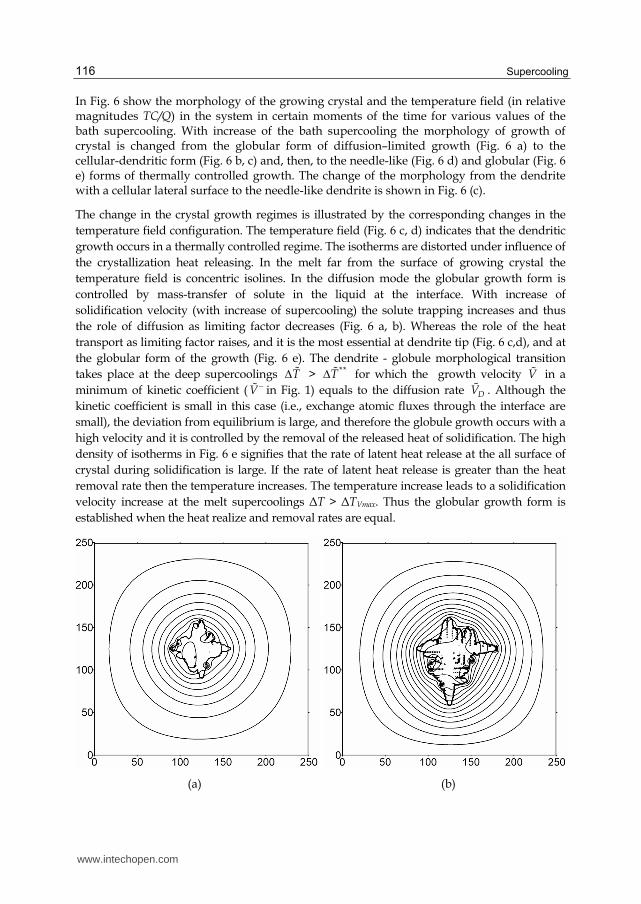
In Fig. 6 show the morphology of the growing crystal and the temperature field (in relative magnitudes TC/Q) in the system in certain moments of the time for various values of the bath supercooling. With increase of the bath supercooling the morphology of growth of crystal is changed from the globular form of diffusion–limited growth (Fig. 6 а) to the cellular-dendritic form (Fig. 6 b, c) and, then, to the needle-like (Fig. 6 d) and globular (Fig. 6 e) forms of thermally controlled growth. The change of the morphology from the dendrite with a cellular lateral surface to the needle-like dendrite is shown in Fig. 6 (с).
The change in the crystal growth regimes is illustrated by the corresponding changes in the
temperature field configuration. The temperature field (Fig. 6 c, d) indicates that the dendritic
growth occurs in a thermally controlled regime. The isotherms are distorted under influence of
the crystallization heat releasing. In the melt far from the surface of growing crystal the
temperature field is concentric isolines. In the diffusion mode the globular growth form is
controlled by mass-transfer of solute in the liquid at the interface. With increase of
solidification velocity (with increase of supercooling) the solute trapping increases and thus
the role of diffusion as limiting factor decreases (Fig. 6 a, b). Whereas the role of the heat
transport as limiting factor raises, and it is the most essential at dendrite tip (Fig. 6 с,d), and at
the globular form of the growth (Fig. 6 e). The dendrite - globule morphological transition
takes place at the deep supercoolings T > **T for which the growth velocity V in a
minimum of kinetic coefficient (V in Fig. 1) equals to the diffusion rate DV . Although the
kinetic coefficient is small in this case (i.e., exchange atomic fluxes through the interface are
small), the deviation from equilibrium is large, and therefore the globule growth occurs with a
high velocity and it is controlled by the removal of the released heat of solidification. The high
density of isotherms in Fig. 6 e signifies that the rate of latent heat release at the all surface of
crystal during solidification is large. If the rate of latent heat release is greater than the heat
removal rate then the temperature increases. The temperature increase leads to a solidification
velocity increase at the melt supercoolings ΔT > ΔTVmax. Thus the globular growth form is
established when the heat realize and removal rates are equal.
(a) (b)
www.intechopen.com
Formation of Dissipative Structures During Crystallization of Supercooled Melts
117
(c) (d)
(e)
Fig. 6. Morphology of dissipative structures (bold lines) are formed during Fe-B melt
crystallization and temperature fields (thin lines) in the system in some moments of the time
t for various values of bath supercooling bathT : (a) bathT = 0.55, t = 500; (b) bathT = 0.70,
t = 500; (c) bathT = 0.75, t = 250; (d) bathT = 0.85, t = 175; (e) bathT = 1.15, t = 250. The
isolines of the dimensionless temperature (TC/Q) were plotted with 0.02 intervals.
www.intechopen.com
Supercooling
118
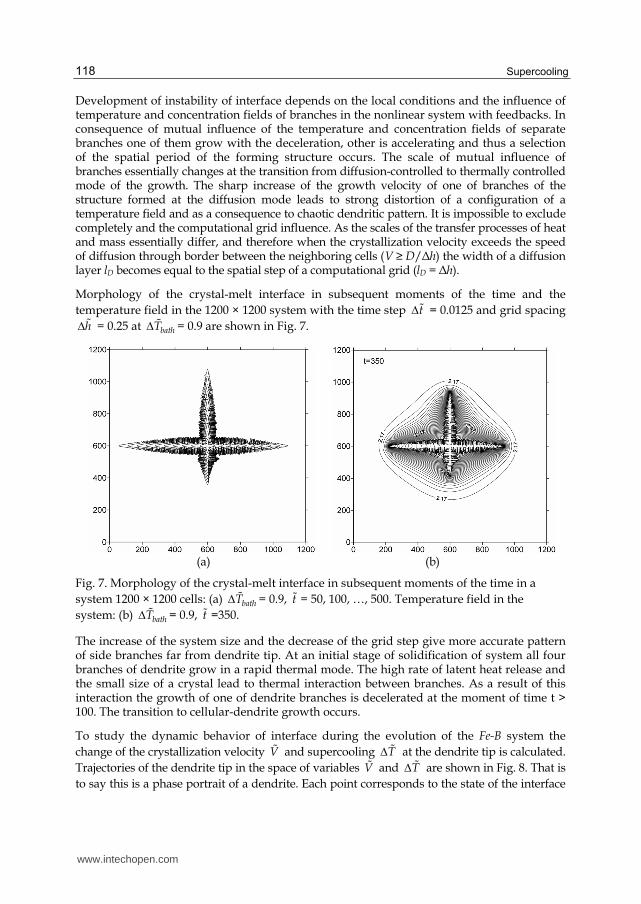
Development of instability of interface depends on the local conditions and the influence of temperature and concentration fields of branches in the nonlinear system with feedbacks. In consequence of mutual influence of the temperature and concentration fields of separate branches one of them grow with the deceleration, other is accelerating and thus a selection of the spatial period of the forming structure occurs. The scale of mutual influence of branches essentially changes at the transition from diffusion-controlled to thermally controlled mode of the growth. The sharp increase of the growth velocity of one of branches of the structure formed at the diffusion mode leads to strong distortion of a configuration of a temperature field and as a consequence to chaotic dendritic pattern. It is impossible to exclude completely and the computational grid influence. As the scales of the transfer processes of heat and mass essentially differ, and therefore when the crystallization velocity exceeds the speed of diffusion through border between the neighboring cells (V ≥ D/Δh) the width of a diffusion layer lD becomes equal to the spatial step of a computational grid (lD = Δh).
Morphology of the crystal-melt interface in subsequent moments of the time and the
temperature field in the 1200 × 1200 system with the time step t = 0.0125 and grid spacing
h = 0.25 at bathT = 0.9 are shown in Fig. 7.
(a) (b)
Fig. 7. Morphology of the crystal-melt interface in subsequent moments of the time in a
system 1200 × 1200 cells: (a) bathT = 0.9, t = 50, 100, …, 500. Temperature field in the
system: (b) bathT = 0.9, t =350.
The increase of the system size and the decrease of the grid step give more accurate pattern of side branches far from dendrite tip. At an initial stage of solidification of system all four branches of dendrite grow in a rapid thermal mode. The high rate of latent heat release and the small size of a crystal lead to thermal interaction between branches. As a result of this interaction the growth of one of dendrite branches is decelerated at the moment of time t > 100. The transition to cellular-dendrite growth occurs.
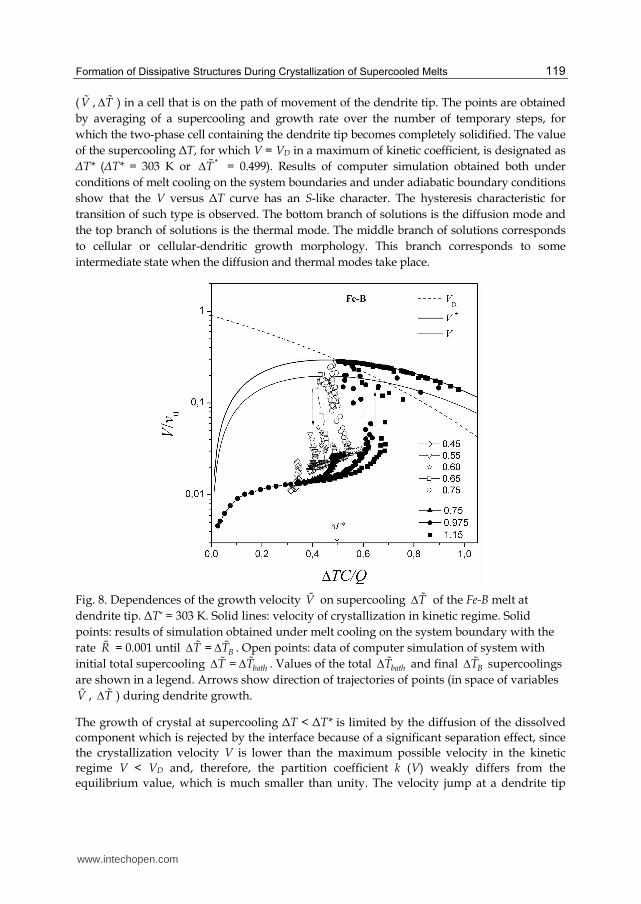
To study the dynamic behavior of interface during the evolution of the Fe-B system the
change of the crystallization velocity V and supercooling T at the dendrite tip is calculated.
Trajectories of the dendrite tip in the space of variables V and T are shown in Fig. 8. That is
to say this is a phase portrait of a dendrite. Each point corresponds to the state of the interface
www.intechopen.com
Formation of Dissipative Structures During Crystallization of Supercooled Melts
119
(V , T ) in a cell that is on the path of movement of the dendrite tip. The points are obtained
by averaging of a supercooling and growth rate over the number of temporary steps, for
which the two-phase cell containing the dendrite tip becomes completely solidified. The value
of the supercooling ΔT, for which V = VD in a maximum of kinetic coefficient, is designated as
ΔT* (ΔT* = 303 K or *T = 0.499). Results of computer simulation obtained both under
conditions of melt cooling on the system boundaries and under adiabatic boundary conditions
show that the V versus ΔT curve has an S-like character. The hysteresis characteristic for
transition of such type is observed. The bottom branch of solutions is the diffusion mode and
the top branch of solutions is the thermal mode. The middle branch of solutions corresponds
to cellular or cellular-dendritic growth morphology. This branch corresponds to some
intermediate state when the diffusion and thermal modes take place.
Fig. 8. Dependences of the growth velocity V on supercooling T of the Fe-B melt at
dendrite tip. ΔT* = 303 K. Solid lines: velocity of crystallization in kinetic regime. Solid
points: results of simulation obtained under melt cooling on the system boundary with the
rate R = 0.001 until T = BT . Open points: data of computer simulation of system with
initial total supercooling T = bathT . Values of the total bathT and final BT supercoolings
are shown in a legend. Arrows show direction of trajectories of points (in space of variables
V , T ) during dendrite growth.
The growth of crystal at supercooling ΔT < ΔT* is limited by the diffusion of the dissolved
component which is rejected by the interface because of a significant separation effect, since
the crystallization velocity V is lower than the maximum possible velocity in the kinetic
regime V < VD and, therefore, the partition coefficient k (V) weakly differs from the
equilibrium value, which is much smaller than unity. The velocity jump at a dendrite tip
www.intechopen.com
Supercooling
120
supercooling ΔT ≥ ΔT* corresponds to the morphological transition conditioned by the
change from a diffusion to a kinetic growth regime controlled by heat transfer in the system.
The segregation of dissolved component at the dendrite tip practically is absent, since the
partition coefficient k (V) is close to unity.
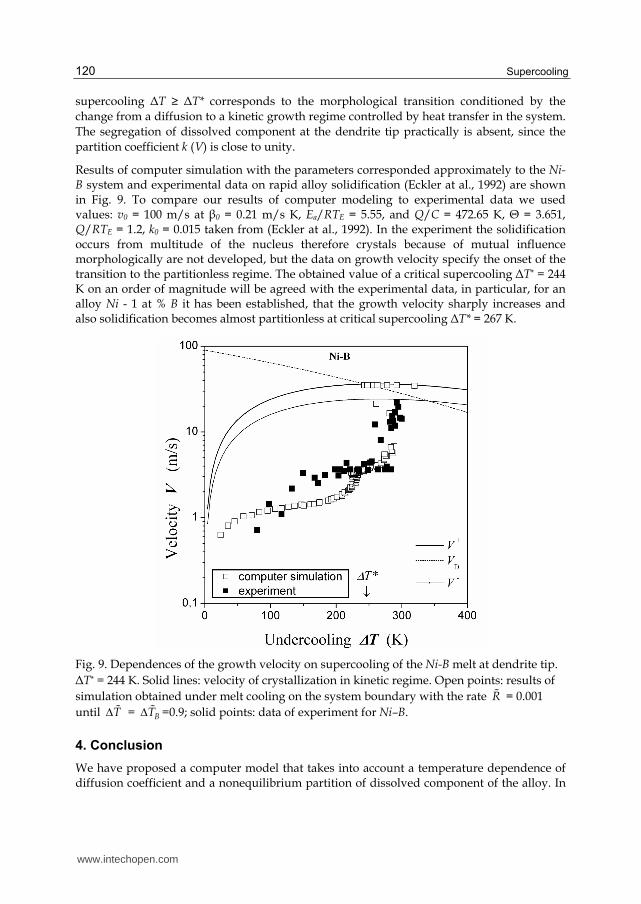
Results of computer simulation with the parameters corresponded approximately to the Ni-B system and experimental data on rapid alloy solidification (Eckler at al., 1992) are shown in Fig. 9. To compare our results of computer modeling to experimental data we used values: v0 = 100 m/s at ┚0 = 0.21 m/s K, Ea/RTE = 5.55, and Q/C = 472.65 K, Θ = 3.651, Q/RTE = 1.2, k0 = 0.015 taken from (Eckler at al., 1992). In the experiment the solidification occurs from multitude of the nucleus therefore crystals because of mutual influence morphologically are not developed, but the data on growth velocity specify the onset of the transition to the partitionless regime. The obtained value of a critical supercooling ΔT* = 244 K on an order of magnitude will be agreed with the experimental data, in particular, for an alloy Ni - 1 at % B it has been established, that the growth velocity sharply increases and also solidification becomes almost partitionless at critical supercooling ΔT* = 267 К.
Fig. 9. Dependences of the growth velocity on supercooling of the Ni-B melt at dendrite tip.
ΔT* = 244 K. Solid lines: velocity of crystallization in kinetic regime. Open points: results of
simulation obtained under melt cooling on the system boundary with the rate R = 0.001
until T = BT =0.9; solid points: data of experiment for Ni–B.
4. Conclusion
We have proposed a computer model that takes into account a temperature dependence of diffusion coefficient and a nonequilibrium partition of dissolved component of the alloy. In
www.intechopen.com
Formation of Dissipative Structures During Crystallization of Supercooled Melts
121
this model the dynamics of the formation of dendritic patterns from a crystallization centre has been investigated. The dependence of interface velocity V on an supercooling ΔT at the dendrite tip is obtained during rapid solidification of Fe-B and Ni-B systems. The morphological transition which is conditioned by change of a diffusion growth mode on thermal growth (dendrites have the form as a needle) at some supercooling at a dendrite tip ΔT ≥ ΔT* is detected. The V versus ΔT curve has an S-like character as well as was shown for flat front of crystallization (Galenko & Danilov, 2000) and for parabolic shape of dendrite (Eckler at al., 1994) by analytic methods. Values of a critical supercooling ΔT* and a growth velocity discontinuity depend on both the anisotropy of the kinetic coefficient, and the difference in the activation energies for atomic kinetics and for diffusion at the interface. The obtained values of a critical supercooling ΔT* and a growth velocity discontinuity on an order of magnitude agree with well-known experimental data (Eckler at al., 1992).
It is necessary to note, that in the experiment the bath supercooling is measured, and in the present work it is investigated the change of velocity and supercooling at a dendrite tip during the crystallization at the given bath supercooling or the cooling rate. Experimental data for Ni-B (Eckler at al., 1992) and recent data for Ti-Al (Hartmann at al., 2008) testify that velocity increases with supercooling at a thermal mode. It means, that ΔT* < ΔTVmax. In approach of the given model we obtain for Ni-B ΔT* = 244 K, ΔTVmax = 263 K and for Ti-Al ΔT* = 150 K, ΔTVmax = 266 K using material parameters from (Eckler at al., 1992) and (Hartmann at al., 2008), respectively. For more correct comparison with experimental data it is necessary to carry out special modelling taking into account all details of experiment. It was not the purpose of given article.
The proposed computer model allows investigate the solidification of metastable melt at the temperatures in the wide range between the equilibrium liquidus and the glass transition. As it has been noted in (Tarabaev & Esin, 2007), that for enough large rates of cooling the transition to the thermal mode can not be realized, i.e. the system becomes "frozen": when crystal growth is decelerated because recalescence is suppressed and the melt is amorphized (glass transition temperature for the Fe-B system is TG ~ 0.5 TM or the supercooling is ΔTG ~ 1.5 Q/C (Elliot, 1983). The crystal growth models with a collision-limited interfacial kinetics are not suitable for the description of alloy solidification at a very large supercooling when a glass formation occurs (Greer, 2001).
5. References
Ahmad, N. A., Wheeler, A. A., Boettinger, W. J., & McFadden, G. B. (1998). Solute trapping and solute drag in a phase-field model of rapid solidification. Physical Review E, Vol.58, No.3, pp. 3436-3450, ISSN 1539-3755
Aziz, M. J., & Kaplan, T. (1988). Continuous growth model for interface motion during alloy solidification. Acta Metallurgica, Vol.36, pp. 2335-2347, ISSN 0001-6160
Aziz, M. J. (1994). Nonequilibrium Interface Kinetics During Rapid Solidification. Materials Science and Engineering A, Vol.178, pp. 167-170, ISSN 0921-5093
Bartel, J., Buhrig, E., Hain, K., & Kuchar, L. (1983). Kristallisation aus Schmelzen: A Handbook, K. Hain, E. Buhrig, (Eds.), VEB Deutscher Verlag für Grundstoffindustrie, Leipzig
Chernov, A. A., & Lewis, J. (1967). Computer model of crystallization of binary systems: kinetic phase transitions. Journal of Physics and Chemistry of Solids, Vol.28, No.11, pp. 2185-2198, ISSN 0022-3697
www.intechopen.com
Supercooling
122
Chernov, A. A. (1980). Crystallization processes. In: Modern Crystallograph, B.K. Vainshtein, (Ed.), Vol.3, pp. 7-232, Nauka, Moscow, USSR, Russian Federation
Eckler, K., Cochrane, R. F., Herlach, D. M., Feuerbacher, B., & Jurisch, M. (1992). Evidence for a Transition from Diffusion-Controlled to Thermally Controlled Solidification in Metallic Alloys. Physical Review B, Vol.45, pp. 5019-5022, ISSN 1098-0121
Eckler, K., Herlach, D. M., & Aziz, M. J. (1994). Search for a Solute-Drag Effect in Dendritic Solidification. Acta Metallurgica et Materialia, Vol.42, pp. 975-979, ISSN 0956-7151
Elliot, R. (1983). Eutectic Solidification Processing: crystalline and glassy alloys. Butterworths, London, Boston, ISBN 0-408-107146.
Greer, A. L. (2001). From metallic glasses to nanocrystalline solids. Proc. of 22nd Risø Int. Symp. on Materials Science: Science of Metastable and Nanocrystalline Alloys Structure, Properties and Modelling (Risø National Laboratory Roskilde Denmark 2001), pp. 461-466
Galenko, P. K., & Danilov, D. A. (2000). Selection of the dynamically stable regime of rapid solidification front motion in an isothermal binary alloy. Journal of Crystal Growth, Vol.216, No.1-4, pp. 512–526, ISSN 0022-0248
Hansen, M., & Anderko, K. (1958). Constitution of Binary Alloys. McGraw-Hill Book Company, INC, New York, Toronto, London
Hartmann, H., Galenko, P. K., Holland-Moritz, D., Kolbe, M., Herlach, D. M., & Shuleshova, O. (2008). Nonequilibrium solidification in undercooled Ti[sub 45]Al[sub 55] melts. Journal of Applied Physics, Vol.103, No.7, pp. 073509-073518, ISSN 0021-8979
Kittl, J. A., Sanders, P. G., Aziz, M. J., Brunco, D. P., & Thompson, M. O. (2000). Complete Experimental Test for Kinetic Models of Rapid Alloy Solidification. Acta Materialia, Vol.48, pp. 4797-4811, ISSN 1359-6454
Miroshnichenko, I. S. (1982). Quenching from the liquid state, Metallurgiya, Moscow, USSR Nikonona, V. V., & Temkin, D. E. (1966). Dendrite growth kinetics in some binary melts, In:
Growth and Imperfections of Metallic Crystals, D.E.Ovsienko, (Ed.), pp. 53-59, Naukova Dumka, Kiev, USSR
Ramirez, J. C., Beckermann, C., Karma, A., & Diepers, H.-J. (2004). Phase-field modeling of binary alloy solidification with coupled heat and solute diffusion. Physical Review E, Vol.69, No.5, pp. 051607-051616, ISSN 1539-3755
Tarabaev, L. P., Mashikhin, A. M., & Vdovina, I. A. (1991). Computer simulation of dendritic crystal growth. VINITI, Moscow, No. 2915-V91
Tarabaev, L. P., Mashikhin, A. M., & Esin, V. O. (1991). Dendritic crystal growth in supercooled melt. J. Crystal Growth, Vol. 114, No. 4, pp. 603 – 612, ISSN 0022-0248
Tarabaev, L. P., Psakh’e, S. G., & Esin, V. O. (2000). Computer Simulation of Segregation, Plastic Deformation, and Defect Formation during Synthesis of Composite Materials. The Physics Metals and Metallography, Vol.89, No.3, pp. 217 – 224, ISSN 0031-918X
Tarabaev, L. P., & Esin, V. O. (2001). Formation of Dendritic Struture upon Directional Solidification of Ternary Alloys. Russian Metallurgy (Metally), Vol.2001, No.4, pp. 366- 372, ISSN 0036-0295
Tarabaev, L. P., & Esin, V. O. (2007). Computer Simulation of the Crystal Morphology and Growth Rate during Ultrarapid Cooling of an Fe-B Melt. Russian Metallurgy (Metally), Vol.2007, No.6, pp. 478-483, ISSN 0036-0295
Temkin, D. E. (1970). Kinetic phase transition at the phase transition in binary alloys. Kristallografiya, Vol.15, No.5, pp. 884-893, ISSN 0023-4761
Wheeler, A. A., Boettinger, W. J., & McFadden, G. B. (1993). Phase-field model of solute trapping during solidification. Physical Review E, Vol.47, No.3, pp. 1893-1909, ISSN 1539-3755
www.intechopen.com
SupercoolingEdited by Prof. Peter Wilson
ISBN 978-953-51-0113-0Hard cover, 134 pagesPublisher InTechPublished online 09, March, 2012Published in print edition March, 2012
InTech EuropeUniversity Campus STeP Ri Slavka Krautzeka 83/A 51000 Rijeka, Croatia Phone: +385 (51) 770 447 Fax: +385 (51) 686 166www.intechopen.com
InTech ChinaUnit 405, Office Block, Hotel Equatorial Shanghai No.65, Yan An Road (West), Shanghai, 200040, China
Phone: +86-21-62489820 Fax: +86-21-62489821
Supercooled liquids are found in the atmosphere, in cold hardy organisms, in metallurgy, and in manyindustrial systems today. Stabilizing the metastable, supercooled state, or encouraging the associated processof nucleation have both been the subject of scientific interest for several hundred years. This book is aninvaluable starting point for researchers interested in the supercooling of water and aqueous solutions inbiology and industry. The book also deals with modeling and the formation subsequent dendritic growth ofsupercooled solutions, as well as glass transitions and interface stability.
How to referenceIn order to correctly reference this scholarly work, feel free to copy and paste the following:
Leonid Tarabaev and Vladimir Esin (2012). Formation of Dissipative Structures During Crystallization ofSupercooled Melts, Supercooling, Prof. Peter Wilson (Ed.), ISBN: 978-953-51-0113-0, InTech, Available from:http://www.intechopen.com/books/supercooling/formation-of-dissipative-structures-during-crystallization-of-supercooled-melts-