Embed Size (px)
Citation preview

Scripta Materialia 57 (2007) 157–160
www.elsevier.com/locate/scriptamat
Formation of amorphous phases in an immiscibleCu–Nb system studied by molecular dynamics
simulation and ion beam mixing
T.L. Wang, J.H. Li, K.P. Tai and B.X. Liu*
Advanced Materials Laboratory, Department of Materials Science and Engineering, Tsinghua University, Beijing 100084, China
Received 23 January 2007; revised 2 March 2007; accepted 5 March 2007Available online 19 April 2007
An n-body potential is constructed and applied to investigate the crystal-to-amorphous transition of the immiscible Cu–Nbsystem by molecular dynamics simulation. It is found that supersaturated solid solutions could turn into disordered states whenthe composition falls into the range of about 15–72 at.% Nb, suggesting that amorphous alloy could be formed in this range forthe Cu–Nb system. Interestingly, amorphous phases are obtained in the Cu70Nb30 and Cu30Nb70 multilayered films upon ion beammixing.� 2007 Acta Materialia Inc. Published by Elsevier Ltd. All rights reserved.
Keywords: Amorphous phase; Molecular dynamics simulations; Ion beam mixing; Cu–Nb alloy; Glass-forming ability
In 1959, Klement et al. obtained the first amorphousalloy (metallic glass) by liquid melt quenching in theAu–Si system [1], and since then a number of techniqueshave been developed to produce amorphous alloys [2].In the early 1980s, a powerful glass-producing tech-nique, i.e. ion beam mixing (IBM) of multilayered films,was introduced [3], by which a large number of metallicglasses were produced in both miscible and immisciblesystems [4]. Subsequently, several empirical criteriaand models have been proposed to predict the composi-tion range in which amorphous alloys could be formed[5]. In past decades, significant progress has beenachieved in computational materials science, and, as apowerful tool, molecular dynamics (MD) simulationhas been widely used to observe and characterize theamorphous alloys of special systems [6–8]. In recentyears, the equilibrium immiscible Cu–Nb system charac-terized with a positive heat of formation (+4 kJ mol�1)has attracted considerable attention, as its compositesexhibit high fatigue endurance, and high thermal andelectrical conductivity [9,10]. Its equilibrium phase dia-gram shows that there are no Cu–Nb compounds overthe entire composition range [11]. Nonetheless, underfar from equilibrium conditions, some metastable crys-
1359-6462/$ - see front matter � 2007 Acta Materialia Inc. Published by Eldoi:10.1016/j.scriptamat.2007.03.006
* Corresponding author. Tel.: +86 10 6277 2557; fax: +86 10 62771160; e-mail: [email protected]
talline or amorphous phases could be obtained [12–14]. In the present study, MD simulation and IBMexperiment are employed to reveal the amorphizationbehavior of the Cu–Nb system.
To conduct MD simulations, an n-body potential isconstructed for the Cu–Nb system based on the secondmoment approximation of the tight-binding (TB-SMA)scheme. In the original TB-SMA formalism, the totalenergy of a system is given by
Etot ¼1
2
Xj 6¼i
/ðrijÞ �X
i
ffiffiffiffiffiffiffiffiffiffiffiffiffiffiffiffiffiffiffiXj 6¼i
wðrijÞs
: ð1Þ
The first term in the equation is the repulsive portionderived from Born–Mayer pairwise interaction and thesecond is the band-structure term, i.e. a many-bodiedterm, which is a second moment approximation of thetight-binding band energy [15]. Here, we make somemodification to both terms. To calculate the interactionbetween Cu–Cu and Cu–Nb, /(rij) and w(rij) areexpressed as follows:
/ðrijÞ ¼A1 exp �P 1
rij
r0� 1
� �h irij < rm1;
A1m exp �P 1mrij
r0� 1
� �h irc1
r0� rij
r0
� �n1
rm1 < rij < rc1;
8><>:
ð2Þ
sevier Ltd. All rights reserved.

158 T. L. Wang et al. / Scripta Materialia 57 (2007) 157–160
wðrijÞ ¼A2 exp �P 2
rij
r0� 1
� �h irij < rm2;
A2m exp �P 2mrij
r0� 1
� �h irc2
r0� rij
r0
� �n2
rm2 < rij < rc2:
8><>:
ð3ÞIn the equations, rc1, rc2 are cutoff radii, r0 is the firstneighbor distance, and A1, P1, A2 and P2 are adjustableparameters, i.e. potential parameters. n1 and n2 are gen-erally adopted integer values and can be adjustable, andshould be greater than 3 to ensure that /(rij), w(rij) andtheir first derivatives smoothly go to zero at cutoff radii.A1m, P1m, A2m, P2m, rm1 and rm2 are also adjustable, butthe two functions and their first derivatives should bekept constant at rm1 and rm2. If necessary, all the param-eters in the equation could be adjustable. While calculat-ing the interaction between Nb–Nb, the repulsiveportion and the band-structure term are expressed asfollows:
/ðrijÞ ¼ ðrij� rc1Þmðc0þ c1rijþ c2r2ijþ c3r3
ijþ c4r4ijÞ rij 6 rc1;
ð4Þ
wðrijÞ ¼ aðrij� rc2Þn exp �brij
r0
� 1
� �� �rij 6 rc2: ð5Þ
Here rc1, rc2 are also cutoff radii, r0 is the first neighbordistance, and c0, c1, c2, c3, a and b are adjustable param-eters. m and n are two integers, often greater than 3.
For pure Cu and Nb, the potential parameters aredetermined by fitting the experimental properties, i.e.cohesive energy, lattice constant, elastic constants andbulk modulus. The physical properties reproduced fromthe derived Cu and Nb potentials as well as the corre-sponding experimental properties used in fitting thepotential are listed in Table 1. From Table 1, one cansee that the derived Cu and Nb potentials work fairlywell in reproducing the physical properties of the pureCu and Nb, respectively. To prove the relevance of theCu and Nb potentials, we also reproduce the cohesiveenergies of their metastable structures for pure Cu andNb, respectively. The results show that the cohesive en-ergy of face-centered cubic (fcc) Cu is 3.80 eV, greaterthan that of hexagonal close-packed (hcp) or body-cen-tered cubic (bcc) Cu (3.77 and 3.78 eV), and that thecohesive energy of bcc Nb is 7.56 eV, greater than thatof the fcc or hcp Nb (7.27 and 7.22 eV), matching wellthe fact that the equilibrium states of pure Cu and Nbare fcc and bcc structure, respectively. In addition, we
Table 1. The lattice constants (a), cohesive energy (Ec), elastic constants (Cij)with their experimental values of Cu and Nb and ab initio calculations of L
Cu Nb
a (A) This work 3.62 3.30Exp./ab initio 3.62 3.30
Ec (eV) This work 3.80 7.56Exp./ab initio 3.49 7.57
C11 (Mbar) This work 1.65 2.51Exp./ab initio 1.68 2.47
C12 (Mbar) This work 1.24 1.33Exp./ab initio 1.22 1.35
C44 (Mbar) This work 0.79 0.29Exp./ab initio 0.76 0.29
B0 (Mbar) This work 1.38 1.72Exp./ab initio 1.37 1.70
further derive the equations of state from the con-structed potentials and they agree well with the corre-sponding Rose’s equations [16].
Since, we are dealing with the equilibrium immiscibleCu–Nb system, there are few available experimentaldata related to the Cu–Nb compounds. In this respect,the ab initio calculation based on quantum mechanicsis known to be a reliable way to acquire some physicalproperties of the compounds of interest [17]. In the pres-ent study, it was carried out by using the well-estab-lished Vienna ab initio simulation package (VASP)[18]. Employing the program, we have calculated the lat-tice constants, cohesive energies, elastic constants andbulk modulus for three hypothetic Cu–Nb compounds:L12 Cu3Nb, B2 CuNb and L12 CuNb3. With the calcu-lated data, the cross potential of the Cu–Nb system wasfitted. The data of properties obtained from the ab initiocalculation and derived from the potential are also listedin Table 1, and one can see that the calculated propertiesfrom the constructed cross potential are in good agree-ment with those obtained from ab initio calculations,qualitatively or semi-quantitatively.
Applying the derived potential, MD simulation isconducted with a Parrinello–Rahman constant pressurescheme and the equations of motion are solved througha fourth-order predictor–corrector algorithm of Gearwith a time step t = 5 · 10�15 s [19]. In the simulations,we use the fcc Cu-based and bcc Nb-based solid solu-tions models [20], respectively. The solid solution modelsconsist of 8 · 8 · 8 = 512 unit cells (2048 atoms) for thefcc Cu-based solid solution and 10 · 10 · 10 = 1000 unitcells (2000 atoms) for the bcc Nb-based solid solutions,respectively. For all solid solution models, the [100],[010] and [001] crystalline directions are parallel tothe x, y and z axes, respectively, and in these three axes,the periodic boundary conditions are adopted. In settingthe solid solution models, the solute atoms are addedinto the model by randomly substituting the desirednumber of solvent atoms to obtain the initial state ofthe solid solution models. Simulations are conductedunder the pressure of 0 Pa and the temperature of300 K for 50,000 MD time steps to reach a relativelystable state, when all the related dynamic variables showno secular variation. The structural phase transitions inthe solid solutions are monitored by the projections ofatomic positions and the pair-correlation function g(r)[21].
and bulk modulus (B0) reproduced from the present potential, together12 Cu3Nb, B2 CuNb and L12 CuNb3
L12 Cu3Nb B2 CuNb L12 CuNb3
3.77 3.16 3.963.81 3.12 4.053.75 4.40 5.774.18 5.35 6.401.50 0.89 0.981.49 1.69 0.941.28 1.32 1.771.54 1.70 1.920.66 0.56 0.810.48 0.48 0.441.36 1.17 1.511.48 1.68 1.59
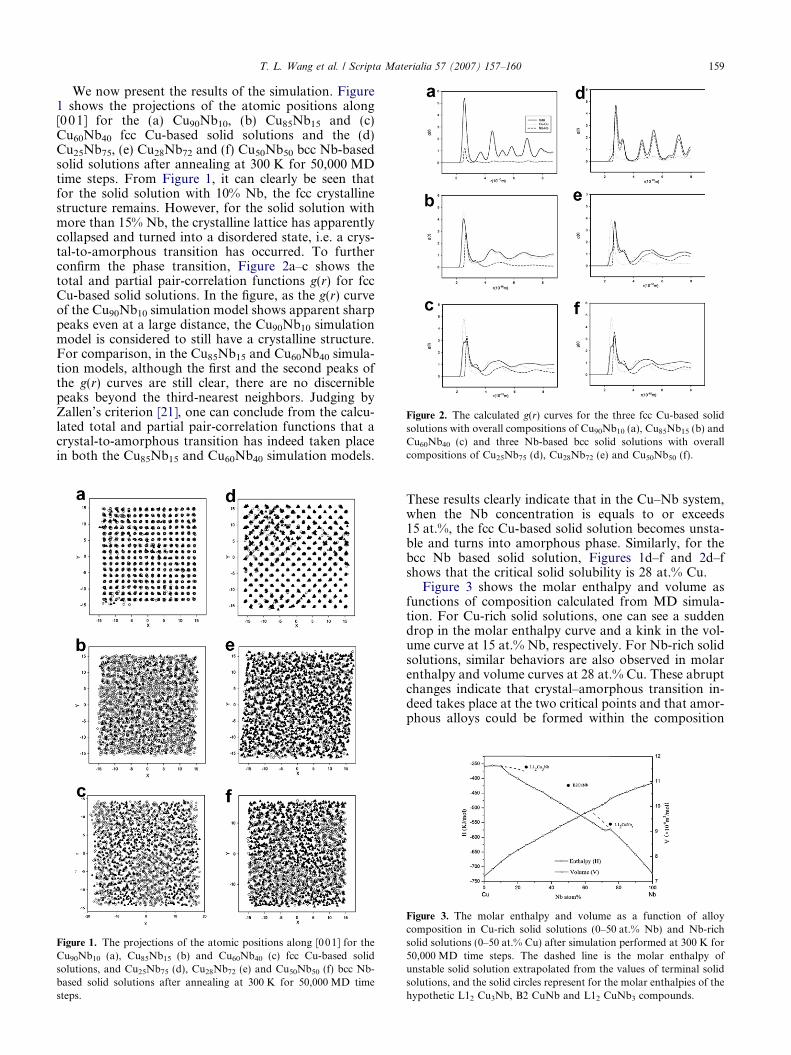
Figure 2. The calculated g(r) curves for the three fcc Cu-based solidsolutions with overall compositions of Cu90Nb10 (a), Cu85Nb15 (b) andCu60Nb40 (c) and three Nb-based bcc solid solutions with overallcompositions of Cu25Nb75 (d), Cu28Nb72 (e) and Cu50Nb50 (f).
T. L. Wang et al. / Scripta Materialia 57 (2007) 157–160 159
We now present the results of the simulation. Figure1 shows the projections of the atomic positions along[001] for the (a) Cu90Nb10, (b) Cu85Nb15 and (c)Cu60Nb40 fcc Cu-based solid solutions and the (d)Cu25Nb75, (e) Cu28Nb72 and (f) Cu50Nb50 bcc Nb-basedsolid solutions after annealing at 300 K for 50,000 MDtime steps. From Figure 1, it can clearly be seen thatfor the solid solution with 10% Nb, the fcc crystallinestructure remains. However, for the solid solution withmore than 15% Nb, the crystalline lattice has apparentlycollapsed and turned into a disordered state, i.e. a crys-tal-to-amorphous transition has occurred. To furtherconfirm the phase transition, Figure 2a–c shows thetotal and partial pair-correlation functions g(r) for fccCu-based solid solutions. In the figure, as the g(r) curveof the Cu90Nb10 simulation model shows apparent sharppeaks even at a large distance, the Cu90Nb10 simulationmodel is considered to still have a crystalline structure.For comparison, in the Cu85Nb15 and Cu60Nb40 simula-tion models, although the first and the second peaks ofthe g(r) curves are still clear, there are no discerniblepeaks beyond the third-nearest neighbors. Judging byZallen’s criterion [21], one can conclude from the calcu-lated total and partial pair-correlation functions that acrystal-to-amorphous transition has indeed taken placein both the Cu85Nb15 and Cu60Nb40 simulation models.
Figure 1. The projections of the atomic positions along [001] for theCu90Nb10 (a), Cu85Nb15 (b) and Cu60Nb40 (c) fcc Cu-based solidsolutions, and Cu25Nb75 (d), Cu28Nb72 (e) and Cu50Nb50 (f) bcc Nb-based solid solutions after annealing at 300 K for 50,000 MD timesteps.
These results clearly indicate that in the Cu–Nb system,when the Nb concentration is equals to or exceeds15 at.%, the fcc Cu-based solid solution becomes unsta-ble and turns into amorphous phase. Similarly, for thebcc Nb based solid solution, Figures 1d–f and 2d–fshows that the critical solid solubility is 28 at.% Cu.
Figure 3 shows the molar enthalpy and volume asfunctions of composition calculated from MD simula-tion. For Cu-rich solid solutions, one can see a suddendrop in the molar enthalpy curve and a kink in the vol-ume curve at 15 at.% Nb, respectively. For Nb-rich solidsolutions, similar behaviors are also observed in molarenthalpy and volume curves at 28 at.% Cu. These abruptchanges indicate that crystal–amorphous transition in-deed takes place at the two critical points and that amor-phous alloys could be formed within the composition
Figure 3. The molar enthalpy and volume as a function of alloycomposition in Cu-rich solid solutions (0–50 at.% Nb) and Nb-richsolid solutions (0–50 at.% Cu) after simulation performed at 300 K for50,000 MD time steps. The dashed line is the molar enthalpy ofunstable solid solution extrapolated from the values of terminal solidsolutions, and the solid circles represent for the molar enthalpies of thehypothetic L12 Cu3Nb, B2 CuNb and L12 CuNb3 compounds.

160 T. L. Wang et al. / Scripta Materialia 57 (2007) 157–160
range bounded by the two critical points. Figure 3 alsoexhibits the molar enthalpies of unstable solid solutionextrapolated from the values of terminal solid solutions,as well as the molar enthalpies of the hypothetical L12
Cu3Nb, B2 CuNb and L12 CuNb3 compounds. Onecan see that, within the composition range of 15–72 at.% Nb, the molar enthalpy of amorphous phase islower than that of solid solution and compound, sug-gesting that amorphous phase is formed by preference.
To confirm the results of the MD simulation, twoCu–Nb multilayered films with compositions of Cu70-Nb30 and Cu30Nb70 are designed and irradiated by200 keV xenon ions. To match the irradiating ion range,the total thickness of the films is calculated to be around42 nm, according to the TRIM program [22]. The filmsare designed to consist of 15 and 13 layers, respectively.The Cu–Nb multilayered films are prepared by deposit-
ing alternatively pure Cu and Nb at a rate of 0.2 A s�1
onto NaCl single crystals as substrates in an e-gun evap-oration system with a vacuum level better than 10�6 Paand irradiated by xenon ions in an implanter with a vac-uum level better than 5 · 10�4 Pa. The irradiation doseis in a range from 8 · 1014 to 9 · 1015 Xe+ cm�2. Duringirradiation, the sample holder is cooled by liquid nitro-gen (77 K) and the current density is confined to beabout 2 lA cm�2 to minimize any overheating effect.
After irradiation, energy-disperse spectrum andX-ray fluorescence examinations were employed toascertain the real compositions of the Cu–Nb films.For structural characterization, the samples are exam-ined by transmission electron microscopy and amor-phous phases are observed in both samples aftervarious irradiation. Figure 4a and b shows the selectedarea diffraction (SAD) patterns of the Cu70Nb30 multi-layered films upon irradiation doses of 8 · 1014 and2 · 1015 Xe+ cm�2, respectively. One can see from Fig-ure 4a that the sharp diffraction lines of Cu and Nb re-main, while in Figure 4b only diffused halos exist,indicating that an amorphous phase is formed. Simi-larly, Figure 4c and d shows the SAD patterns of theCu30Nb70 multilayered films upon irradiation doses of8 · 1014 and 9 · 1015 Xe+ cm�2, respectively. The dif-fused halo shown in Figure 4d indicates that an amor-
Figure 4. The SAD patterns of the Cu70Nb30 multilayered films afterirradiation doses of 8 · 1014 Xe+ cm�2 (a) and 2 · 1015 Xe+ cm�2 (b),and the Cu30Nb70 multilayered film after irradiation doses of8 · 1014 Xe+ cm�2 (c) and 9 · 1015 Xe+ cm�2 (d).
phous phase is also formed in Cu30Nb70 multilayeredfilms. In short, the experiment supports the results ob-tained from the MD simulations. In addition, Michael-sen et al. have also obtained amorphous alloys withinthe composition range of 23–68 at.% Nb by triode–mag-netron sputtering [23].
In summary, based on the TB-SMA formalism, an n-body potential is constructed for the immiscible Cu–Nbsystem and proven to work fairly well in reproducingsome physical properties. MD simulations and IBMexperiments are carried out and the results suggest thatCu–Nb amorphous phases may be formed in the rangeof about 15–72 at.% Nb.
The authors are grateful for the financial supportfrom the National Natural Science Foundation of China(50531040), The Ministry of Science and Technology ofChina (2006CB605201) and the Administration ofTsinghua University.
Supplementary data associated with this articlecan be found, in the online version, at doi:10.1016/j.scriptamat.2007.03.006.
[1] W. Klement, R.H. Willens, P. Duwez, Nature 187 (1960)869.
[2] A. Lindsay Greer, Science 267 (1995) 1947.[3] B.X. Liu, W.L. Johnson, M.A. Nicolet, S.S. Lau, Appl.
Phys. Lett. 42 (1983) 45.[4] B.X. Liu, W.S. Lai, Q. Zhang, Mater. Sci. Eng. 244 (2000)
1.[5] B.X. Liu, Mater. Lett. 5 (1987) 322.[6] J.H. He, E. Ma, Phys. Rev. B 64 (2001) 144206.[7] J.H. He, H.W. Sheng, P.J. Schilling, C.-L. Chien, E. Ma,
Phys. Rev. Lett. 86 (2001) 2826.[8] J.H. Li, S.H. Liang, B.X. Liu, J. Phys. Chem. B 109
(2005) 16463.[9] Y.C. Wang, A. Misra, R.G. Hoagland, Scripta Mater. 54
(2005) 1593.[10] E. Botcharova, J. Freudenberger, L. Schultz, Acta Mater.
54 (2006) 3333.[11] F.R. de Boer, R. Boom, W.C.M. Mattens, A.R. Miedema,
A.K. Niessen, Cohesion in Metals: Transition MetalAlloy, North Holland, Amsterdam, 1989.
[12] X. Sauvage, L. Renaud, B. Deconihout, D. Blavette,D.H. Ping, K. Hono, Acta Mater. 49 (2001) 389.
[13] F. Pan, Z.F. Ling, K.Y. Gao, B.X. Liu, Mater. Res. Soc.Symp. Proc. 398 (1996) 337.
[14] S. Yamamoto, H. Naramoto, B. Tuchiya, K. Narumi, Y.Aoki, Thin Solid Films 335 (1998) 85.
[15] C. Massobrio, V. Pontikis, G. Martin, Phys. Rev. B 41(1990) 10486.
[16] J.H. Rose, J.R. Smith, F. Guinea, J. Ferrante, Phys. Rev.B 29 (1984) 2963.
[17] R. Siegl, M. Yan, V. Vitek, Model. Simul. Mater. Sci.Eng. 5 (1997) 105.
[18] G. Kresse, J. Furthmuller, Phys. Rev. B 54 (1996) 11169.[19] M. Parrinello, A. Rahman, J. Appl. Phys. 52 (1981) 7182.[20] B.X. Liu, W.S. Lai, Z.J. Zhang, Adv. Phys. 50 (2001) 367.[21] Z. Zallen, The Physics of Amorphous Solid, Wiley
InterScience, New York, 1983.[22] J.F. Ziegler, J.P. Biersack, U. Littmark, The Stopping
and Range of Ions in Solids, Pergamon Press, New York,1992.
[23] C. Michaelsen, C. Gente, R. Bormann, J. Appl. Phys. 81(1997) 6024.