Embed Size (px)
Citation preview
The United Republic of Tanzania
FORMAL SECTOR EMPLOYMENT AND EARNINGS
SURVEY, 2016
TANZANIA MAINLAND
National Bureau of Statistics
Ministry of Finance and Planning Dar es Salaam
May, 2018

The United Republic of Tanzania
FORMAL SECTOR EMPLOYMENT AND EARNINGS SURVEY, 2016
TANZANIA MAINLAND
National Bureau of Statistics
Ministry of Finance and Planning
May, 2018

i
FOREWORD
This report presents results of the 2016 Employment and Earnings Survey (EES) conducted by the
National Bureau of Statistics (NBS) on behalf of the Government of the United Republic of Tanzania.
The survey was undertaken between July and December 2016 and enquired about the status of
employment and earnings with reference to 30th June 2016. The history of the Employment and
Earnings Surveys (EES) in Tanzania goes back to 1963 when the first post-independence survey was
launched and this survey is the twelfth after the 2001 EES.
The main objective of this survey is to provide information relating to status of employment and
earnings in the country. The survey was designed such that its results could be used as a proxy in
estimating the labour market indicators to facilitate policy formulation, planning and estimating the
contribution of various sectors to the Gross Domestic Product (GDP).
This report is the only source of information showing the distribution of income and number of
employees; newly recruited workers and job vacancies in the formal sector of employment at regional
level. The need for this report arises from the appreciation of information gap that persisted on
employment and earnings in regional estimates. It is expected that it will provide new insights for
planners, policy makers, researchers and other users dealing with employment and related issues in the
country.
The success of this survey depended on cooperation and contribution of several groups of stakeholders
and individuals during various stages of implementation. NBS would like to recognize the efforts of
the Department of Field Operations, particularly the Business register (BR) unit and the Regional
Statistical Offices (RSO). In addition, NBS would like to extend gratitude to respondents, particularly
employers who supplied the requested information. NBS looks forward to their continuing cooperation
and support in future surveys.
NBS would also like to express its sincere appreciation to all persons who participated in this exercise,
particularly Mr. Ephraim Kwesigabo, Director for Social Statistics and Population Census, Ms. Ruth
Minja, Manager for Environment Statistics and Statistical analysis and Mr. Gregory Millinga, Acting
Manager for Labour and Price Statistics for managing properly this survey with joint technical support
from Mr. Muhiddin Mtindo, Principal Statistician; Mr. James Mbongo, Senior Statistician; Mr. Paskas
ii
Sawaki, Senior Statistician; Mr. Opiyo Mamu, Statistician; Mr. Hashim Njowele, Statistician; Mr.
Saruni Njipay, Statistician; Mr. Philbert Mrema, Statistician and Mr. David Mwaipopo, Statistician for
their dedication and commitment which led to successful completion of the survey and come up with
this beautiful report.
Comments and suggestions for improving the quality of future reports are welcome.
Dr. Albina Chuwa
Director General
National Bureau of Statistics

ii
CONTENTS
FOREWORD ........................................................................................................................................... i
LIST OF TABLES .................................................................................................................................. v
LIST OF FIGURES .............................................................................................................................. vii
EXECUTIVE SUMMARY ................................................................................................................. viii
KEY FINDINGS .................................................................................................................................... xi
CHAPTER ONE ..................................................................................................................................... 1
CONCEPTS, DEFINITIONS AND SURVEY METHODOLOGY ................................................... 1
1. Introduction .................................................................................................................................... 1
1.1 Background .................................................................................................................................... 1
1.2 Objectives of the Survey ................................................................................................................ 1
1.3 Scope .............................................................................................................................................. 2
1.4 Concepts and Definitions ............................................................................................................... 2
1.4.1 Employee ........................................................................................................................................ 2
1.4.2 Regular Employee .......................................................................................................................... 2
1.4.3 Casual Workers .............................................................................................................................. 2
1.4.4 Youth Persons ................................................................................................................................ 2
1.4.5 Wage Rate ...................................................................................................................................... 2
1.4.6 Cash Earnings ................................................................................................................................. 2
1.4.7 Annual Wage Bill ........................................................................................................................... 3
1.4.8 Free Housing .................................................................................................................................. 3
1.4.9 Paid Leave ...................................................................................................................................... 3
1.4.10 Maternity Leave ............................................................................................................................. 3
1.4.11 Free Ration ..................................................................................................................................... 3
1.4.12 Social Security Fund ...................................................................................................................... 3
1.4.13 Public Sector .................................................................................................................................. 3
1.4.14 Private Sector ................................................................................................................................. 4
1.4.15 Industrial Classification ................................................................................................................. 4
1.5 Survey Methodology and Estimation Procedure ............................................................................ 8
1.5.1 The Sample Design ........................................................................................................................ 8

iii
1.5.2 Data Collection ................................................................................................................................ 9
1.5.3 The Response Status ...................................................................................................................... 9
1.5.4 Weight .......................................................................................................................................... 10
CHAPTER TWO .................................................................................................................................. 11
EMPLOYMENT PROFILE ................................................................................................................ 11
2. Introduction....................................................................................................................................... 11
2.1 Employment by Sector, Category of Employment, Age Group and Sex ..................................... 11
2.2 Employment and Disability .......................................................................................................... 14
2.3 Employment by Sub Sector, Age Group and Sex ........................................................................ 15
2.4 Regular Employment by Citizenship and Sector ......................................................................... 17
2.5 Employment by Industry and Category of Employment ............................................................. 18
2.6 Employment by Industry, Category of Employment and Sex ..................................................... 20
2.7 Employment by Industry and Sector ............................................................................................ 22
2.8 Employment by Industry, Age Group and Sex ............................................................................ 24
2.9 Regular Employment by Citizenship and Industry ...................................................................... 26
2.10 Employment by Region and Sector .............................................................................................. 27
2.11 Employment by Region, Category of Employment and Sex ....................................................... 29
2.12 Adult and Youth Employment in Private and Public Sectors by Region and Age Group ........... 30
CHAPTER THREE .............................................................................................................................. 32
MONTHLY WAGE RATE PROFILE ............................................................................................... 32
3. Introduction....................................................................................................................................... 32
3.1 Total Citizen Employees by Sector and Monthly Wage Rate ...................................................... 32
3.2 Total Citizen Employees by Monthly Wage Rate Groups and Sex ............................................. 33
3.3 Citizen Employees by Monthly Wage Rates and Industry .......................................................... 34
3.4 Citizen Employees by Monthly Wage Rate and Sex ................................................................... 36
3.5 Adult and Youth Citizen Employees by Sector and Monthly Wage Rate ................................... 37
CHAPTER FOUR ................................................................................................................................ 39
CASH EARNINGS PROFILE ............................................................................................................ 39
4. Introduction....................................................................................................................................... 39
4.1 Monthly Average Cash Earnings by Major Sector and Sex......................................................... 39
4.2 Monthly Average Cash Earnings by Sub Sector of Employment and Sex .................................. 40
4.3 Monthly Average Cash Earnings by Sub Sector and Category of Employment ......................... 42
4.4 Monthly Average Cash Earnings of Employees by Industry and Sex ......................................... 43
4.5 Annual Cash Earnings of Employees by Sector .......................................................................... 44

iv
4.6 Annual Cash Earnings of Employees by Industry ....................................................................... 46
4.7 Annual Cash Earnings of Employees by Industry and Category of Employment ....................... 47
CHAPTER FIVE .................................................................................................................................. 49
ANNUAL WAGE BILL PROFILE .................................................................................................... 49
5. Introduction ................................................................................................................................ 49
5.1 Annual Wage Bill by Sector ........................................................................................................ 49
5.2 Annual Wage Bill by Sector ........................................................................................................ 50
5.3 Annual Wage Bill by Industry ..................................................................................................... 51
5.4 Annual Wage Bill by Selected Regions ....................................................................................... 53
CHAPTER SIX ..................................................................................................................................... 54
RECRUITMENT OF NEW WORKERS ........................................................................................... 54
6. Introduction....................................................................................................................................... 54
6.1 Recruited Employees by Nature of Position, Sex and Sector ...................................................... 54
6.2 Number of Newly Recruited Employees by Occupation and Sex, 2015/16 ................................ 55
6.3 Number of Newly Recruited Employees by Occupation and Level of Education ...................... 55
6.4 Newly Recruited Employees by Level of Education and Sex ..................................................... 57
6.5 Newly Recruited Employees by Sector and Employment Status ................................................ 58
6.6 Newly Recruited Employees by Occupation and Citizenship ..................................................... 60
6.7 Newly Recruited Employees by Region and Sex ........................................................................ 60
6.8 Newly Recruited Employees by Occupation and Starting Salary ................................................ 62
6.9 Newly Recruited Employees by Level of Education and Monthly Starting Salary ..................... 63
CHAPTER SEVEN .............................................................................................................................. 64
JOB VACANCIES ................................................................................................................................ 64
7. Introduction....................................................................................................................................... 64
7.1 Job Vacancies by Occupation and Working Experience ............................................................. 64
7.2 Job Vacancies by Occupation and Sex Preference ...................................................................... 66
7.3 Job Vacancies by Industry and Reason for Vacancies ................................................................. 66
7.4 Job Vacancies by Industry and Level of Education ..................................................................... 68
7.5 Job Vacancies by Qualification/ Skill Required and Sex Preference........................................... 69
ANNEXES FOR CHAPTER TWO .................................................................................................... 71
ANNEXES FOR CHAPTER THREE ................................................................................................ 84
ANNEXES FOR CHAPTER FOUR ................................................................................................... 87
ANNEXES FOR CHAPTER FIVE ..................................................................................................... 89
D1: Distribution of Annual Wage Bill by Major Sector, 2016 ........................................................... 89
D2: Distribution of Annual Wage Bill by Detailed Sectors, 2016 ...................................................... 89

v
D3: Distribution of Annual Wage Bill (TZS Millions) by Industrial Major Division and Sector, 2016
...................................................................................................................................................... 89
D4: Distribution of Annual Wage Bill by Selected Regions, 2016 .................................................... 90
ANNEXES FOR CHAPTER SIX .......................................................................................................... 91
List of Tables Table 1. 1: Number of Establishments and Response Rates by Employment Size and Sector, Tanzania Mainland,
2016 ................................................................................................................................................... 10
Table 2. 1: Distribution of Total Employees by Category of Employment and Sector, Tanzania Mainland, 2015
and 2016 ............................................................................................................................................ 12
Table 2. 2A: Percentage Distribution of Total Regular Employees by Age Group, Sector and Sex Tanzania
Mainland, 2016 .................................................................................................................................. 13
Table 2. 3: Distribution of Regular Employees with Disability by Sector and Sex, Tanzania Mainland, 2016 .. 14
Table 2. 4A: Percentage Distribution of Total Employees by Sub Sector and Sex, Tanzania Mainland, 2015
and 2016 ............................................................................................................................................ 15
Table 2. 5: Percentage Distribution of Regular Employees by Citizenship and Sub-Sector Tanzania Mainland,
2015 and 2016 ................................................................................................................................... 18
Table 2. 6A: Percentage Distribution of Total Employees by Industry and Category of Employment Tanzania
Mainland, 2015 and 2016 .................................................................................................................. 19
Table 2. 7: Percentage Distribution of Total Employees by Industry and Sector, Tanzania Mainland, 2015 and
2016 ................................................................................................................................................... 23
Table 2. 8: Percentage Distribution of Total Employees by Industry, Age Group and Sex, Tanzania Mainland,
2016 ................................................................................................................................................... 25
Table 2. 9: Percentage Distributions of Regular Employees by Citizenship and Industry (%), Tanzania
Mainland, 2016 .................................................................................................................................. 27
Table 2. 10: Percentage Distribution of Total Employees by Region and Sector, Tanzania Mainland, 2015 and
2016 ................................................................................................................................................... 28
Table 2. 11: Percentage Distribution of Total Employees by Region, Category of Employment and Sex,
Tanzania Mainland, 2016 .................................................................................................................. 29
Table 2. 12: Percentage Distribution of Total Employees by Major Sectors, Region and Age Group, Tanzania
Mainland, 2016 .................................................................................................................................. 30

vi
Table 3. 1: Percentage Distribution of Total Citizen Employees by Monthly Wage Rate (TZS) Group and
Sector, Tanzania Mainland, 2016 ...................................................................................................... 32
Table 3. 2: Percentage Distribution of Total Citizen Employees by Monthly Wage Rate (TZS) Group and Sex,
Tanzania Mainland, 2016 .................................................................................................................. 34
Table 3. 3: Percentage Distribution of Citizen Employees by Industry and Monthly Wage Rate (TZS) Group,
Tanzania Mainland, 2016 .................................................................................................................. 35
Table 3. 4: Percentage Distribution of Regular Citizen Employees by Monthly Wage Rate (TZS) Group and
Sex, Tanzania Mainland, 2016 .......................................................................................................... 36
Table 3. 5: Percentage Distribution of Regular Citizen Employees by Sector and Monthly Wage Rate (TZS)
Group, Tanzania Mainland, 2016 ...................................................................................................... 37
Table 4. 1: Monthly Average Cash Earnings (TZS) by Sector and Sex, Tanzania Mainland, 2015 and 2016.... 39
Table 4. 2: Monthly Average Cash Earnings (TZS) by Sub Sector and Sex, Tanzania Mainland, 2015 and 2016
........................................................................................................................................................... 41
Table 4. 3: Monthly Average Cash Earnings (TZS) by Sub Sector and Category of Employment, Tanzania
Mainland, 2015 and 2016 .................................................................................................................. 42
Table 4. 4: Monthly Average Cash Earnings (TZS) of Employees by Industry and Sex, Tanzania Mainland,
2015 and 2016 ................................................................................................................................... 43
Table 4. 5: Annual Cash Earnings of Employees by Industry (TZS Million), Tanzania Mainland, 2015 and 2016
........................................................................................................................................................... 46
Table 4. 6: Percentage Distribution of Annual Cash Earnings of Employees by Industry and Category of
Employment, Tanzania Mainland, 2016 ............................................................................................ 47
Table 5. 1: Percentage Distribution of Annual Wage Bill by Industry and Sector, 2016 .................................... 51
Table 6. 1: Number of Newly Recruited Employees by Nature of Position, Sex and Sector, Tanzania Mainland,
2015/16 .............................................................................................................................................. 54
Table 6. 2: Number of Newly Recruited Employees by Occupation and Sex, Tanzania Mainland, 2015/16 ..... 55
Table 6. 3: Number of Newly Recruited Employees by Occupation and Level of Education, Tanzania
Mainland, 2015/16 ............................................................................................................................. 56
Table 6. 4: Number of Newly Recruited Employees by Sex and Level of Education, Tanzania Mainland,
2015/16 .............................................................................................................................................. 57
vii
Table 6. 5: Number of Newly Recruited Employees by Sector and Status of Employment, Tanzania Mainland,
2015/16 .............................................................................................................................................. 59
Table 6. 6: Number of Newly Recruited Employees by Region and Sex, Tanzania Mainland, 2015/16 ............ 61
Table 6. 7: Number of Newly Recruited Employees by Occupation and Starting Monthly Salary (TZS),
Tanzania Mainland, 2015/16 ............................................................................................................. 62
Table 6. 8: Number of Newly Recruited Employees by Level of Education and Starting Monthly Salary,
Tanzania Mainland, 2015/16 ............................................................................................................. 63
Table 7. 1: Number of Job Vacancies by Occupation and Work Experience, Tanzania Mainland, 2015/16 ...... 65
Table 7. 2: Number of Job Vacancies by Occupation and Sex Preference, Tanzania Mainland, 2015/16 .......... 66
Table 7. 3: Number of Job Vacancies by Industry and Reasons, 2015/16 .......................................................... 67
Table 7. 4: Number of Job Vacancies by Industry and Required Level of Education, 2015/16 .......................... 68
Table 7. 5: Number of Job Vacancies by Qualification/ Skill Required and Sex Preference, Tanzania Mainland,
2015/16 .............................................................................................................................................. 69
List of Figures Figure 4. 1: Percentage Distribution of Total Annual Cash Earnings by Sector, Tanzania Mainland, 2015 and
2016 ................................................................................................................................................... 45
Figure 5. 1: Distribution of Annual Wage Bill (TZS billion) by Major Sector, 2016........................................... 49
Figure 5. 2: Distribution of Annual Wage Bill (TZS billion) by Sector, 2016 ..................................................... 50
Figure 5. 3: Annual Wage Bill by Cash Earnings and Free Ration for Selected Industries, 2016 ........................ 52
Figure 5. 4: Distribution of Annual Wage Bill (TZS billion) by Selected Regions, 2016 .................................... 53
Figure 6. 1: Number of Newly Recruited Employees by Occupation and Citizenship, Tanzania Mainland,
2015/16 .............................................................................................................................................. 60
Figure 7. 1: Percentage Distribution of Job Vacancies by Occupation, 2015/16 .................................................. 64

viii
EXECUTIVE SUMMARY
Introduction
This executive summary presents in a nutshell the findings of the 2016 Employment and Earnings
Survey (EES) on the state of employment in the formal sector in Tanzania Mainland. The EESs are
conducted by the National Bureau of Statistics (NBS), as mandated by Statistics Act 2015, which
empowers NBS to collect, compile and disseminate official statistics in the country. The summary is
presented for the six main topical areas namely:- Employment Profile; Wage Rates Profile; Cash
Earnings Profile; Annual Wage Bill Profile; Newly Recruited Workers; and Job Vacancies.
Employment Profile
The findings on employment profile reveal an increase in total employment in the formal sector from
2,334,969 employees in 2015 to 2,599,311 employees in 2016; which is an increase of 308,951
employees. The majority of employees are employed in the private sector (1,748,695 private and
850,616 public). Proportion of regular employment has increased from 88.2 percent in 2015 to 92.9
percent in 2016, while casual employment has decreased from 11.8 percent in 2015 to 7.1 under the
same span of time. Education industry had the largest share of total employment with 18.5 percent
followed by manufacturing industry (18.1 percent); and public administration and defence, compulsory
social security industry with 13.6 percent of total employment.
It is also indicated that there are more adult employees under regular employment (63.2 percent)
compared to youth employees who accounted for 36.8 percent of the total regular employees. With
regard to disability status, the results indicate that, there were 3,935 employees (about 0.2 percent of
total employment in the formal sector) with various types of disabilities. The results also show that,
Dar es Salaam region had the largest proportion of employment, with 31.2 percent of all employees,
followed by Morogoro region (10.9 percent) and Arusha region (6.8 percent).
Wage Rates Profile
Regarding the wage rates of employees in the formal sector, the findings show that, overall in 2016,
majority of citizen employees (22.9 percent) earned monthly wages between TZS 500,001 and
900,000. In the private sector however, there were more citizen employees in lower wage rates with
17.8 percent earning monthly wages between TZS 150,001 and 300,000 and 14.6 percent earning
between TZS 100,001 and 150,000. For the public sector, about 15.3 percent of citizen employees

ix
earned between TZS 500,001 and 900,000 and about 8.1 percent earned monthly wages between TZS
300,001 and TZS 500,000. The findings also reveal that, about 4.5 percent of all citizen employees
earned TZS 1,500,000 or above, with a slightly larger proportion in the private sector (2.7 percent)
than public sector (1.8 percent).
Financial and insurance activities had the highest proportion of employees (33.3 percent) earning
wages above TZS 1,500,000 followed by information and communication industry (22.1 percent).
Conversely, construction, wholesale and retail trade and repair of motor vehicles and motorcycles
activities had larger proportions of their employees in lower wage rates between TZS 150,001 and
300,000.
Cash Earnings Profile
The findings indicate that, overall monthly average cash earnings for employees in the formal sector
surged up slightly from TZS 403,729 in 2015 to TZS 448,462 in 2016. Monthly cash earnings in the
public sector increased from TZS 1,063,064 in 2015 to TZS 1,243,945 in 2016, whereas in the private
sector it increased slightly from TZS 353,589 to 362,400. The results boldly note that, on average, cash
earnings for employees in the public sector were three times as much as that of the private sector.
In addition, analysis of monthly cash earnings by sector reveals that, parastatal organizations had the
highest monthly average cash earnings of TZS 1,452,326, while profit making institutions had the
lowest monthly average cash earnings of TZS 339,229. It is also found that in 2016, financial and
insurance activities had the highest monthly average cash earnings of TZS 1,388,070 followed by
public administration and defense; compulsory social security with TZS 1,292,652.
Annual Wage Bill Profile
Analysis on annual wage bill indicates that, overall, employers in public and private sectors had
collective annual wage bill of TZS 23,637 billion in 2016, with employers in private sector having
higher annual wage bill than in the public sector. The largest annual wage bills were incurred by
employers in private profit- making institutions amounting to TZS 9,536 billion followed by employers
in private nonprofit -making institutions with TZS 5,295 billion. Employers in parastatal institutions,
including both non - profit and profit - making institutions had relatively smaller annual wage bills of
TZS 662 billion and TZS 236 billion respectively. Results on annual wage bill by industry indicates
that, the largest proportion of wage bill were in the education industry with 20.4 percent. Public

x
administration and defence; compulsory social security had the second largest annual wage bill of 16.6
percent.
Newly Recruited Workers
The findings on the newly recruited workers reveal that, total number of newly recruited workers in
2016 was 69,639 of which 34,594 employees filled newly created posts and 35,045 employees filled
existing vacancies. The findings also indicate that, among the newly recruited employees, there were
more females (19,433) than males (15,161). On the other hand, private sector had more new recruits
with 51,251 employees compared to public sector with 18,388. It is further indicated that, occupations
of service workers and shop sales workers; and technicians and associate professionals had larger
number of new recruits with 15,515 employees and 14,876 employees, respectively. With regard to
education qualification, the findings indicate that, number of males with tertiary education are more in
the new recruits (8,279 employees) equivalent to 23.7 percent compared to female comprised of 4,559
employees (about 13.2 percent).
Moreover, it is established that, out of the total number of newly recruited employees, the largest
proportion, 66.4 percent (46,262 employees) were employed on permanent basis followed by 25.3
percent (17,615 employees) who were engaged on contractual basis.
Job Vacancies
Analysis for job openings in the formal sector shows that, the largest proportion of job vacancies in
2015/16 (63.6 percent) were for technicians and associate professionals, followed by professionals
(21.6 percent). The remaining occupations each had less than 5 percent of the total job vacancies. The
majority of these jobs, (85.3 percent) did not require any working experience. Vacancies that required
prior working experiences of 1-2 and 3-4 years constituted about 10.6 percent and 2.8 percent
respectively.
The findings also reveal that, the largest proportion of the reported vacancies (93.3 percent) did not
attach any sex preference for the potential candidates. However, 4.4 percent of vacancies preferred
male employees compared to 2.3 percent which preferred female employees.
xi
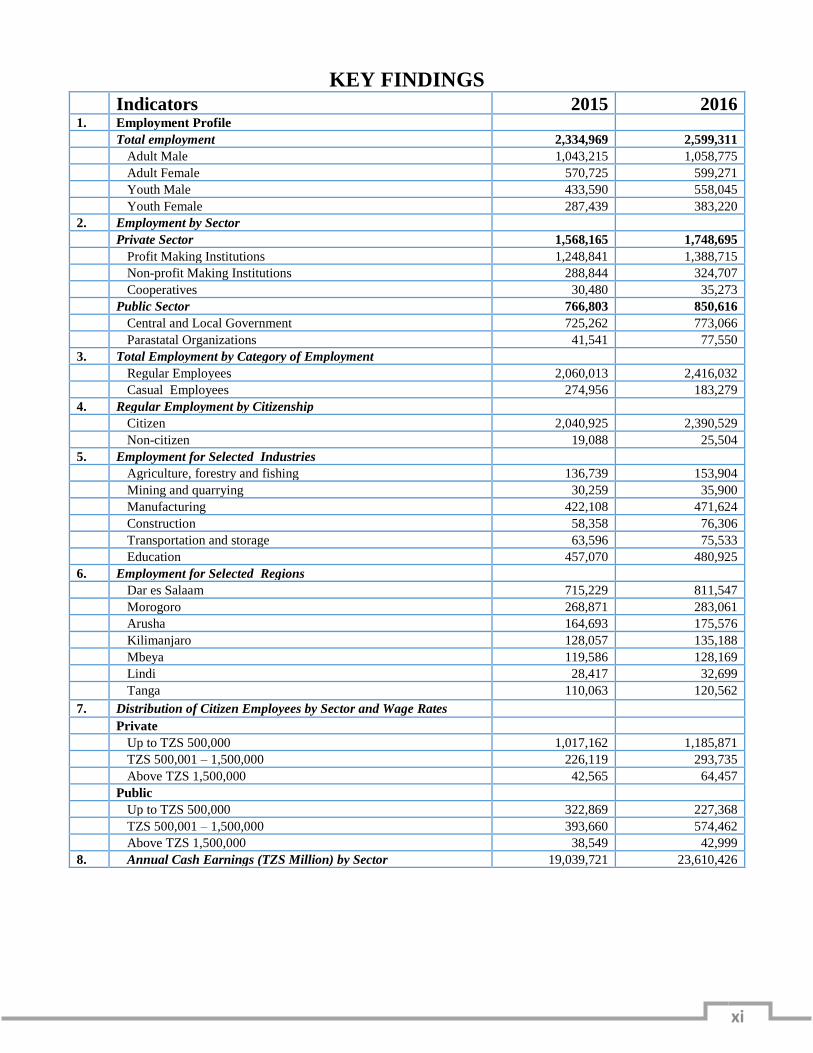
KEY FINDINGS Indicators 2015 2016
1. Employment Profile
Total employment 2,334,969 2,599,311
Adult Male 1,043,215 1,058,775
Adult Female 570,725 599,271
Youth Male 433,590 558,045
Youth Female 287,439 383,220
2. Employment by Sector
Private Sector 1,568,165 1,748,695
Profit Making Institutions 1,248,841
1,388,715
1,388,715
324,707
35,273
Non-profit Making Institutions 288,844
324,707
Cooperatives 30,480
35,273
Public Sector 766,803 850,616
Central and Local Government 725,262
773,066
Parastatal Organizations 41,541
77,550
3. Total Employment by Category of Employment
Regular Employees 2,060,013
2,416,032
Casual Employees 274,956
183,279
4. Regular Employment by Citizenship
Citizen 2,040,925 2,390,529
Non-citizen 19,088
25,504
5. Employment for Selected Industries
Agriculture, forestry and fishing 136,739
153,904
Mining and quarrying 30,259
35,900
Manufacturing 422,108
471,624
Construction 58,358
76,306
Transportation and storage 63,596
75,533
Education 457,070
480,925
6. Employment for Selected Regions
Dar es Salaam 715,229
811,547
Morogoro 268,871
283,061
Arusha 164,693
175,576
Kilimanjaro 128,057
135,188
Mbeya 119,586
128,169
Lindi 28,417
32,699
Tanga 110,063
120,562
7. Distribution of Citizen Employees by Sector and Wage Rates
Private
Up to TZS 500,000 1,017,162
1,185,871
TZS 500,001 – 1,500,000 226,119
293,735
Above TZS 1,500,000 42,565
64,457
Public
Up to TZS 500,000 322,869
227,368
TZS 500,001 – 1,500,000 393,660
574,462
Above TZS 1,500,000 38,549
42,999
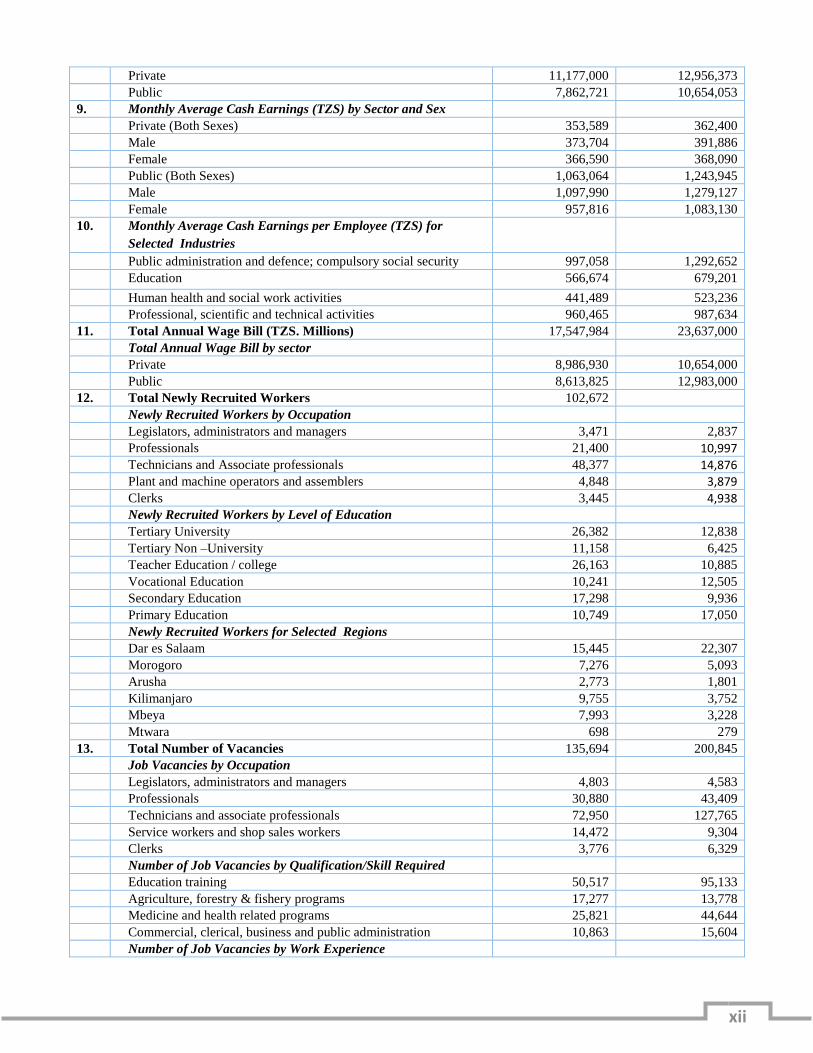
8. Annual Cash Earnings (TZS Million) by Sector 19,039,721 23,610,426
xii
Private 11,177,000
12,956,373
Public 7,862,721
10,654,053
9. Monthly Average Cash Earnings (TZS) by Sector and Sex Private (Both Sexes) 353,589
362,400
Male 373,704
391,886
Female 366,590
368,090
Public (Both Sexes) 1,063,064
1,243,945
Male 1,097,990
1,279,127
Female 957,816
1,083,130
10. Monthly Average Cash Earnings per Employee (TZS) for
Selected Industries
Public administration and defence; compulsory social security 997,058
1,292,652
Education 566,674
679,201
Human health and social work activities 441,489
523,236
Professional, scientific and technical activities 960,465
987,634
11. Total Annual Wage Bill (TZS. Millions) 17,547,984
23,637,000
Total Annual Wage Bill by sector
Private 8,986,930
10,654,000
Public 8,613,825
12,983,000
12. Total Newly Recruited Workers 102,672
Newly Recruited Workers by Occupation
Legislators, administrators and managers 3,471 2,837
Professionals 21,400 10,997
Technicians and Associate professionals 48,377 14,876
Plant and machine operators and assemblers 4,848 3,879
Clerks 3,445 4,938
Newly Recruited Workers by Level of Education
Tertiary University 26,382 12,838
Tertiary Non –University 11,158 6,425
Teacher Education / college 26,163 10,885
Vocational Education 10,241 12,505
Secondary Education 17,298 9,936
Primary Education 10,749 17,050
Newly Recruited Workers for Selected Regions
Dar es Salaam 15,445 22,307
Morogoro 7,276 5,093
Arusha 2,773 1,801
Kilimanjaro 9,755 3,752
Mbeya 7,993 3,228
Mtwara 698 279
13. Total Number of Vacancies 135,694 200,845
Job Vacancies by Occupation
Legislators, administrators and managers 4,803 4,583
Professionals 30,880 43,409
Technicians and associate professionals 72,950 127,765
Service workers and shop sales workers 14,472 9,304
Clerks 3,776 6,329
Number of Job Vacancies by Qualification/Skill Required
Education training 50,517 95,133
Agriculture, forestry & fishery programs 17,277 13,778
Medicine and health related programs 25,821 44,644
Commercial, clerical, business and public administration 10,863 15,604
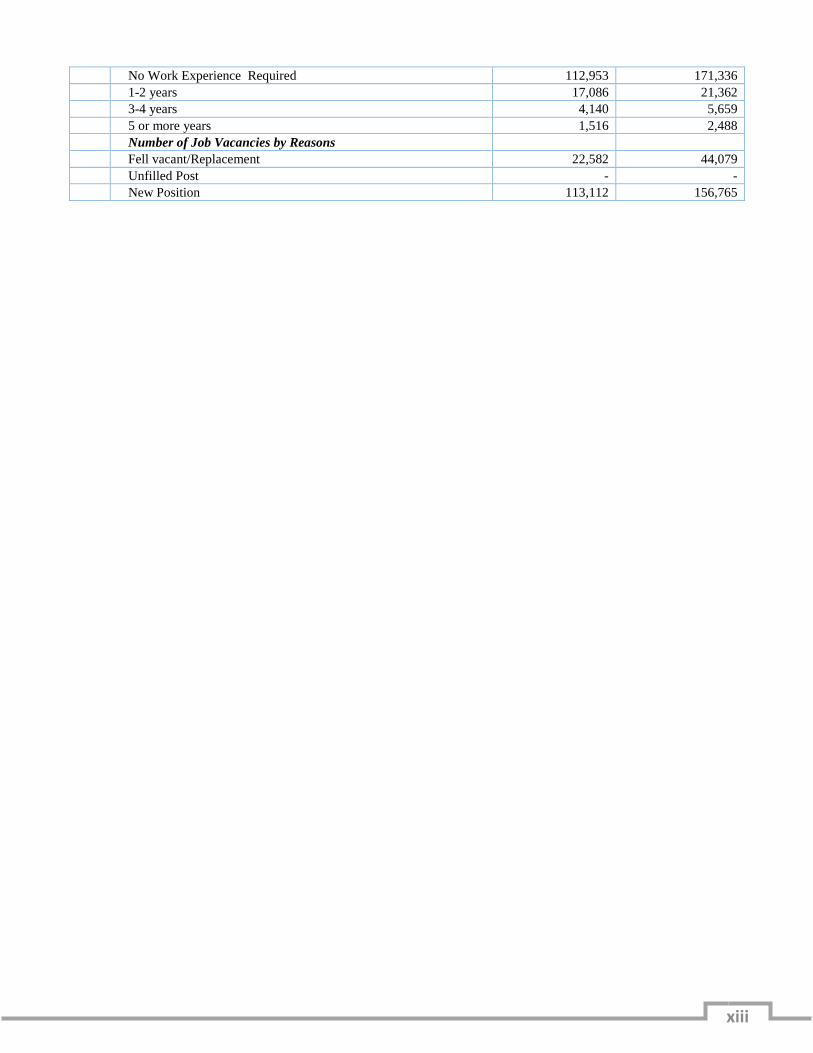
Number of Job Vacancies by Work Experience
xiii
No Work Experience Required 112,953 171,336
1-2 years 17,086 21,362
3-4 years 4,140 5,659
5 or more years 1,516 2,488
Number of Job Vacancies by Reasons
Fell vacant/Replacement 22,582 44,079
Unfilled Post - -
New Position 113,112 156,765

xiv
List of Abbreviation and Acronyms
CRE - Central Register of Establishments
EAC - East African Community
EES - Employment and Earnings Survey
NBS - National Bureau of Statistics
NSSF - National Social Security Fund
PPF - Parastatal Pension Fund
PPS - Probability Proportion to Size
SDG - Sustainable Development Goals
TZS. - Tanzanian Shillings
ISIC - International Standard Industrial Classification of all Economic Activities

1
Chapter One
Concepts, Definitions and Survey Methodology
1. Introduction
The Employment and Earnings Survey (EES) is an establishment- based survey conducted annually in
Tanzania Mainland by the National Bureau of Statistics (NBS). The survey covers formal
establishments with employees in both private and public sectors. The establishments are divided into
three main categories which are all public -sector establishments, all registered private establishments
employing at least 50 persons and a sample of all registered private establishments whose number of
employees are from 5 to 49 persons.
This chapter presents the concepts, definitions and survey methodological procedures followed during
survey designing and implementation. It includes six main sub-sections with information on
background, objective of the survey, the scope, concepts and definitions, survey methodology and
estimation procedure.
1.1 Background
The 2016 EES is a continuation of similar surveys conducted each year. Historical background of
Employment and Earnings Surveys dates back to1963 when the EES was conducted for the first time,
thereafter followed by other surveys conducted annually up to 1984. Due to shortage of financial
resources, EES surveys were suspended after 1984. However, in 2001 the employment and earnings
surveys resumed for the moment with exception of two years; 2008 and 2009. Employment and
Earnings Survey Reports for 2001, 2002, 2005-2007, 2010-2011, 2012, 2013, 2014 and 2015 were
published and are available on the NBS website and in its library.
1.2 Objectives of the Survey
The main objective of the 2016 Employment and Earnings Survey which is similar to the previous
surveys was to collect comprehensive data on the status of employment and earnings as well as data on
the socio-economic characteristics of the labour market for planning purposes. It is the only survey that
provides estimates of employment and earnings in the formal sector at regional level.

2
1.3 Scope
The term scope as used in the Employment and Earnings Survey refers to the type of economic
activity, institutional sectors and geographical areas of the surveyed establishments. The EES scope is
delimited to formal establishments dealing with any of the economic activities with exception of
activities of households as employers and activities of extraterritorial organizations. The survey covers
establishments in 25 regions of Tanzania Mainland.
1.4 Concepts and Definitions
1.4.1 Employee
An employee is any person who is hired to work or perform a job for a business, firm etc. in return for
payment under a contract of service with an employer. The contract can be implied, oral or written for
wage earners and salaried employees whether engaged full-time, part-time or casually.
1.4.2 Regular Employee
The term regular employee refers to all permanent and temporary employees who have been employed
on a weekly or monthly basis for more than one month.
1.4.3 Casual Workers
The term casual worker refers to all persons receiving daily wages and their contracts are not expected
to continue for more than one month.
1.4.4 Youth Persons
The term youth persons, for the purpose of this survey, refer to all persons of age 15 to 35 years. This
is in conformity with the national definition of youth as stipulated in the Labour and Employment
Relations Act of 2004 and the Tanzania Youth Policy.
1.4.5 Wage Rate
The term wage rate refer to the basic agreed rate of payment for normal time of work and relates to a
time-unit such as hour, day, week or month before any deductions are made.
1.4.6 Cash Earnings
The term cash earnings refers to the remuneration in cash paid to employees, for the time worked or
work done before any deductions are made, such as employees’ contribution to social security or
pension funds. The earnings include payment for time not worked such as annual vacation and other

3
paid leave, other guaranteed and regular paid allowances, payment for overtime work and house-rent
paid directly by the employer.
1.4.7 Annual Wage Bill
The term annual wage bill comprises gross cash remunerations accrued as earnings of employees and
actual cost of free ration paid by employers in respect of their employees. They represent workers
claim for furnishing labour for the production of goods or services on behalf of the employer. The
wage bill does not include non-cash benefits to employees.
1.4.8 Free Housing
The term free housing refers to the employer’s own housing facilities or rented, given to employees
free of charge or the amount of cash the employer pays to employees as housing allowances.
1.4.9 Paid Leave
Paid leave refers to the total number of person-days and total value in cash concerning different
categories of normal paid leaves.
1.4.10 Maternity Leave
Maternity leave refers to the total number of person-days and their total value in cash granted to female
employees. An employee may commence maternity leave at any time from four weeks before the
expected date of confinement; or on an earlier date if a medical practitioner certifies that it is necessary
for the employee's health or that of her unborn child.
1.4.11 Free Ration
This refers to the employer’s meals facilities supplied to employees free of charge or the amount of
cash the employer pays to employees as meals allowances.
1.4.12 Social Security Fund
Social security fund refers to the contributions by both employer and employee to the social security
scheme such as National Social Security Fund (NSSF), Parastatal Pension Fund (PPF) and other
schemes of this nature organized by the establishment for the benefit of employees.
1.4.13 Public Sector
Public Sector includes the Central Government, Local Government and Parastatal Organization.
4
1.4.14 Private Sector
Private Sector includes profit making private establishments, non-profit making private establishments
and co-operative establishments.
1.4.15 Industrial Classification
Industrial Classification is based on the International Standard Industrial Classification of all Economic
Activities (ISIC) Revision 4. Establishments engaged in several activities were classified under the
industrial activity in which the majority of workers were employed. The Government technical
services were allocated according to the industry of the employing department. The major industrial
divisions are 21 according to the ISIC Revision 4 as follows:-
1.4.15.1 Agriculture, Forestry and Fishing
This industry includes the exploitation of vegetable and animal natural resources, comprising the
activities of growing of crops, raising and breeding of animals, harvesting of timber and other plants,
animals or animal products from a farm or their natural habitats.
1.4.15.2 Mining and Quarrying
Mining and quarrying industry includes the extraction of minerals occurring naturally as solids (coal
and ores), liquids (petroleum) or gases (natural gas). This also includes supplementary activities aimed
at preparing crude materials for marketing; for example, crushing and grinding, cleaning, drying,
sorting, concentrating ores, liquefaction of natural gas and agglomeration of solid fuels.
1.4.15.3 Manufacturing
This industry includes physical or chemical transformation of materials, substances, or components
into new products, although this cannot be used as the single universal criterion for defining
manufacturing. The materials, substances, or components transformed are raw materials that are
products of agriculture, forestry, fishing, mining or quarrying as well as products of other
manufacturing activities. Substantial alteration, renovation or reconstruction of goods is generally
considered to be manufacturing.
1.4.15.4 Electricity, Gas, Steam and Air Conditioning Supply
This industry includes the activity of providing electric power, natural gas, steam, hot water and the
like through a permanent infrastructure (network) of lines, mains and pipes. The dimension of the
network is not decisive; also included are the distribution of electricity, gas, steam, hot water and the

5
like in industrial parks or residential buildings. It also includes provision of steam and air conditioning
supply.
1.4.15.5 Water Supply; Sewerage, Waste Management and Remediation Activities
This industry includes activities related to the management (including collection, treatment and
disposal) of various forms of waste, such as solid or non-solid industrial or household waste, as well as
contaminated sites. The output of the waste or sewage treatment process can either be disposed of or
become an input into other production processes.
1.4.15.6 Construction
This industry includes general construction and specialized construction activities for buildings and
civil engineering works. It includes new works, repair, additions and alterations, the erection of
prefabricated buildings or structures on the site and also construction of a temporary nature.
1.4.15.7 Wholesale and Retail Trade; Repair of Motor Vehicles and Motorcycles
This industry includes wholesale and retail sale (i.e. sale without transformation) of any type of goods
and the rendering of services incidental to the sale of these goods. It also includes repair of motor
vehicles and motorcycles.
1.4.15.8 Transportation and Storage
This industry includes the provision of passenger or freight transport, whether scheduled or not, by rail,
pipeline, road, water or air and associated activities such as terminal and parking facilities, cargo
handling, storage etc. It also includes renting of transport equipment with driver or operator and postal
and courier activities.
1.4.15.9 Accommodation, Food and Beverage Service Activities
This industry includes the provision of short-stay accommodation for visitors and other travelers and
the provision of complete meals and drinks fit for immediate consumption. The amount and type of
supplementary services provided within this section can vary widely. This industry excludes the
provision of long-term accommodation as primary residences. Also excluded is the preparation of food
or drinks that are either not fit for immediate consumption or that are sold through independent
distribution channels, i.e. through wholesale or retail trade activities.
6
1.4.15.10 Information and Communication
This industry includes production and distribution of information and cultural products, provision of
means to transmit or distribute these products, as well as data or communications, information
technology activities and the processing of data and other information service activities.
1.4.15.11 Financial and Insurance Activities
This industry also includes activities of holding assets, such as activities of holding companies and that
of trusts, funds and similar financial entities. This industry includes financial service activities, like
insurance, reinsurance and pension funding activities and activities to support financial services.
1.4.15.12 Real Estate Activities
This industry includes acting as leasers, agents and/or brokers in one or more of the following: selling
or buying real estate, renting real estate, providing other real estate services such as appraising real
estate or acting as real estate escrow agents. Activities in this industry may be carried out on own or
leased property and may be done on a fee or contract basis. Also included is the building of structures,
combined with maintaining ownership or leasing of such structures.
1.4.15.13 Professional, Scientific and Technical Activities
This industry includes specialized professional, scientific and technical activities. These activities
require high degree training, and make specialized knowledge and skills available to users.
1.4.15.14 Administrative and Support Service Activities
This industry includes a variety of activities that support general business operations. These activities
differ from those in professional, scientific and technical activities, since their primary purpose is not
the transfer of specialized knowledge.
1.4.15.15 Public Administration and Defence; Compulsory Social Security
This industry includes activities of a governmental nature, normally carried out by the public
administration. It includes the enactment and judicial interpretation of laws and their pursuant
regulation, as well as the administration of programmes based on them, legislative activities, taxation,
national defence, public order and safety, immigration services, foreign affairs and the administration
of government programmes. This industry also includes compulsory social security activities.
7
1.4.15.16 Education
This industry includes education at any level or for any profession, oral or written as well as by
radio and television or other means of communication. It includes education by different
institutions in the regular school system at its different levels as well as adult education, literacy
programmes etc. Also included are military schools and academies, prison schools etc. at their
respective levels. The industry includes public as well as private education. For each level of
initial education, the classes include special education for physically or mentally handicapped
pupils.
1.4.15.17 Human Health and Social Work Activities
This industry includes the provision of health and social work activities. Activities include a
wide range of activities, starting from health care provided by trained medical professionals in
hospitals and other facilities, over residential care activities that still involve a degree of health
care activities to social work activities without any involvement of health care professionals.
1.4.15.18 Arts, Entertainment and Recreation
This industry includes a wide range of activities to meet varied cultural, entertainment and
recreational interests of the general public, including live performances, operation of museum
sites, gambling, sports and recreation activities.
1.4.15.19 Other Service Activities
This industry (as a residual category) includes the activities of membership organizations, the
repair of computers, personal and household goods; and a variety of personal service activities
not covered elsewhere in the classification.
1.4.15.20 Activities of Households as Employers; Undifferentiated Goods and
Services-Producing Activities of Households for Own Use
This industry includes: activities of households as employers of domestic personnel such as
maids, cooks, waiters, valets, butlers, laundresses, gardeners, gatekeepers, stable-lads,
chauffeurs, caretakers, babysitters, tutors, secretaries etc. It allows the domestic personnel

8
employed to state the activity of their employer in censuses or studies, even though the employer
is an individual. The product produced by this activity is consumed by the employing household.
1.4.15.21 Activities of Extraterritorial Organizations and Bodies
This class includes: activities of international organizations such as the United Nations and the
specialized agencies of the United Nations system, regional bodies etc., such as, the International
Monetary Fund, the World Bank, the World Customs Organization, the Organization for
Economic Co-operation and Development, the Organization of Petroleum Exporting Countries,
the East African Community and Southern Africa Development Community .
1.5 Survey Methodology and Estimation Procedure
1.5.1 The Sample Design
The Employment and Earnings Survey 2016 is an establishment- based survey covering a total of
9,628 establishments from a frame of 68,119 establishments. This frame consists of all public
establishments and formal private establishments employing 5 persons and above.
As in previous surveys, the sampling unit of this survey is an establishment which is defined as a
legal economic entity engaging itself in one main kind of economic activity at a fixed location.
The EES 2016 covered formal establishments in both private and public sectors in Tanzania
Mainland in such a way that they formed a representative sample, reflecting the level and
magnitude of the economic activities within their respective industrial groups. The EES sample
was based on a sampling frame obtained from the Central Register of Establishments (CRE)
developed and maintained by NBS. The existing sampling frame was developed on the basis of
International Standard Industrial Classification Revision 4 (ISIC Rev.4).
The survey covered all public -sector establishments and private sector establishments with at
least 50 employees. Furthermore, the survey covered a sample of private establishments
employing 5 to 49 persons. The sampling for this group involved stratifying establishments into
those with 5 to 9 employees and those with 10 to 49 persons. Establishments in these strata were
further stratified on the basis of their economic activities and ultimately a single stage sampling

9
technique was used to derive representative establishments from each activity using the
probability proportion to size (PPS).
1.5.2 Data Collection
Data were collected using questionnaires delivered to the selected establishments through
regional statistical offices in Tanzania Mainland. The data collected include; basic information of
the establishments, characteristics of regular and casual employees, number of newly recruited
workers and job vacancies. The survey did not cover; activities of households as employers,
members of the foreign diplomatic missions, corporation and international aid organizations
stationed in Tanzania and members of armed forces.
1.5.3 The Response Status
Response rates for 2016 EES were computed based on the number of selected establishments and
the number of establishments that actually responded to the survey. Out of 10,603 selected
establishments, 9,628 establishments responded to the survey, giving a response rate of 90.8 per
cent. This indicates that about 975 selected establishments equivalent to 9.2 per cent did not
respond. The summary of response rates for both public and private sector is given in the Table
1.1.

10
Table 1. 1: Number of Establishments and Response Rates by Employment Size and
Sector, Tanzania Mainland, 2016
Sector Employment
Size
Number of Establishments Response Rate
Selected Responded
Private
5 - 9 3,035 2,915 96.0
10 - 49 3,110 2,359 75.9
50 + 1,049 1,412 134.6
Sub Total 7,194 6,686 92.9
Public
5 - 9 1,054 774 73.4
10 - 49 1,355 1,125 83.0
50 + 1,000 1,043 104.3
Sub Total 3,409 2,942 86.3
Grand-Total 10,603 9,628 90.8
1.5.4 Weight
The weights for the strata were calculated by using the simple expression denoted as:-
Weight = N/n
Where: N = Total number of establishments in the sampling frame
n = Total number of establishments that responded

11
Chapter Two
Employment Profile
2. Introduction
The Government of Tanzania and other development partners are embarking on creation of
employment to keep pace with among others the growing work force of the country, thus,
employment is one of the prioritized socio-economic and political agenda in the country.
Tanzania like other countries is facing a number of challenges regarding employment and
therefore, a need for data to monitor and evaluate employment situation in the country has
become more important now than ever. This chapter analyses the performance of employment in
the formal sector in Tanzania Mainland in terms of sector, employment category, disability, age
group, citizenship, industry and region. This information provides a platform for evaluation and
implementation of various national, regional and global level programs aimed at boosting
employment and poverty reduction. These include the National Five -Year Development Plan II
(2016/17 - 2020/2), the EAC Vision 2050, the African Development Agenda 2063 and Global
Sustainable Development Goals 2030 particularly goal number 8.
2.1 Employment by Sector, Category of Employment, Age Group and Sex
This section presents the characteristics of employed persons in the formal sector in terms of
sector, category of employment, age group, disability and sex. Category of employment
comprises of regular and casual employment while age group consists of adults (36 years and
above) and youth (aged 15 -35years). This information plays an important role in evaluation,
formulation and implementation of employment policy for betterment of the country’s
manpower utilization.

12
Key Message
Employment in the formal sector in
Tanzania Mainland has increased to
2,599,311 in 2016 from 2,334,969 in 2015.
More employees (1,748,695) were in
private sector compared to public sector
(850,616).
Table 2. 1: Distribution of Total Employees by Category of Employment and Sector, Tanzania
Mainland, 2015 and 2016
Category of
Employment
2015 2016
Private Public Total Percent Private Public Total Percent
Regular 1,304,653 755,360 2,060,013 88.2 1,568,022 848,010 2,416,032 92.9
Casual 263,512 11,444 274,956 11.8 180,673 2,605 183,279 7.1
Total 1,568,165 766,803 2,334,969 100.0 1,748,695 850,616 2,599,311 100.0
Note: Figures may not necessarily add up to totals due to rounding.
Table 2.1 shows that, the total number of employees in
the formal sector in Tanzania Mainland has increased
from 2,334,969 in 2015 to 2,599,311 in 2016, recording
an increase of 264,342 employees over a period of one
year compared to an increase of 193,618 employees
recorded in year 2014 and 2015.
The results also show that the private sector is still an
important sector in terms of employment with 1,748,695 employees in 2016 which is twice as much
compared to public sector with 850,616 employees. Both private and public sectors show an increment
in employment between 2015 and 2016 with higher growth in the private sector (180,530 employees)
compared to public sector with 83,813 employees over the period.
Furthermore, results indicate that the proportion of regular employment in the formal sector has
increased from 88.2 percent in 2015 to 92.9 percent in 2016, while casual employment has decreased
from 11.8 percent in 2015 to 7.1 percent in 2016. Casual employment is not favored by Tanzanian
laws and is naturally precarious and normally associated with unfavorable working conditions.
13
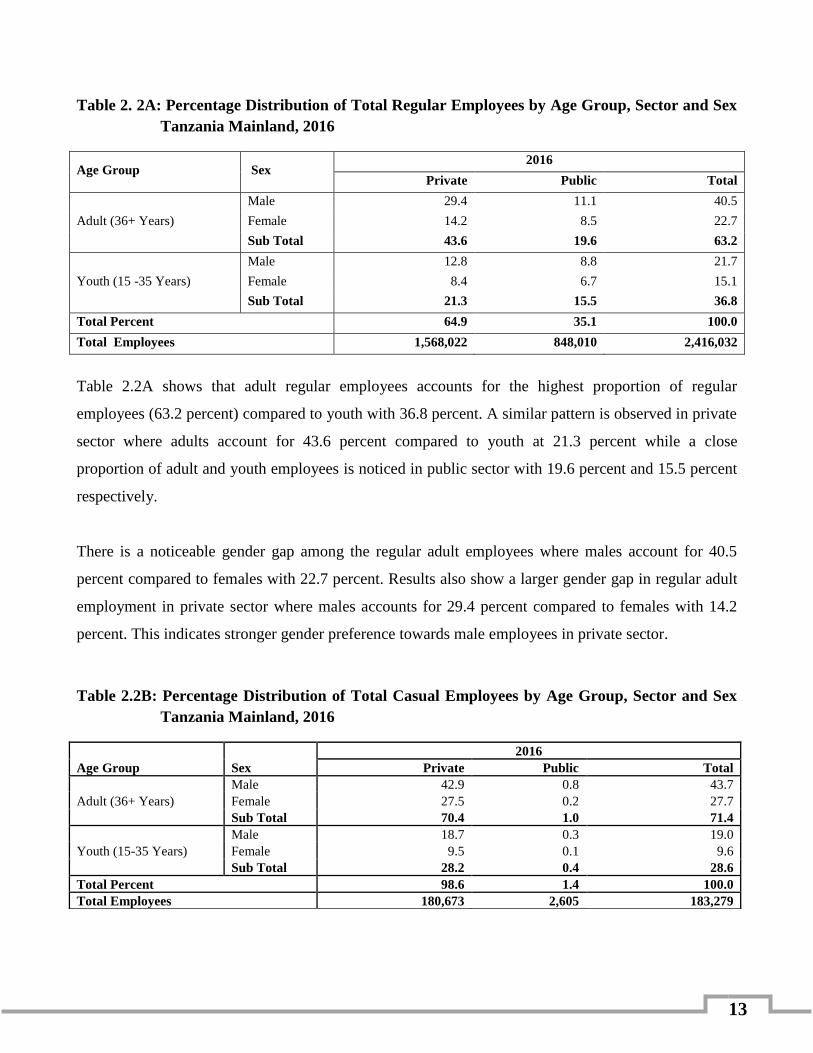
Table 2. 2A: Percentage Distribution of Total Regular Employees by Age Group, Sector and Sex
Tanzania Mainland, 2016
Age Group Sex 2016
Private Public Total
Adult (36+ Years)
Male 29.4 11.1 40.5
Female 14.2 8.5 22.7
Sub Total 43.6 19.6 63.2
Youth (15 -35 Years)
Male 12.8 8.8 21.7
Female 8.4 6.7 15.1
Sub Total 21.3 15.5 36.8
Total Percent 64.9 35.1 100.0
Total Employees 1,568,022 848,010 2,416,032
Table 2.2A shows that adult regular employees accounts for the highest proportion of regular
employees (63.2 percent) compared to youth with 36.8 percent. A similar pattern is observed in private
sector where adults account for 43.6 percent compared to youth at 21.3 percent while a close
proportion of adult and youth employees is noticed in public sector with 19.6 percent and 15.5 percent
respectively.
There is a noticeable gender gap among the regular adult employees where males account for 40.5
percent compared to females with 22.7 percent. Results also show a larger gender gap in regular adult
employment in private sector where males accounts for 29.4 percent compared to females with 14.2
percent. This indicates stronger gender preference towards male employees in private sector.
Table 2.2B: Percentage Distribution of Total Casual Employees by Age Group, Sector and Sex
Tanzania Mainland, 2016
Age Group Sex
2016
Private Public Total
Adult (36+ Years)
Male 42.9 0.8 43.7
Female 27.5 0.2 27.7
Sub Total 70.4 1.0 71.4
Youth (15-35 Years)
Male 18.7 0.3 19.0
Female 9.5 0.1 9.6
Sub Total 28.2 0.4 28.6
Total Percent 98.6 1.4 100.0
Total Employees 180,673 2,605 183,279

14
Key Message
It is revealed that, out of 2,416,032
regular employees in the formal
sector, there were 3,935 employed
persons with disability of whom
2,321 were males and 1,614 females.
Table 2.2B shows that adult employees constitute a higher proportion of casual employees with 71.4
percent compared to youth employees with 28.6 percent. The results also indicate that private sector
had the highest proportion of casual employees at 98.6 percent compared to public sector with 1.4
percent. Furthermore, it is revealed that there are proportionately more adult male employees in casual
employment in private sector (42.9 percent) compared to adult females with 27.5 percent. A similar
pattern is observed in casual youth employees with 18.7 percent for males and 9.5 percent for females.
2.2 Employment and Disability
The Disabled Persons Employment Act No. 2 of 1982 enforces inclusion of persons with disability into
economic production through employment. It has set provision for employing at least two percent of
persons with disability for every 50 employees in an establishment. This section presents the analysis
of employment of disabled persons in the formal sector in Tanzania Mainland. The results can be used
to assess the compliance with the disabled person’s employment Act.
Table 2. 3: Distribution of Regular Employees with Disability by Sector and Sex, Tanzania
Mainland, 2016
Sector
Employees with Disability
(number)
Percent of Employees with
Disability
Total Regular
Employees
Employees with
Disability to Total
Regular Employees (%) Male Female Total Male Female Total
Private 1,411 1,011 2,423 35.9 25.7 61.6 1,568,022 0.2
Public 910 603 1,512 23.1 15.3 38.4 848,010 0.2
Total 2,321 1,614 3,935 59.0 41.0 100.0 2,416,032 0.2
Table 2.3 shows that there were 3,935 employed persons with
disability (2,321 males and 1,614 females) out of 2,416,032
regular employees in the formal sector in 2016. Among the
employed disabled persons, private sector has employed a
larger proportion of persons with disability (61.6 percent)
compared to public sector with 38.4 percent.
Furthermore, the results indicate that among the total disabled employees, there were more males (59.0
percent) than females (41.0 percent). The sex difference is much lower in the public sector (23.1
percent for males and 15.3 percent for females) compared to private sector (35.9 percent for males and

15
25.7 percent for females) than the private sector. Overall, the results indicate a very low level of
absorption of persons with disability at 0.2 percent among regular employees.
2.3 Employment by Sub- Sector, Age Group and Sex
Variations across sub-sectors are important for designing sectorial programs for employment
promotion. On the other hand, employment by sex and age provides important insight on distribution
of employment opportunities among males and females. Youth employment has been a major policy
concern, therefore disaggregating employment by age group will provide useful information for
policies formulation to promote youth employment.
Table 2. 4A: Percentage Distribution of Total Employees by Sub- Sector and Sex, Tanzania
Mainland, 2015 and 2016
Sector
2015 2016
Male Female Total Male Female Total
A: Private
Private Profit- Making
Institutions 36.3 17.1 53.5 35.9 17.5 53.4
Private Non Profit -Making
Institutions 6.8 5.6 12.4 6.7 5.8 12.5
Cooperatives 0.9 0.4 1.3 1.0 0.4 1.4
Total Percent A: 44 23.1 67.2 43.6 23.7 67.3
B: Public
Central and Local
Governments 18 13 31.1 16.8 12.9 29.7
Parastatal Organisations 1.2 0.6 1.8 1.8 1.2 3.0
Total Percent B: 19.2 13.6 32.8 18.6 14.1 32.7
Total Percent (A+B) 63.2 36.8 100.0 62.2 37.8 100.0
Total Number of Employees 1,476,805 858,164 2,334,969 1,616,820 982,491 2,599,311
Table 2.4A reveals that the private profit -making institutions have remained a major employer in the
formal sector with 53.4 percent of all employees, which slightly decreased from 53.5 percent recorded
in 2015. Central and local government ranked second with 29.7 percent of the employees in 2016
decreasing from 31.1 percent recorded in 2015. Cooperatives have the smallest proportion of
employees (1.4 percent of total employees).

16
Results also show that the proportion of employed females (37.8 percent of total employees) is nearly a
half the proportion of males (62.2 percent) in 2016, a similar pattern is observed in 2015. It is also
observed that, the proportion of male employees in the private profit -making institutions (35.9
percent) is larger than females (17.5 percent). A similar pattern is observed in central and local
governments, where 16.8 percent of employees are male and 12.9 percent are female.
Table 2.4B: Percentage Distribution of Total Adult (36+ years) Employees by Sub Sector and
Sex, Tanzania Mainland, 2016
Sector Male Female Total
A: Private
Private Profit -Making Institutions 38.5 17.1 55.7
Private Non Profit -Making Institutions 7.8 6.3 14.1
Cooperatives 1.2 0.4 1.6
Total Percent A: 47.5 23.8 71.3
B: Public
Central and Local Governments 14.5 11.1 25.7
Parastatal Organizations 1.8 1.2 3.0
Total Percent B: 16.3 12.3 28.7
Total Percent (A+B) 63.9 36.1 100.0
Total Number of Employees 1,058,775 599,271 1,658,046
Results in Table 2.4B indicate that the private profit- making institutions had the largest proportion of
total adult employees in the formal sector with 55.7 percent followed by central and local governments
(25.7 percent). The results also reveal that, the proportion of total adult female employees (36.1
percent) is nearly half that of total adult male employees (63.9 percent).
On the other hand, out of the total employment, 38.5 percent of adult male employees were in private
profit -making institutions compared to adult female employees with 17.1 percent. Results further
reveal that 14.5 percent of male employees were in central and local governments compared to females
with 11.1 percent.

17
Table 2.4C: Percentage Distribution of Total Youth (15 - 35 years) Employees by Sub -Sector
and Sex, Tanzania Mainland, 2016
Sector Male Female Total
A: Private
Private Profit -Making Institutions 31.2 18.2 49.5
Private Non Profit -Making Institutions 4.8 4.9 9.7
Cooperatives 0.6 0.4 0.9
Total Percentage A: 36.6 23.5 60.1
B: Public
Central and Local Governments 20.9 16.0 36.9
Parastatal Organisations 1.8 1.2 3.0
Total Percent B: 22.7 17.2 39.9
Total Percent (A+B) 59.3 40.7 100.0
Total Number of Employees 558,045 383,220 941,265
The results in Table 2.4C indicate that private sector is an important employer for youth, employing
60.1 percent of youths aged 15 to 35 years compared to public sector with 39.9 percent. A lower
proportion of female employees (40.7 percent) is observed among youth employees compared to males
with 59.3 percent.
Youth male employees accounted for the larger share of employment in the private profit- making
institutions (31.2 percent) compared to females (18.2 percent). A larger proportion of youth male
employees is also observed in central and local governments with 20.9 percent of total youth
employees compared to 16.0 percent of youth female employees.
2.4 Regular Employment by Citizenship and Sector
Citizenship of employees has become an important issue following regional integrations such as East
African Community (EAC) that aims at free movement of labour within member states. In assessing
the performance of employment in Tanzania, information on citizenship helps to inform policy
formulation on areas of intervention.

18
Key Message
The result indicates that, there
were 2,390,529 Tanzania
citizens and 25,504 Non-citizens
employed in formal sector.
Table 2. 5: Percentage Distribution of Regular Employees by Citizenship and Sub-Sector
Tanzania Mainland, 2015 and 2016
Sector
Citizen Non-Citizen Total
2015 2016 2015 2016 2015 2016
A: Private Profit -Making Institutions. 47.9 49.7 0.7 0.8 48.6 50.5
Non Profit -Making Institutions. 13.1 12.9 0.2 0.1 13.3 13.1
Cooperatives 1.4 1.3 0 0.0 1.4 1.4
Total Percent: A 62.4 64.0 0.9 0.9 63.3 64.9
B: Public Central and Local Governments 34.7 31.8 0 0.1 34.7 31.9
Parastal Organizations 2.0 3.2 0 0.0 2.0 3.2
Total Percent: B 36.7 35.0 0 0.1 36.7 35.1
Total Percent : (A+B) 99.1 98.9 0.9 1.1 100.0 100.0
Total Employees 2,040,925 2,390,529 19,088 25,504 2,060,013 2,416,032
Table 2.5 shows that Tanzanian citizens accounted for 98.9 percent
of total regular employees in the formal sector in 2016, slightly
decreasing from 99.1 recorded in 2015. Correspondingly, the
results indicate a slight increase in the share of employment for
non-citizens from 0.9 percent recorded in 2015 to 1.1 percent in
2016.
The proportion of citizen employees in the private sector to total regular employees has increased from
62.4 percent in 2015 to 64.0 percent in 2016. On the other hand, the proportion of citizen employees in
the public sector has decreased from 36.7 percent recorded in 2015 to 35.0 percent in 2016. The
findings further reveal that, almost all regular non-citizen employees are engaged in private sector,
accounting for 0.9 percent of total regular employees in 2016.
2.5 Employment by Industry and Category of Employment
This section highlights the distribution of employees in different economic activities. The assessment
of these activities informs policy makers on the structure of the work force, performance of
implemented policies in the formal sector and identification of areas which require special attention.
19
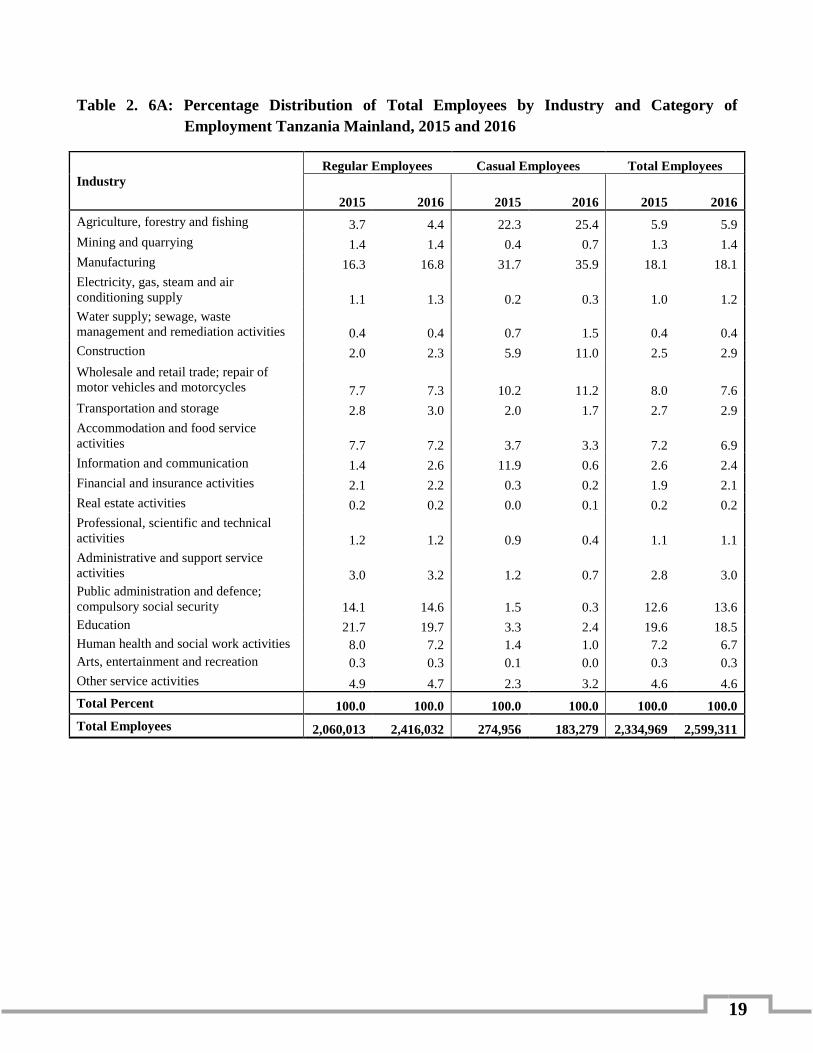
Table 2. 6A: Percentage Distribution of Total Employees by Industry and Category of
Employment Tanzania Mainland, 2015 and 2016
Industry
Regular Employees Casual Employees Total Employees
2015 2016 2015 2016 2015 2016
Agriculture, forestry and fishing 3.7 4.4 22.3 25.4 5.9 5.9
Mining and quarrying 1.4 1.4 0.4 0.7 1.3 1.4
Manufacturing 16.3 16.8 31.7 35.9 18.1 18.1
Electricity, gas, steam and air
conditioning supply 1.1 1.3 0.2 0.3 1.0 1.2
Water supply; sewage, waste
management and remediation activities 0.4 0.4 0.7 1.5 0.4 0.4
Construction 2.0 2.3 5.9 11.0 2.5 2.9
Wholesale and retail trade; repair of
motor vehicles and motorcycles 7.7 7.3 10.2 11.2 8.0 7.6
Transportation and storage 2.8 3.0 2.0 1.7 2.7 2.9
Accommodation and food service
activities 7.7 7.2 3.7 3.3 7.2 6.9
Information and communication 1.4 2.6 11.9 0.6 2.6 2.4
Financial and insurance activities 2.1 2.2 0.3 0.2 1.9 2.1
Real estate activities 0.2 0.2 0.0 0.1 0.2 0.2
Professional, scientific and technical
activities 1.2 1.2 0.9 0.4 1.1 1.1
Administrative and support service
activities 3.0 3.2 1.2 0.7 2.8 3.0
Public administration and defence;
compulsory social security 14.1 14.6 1.5 0.3 12.6 13.6
Education 21.7 19.7 3.3 2.4 19.6 18.5
Human health and social work activities 8.0 7.2 1.4 1.0 7.2 6.7
Arts, entertainment and recreation 0.3 0.3 0.1 0.0 0.3 0.3
Other service activities 4.9 4.7 2.3 3.2 4.6 4.6
Total Percent 100.0 100.0 100.0 100.0 100.0 100.0
Total Employees 2,060,013 2,416,032 274,956 183,279 2,334,969 2,599,311

20
Key Message
The largest proportions to total
employment were in Education
industry (18.5%) and
manufacturing industry with
18.1%.
Table 2.6A indicates that education industry has the largest
share of total employment with 18.5 percent in 2016
compared to 19.6 percent in 2015. Manufacturing industry
ranked second with 18.1 percent of total employment in
2016, followed by public administration and defence;
compulsory social security with 13.6 percent.
The results also show that education industry led in 2016 by employing 19.7 percent of regular
employees, followed by manufacturing industry with 16.8 percent and Public administration and
defence; compulsory social security with 14.6 percent of regular employees. Real estate industry
had the smallest share of regular employees in 2016 (0.2 percent).
Moreover, manufacturing was found to be the most important industry for casual employment,
with an increasing share of total casual employees from 31.7 percent in 2015 to 35.9 percent in
2016. Agriculture, forestry and fishing was the second most important industry for casual
employment, employing 25.4 percent of casual employees in 2016.
3.6 Employment by Industry, Category of Employment and Sex
This part discusses employment by industry in terms of regular and casual employment
categories and sex. These data are of great importance as they provide basic information on
employment levels for a specific industry. Analyzed information is helpful for policy makers to
address gender gap in employment in various industries.

21
Table 2.6B: Percentage Distribution of Total Employees by Industry, Category of Employment
and Sex, Tanzania Mainland, 2016
Industry Regular Employees Casual Employees
Total Male Female Total Male Female Total
Agriculture, forestry and
fishing 2.9 1.5 4.4 16.6 8.8 25.4 5.9
Mining and quarrying 1.3 0.2 1.4 0.5 0.1 0.7 1.4
Manufacturing 11.8 5.0 16.8 21.3 14.6 35.9 18.1
Electricity, gas, steam and air
conditioning supply 0.9 0.4 1.3 0.3 0.0 0.3 1.2
Water supply; sewage, waste
management and remediation
activities
0.3 0.1 0.4 1.3 0.2 1.5 0.4
Construction 1.9 0.4 2.3 4.4 6.6 11.0 2.9
Wholesale and retail trade;
repair of motor vehicles and
motorcycles
5.5 1.8 7.3 8.9 2.3 11.2 7.6
Transportation and storage 2.4 0.6 3.0 1.6 0.1 1.7 2.9
Accommodation and food
service activities 3.3 3.9 7.2 1.8 1.5 3.3 6.9
Information and
communication 1.7 0.9 2.6 0.3 0.3 0.6 2.4
Financial and insurance
activities 1.2 1.0 2.2 0.1 0.0 0.2 2.1
Real estate activities 0.1 0.1 0.2 0.1 0.1 0.1 0.2
Professional, scientific and
technical activities 0.7 0.4 1.2 0.3 0.1 0.4 1.1
Administrative and support
service activities 2.5 0.7 3.2 0.5 0.1 0.7 3.0
Public administration and
defence; compulsory social
security
9.2 5.4 14.6 0.2 0.1 0.3 13.6
Education 10.7 9.0 19.7 1.4 1.0 2.4 18.5
Human health and social
work activities 2.7 4.5 7.2 0.5 0.5 1.0 6.7
Arts, entertainment and
recreation 0.2 0.2 0.3 0.0 0.0 0.0 0.3
Other service activities 2.8 1.8 4.7 2.5 0.7 3.2 4.6
Total Percent 62.2 37.8 100.0 62.7 37.3 100.0 100.0
Total Employees 1,501,957 914,075 2,416,032 114,863 68,415 183,279 2,599,311
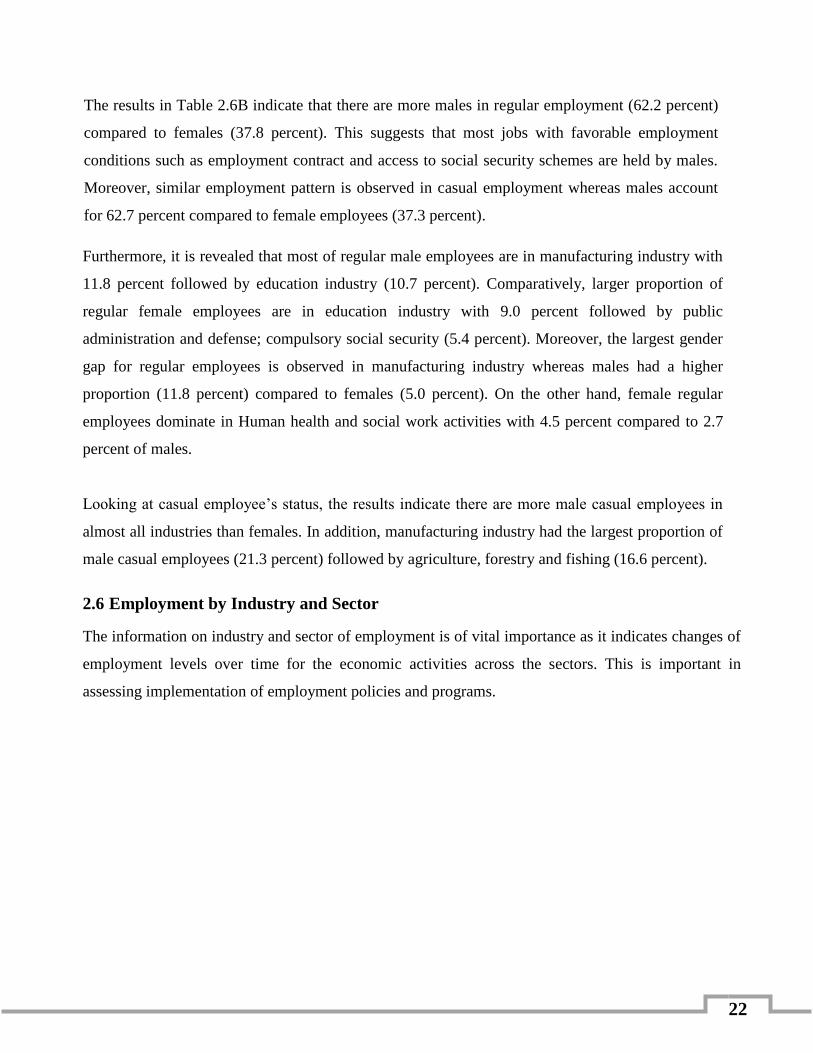
22
The results in Table 2.6B indicate that there are more males in regular employment (62.2 percent)
compared to females (37.8 percent). This suggests that most jobs with favorable employment
conditions such as employment contract and access to social security schemes are held by males.
Moreover, similar employment pattern is observed in casual employment whereas males account
for 62.7 percent compared to female employees (37.3 percent).
Furthermore, it is revealed that most of regular male employees are in manufacturing industry with
11.8 percent followed by education industry (10.7 percent). Comparatively, larger proportion of
regular female employees are in education industry with 9.0 percent followed by public
administration and defense; compulsory social security (5.4 percent). Moreover, the largest gender
gap for regular employees is observed in manufacturing industry whereas males had a higher
proportion (11.8 percent) compared to females (5.0 percent). On the other hand, female regular
employees dominate in Human health and social work activities with 4.5 percent compared to 2.7
percent of males.
Looking at casual employee’s status, the results indicate there are more male casual employees in
almost all industries than females. In addition, manufacturing industry had the largest proportion of
male casual employees (21.3 percent) followed by agriculture, forestry and fishing (16.6 percent).
2.6 Employment by Industry and Sector
The information on industry and sector of employment is of vital importance as it indicates changes of
employment levels over time for the economic activities across the sectors. This is important in
assessing implementation of employment policies and programs.
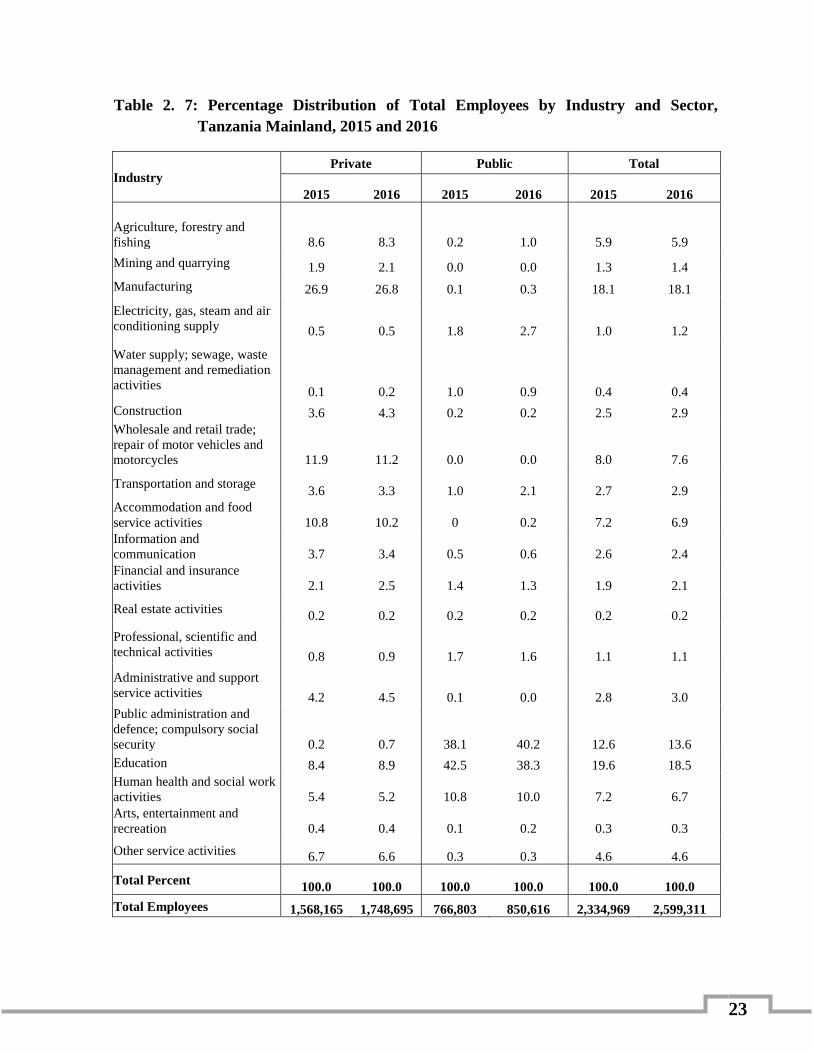
23
Table 2. 7: Percentage Distribution of Total Employees by Industry and Sector,
Tanzania Mainland, 2015 and 2016
Industry Private Public Total
2015 2016 2015 2016 2015 2016
Agriculture, forestry and
fishing 8.6 8.3 0.2 1.0 5.9 5.9
Mining and quarrying 1.9 2.1 0.0 0.0 1.3 1.4
Manufacturing 26.9 26.8 0.1 0.3 18.1 18.1
Electricity, gas, steam and air
conditioning supply 0.5 0.5 1.8 2.7 1.0 1.2
Water supply; sewage, waste
management and remediation
activities 0.1 0.2 1.0 0.9 0.4 0.4
Construction 3.6 4.3 0.2 0.2 2.5 2.9
Wholesale and retail trade;
repair of motor vehicles and
motorcycles 11.9 11.2 0.0 0.0 8.0 7.6
Transportation and storage 3.6 3.3 1.0 2.1 2.7 2.9
Accommodation and food
service activities 10.8 10.2 0 0.2 7.2 6.9
Information and
communication 3.7 3.4 0.5 0.6 2.6 2.4
Financial and insurance
activities 2.1 2.5 1.4 1.3 1.9 2.1
Real estate activities 0.2 0.2 0.2 0.2 0.2 0.2
Professional, scientific and
technical activities 0.8 0.9 1.7 1.6 1.1 1.1
Administrative and support
service activities 4.2 4.5 0.1 0.0 2.8 3.0
Public administration and
defence; compulsory social
security 0.2 0.7 38.1 40.2 12.6 13.6
Education 8.4 8.9 42.5 38.3 19.6 18.5
Human health and social work
activities 5.4 5.2 10.8 10.0 7.2 6.7
Arts, entertainment and
recreation 0.4 0.4 0.1 0.2 0.3 0.3
Other service activities 6.7 6.6 0.3 0.3 4.6 4.6
Total Percent 100.0 100.0 100.0 100.0 100.0 100.0
Total Employees 1,568,165 1,748,695 766,803 850,616 2,334,969 2,599,311

24
The findings in Table 2.7 show that the largest proportion of employees in private sector are in
manufacturing industry with a slight decrease to 26.8 percent in 2016 from 26.9 percent in 2015
followed by wholesale and retail trade; repair of motor vehicles and motorcycles with 11.2
percent and accommodation and food service activities (10.2 percent).
Nevertheless, public administration and defence; compulsory social security had the largest
proportion of employment in public sector with 40.2 percent in 2016 that increased from 38.1
percent in 2015. Education industry ranked second with a proportion of 38.3 percent in 2016
followed by human health and social work activities with 10.0 percent.
2.7 Employment by Industry, Age Group and Sex
This section analyses employment by industry, age group (adult and youth) and sex. The
outcome shows gender gaps between adult and youth employees in specific economic activities.
Therefore, the provided information is useful for creating programs to address gender gap in
employment.
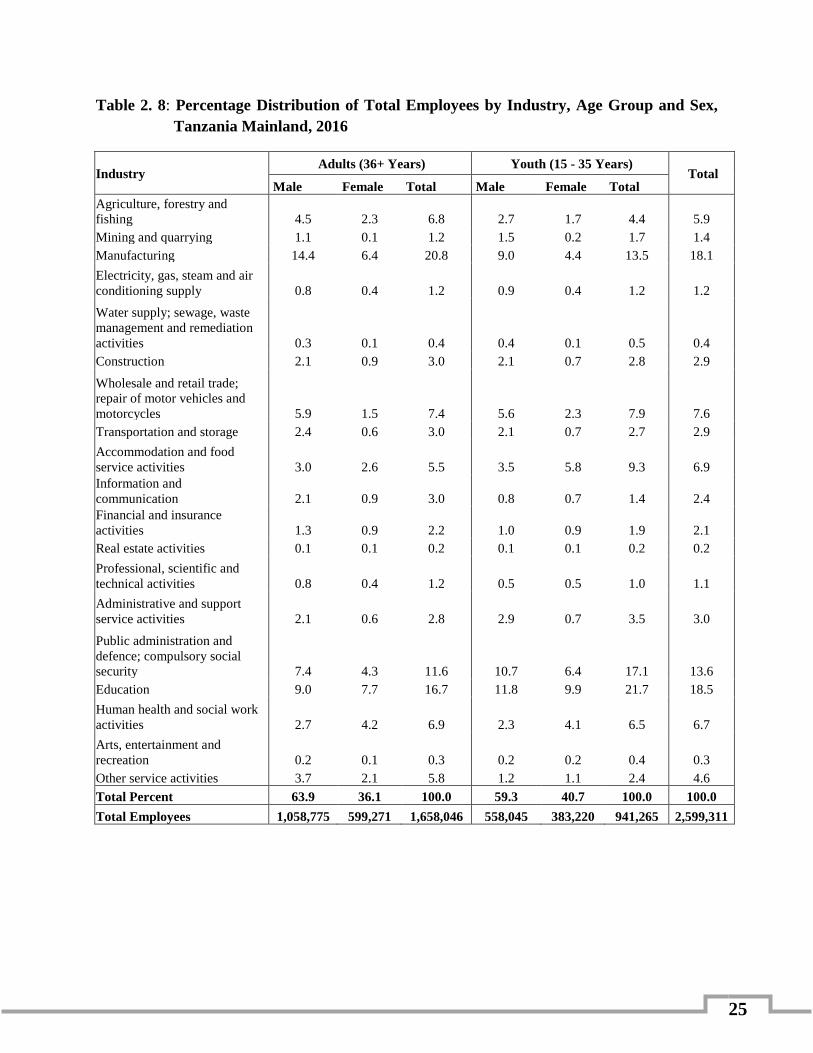
25
Table 2. 8: Percentage Distribution of Total Employees by Industry, Age Group and Sex,
Tanzania Mainland, 2016
Industry Adults (36+ Years) Youth (15 - 35 Years)
Total Male Female Total Male Female Total
Agriculture, forestry and
fishing 4.5 2.3 6.8 2.7 1.7 4.4 5.9
Mining and quarrying 1.1 0.1 1.2 1.5 0.2 1.7 1.4
Manufacturing 14.4 6.4 20.8 9.0 4.4 13.5 18.1
Electricity, gas, steam and air
conditioning supply 0.8 0.4 1.2 0.9 0.4 1.2 1.2
Water supply; sewage, waste
management and remediation
activities 0.3 0.1 0.4 0.4 0.1 0.5 0.4
Construction 2.1 0.9 3.0 2.1 0.7 2.8 2.9
Wholesale and retail trade;
repair of motor vehicles and
motorcycles 5.9 1.5 7.4 5.6 2.3 7.9 7.6
Transportation and storage 2.4 0.6 3.0 2.1 0.7 2.7 2.9
Accommodation and food
service activities 3.0 2.6 5.5 3.5 5.8 9.3 6.9
Information and
communication 2.1 0.9 3.0 0.8 0.7 1.4 2.4
Financial and insurance
activities 1.3 0.9 2.2 1.0 0.9 1.9 2.1
Real estate activities 0.1 0.1 0.2 0.1 0.1 0.2 0.2
Professional, scientific and
technical activities 0.8 0.4 1.2 0.5 0.5 1.0 1.1
Administrative and support
service activities 2.1 0.6 2.8 2.9 0.7 3.5 3.0
Public administration and
defence; compulsory social
security 7.4 4.3 11.6 10.7 6.4 17.1 13.6
Education 9.0 7.7 16.7 11.8 9.9 21.7 18.5
Human health and social work
activities 2.7 4.2 6.9 2.3 4.1 6.5 6.7
Arts, entertainment and
recreation 0.2 0.1 0.3 0.2 0.2 0.4 0.3
Other service activities 3.7 2.1 5.8 1.2 1.1 2.4 4.6
Total Percent 63.9 36.1 100.0 59.3 40.7 100.0 100.0
Total Employees 1,058,775 599,271 1,658,046 558,045 383,220 941,265 2,599,311

26
Table 2.8 indicates that adult male employees had higher proportion (63.9 percent) compared to
adult female employees (36.1 percent). It is also observed that in all industries except for human
health and social work activities, adult male employees had the largest proportions than adult
female employees. In addition, the highest male – female gap in employment is observed in
manufacturing industry with 8.0 percentage points followed by wholesale and retail trade; repair
of motor vehicles and motorcycles (4.3 percentage points).
On the other hand, the findings show that youth male employees accounted for a higher
proportion (59.3 percent) compared to youth female employees (40.7 percent). Nevertheless,
there were higher proportions of youth female employees in accommodation and food service
activities and human health and social work activities with 5.8 percent and 4.1 percent compared
to 3.5 percent and 2.3 percent for youth male employees respectively.
2.8 Regular Employment by Citizenship and Industry
This section provides information on the distribution of citizen and non-citizen regular
employees in relation to industries. The results will help policy makers to plan on how to
enhance citizen capacity to compete in the national labour market to fill skill gaps in occupation
that would normally engage non-citizen employees.

27
Table 2. 9: Percentage Distributions of Regular Employees by Citizenship and Industry,
Tanzania Mainland, 2016
Industry Citizen Non - Citizen Total
Agriculture, forestry and fishing 4.5 2.4 4.4
Mining and quarrying 1.4 3.1 1.4
Manufacturing 16.6 30.9 16.8
Electricity, gas, steam and air conditioning supply 1.3 0.2 1.3
Water supply; sewage, waste management and
remediation activities
0.4 0.4 0.4
Construction 2.3 7.7 2.3
Wholesale and retail trade; repair of motor vehicles and
motorcycles
7.2 12.0 7.3
Transportation and storage 3.0 2.9 3.0
Accommodation and food service activities 7.2 6.2 7.2
Information and communication 2.6 3.7 2.6
Financial and insurance activities 2.3 1.1 2.2
Real estate activities 0.2 0.1 0.2
Professional, scientific and technical activities 1.2 0.4 1.2
Administrative and support service activities 3.2 2.1 3.2
Public administration and defence; compulsory social
security
14.7 3.6 14.6
Education 19.7 17.8 19.7
Human Health and social work activities 7.2 2.4 7.2
Arts, entertainment and recreation 0.3 0.5 0.3
Other service activities 4.7 2.4 4.7
Total Percent 100.0 100.0 100.0
Total Employees 2,390,529 25,504 2,416,032
Results in Table 2.9 show that education industry has the highest proportion of total citizen
regular employees with 19.7 percent followed manufacturing industry (16.6 percent) and public
administration and defense; compulsory social security (14.7 percent). The findings further
reveal that the majority of non-citizen regular employees are in manufacturing industry (30.9
percent) followed by education industry (17.8 percent) and wholesale and retail trade; repair of
motor vehicles and motorcycles with 12.0 percent.
2.9 Employment by Region and Sector
This section presents information on the distribution of employees by region and sector. The
results are useful in evaluating regional contribution to total employment and also helpful in
planning and implementation of programs to enhance regional employment in various economic
activities.

28
Table 2. 10: Percentage Distribution of Total Employees by Region and Sector, Tanzania
Mainland, 2015 and 2016
Region Private Public Total
2015 2016 2015 2016 2015 2016
Dodoma 1.0 1.4 1.7 5.1 2.7 2.6
Arusha 5.9 8.4 1.1 3.3 7.1 6.8
Kilimanjaro 3.8 5.2 1.7 5.3 5.5 5.2
Tanga 3.1 4.6 1.6 4.7 4.7 4.6
Morogoro 8.3 11.9 3.2 8.9 11.5 10.9
Pwani 0.9 1.4 1.2 3.4 2.1 2.0
Dar es Salaam 26.3 40.4 4.3 12.4 30.6 31.2
Lindi 0.3 0.4 1 3.0 1.2 1.3
Mtwara 0.5 0.9 0.7 2.3 1.2 1.3
Ruvuma 1.0 1.9 1 2.8 2 2.2
Iringa 1.5 2.2 1.2 3.7 2.7 2.7
Mbeya 2.8 4.0 2.3 6.9 5.1 4.9
Singida 0.7 1.1 1 3.0 1.6 1.7
Tabora 0.6 0.8 1 3.5 1.6 1.7
Rukwa 0.4 0.5 0.7 2.3 1.1 1.1
Kigoma 0.6 1.0 1.1 3.3 1.8 1.8
Shinyanga 1.1 1.5 1.2 4.0 2.3 2.3
Kagera 0.9 1.3 1.2 3.6 2 2.1
Mwanza 4.4 6.0 1.7 5.6 6.2 5.9
Mara 0.8 1.1 1.2 4.0 2 2.0
Manyara 0.7 1.4 0.7 2.4 1.4 1.8
Njombe 0.4 0.6 0.5 1.8 0.8 1.0
Katavi 0.0 0.1 0.3 1.1 0.3 0.4
Simiyu 0.2 0.3 0.7 2.6 1 1.1
Geita 1.1 1.5 0.4 1.4 1.5 1.5
Total Percent 67.2 67.3 32.8 32.7 100 100.0
Total
Employees
1,568,165 1,748,695 766,803 850,616 2,334,969 2,599,311
Findings in Table 2.10 show that Dar es Salaam region had the largest proportion of the total
employees (31.2 percent) in 2016, followed by Morogoro (10.9 percent), Arusha (6.8 percent)
and Mwanza with 5.9 percent. However, Katavi region had the smallest share of total
employment (0.4 percent) followed by Njombe with 1.0 percent.

29
2.10 Employment by Region, Category of Employment and Sex
This section analyses the percentage share of the total number of employees by region, category
of employment and sex. It looks at gender patterns across different regions so as to support the
development of regional specific gender policies.
Table 2. 11: Percentage Distribution of Total Employees by Region, Category of
Employment and Sex, Tanzania Mainland, 2016
Region Regular Casual
Total Male Female Total Male Female Total
Dodoma 1.5 1.3 2.8 0.3 0.1 0.4 2.6
Arusha 3.8 2.9 6.7 3.4 4.1 7.5 6.8
Kilimanjaro 2.9 2.3 5.2 2.6 2.4 5.0 5.2
Tanga 2.3 1.8 4.2 5.9 5.0 10.9 4.6
Morogoro 7.6 3.4 11.0 6.3 3.2 9.4 10.9
Pwani 1.3 0.8 2.1 1.2 0.4 1.6 2.0
Dar es Salaam 20.4 11.1 31.5 19.8 7.8 27.6 31.2
Lindi 0.8 0.6 1.3 0.1 0.0 0.1 1.3
Mtwara 0.9 0.5 1.4 0.2 0.1 0.3 1.3
Ruvuma 1.1 0.8 1.9 0.2 5.5 5.7 2.2
Iringa 1.5 1.1 2.6 2.1 1.3 3.3 2.7
Mbeya 2.8 2.1 5.0 3.3 1.1 4.4 4.9
Singida 1.0 0.7 1.7 1.3 0.5 1.8 1.7
Tabora 1.1 0.7 1.8 0.2 0.1 0.3 1.7
Rukwa 0.7 0.4 1.2 0.2 0.1 0.3 1.1
Kigoma 1.3 0.6 1.8 0.5 0.1 0.7 1.8
Shinyanga 1.6 0.8 2.5 0.4 0.2 0.7 2.3
Kagera 1.3 0.8 2.1 1.5 0.4 1.8 2.1
Mwanza 3.4 2.1 5.4 9.0 2.6 11.6 5.9
Mara 1.2 1.0 2.1 0.3 0.2 0.5 2.0
Manyara 1.0 0.6 1.6 2.7 1.0 3.8 1.8
Njombe 0.6 0.4 1.0 0.3 0.2 0.4 1.0
Katavi 0.3 0.2 0.5 - 0.0 0.0 0.4
Simiyu 0.7 0.4 1.1 0.3 0.2 0.4 1.1
Geita 1.1 0.4 1.5 0.6 0.7 1.3 1.5
Total Percent 62.2 37.8 100.0 62.7 37.3 100.0 100.0
Total Employees 1,501,957 914,075 2,416,032 114,863 68,415 183,279 2,599,311

30
Table 2.11 reveals that the highest male – female gap in regular employment is observed in Dar
es Salaam region with 9.3 percentage points followed by Morogoro with 4.1 percentage points.
Gender inequality in casual employment is highest in Dar es Salaam region with 12.0 percentage
points followed by Mwanza (6.5 percentage points) and Morogoro (3.1 percentage points).
However, the percentage share of female – male gap on casual employees is observed only in
regions of Ruvuma with 5.3 percentage points, Arusha (0.8 percentage points) and Geita (0.1
percentage points).
2.11 Adult and Youth Employment in Private and Public Sectors by Region and Age
Group
This section shows the distribution of total employees in private and public sector by region and
age group. The assessment reveals the performance and contribution of private and public sectors
in relation to adult and youth employees. It also emphasizes the role of private sector which is
considered to be the engine of the economy in employment creation.
Table 2. 12: Percentage Distribution of Total Employees by Major Sectors, Region and Age
Group, Tanzania Mainland, 2016
Region Private Sector Public Sector
Adult (36+ Years) Youth (15 - 35 Years) Adult (36+ Years) Youth (15 - 35 Years)
Dodoma 1.1 2.2 4.7 5.6
Arusha 9.6 6.0 4.3 2.1
Kilimanjaro 5.1 5.3 6.4 3.8
Tanga 5.6 2.6 5.3 3.8
Morogoro 15.2 4.8 8.6 9.3
Pwani 1.3 1.6 3.3 3.5
Dar es Salaam 39.6 41.9 13.9 10.5
Lindi 0.4 0.6 3.3 2.6
Mtwara 0.8 1.0 2.1 2.6
Ruvuma 1.6 2.4 3.3 2.2
Iringa 2.0 2.7 3.3 4.2
Mbeya 3.5 5.0 6.6 7.3
Singida 1.1 1.2 3.5 2.4
Tabora 0.7 1.0 2.2 5.1
Rukwa 0.4 0.7 1.9 2.8
Kigoma 0.8 1.3 3.7 2.8
Shinyanga 1.5 1.7 3.4 4.7
Kagera 1.2 1.6 3.2 4.0
Mwanza 4.8 8.6 5.0 6.2
Mara 0.8 1.6 3.6 4.4
Manyara 1.0 2.4 2.7 2.1
Njombe 0.5 0.8 1.6 2.0
Katavi 0.1 0.1 0.8 1.3

31
Simiyu 0.2 0.5 2.0 3.2
Geita 1.1 2.3 1.3 1.4
Total Percent 100.0 100.0 100.0 100.0
Total Employees 1,183,002 565,694 475,044 375,571
The results in Table 2.12 indicates that Dar es Salaam region has the highest percentage share of
adult employees in private sector with 39.6 percent followed by Morogoro (15.2 percent) and
Arusha (9.6 percent). It is also revealed that Dar es Salaam has the highest percentage share of
youth employees in private sector with 41.9 percent followed by Mwanza with 8.6 percent and
Arusha (6.0 percent). There is no significant difference in private sector employment for both
adult and youth in the remaining regions.
Moreover, the findings reveal that Dar es Salaam has the highest percentage share of adult
employees in the public sector with 13.9 percent followed by Morogoro with 8.6 percent and
Mbeya (6.6 percent). Similar pattern is observed in youth employees whereas Dar es Salaam has
the highest percentage share with 10.5 percent followed by Morogoro (9.3 percent) and Mbeya
(7.3 percent).

32
Chapter Three
Monthly Wage Rate Profile
3. Introduction
Wage rate is defined as the rate of compensation for a worker, personnel expenses and labour
paid by an employer to an employee in exchange for work done. It indicates the basis of making
payment to the workers, which may relate to output basis or time basis such as an hour, a day,
week or month before any deductions are made.
Information on wage rate profile helps to determine the cost of production, workers’ earnings
and their living standards. It also affects the interest, attitude and satisfaction of workers which
helps to increase the productivity and goodwill of the organization.
3.1 Total Citizen Employees by Sector and Monthly Wage Rate
This section presents distribution of citizen employees by wage rates. The information is
important in designing wage and remuneration policies in the country. Wage rates by major
sectors of the economy are important to the government and other users to understand wage
differentials between public and private sectors.
Table 3. 1: Percentage Distribution of Total Citizen Employees by Monthly Wage Rate
(TZS) Group and Sector, Tanzania Mainland, 2016
Monthly Wage Rate (TZS) Group Private Public Total
Up to 100,000 6.7 0.1 6.8
100,001 -150,000 14.6 0.2 14.8
150,001 - 300,000 17.8 1.1 18.9
300,001 - 500,000 10.6 8.1 18.6
500,001 - 900,000 7.6 15.3 22.9
900,001 - 1,200,000 2.9 6.0 8.9
1,200,001 - 1,500,000 1.8 2.7 4.5
Above 1,500,000 2.7 1.8 4.5
Total Percent 64.6 35.4 100.0
Total Citizen Employees 1,544,064 844,830 2,388,894

33
Key Message
The results reveal that the
majority of the employees
(22.9%) in Public and Private
sectors earn monthly wages
between TZS 500,001 - 900,000
Table 3.1 shows that in 2016, the majority of citizen
employees earn monthly wages between TZS 500,001 and
900,000 (22.9 percent), with relatively larger share of citizen
employees in the public sector (15.3 percent) compared to
those in the private sector (7.6 percent). This is followed
closely by those who earn monthly wages between TZS
150,001 and 300,000 (18.9 percent) and those earning between TZS 300,001 and 500,000 at 18.6
percent.
Furthermore, the largest proportion of citizen employees in private sector (17.8 percent) earned
monthly wage rate between TZS 150,001 and 300,000 followed by those earning between TZS
100,001 and 150,000 (14.6 percent). On the other hand, the largest proportion of citizen
employees in public sector (15.3 percent) earn between TZS 500,001 and 900,000 followed by
those earning between TZS 300,001 and 500,000 at 8.1 percent.
However, small proportion of citizen employees (4.5 percent) earned TZS 1,500,000 and above
with a slightly larger proportion in a private sector (2.7 percent) than public sector (1.8 percent).
Generally, these results suggest presence of under payment in the private sector where majority
of employees earned monthly wages below TZS 300,000 compared to public sector.
3.2 Total Citizen Employees by Monthly Wage Rate Groups and Sex
Disaggregation of wage rates by sex is important for assessing gender pay gaps in the country.
The analysis of wage rate in this section will help in policy formulation and action to minimize
gender pay gap among employees with similar attributes and qualifications.

34
Table 3. 2: Percentage Distribution of Total Citizen Employees by Monthly Wage Rate
(TZS) Group and Sex, Tanzania Mainland, 2016
Monthly Wage Rate Male Female Total
Up to 100,000 6.3 7.8 6.9
100,001 -150,000 15.1 14.2 14.8
150,001 - 300,000 20.6 16.2 18.9
300,001 - 500,000 18.5 18.9 18.6
500,001 - 900,000 22.0 24.5 22.9
900,001 - 1,200,000 8.3 10.0 8.9
1,200,001 - 1,500,000 4.4 4.7 4.5
Above 1,500,000 4.9 3.8 4.5
Total Percent 100.0 100.0 100.0
Total Citizen Employees 1,480,859 908,035 2,388,894
Table 3.2 shows that, the largest proportion of employees (22.9 percent) earn monthly wages
between TZS 500,001 and 900,000 with larger proportion for females (24.5 percent) than males
(22.0 percent). This is followed by those who earn monthly wages between TZS 150,001 to
300,000 (18.9 percent) with males accounting for a larger proportion (20.6 percent) than females
(16.2 percent).
The result further reveals that, proportionately there are more female employees (7.8 percent)
earning less than TZS 100,000 compared to males with 6.3 percent. Despite the larger proportion
of females in lower wages, there is larger proportion of females (4.7 percent) earning higher
wages between TZS 1,200,001 and 1,500,000 than males (4.4 percent). However; more
proportion of males (4.9 percent) compared to females (3.8 percent) earn monthly wages above
TZS 1,500,000.
Generally, females are more likely than males to engage in low paying jobs. This may be
attributed by inadequacy in education qualifications and position of females in the society.
3.3 Citizen Employees by Monthly Wage Rates and Industry
Wage rates by industry provide useful information for understanding wage differences across
industries of the economy. This information is crucial in investment planning decisions,
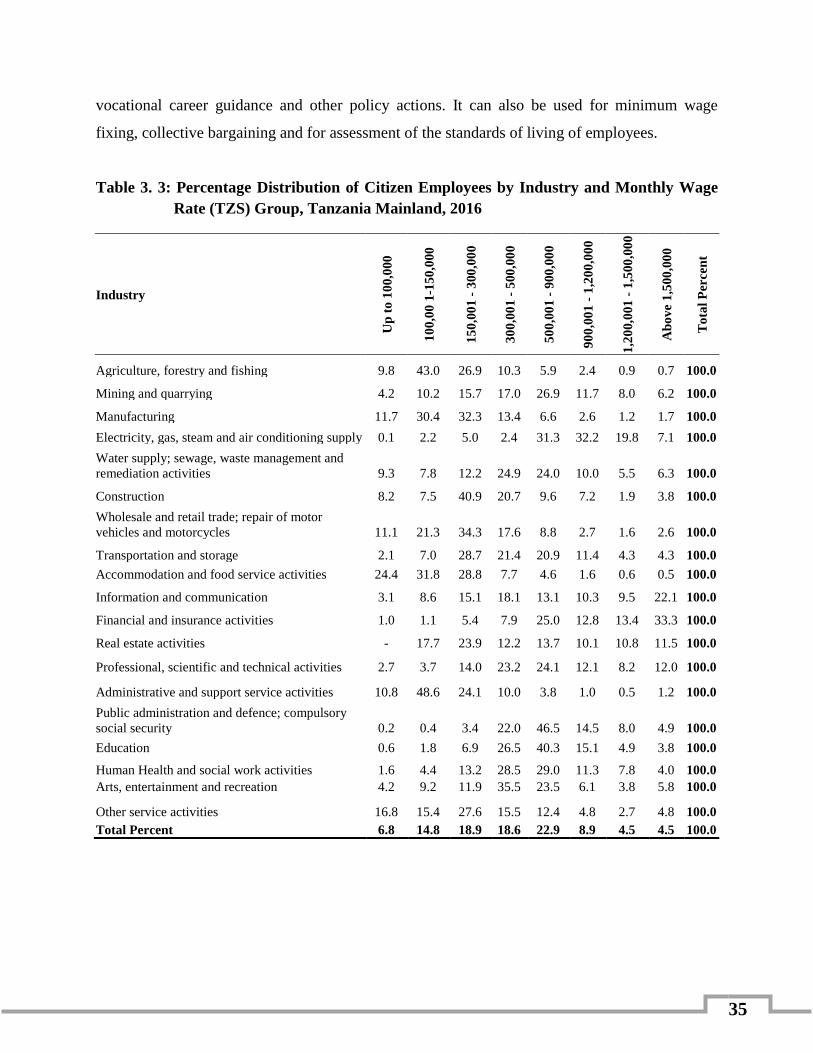
35
vocational career guidance and other policy actions. It can also be used for minimum wage
fixing, collective bargaining and for assessment of the standards of living of employees.
Table 3. 3: Percentage Distribution of Citizen Employees by Industry and Monthly Wage
Rate (TZS) Group, Tanzania Mainland, 2016
Industry
Up
to
10
0,0
00
10
0,0
0 1
-150
,000
15
0,0
01
- 3
00
,00
0
30
0,0
01
- 5
00
,00
0
50
0,0
01
- 9
00
,00
0
90
0,0
01
- 1
,20
0,0
00
1,2
00,0
01
- 1
,500
,00
0
Ab
ov
e 1
,500
,00
0
To
tal
Per
cen
t
Agriculture, forestry and fishing 9.8 43.0 26.9 10.3 5.9 2.4 0.9 0.7 100.0
Mining and quarrying 4.2 10.2 15.7 17.0 26.9 11.7 8.0 6.2 100.0
Manufacturing 11.7 30.4 32.3 13.4 6.6 2.6 1.2 1.7 100.0
Electricity, gas, steam and air conditioning supply 0.1 2.2 5.0 2.4 31.3 32.2 19.8 7.1 100.0
Water supply; sewage, waste management and
remediation activities 9.3 7.8 12.2 24.9 24.0 10.0 5.5 6.3 100.0
Construction 8.2 7.5 40.9 20.7 9.6 7.2 1.9 3.8 100.0
Wholesale and retail trade; repair of motor
vehicles and motorcycles 11.1 21.3 34.3 17.6 8.8 2.7 1.6 2.6 100.0
Transportation and storage 2.1 7.0 28.7 21.4 20.9 11.4 4.3 4.3 100.0
Accommodation and food service activities 24.4 31.8 28.8 7.7 4.6 1.6 0.6 0.5 100.0
Information and communication 3.1 8.6 15.1 18.1 13.1 10.3 9.5 22.1 100.0
Financial and insurance activities 1.0 1.1 5.4 7.9 25.0 12.8 13.4 33.3 100.0
Real estate activities - 17.7 23.9 12.2 13.7 10.1 10.8 11.5 100.0
Professional, scientific and technical activities 2.7 3.7 14.0 23.2 24.1 12.1 8.2 12.0 100.0
Administrative and support service activities 10.8 48.6 24.1 10.0 3.8 1.0 0.5 1.2 100.0
Public administration and defence; compulsory
social security 0.2 0.4 3.4 22.0 46.5 14.5 8.0 4.9 100.0
Education 0.6 1.8 6.9 26.5 40.3 15.1 4.9 3.8 100.0
Human Health and social work activities 1.6 4.4 13.2 28.5 29.0 11.3 7.8 4.0 100.0
Arts, entertainment and recreation 4.2 9.2 11.9 35.5 23.5 6.1 3.8 5.8 100.0
Other service activities 16.8 15.4 27.6 15.5 12.4 4.8 2.7 4.8 100.0
Total Percent 6.8 14.8 18.9 18.6 22.9 8.9 4.5 4.5 100.0

36
Key Message
Financial and Insurance
activities industry have the
highest proportion of employees
earning wages above TZS
1,500,000 (33.3%).
Table 3.3 indicates that, industry of financial and insurance
activities has the highest proportion of employees earning
higher wages above TZS 1,500,000 (33.3 percent) followed
by information and communication industry (22.1 percent)
and professional, scientific and technical activities industry
with 12.0 percent.
In addition, construction industry has the highest proportion of employees earning wages
between TZS 150,001 and 300,000 (40.9 percent) followed by wholesale and retail trade and
repair of motor vehicles and motorcycles (34.3 percent). Accommodation and food service
activities industry accounted for the largest share of lowly paid employees (24.4 percent) with
wages up to TZS 100,000.
3.4 Citizen Employees by Monthly Wage Rate and Sex
This section presents findings on the distribution of regular citizen employees by age group and
wage rate groups. This information gives an insight into current pay status and thus helpful in
formulation and monitoring of policies that address the gender pay gap.
Table 3. 4: Percentage Distribution of Regular Citizen Employees by Monthly Wage Rate
(TZS) Group and Sex, Tanzania Mainland, 2016
Monthly Wage Rate (TZS) Group Adult (36+ years) Youth (15-35 years)
Male Female Both Sexes Male Female Both Sexes
Up to 100,000 6.1 5.7 5.9 6.6 10.9 8.4
100,001 -150,000 16.0 14.9 15.6 13.5 13.2 13.3
150,001 - 300,000 20.8 16.4 19.2 20.1 15.9 18.4
300,001 - 500,000 15.8 15.8 15.8 23.4 23.5 23.4
500,001 - 900,000 19.7 23.2 21.0 26.3 26.3 26.3
900,001 - 1,200,000 9.7 12.7 10.8 5.5 5.9 5.6
1,200,001 - 1,500,000 5.6 6.2 5.8 2.2 2.4 2.3
Above 1,500,000 6.2 5.1 5.8 2.4 1.9 2.2
Total Percent 100.0 100.0 100.0 100.0 100.0 100.0
Total Employees 962,447 544,770 1,507,218 518,411 363,265 881,676

37
Table 3.4 indicates that majority of adult citizen employees (21.0 percent) and youth (26.3
percent) earn monthly wages between TZS 500,001 to TZS 900,000 followed by those earning
monthly wages between TZS 300,001 and 500,000 with 15.8 percent for adult and 23.4 percent
for youth. Results further indicate that the lowest proportion of adult citizen earn between TZS
1,200,001 and 1,500,000 and those earning above TZS 1,500,000 with 5.8 percent each while
the lowest proportion of youth citizen earn above TZS 1,500,000 (2.2 percent).
3.5 Adult and Youth Citizen Employees by Sector and Monthly Wage Rate
This section discusses distribution of adult and youth employment by sector and wage rates.
Youth are regarded as an important resource for manpower in the production of goods and
services. Information on the distribution of employed youth by wage rates is useful for designing
policies to promote youth employment.
Table 3. 5: Percentage Distribution of Regular Citizen Employees by Sector and Monthly
Wage Rate (TZS) Group, Tanzania Mainland, 2016
Monthly Wage Rate
Adult (36+ years) Youth (15-35 years)
Private Public Both Sectors Private Public Both Sectors
Up to 100,000 8.5 0.4 5.9 14.4 0.2 8.4
100,001 -150,000 22.4 0.7 15.6 22.8 0.5 13.3
150,001 - 300,000 26.5 3.2 19.2 29.6 3.2 18.4
300,001 - 500,000 16.3 14.8 15.8 16.3 33.0 23.4
500,001 - 900,000 12.5 39.6 21.0 10.2 48.2 26.3
900,001 - 1,200,000 5.4 22.7 10.8 2.7 9.6 5.6
1,200,001 - 1,500,000 3.4 11.1 5.8 1.5 3.3 2.3
Above 1,500,000 5.0 7.6 5.8 2.4 1.9 2.2
Total Percent 100.0 100.0 100.0 100.0 100.0 100.0
Total Regular Citizen 1,035,993 471,225 1,507,218 508,071 373,605 881,676
Table 3.5 show that, the largest proportion of adult regular citizen employees in public sector
earned monthly wages between TZS 500,001 and 900,000 (39.6 percent) followed by those
earning monthly wages between TZS 900,001 and 1,200,000 (22.7 percent). On the other hand,
in private sector, the largest share of regular employees earns monthly wages between TZS

38
150,001 and 300,000 (26.5 percent) followed by those earning monthly wages between TZS
100,001 and 150,000 (22.4 percent).
Moreover, it is indicated that, the highest proportion of youth employees in public sector earned
monthly wages between TZS 500,001 and 900,000 (48.2 percent) followed by those earning
between TZS 300,001 and 500,000 (33.0 percent). In addition, higher proportion of youth
employees in private sector earned monthly wages between TZS 150,001 and 300,000 (29.6
percent) followed by those earning between TZS 100,001 and150,000 (22.8 percent).
Furthermore, the share of youth employees with lower wages, up TZS 100,000 in private sector
is almost two times (14.4 percent) the share of adult employees in private sector (8.5 percent).

39
Chapter Four
Cash Earnings Profile
4. Introduction
Cash earnings are defined as remuneration in cash paid to employees and are a major part of
their total earnings at work. Generally, cash earnings include payments for time not worked, such
as annual vacation and other payments of accumulated leave. It also includes other guaranteed
and regular paid allowances, payments for overtime work and house-rent paid directly to
employees. Cash earnings are important from the workers’ perspective in measuring the level
and standard of living of the employees. This chapter presents cash earnings profile of
employees in the formal sector by different characteristics such as sex, industry and sector of
employment.
4.1 Monthly Average Cash Earnings by Major Sector and Sex
The section hereunder highlights findings on differentials in distribution of cash earnings
between public and private sectors. The information derived from this section can be used by the
policy makers and relevant authorities in periodical reviews of wage structures in the private and
public sectors in order to improve distribution of the economic benefits in the economy.
Table 4. 1: Monthly Average Cash Earnings (TZS) by Sector and Sex, Tanzania Mainland,
2015 and 2016
Sector
2015 2016
Male Female Overall
Average Male Female
Overall
Average
Private
Sector 373,704 366,590 353,589 391,886 368,090 362,400
Public Sector 1,097,990 957,816 1,063,064 1,279,127 1,083,130 1,243,945
Overall
Average 427,524 414,601 403,729 482,032 447,674 448,462

40
Key Message
The findings indicated that,
monthly average cash earnings
of employees in public sector
were about three times higher
than that of the private sector.
Table 4.1 indicates that monthly average cash earnings for
employees in formal sector increased slightly from TZS
403,729 in 2015 to TZS 448,462 in 2016. The results further
show that, monthly average cash earnings for employees in
the public sector also increased from TZS 1,063,064 in 2015
to TZS 1,243,945 in 2016. In the private sector, monthly
average cash earnings increased slightly from TZS 353,589 recorded in 2015 to TZS 362,400 in
2016. This indicates that monthly average cash earnings for employees in the public sector were
about three times those in the private sector for both years 2015 and 2016. Thus, there is a need
to enhance competitiveness and productivity in the private sector to facilitate better payment to
employees.
Furthermore, the results show that the monthly average cash earning of male employees (TZS
482,032) were slight higher than those of females (TZS 447,674) in the year 2016. However,
there was more noticeable pay gap of TZS about 195,000 between males (TZS 1,279,127) and
females (TZS 1,083,130) in the public sector in comparison with the private sector with male-
female pay gap of TZS 23,000.
4.2 Monthly Average Cash Earnings by Sub Sector of Employment and Sex
This section analyses the distribution of monthly cash earnings by sector in the country. The
information provided is vital for formulation of policies for special groups and determining
levels of payments in different economic sectors. It can also be used as a basis for setting the
minimum wage as well as evaluating performance of the sectors.
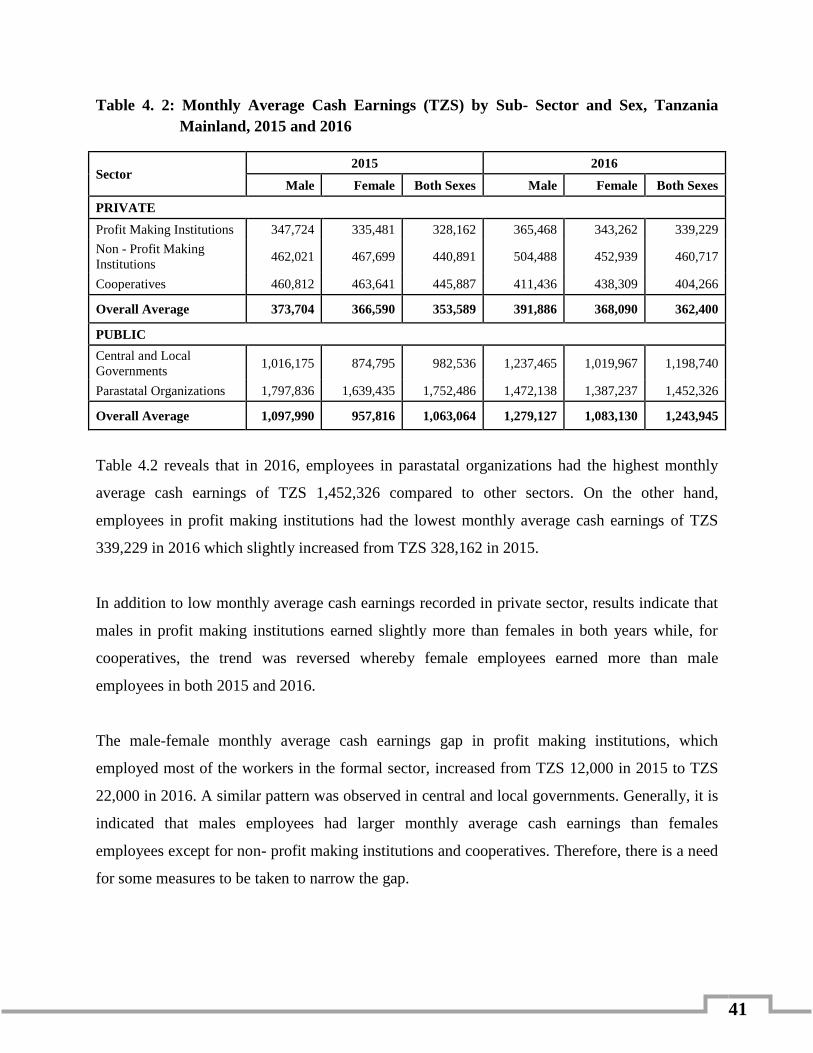
41
Table 4. 2: Monthly Average Cash Earnings (TZS) by Sub- Sector and Sex, Tanzania
Mainland, 2015 and 2016
Sector 2015 2016
Male Female Both Sexes Male Female Both Sexes
PRIVATE
Profit Making Institutions 347,724 335,481 328,162 365,468 343,262 339,229
Non - Profit Making
Institutions 462,021 467,699 440,891 504,488 452,939 460,717
Cooperatives 460,812 463,641 445,887 411,436 438,309 404,266
Overall Average 373,704 366,590 353,589 391,886 368,090 362,400
PUBLIC
Central and Local
Governments 1,016,175 874,795 982,536 1,237,465 1,019,967 1,198,740
Parastatal Organizations 1,797,836 1,639,435 1,752,486 1,472,138 1,387,237 1,452,326
Overall Average 1,097,990 957,816 1,063,064 1,279,127 1,083,130 1,243,945
Table 4.2 reveals that in 2016, employees in parastatal organizations had the highest monthly
average cash earnings of TZS 1,452,326 compared to other sectors. On the other hand,
employees in profit making institutions had the lowest monthly average cash earnings of TZS
339,229 in 2016 which slightly increased from TZS 328,162 in 2015.
In addition to low monthly average cash earnings recorded in private sector, results indicate that
males in profit making institutions earned slightly more than females in both years while, for
cooperatives, the trend was reversed whereby female employees earned more than male
employees in both 2015 and 2016.
The male-female monthly average cash earnings gap in profit making institutions, which
employed most of the workers in the formal sector, increased from TZS 12,000 in 2015 to TZS
22,000 in 2016. A similar pattern was observed in central and local governments. Generally, it is
indicated that males employees had larger monthly average cash earnings than females
employees except for non- profit making institutions and cooperatives. Therefore, there is a need
for some measures to be taken to narrow the gap.

42
4.3 Monthly Average Cash Earnings by Sub- Sector and Category of Employment
The information in this section provides insights on monthly average cash earnings differentials
by categories of employment, namely: - regular and casual employment. Results in this section
provide the basis for policies formulation to enhance working conditions for employees.
Table 4. 3: Monthly Average Cash Earnings (TZS) by Sub -Sector and Category of
Employment, Tanzania Mainland, 2015 and 2016
Sub-Sector
2015 2016
Regular
Employees
Casual
Employees
Regular
Employees
Casual
Employees
Private Profit- Making Institutions 349,744 121,005 349,923 115,004
Private Non-Profit Making Institutions 460,592 129,756 471,415 130,946
Cooperatives 458,762 116,311 415,696 106,611
Central and Local Governments 1,006,559 202,103 1,208,114 207,737
Parastatal Organizations 1,793,738 291,516 1,454,587 126,171
Overall Average 425,020 127,245 458,924 121,466
Table 4.3 indicates that overall monthly average cash earnings for regular employees increased
to TZS 458,924 in 2016 from TZS 425,020 in 2015. It is also found that, monthly average cash
earnings for casual employees decreased to TZS 121,466 in 2016 from TZS 127,245 in 2015.
The results also show that Parastatal organizations had the highest monthly average cash
earnings for regular employees of TZS 1,454,587 in 2016 followed by central and local
governments with TZS 1,208,114. In the same period, regular employees in the private profit -
making institutions had the lowest monthly average cash earnings of TZS 349,923.
The results further reveal that casual employees in central and local governments had the highest
monthly average cash earnings of TZS 207,737 in 2016, followed by parastatal organizations
with TZS 126,171. Cooperatives had the lowest monthly average cash earnings of TZS 106,611.

43
4.4 Monthly Average Cash Earnings of Employees by Industry and Sex
The analysis of cash earnings by industry and sex provides useful information for determining
income variation among different industrial groups and gender pay gap. The information
obtained in this section is important in formulation and implementation of labour and
employment related policies.
Table 4. 4: Monthly Average Cash Earnings (TZS) of Employees by Industry and Sex,
Tanzania Mainland, 2015 and 2016
Industry
2015 2016
Male Female Both
Sexes Male Female
Both
Sexes
Agriculture, forestry and fishing 332,915 282,606 314,072 316,853 271,224 307,430
Mining and quarrying 845,740 439,489 794,965 834,781 721,933 814,529
Manufacturing 312,093 338,747 298,348 288,130 274,990 271,976
Electricity, gas, steam and air
conditioning supply 1,024,402 1,052,193 1,020,571 1,020,286 924,062 933,227
Water supply; sewerage, waste
management and remediation activities 608,309 508,167 591,656 732,685 636,245 705,942
Construction 534,709 427,601 503,670 486,537 392,148 457,030
Wholesale and retail trade; repair of
motor vehicles and motorcycles 352,264 362,293 335,863 383,349 405,160 357,106
Transportation and storage 615,225 552,582 583,565 581,988 539,120 556,056
Accommodation and food service
activities 184,245 153,090 159,753 226,762 188,366 200,881
Information and communication 627,912 638,852 624,886 679,742 636,335 638,838
Financial and insurance activities 1,312,353 1,163,546 1,198,224 1,461,766 1,302,270 1,388,070
Real estate activities 574,356 560,762 556,828 709,639 690,441 670,310
Professional, scientific and technical
activities 825,556 1,177,409 960,465 922,938 1,075,003 987,634
Administrative and support service
activities 400,633 510,143 424,420 313,374 354,819 305,480
Public administration and defence;
compulsory social security 1,035,275 845,048 997,058 1,352,788 1,060,653 1,292,652
Education 575,816 564,778 566,674 735,167 620,585 679,201
Human health and social work activities 502,966 416,310 441,489 580,385 501,155 523,236
Arts, entertainment and recreation 568,566 599,555 547,445 710,249 582,574 623,050
Other service activities 415,590 469,209 401,362 387,800 380,250 369,635
Overall Average 427,524 414,601 403,729 482,032 447,674 448,462

44
Key Message
Employees in the financial and insurance
activities industry had the largest monthly
average cash earnings of TZS 1,388,070,
whereas employees in accommodation
and food service activities had the
smallest monthly average cash earnings
of TZS 200,881.
Results in Table 4.4 reveal that in 2016 financial and
insurance activities had the highest monthly average
cash earnings of TZS 1,388,070 followed by public
administration and defence; compulsory social
security with TZS 1,292,652 and electricity, gas,
steam and air conditioning supply with TZS
933,227. On the other hand, accommodation and
food service activities had the lowest monthly average cash earnings of TZS 200,881.
The results further show that, there is a wider cash earning gap between male and female
employees in Public administration and defence; compulsory social security industry where
males earned TZS 1,352,788 and females earned TZS 1,060,653. This is followed by financial
and insurance activities in which males earned TZS 1,461,766 compared to females with TZS
1,302,270 while females in professional, scientific and technical activities earned TZS 1,075,003
compared to males with TZS 922,938.
4.5 Annual Cash Earnings of Employees by Sector
Annual cash earnings of employees by sector are used to measure total labour cost burden
incurred by employers and income variations in different sectors of the economy. Generally, the
labour cost burden is influenced by the total number of employees in the sector with respective to
their monthly cash earnings.

45
Figure 4. 1: Percentage Distribution of Total Annual Cash Earnings by Sector, Tanzania
Mainland, 2015 and 2016
Figure 4.1 reveals that overall private sector had the largest proportion of total annual cash
earnings in the formal sector compared to public sector in both 2015 and 2016.
The results further indicate that, private sector had the highest proportion of the annual cash
earnings and its contribution has slightly decreased from 58.7 percent in 2015 to 54.9 percent in
2016. On the other hand, annual cash earnings in the public sector have increased slightly from
41.3 percent in 2015 to 45.1 percent in 2016. This indicates that, private sector is still the main
contributor to the total annual cash earnings as expected since it is the main driver of the
economy.
However, it was noted in Table 2.1 that employment in the private sector is almost twice as that
of public sector. Despite the larger proportions of total annual cash earnings in private sector, the
labour cost burden per unit incurred by private sector is very small compared to public sector.
58.754.9
41.345.1
2015 2016
Pe
rce
nta
ge
Private Public

46
4.6 Annual Cash Earnings of Employees by Industry
Cash earnings of employees are useful in determining the income generating capacity of
different industries. This provides indications on industrial productivity and employees’ welfare.
Table 4. 5: Annual Cash Earnings of Employees by Industry (TZS Million), Tanzania
Mainland, 2015 and 2016
Industry 2015 2016
Agriculture, forestry and fishing 458,064 598,918
Mining and quarrying 342,830 357,067
Manufacturing 2,768,935 2,625,000
Electricity, gas, steam and air conditioning supply 311,754 457,906
Water supply; sewerage, waste management and remediation activities 68,925 114,091
Construction 483,000 437,720
Wholesale and retail trade; repair of motor vehicles and mot 1,175,471 1,260,291
Transportation and storage 735,675 895,495
Accommodation and food service activities 606,303 747,197
Information and communication 494,643 1,088,841
Financial and insurance activities 1,296,674 2,333,928
Real estate activities 47,899 52,234
Professional, scientific and technical activities 392,319 433,513
Administrative and support service activities 320,074 337,488
Public administration and defence; compulsory social security 2,543,031 3,917,505
Education 4,476,688 4,822,625
Human health and social work activities 1,675,383 2,332,219
Arts, entertainment and recreation activities 64,874 72,492
Other service activities 777,179 725,896
Total 19,039,721 23,610,426
The findings in Table 4.5 shows that, there was a 24.0 percent increase of annual cash earnings
to TZS 23,610,426 million in 2016 from TZS 19,039,721 million in 2015. The results further
show that, across all industries, the highest annual cash earnings were in education industry with
TZS 4,822,625 million, followed by public administration and defense; compulsory social
security with TZS 3,917,505 million and manufacturing with TZS 2,625,000 million. Despite
real estate industry having the lowest annual cash earnings, it has increased considerably by 9.1
percent from TZS 47,899 million in 2015 to TZS 52,234 million in 2016.
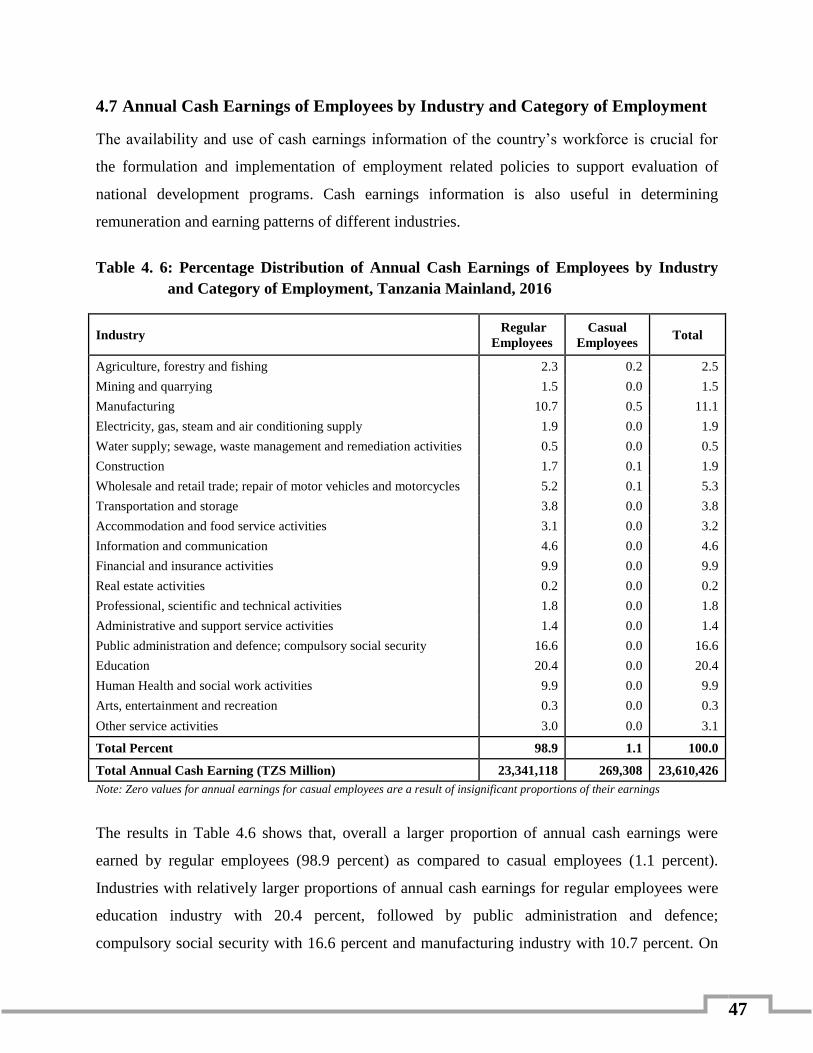
47
4.7 Annual Cash Earnings of Employees by Industry and Category of Employment
The availability and use of cash earnings information of the country’s workforce is crucial for
the formulation and implementation of employment related policies to support evaluation of
national development programs. Cash earnings information is also useful in determining
remuneration and earning patterns of different industries.
Table 4. 6: Percentage Distribution of Annual Cash Earnings of Employees by Industry
and Category of Employment, Tanzania Mainland, 2016
Industry Regular
Employees
Casual
Employees Total
Agriculture, forestry and fishing 2.3 0.2 2.5
Mining and quarrying 1.5 0.0 1.5
Manufacturing 10.7 0.5 11.1
Electricity, gas, steam and air conditioning supply 1.9 0.0 1.9
Water supply; sewage, waste management and remediation activities 0.5 0.0 0.5
Construction 1.7 0.1 1.9
Wholesale and retail trade; repair of motor vehicles and motorcycles 5.2 0.1 5.3
Transportation and storage 3.8 0.0 3.8
Accommodation and food service activities 3.1 0.0 3.2
Information and communication 4.6 0.0 4.6
Financial and insurance activities 9.9 0.0 9.9
Real estate activities 0.2 0.0 0.2
Professional, scientific and technical activities 1.8 0.0 1.8
Administrative and support service activities 1.4 0.0 1.4
Public administration and defence; compulsory social security 16.6 0.0 16.6
Education 20.4 0.0 20.4
Human Health and social work activities 9.9 0.0 9.9
Arts, entertainment and recreation 0.3 0.0 0.3
Other service activities 3.0 0.0 3.1
Total Percent 98.9 1.1 100.0
Total Annual Cash Earning (TZS Million) 23,341,118 269,308 23,610,426
Note: Zero values for annual earnings for casual employees are a result of insignificant proportions of their earnings
The results in Table 4.6 shows that, overall a larger proportion of annual cash earnings were
earned by regular employees (98.9 percent) as compared to casual employees (1.1 percent).
Industries with relatively larger proportions of annual cash earnings for regular employees were
education industry with 20.4 percent, followed by public administration and defence;
compulsory social security with 16.6 percent and manufacturing industry with 10.7 percent. On

48
the other hand, real estate activities and arts, entertainment and recreation activities had
relatively smaller proportions of annual cash earnings with 0.2 percent and 0.3 respectively for
regular employees. Reasonable proportions of annual cash earnings for casual employees were in
manufacturing industry (0.5 percent), agriculture, forestry and fishing (0.2 percent) and
construction (0.1 percent).
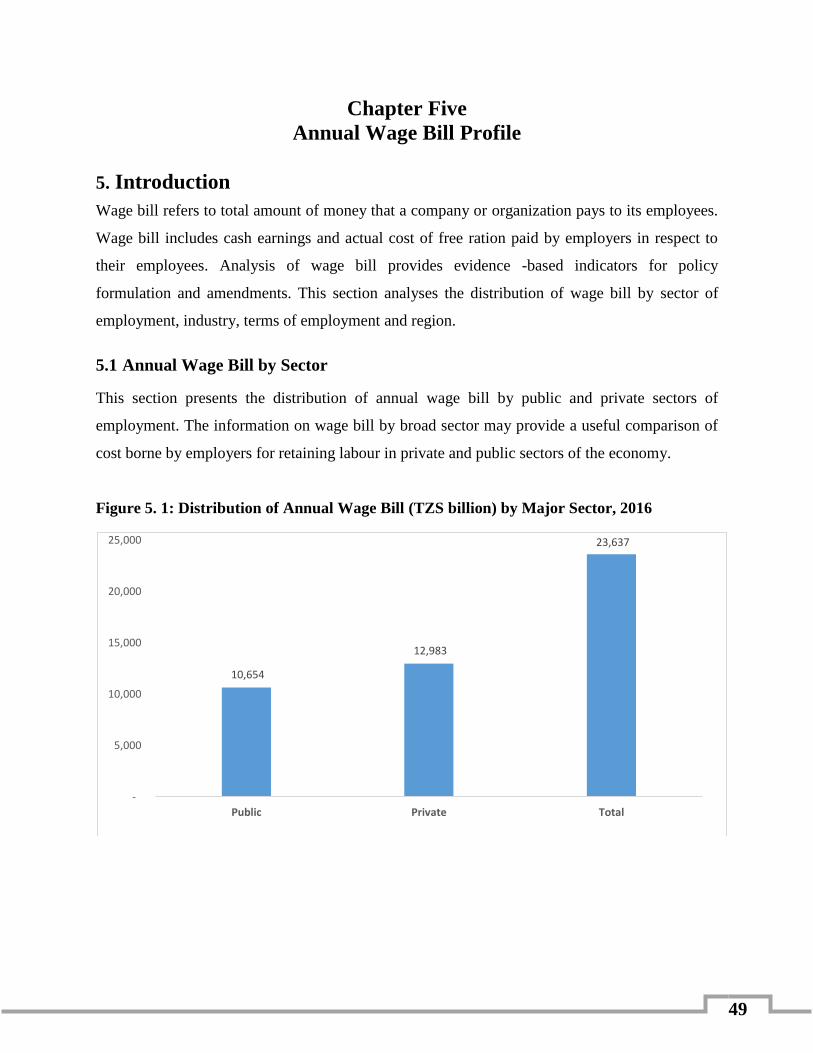
49
Chapter Five
Annual Wage Bill Profile
5. Introduction
Wage bill refers to total amount of money that a company or organization pays to its employees.
Wage bill includes cash earnings and actual cost of free ration paid by employers in respect to
their employees. Analysis of wage bill provides evidence -based indicators for policy
formulation and amendments. This section analyses the distribution of wage bill by sector of
employment, industry, terms of employment and region.
5.1 Annual Wage Bill by Sector
This section presents the distribution of annual wage bill by public and private sectors of
employment. The information on wage bill by broad sector may provide a useful comparison of
cost borne by employers for retaining labour in private and public sectors of the economy.
Figure 5. 1: Distribution of Annual Wage Bill (TZS billion) by Major Sector, 2016
10,654
12,983
23,637
-
5,000
10,000
15,000
20,000
25,000
Public Private Total

50
Key Message
Employers in private sector had higher
annual wage bill than in the public sector.
Key Message
The largest annual wage bill were
incurred by employers in private profit
making institutions (TZS 9,536 billion)
and smallest by parastatal non-profit
making institution (TZS 236 billion).
Figure 5.1 shows that overall; employers in public
and private sectors had an annual wage bill of TZS
23,637 billion in 2016. The findings also reveal that,
employers in private sector had higher annual wage
bill (TZS. 12,983 billion) than in the public sector (TZS. 10,654 billion). This is attributed by
larger number of employees in private sector than in public sector.
5.2 Annual Wage Bill by Sector
Analysis of distribution of wage bill by sector of the economy shows comparative costs of
employers across the detailed sectors in the economy. The information help in formulation of
sector- specific programs of wage structure in relation to productivity and other important labour
related variables.
Figure 5. 2: Distribution of Annual Wage Bill (TZS billion) by Sector, 2016
Figure 5.2 shows that overall, the largest wage bill
was incurred by employers in private profit- making
institutions (TZS 9,536 billion) followed by
employers in private non-profit making institutions
(TZS 5,295 billion. Employers in parastatal
9,536
5,295
3,212
2,412
1,422
862
662
236
- 2,000 4,000 6,000 8,000 10,000 12,000
Private Profit Making Institution
Private Non-Profit Making Institution
Cooperative
Central Government
Local Government ( Urban )
Local Government ( District )
Parastatal Profit Making Institution
Parastatal Non-profit Making Institution

51
institutions, including both non-profit making and profit- making institutions had relatively small
annual wage bill (TZS 236 and 662 billion respectively). The lower annual wage bill in the
parastatal institutions is mainly attributed to smaller levels of employment compared to other
sectors.
5.3 Annual Wage Bill by Industry
Wage bill by industry may provide vital clues for visualizing labour costs accrued to employers
in various industries. This information is important recipe for labour Vis –a- Vis employment
programs with focused outcomes on specific industries such as research which triangulate
productivity, employment and wage bill across industrial divisions.
Table 5. 1: Percentage Distribution of Annual Wage Bill by Industry and Sector, 2016
Industry Private Public Total Annual
Wage Bill
Agriculture, forestry and fishing 4.1 0.6 2.5
Mining and quarrying 2.8 - 1.5
Manufacturing 20.2 0.1 11.1
Electricity, gas, steam and air conditioning supply 0.8 3.3 1.9
Water supply; sewage, waste management and
remediation activities
0.1 0.9 0.5
Construction 3.2 0.2 1.9
Wholesale and retail trade; repair of motor vehicles and
motorcycles
9.8 0.0 5.4
Transportation and storage 4.2 3.3 3.8
Accommodation and food service activities 5.7 0.1 3.2
Information and communication 7.9 0.6 4.6
Financial and insurance activities 9.5 10.4 9.9
Real estate activities 0.2 0.3 0.2
Professional, scientific and technical activities 2.5 1.1 1.8
Administrative and support service activities 2.5 0.1 1.4
Public administration and defence; compulsory social
security
0.9 35.7 16.6
Education 12.2 30.4 20.4
Human Health and social work activities 7.9 12.3 9.9
Arts, entertainment and recreation 0.4 0.2 0.3
Other service activities 5.2 0.4 3.0
Total Percentage 100.0 100.0 100.0
Total 12,983 10,654 23,637
Table 5.1 indicates that, overall the largest proportion of wage bill was in education industry
(20.4 percent) followed by Public administration and defence; compulsory social security (16.6

52
Key Message
The largest proportion of wage bill was in
education industry with 20.4% and Dar es
Salaam region had the largest annual
wage bill of TZS 9,219 billion.
percent). Industries of mining and quarrying; administrative and support service activities; and
arts, entertainment and recreation accounted for comparatively lower annual wage bills than
other industries.
The largest proportions of annual wage bill in the private sector was observed in manufacturing
industry (20.2 percent) followed by education industry (12.2 percent). On the other hand, for the
public sector the largest proportions of annual wage bill were in public administration and
defence; compulsory social security (35.7 percent) and education industry (30.4 percent).
Figure 5. 3: Annual Wage Bill by Cash Earnings and Free Ration for Selected Industries,
2016
Figure 5.3 indicates that, among the selected
industries, free rations contributed slightly higher
proportions to total wage bills in industries of
wholesale and retail trade; repair of motor vehicles
and motorcycles and accommodation and food
service activities with 0.6 percent and 0.5 percent, respectively. Contribution of free ration to
100.0 99.8
99.7
99.4 99.6
99.5
99.9
99.6
0.0 0.2
0.3
0.6 0.4
0.5
0.1
0.4
99%
99%
99%
100%
100%
100%
Annual Cash Earnings Annual free ration
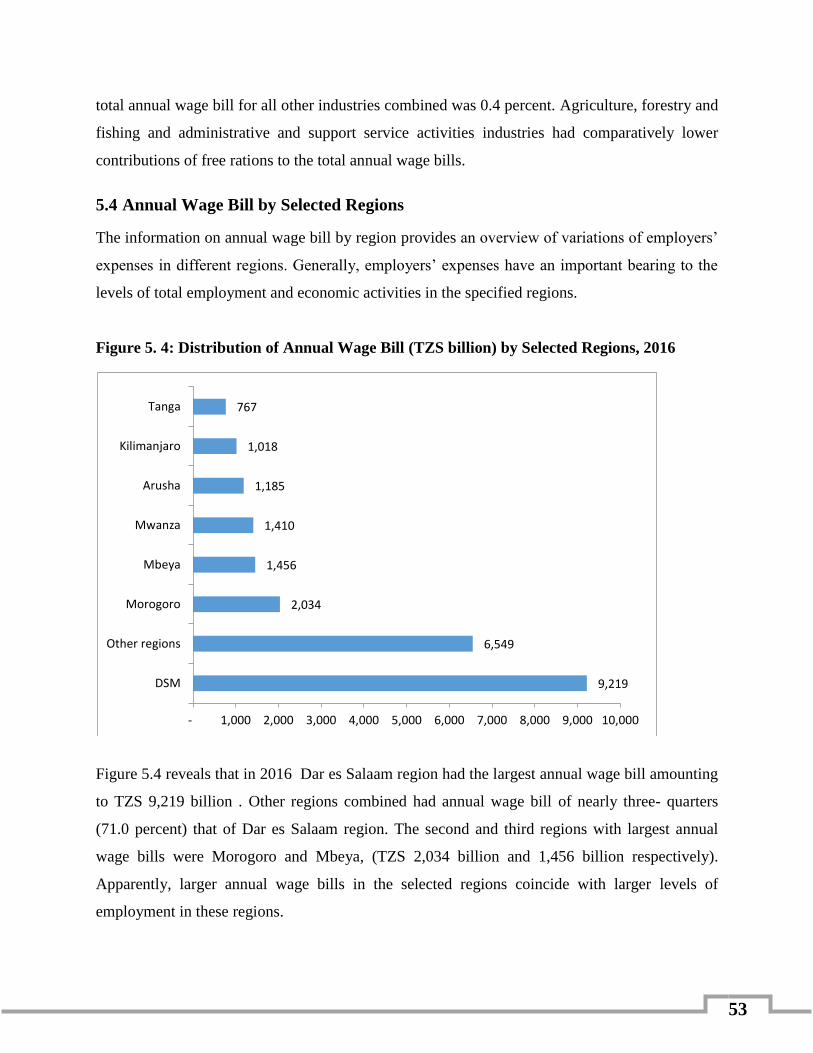
53
total annual wage bill for all other industries combined was 0.4 percent. Agriculture, forestry and
fishing and administrative and support service activities industries had comparatively lower
contributions of free rations to the total annual wage bills.
5.4 Annual Wage Bill by Selected Regions
The information on annual wage bill by region provides an overview of variations of employers’
expenses in different regions. Generally, employers’ expenses have an important bearing to the
levels of total employment and economic activities in the specified regions.
Figure 5. 4: Distribution of Annual Wage Bill (TZS billion) by Selected Regions, 2016
Figure 5.4 reveals that in 2016 Dar es Salaam region had the largest annual wage bill amounting
to TZS 9,219 billion . Other regions combined had annual wage bill of nearly three- quarters
(71.0 percent) that of Dar es Salaam region. The second and third regions with largest annual
wage bills were Morogoro and Mbeya, (TZS 2,034 billion and 1,456 billion respectively).
Apparently, larger annual wage bills in the selected regions coincide with larger levels of
employment in these regions.
9,219
6,549
2,034
1,456
1,410
1,185
1,018
767
- 1,000 2,000 3,000 4,000 5,000 6,000 7,000 8,000 9,000 10,000
DSM
Other regions
Morogoro
Mbeya
Mwanza
Arusha
Kilimanjaro
Tanga

54
Key Message
The findings reveal that, 34,594
employees were recruited in 2016 with
more females (19,433) than males
(15,161).
Chapter Six
Recruitment of New Workers
6. Introduction
This chapter presents the findings on the newly recruited employees for the year 2015/16.
Employers were asked to state the number of newly recruited employees into their
establishments during the 12 months period from 1st July, 2015 to 30th June, 2016. The collected
data were later categorized by sex; occupational title; the highest level of education attained;
main subjects of training attained; country of origin; employment status; employees by region
and the amount of money earned at the commencement of the service contract.
6.1 Recruited Employees by Nature of Position, Sex and Sector
The recruitment process provides the organization with a pool of potentially qualified job
candidates from which judicious selection can be made to fill vacancies. The analysis in this
section focuses on the nature of existing positions filled by the newly recruited employees.
Table 6. 1: Number of Newly Recruited Employees by Nature of Position, Sex and Sector,
Tanzania Mainland, 2015/16
Sector A: Fell vacant B: New Position Total (A+B)
Male Female Total Male Female Total Male Female Total
Private 17,090 13,298 30,388 8,940 11,923 20,863 26,030 25,221 51,251
Public 2,724 1,933 4,657 6,221 7,510 13,731 8,945 9,443 18,388
Total 19,814 15,231 35,045 15,161 19,433 34,594 34,975 34,664 69,639
Results in Table 6.1 reveal that the total number of
newly recruited workers in 2016 is 69,639 of which
34,594 employees filled newly created posts and
35,045 employees filled existing vacancies. Among
the newly recruited employees, there are more
females (19,433) than males (15,161). On the other hand, private sector had more new recruits
with 51,251compared to public sector with 18,388.

55
Key Message
The largest number of newly recruited
employees (15,515) was in the category of
service workers and shop sales workers.
6.2 Number of Newly Recruited Employees by Occupation and Sex, 2015/16
This section presents findings on the number of newly recruited employees for the period of
2015/16 financial year. It also highlights information on occupation and distribution of male and
female employees.
Table 6. 2: Number of Newly Recruited Employees by Occupation and Sex, Tanzania
Mainland, 2015/16
Occupation Male Female Total
Legislators, administrators and managers 1,786 1,051 2,837
Professionals 7,055 3,942 10,997
Technicians and associate professionals 8,154 6,722 14,876
Clerks 1,618 3,320 4,938
Service workers and shop sales workers 8,483 7,032 15,515
Agricultural and fishery workers 555 326 881
Craft and related workers 1,721 248 1,969
Plant and machine operators and assemblers 2,988 891 3,879
Elementary occupations 2,615 11,132 13,747
Total 34,975 34,664 69,639
Table 6.2 shows that Service workers and shop sales
workers had the largest number of newly recruited
employees with 15,515 employees in 2015/16
followed by Technicians and associate professionals
with 14,876 employees and elementary occupations with 13,747 employees. The result further
reveals that agricultural and fishery workers had the smallest number of newly recruited
employees of 881.
The results also show that there were more newly recruited male employees than females in all
occupations except for clerks and elementary occupations. This pattern calls for more effort to
promote females to access better employment opportunities.
6.3 Number of Newly Recruited Employees by Occupation and Level of Education
This section shades light on the education level requirements in different occupations. It further
provides information on over or under utilization of employee skills with respect to their level of
education and experience.
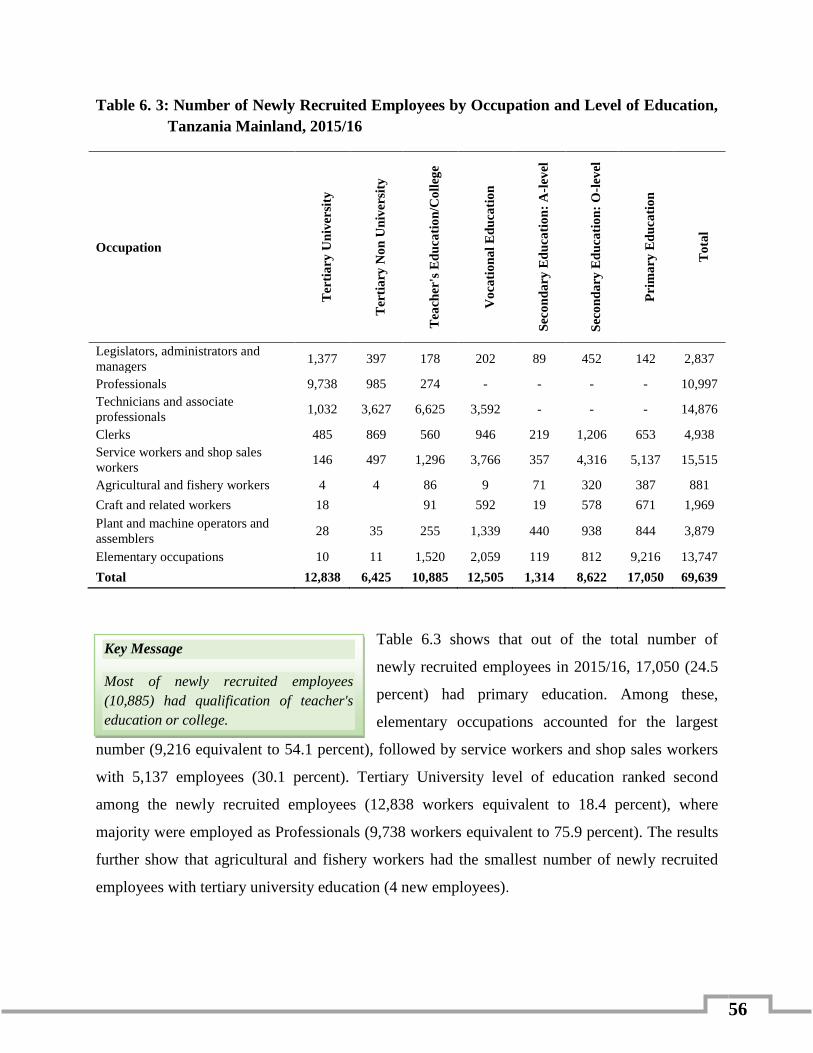
56
Key Message
Most of newly recruited employees
(10,885) had qualification of teacher's
education or college.
Table 6. 3: Number of Newly Recruited Employees by Occupation and Level of Education,
Tanzania Mainland, 2015/16
Occupation
Ter
tia
ry U
niv
ersi
ty
Ter
tia
ry N
on
Un
iver
sity
Tea
cher
's E
du
cati
on
/Co
lleg
e
Vo
cati
on
al
Ed
uca
tio
n
Sec
on
da
ry E
du
cati
on
: A
-lev
el
Sec
on
da
ry E
du
cati
on
: O
-lev
el
Pri
ma
ry E
du
cati
on
To
tal
Legislators, administrators and
managers 1,377 397 178 202 89 452 142 2,837
Professionals 9,738 985 274 - - - - 10,997
Technicians and associate
professionals 1,032 3,627 6,625 3,592 - - - 14,876
Clerks 485 869 560 946 219 1,206 653 4,938
Service workers and shop sales
workers 146 497 1,296 3,766 357 4,316 5,137 15,515
Agricultural and fishery workers 4 4 86 9 71 320 387 881
Craft and related workers 18 91 592 19 578 671 1,969
Plant and machine operators and
assemblers 28 35 255 1,339 440 938 844 3,879
Elementary occupations 10 11 1,520 2,059 119 812 9,216 13,747
Total 12,838 6,425 10,885 12,505 1,314 8,622 17,050 69,639
Table 6.3 shows that out of the total number of
newly recruited employees in 2015/16, 17,050 (24.5
percent) had primary education. Among these,
elementary occupations accounted for the largest
number (9,216 equivalent to 54.1 percent), followed by service workers and shop sales workers
with 5,137 employees (30.1 percent). Tertiary University level of education ranked second
among the newly recruited employees (12,838 workers equivalent to 18.4 percent), where
majority were employed as Professionals (9,738 workers equivalent to 75.9 percent). The results
further show that agricultural and fishery workers had the smallest number of newly recruited
employees with tertiary university education (4 new employees).

57
Key Message
There were more newly recruited males
(8,279) with tertiary education compared
to females (4,559) in the formal sector.
Furthermore, teacher's education or College was also found to be important in the formal sector
with a large number of newly recruited workers amounting to 10,885 (15.6 percent). Among
these, 6,625 (60.9 percent) were technicians and associate professionals and 1, 520(14.0 percent)
were in elementary occupations. Results also indicate that job openings were very small for those
with secondary A level education amounting to 1,314 equivalent to 1.9 percent of new recruits.
Although, clerical work requires middle to low level of education but it is revealed that there is
underutilization of skills for the newly recruited workers in terms of occupations held. This is
evidenced by 485 employees with tertiary education in Table 6.3 performing clerical tasks. This
requires policy intervention to ensure full utilization available skills in the economy.
6.4 Newly Recruited Employees by Level of Education and Sex
This section presents information on the number of newly recruited employees by level of
education and sex. It provides useful information for determining education background of
newly recruited male and female employees.
Table 6. 4: Number of Newly Recruited Employees by Sex and Level of Education,
Tanzania Mainland, 2015/16
Level of Education Male Female
Total Number Percent Number Percent
Tertiary University 8,279 23.7 4,559 13.2 12,838
Tertiary Non University 3,209 9.2 3,216 9.3 6,425
Teacher's Education/College 6,443 18.4 4,442 12.8 10,885
Vocational Education 5,802 16.6 6,703 19.3 12,505
Secondary Education: A-level 756 2.2 558 1.6 1,314
Secondary Education: O-level 4,815 13.8 3,807 11.0 8,622
Primary Education 5,671 16.2 11,379 32.8 17,050
Total 34,975 100 34,664 100 69,639
Findings in Table 6.4 shows that males with tertiary
education had larger number of newly recruited
employees amounting to 8,279 (23.7 percent)
compared to females workers with 4,559 which is
equivalent to 13.2 percent.
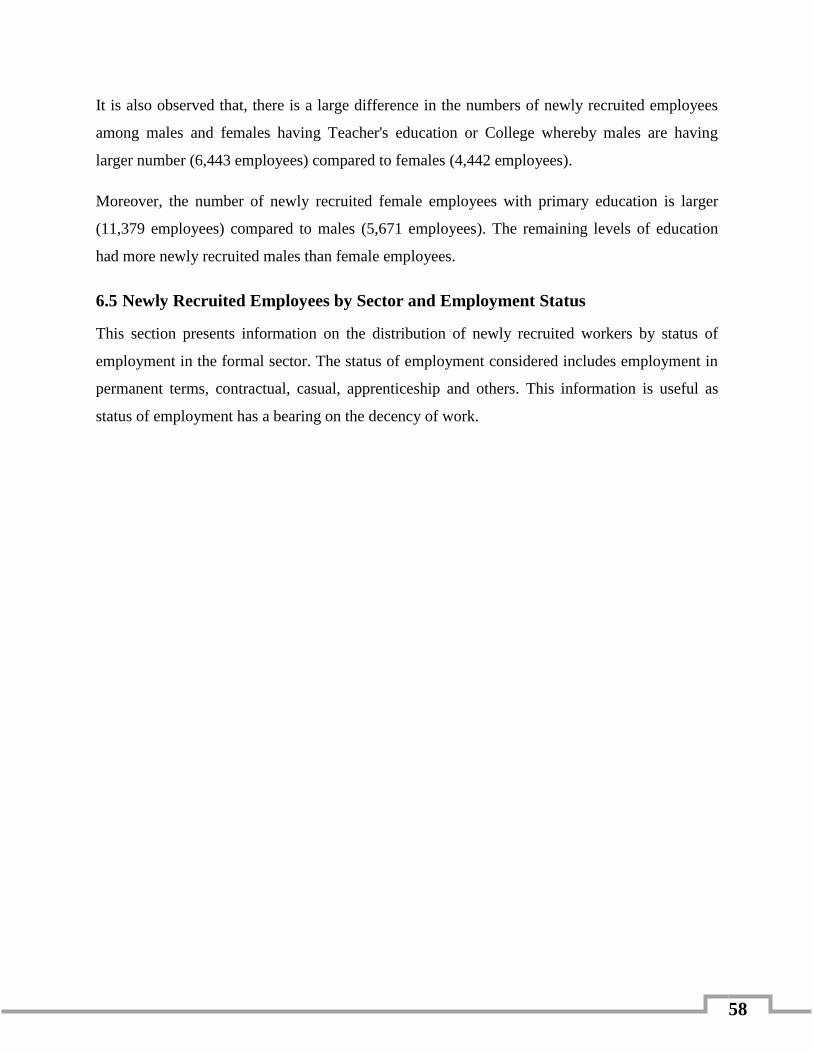
58
It is also observed that, there is a large difference in the numbers of newly recruited employees
among males and females having Teacher's education or College whereby males are having
larger number (6,443 employees) compared to females (4,442 employees).
Moreover, the number of newly recruited female employees with primary education is larger
(11,379 employees) compared to males (5,671 employees). The remaining levels of education
had more newly recruited males than female employees.
6.5 Newly Recruited Employees by Sector and Employment Status
This section presents information on the distribution of newly recruited workers by status of
employment in the formal sector. The status of employment considered includes employment in
permanent terms, contractual, casual, apprenticeship and others. This information is useful as
status of employment has a bearing on the decency of work.
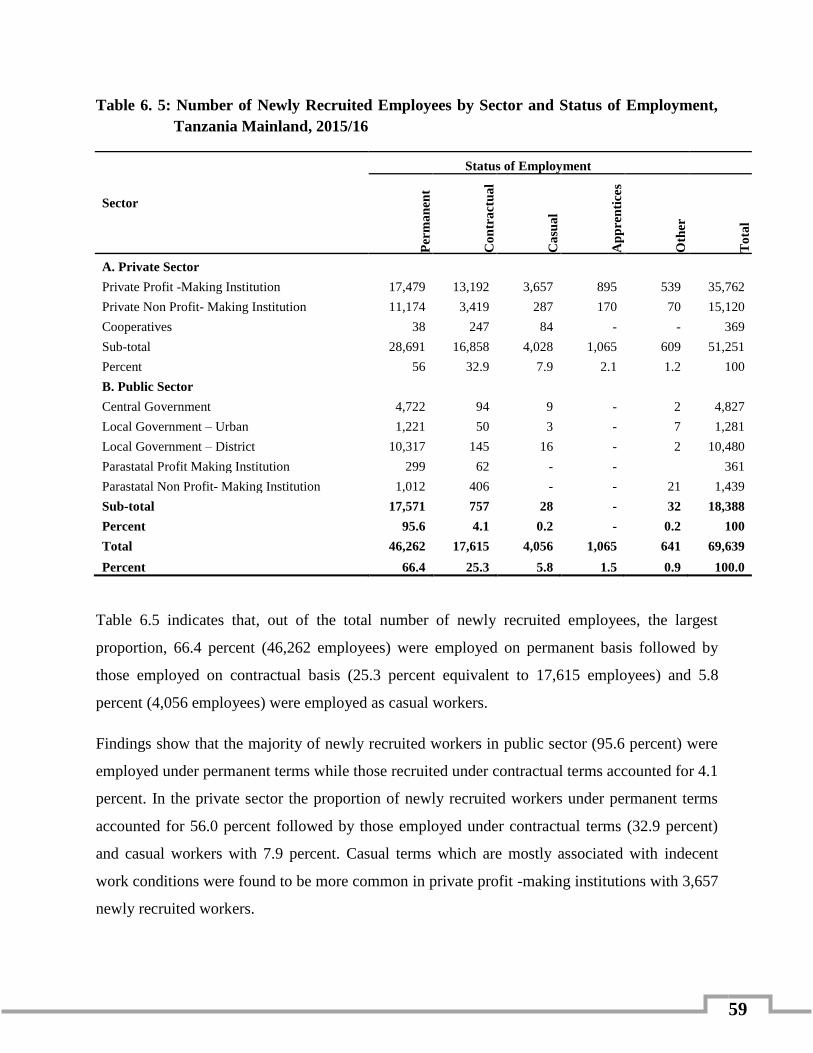
59
Table 6. 5: Number of Newly Recruited Employees by Sector and Status of Employment,
Tanzania Mainland, 2015/16
Sector
Status of Employment
Per
ma
nen
t
Co
ntr
act
ua
l
Ca
sua
l
Ap
pre
nti
ces
Oth
er
To
tal
A. Private Sector Private Profit -Making Institution 17,479 13,192 3,657 895 539 35,762
Private Non Profit- Making Institution 11,174 3,419 287 170 70 15,120
Cooperatives 38 247 84 - - 369
Sub-total 28,691 16,858 4,028 1,065 609 51,251
Percent 56 32.9 7.9 2.1 1.2 100
B. Public Sector Central Government 4,722 94 9 - 2 4,827
Local Government – Urban 1,221 50 3 - 7 1,281
Local Government – District 10,317 145 16 - 2 10,480
Parastatal Profit Making Institution 299 62 - - 361
Parastatal Non Profit- Making Institution 1,012 406 - - 21 1,439
Sub-total 17,571 757 28 - 32 18,388
Percent 95.6 4.1 0.2 - 0.2 100
Total 46,262 17,615 4,056 1,065 641 69,639
Percent 66.4 25.3 5.8 1.5 0.9 100.0
Table 6.5 indicates that, out of the total number of newly recruited employees, the largest
proportion, 66.4 percent (46,262 employees) were employed on permanent basis followed by
those employed on contractual basis (25.3 percent equivalent to 17,615 employees) and 5.8
percent (4,056 employees) were employed as casual workers.
Findings show that the majority of newly recruited workers in public sector (95.6 percent) were
employed under permanent terms while those recruited under contractual terms accounted for 4.1
percent. In the private sector the proportion of newly recruited workers under permanent terms
accounted for 56.0 percent followed by those employed under contractual terms (32.9 percent)
and casual workers with 7.9 percent. Casual terms which are mostly associated with indecent
work conditions were found to be more common in private profit -making institutions with 3,657
newly recruited workers.

60
6.6 Newly Recruited Employees by Occupation and Citizenship
This section analyses the distribution of the newly recruited workers by occupation and
citizenship. The information is useful in identifying occupations that are mostly held by
foreigners and therefore, inform policy or programs to enhance availability of skills to citizen
candidates.
Table 6. 6: Number of Newly Recruited Employees by Occupation and Citizenship,
Tanzania Mainland, 2015/16
Occupation Citizen Non-Citizen Total
Legislators, administrators and managers 2,646 191 2,837
Professionals 10,721 276 10,997
Technicians and associate professionals 14,835 41 14,876
Clerks 4,932 6 4,938
Service workers and shop sales workers 15,496 19 15,515
Agricultural and fishery workers 877 4 881
Craft and related workers 1,969 - 1,969
Plant and machine operators and assemblers 3,870 9 3,879
Elementary occupations 13,743 4 13,747
Total 69,089 550 69,639
Table 6.6 shows that out of the total number of newly recruited workers, the majority were
citizen (69,089 employees equivalent to 99.2 percent) while non-citizens accounted for only 0.8
percent (550 workers). The majority of non-citizen employees were employed as professionals
(276 workers) followed by legislators, administrators and managers with 191 employees and
technicians and associate professionals with 41 newly recruited non-citizen employees.
6.7 Newly Recruited Employees by Region and Sex
This section presents the distribution of newly recruited employees by region and sex. It provides
information on job opportunities across regions and how male and female employees access
those opportunities.
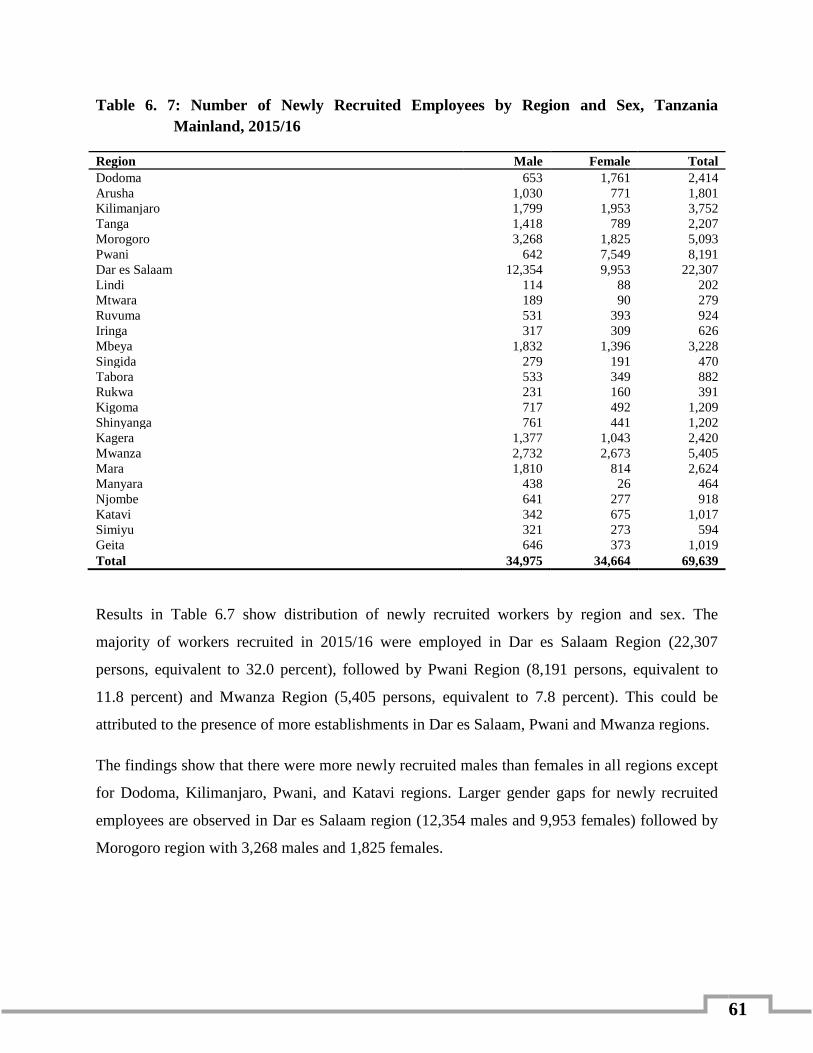
61
Table 6. 7: Number of Newly Recruited Employees by Region and Sex, Tanzania
Mainland, 2015/16
Region Male Female Total
Dodoma 653 1,761 2,414
Arusha 1,030 771 1,801
Kilimanjaro 1,799 1,953 3,752
Tanga 1,418 789 2,207
Morogoro 3,268 1,825 5,093
Pwani 642 7,549 8,191
Dar es Salaam 12,354 9,953 22,307
Lindi 114 88 202
Mtwara 189 90 279
Ruvuma 531 393 924
Iringa 317 309 626
Mbeya 1,832 1,396 3,228
Singida 279 191 470
Tabora 533 349 882
Rukwa 231 160 391
Kigoma 717 492 1,209
Shinyanga 761 441 1,202
Kagera 1,377 1,043 2,420
Mwanza 2,732 2,673 5,405
Mara 1,810 814 2,624
Manyara 438 26 464
Njombe 641 277 918
Katavi 342 675 1,017
Simiyu 321 273 594
Geita 646 373 1,019
Total 34,975 34,664 69,639
Results in Table 6.7 show distribution of newly recruited workers by region and sex. The
majority of workers recruited in 2015/16 were employed in Dar es Salaam Region (22,307
persons, equivalent to 32.0 percent), followed by Pwani Region (8,191 persons, equivalent to
11.8 percent) and Mwanza Region (5,405 persons, equivalent to 7.8 percent). This could be
attributed to the presence of more establishments in Dar es Salaam, Pwani and Mwanza regions.
The findings show that there were more newly recruited males than females in all regions except
for Dodoma, Kilimanjaro, Pwani, and Katavi regions. Larger gender gaps for newly recruited
employees are observed in Dar es Salaam region (12,354 males and 9,953 females) followed by
Morogoro region with 3,268 males and 1,825 females.
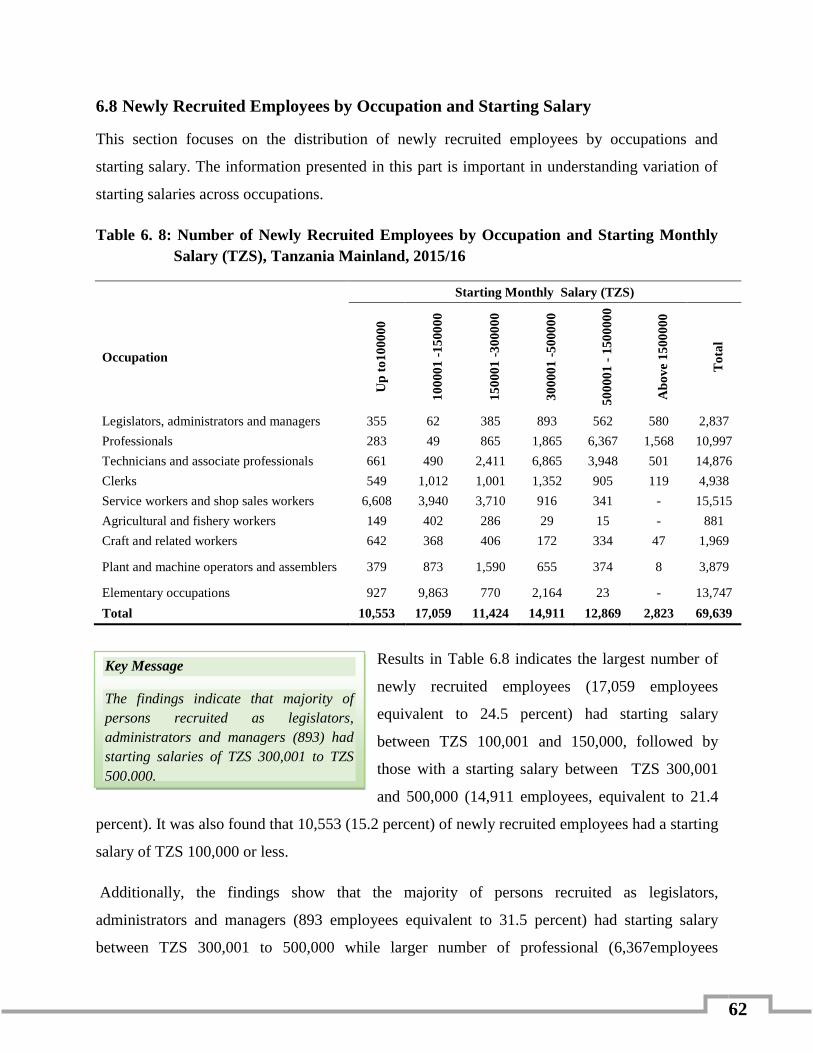
62
Key Message
The findings indicate that majority of
persons recruited as legislators,
administrators and managers (893) had
starting salaries of TZS 300,001 to TZS
500,000.
6.8 Newly Recruited Employees by Occupation and Starting Salary
This section focuses on the distribution of newly recruited employees by occupations and
starting salary. The information presented in this part is important in understanding variation of
starting salaries across occupations.
Table 6. 8: Number of Newly Recruited Employees by Occupation and Starting Monthly
Salary (TZS), Tanzania Mainland, 2015/16
Starting Monthly Salary (TZS)
Occupation
Up
to
10
00
00
10
000
1 -
15
00
00
15
000
1 -
30
00
00
30
000
1 -
50
00
00
50
000
1 -
150
000
0
Ab
ov
e 1
500
000
To
tal
Legislators, administrators and managers 355 62 385 893 562 580 2,837
Professionals 283 49 865 1,865 6,367 1,568 10,997
Technicians and associate professionals 661 490 2,411 6,865 3,948 501 14,876
Clerks 549 1,012 1,001 1,352 905 119 4,938
Service workers and shop sales workers 6,608 3,940 3,710 916 341 - 15,515
Agricultural and fishery workers 149 402 286 29 15 - 881
Craft and related workers 642 368 406 172 334 47 1,969
Plant and machine operators and assemblers 379 873 1,590 655 374 8 3,879
Elementary occupations 927 9,863 770 2,164 23 - 13,747
Total 10,553 17,059 11,424 14,911 12,869 2,823 69,639
Results in Table 6.8 indicates the largest number of
newly recruited employees (17,059 employees
equivalent to 24.5 percent) had starting salary
between TZS 100,001 and 150,000, followed by
those with a starting salary between TZS 300,001
and 500,000 (14,911 employees, equivalent to 21.4
percent). It was also found that 10,553 (15.2 percent) of newly recruited employees had a starting
salary of TZS 100,000 or less.
Additionally, the findings show that the majority of persons recruited as legislators,
administrators and managers (893 employees equivalent to 31.5 percent) had starting salary
between TZS 300,001 to 500,000 while larger number of professional (6,367employees

63
equivalent to 57.9 percent) had starting salary between TZS 500,001 and 1,500,000. Majority of
technicians and associate professionals (6,865 employees equivalent to 46.1 percent) had starting
salary between TZS 300,001 and 500,000. However, service and shop sales workers had higher
proportion (42.6 percent) of newly recruited workers with starting salary of TZS 100,000 or less.
6.9 Newly Recruited Employees by Level of Education and Monthly Starting Salary
Education qualification attained has a central influence on remuneration of employees in an
organization. This section analyses the distribution of newly recruited employees by level of
education indicating how starting salary vary with levels of education attained.
Table 6. 9: Number of Newly Recruited Employees by Level of Education and Starting
Monthly Salary, Tanzania Mainland, 2015/16
Level of education
Starting Monthly Salary (TZS)
Up
to
10
00
00
10
000
1-
15
00
00
15
000
1-
30
00
00
30
000
1-
50
00
00
50
000
1-
15
00
000
Ab
ov
e 1
500
000
To
tal
Tertiary University 268 131 846 2,287 7,144 2,162 12,838
Tertiary Non University 323 276 1,082 2,324 2,316 104 6,425
Teacher's Education/College 746 1,875 1,504 5,151 1,434 175 10,885
Vocational Education 1,721 2,201 3,281 3,710 1,210 382 12,505
Secondary Education: A-level 274 309 416 111 204 - 1,314
Secondary Education: O-level 2,104 2,220 2,875 922 501 - 8,622
Primary Education 5,117 10,047 1,420 406 60 - 17,050
Total 10,553 17,059 11,424 14,911 12,869 2,823 69,639
Findings in Table 6.9 indicate that 90.3 percent of newly recruited employees with tertiary
university education had a starting salary of at least TZS 300,001. It is also indicated that 99.6
percent of newly recruited workers who had primary education had a starting salary of TZS
300,000 or less. This shows that the level of education has significant influence on remuneration
of employees.

64
Chapter Seven
Job Vacancies
7. Introduction
This chapter presents job vacancies that were in formal sector establishments in 2015/2016. A
job vacancy is defined as a paid post that is newly created, unoccupied, or about to become
vacant, for which the employer is taking active steps or is prepared to take further steps to find a
suitable candidate from outside the enterprise concerned. The analysis of job vacancies is
categorized by occupation, education level, main qualification/skill, working experience, reason
for the vacancies and sex preference.
7.1 Job Vacancies by Occupation and Working Experience
This section, analyses distribution of the existing job vacancies by occupation and the duration of
work experience required. The current labour market is becoming competitive hence securing a
job may require additional attributes, sometimes experience being one of them.
Figure 7. 1: Percentage Distribution of Job Vacancies by Occupation, 2015/16
63.6
21.6
4.6
3.2
2.3
1.5
1.2
1.2
0.8
0 10 20 30 40 50 60 70
Technicians and associate professionals
Professionals
Service workers and shop sales workers
Clerks
Legislators, administrators and managers
Elementary occupations
Plant and machine operators and…
Craft and related workers
Agricultural and fishery workers
Percent
Occ
up
atio
ns
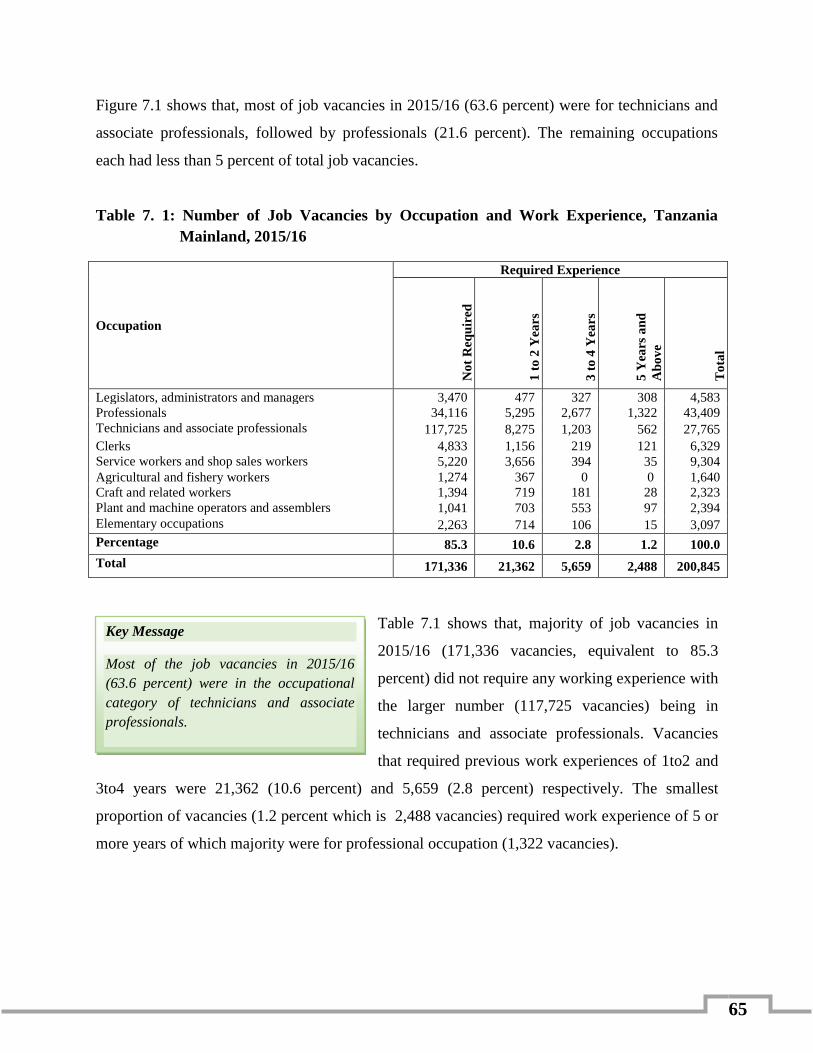
65
Key Message
Most of the job vacancies in 2015/16
(63.6 percent) were in the occupational
category of technicians and associate
professionals.
Figure 7.1 shows that, most of job vacancies in 2015/16 (63.6 percent) were for technicians and
associate professionals, followed by professionals (21.6 percent). The remaining occupations
each had less than 5 percent of total job vacancies.
Table 7. 1: Number of Job Vacancies by Occupation and Work Experience, Tanzania
Mainland, 2015/16
Occupation
Required Experience
No
t R
equ
ired
1 t
o 2
Yea
rs
3 t
o 4
Yea
rs
5 Y
ears
an
d
Ab
ov
e
To
tal
Legislators, administrators and managers 3,470 477 327 308 4,583
Professionals 34,116 5,295 2,677 1,322 43,409
Technicians and associate professionals 117,725 8,275 1,203 562 27,765
Clerks 4,833 1,156 219 121 6,329
Service workers and shop sales workers 5,220 3,656 394 35 9,304
Agricultural and fishery workers 1,274 367 0 0 1,640
Craft and related workers 1,394 719 181 28 2,323
Plant and machine operators and assemblers 1,041 703 553 97 2,394
Elementary occupations 2,263 714 106 15 3,097
Percentage 85.3 10.6 2.8 1.2 100.0
Total 171,336 21,362 5,659 2,488 200,845
Table 7.1 shows that, majority of job vacancies in
2015/16 (171,336 vacancies, equivalent to 85.3
percent) did not require any working experience with
the larger number (117,725 vacancies) being in
technicians and associate professionals. Vacancies
that required previous work experiences of 1to2 and
3to4 years were 21,362 (10.6 percent) and 5,659 (2.8 percent) respectively. The smallest
proportion of vacancies (1.2 percent which is 2,488 vacancies) required work experience of 5 or
more years of which majority were for professional occupation (1,322 vacancies).

66
7.2 Job Vacancies by Occupation and Sex Preference
This section presents findings on the distribution of job vacancies by occupations and sex
preference of the employer for the candidate to fill such a vacancy.
Table 7. 2: Number of Job Vacancies by Occupation and Sex Preference, Tanzania
Mainland, 2015/16
Occupation Sex Preference
Male Female Any Total
Legislators, administrators and managers 206 134 4,243 4,583
Professionals 1,225 698 41,486 43,409
Technicians and associate professionals 2,992 1,172 123,601 127,765
Clerks 100 1,160 5,069 6,329
Service workers and shop sales workers 1,533 1,034 6,738 9,304
Agricultural and fishery workers 319 68 1,253 1,640
Craft and related workers 1,243 18 1,062 2,323
Plant and machine operators and assemblers 907 39 1,449 2,394
Elementary occupations 389 206 2,502 3,097
Percentage 4.4 2.3 93.3 100.0
Total 8,914 4,528 187,403 200,845
Table 7.2 shows that, the largest proportion of the reported vacancies (93.3 percent) in 2015/16
did not indicate any sex preference. However, 4.4 percent of vacancies preferred male employees
compared to 2.3 percent which preferred female employees.
The results further indicate that, clerical occupation had larger number of vacancies that
preferred female candidates (1,160 vacancies) than male candidates (100 vacancies). The
remaining occupations prefer more male than female employees.
7.3 Job Vacancies by Industry and Reason for Vacancies
This section focuses on the distribution of the number of job vacancies created in various
economic activities and reasons for such vacancies.

67
Key Message
Public administration and defence;
compulsory social security industry had
the largest number of job vacancies
(80,867) in 2016.
Table 7. 3: Number of Job Vacancies by Industry and Reasons, 2015/16
Industry Reasons for Vacancies
Total Percentage Replacement New Position
Agriculture, forestry and fishing 253 3,463 3,716 1.9
Mining and quarrying 344 577 921 0.5
Manufacturing 572 1,803 2,374 1.2
Electricity, gas, steam and air conditioning supply 68 114 182 0.1
Water supply; sewage, waste management and
remediation activities 215 603 818 0.4
Construction 90 544 634 0.3
Wholesale and retail trade; repair of motor vehicles
and motorcycles 145 410 555 0.3
Transportation and storage 176 290 466 0.2
Accommodation and food service activities 775 1,211 1,986 1.0
Information and communication 531 809 1,339 0.7
Financial and insurance activities 298 295 593 0.3
Real estate activities 48 49 97 0.0
Professional, scientific and technical activities 1,224 4,255 5,479 2.7
Administrative and support service activities 172 311 483 0.2
Public administration and defence; compulsory social
security 16,533 64,333 80,867 40.3
Education 17,456 52,662 70,118 34.9
Human Health and social work activities 4,101 24,292 28,393 14.1
Arts, entertainment and recreation 95 114 209 0.1
Other service activities 982 632 1,614 0.8
Total 44,079 156,765 200,845 100.0
Table 7.3 shows that, public administration and
defence; compulsory social security industry had the
largest number of job vacancies (80,867 vacancies,
equivalent to 40.3 percent) followed by education
with 70,118 vacancies (34.9 percent) and human
health and social work activities with 28,393 vacancies (14.1 percent).
Furthermore, it has been observed that education industry had large number of new vacancies
due to replacement (17,456) followed by public administration and defence; compulsory social
security with 16,533 vacancies. On the other hand, public administration and defence;
compulsory social security had the largest number of vacancies resulting from new created
positions (64,333) followed by education industry with 52,662 vacancies.

68
7.4 Job Vacancies by Industry and Level of Education
Analysis in this section shows the distribution of job vacancies by industry and level of
education. This information helps to understand industrial categories with large proportions of
vacancies across different levels of education. Availability of trend analysis of information on
levels of education in relation to the job vacancies may help planners and decision makers to
have optimal planning on education by considering the most number of vacancies demanded in
the market.
Table 7. 4: Number of Job Vacancies by Industry and Required Level of Education,
2015/16
Industry
Highest Level of Education
Ter
tia
ry
Un
iver
sity
Ter
tia
ry N
on
-
Un
iver
sity
Tea
cher
's
Ed
uca
tio
n/C
oll
e
ge
Vo
cati
on
al
Ed
uca
tio
n
Sec
on
da
ry A
-
Lev
el
Sec
on
da
ry O
-
Lev
el
Pri
ma
ry
Ed
uca
tio
n
No
Ed
uca
tio
n
To
tal
Agriculture, forestry and fishing 570 367 1,933 82 126 146 493 0 3,716
Mining and quarrying 63 3 7 97 129 622 0 921
Manufacturing 375 127 39 1,182 44 327 280 0 2,374
Electricity, gas, steam and air
conditioning supply 50 49 4 54 25 0 0 0 182
Water supply; sewage, waste
management and remediation
activities
249 176 79 283 8 23 0 0 818
Construction 392 120 19 26 3 75 0 0 634
Wholesale and retail trade; repair of
motor vehicles and motorcycles 87 24 4 184 5 220 31 0 555
Transportation and storage 126 57 62 51 83 69 18 0 466
Accommodation and food service
activities 43 8 558 406 114 434 423 0 1,986
Information and communication 971 50 133 33 153 0 0 1,339
Financial and insurance activities 283 31 19 70 180 10 0 0 593
Real estate activities 41 0 0 8 12 0 36 0 97
Professional, scientific and technical
activities 1,308 390 952 214 45 936 1,635 0 5,479
Administrative and support service
activities 74 26 25 65 33 76 183 0 483
Public administration and defence;
compulsory social security 14,810 21,715 34,400 2,972 829 5,045 1,096 0 80,867
Education 15,160 4,580 38,897 2,648 123 8,410 300 0 70,118
Human Health and social work
activities 6,082 11,351 6,009 1,929 587 2,431 5 0 28,393
Arts, entertainment and recreation 110 3 13 47 0 5 32 0 209
Other service activities 368 449 212 119 96 278 92 0 1,614
Percentage 20.5 19.7 41.5 5.2 1.2 9.3 2.6 0.0 100.0
Total 41,162 39,526 83,363 10,469 2,312 18,767 5,246 0 200,845

69
Table 7.4 shows that, the highest number of job vacancies (41.5 percent) require teacher's
education/college followed by vacancies that required tertiary university (20.5 percent) of which
most of such vacancies were in education industry. It is also observed that there were no
vacancies that required candidates with no education.
7.5 Job Vacancies by Qualification/ Skill Required and Sex Preference
This section focuses on the distribution of the number of new job vacancies created by
qualification or skilled acquired and sex preference.
Table 7. 5: Number of Job Vacancies by Qualification/ Skill Required and Sex Preference,
Tanzania Mainland, 2015/16
Qualification/Skill Required Sex Preference
Percentage Male Female Any Total
General training programs including literacy 148 80 393 621 0.3
Education trainings 2,228 275 92,630 95,133 47.4
Fine and applied arts programs 1 0 189 190 0.1
Programs in language 0 0 11 11 0.0
Other humanity courses 18 4 68 90 0.0
Social and behavior 42 143 6,073 6,258 3.1
Commercial, clerical, business and public
administration programs 447 1,405 13,751 15,604 7.8
Programs in law 44 29 1,122 1,195 0.6
Natural science programs 10 0 411 421 0.2
Mathematics and computer science programs 75 39 1,445 1,559 0.8
Medicine and health related programs 731 693 43,220 44,644 22.2
Construction trades programs 399 15 635 1,049 0.5
Other craft, trade and industrial programs 356 24 1,819 2,198 1.1
Engineering and allied programs 411 38 2,746 3,195 1.6
Architectural and town planning programs 54 45 1,138 1,238 0.6
Agriculture, forestry and fishery programs 665 316 12,797 13,778 6.9
Home economics and domestic science
programs 13 14 325 352 0.2
Transport and communication programs 830 67 1,030 1,928 1.0
Service trades programs 1,746 763 4,324 6,832 3.4
Programs in mass communication and
documentation 12 57 751 821 0.4
Other programs 683 520 2,526 3,729 1.9
Total 8,914 4,528 187,403 200,845 100.0

70
Key Message
Most of job vacancies in 2015/16
(47.4%) required candidates with
skills in education training.
Table 7.5 shows that, most of job vacancies created in
2015/16 (47.4 percent) required candidates with skills in
education training followed by vacancies which required
skills in medicine and health related programs (22.2
percent).
Furthermore, vacancies which required candidates with skills in commercial, clerical, business
and public administration programs preferred females to males (1,405 females and 447 males).
This was followed by social and behaviour (143 females and 42 males) and; programs in mass
communication and documentation with 57 females and 12 males. The remaining skills indicated
more preference for males except for home economics and domestic science programs with 14
females and 13 males.

71
Annexes for Chapter Two
Table A1: Number of Total Regular Employees by Age Group, Sector and Sex Tanzania
Mainland, 2016
Age Group Sex 2016
Private Public Total
Adult (36+ Years)
Male 709,727 268,939 978,666
Female 344,265 204,236 548,501
Sub Total 1,053,993 473,174 1,527,167
Youth (15 -35 Years)
Male 310,310 212,981 523,291
Female 203,719 161,855 365,574
Sub Total 514,029 374,836 888,865
Table A2: Number of Total Casual Employees by Age Group, Sector and Sex Tanzania
Mainland, 2016
Age Group Sex 2016
Private Public Total
Adult (36+ Years)
Male 78,557 1,552 80,109
Female 50,452 318 50,770
Sub Total 129,009 1,870 130,879
Youth (15-35 Years)
Male 34,240 514 34,754
Female 17,424 222 17,646
Sub Total 51,664 736 52,400

72
Table A3: Number of Total Employees by Sub Sector and Sex, Tanzania Mainland, 2015
and 2016
Sector 2015 2016
Male Female Total Male Female Total
A: Private
Private Profit -Making
Institutions 848,558 400,284 1,248,841 933,082 455,634 1,388,715
Private Non Profit -Making
Institutions 158,426 130,418 288,844 175,033 149,674 324,707
Cooperatives 21,147 9,333 30,480 24,721 10,552 35,273
Sub Total: 1,028,130 540,035 1,568,165 1,132,835 615,860 1,748,695
B: Public
Central and Local
Governments 421,020 304,242 725,262 437,485 335,582 773,066
Parastatal Organisations 27,655 13,886 41,541 46,501 31,049 77,550
Sub Total : 448,675 318,129 766,803 483,985 366,630 850,616
Total Number of Employees 1,476,805 858,164 2,334,969 1,616,820 982,491 2,599,311
Table A4: Number of Total Adult (36+ years) Employees by Sub Sector and Sex, Tanzania
Mainland, 2016
Sector Male Female Total
A: Private
Private Profit- Making Institutions 639,084 284,103 923,187
Private Non Profit -Making Institutions 129,689 103,687 233,377
Cooperatives 19,511 6,927 26,438
Sub Total: 788,285 394,717 1,183,002
B: Public
Central and Local Governments 240,758 184,674 425,432
Parastatal Organisations 29,732 19,880 49,612
Sub Total: 270,490 204,554 475,044
Total Number of Employees 1,058,775 599,271 1,658,046

73
Table A5: Number of Total Youth (15 - 35 years) Employees by Sub Sector and Sex,
Tanzania Mainland, 2016
Sector Male Female Total
A: Private
Private Profit- Making Institutions 293,997 171,531 465,528
Private Non- Profit Making Institutions 45,344 45,987 91,331
Cooperatives 5,209 3,625 8,835
Sub Total: 344,550 221,143 565,694
B: Public
Central and Local Governments 196,726 150,907 347,634
Parastatal Organisations 16,769 11,169 27,938
Sub Total: 213,495 162,076 375,571
Total Number of Employees 558,045 383,220 941,265
Table A6: Number of Total Regular Employees by Citizenship and Sub-Sector Tanzania
Mainland, 2015 and 2016
Sector
Citizen Non-Citizen Total
2,015 2,016 2,015 2,016 2,015 2,016
A: Private
Profit Making
Institutions. 987,162 1,201,254 14,201 18,485 1,001,363 1,219,739
Non Profit
Making
Institutions.
270,859 312,172 3,767 3,392 274,626 315,563
Cooperatives 27,826 31,954 838 765 28,664 32,719
Sub Total 1,285,847 1,545,380 18,806 22,642 1,304,653 1,568,022
B: Public
Central and
Local
Governments
714,404 767,882 123 2,689 714,527 770,571
Parastatall
Organisations 40,674 77,267 158 172 40,832 77,439
Sub Total 755,078 845,149 281 2,861 755,360 848,010
Total Employees 2,040,925 2,390,529 19,088 25,504 2,060,013 2,416,032

74
Table A7: Number of Total Employees by Industry and Category of Employment Tanzania
Mainland, 2015 and 2016
Industry Regular Employees Casual Employees Total Employees
2015 2016 2015 2016 2015 2016
Agriculture, forestry and fishing 75,323 107,299 61,416 46,605 136,739 153,904
Mining and quarrying 29,093 34,702 1,165 1,197 30,259 35,900
Manufacturing 334,964 405,765 87,144 65,859 422,108 471,624
Electricity, gas, steam and air
conditioning supply 21,659 30,817 545 606 22,204 31,423
Water supply; sewage, waste
management and remediation
activities
7,695 8,896 1,837 2,797 9,532 11,694
Construction 42,023 56,138 16,335 20,167 58,358 76,306
Wholesale and retail trade;
repair of motor vehicles and
motorcycles
158,666 176,247 27,913 20,606 186,579 196,853
Transportation and storage 58,085 72,453 5,511 3,080 63,596 75,533
Accommodation and food
service activities 158,482 173,179 10,204 6,003 168,687 179,183
Information and communication 28,237 62,459 32,761 1,154 60,998 63,613
Financial and insurance
activities 43,503 54,077 794 336 44,297 54,414
Real estate activities 4,751 4,660 96 229 4,847 4,889
Professional, scientific and
technical activities 24,200 27,952 2,453 752 26,654 28,704
Administrative and support
service activities 62,676 77,541 3,202 1,235 65,878 78,776
Public administration and
defence; compulsory social
security
290,923 353,343 4,234 507 295,157 353,849
Education 447,997 476,506 9,073 4,419 457,070 480,925
Human health and social work
activities 164,065 173,135 3,779 1,868 167,843 175,003
Arts, entertainment and
recreation 7,043 8,320 194 72 7,236 8,392
Other service activities 100,630 112,540 6,300 5,787 106,930 118,327
Total Employees 2,060,013 2,416,032 274,956 183,279 2,334,969 2,599,311

75
Table A8: Number of Total employment by Industry, Category of Employment and Sex,
2016
Industry Regular Employees Casual Employees
Total Male Female Total Male Female Total
Agriculture, forestry and fishing 70,345 36,954 107,299 30,459 16,146 46,605 153,904
Mining and quarrying 30,711 3,992 34,702 983 214 1,197 35,900
Manufacturing 284,860 120,905 405,765 39,075 26,784 65,859 471,624
Electricity, gas, steam and air
conditioning supply 21,411 9,406 30,817 529 77 606 31,423
Water supply; sewage, waste
management and remediation
activities
6,642 2,254 8,896 2,402 396 2,797 11,694
Construction 46,137 10,001 56,138 8,041 12,126 20,167 76,306
Wholesale and retail trade; repair of
motor vehicles and motorcycles 133,548 42,699 176,247 16,330 4,276 20,606 196,853
Transportation and storage 57,029 15,424 72,453 2,864 216 3,080 75,533
Accommodation and food service
activities 78,822 94,357 173,179 3,267 2,736 6,003 179,183
Information and communication 41,257 21,202 62,459 608 546 1,154 63,613
Financial and insurance activities 30,017 24,061 54,077 257 79 336 54,414
Real estate activities 3,081 1,579 4,660 96 133 229 4,889
Professional, scientific and technical
activities 18,022 9,930 27,952 507 245 752 28,704
Administrative and support service
activities 61,343 16,198 77,541 1,003 232 1,235 78,776
Public administration and defence;
compulsory social security 222,399 130,944 353,343 347 159 507 353,849
Education 258,243 218,263 476,506 2,600 1,819 4,419 480,925
Human health and social work
activities 65,324 107,810 173,135 967 901 1,868 175,003
Arts, entertainment and recreation 4,529 3,792 8,320 8 64 72 8,392
Other service activities 68,236 44,304 112,540 4,518 1,269 5,787 118,327
Total Employees 1,501,957 914,075 2,416,032 114,863 68,415 183,279 2,599,311
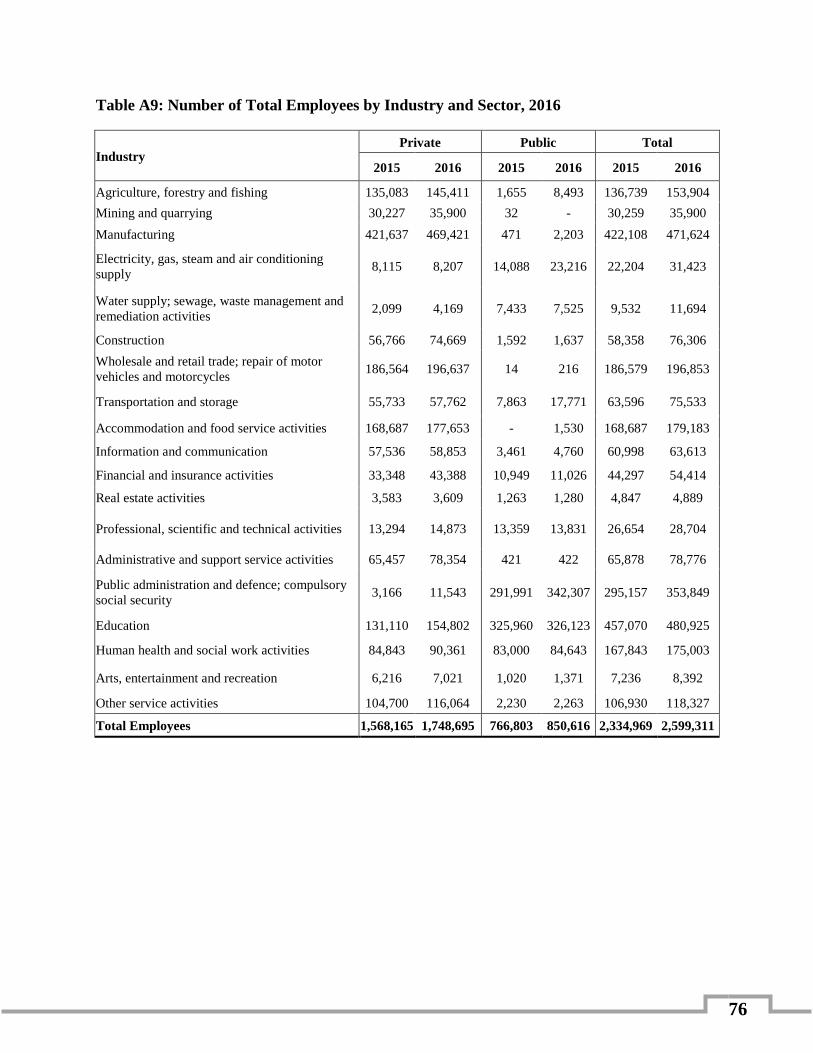
76
Table A9: Number of Total Employees by Industry and Sector, 2016
Industry Private Public Total
2015 2016 2015 2016 2015 2016
Agriculture, forestry and fishing 135,083 145,411 1,655 8,493 136,739 153,904
Mining and quarrying 30,227 35,900 32 - 30,259 35,900
Manufacturing 421,637 469,421 471 2,203 422,108 471,624
Electricity, gas, steam and air conditioning
supply 8,115 8,207 14,088 23,216 22,204 31,423
Water supply; sewage, waste management and
remediation activities 2,099 4,169 7,433 7,525 9,532 11,694
Construction 56,766 74,669 1,592 1,637 58,358 76,306
Wholesale and retail trade; repair of motor
vehicles and motorcycles 186,564 196,637 14 216 186,579 196,853
Transportation and storage 55,733 57,762 7,863 17,771 63,596 75,533
Accommodation and food service activities 168,687 177,653 - 1,530 168,687 179,183
Information and communication 57,536 58,853 3,461 4,760 60,998 63,613
Financial and insurance activities 33,348 43,388 10,949 11,026 44,297 54,414
Real estate activities 3,583 3,609 1,263 1,280 4,847 4,889
Professional, scientific and technical activities 13,294 14,873 13,359 13,831 26,654 28,704
Administrative and support service activities 65,457 78,354 421 422 65,878 78,776
Public administration and defence; compulsory
social security 3,166 11,543 291,991 342,307 295,157 353,849
Education 131,110 154,802 325,960 326,123 457,070 480,925
Human health and social work activities 84,843 90,361 83,000 84,643 167,843 175,003
Arts, entertainment and recreation 6,216 7,021 1,020 1,371 7,236 8,392
Other service activities 104,700 116,064 2,230 2,263 106,930 118,327
Total Employees 1,568,165 1,748,695 766,803 850,616 2,334,969 2,599,311

77
Table A10: Number of Total Employees by Industry Major Division and Sex, 2016
Industry Adults (36+ Years) Youth (15 - 35 Years)
Total Male Female Total Male Female Total
Agriculture, forestry and fishing 75,144 37,441 112,585 25,660 15,658 41,319 153,904
Mining and quarrying 17,921 2,385 20,306 13,773 1,820 15,593 35,900
Manufacturing 239,024 105,951 344,975 84,912 41,738 126,649 471,624
Electricity, gas, steam and air
conditioning supply 13,880 5,963 19,842 8,061 3,519 11,580 31,423
Water supply; sewage, waste
management and remediation activities 5,387 1,368 6,755 3,657 1,282 4,939 11,694
Construction 34,727 15,154 49,880 19,451 6,974 26,425 76,306
Wholesale and retail trade; repair of
motor vehicles and motorcycles 97,013 25,664 122,677 52,865 21,311 74,176 196,853
Transportation and storage 40,578 9,443 50,020 19,316 6,197 25,513 75,533
Accommodation and food service
activities 49,010 42,456 91,466 33,080 54,638 87,717 179,183
Information and communication 34,588 15,567 50,154 7,278 6,181 13,459 63,613
Financial and insurance activities 20,988 15,521 36,509 9,286 8,619 17,905 54,414
Real estate activities 1,804 1,223 3,027 1,373 488 1,862 4,889
Professional, scientific and technical
activities 13,557 5,922 19,479 4,972 4,253 9,225 28,704
Administrative and support service
activities 35,400 10,251 45,652 26,946 6,179 33,124 78,776
Public administration and defence;
compulsory social security 121,886 70,705 192,591 100,861 60,398 161,259 353,849
Education 149,784 127,124 276,908 111,059 92,958 204,017 480,925
Human health and social work activities 44,233 69,896 114,129 22,059 38,816 60,874 175,003
Arts, entertainment and recreation 2,843 2,174 5,017 1,694 1,681 3,375 8,392
Other service activities 61,009 35,064 96,073 11,745 10,509 22,253 118,327
Total Employees 1,058,775 599,271 1,658,046 558,045 383,220 941,265 2,599,311

78
Table A11: Number of Total Regular Employees by Industrial Major Division and
Citizenship, 2016
Industry Citizen Non - Citizen Total
Agriculture, forestry and fishing 106,688 611 107,299
Mining and quarrying 33,907 795 34,702
Manufacturing 397,882 7,883 405,765
Electricity, gas, steam and air conditioning supply 30,769 49 30,817
Water supply; sewage, waste management and
remediation activities 8,798 98 8,896
Construction 54,173 1,966 56,138
Wholesale and retail trade; repair of motor vehicles and
motorcycles 173,196 3,051 176,247
Transportation and storage 71,714 740 72,453
Accommodation and food service activities 171,591 1,589 173,179
Information and communication 61,503 956 62,459
Financial and insurance activities 53,808 269 54,077
Real estate activities 4,624 36 4,660
Professional, scientific and technical activities 27,861 91 27,952
Administrative and support service activities 76,993 548 77,541
Public administration and defence; compulsory social
security 352,417 926 353,343
Education 471,964 4,542 476,506
Human Health and social work activities 172,516 618 173,135
Arts, entertainment and recreation 8,193 127 8,320
Other service activities 111,932 608 112,540
Total Employees 2,390,529 25,504 2,416,032
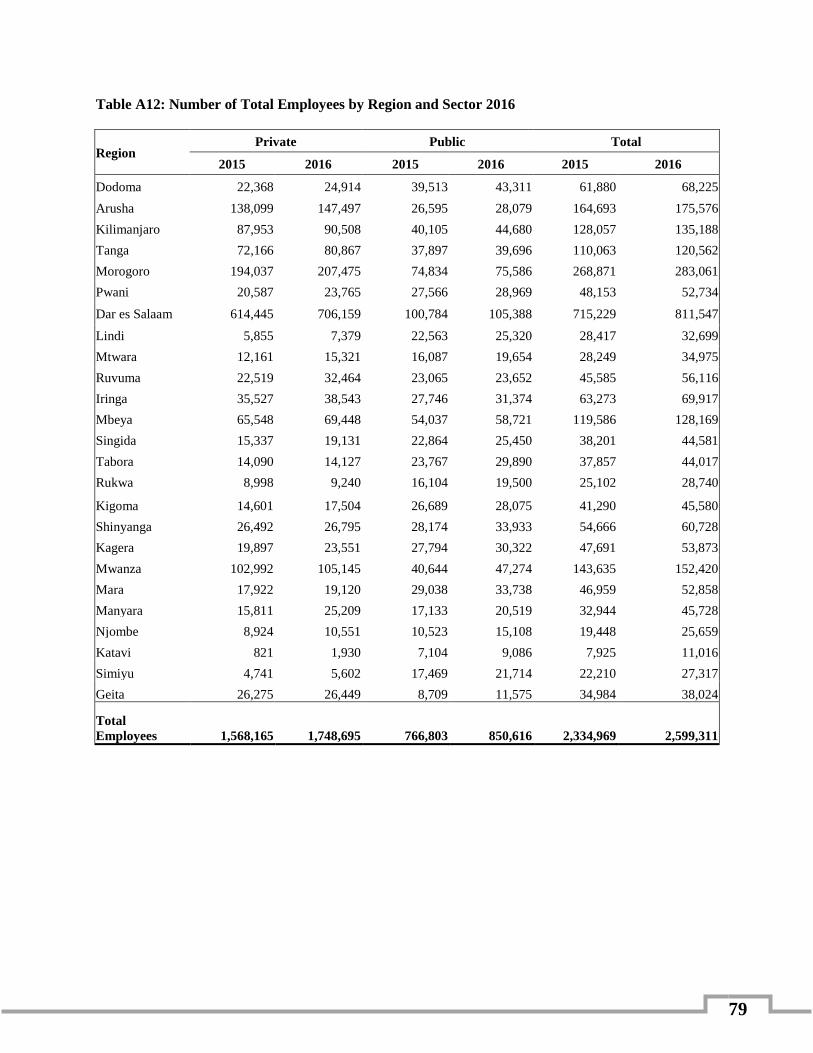
79
Table A12: Number of Total Employees by Region and Sector 2016
Region Private Public Total
2015 2016 2015 2016 2015 2016
Dodoma 22,368 24,914 39,513 43,311 61,880 68,225
Arusha 138,099 147,497 26,595 28,079 164,693 175,576
Kilimanjaro 87,953 90,508 40,105 44,680 128,057 135,188
Tanga 72,166 80,867 37,897 39,696 110,063 120,562
Morogoro 194,037 207,475 74,834 75,586 268,871 283,061
Pwani 20,587 23,765 27,566 28,969 48,153 52,734
Dar es Salaam 614,445 706,159 100,784 105,388 715,229 811,547
Lindi 5,855 7,379 22,563 25,320 28,417 32,699
Mtwara 12,161 15,321 16,087 19,654 28,249 34,975
Ruvuma 22,519 32,464 23,065 23,652 45,585 56,116
Iringa 35,527 38,543 27,746 31,374 63,273 69,917
Mbeya 65,548 69,448 54,037 58,721 119,586 128,169
Singida 15,337 19,131 22,864 25,450 38,201 44,581
Tabora 14,090 14,127 23,767 29,890 37,857 44,017
Rukwa 8,998 9,240 16,104 19,500 25,102 28,740
Kigoma 14,601 17,504 26,689 28,075 41,290 45,580
Shinyanga 26,492 26,795 28,174 33,933 54,666 60,728
Kagera 19,897 23,551 27,794 30,322 47,691 53,873
Mwanza 102,992 105,145 40,644 47,274 143,635 152,420
Mara 17,922 19,120 29,038 33,738 46,959 52,858
Manyara 15,811 25,209 17,133 20,519 32,944 45,728
Njombe 8,924 10,551 10,523 15,108 19,448 25,659
Katavi 821 1,930 7,104 9,086 7,925 11,016
Simiyu 4,741 5,602 17,469 21,714 22,210 27,317
Geita 26,275 26,449 8,709 11,575 34,984 38,024
Total
Employees 1,568,165 1,748,695 766,803 850,616 2,334,969 2,599,311

80
Table A13: Number of Total Employees by Region, Terms of Employment and Sex, 2016
Region Regular Casual
Total Male Female Total Male Female Total
Dodoma 36,390 31,075 67,465 543 217 760 68,225
Arusha 92,232 69,530 161,762 6,208 7,606 13,814 175,576
Kilimanjaro 69,958 56,156 126,114 4,743 4,331 9,074 135,188
Tanga 56,766 43,896 100,662 10,726 9,174 19,900 120,562
Morogoro 182,442 83,315 265,757 11,523 5,781 17,304 283,061
Pwani 30,666 19,118 49,784 2,174 776 2,950 52,734
Dar es Salaam 493,248 267,707 760,955 36,264 14,327 50,592 811,547
Lindi 18,517 13,990 32,506 117 76 193 32,699
Mtwara 22,277 12,108 34,384 428 163 591 34,975
Ruvuma 27,066 18,525 45,591 416 10,109 10,525 56,116
Iringa 37,423 26,371 63,794 3,758 2,365 6,123 69,917
Mbeya 68,226 51,811 120,038 6,129 2,002 8,131 128,169
Singida 23,545 17,679 41,224 2,392 964 3,356 44,581
Tabora 27,698 15,854 43,552 281 184 465 44,017
Rukwa 18,037 10,068 28,106 429 206 635 28,740
Kigoma 30,787 13,582 44,369 981 230 1,211 45,580
Shinyanga 39,089 20,402 59,490 808 430 1,238 60,728
Kagera 31,218 19,284 50,501 2,718 654 3,372 53,873
Mwanza 81,019 50,141 131,161 16,564 4,695 21,259 152,420
Mara 27,927 24,003 51,930 633 294 928 52,858
Manyara 23,757 15,070 38,827 5,016 1,885 6,901 45,728
Njombe 14,011 10,838 24,849 469 342 810 25,659
Katavi 6,976 4,036 11,011 - 5 5 11,016
Simiyu 16,898 9,669 26,567 464 286 750 27,317
Geita 25,784 9,848 35,632 1,080 1,312 2,392 38,024
Total Employees 1,501,957 914,075 2,416,032 114,863 68,415 183,279 2,599,311

81
Table A14: Number of Total Employees in Private Sector by Region, Age Group and Sex,
2016
Region Adult Male Adult Female Youth Male Youth Female Grand total
Dodoma 8,242 4,468 6,339 5,866 24,914
Arusha 64,045 49,343 19,595 14,514 147,497
Kilimanjaro 36,575 24,148 16,559 13,226 90,508
Tanga 37,403 28,839 8,752 5,872 80,867
Morogoro 134,583 45,536 16,701 10,655 207,475
Pwani 9,918 5,000 5,891 2,957 23,765
Dar es Salaam 321,478 147,472 149,332 87,877 706,159
Lindi 2,020 2,240 1,755 1,364 7,379
Mtwara 6,306 3,159 3,313 2,542 15,321
Ruvuma 6,077 12,861 7,478 6,048 32,464
Iringa 14,840 8,276 9,035 6,391 38,543
Mbeya 28,679 12,506 15,611 12,652 69,448
Singida 7,263 5,186 4,234 2,448 19,131
Tabora 6,048 2,280 3,280 2,520 14,127
Rukwa 4,170 1,095 2,743 1,231 9,240
Kigoma 7,702 2,180 5,473 2,150 17,504
Shinyanga 13,136 4,307 6,416 2,936 26,795
Kagera 9,593 4,948 5,356 3,654 23,551
Mwanza 39,844 16,526 29,249 19,526 105,145
Mara 6,469 3,485 4,760 4,406 19,120
Manyara 6,760 4,809 9,465 4,175 25,209
Njombe 3,788 2,337 2,164 2,262 10,551
Katavi 799 321 565 246 1,930
Simiyu 1,775 858 1,760 1,210 5,602
Geita 10,772 2,537 8,724 4,416 26,449
Total 788,285 394,717 344,550 221,143 1,748,695
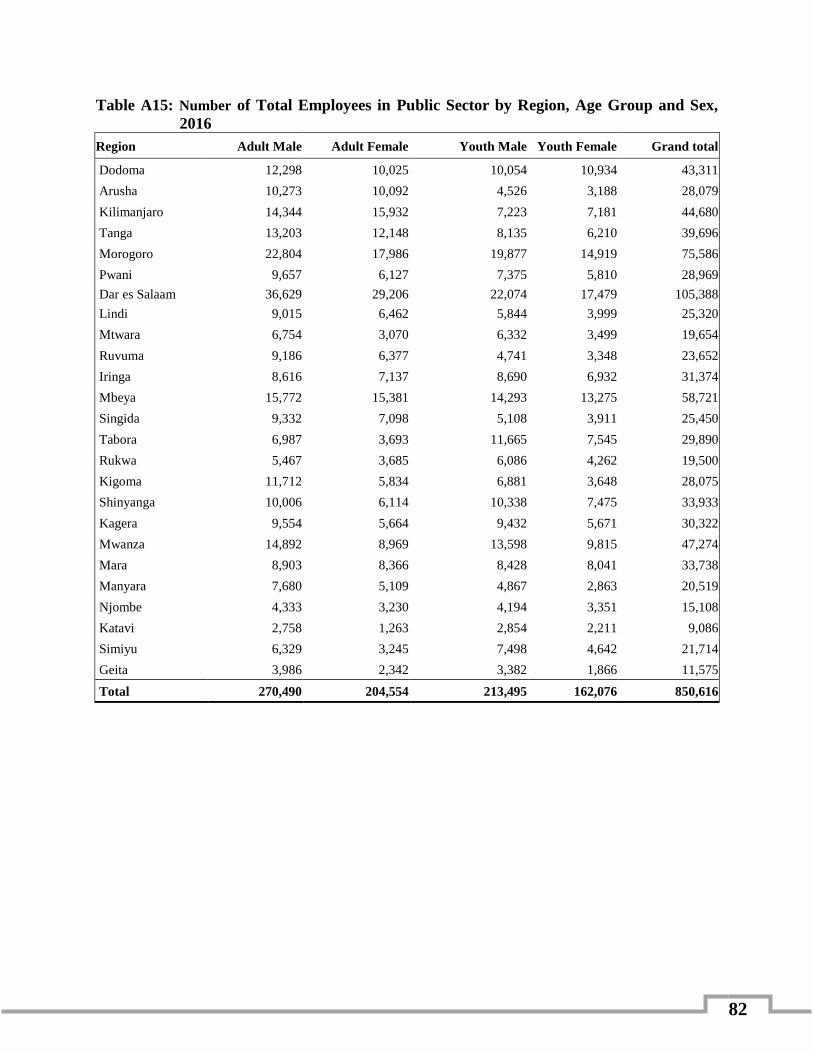
82
Table A15: Number of Total Employees in Public Sector by Region, Age Group and Sex,
2016
Region Adult Male Adult Female Youth Male Youth Female Grand total
Dodoma 12,298 10,025 10,054 10,934 43,311
Arusha 10,273 10,092 4,526 3,188 28,079
Kilimanjaro 14,344 15,932 7,223 7,181 44,680
Tanga 13,203 12,148 8,135 6,210 39,696
Morogoro 22,804 17,986 19,877 14,919 75,586
Pwani 9,657 6,127 7,375 5,810 28,969
Dar es Salaam 36,629 29,206 22,074 17,479 105,388
Lindi 9,015 6,462 5,844 3,999 25,320
Mtwara 6,754 3,070 6,332 3,499 19,654
Ruvuma 9,186 6,377 4,741 3,348 23,652
Iringa 8,616 7,137 8,690 6,932 31,374
Mbeya 15,772 15,381 14,293 13,275 58,721
Singida 9,332 7,098 5,108 3,911 25,450
Tabora 6,987 3,693 11,665 7,545 29,890
Rukwa 5,467 3,685 6,086 4,262 19,500
Kigoma 11,712 5,834 6,881 3,648 28,075
Shinyanga 10,006 6,114 10,338 7,475 33,933
Kagera 9,554 5,664 9,432 5,671 30,322
Mwanza 14,892 8,969 13,598 9,815 47,274
Mara 8,903 8,366 8,428 8,041 33,738
Manyara 7,680 5,109 4,867 2,863 20,519
Njombe 4,333 3,230 4,194 3,351 15,108
Katavi 2,758 1,263 2,854 2,211 9,086
Simiyu 6,329 3,245 7,498 4,642 21,714
Geita 3,986 2,342 3,382 1,866 11,575
Total 270,490 204,554 213,495 162,076 850,616

83
Table A16: Number of Total Employees by Region, Sector and Age Group, 2016
Region Private Sector Public Sector
Adult (36+ Years) Youth (15 - 35 Years) Adult (36+ Years) Youth (15 - 35 Years)
Dodoma 12,710 12,204 22,323 20,988
Arusha 113,388 34,109 20,365 7,714
Kilimanjaro 60,723 29,785 30,276 14,404
Tanga 66,242 14,624 25,351 14,345
Morogoro 180,120 27,355 40,790 34,796
Pwani 14,918 8,847 15,784 13,185
Dar es Salaam 468,950 237,209 65,835 39,553
Lindi 4,260 3,119 15,477 9,843
Mtwara 9,465 5,856 9,824 9,830
Ruvuma 18,938 13,526 15,563 8,090
Iringa 23,116 15,427 15,753 15,621
Mbeya 41,185 28,263 31,153 27,568
Singida 12,449 6,682 16,430 9,019
Tabora 8,328 5,800 10,680 19,210
Rukwa 5,266 3,974 9,152 10,348
Kigoma 9,882 7,623 17,547 10,529
Shinyanga 17,443 9,352 16,120 17,814
Kagera 14,542 9,009 15,218 15,104
Mwanza 56,370 48,775 23,862 23,413
Mara 9,954 9,166 17,269 16,469
Manyara 11,569 13,640 12,789 7,730
Njombe 6,125 4,426 7,563 7,545
Katavi 1,120 810 4,021 5,065
Simiyu 2,633 2,969 9,574 12,140
Geita 13,309 13,140 6,328 5,247
Total
Employees 1,183,002 565,694 475,044 375,571

84
Annexes for Chapter Three
Table B1: Number of Total Citizen Employees by Monthly Wage Rate (TZS) Group and
Sector Tanzania Mainland, 2016
Monthly Wage Rate Private Public Total
Up to 100,000 161,043 2,484 163,528
100,001 -150,000 348,015 4,960 352,975
150,001 - 300,000 424,737 26,832 451,569
300,001 - 500,000 252,076 193,092 445,168
500,001 - 900,000 181,419 366,519 547,938
900,001 - 1,200,000 69,841 143,015 212,856
1,200,001 - 1,500,000 42,475 64,928 107,403
Above 1,500,000 64,457 42,999 107,456
Total Citizen Employees 1,544,064 844,830 2,388,894
Table B2: Number of Total Citizen Employees by Monthly Wage Rate (TZS) Group and
Sex, Tanzania Mainland, 2016
Monthly Wage Rate (TZS) Group Male Female Total
Up to 100,000 92,809 70,719 163,528
100,001 -150,000 224,124 128,851 352,975
150,001 - 300,000 304,687 146,881 451,569
300,001 - 500,000 273,764 171,404 445,168
500,001 - 900,000 325,830 222,108 547,938
900,001 - 1,200,000 122,139 90,717 212,856
1,200,001 - 1,500,000 64,871 42,532 107,403
Above 1,500,000 72,634 34,822 107,456
Total Citizen Employees 1,480,859 908,035 2,388,894
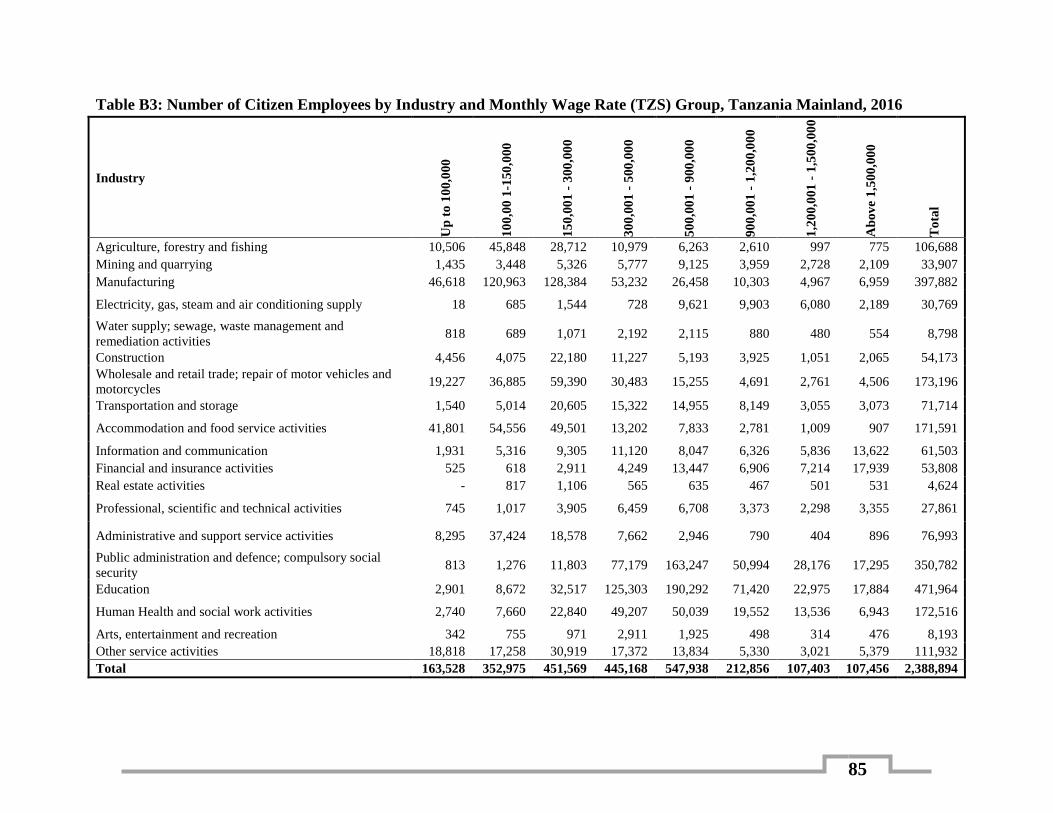
85
Table B3: Number of Citizen Employees by Industry and Monthly Wage Rate (TZS) Group, Tanzania Mainland, 2016
Industry
Up
to
10
0,0
00
10
0,0
0 1
-150
,000
15
0,0
01
- 3
00
,00
0
30
0,0
01
- 5
00
,00
0
50
0,0
01
- 9
00
,00
0
90
0,0
01
- 1
,20
0,0
00
1,2
00,0
01
- 1
,500
,00
0
Ab
ov
e 1
,500
,00
0
To
tal
Agriculture, forestry and fishing 10,506 45,848 28,712 10,979 6,263 2,610 997 775 106,688
Mining and quarrying 1,435 3,448 5,326 5,777 9,125 3,959 2,728 2,109 33,907
Manufacturing 46,618 120,963 128,384 53,232 26,458 10,303 4,967 6,959 397,882
Electricity, gas, steam and air conditioning supply 18 685 1,544 728 9,621 9,903 6,080 2,189 30,769
Water supply; sewage, waste management and
remediation activities 818 689 1,071 2,192 2,115 880 480 554 8,798
Construction 4,456 4,075 22,180 11,227 5,193 3,925 1,051 2,065 54,173
Wholesale and retail trade; repair of motor vehicles and
motorcycles 19,227 36,885 59,390 30,483 15,255 4,691 2,761 4,506 173,196
Transportation and storage 1,540 5,014 20,605 15,322 14,955 8,149 3,055 3,073 71,714
Accommodation and food service activities 41,801 54,556 49,501 13,202 7,833 2,781 1,009 907 171,591
Information and communication 1,931 5,316 9,305 11,120 8,047 6,326 5,836 13,622 61,503
Financial and insurance activities 525 618 2,911 4,249 13,447 6,906 7,214 17,939 53,808
Real estate activities - 817 1,106 565 635 467 501 531 4,624
Professional, scientific and technical activities 745 1,017 3,905 6,459 6,708 3,373 2,298 3,355 27,861
Administrative and support service activities 8,295 37,424 18,578 7,662 2,946 790 404 896 76,993
Public administration and defence; compulsory social
security 813 1,276 11,803 77,179 163,247 50,994 28,176 17,295 350,782
Education 2,901 8,672 32,517 125,303 190,292 71,420 22,975 17,884 471,964
Human Health and social work activities 2,740 7,660 22,840 49,207 50,039 19,552 13,536 6,943 172,516
Arts, entertainment and recreation 342 755 971 2,911 1,925 498 314 476 8,193
Other service activities 18,818 17,258 30,919 17,372 13,834 5,330 3,021 5,379 111,932
Total 163,528 352,975 451,569 445,168 547,938 212,856 107,403 107,456 2,388,894
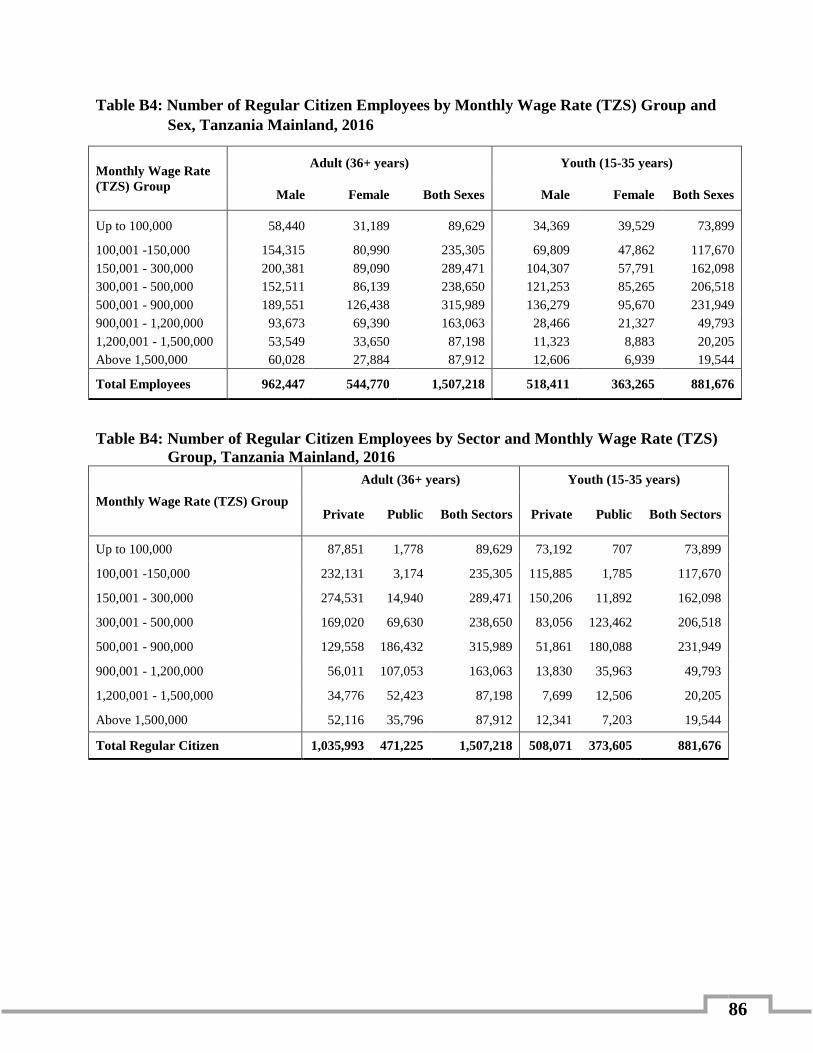
86
Table B4: Number of Regular Citizen Employees by Monthly Wage Rate (TZS) Group and
Sex, Tanzania Mainland, 2016
Monthly Wage Rate
(TZS) Group
Adult (36+ years) Youth (15-35 years)
Male Female Both Sexes Male Female Both Sexes
Up to 100,000 58,440 31,189 89,629 34,369 39,529 73,899
100,001 -150,000 154,315 80,990 235,305 69,809 47,862 117,670
150,001 - 300,000 200,381 89,090 289,471 104,307 57,791 162,098
300,001 - 500,000 152,511 86,139 238,650 121,253 85,265 206,518
500,001 - 900,000 189,551 126,438 315,989 136,279 95,670 231,949
900,001 - 1,200,000 93,673 69,390 163,063 28,466 21,327 49,793
1,200,001 - 1,500,000 53,549 33,650 87,198 11,323 8,883 20,205
Above 1,500,000 60,028 27,884 87,912 12,606 6,939 19,544
Total Employees 962,447 544,770 1,507,218 518,411 363,265 881,676
Table B4: Number of Regular Citizen Employees by Sector and Monthly Wage Rate (TZS)
Group, Tanzania Mainland, 2016
Monthly Wage Rate (TZS) Group
Adult (36+ years) Youth (15-35 years)
Private Public Both Sectors Private Public Both Sectors
Up to 100,000 87,851 1,778 89,629 73,192 707 73,899
100,001 -150,000 232,131 3,174 235,305 115,885 1,785 117,670
150,001 - 300,000 274,531 14,940 289,471 150,206 11,892 162,098
300,001 - 500,000 169,020 69,630 238,650 83,056 123,462 206,518
500,001 - 900,000 129,558 186,432 315,989 51,861 180,088 231,949
900,001 - 1,200,000 56,011 107,053 163,063 13,830 35,963 49,793
1,200,001 - 1,500,000 34,776 52,423 87,198 7,699 12,506 20,205
Above 1,500,000 52,116 35,796 87,912 12,341 7,203 19,544
Total Regular Citizen 1,035,993 471,225 1,507,218 508,071 373,605 881,676

87
Annexes for Chapter Four
Table C1: Total Annual Cash Earnings by Sector, Tanzania Mainland, 2015 and 2016
Sector 2015 2016
Private 11,177,000 12,956,373
Public 7,862,721 10,654,053
Total 19,039,721 23,610,426
Table C2: Annual Cash Earnings (TZS Million) of Employees by Major Industry and
Terms of employment, 2016
Industry Regular
Employees
Casual
Employees Total
Agriculture, forestry and fishing 549,421 49,497 598,918
Mining and quarrying 354,183 2,883 357,067
Manufacturing 2,517,469 107,531 2,625,000
Electricity, gas, steam and air conditioning supply 455,562 2,344 457,906
Water supply; sewage, waste management and remediation
activities 109,968 4,123 114,091
Construction 410,663 27,057 437,720
Wholesale and retail trade; repair of motor vehicles and
motorcycles 1,225,198 35,093 1,260,291
Transportation and storage 887,675 7,820 895,495
Accommodation and food service activities 739,348 7,849 747,197
Information and communication 1,086,895 1,946 1,088,841
Financial and insurance activities 2,333,163 765 2,333,928
Real estate activities 52,006 227 52,234
Professional, scientific and technical activities 432,229 1,284 433,513
Administrative and support service activities 335,758 1,730 337,488
Public administration and defence; compulsory social security 3,916,310 1,195 3,917,505
Education 4,814,520 8,105 4,822,625
Human Health and social work activities 2,328,451 3,767 2,332,219
Arts, entertainment and recreation 72,411 82 72,492
Other service activities 719,886 6,011 725,896
Total Annual Cash Earning (TZS Million) 23,341,118 269,308 23,610,426
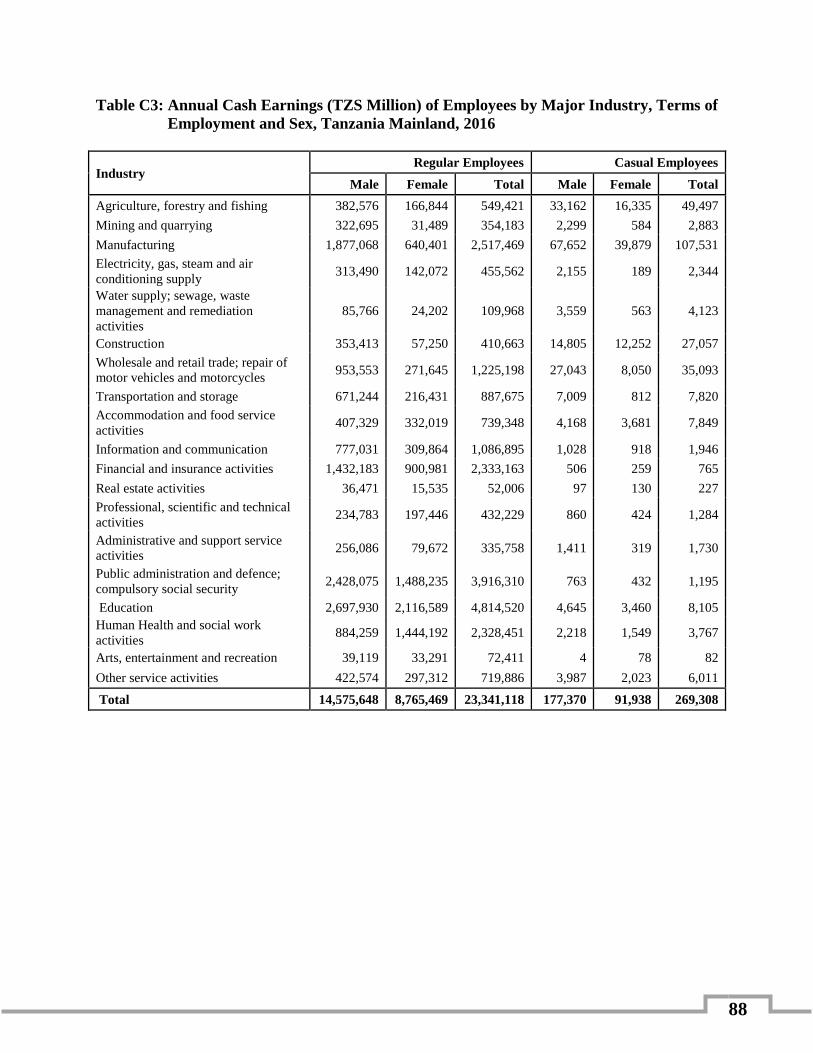
88
Table C3: Annual Cash Earnings (TZS Million) of Employees by Major Industry, Terms of
Employment and Sex, Tanzania Mainland, 2016
Industry Regular Employees Casual Employees
Male Female Total Male Female Total
Agriculture, forestry and fishing 382,576 166,844 549,421 33,162 16,335 49,497
Mining and quarrying 322,695 31,489 354,183 2,299 584 2,883
Manufacturing 1,877,068 640,401 2,517,469 67,652 39,879 107,531
Electricity, gas, steam and air
conditioning supply 313,490 142,072 455,562 2,155 189 2,344
Water supply; sewage, waste
management and remediation
activities
85,766 24,202 109,968 3,559 563 4,123
Construction 353,413 57,250 410,663 14,805 12,252 27,057
Wholesale and retail trade; repair of
motor vehicles and motorcycles 953,553 271,645 1,225,198 27,043 8,050 35,093
Transportation and storage 671,244 216,431 887,675 7,009 812 7,820
Accommodation and food service
activities 407,329 332,019 739,348 4,168 3,681 7,849
Information and communication 777,031 309,864 1,086,895 1,028 918 1,946
Financial and insurance activities 1,432,183 900,981 2,333,163 506 259 765
Real estate activities 36,471 15,535 52,006 97 130 227
Professional, scientific and technical
activities 234,783 197,446 432,229 860 424 1,284
Administrative and support service
activities 256,086 79,672 335,758 1,411 319 1,730
Public administration and defence;
compulsory social security 2,428,075 1,488,235 3,916,310 763 432 1,195
Education 2,697,930 2,116,589 4,814,520 4,645 3,460 8,105
Human Health and social work
activities 884,259 1,444,192 2,328,451 2,218 1,549 3,767
Arts, entertainment and recreation 39,119 33,291 72,411 4 78 82
Other service activities 422,574 297,312 719,886 3,987 2,023 6,011
Total 14,575,648 8,765,469 23,341,118 177,370 91,938 269,308
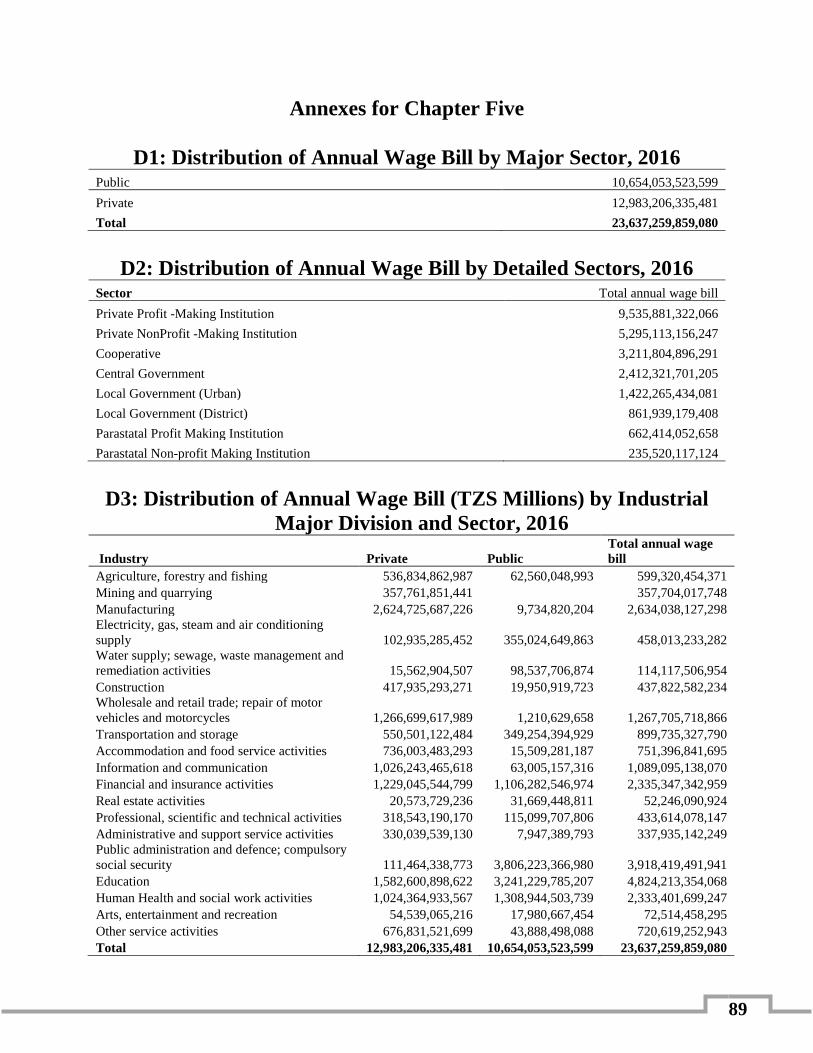
89
Annexes for Chapter Five
D1: Distribution of Annual Wage Bill by Major Sector, 2016 Public 10,654,053,523,599
Private 12,983,206,335,481
Total 23,637,259,859,080
D2: Distribution of Annual Wage Bill by Detailed Sectors, 2016 Sector Total annual wage bill
Private Profit -Making Institution 9,535,881,322,066
Private NonProfit -Making Institution 5,295,113,156,247
Cooperative 3,211,804,896,291
Central Government 2,412,321,701,205
Local Government (Urban) 1,422,265,434,081
Local Government (District) 861,939,179,408
Parastatal Profit Making Institution 662,414,052,658
Parastatal Non-profit Making Institution 235,520,117,124
D3: Distribution of Annual Wage Bill (TZS Millions) by Industrial
Major Division and Sector, 2016
Industry Private Public
Total annual wage
bill
Agriculture, forestry and fishing 536,834,862,987 62,560,048,993 599,320,454,371
Mining and quarrying 357,761,851,441 357,704,017,748
Manufacturing 2,624,725,687,226 9,734,820,204 2,634,038,127,298
Electricity, gas, steam and air conditioning
supply 102,935,285,452 355,024,649,863 458,013,233,282
Water supply; sewage, waste management and
remediation activities 15,562,904,507 98,537,706,874 114,117,506,954
Construction 417,935,293,271 19,950,919,723 437,822,582,234
Wholesale and retail trade; repair of motor
vehicles and motorcycles 1,266,699,617,989 1,210,629,658 1,267,705,718,866
Transportation and storage 550,501,122,484 349,254,394,929 899,735,327,790
Accommodation and food service activities 736,003,483,293 15,509,281,187 751,396,841,695
Information and communication 1,026,243,465,618 63,005,157,316 1,089,095,138,070
Financial and insurance activities 1,229,045,544,799 1,106,282,546,974 2,335,347,342,959
Real estate activities 20,573,729,236 31,669,448,811 52,246,090,924
Professional, scientific and technical activities 318,543,190,170 115,099,707,806 433,614,078,147
Administrative and support service activities 330,039,539,130 7,947,389,793 337,935,142,249
Public administration and defence; compulsory
social security 111,464,338,773 3,806,223,366,980 3,918,419,491,941
Education 1,582,600,898,622 3,241,229,785,207 4,824,213,354,068
Human Health and social work activities 1,024,364,933,567 1,308,944,503,739 2,333,401,699,247
Arts, entertainment and recreation 54,539,065,216 17,980,667,454 72,514,458,295
Other service activities 676,831,521,699 43,888,498,088 720,619,252,943
Total 12,983,206,335,481 10,654,053,523,599 23,637,259,859,080

90
D4: Distribution of Annual Wage Bill by Selected Regions, 2016 Region Total Annual Wage Bill
Dodoma 580,111,690,941
Arusha 1,185,029,269,037
Kilimanjaro 1,017,807,804,439
Tanga 766,806,274,494
Morogoro 2,034,296,472,536
Pwani 522,083,204,880
Dar es Salaam 9,219,287,700,803
Lindi 329,653,446,947
Mtwara 267,065,429,877
Ruvuma 428,383,650,213
Iringa 519,767,525,574
Mbeya 1,455,861,180,007
Singida 325,437,812,144
Tabora 342,122,963,578
Rukwa 262,893,357,318
Kigoma 371,623,754,154
Shinyanga 571,722,969,133
Kagera 565,189,991,242
Mwanza 1,409,614,266,646
Mara 396,011,923,338
Manyara 223,506,246,830
Njombe 176,959,980,655
Katavi 105,698,688,104
Simiyu 213,242,395,075
Geita 347,081,861,114
Total 23,637,259,859,080
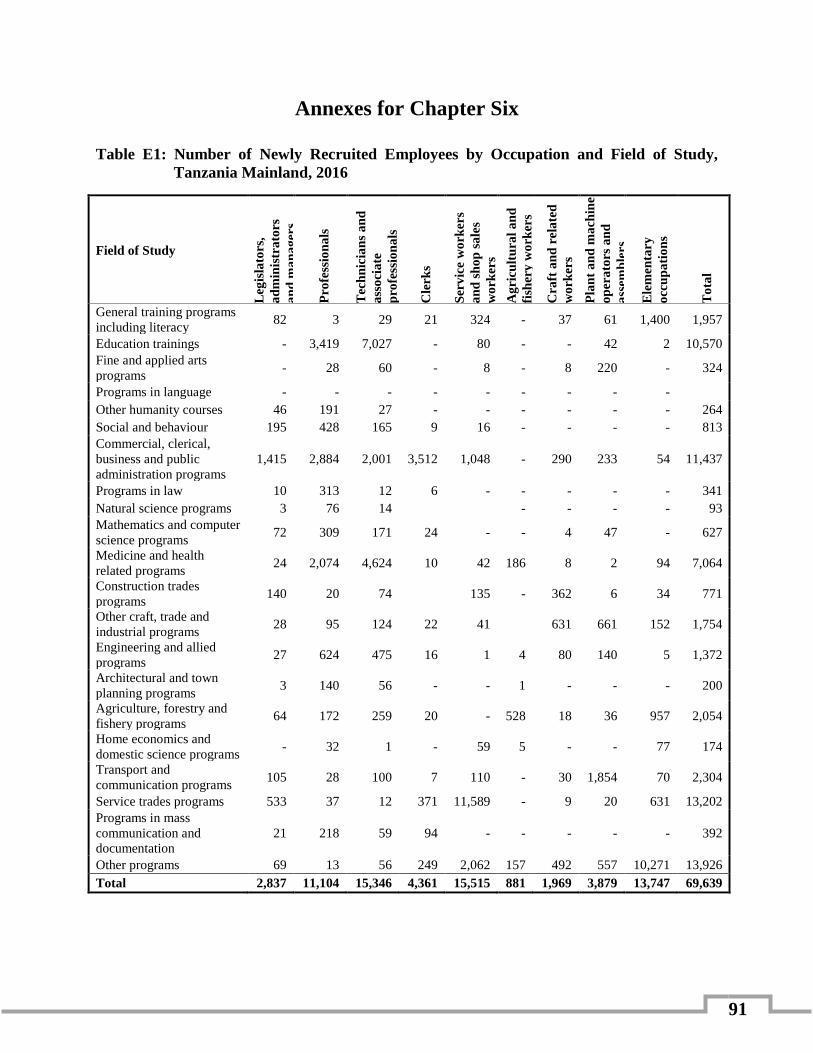
91
Annexes for Chapter Six
Table E1: Number of Newly Recruited Employees by Occupation and Field of Study,
Tanzania Mainland, 2016
Field of Study L
egis
lato
rs,
ad
min
istr
ato
rs
an
d m
an
ag
ers
Pro
fess
ion
als
Tec
hn
icia
ns
an
d
ass
oci
ate
pro
fess
ion
als
Cle
rk
s
Ser
vic
e w
ork
ers
an
d s
ho
p s
ale
s
wo
rker
s
Ag
ricu
ltu
ral
an
d
fish
ery
wo
rker
s
Cra
ft a
nd
rela
ted
wo
rker
s
Pla
nt
an
d m
ach
ine
op
era
tors
an
d
ass
emb
lers
Ele
men
tary
occ
up
ati
on
s
To
tal
General training programs
including literacy 82 3 29 21 324 - 37 61 1,400 1,957
Education trainings - 3,419 7,027 - 80 - - 42 2 10,570
Fine and applied arts
programs - 28 60 - 8 - 8 220 - 324
Programs in language - - - - - - - - -
Other humanity courses 46 191 27 - - - - - - 264
Social and behaviour 195 428 165 9 16 - - - - 813
Commercial, clerical,
business and public
administration programs
1,415 2,884 2,001 3,512 1,048 - 290 233 54 11,437
Programs in law 10 313 12 6 - - - - - 341
Natural science programs 3 76 14 - - - - 93
Mathematics and computer
science programs 72 309 171 24 - - 4 47 - 627
Medicine and health
related programs 24 2,074 4,624 10 42 186 8 2 94 7,064
Construction trades
programs 140 20 74 135 - 362 6 34 771
Other craft, trade and
industrial programs 28 95 124 22 41 631 661 152 1,754
Engineering and allied
programs 27 624 475 16 1 4 80 140 5 1,372
Architectural and town
planning programs 3 140 56 - - 1 - - - 200
Agriculture, forestry and
fishery programs 64 172 259 20 - 528 18 36 957 2,054
Home economics and
domestic science programs - 32 1 - 59 5 - - 77 174
Transport and
communication programs 105 28 100 7 110 - 30 1,854 70 2,304
Service trades programs 533 37 12 371 11,589 - 9 20 631 13,202
Programs in mass
communication and
documentation
21 218 59 94 - - - - - 392
Other programs 69 13 56 249 2,062 157 492 557 10,271 13,926
Total 2,837 11,104 15,346 4,361 15,515 881 1,969 3,879 13,747 69,639

92
Table E2: Number of Newly Recruited Employees by Region and Occupation, Tanzania
Mainland, 2016
Region
Leg
isla
tors
,
ad
min
istr
ato
rs a
nd
ma
na
ger
s
Pro
fess
ion
als
Tec
hn
icia
ns
an
d
ass
oci
ate
pro
fess
ion
als
Cle
rk
s
Ser
vic
e w
ork
ers
an
d
sho
p s
ale
s w
ork
ers
Ag
ricu
ltu
ral
an
d
fish
ery
wo
rker
s
Cra
ft a
nd
rela
ted
wo
rker
s
Pla
nt
an
d m
ach
ine
op
era
tors
an
d
ass
emb
lers
Ele
men
tary
occ
up
ati
on
s
To
tal
Dodoma 29 603 549 267 781 3 6 176 2,414
Arusha 42 236 281 237 542 54 94 105 210 1,801
Kilimanjaro 86 648 665 198 665 66 57 279 1,088 3,752
Tanga 58 83 158 57 309 119 187 1,236 2,207
Morogoro 351 598 1,150 231 1,969 186 129 328 151 5,093
Pwani 19 282 414 344 150 34 12 106 6,830 8,191
DSM 1,181 3,623 3,997 1,830 6,725 28 836 1,682 2,405 22,307
Lindi 24 25 37 43 8 14 3 48 202
Mtwara 14 49 117 16 3 6 29 45 279
Ruvuma 35 151 116 51 317 40 138 76 924
Iringa 20 207 126 53 139 6 11 37 27 626
Mbeya 125 706 1,181 94 586 286 21 29 200 3,228
Singida 6 159 155 40 27 39 17 27 470
Tabora 72 147 339 53 153 30 13 75 882
Rukwa 64 74 206 11 22 5 9 391
Kigoma 5 249 412 29 201 51 10 14 238 1,209
Shinyanga 3 66 157 51 478 6 290 151 1,202
Kagera 103 677 928 308 101 10 152 141 2,420
Mwanza 478 1,283 671 261 1,861 82 113 319 337 5,405
Mara 30 600 1,502 77 294 18 18 40 45 2,624
Manyara 85 6 5 31 302 35 464
Njombe 3 70 340 32 20 30 115 308 918
Katavi 2 266 694 40 13 2 1,017
Simiyu 82 189 172 24 120 1 6 594
Geita 5 28 973 9 4 1,019
Total 2,837 11,104 15,346 4,361 15,515 881 1,969 3,879 13,747 69,639

93
Table E3: Distribution of the Newly Recruited Permanent, Contractual Casual and Apprentice Employees by Sub Sectors and
Sex, Tanzania Mainland, 2016
Sub Sector Permanent Contract Casual Apprentices Other Total
Male Female Male Female Male Female Male Female Male Female Male Female
PRIVATE SECTOR
Private Profit -
Making
Institutions
10,446 7,033 8,121 5,071 1,440 2,217 663 232 461 78 21,131 14,631
Private Non Profit
-Making
Institutions
2,442 8,732 1,869 1,550 144 143 118 52 34 36 4,607 10,513
PUBLIC SECTOR
Cooperatives 30 8 178 69 84 - - - - - 292 77
Central
Government 1,525 3,197 58 36 9 - - - 1 1 1,593 3,234
Local Government
- Urban 627 594 36 14 2 1 - 5 2 670 611
Local Government
- District 5,608 4,709 99 46 9 7 - - 1 1 5,717 4,763
Parastatal Profit
Making-
Institutions
176 123 43 19 - - - - - - 219 142
Parastatal Non
Profit- Making
Institutions
515 497 216 190 - - - - 15 6 746 693
Total 21,369 24,893 10,620 6,995 1,688 2,368 781 284 517 124 34,975 34,664

94
Table E4: Number of Newly Recruited Employees by selected Occupation, Starting Basic Salary and Sex, Tanzania Mainland,
2015 and 2016
Occupation
Less than
100,000
100,001 –
150,000
150,001 –
300,000
300,001 –
500,000
500,001 -
1,500,000 Above 1,500,000 Total
Male Female Male Female Male Female Male Female Male Female Male Female Male Female
Legislators,
administrators
and managers
251 104 52 10 131 254 556 337 423 139 373 207 1,786 1,051
Professionals 294 44 36 23 375 498 1,256 618 4,118 2,274 1,054 514 7,133 3,971
Technicians
and associate
professionals
366 316 477 437 1,247 1,203 3,829 3,036 2,226 1,708 234 267 8,379 6,967
Clerks 68 405 197 381 359 595 217 1,126 428 466 46 73 1,315 3,046
Service
workers and
shop sales
workers
2,796 3,812 2,334 1,606 2,487 1,217 622 290 244 101 - 6 8,483 7,032
Agricultural
and fishery
workers
121 28 174 228 229 57 18 11 13 2 - - 555 326
Craft and
related
workers
510 132 307 61 396 4 165 7 302 32 41 12 1,721 248
Plant and
machine
operators and
assemblers
357 22 501 372 1,142 448 624 31 348 12 16 6 2,988 891
Elementary
occupations 382 545 1,684 8,179 467 303 64 2,100 18 5 - - 2,615 11,132
Total 5,145 5,408 5,762 11,297 6,833 4,579 7,351 7,556 8,120 4,739 1,764 1,085 34,975 34,664

NATIONAL BUREAU OF STATISTICS
Vision
“To become a one – stop Centre for official statistics in Tanzania.”
Mission
“To produce quality official statistics and services that meet needs of national and
international stakeholders for evidence – based planning and decision making.”