Embed Size (px)
DESCRIPTION
science
Citation preview
7/18/2019 Form 1 Chapter 7 Heat
http://slidepdf.com/reader/full/form-1-chapter-7-heat-56d57ee27f469 1/12
SCIENCE SECONDARY 1
JPN Pahang 2009 48
FORM 1 CHAPTER 7
HEAT
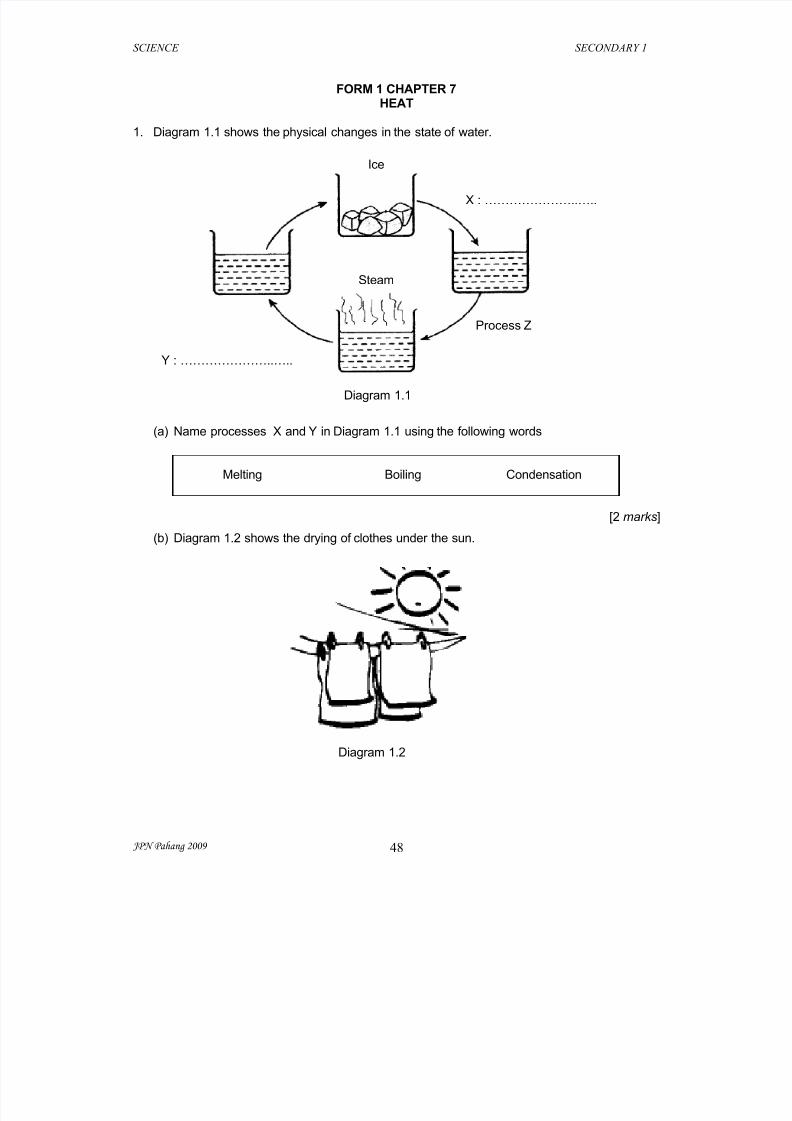
1. Diagram 1.1 shows the physical changes in the state of water.
(a) Name processes X and Y in Diagram 1.1 using the following words
[2 marks]
(b) Diagram 1.2 shows the drying of clothes under the sun.
Melting Boiling Condensation
Diagram 1.2
Y : …………………..…..
Ice
Steam
Process Z
X : …………………..…..
Diagram 1.1
7/18/2019 Form 1 Chapter 7 Heat
http://slidepdf.com/reader/full/form-1-chapter-7-heat-56d57ee27f469 2/12
SCIENCE SECONDARY 1
JPN Pahang 2009 49
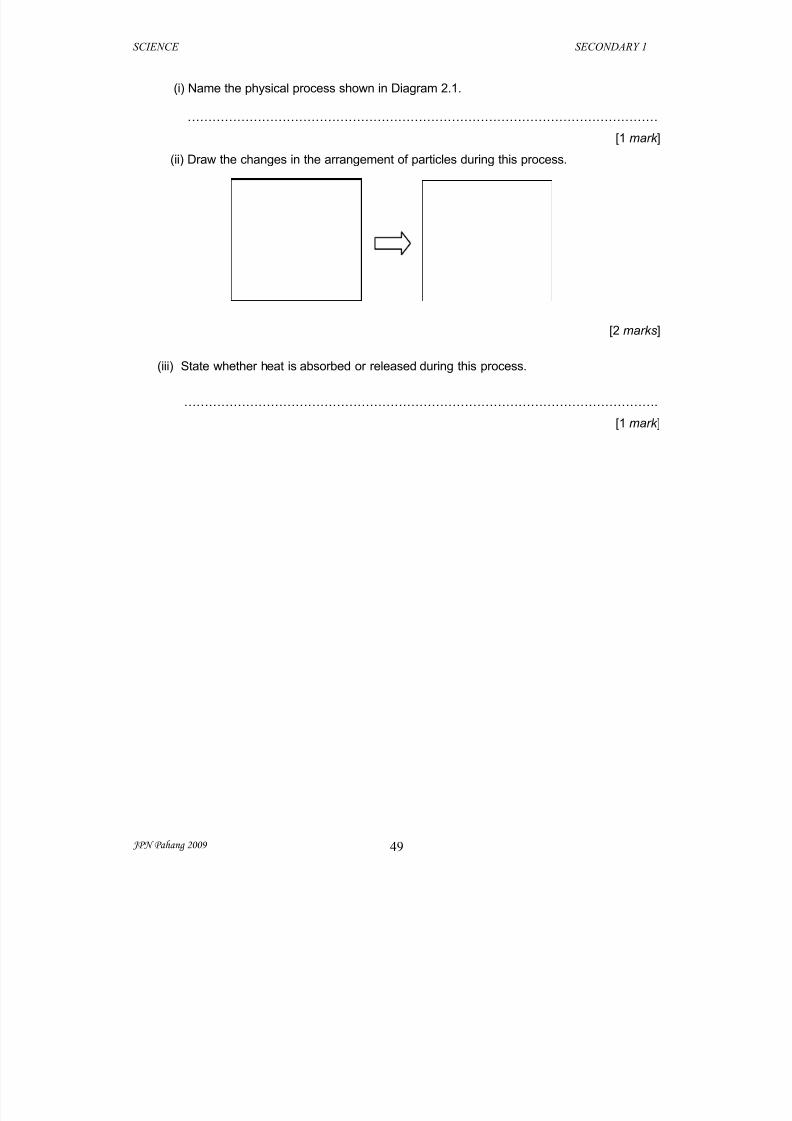
(i) Name the physical process shown in Diagram 2.1.
……………………………………………………………………………………………………
[1 mark ]
(ii) Draw the changes in the arrangement of particles during this process.
[2 marks]
(iii) State whether heat is absorbed or released during this process.
…………………………………………………………………………………………………….
[1 mark ]
7/18/2019 Form 1 Chapter 7 Heat
http://slidepdf.com/reader/full/form-1-chapter-7-heat-56d57ee27f469 3/12
SCIENCE SECONDARY 1
JPN Pahang 2009 50
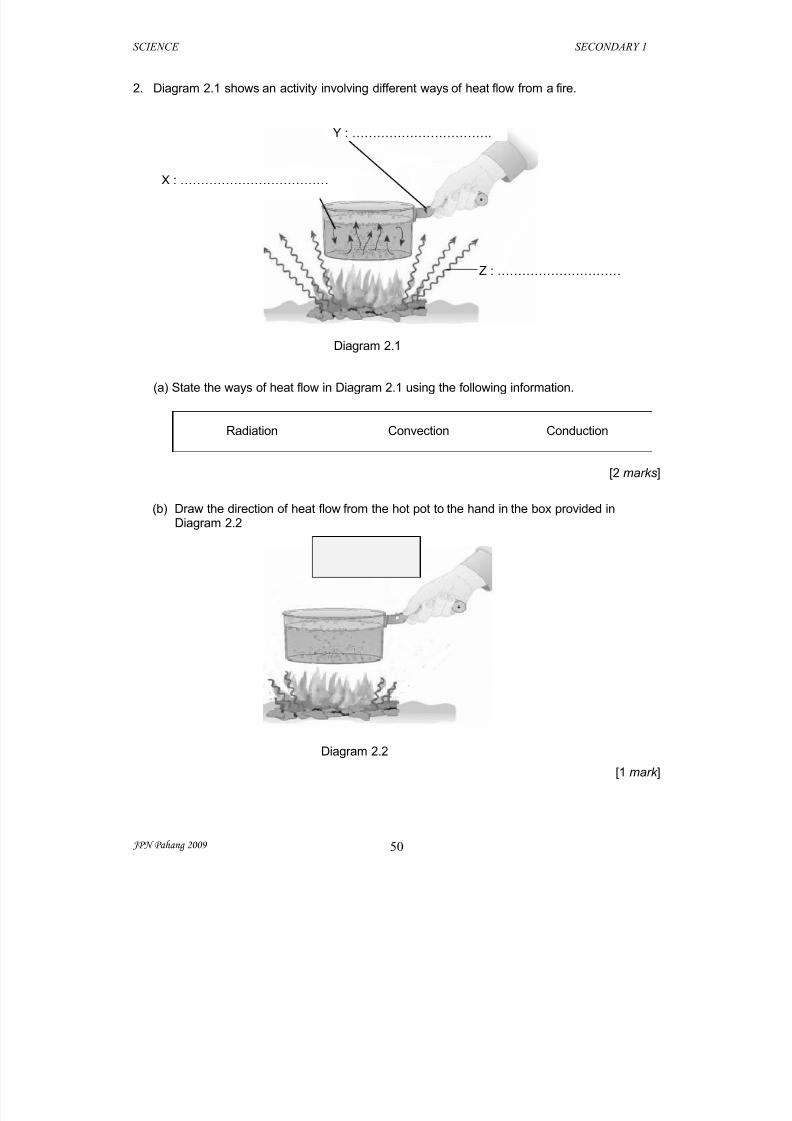
2. Diagram 2.1 shows an activity involving different ways of heat flow from a fire.
(a) State the ways of heat flow in Diagram 2.1 using the following information.
[2 marks]
(b) Draw the direction of heat flow from the hot pot to the hand in the box provided inDiagram 2.2
[1 mark ]
Radiation Convection Conduction
Diagram 2.2
Y : …………………………….
Diagram 2.1
Z : …………………………
X : ………………………………
7/18/2019 Form 1 Chapter 7 Heat
http://slidepdf.com/reader/full/form-1-chapter-7-heat-56d57ee27f469 4/12
SCIENCE SECONDARY 1
JPN Pahang 2009 51
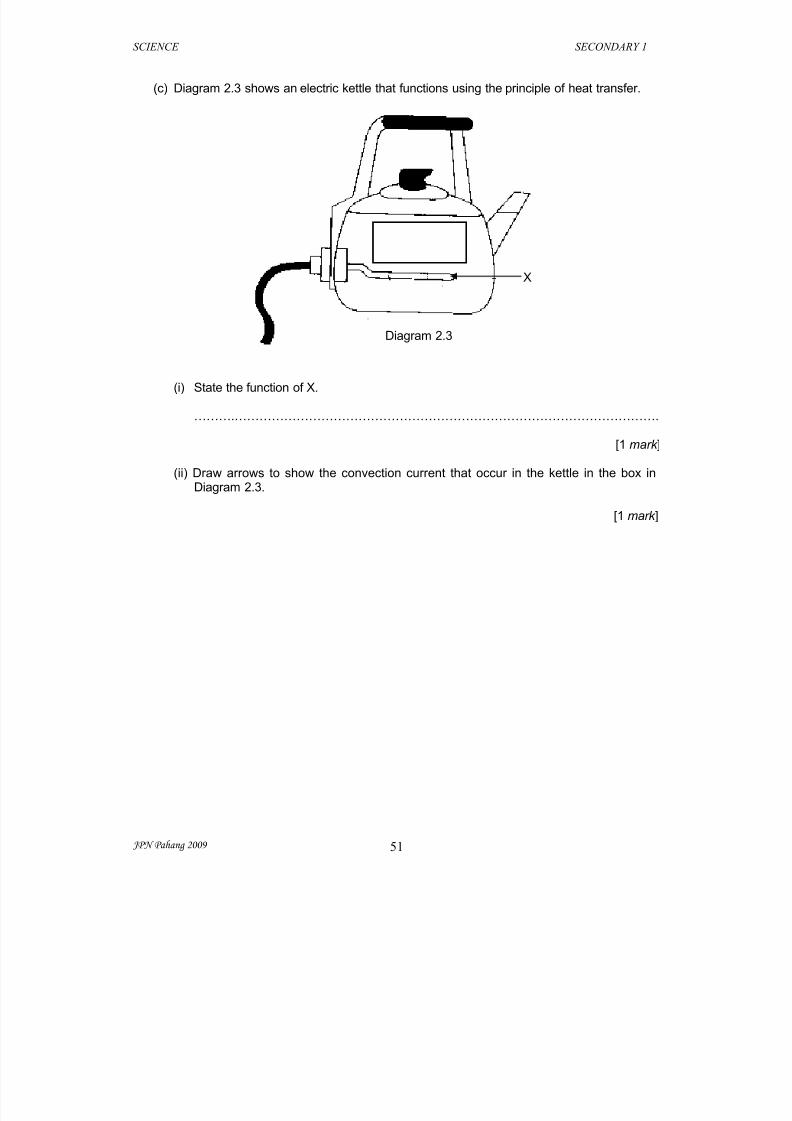
(c) Diagram 2.3 shows an electric kettle that functions using the principle of heat transfer.
(i) State the function of X.
……….………………………………………………………………………………………….
[1 mark ]
(ii) Draw arrows to show the convection current that occur in the kettle in the box inDiagram 2.3.
[1 mark ]
X
Diagram 2.3
7/18/2019 Form 1 Chapter 7 Heat
http://slidepdf.com/reader/full/form-1-chapter-7-heat-56d57ee27f469 5/12
SCIENCE SECONDARY 1
JPN Pahang 2009 52
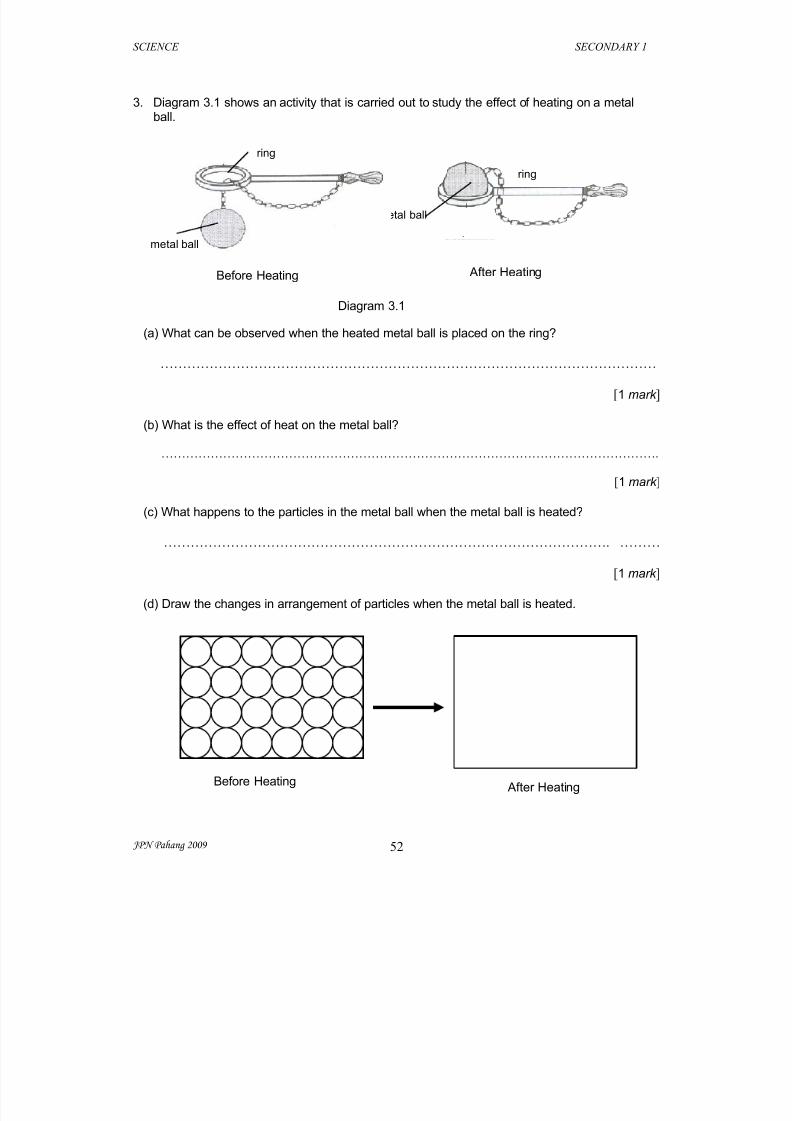
3. Diagram 3.1 shows an activity that is carried out to study the effect of heating on a metalball.
(a) What can be observed when the heated metal ball is placed on the ring?
…………………………………………………………………………………………………
[1 mark ]
(b) What is the effect of heat on the metal ball?
………………………………………………………………………………………………………….
[1 mark ]
(c) What happens to the particles in the metal ball when the metal ball is heated?
………………………………………………………………………………………. ………
[1 mark ]
(d) Draw the changes in arrangement of particles when the metal ball is heated.
metal ball
ring
metal ball
ring
Before Heating After Heating
Diagram 3.1
Before Heating After Heating
7/18/2019 Form 1 Chapter 7 Heat
http://slidepdf.com/reader/full/form-1-chapter-7-heat-56d57ee27f469 6/12
SCIENCE SECONDARY 1
JPN Pahang 2009 53
[1 mark ]
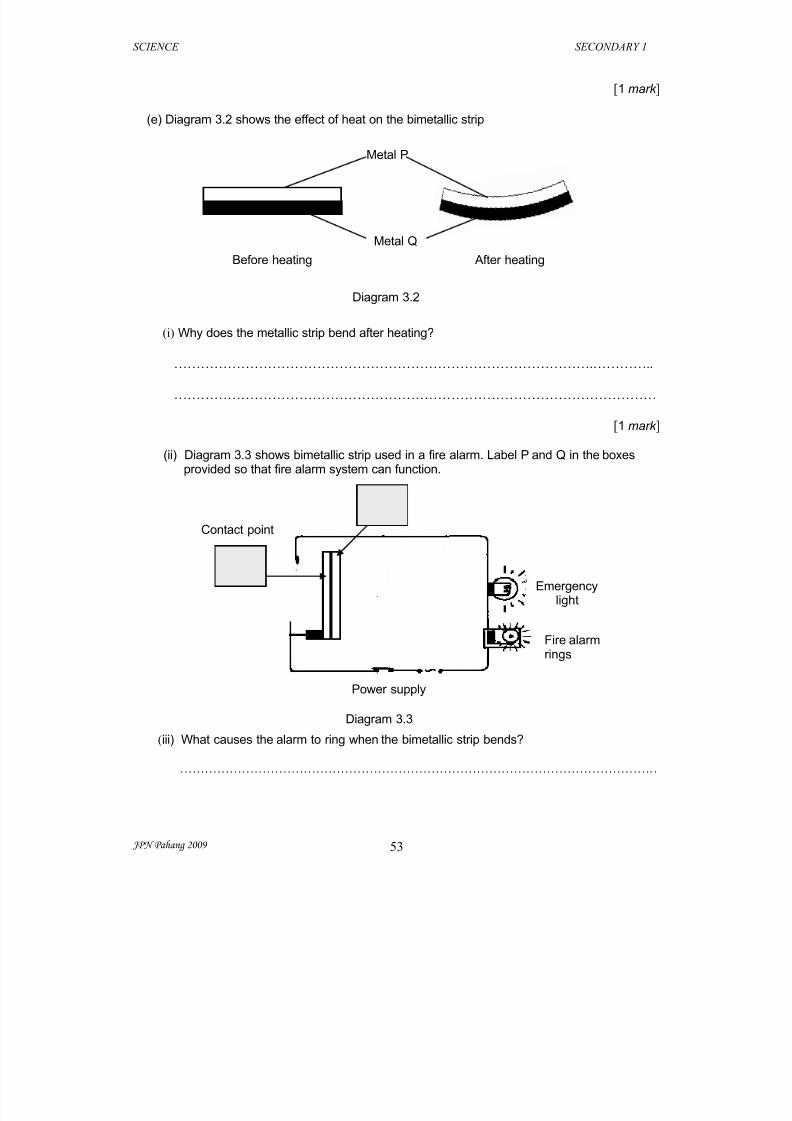
(e) Diagram 3.2 shows the effect of heat on the bimetallic strip
(i) Why does the metallic strip bend after heating?
………………………………………………………………………………….…………..
………………………………………………………………………………………………
[1 mark ]
(ii) Diagram 3.3 shows bimetallic strip used in a fire alarm. Label P and Q in the boxesprovided so that fire alarm system can function.
(iii) What causes the alarm to ring when the bimetallic strip bends?
……………………………………………………………………………………………………..
Metal P
Metal Q
Before heating After heating
Diagram 3.2
Fire alarmrings
Power supply
Emergencylight
Contact point
Diagram 3.3
7/18/2019 Form 1 Chapter 7 Heat
http://slidepdf.com/reader/full/form-1-chapter-7-heat-56d57ee27f469 7/12
SCIENCE SECONDARY 1
JPN Pahang 2009 54
[1 mark ]
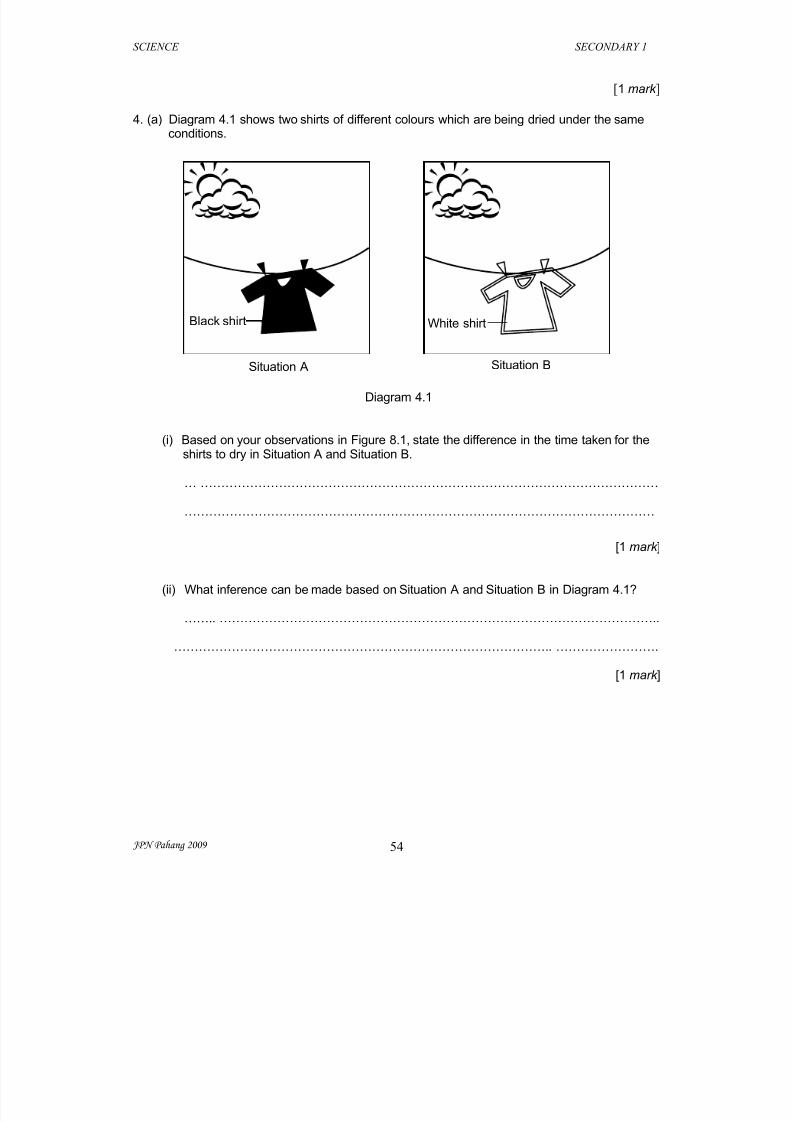
4. (a) Diagram 4.1 shows two shirts of different colours which are being dried under the sameconditions.
(i) Based on your observations in Figure 8.1, state the difference in the time taken for theshirts to dry in Situation A and Situation B.
… …………………………………………………………………………………………………
……………………………………………………………………………………………………
[1 mark ]
(ii) What inference can be made based on Situation A and Situation B in Diagram 4.1?
…….. ……………………………………………………………………………………………..
……………………………………………………………………………….. …………………….
[1 mark ]
Diagram 4.1
Situation A Situation B
Black shirt White shirt
7/18/2019 Form 1 Chapter 7 Heat
http://slidepdf.com/reader/full/form-1-chapter-7-heat-56d57ee27f469 8/12
SCIENCE SECONDARY 1
JPN Pahang 2009 55
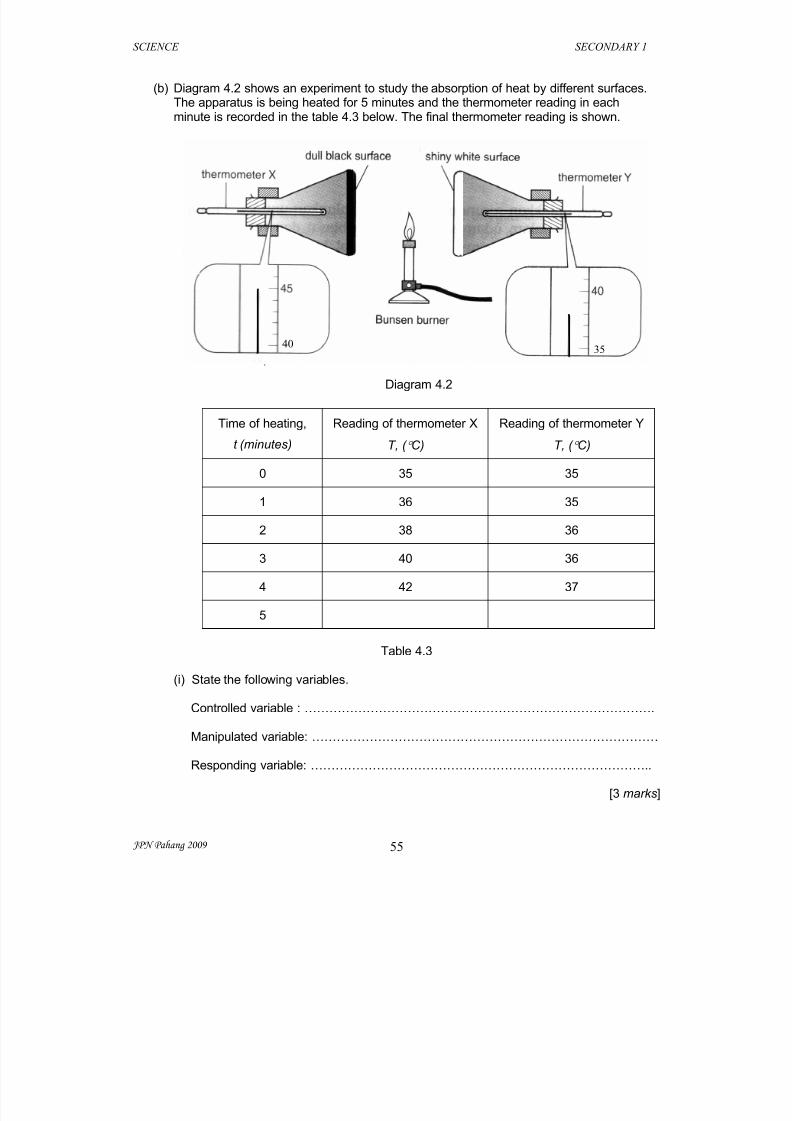
(b) Diagram 4.2 shows an experiment to study the absorption of heat by different surfaces.The apparatus is being heated for 5 minutes and the thermometer reading in eachminute is recorded in the table 4.3 below. The final thermometer reading is shown.
Time of heating,
t (minutes)
Reading of thermometer X
T, ( C)
Reading of thermometer Y
T, ( C)
0 35 35
1 36 35
2 38 36
3 40 36
4 42 37
5
Table 4.3
(i) State the following variables.
Controlled variable : ………………………………………………………………………….
Manipulated variable: …………………………………………………………………………
Responding variable: ………………………………………………………………………..
[3 marks]
Diagram 4.2
40 35
7/18/2019 Form 1 Chapter 7 Heat
http://slidepdf.com/reader/full/form-1-chapter-7-heat-56d57ee27f469 9/12
SCIENCE SECONDARY 1
JPN Pahang 2009 56
(ii) State the hypothesis of this experiment.
………….......................................................................................................................
…………..…………………………………………………………………………….. ………
[1 mark ]
(iii) Record the temperature reading in the table 4.3.[1 mark ]
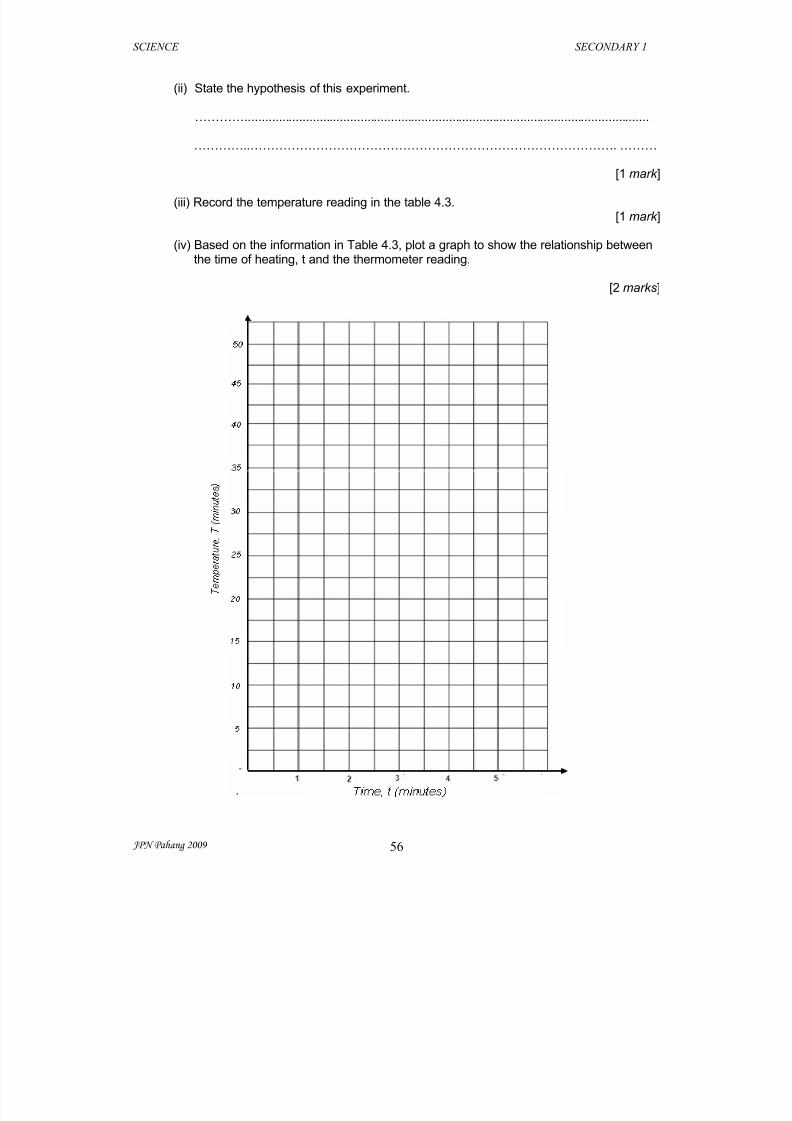
(iv) Based on the information in Table 4.3, plot a graph to show the relationship betweenthe time of heating, t and the thermometer reading.
[2 marks]

7/18/2019 Form 1 Chapter 7 Heat
http://slidepdf.com/reader/full/form-1-chapter-7-heat-56d57ee27f469 10/12
SCIENCE SECONDARY 1
JPN Pahang 2009 57
(v) Based on the graph, what is the relationship between the time, t and thetemperature, T ?
………………………………………………………………………………………………….
………………………………………………………………………………………………….
[1 mark ]
(vi) Predict what will happen to the thermometer X reading after 5 minutes.
…………………………………………………………………………………………………
…………………………………………………………………………………………………
[1 mark ]
7/18/2019 Form 1 Chapter 7 Heat
http://slidepdf.com/reader/full/form-1-chapter-7-heat-56d57ee27f469 11/12
SCIENCE SECONDARY 1
JPN Pahang 2009 58
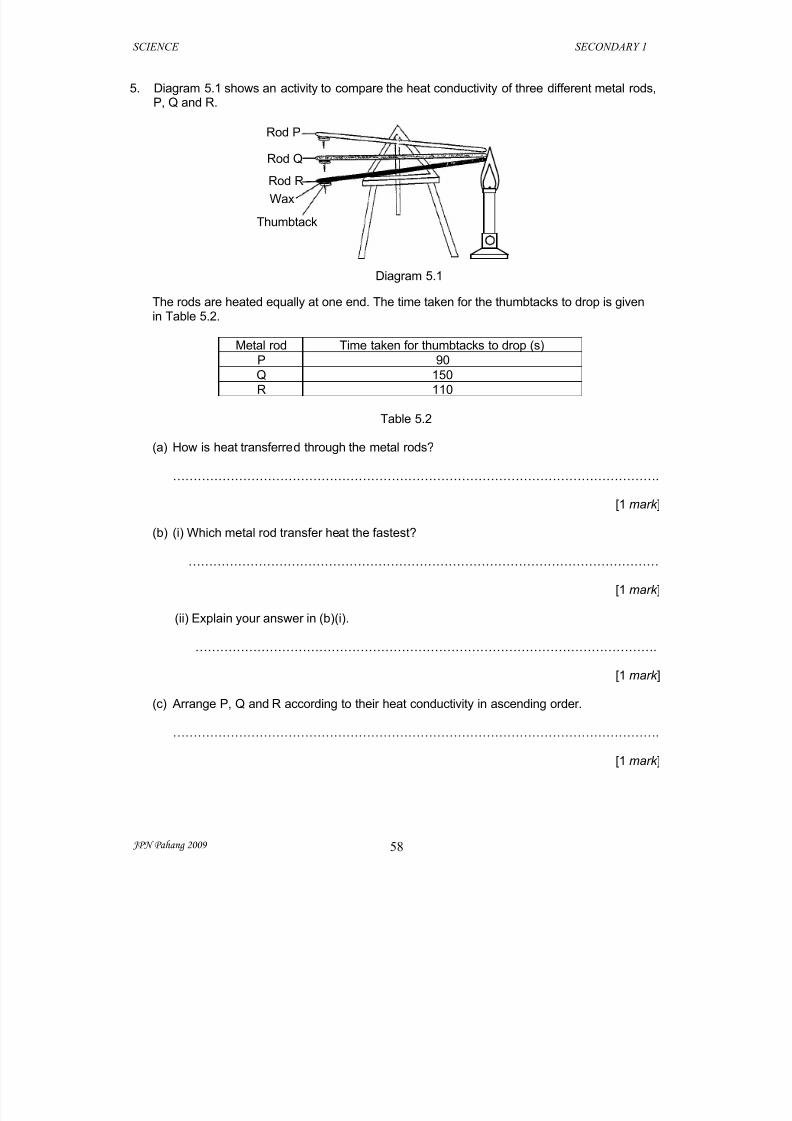
5. Diagram 5.1 shows an activity to compare the heat conductivity of three different metal rods,P, Q and R.
The rods are heated equally at one end. The time taken for the thumbtacks to drop is givenin Table 5.2.
Metal rod Time taken for thumbtacks to drop (s)P 90
Q 150R 110
Table 5.2
(a) How is heat transferred through the metal rods?
……………………………………………………………………………………………………….
[1 mark ]
(b) (i) Which metal rod transfer heat the fastest?
……………………………………………………………………………………………………
[1 mark ]
(ii) Explain your answer in (b)(i).
………………………………………………………………………………………………….
[1 mark ]
(c) Arrange P, Q and R according to their heat conductivity in ascending order.
……………………………………………………………………………………………………….
[1 mark ]
Rod P
Rod Q
Rod R
Wax
Thumbtack
Diagram 5.1
7/18/2019 Form 1 Chapter 7 Heat
http://slidepdf.com/reader/full/form-1-chapter-7-heat-56d57ee27f469 12/12
SCIENCE SECONDARY 1
JPN Pahang 2009 59
(d) (i) Which of the metals, P, Q, or R is the best material for making a frying pan?
………………………………………………………………………………………………….
[1 mark ]
(ii) Give one reason for your answer in (d)(i).
……………………………………………………………………………………………………
…………………………. ……………………………………………………………………….
[1 mark ]