Embed Size (px)
Citation preview
The First International Conference on Entrepreneurship
Book One I
FOREWORD
Welcome to the 1st International Conference on Entrepreneurship
(2014 ICOEN, INDONESIA)
On behalf of The Honorable Keynote Speakers,
Conference Co Host, Rector of Ciputra University.
Organizational Committee, Steering Committee, and
distinguished Presenters and Participants.
It is my great pleasure to welcome you to this
International Conference on Entrepreneurship (ICOEN)
2014 in Indonesia.
The conference is held on September 18th and 19th;
moreover. It attracts educators, researchers, and
entrepreneurs which related with scientific disciplines of
practitioners.
On this occasion, let me give special thanks to the
Keynote Speakers (1) Prof. Parimal Merchant, Director
Center for Family Manager Business SP Jain
Institute of Management & Research, India, (2) Prof. Greg Barton, Director of the
Center for Islam and the Modern World (CIMOW), Australia, (3) Ir. Harun Hajadi,
MBA Managing Director of Ciputra Group, Indonesia, (4) Tanadi Santoso, MBA.,
Founder of SAM Design, Indonesia, (5) Antonius Tanan, MBA, President of UCEC
(University Ciputra Entrepreneurship Center), Indonesia, (6) Prof. Dr. Lucas da Costa,
SE., M.Si, Rector of Universidade Da Paz, Timur Leste, (7) Norashidah Hashim, PhD,
Deputy Director of Training and Consultation Department. Co – operative and
Entrepreneurship Development Institute (CEDI) Universiti Utara Malaysia, Malaysia.
Your contribution to this seminar as reviewers and keynote speakers make this event
more meaningful and evaluable. We are also thankful to all reviewers, for their
commitment, effort and dedication in understanding the task of reviewing all of the full
paper.
We would like to thank to all authors who have submitted their papers to be reviewed,
those whose paper were chosen to be presented in the seminar, and those who have
submitted manuscripts to be publishes in proceeding
Last but not least, we would like to express our sincere gratitude to everyone who has
contributed and made the joint conference a success.
Best wishes,
2014 ICOEN Organizing Committee Chair
Dr. J.E.Sutanto, MM.
Graduate School, Ciputra University Surabaya, Indonesia
The First International Conference on Entrepreneurship
Book One II
COMMITTEE
Steering Committee
1. Dr. David Sukardi Kodrat, MM., CPM. (Asia) (Ciputra University)
2. Prof. Dr. F. Danardana Murwani, MM. (Ciputra University)
3. Ir. Hendrasmoro, M.D.M. (Ciputra University)
Organizing Committee
Chair Dr. J.E. Sutanto, MM (Ciputra University)
Secretary Dr. Christina Whidya Utami, MM. (Ciputra University)
Co-Secretary Natalia Christiani Djahi, S.Pd., M.Pd. (Ciputra University)
Treasury Maria Assumpta Evi Marlina, SE, MM. (Ciputra University)
Co-Treasury Eko Budi Santoso, SE., M.Si.Ak. (Ciputra University)
HELD BY CIPUTRA UNIVERSITY COLLABORATED WITH
1. UIN Sunan Ampel Surabaya, INDONESIA
2. Universitas Negeri Surabaya, INDONESIA
3. Sekolah Tinggi Ilmu Ekonomi Indonesia Surabaya, INDONESIA
4. Universitas Katolik Darma Cendika Surabaya, INDONESIA
5. IBMT International University Surabaya, INDONESIA
6. Ikatan Doktor Ekonomi Indonesia (IDEI) Surabaya, INDONESIA
7. Universitas Abdurachman Saleh Situbondo, INDONESIA
8. Universitas W.R. Supratman Surabaya, INDONESIA
The First International Conference on Entrepreneurship
Book One III
REVIEWER
1. Prof. Dr. Ir. Hening Widi Oetomo, M.M., Ph.D.
(Sekolah Tinggi Ilmu Ekonomi Indonesia Surabaya)
2. Dr. Tina Melinda, Dra., M.M. (Ciputra University Surabaya)
3. Dr. Christina Whidya Utami, M.M.
(Ciputra University Surabaya)
4. Dr. Hermeindito, SE, MM.
(Ciputra University Surabaya)
5. Dr. Yusak Anshori, M.M. (Ciputra University Surabaya)
6. Jimmy Ellya Kurniawan, S.Psi., M.Si., Psikolog
(Ciputra University Surabaya)
7. Wirawan Endro Dwi Radianto, S.E., M.Sc.Ak.
(Ciputra University Surabaya)
8. Dr. Christian Herdinata, S.E., M.M. (Ciputra University Surabaya)
9. Adi Suryaputra Paramita, S.Kom., M.Kom. (Ciputra University Surabaya)
10. Trianggoro Wiradinata, S.T., M.Eng.Sc., Ph.D. (Ciputra University Surabaya)
11. Tommy Christian Efrata, S.E., M.Sc. (Ciputra University Surabaya)
12. Agoes Tinus Lis Indrianto, S.S.,M.Tourism. (Ciputra University Surabaya)
13. Dra. Juliuska Sahertian, M.Sc. (Ciputra University Surabaya)
The First International Conference on Entrepreneurship
Book One IV
KEYNOTE SPEAKERS
1. Prof. Parimal Merchant
Director Center for Family Manager Business SP Jain Institute of Management &
Research, INDIA
2. Prof. Greg Barton
Director of the Center for Islam and the Modern World (CIMOW),
AUSTRALIA
3. Ir. Harun Hajadi, MBA
Managing Director of Ciputra Group, INDONESIA
4. Tanadi Santoso, MBA
Founder of SAM Design, INDONESIA
5. Antonius Tanan, MBA
President of UCEC (Universitas Ciputra Enterpreneurship Center),
INDONESIA.
6. Prof. Dr. Lucas da Costa, SE., M.Si
Rector of Universidade Da Paz, TIMOR LESTE
7. Norashidah Hashim, PhD
Deputy Director of Training and Consultation Department .
Co – operative and Entrepreneurship Development Institute (CEDI)
Universiti Utara Malaysia, MALAYSIA
The First International Conference on Entrepreneurship
Book One V
TABLE OF CONTENTS
Evi Thelia Sari1 The Effect of Entrepreneurial Corporate
Culture to Create The Entrepreneurial
Personality Characteristics: Comparing Male
And Female Employees In Surabaya
1
Ristanti Akseptori1,
Marya Mujayana2
Cointegration of Indonesia’s Stock Market
And America At The Period of And Recovery
From Global Financial Crisis
19
Nila K Hidayat1, Dibia
Abduh2, Fiter Abadi3
Competence Development Strategy Resources
Actors Creative Industry Through Education,
Skills And Culture In The Creative Industries
Regional South Tangerang
29
Christina Whidya Utami1,
Hendrasmoro2,
Danardana Murwani3
Model Application Mentoring Pegg (5c) to
Improve The Entrepreneur Learning Quality
E4 Ciputra University
45
Ivana Alim1, Deddy
Marciano2, James Bartle3
Asymmetry Information And Credit Risk
Effect on Loan Pricing In Asia Pacific 2006-
2010
59
Dean Michael Reyhan1,
David Sukardi Kodrat2
R Trading Company Development Feasibility
Study
70
Nurmawati1 Planning And Controlling of Raw Material In
Accumulator Production At The Pt Xx
80
Rendy Iswanto1, Tina
Melinda2
The Effect of Price And Product Quality on
Buying Decision of Photo Cabin Services
88
Jeffry1, Christina Whidya
Utami2
The Influence of Intrinsic Motivation And
Extrinsic Motivation Towards Player
Performance In Knights Management
98
Kirwani Susanti1, Made
Dudy Satyawan2, Renny
Dwijayanti3
The Internalization of Entrepreneurial
Learning In An Effort to Develop
Entrepreneurial Spirit on Vocational High
School Students
108
Bachtiar Jusuf Helmy Effect of Sources of Competitive Advantage
of Marketing on The Performance of Fish
Processing Industry In Tambak Wedi,
Surabaya
119
Tina Melinda1, Meidiahna
Kusuma2, Liliani3
The Factors Shaping The Spirit of
Entrepreneurship (A Study In Small And
Medium Enterprises)
128
The First International Conference on Entrepreneurship
Book One VI
Nekky Rahmiyati1 The Effects of Fiscal Decentralitation And
Investment Growth on Economic Growth In
East Java
136
Arif Firmansyah1, Dina
Ratna Furi2
The Role of Entrepreneurial Orientation on
The Relationship Between Personal
Characteristics And Business Performance
145
Wiwin Purnomowati1,
Ismini2
Ibk Program For Creating Student
Entrepreneurs At The Widyagama University
162
Kevyn Hadianto Setijo1,
Denny Bernardus2,
Christina Whidya Utami3
Design Strategy For Property Developer
Addressing The Policy of Bank Indonesia
No.15/40/Dkmp On 24 September 2013 (Case
Study: Citraland Surabaya)
169
Daniel Kurniawan1,
J. E. Sutanto2
The Influence of Price, Product Quality,
Service Quality on Customer Satisfaction And
Customer Loyalty of Dck Surabaya
185
Sri Sutrismi1 The Implementation of Students’ Entrepreneur
Through The Cooperative-Based Entrepreneur
Instructional Model
204
Bambang Purwoko1 The Influence Perceived Stimulation And
Perceived Crowding Against Impulse Buying
And Customer Satisfaction Ramayana
Department Store In Surabaya
211
Wayan Sukesedana1,
J.E. Sutanto2
Effect of Internal And External Factors of
Against Sugarcane Farmers Income In
Ngimbang Lamongan
225
Jaya Adi Gama
Tengtarto1, David
Sukardi Kodrat2
Fleasibility Study For Development Business
PT. J
239
Kevin Alexander
Ongkowidjojo1, Damelina
Tambunan2
The Succession Program Planning of Damai
Sejahtera Family Business
250
Wulandari Harjanti1 Creating Comfort Zone With
Entrepreneurship
257
The First International Conference on Entrepreneurship
Book One 1
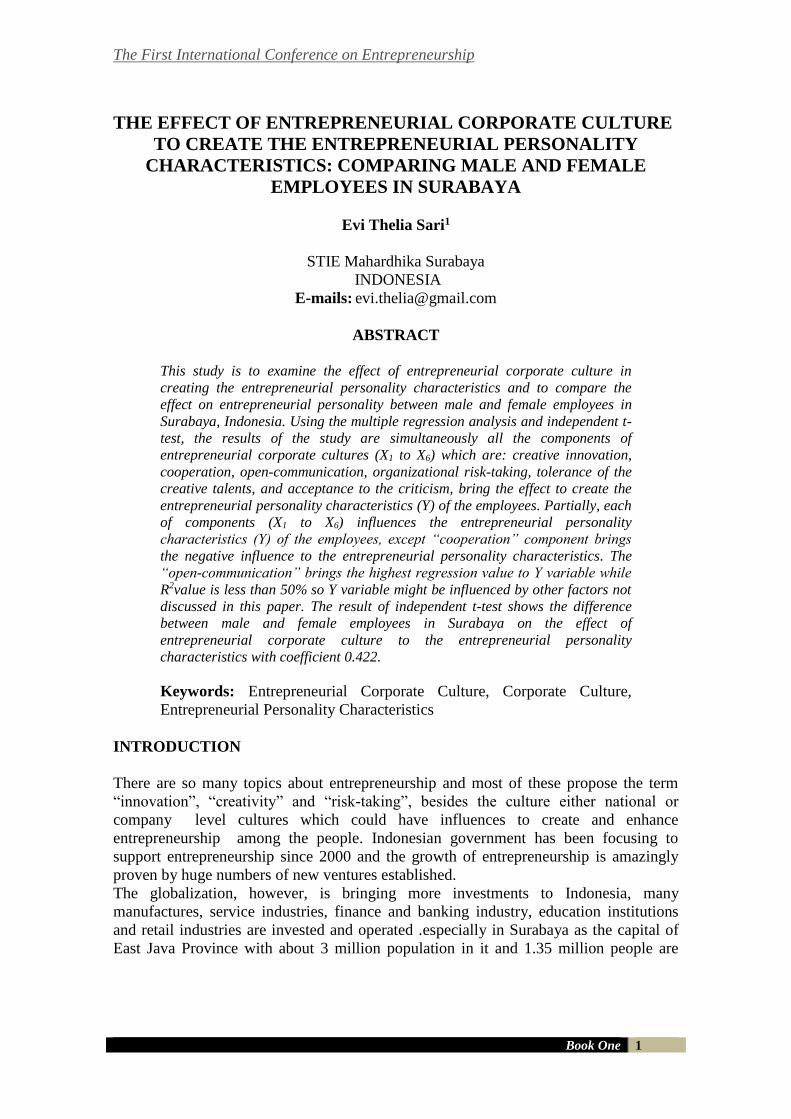
THE EFFECT OF ENTREPRENEURIAL CORPORATE CULTURE
TO CREATE THE ENTREPRENEURIAL PERSONALITY
CHARACTERISTICS: COMPARING MALE AND FEMALE
EMPLOYEES IN SURABAYA
Evi Thelia Sari1
STIE Mahardhika Surabaya
INDONESIA
E-mails: [email protected]
ABSTRACT
This study is to examine the effect of entrepreneurial corporate culture in
creating the entrepreneurial personality characteristics and to compare the
effect on entrepreneurial personality between male and female employees in
Surabaya, Indonesia. Using the multiple regression analysis and independent t-
test, the results of the study are simultaneously all the components of
entrepreneurial corporate cultures (X1 to X6) which are: creative innovation,
cooperation, open-communication, organizational risk-taking, tolerance of the
creative talents, and acceptance to the criticism, bring the effect to create the
entrepreneurial personality characteristics (Y) of the employees. Partially, each
of components (X1 to X6) influences the entrepreneurial personality
characteristics (Y) of the employees, except “cooperation” component brings
the negative influence to the entrepreneurial personality characteristics. The
“open-communication” brings the highest regression value to Y variable while
R2value is less than 50% so Y variable might be influenced by other factors not
discussed in this paper. The result of independent t-test shows the difference
between male and female employees in Surabaya on the effect of
entrepreneurial corporate culture to the entrepreneurial personality
characteristics with coefficient 0.422.
Keywords: Entrepreneurial Corporate Culture, Corporate Culture,
Entrepreneurial Personality Characteristics
INTRODUCTION
There are so many topics about entrepreneurship and most of these propose the term
“innovation”, “creativity” and “risk-taking”, besides the culture either national or
company level cultures which could have influences to create and enhance
entrepreneurship among the people. Indonesian government has been focusing to
support entrepreneurship since 2000 and the growth of entrepreneurship is amazingly
proven by huge numbers of new ventures established.
The globalization, however, is bringing more investments to Indonesia, many
manufactures, service industries, finance and banking industry, education institutions
and retail industries are invested and operated .especially in Surabaya as the capital of
East Java Province with about 3 million population in it and 1.35 million people are
The First International Conference on Entrepreneurship
Book One 2
working in either private or state-owned companies/institutions in Surabaya city. This
population is mixed of originates and urbanized people from counties or towns around
Surabaya and even from other provinces and islands. This mixture brings more
complication to define its basic culture. In addition to this, the global companies
investing in Surabaya enrich this city with many cultures introduced to society through
its employees.
Companies are not static, yet they are continually changing (Morris & Kuratko, 2002).
They must adapt their traditional paradigm and even value to the changing global
environment, demand and also values. Thus, the companies have to change to be more
innovative and then they need to support their people within with the eagerness and
readiness to change and do something different than they used to do. Study by Shihab,
et al.(2011) found the significant relationship between organizational culture and
entrepreneurial orientation among its employees. Many years ago, basically, male and
female characteristics in Indonesia differed by the conditions of its independences, risk-
taking, ability to perceive failures and other personality characteristics of an
entrepreneurship. Yet, the culture in national level is currently changing, indeed.
Surabaya, the second largest city in Indonesia, currently indicated to have some changes
in cultures and even values and norms. While in the past, the basic culture of Indonesian
characteristics are masculinity, high context and collectivist as those in some other
Asian countries and Latin America, but the globalization brings a lot of changes not
only to the economy, technology, political, but also to social and culture life.
This paper will examine the effect of entrepreneurial corporate culture to create the
employees’ entrepreneurial characteristics in Surabaya and then try to see whether the
effect is different to male and female employees.
LITERATURE REVIEW
Corporate Culture
Organizational culture is a system of common definitions which are preserved by the
members of an organization and it creates distinction between organizations
(Pardakhtchi, 2006). Robbins (1990) identified ten key characteristics composing
organizational culture. They include individual initiative, risk tolerance, direction,
integration, management support, control, identity, reward system, conflict tolerance
and communication patterns. (Sepehri and Khayati, 2013).
Defining the term “corporate culture” needs an introduction of culture in its existence
within an organization or corporate (later, it will be mentioned as “corporate”). Schein
(2010), stated that the concepts about culture are: Structural stability: implies that it is
not only shared but also stable because it defines the group; depth: culture is the deepest,
often unconscious part of a group and is therefore less tangible and less visible; breadth:
after characteristic of culture is that after it has developed, it covers all of a group’s
functioning. Thus, culture is pervasive and influences all aspects of how an organization
deals with its primary task, its various environments, and its internal operations and the
last concept is; patterning or integration which is implied by the concept of culture and
that further lends stability is patterning or integration that ties together the various
elements and resides at a deeper level. Culture, based on Schein (2002), then implies
that rituals, climate, values and behaviors tie together into a coherent whole and this
pattern or integration is the essence of what we mean by culture. Disorder or
The First International Conference on Entrepreneurship
Book One 3
senselessness makes anxiety and hard work to reduce that anxiety by developing a more
consistent and predictable view of how things are and how they should be.
Thus, in a corporate, culture will affect the way how the strategy is determined, goals
are established and organization operates. Finally, Schein (2010) defined formally that
an organization culture (this paper refers to it) is “A pattern of shared basic
assumptions that a group has learned as it solved its problems of external adaptation and internal integration, that has worked well enough to be considered valid and
therefore, to be taught to new members as the correct way to perceive, think, and feel in
relation to those problems.” The cultures somehow, affecting the corporate ways come from macro level (laws and
economic institutions) and micro level (the organization is influenced through a number
of cultural elements relating to employer-employee relationships and behaviour among
employees).
Entrepreneurial Corporate Culture
The understanding of basic culture concepts within a corporate will support the better
idea to the entrepreneurial corporate culture. Kotter (1996) in Morris & Kuratko (2002)
noted that “ culture changes only after you have successfully altered people’s actions,
after the new behavior produces some group benefit for a period of time, and after
people see the connection between the new actions and the performance improvement”.
This statement then brings us the paradigm that management even does not change the
culture so that entrepreneurship begins, but a corporate must create an entrepreneurial
culture through a transformation process including innovation, continuous
reinforcement, result, and extensive internal communication (Morris & Kuratko, 2002).
Definition of entrepreneurial corporate culture is not clearly described, but its core
meaning refers to corporate which is consistent with entrepreneurship and most
conducive to entrepreneurship (Morris & Kuratko, 2002) and seems to have the
following elements:
- People and empowerment focused;
- Value creation through innovation and change;
- Attention to the basics;
- Hands-on management;
- Doing the right things;
- Freedom to grow and to fail;
- Commitment and personal responsibility;
- Emphasis on the future and a sense of urgency
The basic thing of entrepreneurial corporate culture is about the people within it. They
must champion a concept, persevere in the face of resistance and rejection, make
adaptations, and keep the idea alive, but still need teams. A motivated, coordinated team
is critical for moving an entrepreneurial event through what can be a lengthy process
filled with obstacles (Morris & Kuratko, 2002).
The other important thing in entrepreneurial corporate is about the people view about
failure. Failure is then perceived in the entrepreneurial corporate because the executives
recognize that failure goes hand in hand with innovating. Failure is considered a trial
toward an innovation and sometimes it brings extra cost to try. Then avoiding failure in
no way ensures success but experiencing failures can enhance the possibility of success
The First International Conference on Entrepreneurship
Book One 4
if learning is taking place. So, the real problem with failure point of view is how a
corporate conceptualizes failure. (Morris & Kuratko, 2002). However, the study by
Sepehri & Khayati (2013) indicates that there is a significant relationship between the
components of organizational culture and corporate entrepreneurship.
Stevenson (1983) in Gathungu, et al. (2014) conceptualized entrepreneurship as a
management approach that has at its heart an all-consuming passion for the pursuit and
exploitation of opportunity without regard to resources currently controlled and
contrasted entrepreneurial behavior with administrative behavior.
Razavi et al. (2012) in their study used McGuire components of entrepreneurial
organization culture those will be also used in this paper. The six components used to
describe the entrepreneurial corporate culture are: creative innovation, cooperation,
open communication, organizational risk-taking, tolerance of the creative talents, and
criticism acceptance.
Creative innovation has many definitions and indicators but basically it is characterized
by dynamic environment with its new product or procedure or a new management
strategy to an enterprise (Razavi et al., 2012). The product development is one of the
duties of research and development in the institution, organization or corporate.
Cooperation tends to be defined as the teamwork dynamic and collaboration among
employees within organization. Open communication is clearly seen as the easy access
to information and sharing ideas at all levels and sections in organization/corporate.
Organizational risk-taking is defined as the ability of the organization members to
believe reasonable risk-taking and learning from mistakes and even failures (Razavi et
al., 2012). Open-minded and informal culture perhaps is easier to adjust with mistakes.
The other component is tolerance of creative talents which refers to supports that given
to the creativity of the employees in doing their tasks. The last component proposed by
Mc Guire as cited in Razavi et al (2012) is criticism acceptance which needs the open-
minded leaders in organization or corporate because it refers to acceptance to the
comment from dissatisfied employees and the cooperation between management and
employee to resolve their dissatisfaction. This paper uses those term based on Razavi’s
with some adaptation to the proper situation.
Mars (2008) in his study shows four distinct environment about corporate cultures;
piazzas, modules, pyramids and keeps. To each “corporate culture” he equated an
appropriate form of enterprise: piazza to entrepreneurialism, modules to projects,
pyramids to institutional hierarchies and keeps to specialist pursuits. For those
entrepreneurial, networking and innovating individualist, there is no division between
internal and external space (time) and for them it is about competitive arena. So, in the
entrepreneurial corporate culture, competition and innovation must be encouraged
among the employees.
Cakar & Erturk (2010) concluded in their study that innovative culture is a way of
thinking and behaving that creates, develops and establishes values and attitudes within
a firm that may require rising, accepting, and supporting new ideas involving an
improvement in the functioning and management of the firm. They considered that
empowerment is an antecedent of innovation capability and a consequence of
organizational culture. Their findings are meaningful that the more employees tend to
avoid uncertainty, the more they participate in the decisions affecting their tasks. They
The First International Conference on Entrepreneurship
Book One 5
usually ask feedback from their supervisors and motivated by the praise from the
supervisors.
Small firms have their managers more concerned with and involved in the professional
as well as personal lives of their subordinates and this setting makes employees become
more positive to the managers’ decisions on innovations and increase their participation
in the innovation process (Cakar & Erturk, 2010).
Entrepreneurial Orientation
Although in this paper, entrepreneurial orientation specifically is not discussed, but this
term seems to be the other effect of entrepreneurial corporate culture. Some empirical
studies suggest that EO is a multi-dimensional construct and can be evaluated from
different perspectives. Miller’s (1983) work, which views the EO construct as
innovation, risk-taking, and proactiveness, is the basis for several studies. Later, a
number of studies have established innovation, risk-taking, and proactiveness as EO
dimensions. Lumpkin and Dess (1996) in Shihab et al., (2011), defined each EO
construct as follows:
1. Autonomy is one of the most important stimuli for the entrepreneurs in running
ventures and described as an independency of an individual or a team to
develop business vision and carry it through
2. Completion here is defined as the strong autonomy whenever the entrepreneurs
supported with cultures that endorse them to be independently and
opportunities seekers.
3. Innovativeness refers to willingness to support new ideas, creativity, novelty,
technological leadership, experimentation, and R&D in the development of
new processes. It also gives large contribution to the presence of
entrepreneurship. If there is supporting culture which supports the creation of
new ideas, experimentation, original solutions to problem, and creative process
then innovativeness will give the positive results.
4. Risk taking is defined as willingness to accept uncertainty, seizing opportunity
in the marketplace by making large resource commitment with expectation to
achieve high returns. Risk-taking behavior and commitment to resource will
bring an entrepreneur to harvest the benefits.
5. Competitive aggressiveness is about firm’s tendency to compete with its
rivals/competitors directly and intensely. It also refers to entrepreneurs who
live in culture of achievement oriented. This dimension is becoming an
important component of EO because without competitive aggressiveness, firm
would not be able to survive and success in starting up a new venture. Since
proactiveness dimension is identical to competitive aggressiveness and
therefore is excluded in this present paper.
An organization’s culture represents the coherent pattern of values and beliefs that have
evolved as successful solutions to past challenges (Schein, 1990). Culture represents an
important contextual factor that can foster discretionary knowledge-sharing behaviors
(Burgelman, 1983; Morris et al., 1993; Zahra et al., 2004). A significant aspect of
organizational culture is the way in which the organization relates to employees and
employees to one another (e.g., Baron, Hannan & Burton, 1999; Schein, 1990). The
values regarding relationships with employees that underlie organizational culture can
The First International Conference on Entrepreneurship
Book One 6
exert a significant influence upon the types of HRM practices selected (Baron et al.,
1999). The dominant values of an organization are expected to exert a direct and
indirect influence on knowledge processes. (Hayton & Macchitella, 2013).
Entrepreneurial Personality Characteristics
There are a lot of versions to describe characteristics associated with entrepreneurs.
John Kao (Kuratko & Hodgetts, 2007) proposed eleven common characteristics to
identify the entrepreneurial characteristics, such as: total commitment, determination
and perseverance; drive o achieve and grow; opportunity and goal orientation; taking
initiative and personal responsibility; persistent problem solving; realism and a sense of
humor; seeking and using feedback; internal locus of control; calculated risk taking and
risk seeking; low need for statuts and power; integrity and reliability. Hornaday (1982)
in his “Research about Living Entrepreneurs” (Kuratko & Hodgetts, 2007) found 42
characteristics often attributed to entrepreneurs, some of them are: confidence, creativity,
initiative, intelligence, flexibility, efficacy, commitment, and ability to take calculated
risks, etc.
Based on the article of Soo Ji Min in 1999 (Kuratko & Hodgetts, 2007), there are the
top ten of twenty-first century characteristics of entrepreneurs such as: recognize and
take advantage of opportunities; resourceful; creative; visionary; independent thinker;
hard worker; optimistic; innovator; risk taker; leader.
In this paper, the characteristics to define entrepreneurial personality are based on the
components studied by Razavi et al. (2012) whose definitions adapted to this research
topic and use other reference too. Those eight characteristics are:
1. Risk-Taking, in this paper considered as calculated risk taking, as the extent
to which a person takes the solving complex issues and offering a variety of
ways to reasonable risks and has the power to face great risks and problems.
The ‘risk’ term here is considered calculated and carefully thought-out
manner (Kuratko & Hodgetts, 2007).
2. Internal Locus of Control, as Kuratko & Hodgetts (2007), is the belief that
either success or failure of their business is not governed by fate, luck or
similar forces. It is about their accomplishments in controlling and
influencing their business’ outcomes after their actions.
3. Success-Seeking, as Razavi et al (2012) proposed it as an individual’s
motivation to succeed and try to achieve goals.
4. Expressiveness of thought: It is the amount of a person’s ability to convey
complex concepts. It is more clearly to be defined in term of communication
skill, used in sharing ideas or policy.
5. Pragmatism, Razavi et al (2012) stated this term as the extent to which an
individual cares about doing work and achieving results. Kuratko & Hodgetts
(2007) stated in other term with similar definition to it as “drive to achieve”
that appears to others to be internally driven by a strong desire to compete,
excel against self-imposed standards, pursue and attain challenging goals.
6. Tolerance of Ambiguity is defined as the extent to which a person
entrepreneurs’ personality characteristics to accept instability and change and
works in conditions of uncertainty and ambiguity (Razavi et al., 2012).
The First International Conference on Entrepreneurship
Book One 7
7. Dreaming is also characteristics attached to entrepreneur because it refers to
the amount of a person’s imagination of organization belief in working with
others to achieve the different issues and the power of mental imagery.
(Razavi et al., 2012). Later on, this term is more known as vision, to develop
over time as the individual begins to realize what the firm is and what it can
become (Kuratko & Hodgetts, 2007).
8. Challenge-seeking is defined as the amount of interest in taking challenges
and the ability to deal with difficult and complicated issues (Razavi et al.,
2012). It is similar to the opportunity orientation as they are goal oriented in
their pursuit of opportunities (Kuratko & Hodgetts, 2007). This situation will
challenge them to accomplish their dream, goal and desired-result.
However, to be an entrepreneur does not need any extraordinary talent. It needs some
skills such as initiative, imagination, a clear vision and confidence. Most entrepreneurs
want to make the world a more pleasant place to live. (Kume, et al., 2013)
Gender Issues in Entrepreneurial Characteristics
There are also some other important differences which distinguish women from men in
this profession. The following are the most dominant (Radović-Marković, 2009):
1. Women start businesses to accomplish flexibility, independence and to free
themselves from corporative boundaries. Besides that, many women look
for personal satisfaction through running a business independently, to create
space for advancing in a career, to create a safe future and the possibility of
a choice of life style and work style.
2. Women are often motivated to start their own business because of the
dissatisfaction with their status in their jobs.
3. More than half of women owners (53%) are guided by intuition when they
start and run a business, while men (71%) are guided only by logic.
4. Two thirds of women (60%) compared to male business owners, examine
all possibilities before they make a decision and start some action, gather
information from their consultants and entrepreneurial associations more
than men do, successfully weigh up every possibility and balance different
tasks and priorities as well. (Radović-Marković, 2013):
The paper of Radović-Marković (2009) elaborated some main issues in the literature of
female entrepreneurship. Future studies should follow the changes in the roles and tasks
of women as entrepreneurs as the main conductors of these activities, influenced by new
flows of economic operation in the age of globalization. That is, the recognition of the
capacity of women entrepreneurs in our global community is no longer a matter of
debate. (Radović-Marković, 2013).
Gender differences, for Spain case, in entrepreneurial intentions and agentic traits
frequently linked to entrepreneurship (locus of control, entrepreneurial self-efficacy,
risk-taking propensity, and proactiveness) were examined and the result showed gender
differences in entrepreneurial intention and entrepreneurial self-efficacy, in the sense
that men felt themselves more efficient and oriented to create a new venture than
women. Nevertheless, major area and age explained differences in the variables studied
better than gender. (Jose & Licciardello, 2012).
The First International Conference on Entrepreneurship
Book One 8
Relationship between Corporate Culture and Entrepreneurial Personal
Characteristics
In other words, there is no significant difference between employees’ viewpoints on
corporate entrepreneurship and organizational culture, in terms of gender. (Sepehri &
Khayati, 2013). Hian Chi Koo (1996) in Razavi et al. (2012) found that success-seeking,
internal locus of control, risk-taking, ambiguity tolerance, self-reliance and innovation
as factors to lead people get tendency to entrepreneurial activities.
Razavi et al (2012) in their study found the negative correlation between creative
innovation, cooperation and tolerance of creative talents the personality characteristics,
open communications and organizational risk-taking. The result also showed that the
criticism acceptance has no meaningful correlation to the personality characteristics.
But the other part of the result shows that organizational risk-taking and open
communication have positive correlation between organizational risk-taking and open
communication with the personality characteristics of the respondents, so they
recommended the institution to improve the communications and performance by
workshop to educate the skill of risk-taking tolerance, creating thought and so on.
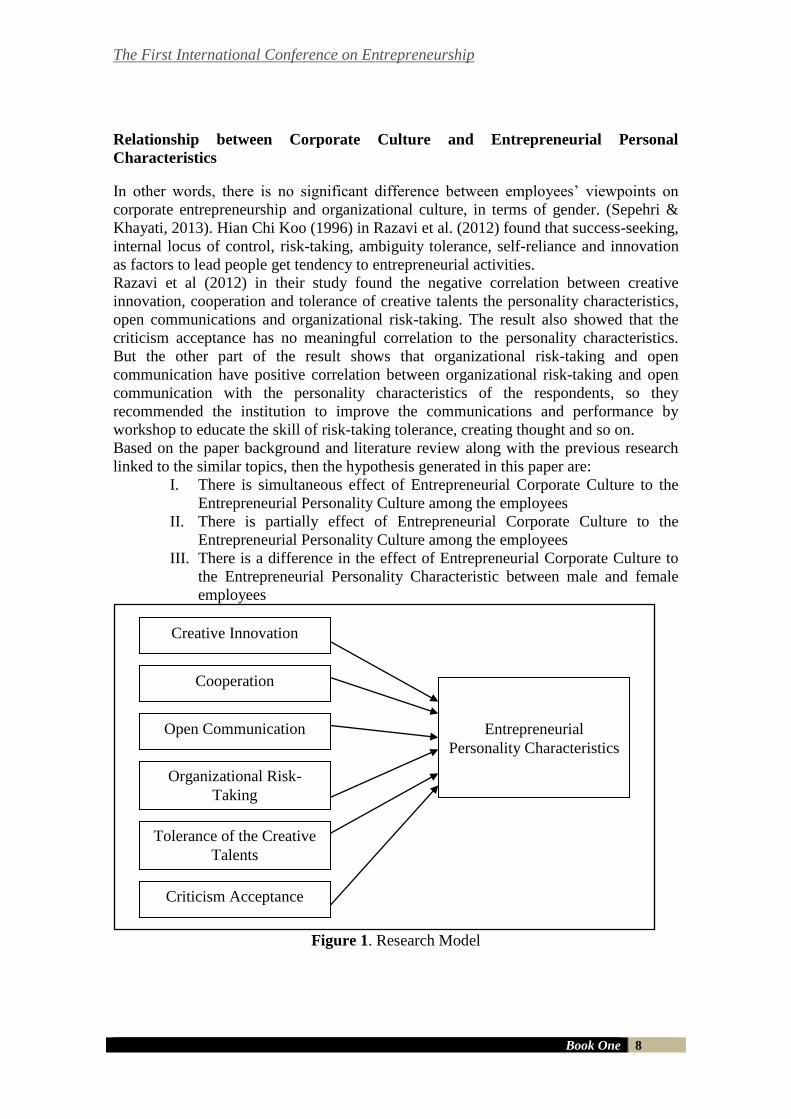
Based on the paper background and literature review along with the previous research
linked to the similar topics, then the hypothesis generated in this paper are:
I. There is simultaneous effect of Entrepreneurial Corporate Culture to the
Entrepreneurial Personality Culture among the employees
II. There is partially effect of Entrepreneurial Corporate Culture to the
Entrepreneurial Personality Culture among the employees
III. There is a difference in the effect of Entrepreneurial Corporate Culture to
the Entrepreneurial Personality Characteristic between male and female
employees
Figure 1. Research Model
Cooperation
Open Communication
Organizational Risk-
Taking
Tolerance of the Creative
Talents
Criticism Acceptance
Entrepreneurial
Personality Characteristics
Creative Innovation
The First International Conference on Entrepreneurship
Book One 9
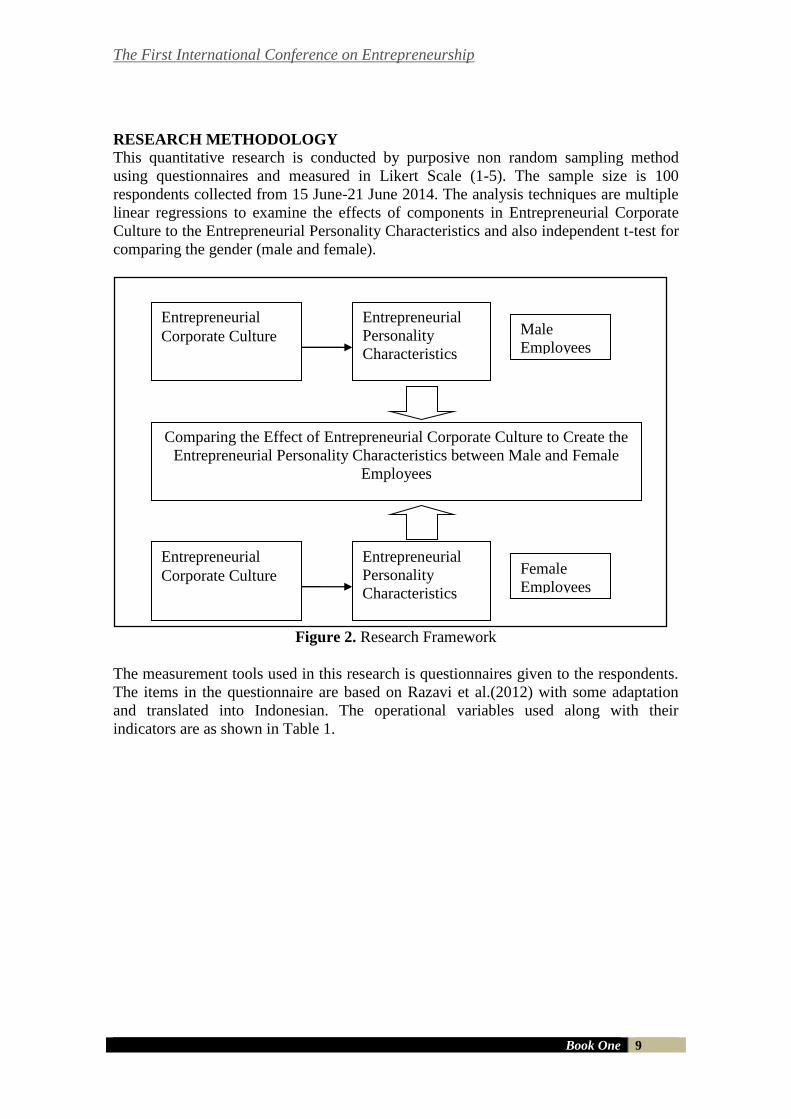
RESEARCH METHODOLOGY
This quantitative research is conducted by purposive non random sampling method
using questionnaires and measured in Likert Scale (1-5). The sample size is 100
respondents collected from 15 June-21 June 2014. The analysis techniques are multiple
linear regressions to examine the effects of components in Entrepreneurial Corporate
Culture to the Entrepreneurial Personality Characteristics and also independent t-test for
comparing the gender (male and female).
Figure 2. Research Framework
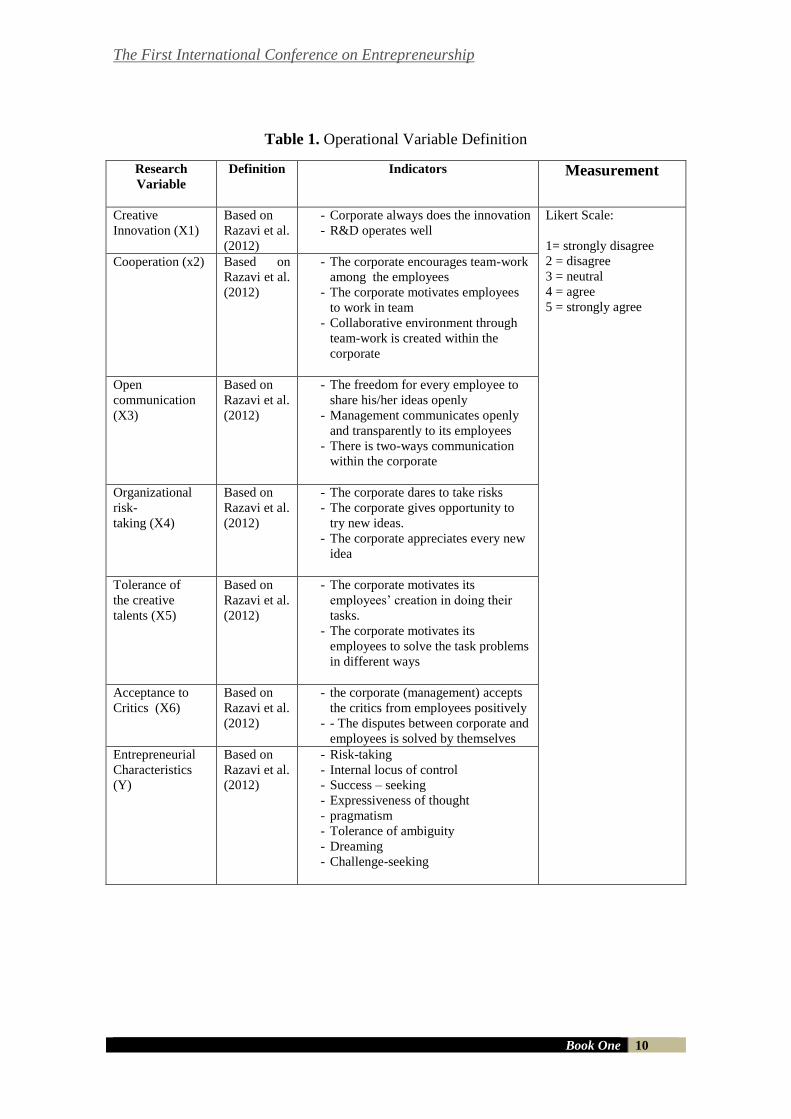
The measurement tools used in this research is questionnaires given to the respondents.
The items in the questionnaire are based on Razavi et al.(2012) with some adaptation
and translated into Indonesian. The operational variables used along with their
indicators are as shown in Table 1.
Entrepreneurial
Corporate Culture
Entrepreneurial
Personality
Characteristics
Female
Employees
Entrepreneurial
Corporate Culture
Entrepreneurial
Personality
Characteristics
Male
Employees
Comparing the Effect of Entrepreneurial Corporate Culture to Create the
Entrepreneurial Personality Characteristics between Male and Female
Employees
The First International Conference on Entrepreneurship
Book One 10
Table 1. Operational Variable Definition
Research
Variable
Definition Indicators Measurement
Creative
Innovation (X1)
Based on
Razavi et al.
(2012)
- Corporate always does the innovation
- R&D operates well
Likert Scale:
1= strongly disagree
2 = disagree
3 = neutral
4 = agree
5 = strongly agree
Cooperation (x2) Based on
Razavi et al.
(2012)
- The corporate encourages team-work
among the employees
- The corporate motivates employees
to work in team
- Collaborative environment through
team-work is created within the
corporate
Open
communication
(X3)
Based on
Razavi et al.
(2012)
- The freedom for every employee to
share his/her ideas openly
- Management communicates openly
and transparently to its employees
- There is two-ways communication
within the corporate
Organizational
risk-
taking (X4)
Based on
Razavi et al.
(2012)
- The corporate dares to take risks
- The corporate gives opportunity to
try new ideas.
- The corporate appreciates every new
idea
Tolerance of
the creative
talents (X5)
Based on
Razavi et al.
(2012)
- The corporate motivates its
employees’ creation in doing their
tasks.
- The corporate motivates its
employees to solve the task problems
in different ways
Acceptance to
Critics (X6)
Based on
Razavi et al.
(2012)
- the corporate (management) accepts
the critics from employees positively
- - The disputes between corporate and
employees is solved by themselves
Entrepreneurial
Characteristics
(Y)
Based on
Razavi et al.
(2012)
- Risk-taking
- Internal locus of control
- Success – seeking
- Expressiveness of thought
- pragmatism
- Tolerance of ambiguity
- Dreaming
- Challenge-seeking
The First International Conference on Entrepreneurship
Book One 11
FINDINGS
The respondents description in this study shows that from 100 respondents purposively
taken are 41% male and 59% female employees in many institutions/companies in
Surabaya. Most of them (54%) is 22-28 years old, 31% is 15-21 years old, 12% is 29-35
years old and only 2% aged 36-42 years old while only 1% above 42 years old. Among
the respondents only 12% is married and the rest 88% is single (not widowed/divorced).
Based on their job positions and tenures, 86% of respondents work in local private
company, 6% in State-owned companies (SOE companies) and 8% work in foreign
private companies in Surabaya. Their corporate/institutions have various number of
employees. Less than 50 employees is the most based on the respondents’ information
(45%). Only 17% of respondents work in companies employing more than 300 people,
23% ranged 51-100 employees and only 15% work in companies which employ 101-
300 people.
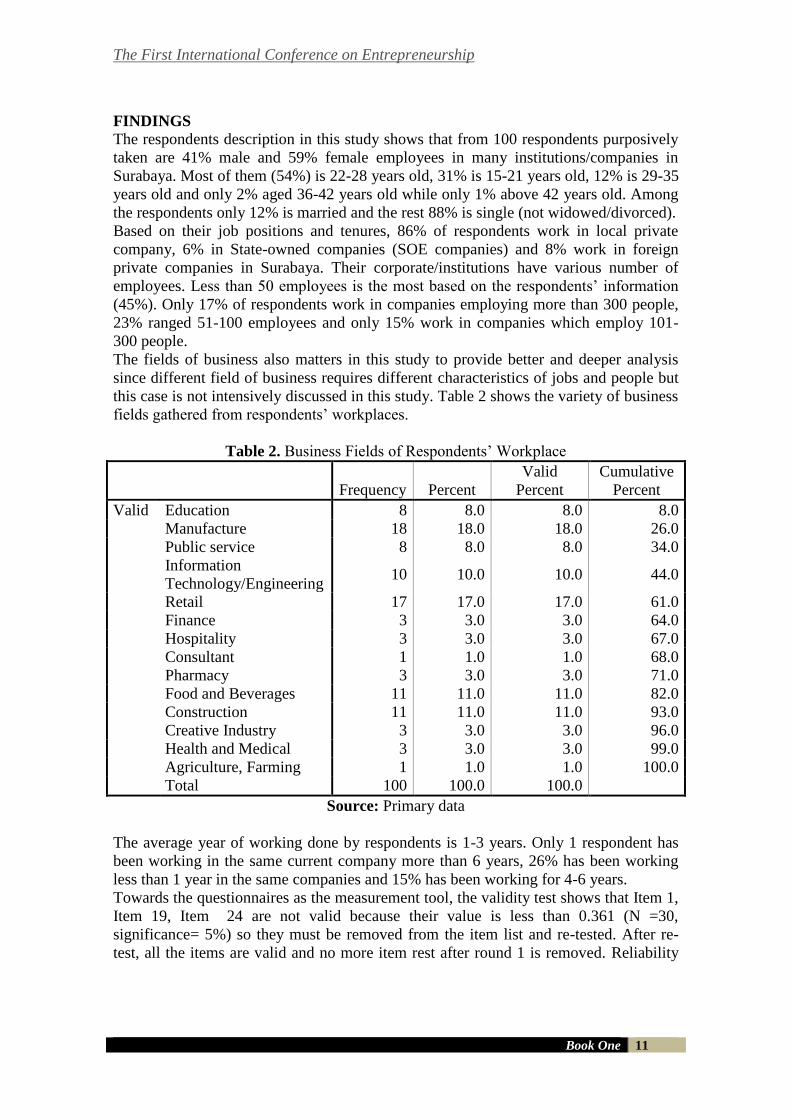
The fields of business also matters in this study to provide better and deeper analysis
since different field of business requires different characteristics of jobs and people but
this case is not intensively discussed in this study. Table 2 shows the variety of business
fields gathered from respondents’ workplaces.
Table 2. Business Fields of Respondents’ Workplace
Frequency Percent
Valid
Percent
Cumulative
Percent
Valid Education 8 8.0 8.0 8.0
Manufacture 18 18.0 18.0 26.0
Public service 8 8.0 8.0 34.0
Information
Technology/Engineering 10 10.0 10.0 44.0
Retail 17 17.0 17.0 61.0
Finance 3 3.0 3.0 64.0
Hospitality 3 3.0 3.0 67.0
Consultant 1 1.0 1.0 68.0
Pharmacy 3 3.0 3.0 71.0
Food and Beverages 11 11.0 11.0 82.0
Construction 11 11.0 11.0 93.0
Creative Industry 3 3.0 3.0 96.0
Health and Medical 3 3.0 3.0 99.0
Agriculture, Farming 1 1.0 1.0 100.0
Total 100 100.0 100.0
Source: Primary data
The average year of working done by respondents is 1-3 years. Only 1 respondent has
been working in the same current company more than 6 years, 26% has been working
less than 1 year in the same companies and 15% has been working for 4-6 years.
Towards the questionnaires as the measurement tool, the validity test shows that Item 1,
Item 19, Item 24 are not valid because their value is less than 0.361 (N =30,
significance= 5%) so they must be removed from the item list and re-tested. After re-
test, all the items are valid and no more item rest after round 1 is removed. Reliability
The First International Conference on Entrepreneurship
Book One 12
test to the items is done and the item 18 and item 20 must be removed and the other test
must be executed. The second round of reliability test shows that all rest items are
reliable after those two items removed. In the column “Corrected Item-Total
Correlation” all the items’ values are more than 0.361 (based on the r table for N =30,
and significance= 5%). The Cronbach’s Alpha value is 0.925 and it exceeds the
minimum value 0.6.
So, five statements in questionnaires must be deleted in prior to the process of linear
regression analysis, are “your workplace always does the product innovations”, “you do
your job with responsibility”, “You are driven to reach the target”, you don’t have
difficulties to explain and express your thoughts in your workplace”, “You have the
ideas about your company/institution’s future”. The last four statements refer to internal
locus of control, success-seeking, expressiveness of thought, and dreaming as the
indicators of entrepreneurial personality characteristics. Other indicators of this
dependent variable are measured by other five indicators: risk-taking, pragmatism,
tolerance of ambiguity and challenge-seeking.
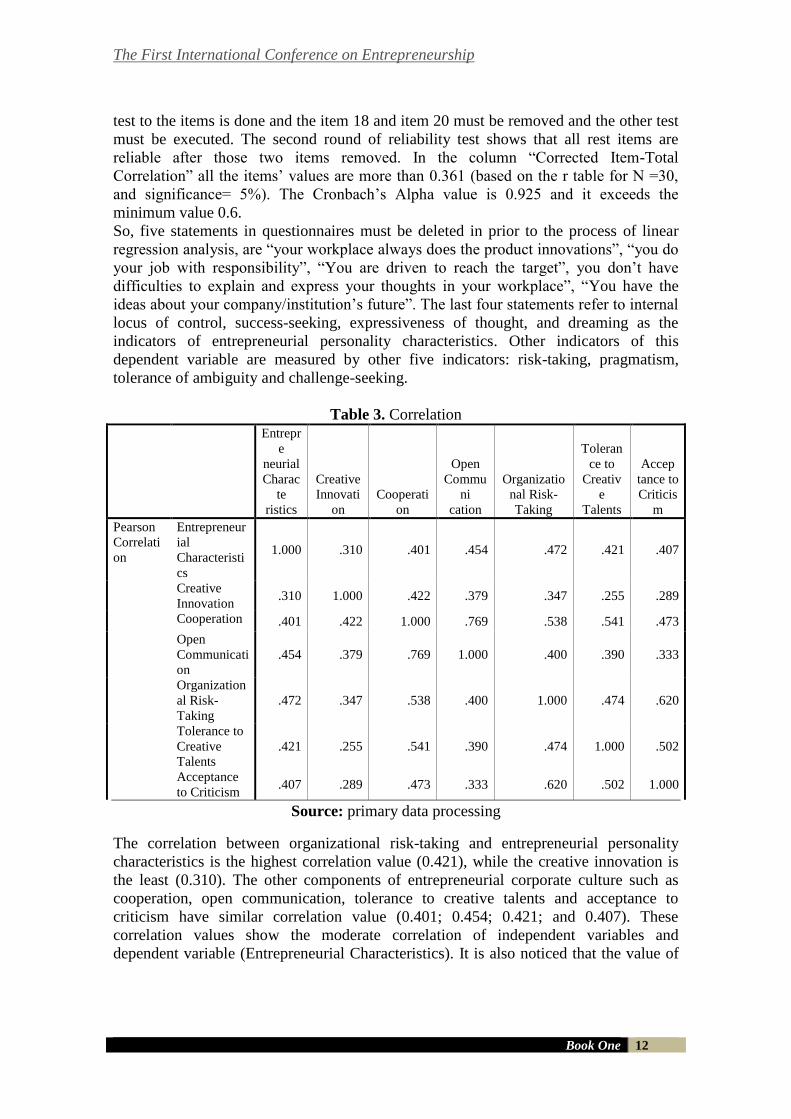
Table 3. Correlation
Entrepr
e
neurial
Charac
te
ristics
Creative
Innovati
on
Cooperati
on
Open
Commu
ni
cation
Organizatio
nal Risk-
Taking
Toleran
ce to
Creativ
e
Talents
Accep
tance to
Criticis
m
Pearson
Correlati
on
Entrepreneur
ial
Characteristi
cs
1.000 .310 .401 .454 .472 .421 .407
Creative
Innovation .310 1.000 .422 .379 .347 .255 .289
Cooperation .401 .422 1.000 .769 .538 .541 .473
Open
Communicati
on
.454 .379 .769 1.000 .400 .390 .333
Organization
al Risk-
Taking
.472 .347 .538 .400 1.000 .474 .620
Tolerance to
Creative
Talents
.421 .255 .541 .390 .474 1.000 .502
Acceptance
to Criticism .407 .289 .473 .333 .620 .502 1.000
Source: primary data processing
The correlation between organizational risk-taking and entrepreneurial personality
characteristics is the highest correlation value (0.421), while the creative innovation is
the least (0.310). The other components of entrepreneurial corporate culture such as
cooperation, open communication, tolerance to creative talents and acceptance to
criticism have similar correlation value (0.401; 0.454; 0.421; and 0.407). These
correlation values show the moderate correlation of independent variables and
dependent variable (Entrepreneurial Characteristics). It is also noticed that the value of
The First International Conference on Entrepreneurship
Book One 13
R2 is 0.354, means that the independent variables are not strong enough to influence the
dependent variable.
The low correlation value of creative innovation to the entrepreneurial characteristics
can be understood since most of respondents have been working 1-3 years in the same
(current) companies and their average age is ranging from 22-28 years old and still
single. In this age and marital status, most of them look for comfort when working.
They still strive to be themselves and less responsibility to family than older ages and
married people. The term creative innovation here refers to company’s culture to
innovate and use its R&D effectively. Seemingly, most employees do not pay intention
to R&D’s job.
However, all indicators of “organization risk-taking” are valid and reliable to be used in
the analysis and this variable is correlated to entrepreneurial personality characteristics
of the employees. Company welcomes new ideas from its employees and this attitude
towards new ideas correlates to entrepreneurial characteristic personality.
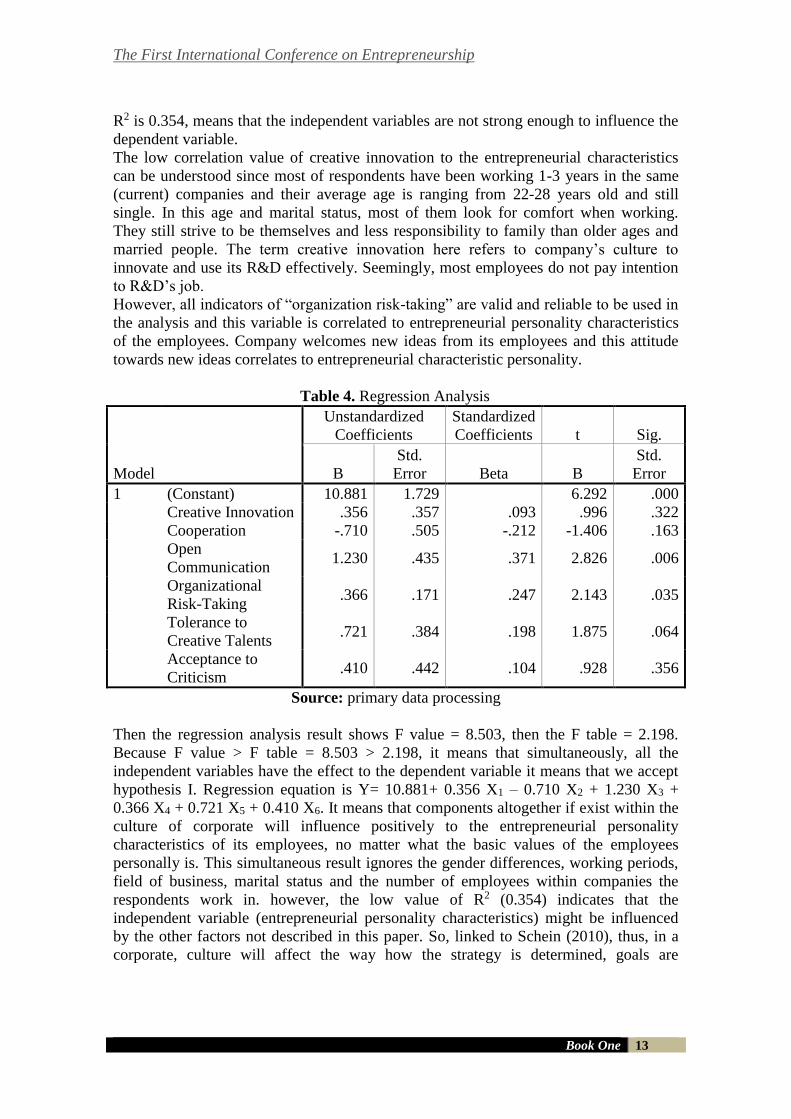
Table 4. Regression Analysis
Model
Unstandardized
Coefficients
Standardized
Coefficients t Sig.
B
Std.
Error Beta B
Std.
Error
1 (Constant) 10.881 1.729 6.292 .000
Creative Innovation .356 .357 .093 .996 .322
Cooperation -.710 .505 -.212 -1.406 .163
Open
Communication 1.230 .435 .371 2.826 .006
Organizational
Risk-Taking .366 .171 .247 2.143 .035
Tolerance to
Creative Talents .721 .384 .198 1.875 .064
Acceptance to
Criticism .410 .442 .104 .928 .356
Source: primary data processing
Then the regression analysis result shows F value = 8.503, then the F table = 2.198.
Because F value > F table = 8.503 > 2.198, it means that simultaneously, all the
independent variables have the effect to the dependent variable it means that we accept
hypothesis I. Regression equation is Y= 10.881+ 0.356 X1 – 0.710 X2 + 1.230 X3 +
0.366 X4 + 0.721 X5 + 0.410 X6. It means that components altogether if exist within the
culture of corporate will influence positively to the entrepreneurial personality
characteristics of its employees, no matter what the basic values of the employees
personally is. This simultaneous result ignores the gender differences, working periods,
field of business, marital status and the number of employees within companies the
respondents work in. however, the low value of R2 (0.354) indicates that the
independent variable (entrepreneurial personality characteristics) might be influenced
by the other factors not described in this paper. So, linked to Schein (2010), thus, in a
corporate, culture will affect the way how the strategy is determined, goals are
The First International Conference on Entrepreneurship
Book One 14
established and organization operates because it is a pattern of shared basic assumptions
that a group has learned as it solved its problems of external adaptation and internal
integrationand somehow, affecting the corporate ways in employer-employee
relationships and behaviour among employees.
The result of regression analysis shows that t test value = 6.292 and t table = 1.986.
Because t value > t table or 6.292 > 1.986, all the independent variables partially have
the effect to the dependent variable, so hypothesis II is accepted. But partially, it is
surprising that cooperation has the negative influence to the entrepreneurial personality
characteristics, and creative innovation is very low but positively effecting
entrepreneurial personality characteristics. It is oppositely to “tolerance to creative
talents” variable which effects the characteristic positively (highest value compared to
the other positive effects).
The negative effect of cooperation can be explained based on definition as the
teamwork dynamic and collaboration among employees within organization (Razavi et
al., 2012). The teamwork dynamic is not common for most of our respondents and
negatively considered as the barrier to compete with the other employees in the same
company. The basic culture of Indonesian people perhaps influences this result since the
high context culture will be not easily to be aggressive in team work. Marks et al (2001)
in Lepine (2008) argued that teams orchestrate interpersonal processes both during and
between episodes, so it needs the interpersonal skills of its members. It then also
depends on task interdependence proposed by Thompson (1967) as cited in Lepine
(2008) which stated that when task interdependence in a work unit is lower, members
work more independently, requisite interpersonal interaction is more limited and then
member contributions are pooled rather than integrated. Lepine et al. (2008) found that
task interdependence and team size affected relationships between teamwork processes
and performance. In terms of entrepreneurship, we more concern in being independent,
than it makes sense when cooperation and collaboration decrease the spirit of
entrepreneurship due to its interdependence.
Kimbrough & Componation (2009), in their study, combined a culture measurement
instrument with gauges of Enterprise Risk Management (ERM) implementation and the
result shows the correlation. They summarized that the organic cultures tend to make
greater progress in their ERM programs. The organization culture in this study refers to
how quickly the organization can react to market changes and whether or not the
organization can successfully steer major changes of its environment. Linking to
entrepreneurial corporate culture, Razavi et al. (2012) defined organizational risk-taking
for their study as the ability of the organization members to believe reasonable risk-
taking and learning from mistakes and even failures. The organization (this term is
always considered as corporate) which accustomed to react and be brave in taking risks
will influence their employees’ entrepreneurial personality and the result of this study
shows the positive influence. It means that the higher intensity of corporate in taking
risk in the management decisions towards the business environment, will bring
employees to be more ready and easily to react to any risks.
Creative innovation, defined as characterized by dynamic environment with its new
product or procedure or a new management strategy to an enterprise and tolerance to
creative talents, defined as supports that given to the creativity of the employees in
doing their tasks. (Razavi et al., 2012) are positively influence the entrepreneurial
The First International Conference on Entrepreneurship
Book One 15
personality. But technically, both components cannot be separated from open-minded
and informal culture. Open-mindedness and informal culture are supported by open
communication and acceptance to criticism as well within the organization. Supported
by Mars (2008), piazza corporate culture will support and encourage the innovation
among the employees. innovative culture is a way of thinking and behaving that creates,
develops and establishes values and attitudes within a firm that may require rising,
accepting, and supporting new ideas involving an improvement in the functioning and
management of the firm and feedback and praise from their supervisors motivate the
employees to be involved in creating their new way of work (Cakar & Erturk, 2010).
The low effect of creative innovation and the acceptance of talents could be due to the
field of business where the respondents work. Some of them do not require the rapid
innovation or multitalented employees such as banking/finance, construction and retail
because all jobs have standardized rule and procedures. But if both of them implied in
manufactures, services or creative industry only, the result must be different.
One thing to be noticed is that the highest effect to entrepreneurial personality is open
communication. Basic culture of population is high context and collectivism so that
every one needs communication with others and considered communication as best way
to solve problems, and could be understood by the range of ages the most respondents
are. Cakar & Erturk (2010) found that small firms have their managers more concerned
with and involved in the professional as well as personal lives of their subordinates and
this setting makes employees become more positive to the managers’ decisions on
innovations and increase their participation in the innovation process, relating this
finding to the respondents characteristics in this paper that most of them are in the
productive age, so they tend to ask for more information and be active in information
seeking by communicating more, and also, most respondents work in medium corporate
with less than 50 employees that brings easier condition to communicate and know each
other even with the superiors.
After answering two hypotheses regarding regression analysis, the other hypothesis is
answered using independent t-test to compare the entrepreneurial personality
characteristics between male and female employees. Based on respondent description
this study gets 47 males and 53 females to be analyzed.
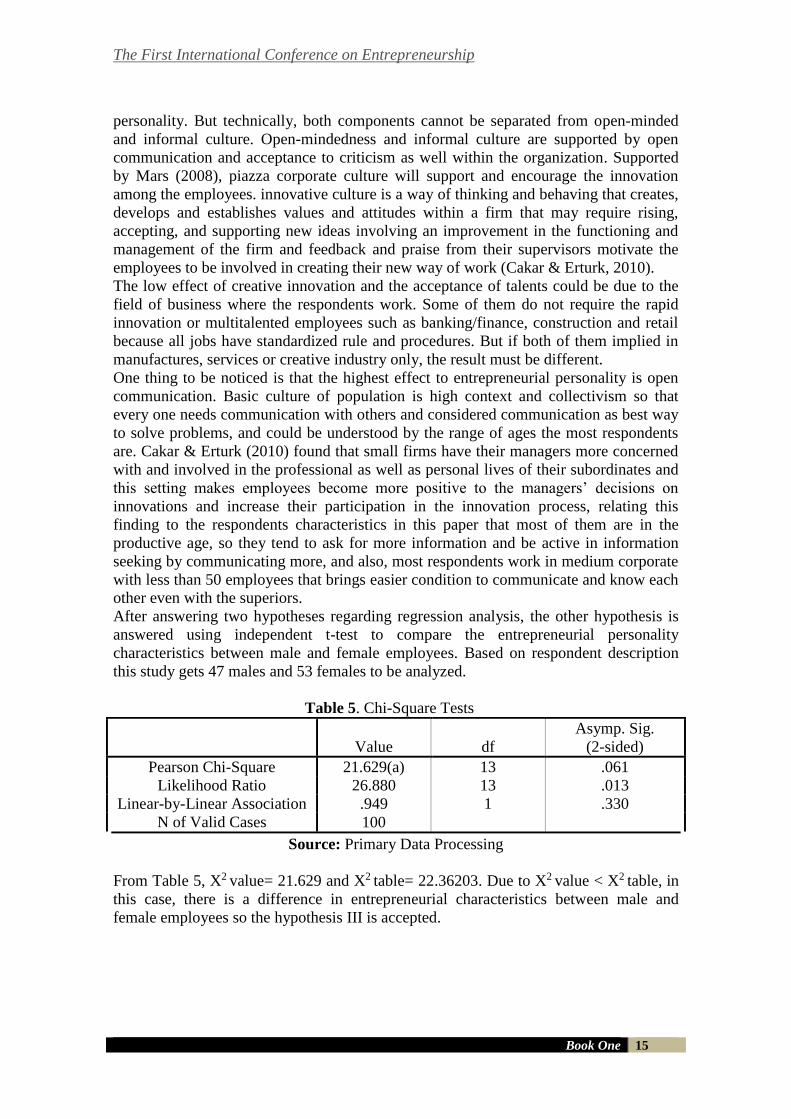
Table 5. Chi-Square Tests
Value df
Asymp. Sig.
(2-sided)
Pearson Chi-Square 21.629(a) 13 .061
Likelihood Ratio 26.880 13 .013
Linear-by-Linear Association .949 1 .330
N of Valid Cases 100
Source: Primary Data Processing
From Table 5, X2 value= 21.629 and X2 table= 22.36203. Due to X2 value < X2 table, in
this case, there is a difference in entrepreneurial characteristics between male and
female employees so the hypothesis III is accepted.
The First International Conference on Entrepreneurship
Book One 16
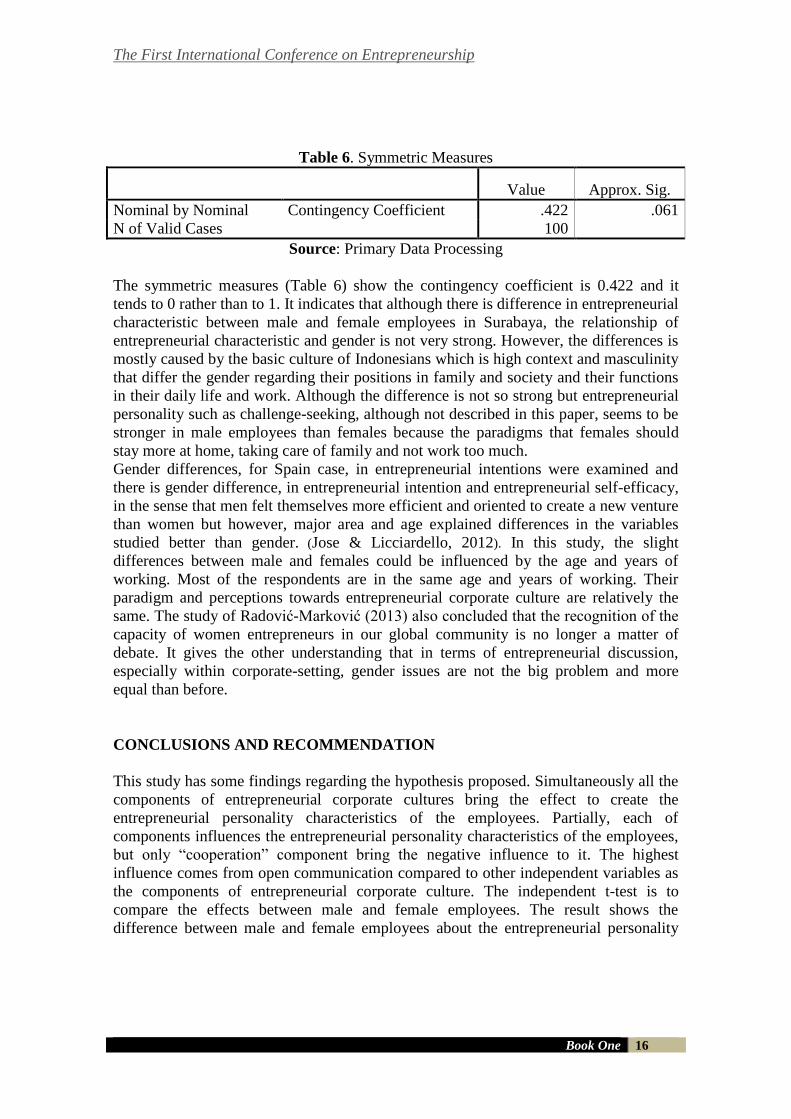
Table 6. Symmetric Measures
Value Approx. Sig.
Nominal by Nominal Contingency Coefficient .422 .061
N of Valid Cases 100
Source: Primary Data Processing
The symmetric measures (Table 6) show the contingency coefficient is 0.422 and it
tends to 0 rather than to 1. It indicates that although there is difference in entrepreneurial
characteristic between male and female employees in Surabaya, the relationship of
entrepreneurial characteristic and gender is not very strong. However, the differences is
mostly caused by the basic culture of Indonesians which is high context and masculinity
that differ the gender regarding their positions in family and society and their functions
in their daily life and work. Although the difference is not so strong but entrepreneurial
personality such as challenge-seeking, although not described in this paper, seems to be
stronger in male employees than females because the paradigms that females should
stay more at home, taking care of family and not work too much.
Gender differences, for Spain case, in entrepreneurial intentions were examined and
there is gender difference, in entrepreneurial intention and entrepreneurial self-efficacy,
in the sense that men felt themselves more efficient and oriented to create a new venture
than women but however, major area and age explained differences in the variables
studied better than gender. (Jose & Licciardello, 2012). In this study, the slight
differences between male and females could be influenced by the age and years of
working. Most of the respondents are in the same age and years of working. Their
paradigm and perceptions towards entrepreneurial corporate culture are relatively the
same. The study of Radović-Marković (2013) also concluded that the recognition of the
capacity of women entrepreneurs in our global community is no longer a matter of
debate. It gives the other understanding that in terms of entrepreneurial discussion,
especially within corporate-setting, gender issues are not the big problem and more
equal than before.
CONCLUSIONS AND RECOMMENDATION
This study has some findings regarding the hypothesis proposed. Simultaneously all the
components of entrepreneurial corporate cultures bring the effect to create the
entrepreneurial personality characteristics of the employees. Partially, each of
components influences the entrepreneurial personality characteristics of the employees,
but only “cooperation” component bring the negative influence to it. The highest
influence comes from open communication compared to other independent variables as
the components of entrepreneurial corporate culture. The independent t-test is to
compare the effects between male and female employees. The result shows the
difference between male and female employees about the entrepreneurial personality
The First International Conference on Entrepreneurship
Book One 17
characteristic affected by the entrepreneurial corporate culture. All hypothesis assumed
in this study are accepted and answered.
LIMITATION OF STUDY
This study has some limitations apart of the small number of respondents. This study
does not include the education background and positions of the respondents to support
the analysis. This study is also limited in analyzing data in terms of culture theories. In
the further study, the comparison based on gender must be deeper examined along with
the psychological theories to strengthen the personality differences.
It is also better if in the future study, the corporate analyzed has identically size, field of
business and ownership to be more focus in analysis, and if necessary to compare, it
should be three types of corporate or organizations, so the differences can be clearly
seen.
REFERENCES
Belousova, Olga. 2009. Factors Affecting Employees’ Intentions to and Adoption of
Entrepreneurial Behaviors: A Role for Entrepreneurial Orientation?. Proceeding of The
ESU Conference on Entrepreneurship, p.14
Cakar, Nigar Demircan & Alper Erturk. 2010. Comparing Innovation Capability of Small and
Medium-Sized Enterprises: Examining the Effects of Organizational Culture and
Empowerment. Journal of Small Business Management 2010 48 (3), pp. 325-359
Gathungu, James M, et al. 2014. Entrepreneurial Orientation, Networking, External
Environment, and Firm Performance: A Critical Literature Review. European Scientific
Journal, March 2014, Edition Vol. 10, No. 7.
Hayton, James & Ubaldo Macchitella. 2013. HRM, Organizational Culture and Entrepreneurial
Capabilities: The Role of Individual and Collective Knowledge Processes. ERC
Research Paper, No.5, June 2013. www.enterprisereseach.ac.uk.
Halim, Muhammad Abi Sofian Abdul, et al. 2013. Entrepreneurial Intentions As A Factor To
Job Performance in Public Organization. Global Advanced Research Journal of
Management and Business Studies (ISSN: 2315-5086) Vol. 2(6) pp. 349-355, June,
2013. Available online http://garj.org/garjmbs/index.htm. Copyright © 2013 Global
Advanced Research Journals
Jose, Sanchez, C. & Licciardello Orazio. 2012. Gender Differences and Attitudes in
Entrepreneurial Intentions: the Role of Career Choice. Journal of Women’s
Entrepreneurship and Education 2012, No. 1-2, 7-27.
Kimbrough, R.L & P.J. Componation. 2009. The Relationship Between Organizational Culture
and Enterprise Risk Management. Engineering ManagementJournal Vol. 21 No.2, June
2009.
The First International Conference on Entrepreneurship
Book One 18
Kume, Anisa, et al. 2013. Entrepreneurial Characteristics Amongst University Students in
Albania. European Scientific Journal, June 2013 Edition Vol. 9., No. 16.
Kuratko, Donald F & Richard M.Hodgetts. 2007. Entrepreneurship: Theory, Process, Practice.
7th Edition. Thomson.
LePine, Jeffery A., et al. 2008. A Meta-Analysis of Teamwork Processes: Tests of A
Multidimensional Model and Relationships with Team Effectiveness Criteria.
Personnel Psychology, 2008, 61, 273-307
Mars, Gerald. 2008. Corporate Cultures and the Use of Space: An Approach from Cultural
Theory. Innovation: the European Journal of Social Science Research. Vol. 21, No. 3,
September 2008, 185-204.
Morris, Michael H & Donald F. Kuratko. 2002. Corporate Entrepreneurship. 1st Edition.
Thomson: USA
Radović-Marković, Mirjana. 2013. Female Entrepreneurship: Theoretical Approaches. Journal
of Women’s Entrepreneurship and Education. No. 1-2, 1-9
Razavi, Seyed Mohammad Hosein, et al. 2012. Analysis of the Relationship Between
Entrepreneurial Organizational Culture & Personality Attributes of Sport Teachers:
Evidence from Mazandaran Province in Iran. Middle-East Journal of Scientific
Research 11 (2): 201-208, 2012, ISSN 1990-9233. IDOSI Publications
Schein, Edgar H. 2010. Organizational Culture and Leadership.(4th Edition). San Francisco:
Jossey-Bass
Sepehri, Somayyeh & Emad Khayati. 2013. The Relationship between Organizational Culture
and Corporate Entrepreneurship in Food and Beverage Industries. Asian Journal of
Management Sciences and Education. Vol. 2 no. 3, July 2013
Shihab, Muchsin Saggaff, et al. 2011. Relationship between Organisational Culture and
Entrepreneurial Orientation: Indonesian SMEs Context. 2nd International Conference
on Business, Economics and Tourism Management IPEDR vol.24 (2011) © (2011)
IACSIT Press, Singapore
The First International Conference on Entrepreneurship
Book One 19
COINTEGRATION OF INDONESIA’S STOCK MARKET AND
AMERICA AT THE PERIOD OF AND RECOVERY FROM
GLOBAL FINANCIAL CRISIS
Ristanti Akseptori1, Marya Mujayana2
STMIK STIKOM
SURABAYA, INDONESIA.
E-mails: [email protected], [email protected]
ABSTRACT This study aims to investigate the integration of capital market of Indonesia and
America as a result of the global financial crisis. Indonesia capital market is
represented by the Composite Stock Price Index, while the American stock
market is represented by the S&P500. In addition to the influence of foreign
capital market condition, (S&P500) as the external factor of country’s economy,
the Indonesia capital market is influenced by economic conditions in the
country, including the exchange rate and foreign transaction (net foreign flow).
External and internal factors can affect the stability of the financial system of a
country. To find the integration of world capital markets and Indonesia
financial system stability due to the global financial crisis, this study was
conducted in two periods, they are the period of global financial crisis (July
2007-December 2010) and the period of recovery after global financial crisis
(January 2011- December 2013).
This study used a quantitative approach using the Johansen Cointegration Test.
Monthly data were analyzed using the method of Ordinary Least Square (OLS).
The result of this study showed that there is no cointegration between Jakarta
Composite Index and S&P500 in the period of crisis and recovery. It means
there is short term relationship. This prove showed that there is integration
between Jakarta Composite Index and S&P500. When there is collapse in
S&P500, so did the Indonesia stock market. While internal factors, net foreign
flow, showed the stability in the long relationship to the Indonesia Stock Market.
Keywords: Integration, Stock Market, Cointegration Test, Global
Financial Crisis.
INTRODUCTION Capital market has a role as a source of long-term financing for corporations and
investors. Integrated world capital markets will provide opportunities for companies and
investors to raise capital efficiently. Investors can make investments with broader
diversification (not only between industries, but also between countries). The capital
costs which are borne by the investor gets smaller, so the investment gets more
profitable. Thus, there are more investments done so that creates greater employment.
Integrated capital markets are geared to achieve the most optimal level of functionality
that supports the achievement level of welfare between countries. Thereby it increases
The First International Conference on Entrepreneurship
Book One 20
economic development in many countries.
World capital market activity must be influenced by conditions that occur in the world.
Instability from the crisis could lead to high costs of economic, politic, and social.
Stability of the financial system of a country is influenced by external and internal
factors. Trihadmini (2011) mentions that the external factor could be the world liquidity
shock that encourages the flow into or out of capital in the short term, the global
financial instability and the contagion effect. While internal factors may include interest
rates, exchange rates, inflation, and high dependence on banks. External conditions such
as the global crisis in 2007 proved that the activity of the world stock market is severe
affected. Bloomberg Database (2008) reported that from 25 July 2007 until 31
December 2008, a decrease in the S&P 500 is 40.50%. FTSE100 (UK stock market
index) fell by 31.30%, the Nikkei 225 (Japan stock market index) plunged by 50.39%,
the KLSE (Malaysia stock market index) fell by 36.45%, and the Jakarta Composite
Index fell by 43.39%. This proves how external conditions affect the country's economy
activities of the country.
The integration of world capital markets is a topic that has been studied since the world
stock market crash in October 1987. Preliminary studies carried out on the stock market
were developed by countries like the United States, European countries, Japan. After the
Asian crisis, many studies began to focus their research on the emerging markets of
Asia. With the background of the global financial crisis, previous research concerning
the integration of America with the Malaysian stock market has been studied by Khalifa
and Gallato (2012). The findings showed that when the American stock market
collapsed, so did the Malaysian stock market, but the exchange rate (forex) as a
country's macroeconomic variables, did not significantly affect the Malaysian stock
market during the global financial crisis. This finding proves the existence of a country's
capital market integration with other countries, while the domestic capital market
conditions are formed as a result of macro-economic aggregates.
This study focuses on the integration of capital markets of Indonesia and America as the
country of the crisis origin to determine how much Indonesia is affected by the crisis
shock. In addition, macro-economic variables such as exchange rate and foreign
transaction are considered as variables to determine the resilience of the domestic
capital market conditions. This research was carried out using Johansen Cointegration
Test in two periods, namely the period of the global crisis and the recovery from the
crisis.
CONTEXT AND REVIEW OF LITERATURE
Capital Market Integration
Integrated international capital market is a condition in which there are no barriers
whatsoever to have any securities in the capital markets, and also there are no obstacles
in the capital inflow/outflow). In this case, the stability of the world financial system
needs to be in good shape to be able to support the smooth capital inflow/outflow. The
presence of shock that occurs in the world's financial system can have an impact on the
capital inflow/outflow. The occurrence of shock can lead to negative market sentiment,
the condition in which many investors withdraw their funds in the stock market due to
the concerns about the security of their investment. In an integrated market, the
breakdown of the capital inflow/outflow in a market can impact the overall market
The First International Conference on Entrepreneurship
Book One 21
conditions. This occurs in the period of the global crisis 2008, where the American
financial system crash impact capital inflow/outflow to other countries such as Britain,
Japan, Malaysia, Indonesia, etc. This is proved from the decrease of stock index
movements in the stock market. The results of the research supporting this analysis is
Koh and Mayasami (1996) using a trivariate vector error-correlation model (VECM) on
the effect of the global market shares of the cointegration in the Singapore Stock
Exchange, that at the level of the market, America, Japan and Singapore are
significantly cointegrated in positive.
Study on integration of stock exchanges in Jakarta, Kuala Lumpur, Manila, Singapore
and Bangkok was conducted by Kiang-Ping et al (2003) using monthly data from 1998
to 2002. Conclusion of the results of study suggests that there is a common force that
drives the stock market of five ASEAN countries which are moving together in the long
term, mutually dependent (interdependent) and highly integrated and will move as part
of integrated market.
Johansen Cointegration Test
Mobarek states several tests which can be used to test the integration of the stock
markets are multivariate GARCH, vector auto regression (VAR), Unit root test, and
various cointegration tests. Johansen Cointegration Test is used to look at the long term
relationship of the variables under study so that the estimation of this research can be
used to look at the long-term equilibrium relationship of the two variables studied. The
two variables which are not stationary before differenced but stationary at first
difference, it is possible for cointegration (there is a long-term relationship between the
two). Cointegration hypothesis is widely used by researchers to test the integration of
international financial markets. Bekaert and Harvey (1995) emphasizes that a stock
market is integrated with the world stock market if the asset has a value corresponding
to the expected return of asset markets that have the identical level of risk that is listed
in the world market. In this case, it is applied the law of one price. The nature and
degree of integration of financial markets are very helpful for international investors in
influencing the decision of potential asset allocation on portfolio diversification. Majid
and Kassim (2009) explored the standard time series vector autoregressive technique to
determine whether cross-market relations of Indonesia and Malaysia stock market
change in the period of before and during the crisis. Research results support the general
view that the stock market tends to show a greater degree of integration or co-movement
increased during periods of crisis.
Research Framework Capital market integration is a relationship between two or more capital markets of
countries. If one market is experiencing shocks, such as a change in the stock price
index, it will give effect in the long term as well as short-term on capital markets on
integrated country. Its effects can be positive or negative. If there is capital market
integration, the results of the analysis will show a trend of increase or decrease with the
same for each country. The integration of capital markets provides an opportunity for
investors to make a profit, which in turn boost the economy of the countries. However,
the integration of capital markets can overwhelm the fragile capital markets. This occurs
The First International Conference on Entrepreneurship
Book One 22
because the capital markets are susceptible easily affected by capital market volatility
that occurred in other countries. Investors become reluctant to invest in a volatile market.
METHOD This study is a descriptive and conclusive study. Dependent variable in this study is
Jakarta Composite Index (www.finance.yahoo.com), while the independent variables
are the S&P500 (www.finance.yahoo.com), exchange rate (www.bi.go.id), and foreign
transactions (www .idx.co.id). The data analyzed is quantitative data analysis. The
period of study was divided into two, namely the global crisis period (July 2007-
December 2010) and the period of recovery from global financial crisis (January 2011-
December 2013).
The first step is to test the classical assumptions (normality, multicolinearity,
autocorrelation, and heteroskedastisitas) to ensure that the data used meet assumptions
of classical test. The next is to determine the stationary of data by conducting unit root
test to determine the degree of stationary of the variables used in the study. Unit root
test is done using Augmented Dickey Fuller test (ADF). Furthermore, partial
cointegration test is done between the independent variables (one by one) and the
dependent variable to determine the possibility of a long-term relationship between the
variables. In this study, it is conducted by the Johansen Cointegration Test. Basic
operational model for this study is:
JCI = α0 + α 1GSPC + α2kurs + α3NF + ε.......... (1)
Where JCI is a monthly index of stock price index (Composite Stock Price Index) in
Indonesia Stock Exchange, GSPC is S&P500 as one of the American stock index, kurs
is the exchange rate, and NF is foreign transaction or Nett Foreign Flow/buy-sell). Tests
were carried out using Eviews 4.
FINDINGS
Classical Test Assumptions
a. Normality Test
Normality test is done by Jarque-Berra testing. The results show that in the period of
July 2007-December 2010 and January 2011 – December 2013, research variables are
normally distributed with Jarque-Berra value greater than 0.05.
Table 1. Normality Test Result Period Dependent
Variable
Independent
Variable
Jarque
Berra
Probability Conclusion
July2007-Dec2010 JCI GSPC, kurs, NF 4.4236 0.109503 Normal
Distribution
Jan2011-Dec2013 JCI GSPC, kurs, NF 0.766107 0.681776 Normal
Distribution
The First International Conference on Entrepreneurship
Book One 23
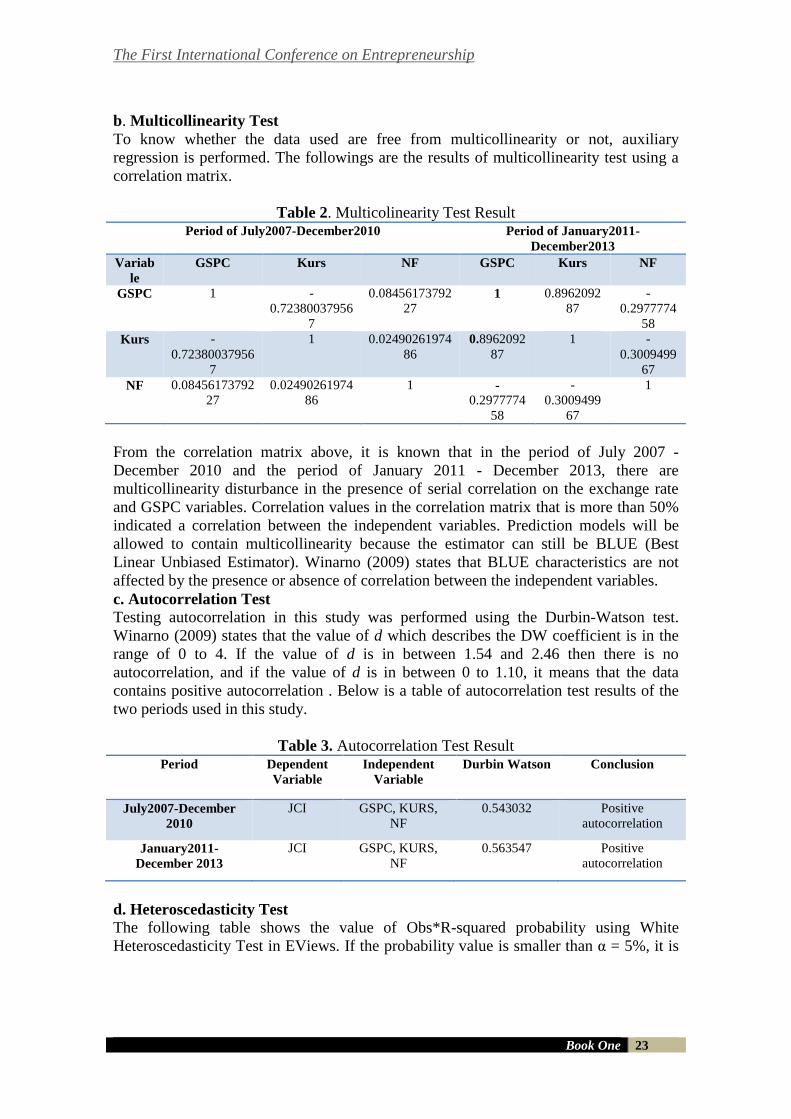
b. Multicollinearity Test
To know whether the data used are free from multicollinearity or not, auxiliary
regression is performed. The followings are the results of multicollinearity test using a
correlation matrix.
Table 2. Multicolinearity Test Result Period of July2007-December2010 Period of January2011-
December2013
Variab
le
GSPC Kurs NF GSPC Kurs NF
GSPC 1 -
0.72380037956
7
0.08456173792
27 1 0.8962092
87
-
0.2977774
58
Kurs -
0.72380037956
7
1 0.02490261974
86
0.8962092
87
1 -
0.3009499
67
NF 0.08456173792
27
0.02490261974
86
1 -
0.2977774
58
-
0.3009499
67
1
From the correlation matrix above, it is known that in the period of July 2007 -
December 2010 and the period of January 2011 - December 2013, there are
multicollinearity disturbance in the presence of serial correlation on the exchange rate
and GSPC variables. Correlation values in the correlation matrix that is more than 50%
indicated a correlation between the independent variables. Prediction models will be
allowed to contain multicollinearity because the estimator can still be BLUE (Best
Linear Unbiased Estimator). Winarno (2009) states that BLUE characteristics are not
affected by the presence or absence of correlation between the independent variables.
c. Autocorrelation Test Testing autocorrelation in this study was performed using the Durbin-Watson test.
Winarno (2009) states that the value of d which describes the DW coefficient is in the
range of 0 to 4. If the value of d is in between 1.54 and 2.46 then there is no
autocorrelation, and if the value of d is in between 0 to 1.10, it means that the data
contains positive autocorrelation . Below is a table of autocorrelation test results of the
two periods used in this study.
Table 3. Autocorrelation Test Result Period Dependent
Variable
Independent
Variable
Durbin Watson Conclusion
July2007-December
2010
JCI GSPC, KURS,
NF
0.543032 Positive
autocorrelation
January2011-
December 2013
JCI GSPC, KURS,
NF
0.563547 Positive
autocorrelation
d. Heteroscedasticity Test The following table shows the value of Obs*R-squared probability using White
Heteroscedasticity Test in EViews. If the probability value is smaller than α = 5%, it is
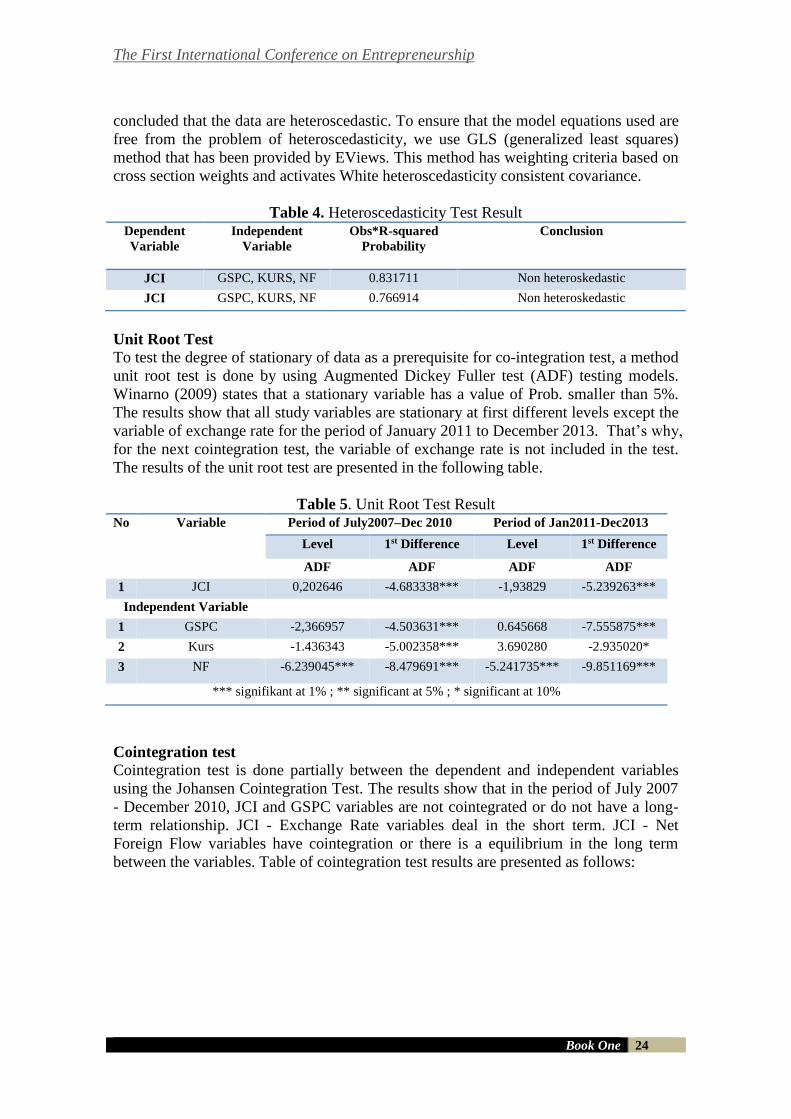
The First International Conference on Entrepreneurship
Book One 24
concluded that the data are heteroscedastic. To ensure that the model equations used are
free from the problem of heteroscedasticity, we use GLS (generalized least squares)
method that has been provided by EViews. This method has weighting criteria based on
cross section weights and activates White heteroscedasticity consistent covariance.
Table 4. Heteroscedasticity Test Result Dependent
Variable
Independent
Variable
Obs*R-squared
Probability
Conclusion
JCI GSPC, KURS, NF 0.831711 Non heteroskedastic
JCI GSPC, KURS, NF 0.766914 Non heteroskedastic
Unit Root Test
To test the degree of stationary of data as a prerequisite for co-integration test, a method
unit root test is done by using Augmented Dickey Fuller test (ADF) testing models.
Winarno (2009) states that a stationary variable has a value of Prob. smaller than 5%.
The results show that all study variables are stationary at first different levels except the
variable of exchange rate for the period of January 2011 to December 2013. That’s why,
for the next cointegration test, the variable of exchange rate is not included in the test.
The results of the unit root test are presented in the following table.
Table 5. Unit Root Test Result No Variable Period of July2007–Dec 2010 Period of Jan2011-Dec2013
Level 1st Difference Level 1st Difference
ADF ADF ADF ADF
1 JCI 0,202646 -4.683338*** -1,93829 -5.239263***
Independent Variable
1 GSPC -2,366957 -4.503631*** 0.645668 -7.555875***
2 Kurs -1.436343 -5.002358*** 3.690280 -2.935020*
3 NF -6.239045*** -8.479691*** -5.241735*** -9.851169***
*** signifikant at 1% ; ** significant at 5% ; * significant at 10%
Cointegration test Cointegration test is done partially between the dependent and independent variables
using the Johansen Cointegration Test. The results show that in the period of July 2007
- December 2010, JCI and GSPC variables are not cointegrated or do not have a long-
term relationship. JCI - Exchange Rate variables deal in the short term. JCI - Net
Foreign Flow variables have cointegration or there is a equilibrium in the long term
between the variables. Table of cointegration test results are presented as follows:
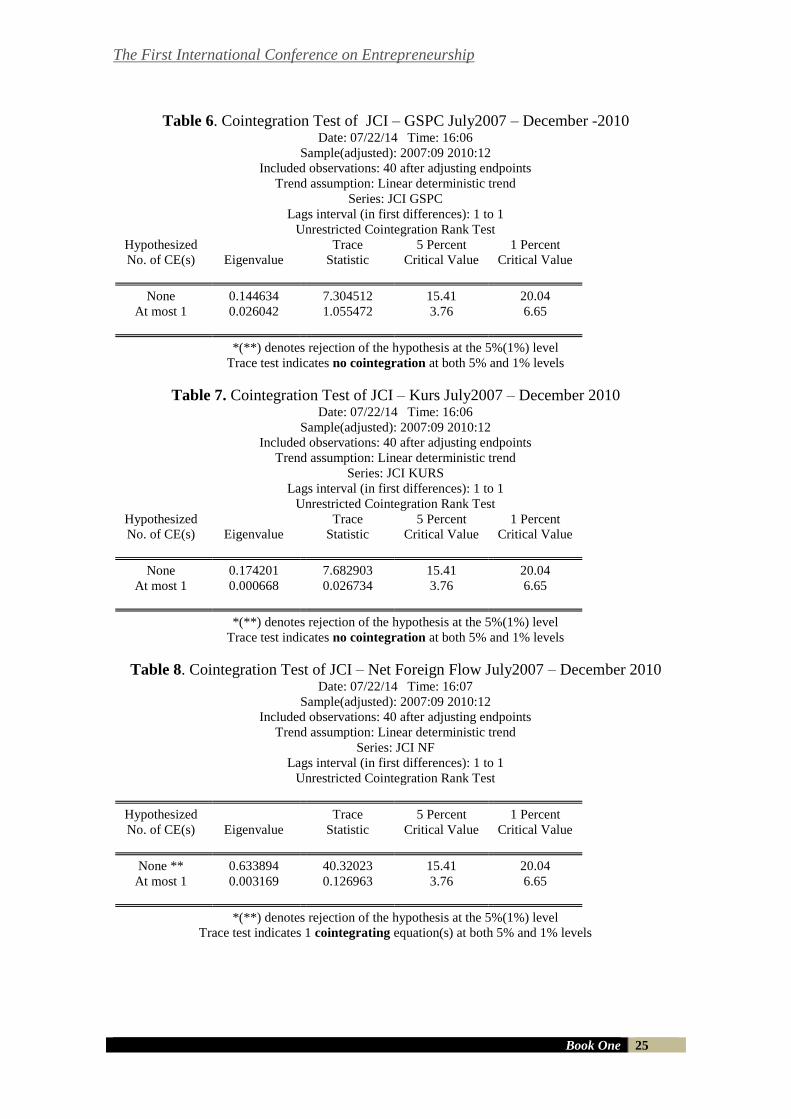
The First International Conference on Entrepreneurship
Book One 25
Table 6. Cointegration Test of JCI – GSPC July2007 – December -2010 Date: 07/22/14 Time: 16:06
Sample(adjusted): 2007:09 2010:12
Included observations: 40 after adjusting endpoints
Trend assumption: Linear deterministic trend
Series: JCI GSPC
Lags interval (in first differences): 1 to 1
Unrestricted Cointegration Rank Test
Hypothesized Trace 5 Percent 1 Percent
No. of CE(s) Eigenvalue Statistic Critical Value Critical Value
None 0.144634 7.304512 15.41 20.04
At most 1 0.026042 1.055472 3.76 6.65
*(**) denotes rejection of the hypothesis at the 5%(1%) level
Trace test indicates no cointegration at both 5% and 1% levels
Table 7. Cointegration Test of JCI – Kurs July2007 – December 2010 Date: 07/22/14 Time: 16:06
Sample(adjusted): 2007:09 2010:12
Included observations: 40 after adjusting endpoints
Trend assumption: Linear deterministic trend
Series: JCI KURS
Lags interval (in first differences): 1 to 1
Unrestricted Cointegration Rank Test
Hypothesized Trace 5 Percent 1 Percent
No. of CE(s) Eigenvalue Statistic Critical Value Critical Value
None 0.174201 7.682903 15.41 20.04
At most 1 0.000668 0.026734 3.76 6.65
*(**) denotes rejection of the hypothesis at the 5%(1%) level
Trace test indicates no cointegration at both 5% and 1% levels
Table 8. Cointegration Test of JCI – Net Foreign Flow July2007 – December 2010 Date: 07/22/14 Time: 16:07
Sample(adjusted): 2007:09 2010:12
Included observations: 40 after adjusting endpoints
Trend assumption: Linear deterministic trend
Series: JCI NF
Lags interval (in first differences): 1 to 1
Unrestricted Cointegration Rank Test
Hypothesized Trace 5 Percent 1 Percent
No. of CE(s) Eigenvalue Statistic Critical Value Critical Value
None ** 0.633894 40.32023 15.41 20.04
At most 1 0.003169 0.126963 3.76 6.65
*(**) denotes rejection of the hypothesis at the 5%(1%) level
Trace test indicates 1 cointegrating equation(s) at both 5% and 1% levels
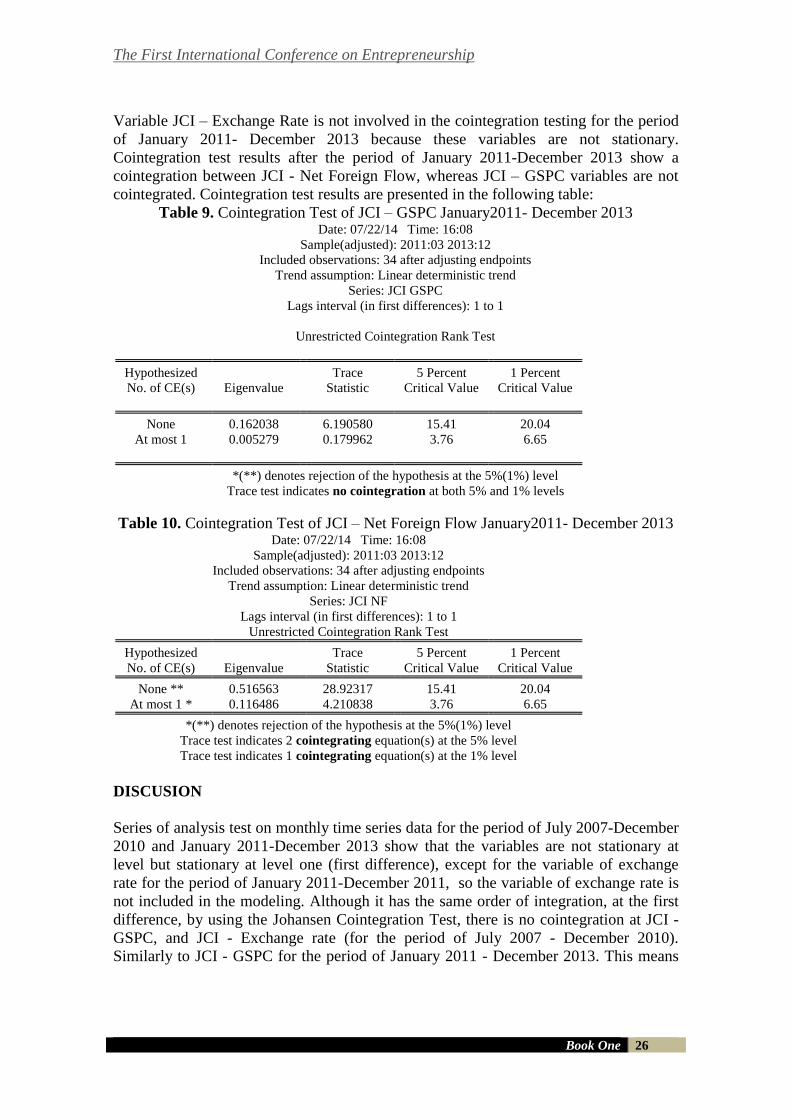
The First International Conference on Entrepreneurship
Book One 26
Variable JCI – Exchange Rate is not involved in the cointegration testing for the period
of January 2011- December 2013 because these variables are not stationary.
Cointegration test results after the period of January 2011-December 2013 show a
cointegration between JCI - Net Foreign Flow, whereas JCI – GSPC variables are not
cointegrated. Cointegration test results are presented in the following table:
Table 9. Cointegration Test of JCI – GSPC January2011- December 2013 Date: 07/22/14 Time: 16:08
Sample(adjusted): 2011:03 2013:12
Included observations: 34 after adjusting endpoints
Trend assumption: Linear deterministic trend
Series: JCI GSPC
Lags interval (in first differences): 1 to 1
Unrestricted Cointegration Rank Test
Hypothesized Trace 5 Percent 1 Percent
No. of CE(s) Eigenvalue Statistic Critical Value Critical Value
None 0.162038 6.190580 15.41 20.04
At most 1 0.005279 0.179962 3.76 6.65
*(**) denotes rejection of the hypothesis at the 5%(1%) level
Trace test indicates no cointegration at both 5% and 1% levels
Table 10. Cointegration Test of JCI – Net Foreign Flow January2011- December 2013 Date: 07/22/14 Time: 16:08
Sample(adjusted): 2011:03 2013:12
Included observations: 34 after adjusting endpoints
Trend assumption: Linear deterministic trend
Series: JCI NF
Lags interval (in first differences): 1 to 1
Unrestricted Cointegration Rank Test
Hypothesized Trace 5 Percent 1 Percent
No. of CE(s) Eigenvalue Statistic Critical Value Critical Value
None ** 0.516563 28.92317 15.41 20.04
At most 1 * 0.116486 4.210838 3.76 6.65
*(**) denotes rejection of the hypothesis at the 5%(1%) level
Trace test indicates 2 cointegrating equation(s) at the 5% level
Trace test indicates 1 cointegrating equation(s) at the 1% level
DISCUSION
Series of analysis test on monthly time series data for the period of July 2007-December
2010 and January 2011-December 2013 show that the variables are not stationary at
level but stationary at level one (first difference), except for the variable of exchange
rate for the period of January 2011-December 2011, so the variable of exchange rate is
not included in the modeling. Although it has the same order of integration, at the first
difference, by using the Johansen Cointegration Test, there is no cointegration at JCI -
GSPC, and JCI - Exchange rate (for the period of July 2007 - December 2010).
Similarly to JCI - GSPC for the period of January 2011 - December 2013. This means
The First International Conference on Entrepreneurship
Book One 27
that there is no equilibrium in the long-term on the variable relationship of JCI - GSPC
and JCI - Exchange in the period of July 2007 - December 2010, JCI - GSPC January
2011- December 2013. Cointegration relationships found in JCI - Net Foreign Flow in
two periods of the study. It is claimed that there is equilibrium in the long-term in the
relation of JCI-Net Foreign Flow in the period of crisis and the recovery from the crisis.
The absence of long-term equilibrium in the relationship between JCI - GSPC in the
period of crisis and the recovery period show that the Indonesian capital market
conditions are affected quite strongly due to shock at the S&P500 stock market. This is
indicated by the movement in the short-term due to the shock that occurs. This proves
that Indonesian capital markets are in a vulnerable position. If the Indonesian capital
market is quite strong to face the shock, long-term equilibrium relationship is still
occurs. Unfortunately this is not happen to JCI in the period of crisis and recovery
period.
The vulnerability of Indonesian capital market condition is possible because the
transaction occurred in the Indonesian capital market is dominated by foreign investors.
www.datacon.co.id reported that realization of foreign direct investment projects in
Indonesia has increased since 2007, foreign investment realization has decreased due to
the global financial crisis on 2009, in 2010 foreign investment into Indonesia increased
with the increasing of Indonesia's economic growth that reach 6,3%. Nurhayati (2012)
states that registered foreign investors hold about 60% of the total market capitalization.
If there is a negative sentiment towards the market, where the investors withdrew their
funds, then there is a crash by significant decrease in Composite Stock Price Index.
There is a large capital outflow and also will affect Indonesia's balance of payments.
Capital market conditions that are vulnerable in the capital market integration can sink
the stock market itself. In this case, the concern is the investors are reluctant to invest.
CONCLUSION
Based on the Johansen Cointegration test, it is concluded that there is no cointegration
at JCI-GSPC relationship at the period of crisis and recovery periods, and the
relationship of JCI- exchange rate at the period of crisis. Cointegration relationships
found in JCI-Net Foreign Flow in the two periods studied. These results indicate that the
Indonesian capital market is not strong enough to face the shock of S&P500 as a result
of the global financial crisis. While net foreign flow as macroeconomic variable, does
not significantly affect the Indonesia capital market. It is evident from the existence of
equilibrium in the long-run relationship.
REFERENCES
Bekaert, G and Harvey, C. 1995. Time Varying World Market Integration. Journal of Finance
Vol. 50 403-444.
Khalifa, Gawi Mohammed and Gallato, Christina A. Gervacio 2012. The Contagion Effect of
The 2007 Global Financial Crisis on The Malaysian Stock Market. Indonesia
International Conference on Innovation, Entrepreneurship, and Small Business. Surabaya:
Ciputra University.
The First International Conference on Entrepreneurship
Book One 28
Kian-Ping Lim. Hock-Ann Lee and L. Khim-Sen Liew. 2003. International Diversification
Benefits in ASEAN Stock Markets: A Revisit. Labuan School of International Business and
Finance. University Malaysia, University Putra Malaysia.
Koh, Tiong Sim and Ramin Cooper Maysami. 1996. A Cointegration Analysis of the Impact of
Economic Forces and Global Market Integration on the Singapore Stock Market.
Nanyang Business School. Nanyang Technological University, Singapore.
Majid, M. and Kassim, S. 2009. Impact of the 2007 US Financial Crisis on the Emerging Equity
Markets. International Journal of Emerging Markets Vol 4 (4), 341-357.
Mobarek, Asma. Global Stock Market Integration and the Determinants of Co-movements:
Evidence from developed and emerging countries. Stockholm University: NASDAQ
OMX Foundation.
Nurhayati, Mafizatun. 2012. Analisis Integrasi Pasar Modal Asean Dalam Rangka Menuju
Masyarakat Ekonomi Asean. http://eprints.unisbank.ac.id/205/1/artikel-38.pdf.
Trihadmini, Nuning. 2011. Contagion dan Spillover Effect Pasar Keuangan Global Sebagai
Early Warning System. Finance and Banking Journal, Vol. 13.
Winarno. 2009. Analsis Ekonometri dan Statistika dengan EViews. Yogyakarta: UPP STIM
YKPN.
http://www.datacon.co.id/ColdStorage-2011Fokus.html
www.nasdaqomx.com/.../76057_globalstockmarketintegra
The First International Conference on Entrepreneurship
Book One 29
COMPETENCE DEVELOPMENT STRATEGY RESOURCES
INDUSTRY PLAYERS THROUGH CREATIVE EDUCATION,
SKILLS AND CULTURE IN THE CREATIVE INDUSTRIES IN
SOUTH TANGERANG
Nila K Hidayat1, Dibia Abduh2, Fiter Abadi 3
SWISS GERMAN UNIVERSITY, TANGERANG INDONESIA
E-mails: [email protected]; [email protected]; [email protected]
ABSTRACT
The long-term aim of this research is to develop a concept and model
to optimize the maintenance and development of SME’s in creative
industry. The other aim is to identify and to analyze the influence
factors of human resources to successful of SME’s. this research will
focus on one of the subsectors of creative industry namely craft.
Geographic area which will be covered for this research are 7
districts in South Tangerang: Serpong, Pamulang, Ciputat, Ciputat
Timur dan Pondok Aren. The result of this research are a model of
human resource competence development for craft subsector;strategic
program and activity plan to performace the competence in creative
industry and development of SME’s in Tangerang Selatan.
Variables which will be analyzed in this research are education, skill;
culture, competence and performance of SME’s. This research has
been done by doing survey, interviews with related persons and
institutions, questionnaires and Forum Group Discussion (FGD).
Moreover, the data is analyzed by using Spearman correlation to
figure out how significant the impact of education, skill, culture and
competence of human resource for creative industry’s actor; and do
these variables will influence competence performance of SME’s in
South Tangerang.
The result of this research showed that skill has strong influence to
performance of creative industry SME’s in South Tangerang.
Keywords: Competence, Education, Skill, Culture, Performance
In SME’s.
INTRODUCTION
Creative economy has significant role in Indonesian economic and and reality creative
economy is one of mail economic pillar to create jobs, increase economic per capita and
sustainable development. Moreover creative economy could develop patriotism thru
domestic products created by creative economic. Based on data from Trade Ministerium,
in year 2006 creative industry donated Rp. 104.4 trilliun or about 6,28% of Indonesian
The First International Conference on Entrepreneurship
Book One 30
GDP. The biggest contribution of creative industry comes from subsectors such as
fashion (44.18%), craft (27.72%) and advertisement (7.03%). These subsectors could
absorb 5.4 jobs with growth rate of 17.6% in 2006 while in national scale the average
new job grows in 0.54%.
Indonesian Trade Ministerium devides creative industry into 14 subsectors, namely
fashion, advertisement, craft, research and development, music, printing and publication,
computer service and software, television and radio, interactive game, art performance,
design, art product market and antique, film, video and photography.
The blueprint of national economy creative for 2009-2015 which was made in 2008 is:
”economic new era after agriculture economy, industry economy and information
economy which intensify information and creativity with idea and knowledge of human
resource as main production factor in economic activity”
Industry creative consists of many industries which focus on creative idea or intellectual
property of someone. However in the other side, the availability of human resource in
term of quantity or quality becomes main issue in developing creative industry. This
issue should become concern of everyone since it contributes significantly to national
economic. This issue can be solved thru education and therefore it is needed to have an
education system which can produce creative people in the future.(Boediono,2012).
(I.D.K.R. Ardiana, et all. ,2011) Developing creative industry including SME’s should
include development of human resource in many aspects. A result of one of the
researches showed that education level of an SME’s entrepreneur is high school
(44.1%), vocational training graduate (7.4%) and bachelor (17.9%) , the rest have
educational background under high school. This fact showed that it is untrue if
educational background of Indonesian entrepreneurs is relatively low. However,
increasing human resource quality especially in knowledge, skill, ability and attitude in
entrepreneurship is highly needed. Human ability is defined as human potential in doing
things, to achieve those things well with their ability. (Bryson & O'neil, 2008).
South Tangerang consists of 7 districts and has 5 MSME’s (micro, small, medium
enterprise) which covers 4 craft categories: wood and woven craft 40 units, Kota
Tangerang Selatan yang terdiri dari tujuh kecamatan, memiliki lima jenis UMKM yang
meliputi empat katagori kerajinan yaitu kerajinan kayu dan anyaman 40 unit, clay craft
1 unit, textile 243 unit, shoes 6 units and food ad beverages 143 units. The table below
shows the potential of creative industry in South Tangerang.
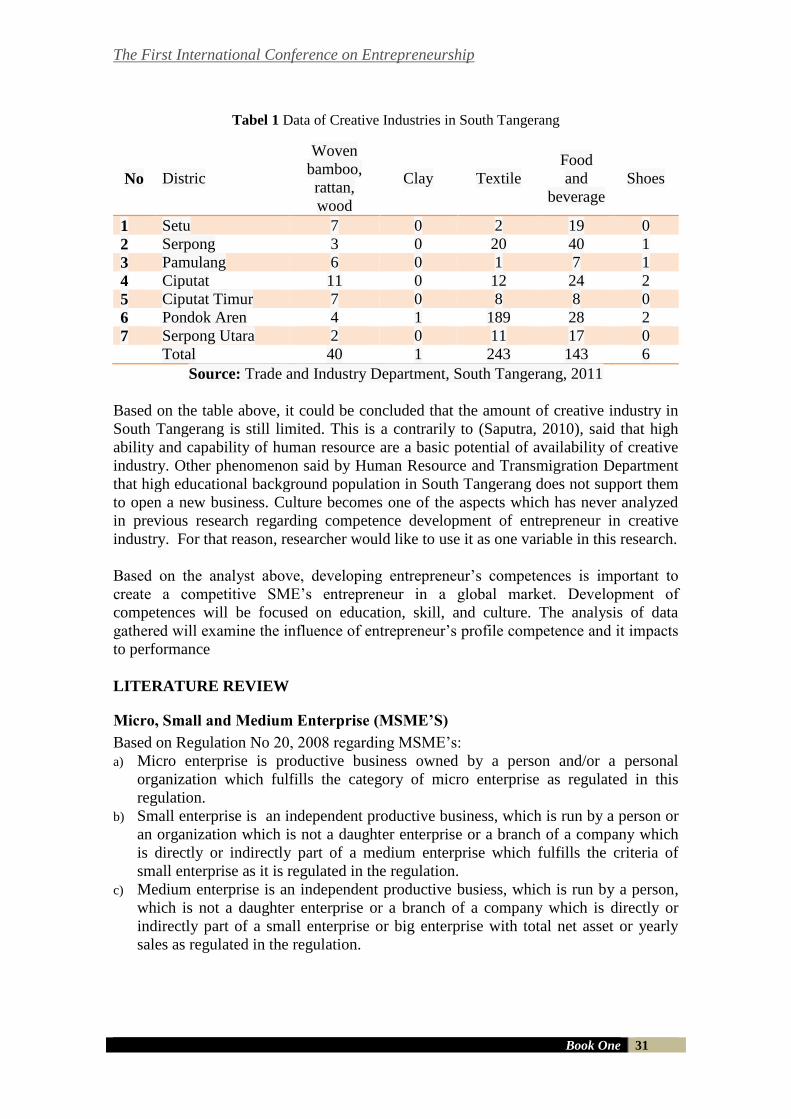
The First International Conference on Entrepreneurship
Book One 31
Tabel 1 Data of Creative Industries in South Tangerang
No Distric
Woven
bamboo,
rattan,
wood
Clay Textile
Food
and
beverage
Shoes
1 Setu 7 0 2 19 0
2 Serpong 3 0 20 40 1
3 Pamulang 6 0 1 7 1
4 Ciputat 11 0 12 24 2
5 Ciputat Timur 7 0 8 8 0
6 Pondok Aren 4 1 189 28 2
7 Serpong Utara 2 0 11 17 0
Total 40 1 243 143 6
Source: Trade and Industry Department, South Tangerang, 2011
Based on the table above, it could be concluded that the amount of creative industry in
South Tangerang is still limited. This is a contrarily to (Saputra, 2010), said that high
ability and capability of human resource are a basic potential of availability of creative
industry. Other phenomenon said by Human Resource and Transmigration Department
that high educational background population in South Tangerang does not support them
to open a new business. Culture becomes one of the aspects which has never analyzed
in previous research regarding competence development of entrepreneur in creative
industry. For that reason, researcher would like to use it as one variable in this research.
Based on the analyst above, developing entrepreneur’s competences is important to
create a competitive SME’s entrepreneur in a global market. Development of
competences will be focused on education, skill, and culture. The analysis of data
gathered will examine the influence of entrepreneur’s profile competence and it impacts
to performance
LITERATURE REVIEW
Micro, Small and Medium Enterprise (MSME’S)
Based on Regulation No 20, 2008 regarding MSME’s:
a) Micro enterprise is productive business owned by a person and/or a personal
organization which fulfills the category of micro enterprise as regulated in this
regulation.
b) Small enterprise is an independent productive business, which is run by a person or
an organization which is not a daughter enterprise or a branch of a company which
is directly or indirectly part of a medium enterprise which fulfills the criteria of
small enterprise as it is regulated in the regulation.
c) Medium enterprise is an independent productive busiess, which is run by a person,
which is not a daughter enterprise or a branch of a company which is directly or
indirectly part of a small enterprise or big enterprise with total net asset or yearly
sales as regulated in the regulation.
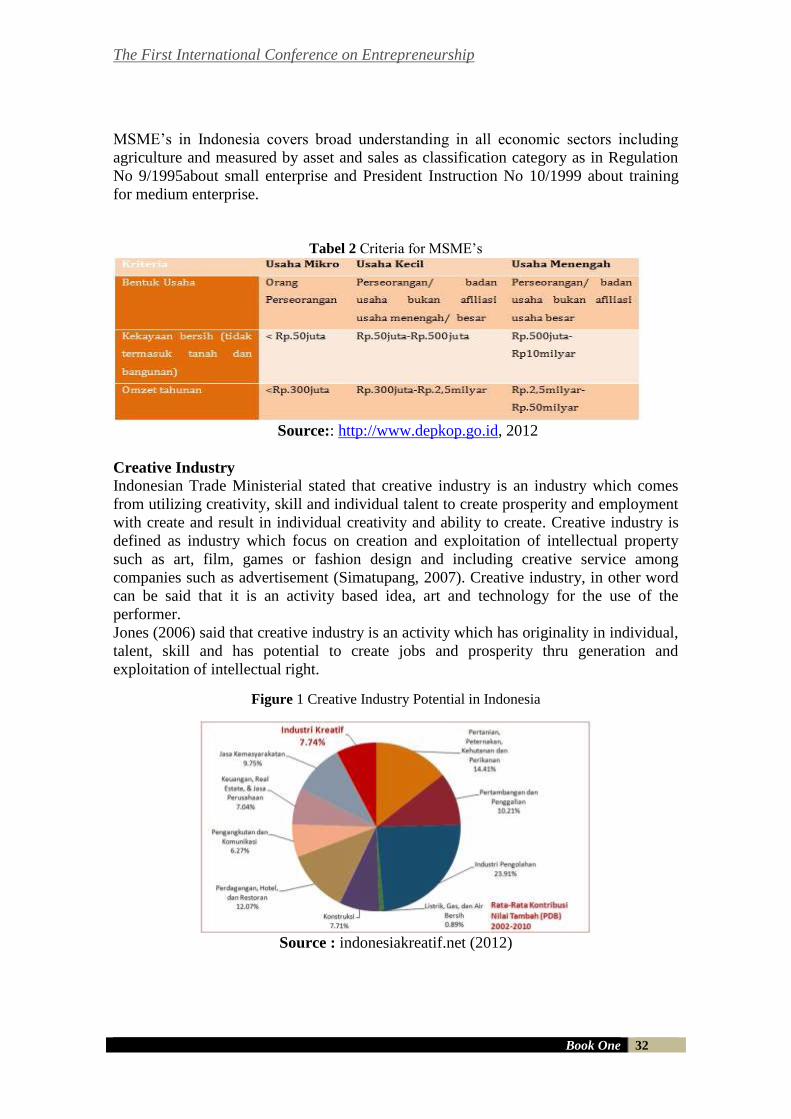
The First International Conference on Entrepreneurship
Book One 32
MSME’s in Indonesia covers broad understanding in all economic sectors including
agriculture and measured by asset and sales as classification category as in Regulation
No 9/1995about small enterprise and President Instruction No 10/1999 about training
for medium enterprise.
Tabel 2 Criteria for MSME’s
Source:: http://www.depkop.go.id, 2012
Creative Industry
Indonesian Trade Ministerial stated that creative industry is an industry which comes
from utilizing creativity, skill and individual talent to create prosperity and employment
with create and result in individual creativity and ability to create. Creative industry is
defined as industry which focus on creation and exploitation of intellectual property
such as art, film, games or fashion design and including creative service among
companies such as advertisement (Simatupang, 2007). Creative industry, in other word
can be said that it is an activity based idea, art and technology for the use of the
performer.
Jones (2006) said that creative industry is an activity which has originality in individual,
talent, skill and has potential to create jobs and prosperity thru generation and
exploitation of intellectual right.
Figure 1 Creative Industry Potential in Indonesia
Source : indonesiakreatif.net (2012)
The First International Conference on Entrepreneurship
Book One 33
Based on Holsz (2005) , creative industry has characteristics and differences as follow:
a. Creative industry product is a product from experience in which the success is
dependent to the one who consumes it.
b. Creative industry product is mostly a symbolic product which content cultural
values to differentiate with other product.
c. The difference from every consumer in valuing the level of quality is hard to
predict.
d. Creative industry is mostly recognized by having high diversification.
e. Most of creative industry product is durable and can be use many more than one
time.
f. Some industries are categorized as a specific technology development.
Competence
Competence shows a proper quality or having a proper quality to accomplish a certain
task. One could receive compensation thru education, trainings, experiences or natural
ability. Even though there are many definition of compensation, they have these 2
general components::
a. Competence is behavior which can be monitored or measured, knowledge and
ability.
b. Requirements (knowledge, skill, and attitude) should differentiate between a
winning player and the others.
Competence is behavior and monitored, since competence is based on someone
behavior. The result of one competence is effective or even excellent in work
achievement. Developing competence model needs process to identify a successful
performance or responsible in work situation, and further to identify knowledge, skill
and attitude which is related to work (Kompetensi dan Kinerja , access on May 28,
2011 ).
Knowledge is defined by Davenport and Prusak (1998) as combination between
experience, contextual information, values and heritages which give form to evaluate
and combine new experience and information. Skill is defined as ability and capacity
which are achieved thru accidentally, systematically and sustainability to do effort and
adaptive to carry out a complex activity or job function which involve ideas (cognitive
skill), others (technical skill), and /or persons (interpersonal skill). Based on Sims
(2002), attitude is a positive or negative feeling or mental situation, to bow and
organized thru experience which gives certain influence to respond to a person, an item
or to a situation. Breckler (1984) identified that attitude has 3 separate but connected
parts:
a. Cognitive; perception and believe about attitude object,
b. Affective; evaluation and feeling toward attitude object; one’s feeling to like or not
to like an object.
c. Behavior; how one wants to behave and what to say about behavior toward the
object. This is not always the same with the monitored behavior follow by attitude
expression.
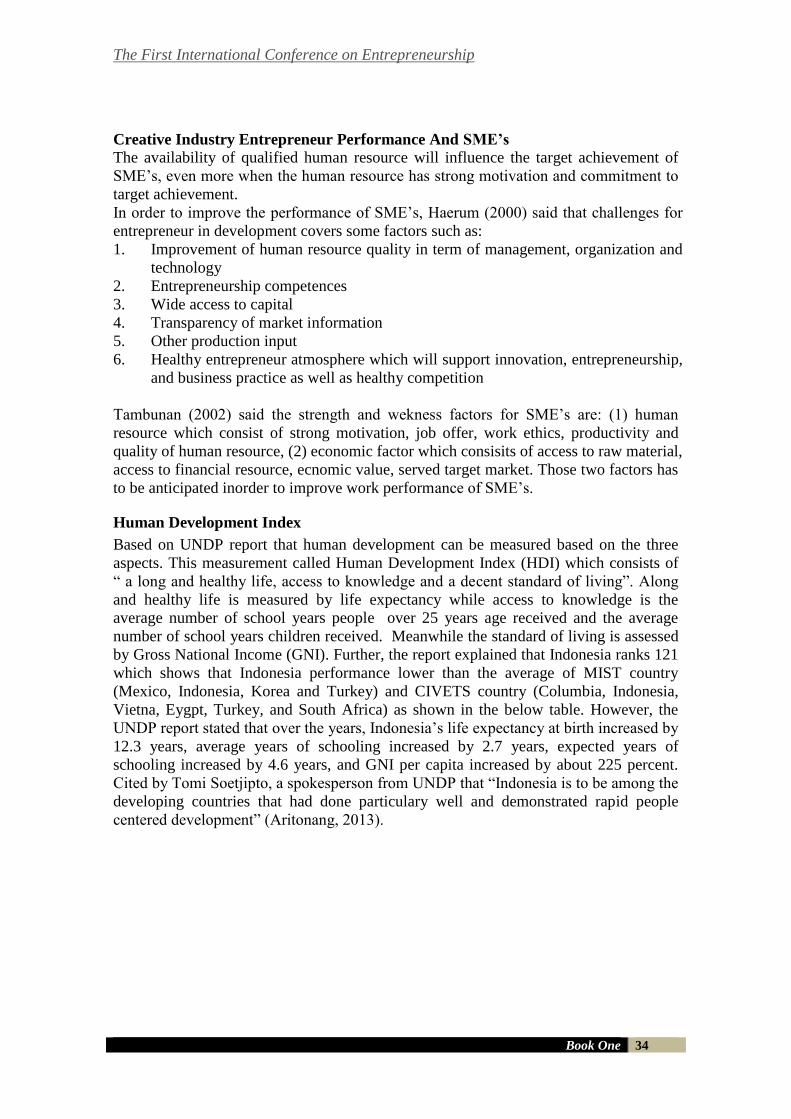
The First International Conference on Entrepreneurship
Book One 34
Creative Industry Entrepreneur Performance And SME’s The availability of qualified human resource will influence the target achievement of
SME’s, even more when the human resource has strong motivation and commitment to
target achievement.
In order to improve the performance of SME’s, Haerum (2000) said that challenges for
entrepreneur in development covers some factors such as:
1. Improvement of human resource quality in term of management, organization and
technology
2. Entrepreneurship competences
3. Wide access to capital
4. Transparency of market information
5. Other production input
6. Healthy entrepreneur atmosphere which will support innovation, entrepreneurship,
and business practice as well as healthy competition
Tambunan (2002) said the strength and wekness factors for SME’s are: (1) human
resource which consist of strong motivation, job offer, work ethics, productivity and
quality of human resource, (2) economic factor which consisits of access to raw material,
access to financial resource, ecnomic value, served target market. Those two factors has
to be anticipated inorder to improve work performance of SME’s.
Human Development Index
Based on UNDP report that human development can be measured based on the three
aspects. This measurement called Human Development Index (HDI) which consists of
“ a long and healthy life, access to knowledge and a decent standard of living”. Along
and healthy life is measured by life expectancy while access to knowledge is the
average number of school years people over 25 years age received and the average
number of school years children received. Meanwhile the standard of living is assessed
by Gross National Income (GNI). Further, the report explained that Indonesia ranks 121
which shows that Indonesia performance lower than the average of MIST country
(Mexico, Indonesia, Korea and Turkey) and CIVETS country (Columbia, Indonesia,
Vietna, Eygpt, Turkey, and South Africa) as shown in the below table. However, the
UNDP report stated that over the years, Indonesia’s life expectancy at birth increased by
12.3 years, average years of schooling increased by 2.7 years, expected years of
schooling increased by 4.6 years, and GNI per capita increased by about 225 percent.
Cited by Tomi Soetjipto, a spokesperson from UNDP that “Indonesia is to be among the
developing countries that had done particulary well and demonstrated rapid people
centered development” (Aritonang, 2013).
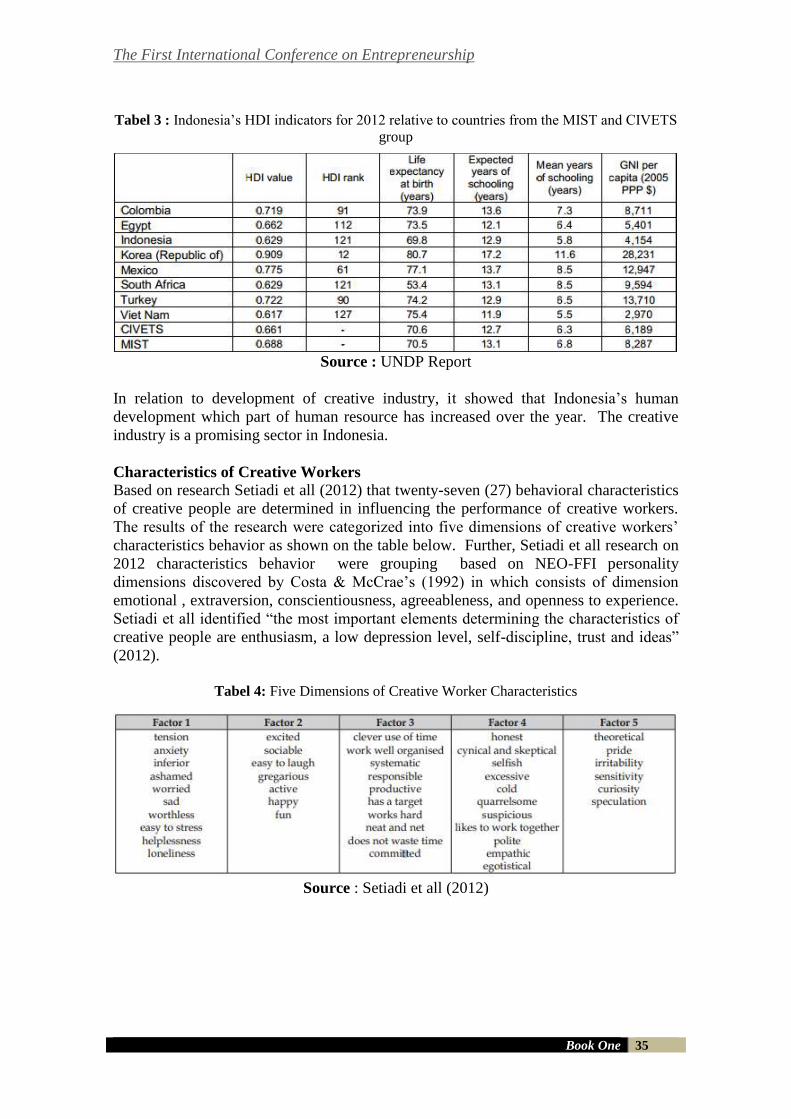
The First International Conference on Entrepreneurship
Book One 35
Tabel 3 : Indonesia’s HDI indicators for 2012 relative to countries from the MIST and CIVETS
group
Source : UNDP Report
In relation to development of creative industry, it showed that Indonesia’s human
development which part of human resource has increased over the year. The creative
industry is a promising sector in Indonesia.
Characteristics of Creative Workers
Based on research Setiadi et all (2012) that twenty-seven (27) behavioral characteristics
of creative people are determined in influencing the performance of creative workers.
The results of the research were categorized into five dimensions of creative workers’
characteristics behavior as shown on the table below. Further, Setiadi et all research on
2012 characteristics behavior were grouping based on NEO-FFI personality
dimensions discovered by Costa & McCrae’s (1992) in which consists of dimension
emotional , extraversion, conscientiousness, agreeableness, and openness to experience.
Setiadi et all identified “the most important elements determining the characteristics of
creative people are enthusiasm, a low depression level, self-discipline, trust and ideas”
(2012).
Tabel 4: Five Dimensions of Creative Worker Characteristics
Source : Setiadi et all (2012)
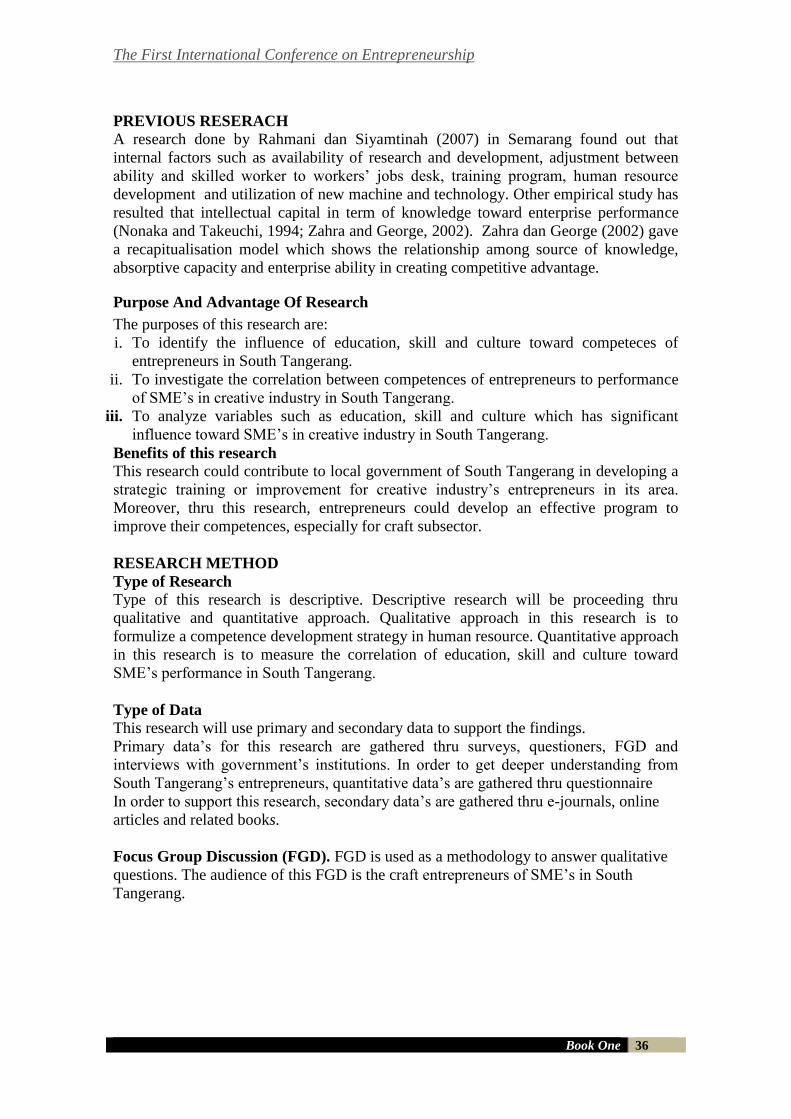
The First International Conference on Entrepreneurship
Book One 36
PREVIOUS RESERACH
A research done by Rahmani dan Siyamtinah (2007) in Semarang found out that
internal factors such as availability of research and development, adjustment between
ability and skilled worker to workers’ jobs desk, training program, human resource
development and utilization of new machine and technology. Other empirical study has
resulted that intellectual capital in term of knowledge toward enterprise performance
(Nonaka and Takeuchi, 1994; Zahra and George, 2002). Zahra dan George (2002) gave
a recapitualisation model which shows the relationship among source of knowledge,
absorptive capacity and enterprise ability in creating competitive advantage.
Purpose And Advantage Of Research
The purposes of this research are:
i. To identify the influence of education, skill and culture toward competeces of
entrepreneurs in South Tangerang.
ii. To investigate the correlation between competences of entrepreneurs to performance
of SME’s in creative industry in South Tangerang.
iii. To analyze variables such as education, skill and culture which has significant
influence toward SME’s in creative industry in South Tangerang.
Benefits of this research
This research could contribute to local government of South Tangerang in developing a
strategic training or improvement for creative industry’s entrepreneurs in its area.
Moreover, thru this research, entrepreneurs could develop an effective program to
improve their competences, especially for craft subsector.
RESEARCH METHOD
Type of Research
Type of this research is descriptive. Descriptive research will be proceeding thru
qualitative and quantitative approach. Qualitative approach in this research is to
formulize a competence development strategy in human resource. Quantitative approach
in this research is to measure the correlation of education, skill and culture toward
SME’s performance in South Tangerang.
Type of Data
This research will use primary and secondary data to support the findings.
Primary data’s for this research are gathered thru surveys, questioners, FGD and
interviews with government’s institutions. In order to get deeper understanding from
South Tangerang’s entrepreneurs, quantitative data’s are gathered thru questionnaire
In order to support this research, secondary data’s are gathered thru e-journals, online
articles and related books.
Focus Group Discussion (FGD). FGD is used as a methodology to answer qualitative
questions. The audience of this FGD is the craft entrepreneurs of SME’s in South
Tangerang.
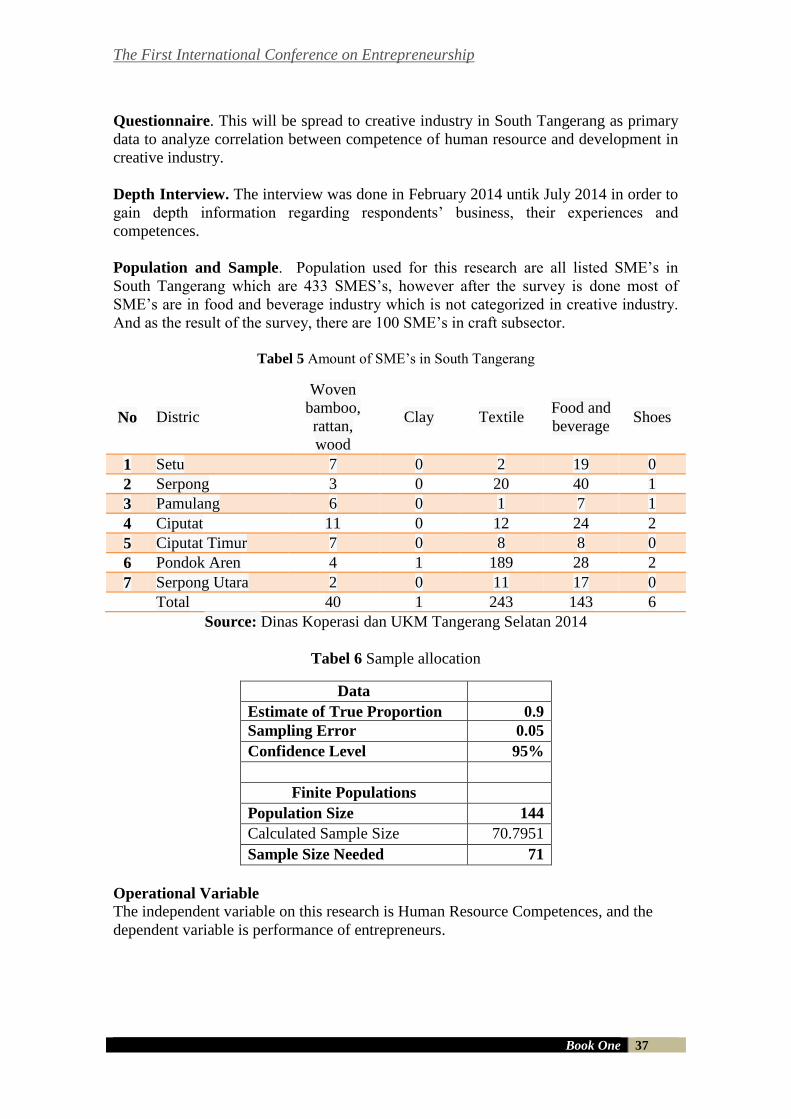
The First International Conference on Entrepreneurship
Book One 37
Questionnaire. This will be spread to creative industry in South Tangerang as primary
data to analyze correlation between competence of human resource and development in
creative industry.
Depth Interview. The interview was done in February 2014 untik July 2014 in order to
gain depth information regarding respondents’ business, their experiences and
competences.
Population and Sample. Population used for this research are all listed SME’s in
South Tangerang which are 433 SMES’s, however after the survey is done most of
SME’s are in food and beverage industry which is not categorized in creative industry.
And as the result of the survey, there are 100 SME’s in craft subsector.
Tabel 5 Amount of SME’s in South Tangerang
No Distric
Woven
bamboo,
rattan,
wood
Clay Textile Food and
beverage Shoes
1 Setu 7 0 2 19 0
2 Serpong 3 0 20 40 1
3 Pamulang 6 0 1 7 1
4 Ciputat 11 0 12 24 2
5 Ciputat Timur 7 0 8 8 0
6 Pondok Aren 4 1 189 28 2
7 Serpong Utara 2 0 11 17 0
Total 40 1 243 143 6
Source: Dinas Koperasi dan UKM Tangerang Selatan 2014
Tabel 6 Sample allocation
Data
Estimate of True Proportion 0.9
Sampling Error 0.05
Confidence Level 95%
Finite Populations
Population Size 144
Calculated Sample Size 70.7951
Sample Size Needed 71
Operational Variable
The independent variable on this research is Human Resource Competences, and the
dependent variable is performance of entrepreneurs.
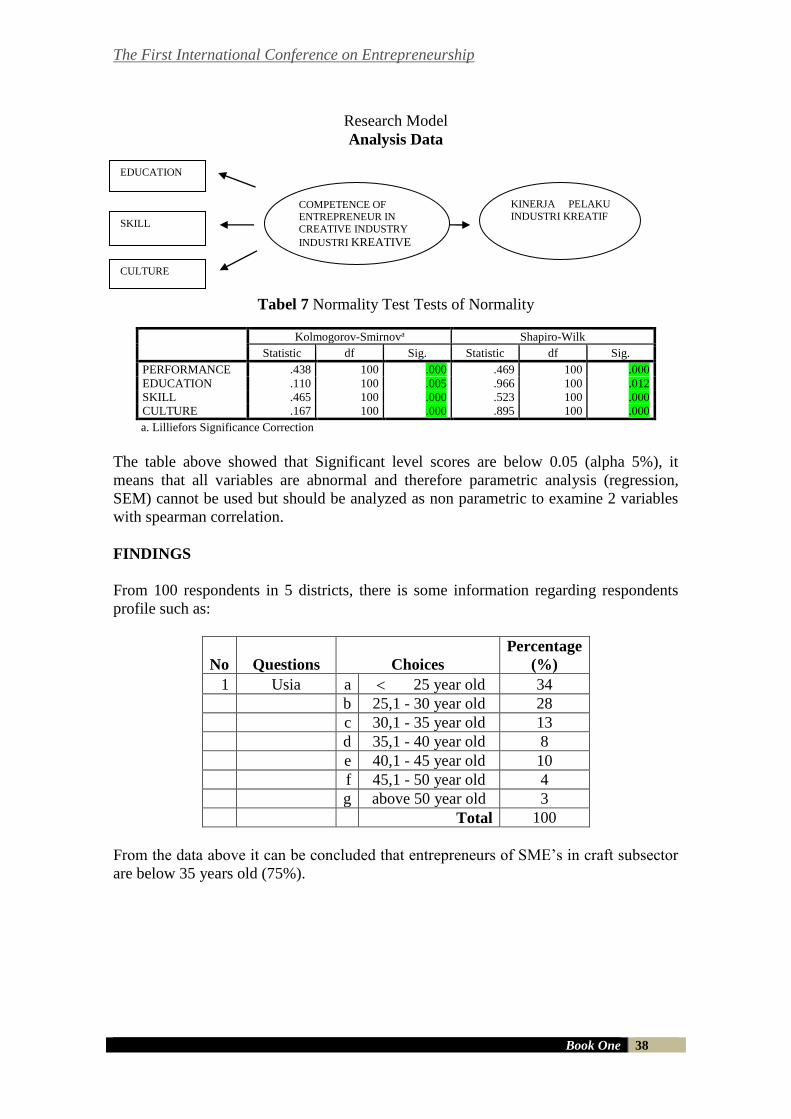
The First International Conference on Entrepreneurship
Book One 38
Research Model
Analysis Data
Tabel 7 Normality Test Tests of Normality
Kolmogorov-Smirnova Shapiro-Wilk
Statistic df Sig. Statistic df Sig.
PERFORMANCE .438 100 .000 .469 100 .000
EDUCATION .110 100 .005 .966 100 .012
SKILL .465 100 .000 .523 100 .000
CULTURE .167 100 .000 .895 100 .000
a. Lilliefors Significance Correction
The table above showed that Significant level scores are below 0.05 (alpha 5%), it
means that all variables are abnormal and therefore parametric analysis (regression,
SEM) cannot be used but should be analyzed as non parametric to examine 2 variables
with spearman correlation.
FINDINGS
From 100 respondents in 5 districts, there is some information regarding respondents
profile such as:
No Questions Choices
Percentage
(%)
1 Usia a 25 year old 34
b 25,1 - 30 year old 28
c 30,1 - 35 year old 13
d 35,1 - 40 year old 8
e 40,1 - 45 year old 10
f 45,1 - 50 year old 4
g above 50 year old 3
Total 100
From the data above it can be concluded that entrepreneurs of SME’s in craft subsector
are below 35 years old (75%).
EDUCATION
SKILL
CULTURE
COMPETENCE OF ENTREPRENEUR IN
CREATIVE INDUSTRY
INDUSTRI KREATIVE
KINERJA PELAKU
INDUSTRI KREATIF
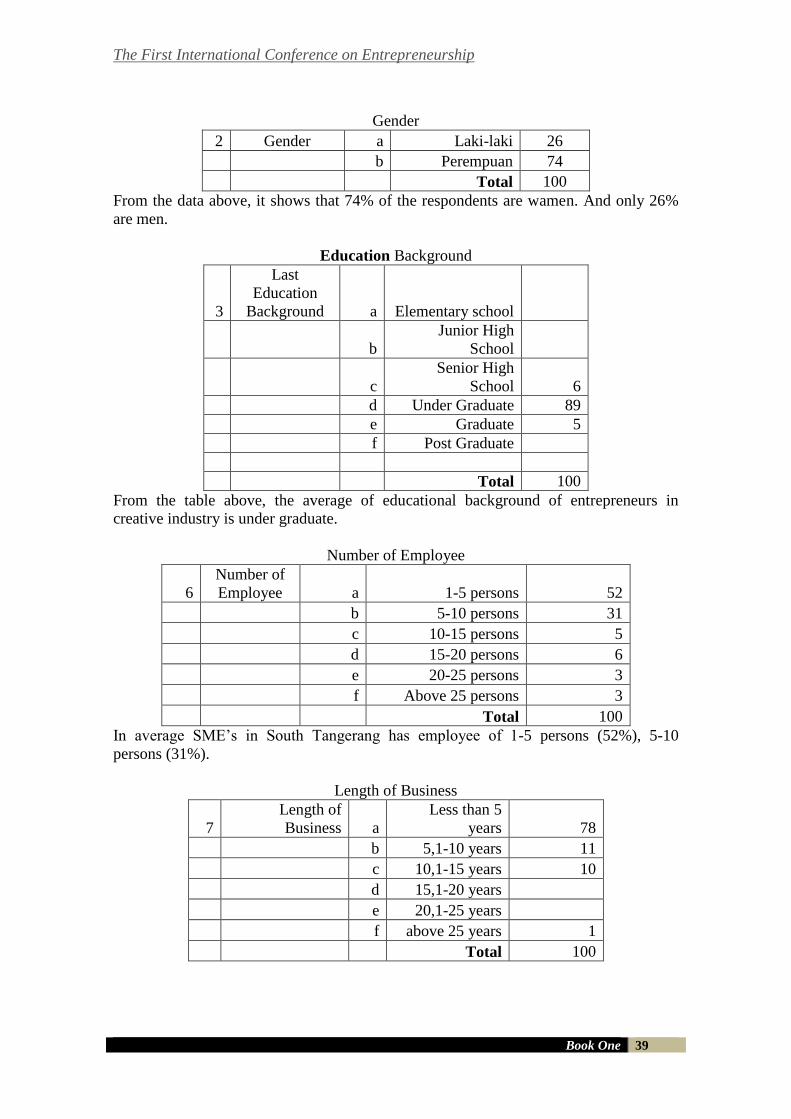
The First International Conference on Entrepreneurship
Book One 39
Gender
2 Gender a Laki-laki 26
b Perempuan 74
Total 100
From the data above, it shows that 74% of the respondents are wamen. And only 26%
are men.
Education Background
3
Last
Education
Background a Elementary school
b
Junior High
School
c
Senior High
School 6
d Under Graduate 89
e Graduate 5
f Post Graduate
Total 100
From the table above, the average of educational background of entrepreneurs in
creative industry is under graduate.
Number of Employee
6
Number of
Employee a 1-5 persons 52
b 5-10 persons 31
c 10-15 persons 5
d 15-20 persons 6
e 20-25 persons 3
f Above 25 persons 3
Total 100
In average SME’s in South Tangerang has employee of 1-5 persons (52%), 5-10
persons (31%).
Length of Business
7
Length of
Business a
Less than 5
years 78
b 5,1-10 years 11
c 10,1-15 years 10
d 15,1-20 years
e 20,1-25 years
f above 25 years 1
Total 100
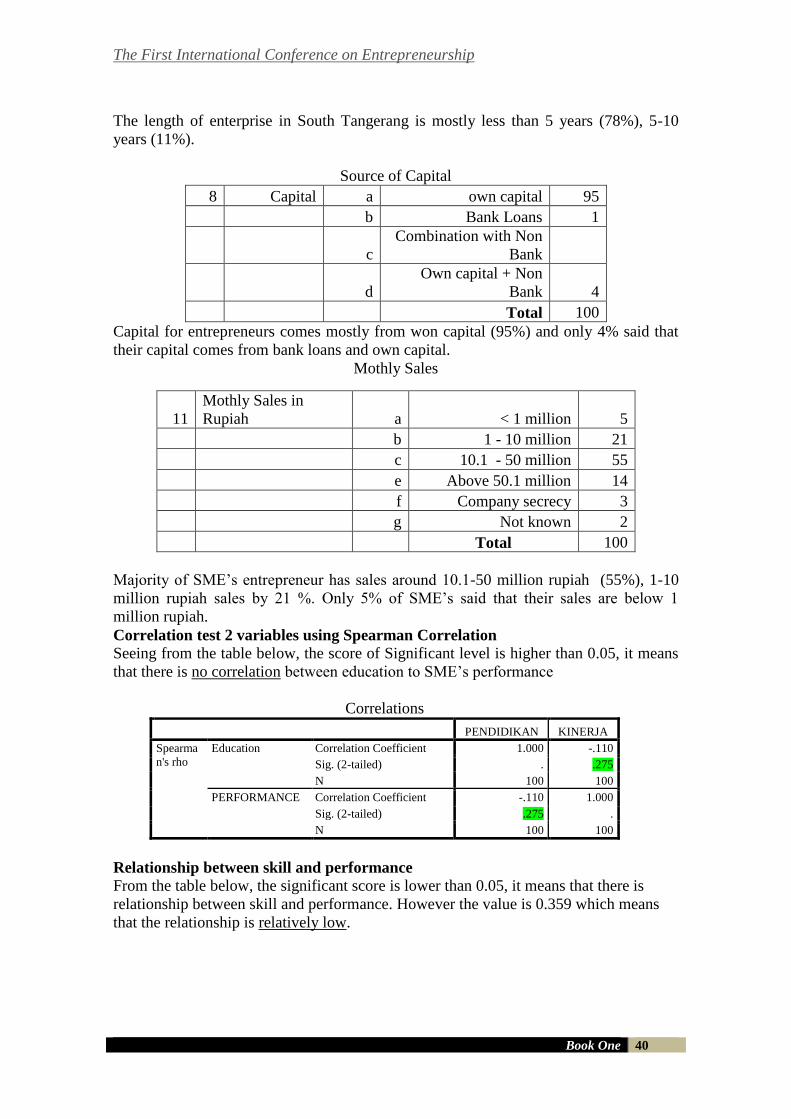
The First International Conference on Entrepreneurship
Book One 40
The length of enterprise in South Tangerang is mostly less than 5 years (78%), 5-10
years (11%).
Source of Capital
8 Capital a own capital 95
b Bank Loans 1
c
Combination with Non
Bank
d
Own capital + Non
Bank 4
Total 100
Capital for entrepreneurs comes mostly from won capital (95%) and only 4% said that
their capital comes from bank loans and own capital.
Mothly Sales
11
Mothly Sales in
Rupiah a < 1 million 5
b 1 - 10 million 21
c 10.1 - 50 million 55
e Above 50.1 million 14
f Company secrecy 3
g Not known 2
Total 100
Majority of SME’s entrepreneur has sales around 10.1-50 million rupiah (55%), 1-10
million rupiah sales by 21 %. Only 5% of SME’s said that their sales are below 1
million rupiah.
Correlation test 2 variables using Spearman Correlation
Seeing from the table below, the score of Significant level is higher than 0.05, it means
that there is no correlation between education to SME’s performance
Correlations
PENDIDIKAN KINERJA
Spearma
n's rho
Education Correlation Coefficient 1.000 -.110
Sig. (2-tailed) . .275
N 100 100
PERFORMANCE Correlation Coefficient -.110 1.000
Sig. (2-tailed) .275 .
N 100 100
Relationship between skill and performance
From the table below, the significant score is lower than 0.05, it means that there is
relationship between skill and performance. However the value is 0.359 which means
that the relationship is relatively low.
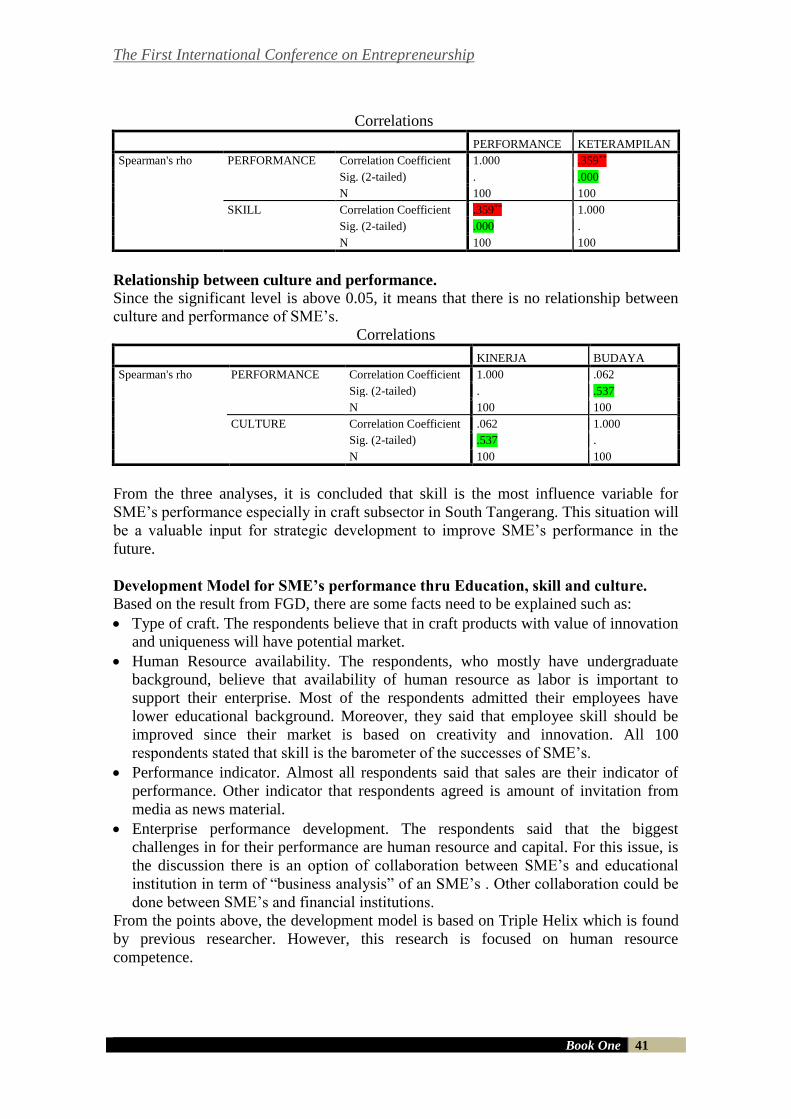
The First International Conference on Entrepreneurship
Book One 41
Correlations
PERFORMANCE KETERAMPILAN
Spearman's rho PERFORMANCE Correlation Coefficient 1.000 .359**
Sig. (2-tailed) . .000
N 100 100
SKILL Correlation Coefficient .359** 1.000
Sig. (2-tailed) .000 .
N 100 100
Relationship between culture and performance.
Since the significant level is above 0.05, it means that there is no relationship between
culture and performance of SME’s.
Correlations
KINERJA BUDAYA
Spearman's rho PERFORMANCE Correlation Coefficient 1.000 .062
Sig. (2-tailed) . .537
N 100 100
CULTURE Correlation Coefficient .062 1.000
Sig. (2-tailed) .537 .
N 100 100
From the three analyses, it is concluded that skill is the most influence variable for
SME’s performance especially in craft subsector in South Tangerang. This situation will
be a valuable input for strategic development to improve SME’s performance in the
future.
Development Model for SME’s performance thru Education, skill and culture.
Based on the result from FGD, there are some facts need to be explained such as:
Type of craft. The respondents believe that in craft products with value of innovation
and uniqueness will have potential market.
Human Resource availability. The respondents, who mostly have undergraduate
background, believe that availability of human resource as labor is important to
support their enterprise. Most of the respondents admitted their employees have
lower educational background. Moreover, they said that employee skill should be
improved since their market is based on creativity and innovation. All 100
respondents stated that skill is the barometer of the successes of SME’s.
Performance indicator. Almost all respondents said that sales are their indicator of
performance. Other indicator that respondents agreed is amount of invitation from
media as news material.
Enterprise performance development. The respondents said that the biggest
challenges in for their performance are human resource and capital. For this issue, is
the discussion there is an option of collaboration between SME’s and educational
institution in term of “business analysis” of an SME’s . Other collaboration could be
done between SME’s and financial institutions.
From the points above, the development model is based on Triple Helix which is found
by previous researcher. However, this research is focused on human resource
competence.
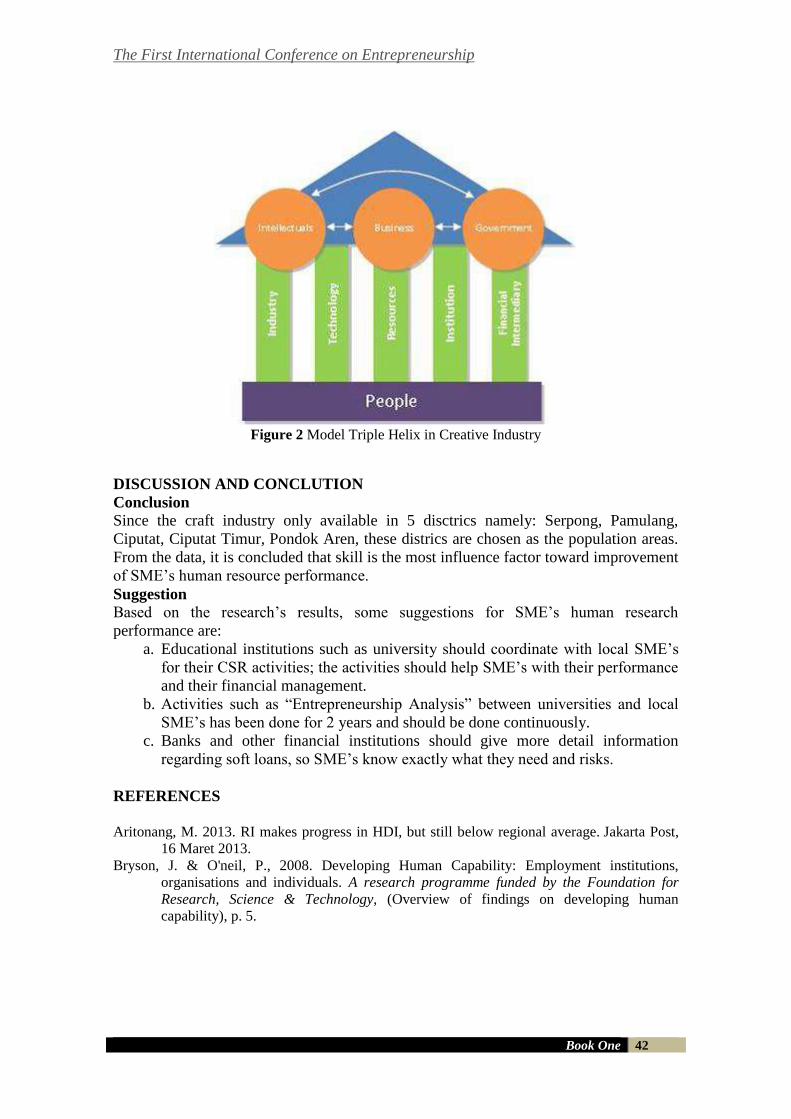
The First International Conference on Entrepreneurship
Book One 42
Figure 2 Model Triple Helix in Creative Industry
DISCUSSION AND CONCLUTION
Conclusion Since the craft industry only available in 5 disctrics namely: Serpong, Pamulang,
Ciputat, Ciputat Timur, Pondok Aren, these districs are chosen as the population areas.
From the data, it is concluded that skill is the most influence factor toward improvement
of SME’s human resource performance. Suggestion
Based on the research’s results, some suggestions for SME’s human research
performance are:
a. Educational institutions such as university should coordinate with local SME’s
for their CSR activities; the activities should help SME’s with their performance
and their financial management.
b. Activities such as “Entrepreneurship Analysis” between universities and local
SME’s has been done for 2 years and should be done continuously.
c. Banks and other financial institutions should give more detail information
regarding soft loans, so SME’s know exactly what they need and risks.
REFERENCES
Aritonang, M. 2013. RI makes progress in HDI, but still below regional average. Jakarta Post,
16 Maret 2013.
Bryson, J. & O'neil, P., 2008. Developing Human Capability: Employment institutions,
organisations and individuals. A research programme funded by the Foundation for
Research, Science & Technology, (Overview of findings on developing human
capability), p. 5.
The First International Conference on Entrepreneurship
Book One 43
Breckler, S. J. 1984. Empirical validation of affect, behavior, and cognition as distinct
components of attitude. Journal of Personality and Social Psychology , 47 , 1191-1205.
Boediono 2013, http://www.tribunnews.com, Rabu, 27 November 2013.
Cetak Biru Pengembangan Ekonomi Kreatif Nasional 2009-2015 2008.
Costa, P.T.Jr., & McCrae R.R., 1992. Revised NEO Personality Inventory (NEO-PI-R) and
NEO Five-Factor Inventory (NEO-FFI) manual. Psychological Assessment Resources,
Odessa, FL.
Davenport, T.H., & Prusak, L. 1998. Working knowledge: how organizations manage what
they know. Boston, MA: Harvard Business School Press.
Holzl, W. 2005, “Entrepreneurship, Entry and Exit Creative Industries ; An Exploratory
Survey”, Vienna University of Economics and Business Administration, Vol.1.pp.1-31.
Haeruman, H, 2000, Peningkatan Daya Saing UMKM untuk Mendukung Program PEL.
Makalah Seminar Peningkatan Daya Saing, Graha Sucofindo, Jakarta
Howkins,John, 2002 ; The Creative Economy : How People Make Money from Ideas, Penguin.
I.D.K.R. Ardiana, I.A. Brahmayanti, Subaedi 2012 : Kompetensi SDM UKM dan Pengaruhnya
Terhadap Kinerja UKM di Surabaya.
Jones, R. 2006 Seminar on the Creative Industries Development Krasnoyarsk, PACIFIC
STREAM Information CIC.
Nonaka, I., and Takeuchi, H., 1995. The Knowledge-Creating Company, Oxford University
Press, New York
Rahmani dan Siyamtinah 2009, Dampak Keragaman Pola Membangun Kapabilitas Inovasi
terhadap Kinerja UKM di Semarang, Laporan Penelitian Dosen Muda ,Dikti
Saputra, W., 2010. Industri Kreatif. 1 ed. Serdang: Badouse Media.
Setiadi, N. Et all 2012. Boosting Indonesia’s Creative Industries: Identification of People’s
Characteristics and Creative Behavior. Quaestiones Geographicae - Journal of the
Institute of Geography, Adam Mickiewicz University, Poznań, Poland, 31(4), 53-62.
Sim, Clyamond 2002 “Defining Competency”, The State of Queensland (Department of
Education and Training), 2002.
Simatupang, T,M. 2007, Konsep Kebijakan Membangun Industri Kreatif”, Pikiran Rakyat ,
Selasa 28 Agustus 2007.
Tambunan, Tulus T.H., 2002, Usaha Kecil dan Menengah di Indonesia: Beberapa Isu Penting,
Salemba Empat, Jakarta.
The First International Conference on Entrepreneurship
Book One 44
UNDP Report. Human Development Report 2013. The Rise of the South: Human Progress in a
Diverse World. Indonesia – HDI values and rank changes in the 2013 Human
Development Report.
Zahra, S.A., and George, G., 2002. “Absorptive Capacity: A Review, Reconceptualization, and
Extension” dalam Academy of Management Review, Vol. 27
The Rule:
Undang-Undang Nomor 20 Tahun 2008 tentang Usaha Mikro, Kecil dan Menengah.
Peraturan Pemerintah Nomor 44 Tahun 1997 tentang Kemitraan;
Peraturan Presiden Nomor 5 Tahun 2010 tentang Rencana Pembangunan Jangka Menengah
Nasional 2010-2014;
Keputusan Presiden Nomor 127/2001 tentang Bidang/Jenis Usaha yang terbuka untuk Usaha
Menengah atau Besar dengan Syarat Kemitraan.
Internet
http://www.depkop.go.id
http://www.smecda.com
http://www.depkeu.go.id
The First International Conference on Entrepreneurship
Book One 45
MODEL APPLICATION MENTORING PEGG (5C) TO IMPROVE
THE ENTREPRENEUR LEARNING QUALITY E4 CIPUTRA
UNIVERSITY
Christina Whidya Utami1, Hendrasmoro2, Danardana Murwani3
(Lecturer at Ciputra University)
INDONESIA
E-mails: [email protected], [email protected],
ABSTRACT
The Mentoring application model that usually calls with “five c” which
contains: challanges, Choises, consequences, creative solution and conclusions
(pegg, 1999) can be implemented with the goals of competence improvement on
the Ciptura University graduate. The research goals are : 1) How can we
applicate the 5C mentoring model in the phase of discovery and planning,
resourcing, implementation, and evaluation in the E4 major course? 2) How the
student respond to the 5c model in the entrepreneurship major 4 (innovation)
The research respondend are 35 student that has been took the
entrepreneurship major 4 (innovation), got the mentoring proccess( the five c
mentoring) that continually did and repeated in every learning phase.
This research has dicovered that the application and the student respond in the
mentoring model implementation are great, showed by this 5C mentoring model
through the phase of discovery and planning,resourcing, implementation and
evaluation. the student respond about 5C model (challanges, choices,
consequenses, creative and conclusions) in the entrepreneurhip major 4
(innovation) are devided into 3 things that the facilitator believes, the mentoring
proccess, learning method, and facilitator.
Keywords: Entreprenership, Mentoring Pegg 5C, Challanges, Choices,
Consequenses
INTRODUCTION
The awareness about the importance of entrepreneurship education that should create a
good entrepreneur will motivate a lot of formal education institution that based in
entrepreneur. A lot of research has been developed to find the entrepreneurship learning
method that can grow the creaativity and entrepreneurial intention (Hamidi et., al.,
2008) with the big number of sks (satuan kredit smester) won’t be a guarantee that
graduate student will be a master of entrepreneurship if the learning proccess are not
managed well. The future learning concept must be oriented to the effort of the learn to
think, learn to act, learn to realize what you are becoming, learn to live together.
Therefor in the learning proccess, it needs an approach that can connecting the science
concept with the factual concept in the reality, so the student involvement in the
learning proccess will be bigger. This facts made the Ciputra University realized to
The First International Conference on Entrepreneurship
Book One 46
develop their entrepreneur competence from its student. Therefore Ciputra university
has developed the entrepreneurship tiered curriculum from the first semester until 5
calls E1, E2, E3, E4, and E5. Where in every E will have the different competence
subject. For example for the E4 competence what we expecting is the student should
develop the innovation from the business project that they develop. This E4 major has
been prepared for the student in the 4 semester near the end of entrepreneur study.
Remembering the last step is E5 which is the phase to the entrepreneur study that the
student has to take in the 5 semester. So the project that the students are developing in
the E4 subject is expected to be great and not in the phase of start up. Because of that
Ciputra University has set the goals of E4 subject are building the innovative business.
However, in the reality there are a lot of student projects that not quite developed in the
E4 subject, based on the context or the business models. It showed by some student that
still not having a big profit, with the range of rebuying number that is low, and making
the concerns that the business won’t be able to survive in the long term.
This E4 subject, has its road map that contains discovery, planning, resourcing,
actualization, and evaluation (curriculum team E4,2012) where in every phase contains
the concept material about business and entrepreneurship with the mentoring method.
The mentoring application has done by 3 facilitator with 2 academic lecturer
qualification and 1 ER entrepreneur residence or someone who has the experience as
an entrepreneur.the mentoring activity can be held inside the classroom, but in some
cases its not possible to visit the students project because of the limited time and
energy,or involving the outsourcing to as a mentor or even a family member to get
involve for giving the guide and direction for their business while the mentor that
should hep the student to controll a person life and guide it to fill their lifes. What
happened in the mentoring session? You can see the basic mentoring model that
usually calls with “five c” which contain : challanges, choices, consequences, creative
solution and conclusion (Pegg, 1999) therefore the problem formulation, 1) how’s the
application ofentoring model 5C in the ohase of discovery and planning2) how the
students respond with the application and implementation of 5c with this subject?
Literature Review
According to Pegg, (1999) a mentor must have credibility individually as follows:
Through age it means to have wisdom, Through books means not listen to other people's
know-how, through success means someone’s success experience is the best teacher,
Through street wisdom means being able to choose the way / manner others as
allternatif, through chemestry means should be able to establish a good relationship so it
can be considered as an advisor, being a truth teller through it means to be a leading
employee who listen to customer complaints, through expertise means that experience is
very important, through presence means giving presence in the middle-central actors.
According to Pegg (1999) mentoring is help people to bild on Reviews their strengths,
find solutions and Achieve ongoing success. Thus the actual mentoring will have the
following goals. The purpose of the mentorship learning methods are: 1) Experiencing
the phenomenon itself and find its own practice of entrepreneurship where it is expected
to build confidence, self-esteem and self-awareness that is fundamental in solving
problems (Nurachmach, 2007). 2) Integrate all existing sources into a form of learning
systems more effective in achieving competence, ie which has the basic principles of
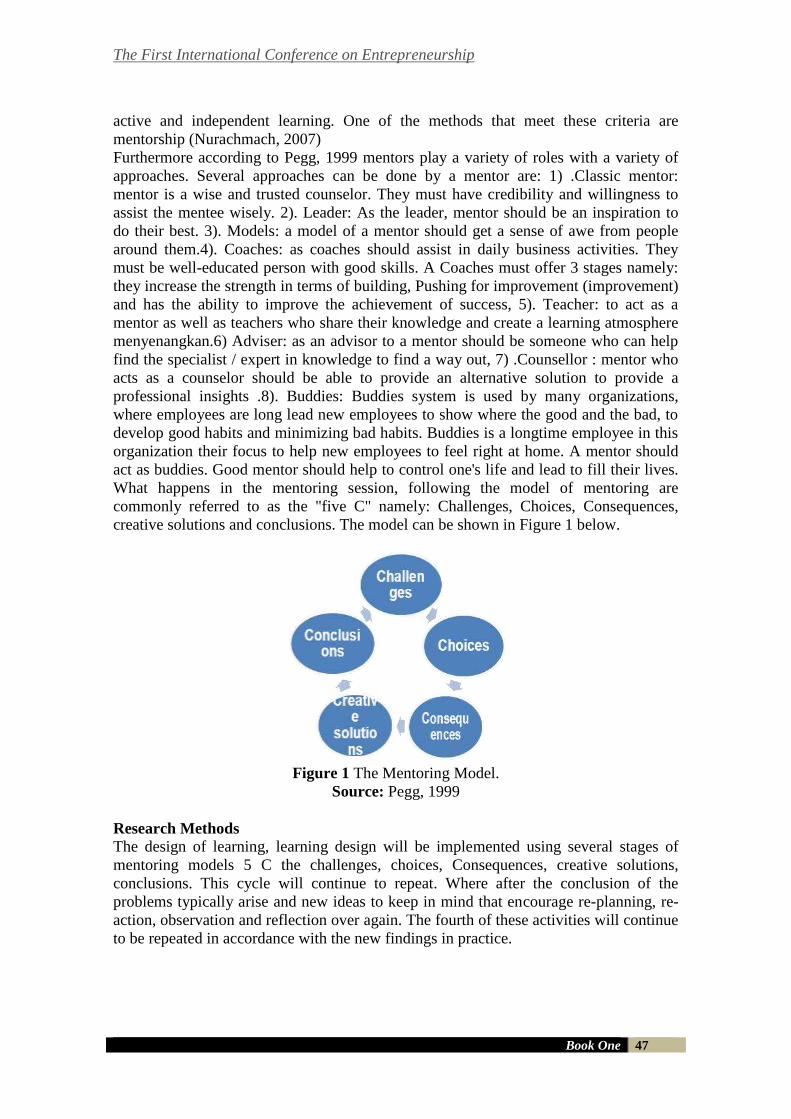
The First International Conference on Entrepreneurship
Book One 47
active and independent learning. One of the methods that meet these criteria are
mentorship (Nurachmach, 2007)
Furthermore according to Pegg, 1999 mentors play a variety of roles with a variety of
approaches. Several approaches can be done by a mentor are: 1) .Classic mentor:
mentor is a wise and trusted counselor. They must have credibility and willingness to
assist the mentee wisely. 2). Leader: As the leader, mentor should be an inspiration to
do their best. 3). Models: a model of a mentor should get a sense of awe from people
around them.4). Coaches: as coaches should assist in daily business activities. They
must be well-educated person with good skills. A Coaches must offer 3 stages namely:
they increase the strength in terms of building, Pushing for improvement (improvement)
and has the ability to improve the achievement of success, 5). Teacher: to act as a
mentor as well as teachers who share their knowledge and create a learning atmosphere
menyenangkan.6) Adviser: as an advisor to a mentor should be someone who can help
find the specialist / expert in knowledge to find a way out, 7) .Counsellor : mentor who
acts as a counselor should be able to provide an alternative solution to provide a
professional insights .8). Buddies: Buddies system is used by many organizations,
where employees are long lead new employees to show where the good and the bad, to
develop good habits and minimizing bad habits. Buddies is a longtime employee in this
organization their focus to help new employees to feel right at home. A mentor should
act as buddies. Good mentor should help to control one's life and lead to fill their lives.
What happens in the mentoring session, following the model of mentoring are
commonly referred to as the "five C" namely: Challenges, Choices, Consequences,
creative solutions and conclusions. The model can be shown in Figure 1 below.
Figure 1 The Mentoring Model.
Source: Pegg, 1999
Research Methods
The design of learning, learning design will be implemented using several stages of
mentoring models 5 C the challenges, choices, Consequences, creative solutions,
conclusions. This cycle will continue to repeat. Where after the conclusion of the
problems typically arise and new ideas to keep in mind that encourage re-planning, re-
action, observation and reflection over again. The fourth of these activities will continue
to be repeated in accordance with the new findings in practice.
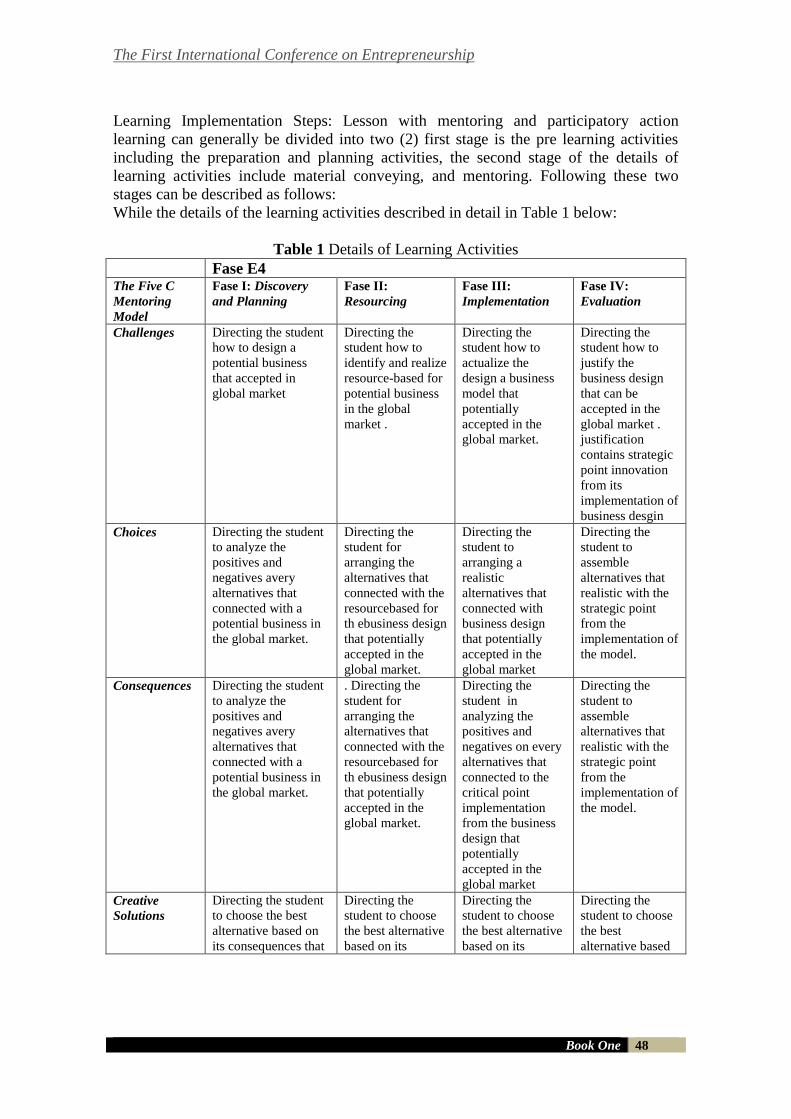
The First International Conference on Entrepreneurship
Book One 48
Learning Implementation Steps: Lesson with mentoring and participatory action
learning can generally be divided into two (2) first stage is the pre learning activities
including the preparation and planning activities, the second stage of the details of
learning activities include material conveying, and mentoring. Following these two
stages can be described as follows:
While the details of the learning activities described in detail in Table 1 below:
Table 1 Details of Learning Activities
Fase E4 The Five C
Mentoring
Model
Fase I: Discovery
and Planning
Fase II:
Resourcing
Fase III:
Implementation
Fase IV:
Evaluation
Challenges Directing the student
how to design a
potential business
that accepted in
global market
Directing the
student how to
identify and realize
resource-based for
potential business
in the global
market .
Directing the
student how to
actualize the
design a business
model that
potentially
accepted in the
global market.
Directing the
student how to
justify the
business design
that can be
accepted in the
global market .
justification
contains strategic
point innovation
from its
implementation of
business desgin
Choices Directing the student
to analyze the
positives and
negatives avery
alternatives that
connected with a
potential business in
the global market.
Directing the
student for
arranging the
alternatives that
connected with the
resourcebased for
th ebusiness design
that potentially
accepted in the
global market.
Directing the
student to
arranging a
realistic
alternatives that
connected with
business design
that potentially
accepted in the
global market
Directing the
student to
assemble
alternatives that
realistic with the
strategic point
from the
implementation of
the model.
Consequences Directing the student
to analyze the
positives and
negatives avery
alternatives that
connected with a
potential business in
the global market.
. Directing the
student for
arranging the
alternatives that
connected with the
resourcebased for
th ebusiness design
that potentially
accepted in the
global market.
Directing the
student in
analyzing the
positives and
negatives on every
alternatives that
connected to the
critical point
implementation
from the business
design that
potentially
accepted in the
global market
Directing the
student to
assemble
alternatives that
realistic with the
strategic point
from the
implementation of
the model.
Creative
Solutions
Directing the student
to choose the best
alternative based on
its consequences that
Directing the
student to choose
the best alternative
based on its
Directing the
student to choose
the best alternative
based on its
Directing the
student to choose
the best
alternative based
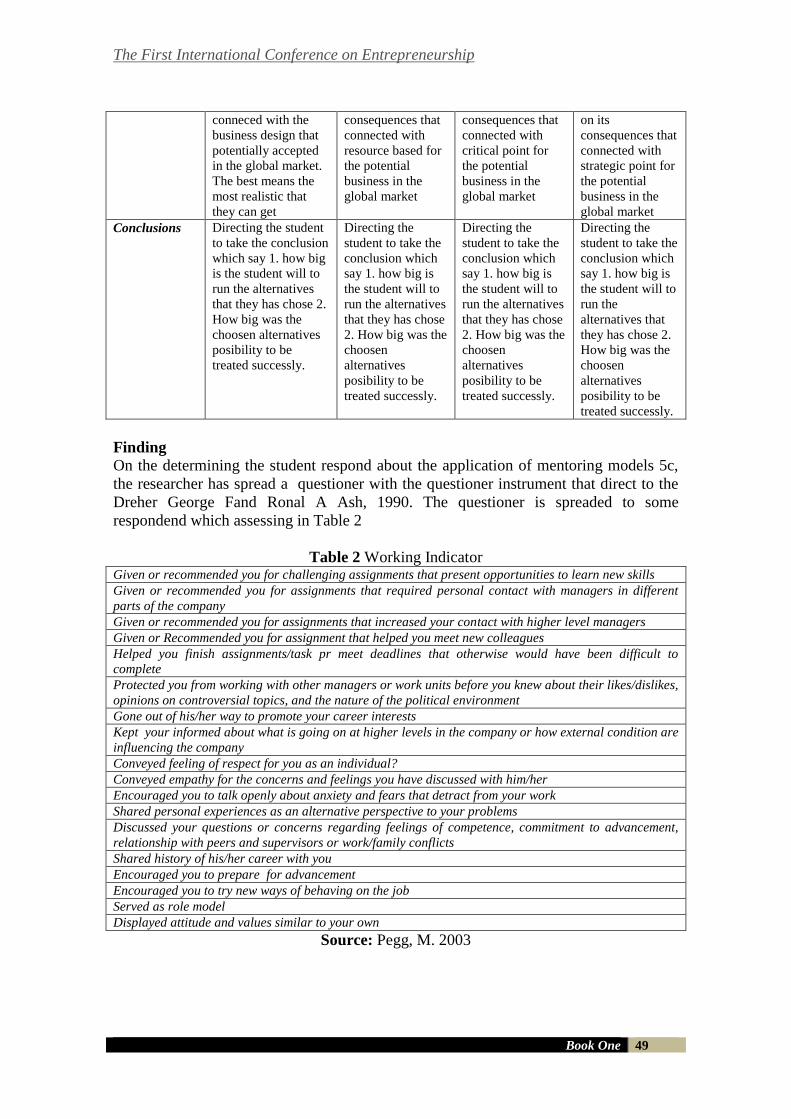
The First International Conference on Entrepreneurship
Book One 49
conneced with the
business design that
potentially accepted
in the global market.
The best means the
most realistic that
they can get
consequences that
connected with
resource based for
the potential
business in the
global market
consequences that
connected with
critical point for
the potential
business in the
global market
on its
consequences that
connected with
strategic point for
the potential
business in the
global market
Conclusions Directing the student
to take the conclusion
which say 1. how big
is the student will to
run the alternatives
that they has chose 2.
How big was the
choosen alternatives
posibility to be
treated successly.
Directing the
student to take the
conclusion which
say 1. how big is
the student will to
run the alternatives
that they has chose
2. How big was the
choosen
alternatives
posibility to be
treated successly.
Directing the
student to take the
conclusion which
say 1. how big is
the student will to
run the alternatives
that they has chose
2. How big was the
choosen
alternatives
posibility to be
treated successly.
Directing the
student to take the
conclusion which
say 1. how big is
the student will to
run the
alternatives that
they has chose 2.
How big was the
choosen
alternatives
posibility to be
treated successly.
Finding
On the determining the student respond about the application of mentoring models 5c,
the researcher has spread a questioner with the questioner instrument that direct to the
Dreher George Fand Ronal A Ash, 1990. The questioner is spreaded to some
respondend which assessing in Table 2
Table 2 Working Indicator Given or recommended you for challenging assignments that present opportunities to learn new skills
Given or recommended you for assignments that required personal contact with managers in different
parts of the company
Given or recommended you for assignments that increased your contact with higher level managers
Given or Recommended you for assignment that helped you meet new colleagues
Helped you finish assignments/task pr meet deadlines that otherwise would have been difficult to
complete
Protected you from working with other managers or work units before you knew about their likes/dislikes,
opinions on controversial topics, and the nature of the political environment
Gone out of his/her way to promote your career interests
Kept your informed about what is going on at higher levels in the company or how external condition are
influencing the company
Conveyed feeling of respect for you as an individual?
Conveyed empathy for the concerns and feelings you have discussed with him/her
Encouraged you to talk openly about anxiety and fears that detract from your work
Shared personal experiences as an alternative perspective to your problems
Discussed your questions or concerns regarding feelings of competence, commitment to advancement,
relationship with peers and supervisors or work/family conflicts
Shared history of his/her career with you
Encouraged you to prepare for advancement
Encouraged you to try new ways of behaving on the job
Served as role model
Displayed attitude and values similar to your own
Source: Pegg, M. 2003
The First International Conference on Entrepreneurship
Book One 50
Respondend Description
Respondents of this study were all students of Class B E4 Ciputra University program.
The following is a list of names and their respondent with group business project. As
described in Chapter 1 that while the goal is student learning rabuan entrepreneurial
experience and can create new ventures (business and social), or be able to develop the
family business (family business) can sustainable global challenges as well as having a
good impact for the community (ethical) and accepted by society. While learning
entrepreneurship rabuan structure consists of five semesters (3 credits each) except the
old forces before and including the year 2010, which is still taking the 2 credits with the
Global Player Advance (E6).
While the learning objectives E4 are Innovators (3sks) learning emphasis on innovation
from a student venture development with market / community there. Innovations related
to product diversification, market, network, process, finance, business models, brand or
completeness of others with permission and legal status needed to reach the global stage
player. For E4 class is divided into three broad categories namely business venture,
social venture that puts the social impact of a family or a business venture. Forms of
business venture or project for social ventures. Students continue to build his own team
or a team with a maximum of five people. Maximum capital or additional capital per
person is allowed is five million dollars, more than it had to get special permission. The
form of the project for the family business, the project is individual. Terms family
business: a). family business that has been running for more than 5 years, b). The
student will be appointed to carry on the family business and c). the student is willing to
continue these efforts. Family Business for the provision of capital is determined by the
consent of the family or a parent company or a maximum of 5 million dollars per person.
E4 subjects prepared for a 4th semester student at stage approaches the final stage of
learning Entrepreneur, considering the stage again the E5 is the final stage of learning
entrepreneurial students who have taken in semester 5. Thus projects developed by
students in the course are expected to have sufficient E4 mature and no longer in the
start up phase. For the achievement of specified learning courses E4 is to build
innovative business, where design and business innovation strategies should be
measurable. However, in reality many student projects developed in the class E4 is not
yet well established in the context of its business model. It is evident from the many
projects the students who still have a very low turnover, with the level of customer
rebuying is still very low frequency, resulting in fear of this student project business
will not survive in the long term.The students prepared to e4 to the final stage in the 4th
to the entrepreneur, as another step to e5 is a step that must be taken of the entrepreneur
in the five students.The projects are being developed by the students at this college are
mature enough to e4 and no longer on the stage is set for starting up. to e4 the lesson is
that business, build an innovative business innovation and design strategies in which it
should be measured.In fact, however, that is a lot of students in the class project e4 has
been established in terms of its business model.It is seen from many projects that have a
business turnover of a student who is very low level of customer rebuying it is very low
frequency, to take part in business worry about the students that would not survive in
the long term.Your eyes have a road map to e4 that
The First International Conference on Entrepreneurship
Book One 51
The result of all of the 5c
To address this problem on the draft is in the process of all the discovery and planning,
resourching stage, the actualization, and the evaluation and doing some research in the
process of data for any stage.The evaluation conducted in the process of all done every
facilitator / mentor to each individual student as members of a group or groups in the
following:
In Phase / Phase 1 Discovery and Planning, the respondents in this case are
all students of class B E4 get the mentoring process (The Five C Mentoring) by
the following process:
Challenges: Directs students on how to design a business that has the potential to
be accepted in the global market. Choice: Directs students to develop realistic
alternatives associated with potentially acceptable design business in the global
market, Consequences: Directing the student to assess strengths and weaknesses
of each alternative with regard to the design of potential business received in the
global market, Creative Solution: Directing students to choose the best
alternative based on the consequences of each alternative with regard to the
design of potential business received in the global market. The most realistic
best meaningful and / or best to be grabbed and Conclusion; Directing students
to draw conclusions regarding: (1) how much the desire of students to run the
chosen alternative; and (2) how likely alternative is chosen to be achieved
successfully.Challenges: Directs students on how to design a business that has
the potential to be accepted in the global market. Choice: Directs students to
develop realistic alternatives associated with potentially acceptable design
business in the global market, Consequences: Directing the student to assess
strengths and weaknesses of each alternative with regard to the design of
potential business received in the global market, Creative Solution: Directing
students to choose the best alternative based on the consequences of each
alternative with regard to the design of potential business received in the global
market. The most realistic best meaningful and / or best to be grabbed and
Conclusion; Directing students to draw conclusions regarding: (1) how much the
desire of students to run the chosen alternative; and (2) how likely alternative is
chosen to be achieved successfully.
In Phase / Phase 2 Resourcing, the respondents in this case were all
students E4
class B get the mentoring process (The Five C Mentoring) by the following
process:
Challenges: Directs students on how to identify and realize resource-based
businesses that have the potential to be accepted in the global market. Directing
:, Choice students to develop realistic alternatives related to the resource-based
businesses that have the potential to be accepted in the market
global.Consequences: Directing the student to assess strengths and weaknesses
of each alternative with regard to resource-based businesses that have the
potential to be accepted in the global market .Creative Solution: Directs students
to choose the best alternative based on the consequences of each alternative with
regard to resource-based businesses that have the potential to be accepted in the
The First International Conference on Entrepreneurship
Book One 52
global market and Conclusion; Directing students to draw conclusions
regarding: (1) how much the desire of students to run the chosen alternative; and
(2) how likely alternative is chosen to be achieved successfully.
On Stage / Phase 3 Implementation of the respondents in this case were all
students of class B E4 get the mentoring process (The Five C Mentoring) by the
following process: Challenges: Directs students on how to actualize the design /
business model that has the potential to be accepted in the global market.
Choice: Directs students to develop realistic alternatives related to the critical
point implementation of design / business model that has the potential to be
accepted in the global market. Consequences: Directing the student to assess
strengths and weaknesses of each alternative with regard to the critical point
implementation design / business model that has the potential to be accepted in
the market global.Creative Solution: Directs students to choose the best
alternative based on the consequences of each alternative with regard to the
critical point implementation design / business model potentially acceptable in
the market global.dan Conclusion; Directing students to draw conclusions
regarding: (1) how much the desire of students to run the chosen alternative; and
(2) how likely alternative is chosen to achieve with success .
in Phase / Phase 4 Evaluation of the respondents in this case were all
students of class B E4 get the mentoring process (The Five C Mentoring) by the
following process: Challenges: Directs students on how to justify the design /
business model that has the potential to be accepted in the global market.
Justification includes the invention of the strategic points of the implementation
of the design / business model .. Awards: Directing students to develop realistic
alternatives related to the strategic point of implementation design / business
model .. Consequences: Directing the student to assess strengths and weaknesses
of each alternative with regard to strategic point of implementation design /
business model. Creative Solution: Directs students to choose the best
alternative based on the consequences of each alternative related to the strategic
point of implementation design / model bisnis.dan Conclusion; Directing
students to draw conclusions regarding: (1) how much the desire of students to
run the chosen alternative; and (2) how likely alternative is chosen to be
achieved successfully.
The process of all the five ( c ) of all this was done consistently and over again,
or in any phase of the class b e4 learning, in studies conducted in the second
week and the fourth week of the twelve.An evaluation be made by the middle of
this process to the presentation sunday ( 8 ) eight uts ( a ) with the results of the
term examination of the facilitator is the following: those with the highest value
is the 21,1 80 % of the value of, as the next was 78 % 18,4 by the percentage of
the students of that is good enough
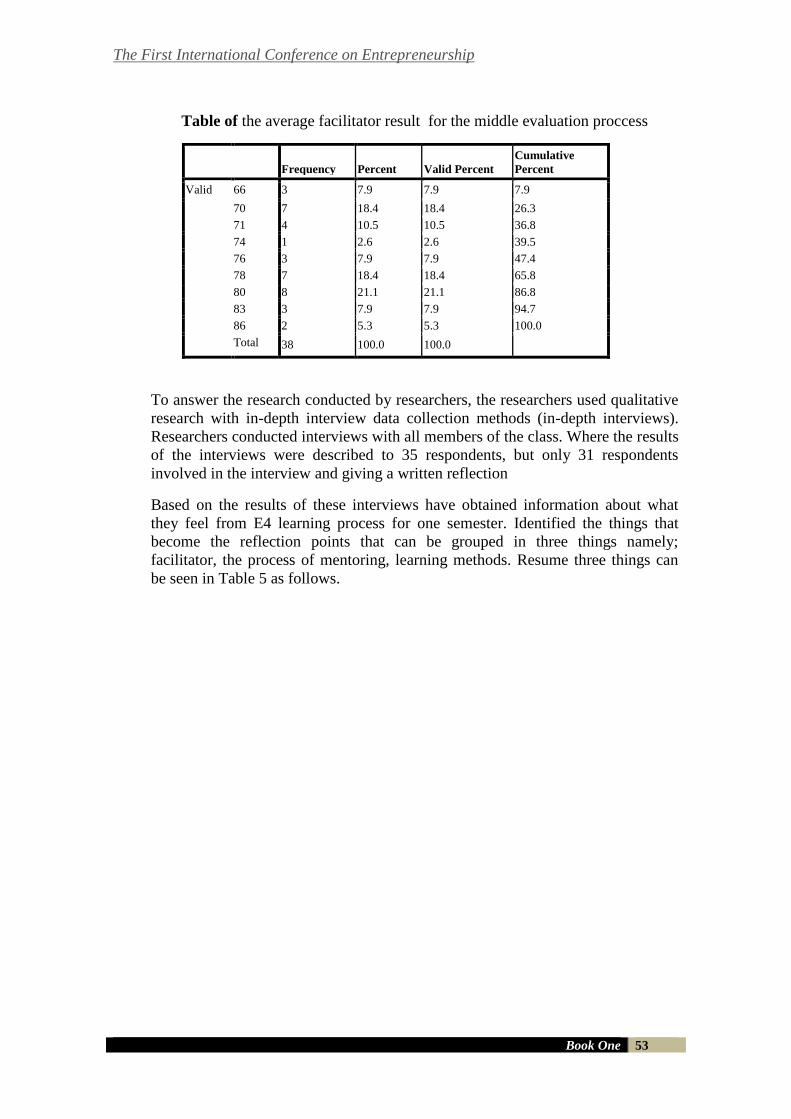
The First International Conference on Entrepreneurship
Book One 53
Table of the average facilitator result for the middle evaluation proccess
Frequency Percent Valid Percent
Cumulative
Percent
Valid 66 3 7.9 7.9 7.9
70 7 18.4 18.4 26.3
71 4 10.5 10.5 36.8
74 1 2.6 2.6 39.5
76 3 7.9 7.9 47.4
78 7 18.4 18.4 65.8
80 8 21.1 21.1 86.8
83 3 7.9 7.9 94.7
86 2 5.3 5.3 100.0
Total 38 100.0 100.0
To answer the research conducted by researchers, the researchers used qualitative
research with in-depth interview data collection methods (in-depth interviews).
Researchers conducted interviews with all members of the class. Where the results
of the interviews were described to 35 respondents, but only 31 respondents
involved in the interview and giving a written reflection
Based on the results of these interviews have obtained information about what
they feel from E4 learning process for one semester. Identified the things that
become the reflection points that can be grouped in three things namely;
facilitator, the process of mentoring, learning methods. Resume three things can
be seen in Table 5 as follows.
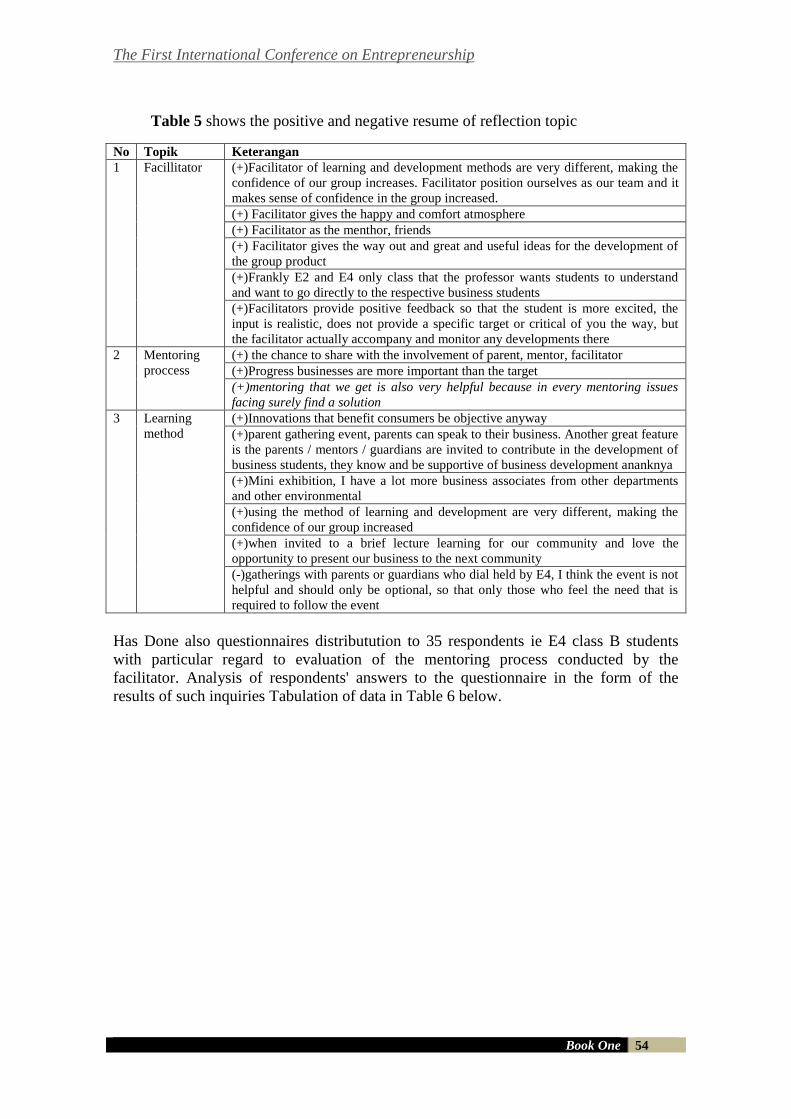
The First International Conference on Entrepreneurship
Book One 54
Table 5 shows the positive and negative resume of reflection topic
No Topik Keterangan
1 Facillitator (+)Facilitator of learning and development methods are very different, making the
confidence of our group increases. Facilitator position ourselves as our team and it
makes sense of confidence in the group increased.
(+) Facilitator gives the happy and comfort atmosphere
(+) Facilitator as the menthor, friends
(+) Facilitator gives the way out and great and useful ideas for the development of
the group product
(+)Frankly E2 and E4 only class that the professor wants students to understand
and want to go directly to the respective business students
(+)Facilitators provide positive feedback so that the student is more excited, the
input is realistic, does not provide a specific target or critical of you the way, but
the facilitator actually accompany and monitor any developments there
2 Mentoring
proccess
(+) the chance to share with the involvement of parent, mentor, facilitator
(+)Progress businesses are more important than the target
(+)mentoring that we get is also very helpful because in every mentoring issues
facing surely find a solution
3 Learning
method
(+)Innovations that benefit consumers be objective anyway
(+)parent gathering event, parents can speak to their business. Another great feature
is the parents / mentors / guardians are invited to contribute in the development of
business students, they know and be supportive of business development ananknya
(+)Mini exhibition, I have a lot more business associates from other departments
and other environmental
(+)using the method of learning and development are very different, making the
confidence of our group increased
(+)when invited to a brief lecture learning for our community and love the
opportunity to present our business to the next community
(-)gatherings with parents or guardians who dial held by E4, I think the event is not
helpful and should only be optional, so that only those who feel the need that is
required to follow the event
Has Done also questionnaires distributution to 35 respondents ie E4 class B students
with particular regard to evaluation of the mentoring process conducted by the
facilitator. Analysis of respondents' answers to the questionnaire in the form of the
results of such inquiries Tabulation of data in Table 6 below.
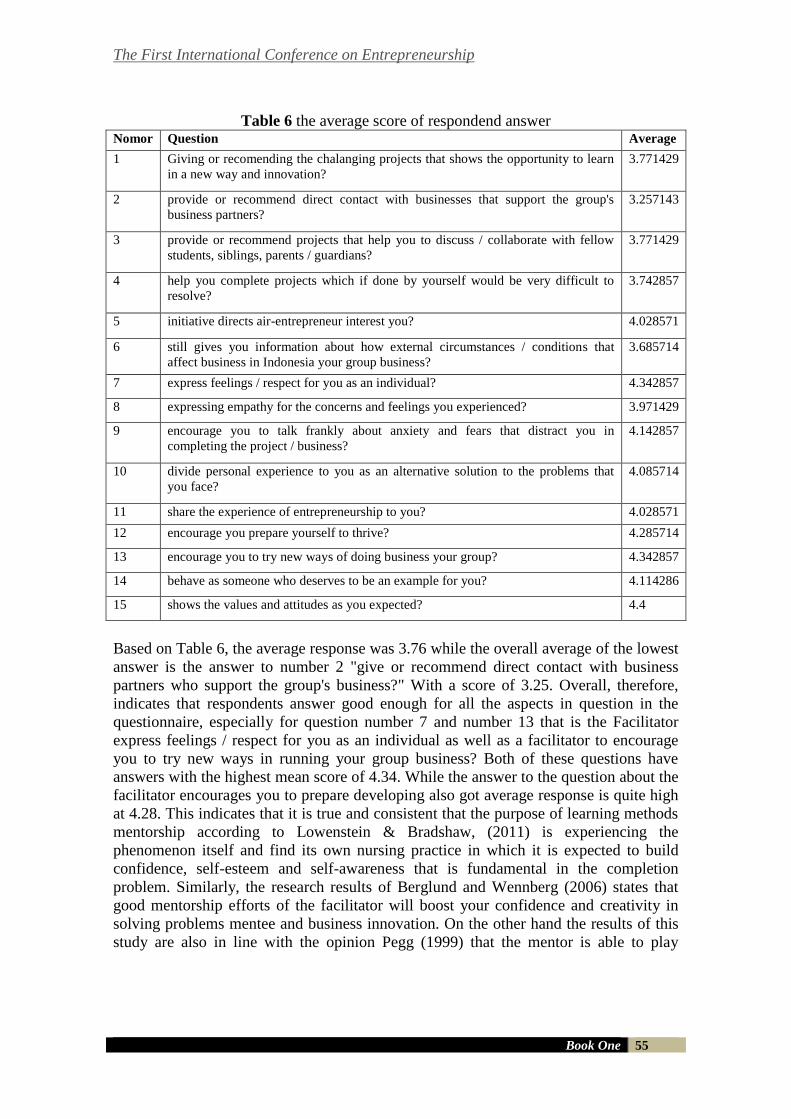
The First International Conference on Entrepreneurship
Book One 55
Table 6 the average score of respondend answer Nomor Question Average
1 Giving or recomending the chalanging projects that shows the opportunity to learn
in a new way and innovation?
3.771429
2 provide or recommend direct contact with businesses that support the group's
business partners?
3.257143
3 provide or recommend projects that help you to discuss / collaborate with fellow
students, siblings, parents / guardians?
3.771429
4 help you complete projects which if done by yourself would be very difficult to
resolve?
3.742857
5 initiative directs air-entrepreneur interest you? 4.028571
6 still gives you information about how external circumstances / conditions that
affect business in Indonesia your group business?
3.685714
7 express feelings / respect for you as an individual? 4.342857
8 expressing empathy for the concerns and feelings you experienced? 3.971429
9 encourage you to talk frankly about anxiety and fears that distract you in
completing the project / business?
4.142857
10 divide personal experience to you as an alternative solution to the problems that
you face?
4.085714
11 share the experience of entrepreneurship to you? 4.028571
12 encourage you prepare yourself to thrive? 4.285714
13 encourage you to try new ways of doing business your group? 4.342857
14 behave as someone who deserves to be an example for you? 4.114286
15 shows the values and attitudes as you expected? 4.4
Based on Table 6, the average response was 3.76 while the overall average of the lowest
answer is the answer to number 2 "give or recommend direct contact with business
partners who support the group's business?" With a score of 3.25. Overall, therefore,
indicates that respondents answer good enough for all the aspects in question in the
questionnaire, especially for question number 7 and number 13 that is the Facilitator
express feelings / respect for you as an individual as well as a facilitator to encourage
you to try new ways in running your group business? Both of these questions have
answers with the highest mean score of 4.34. While the answer to the question about the
facilitator encourages you to prepare developing also got average response is quite high
at 4.28. This indicates that it is true and consistent that the purpose of learning methods
mentorship according to Lowenstein & Bradshaw, (2011) is experiencing the
phenomenon itself and find its own nursing practice in which it is expected to build
confidence, self-esteem and self-awareness that is fundamental in the completion
problem. Similarly, the research results of Berglund and Wennberg (2006) states that
good mentorship efforts of the facilitator will boost your confidence and creativity in
solving problems mentee and business innovation. On the other hand the results of this
study are also in line with the opinion Pegg (1999) that the mentor is able to play
The First International Conference on Entrepreneurship
Book One 56
several roles namely Classic mentor: mentor is a wise and trusted counselor. They must
have credibility and willingness to assist the mentee wisely. Leader: As the leader of a
mentor should be an inspiration to do my best. Models: a model of a mentor should get
a sense of awe from the people around him. Coaches: as coaches should assist in daily
business activities. They must be well-educated person with good skills. A Coaches
must offer 3 stages namely: they increase the strength in terms of building, Pushing for
improvement (improvement) and has the ability to improve the achievement of success,
Teacher: as a mentor should act as well as teachers who share their knowledge and
make learning fun. Adviser: as an advisor to a mentor should be someone who can help
find the specialist / expert in knowledge to find a way out, Counsellor: mentor who acts
as a counselor should be able to provide an alternative solution by providing
professional insights, Buddies: Buddies system used by many organizations, where
employees are long lead new employees to show where the good and the bad, to
develop good habits and minimizing bad habits. Buddies is a longtime employee in this
organization their focus to help new employees to feel right at home. A mentor should
act as buddies. Good mentor should help to control one's life and lead to fill their lives.
What happens in the mentoring session, following the model of mentoring are
commonly referred to as the "five C" namely: Challenges, Choices, Consequences,
creative solutions and conclusions
CONCLUSION
Based on the data analysis and discussion, there are several conclusions that can be
presented in this study is
1. 5C Application of mentoring models on stage discovery and planning,
resourcing, implementation and evaluation on E4 is subject Challenges: students
more focused on how to design a business that has the potential to be accepted in
the global market. Choice students more focused to develop realistic alternatives
related to the design of potential business received in the global market,
Consequences: more focused student to assess strengths and weaknesses of each
alternative with regard to the design of potential business received in the global
market, Creative Solution: student more directed to choose the best alternative
based on the consequences of each alternative with regard to the design of
potential business received in the global market. The most realistic best
meaningful and / or best to be grabbed and Conclusion; students more directed
to interesting conclusions regarding: (1) how much the desire of students to run
the chosen alternative; and (2) how likely alternative is chosen to achieve a
successful
2. Student response to the application of the model 5C on 4 subjects
Entrepreneurship (Innovation) is divided into three terms of the facilitator, the
process of mentoring, learning methods. Facilitator: to empower students,
mentoring process: lead to the discovery of solutions and foster student self-
confidence, learning methods: fun.
The First International Conference on Entrepreneurship
Book One 57
SUGGESTION
Based on data analysis and discussion then there are some suggestions that can be
presented in this study are: The need for a mentor to provide or recommend direct
contact with business partners supporting the business group.
REFERENCE
Berglund H & Wennberg K , 2006. Creativity Among Entrepreneurship Students: Comparing Engineering and
Business Education, International Journal of Continuing Engineering Education, Vol 16. No. %., pp. 366-
79
Dreher Goerge F & Ronald A. Ash, 1990. A Comparative Study of Mentoring Among Men and
Woman in Managerial, Profesional and Technical Positions, Journal of Applied
Psychology Vol 75, No.5, 539-546.
Fuller SS. Enabling, 2000. Empowering. Inspiring: Research and Mentorship. Journal of Small
Business and Enterprise Development Vol 22 pp 88:l10.
Green BL. Rivers BM, Arekere DM. 2006. Mentoring: a Framework for Developing Health
Disparities Researchers. Journal of Health Promot Pract, Vol 7; 336-3 4 5.
Hamidi Yar Daniel, Karl Wennberg, Henrik Berglund, 2008. Creativity in Entrepreneurship
Education, Journal of Small Business and Enterprise Development, Vol 15. No.2., pp
304-320
http://www.scribd.com/doc/116217471/Perceptorship-Dan-Mentorship
Lowenstein & Bradshaw, 2011, Evaluating and Measuring Entrepreneurship and Enterprise
Education: Methods, Tools and Practises, International Journal of Entrepreneurship
Education, Vol., pp 5-24
Pegg, M. 2003. The Art of Mentoring, Management, Books 2000 Ltd., ISBN 1-85252-272-0
Pegg,M. 1999, The Art of Mentoring. Industrial and Commercial Training, 31, 136-141
Ramani S, fipen L, Kachur EK. 2010. Twelve Tips for Developing Mentoring. Med Teach., Vol.
28;404-408.
Rabionet, Silvia E. Rabionet, Ed, Lydia E. Santiago, and Carmen D. Zorrilla, MD, 2006. A
Multifaceted Mentoring Model for Minority Researchers to Address HIV Health
Disparitie, Journal of Health Promot Pract, Vol 6; 336-3 4 5
Sambunja D. Straus SF,, Manjsic A. 2009. Mentoring in Academic Medidne: a systematic
review. 296:1 103-1 115
Schnibbe KF, 2004. Mentoring: A Component For Professional Growth and Academic
6B(3}:324-328.

The First International Conference on Entrepreneurship
Book One 58
Sudjana, 2009, http://elsayangawi.wordpress.com/about-2/model-bermain-peran-dalam-
pembelajaran-partisipatif.
US Department of Eduealion. 2009. United States Departement of Education Lists of
postsecondary Minonty Institutions. Available at; http://www.ed.gov/ahout/ofñ ces/l
ist/ocr/ed lite-minorityinst.html. Acce.ssed January 3, 2009.
Winkelmaii M, 2005. Cultural Sensitivity and Competence, Peosta. IA: Eddie Bower Publishing,
Zambrano RE, Molnar C, Baras-Muñoz H, Salas-Lopez D. 2004. Cultural Competency as it
Ethnic, Linguistic, and Class Parities in Managed Health Organizations. 10 (siippl);37-
44.
The First International Conference on Entrepreneurship
Book One 59
ASYMMETRY INFORMATION AND CREDIT RISK EFFECT ON
LOAN PRICING IN ASIA PACIFIC 2006-2010
Ivana Alim1, Deddy Marciano2, James Bartle3
Alumny of Universitas Surabaya, Universitas Surabaya, University of New South
Wales (UNSW) INDONESIA, INDONESIA, WALES
Email: [email protected]
ABSTRACT
The purpose of this research is to test the relationship of the independent
variables (commercial bank, mix bank, country risk, CPI, foreign lender, log
amount, maturity, ticker, secure, senior, deal purpose, and sector industries) to
the dependent variables (loan spread). Key issues in this study consisted of
information asymmetry, moral hazard, adverse selection and country risk. The
results of this research shows the variable that significantly affect the loan
pricing decisions by lenders especially in Asia Pacific countries. Borrowers in
Asia Pacific can learn from the lender’s behavior in the loan pricing decision.
They also can have more knowledge on the determinants influence the
procedure of the loan pricing. Governments of the Asia Pacific countries can
use this study to gain more information about factors that influence the loan
pricing. They should make a regulation according loan pricing decisions and
they should monitored the process of the loans for the local banks so they
wouldn’t be bankrupt because loans in Asia Pacific contains high risk.
Keywords : Asymmetry Information, Credit Risk, Loan Pricing.
INTRODUCTION
Loan pricing is a critically important topic in the study of financial institutions (Swank,
1996).There are many research about loan pricing and what is considered in the loan
pricing, but this research is contributing on the behavior in Asia Pacific region while the
other research is conducting the research in the developing countries such as U.S and
Europe which are already well regulated. Researcher also focusing this study on the
country risk effect and the other credit risk that is considered by lenders in the loan
pricing.
The most substantial theories affecting variables in loan pricing decision are asymmetric
information and moral hazard theories (Sinkey, 2002; Heffernan, 1996). In Indonesia,
asymmetric information becomes a serious issue related to the insufficient monitoring
system from creditor and the weakness of financial system regulation. This situation
creates unique aspect for loan pricing research in Indonesia caused by high level of
asymmetric information, which is different from the previous research conducted in
USA and Europe with low level of asymmetric information.
The First International Conference on Entrepreneurship
Book One 60
Country characteristics has an important role in shaping the loan pricing despite the
availability of financial information related to borrower. This is because the risk of
asymmetry information in the Asia Pacific countries is greater than the U.S. or
Europe, so the lender need to assess the risks that could affect the ability of borrower to
repay the loan.Comparing risk assessment and loan pricing by domestic lenders and
foreign lenders are also conducted by Atmojo (2004). Atmojo (2004) explains that
domestic lenders are in a good position to easily obtain information and more cost
efficient than the foreign lenders.
Atmojo (2004) also categorize corporate lending based on listed and non listed
borrowers.For listed borrowers which shares traded on the stock exchange, the
information will be more easily obtained. (Booth, 1992) also explained that publicly
owned companies will reduce a lower asymmetric information and monitoring cost, as
well caused a lower risk, since the borrower maintain their transparency which results
in a lower/cheaper loan pricing.
For type of creditor, there are 2 kinds of banks which are commercial bank and
investment bank. Marciano (2008) explained that commercial bank have a better ability
to reduce assymmetric information compare to investment bank. Furthermore, the loan
size that the lenders give to the borrower is representing the quality of the borrower to
decide the spread given.
In finance, maturity or maturity date refers to the final payment date of a loan or other
financial instrument, at which point the principal (and all remaining interest) is due to
be paid. It represents that the riskier the company, lenders will tend to give shorter term
maturity so they can reevaluate it, thus lenders will give high spread to cover high risk
that the company have (Barclay and Smith, 1995; Stoch and Mauer, 1996).
Another variable that needs to be considered is whether the loan is secured with the
collateral or not. The definition of collateral in Winton and Rajan (1995) is as a
“specific assets pledged as security for a loan”. Bester (1985), Besanko and Thakor
(1987) stated that the borrower could have a good credit risk quality by offering a
collateral. While for seniority, if the loan is senior it means it will be paid first than the
subordinates loan. This suggests that senior loans will be charged lower loan spread by
lender.
LITERATURE REVIEW
Lasmono and Marciano (2010) explained that the high rate of corruption perception
index shows the common practice of bribe and misused fundings in the bureaucrat,
which could lead to borrower’s false action such as issuing a misleading financial report,
false tax report, etc. Country with high corruption perception index indicates that the
asymmetry information also greater, thus the lenders will enlarge the loan spread. H1 :
The higher the corruption rate will results in a higher loan spread. Listed company is monitored by the investors, public claimholders, analysts or bond
rating agencies all the time through cross monitoring. The situation where the
information is easier to obtain could reduce the level of asymmetry information between
lenders and borrowers (Marciano, 2008). Therefore, listed borrowers will have lower
loan spread compared with non listed borrowers (Booth, 1992). H2 : Listed company
makes lender gives lower loan spread.
The First International Conference on Entrepreneurship
Book One 61
There are findings from Goldberg, Dages, and Kinney (2000) who explained that
foreign banks will have better performance in lending to developing countries if the
foreign bank may cooperate with the domestic banks located in that country. Atmojo
(2004) explained that domestic lenders are in a good position to easily obtain
information and more cost efficient than the foreign lenders. Therefore, foreign lenders
will have higher loan spread than the domestic lenders. H3 : Foreign lenders gives
higher loan spread compare to domestic lenders. The result of the research conducted by Tanjung and Marciano (2012) shows that
investment bank has poor monitoring capabilities, so they will increase the lead share to
get a better monitoring ability. Drucker and Puri (2003) also explained that the
investment bank has a higher monitoring costs due to weak evaluation capability
compare to commercial bank. H4 : Commercial bank gives lower loan spread
compare to investment bank. Country risk is an an index measuring the risk of a country that is based on credit risk
and political risk (Tanjung, 2012). No matter how good the company's financial
performance, it will have a high risk if the country condition is unstable (Tanjung,
2012). This condition leads the lender to give higher loan spread to the country that
have high country risk. H5 : The higher the country risk will results in a higher loan
spread. There are negative relationship between maturity and loan spread.The riskier the
company, lenders will tend to give shorter term maturity so they can reevaluate it, thus
lenders will give higher spread to cover high risk that the company have. Lasmono
(2010) also explained that it is because a short term maturity will results in a more
frequent due time payment extension request by the borrower, and cause a more
frequent monitoring activities by the lenders. H6 : Longer maturity makes lender
gives lower loan spread. Smith and Warner (1979) shows that secured loans need more monitoring than
unsecured loans or loan without collateral. The existence of collateral assumed as a
signal of high risk loan (Harhoff and Korting, 1998). In conclusion, loan with collateral
is considered riskier thus lender will assigned higher loan spread to the borrower. H7 :
Secured loans makes lender gives higher loan spread. The findings of research conducted by Tanjung and Marciano (2012) are consistent with
research by Godlewski and Weill (2007) which stated that the existence of seniority
would lead a lower need of lead arranger to monitor the borrower, thus the loan spread
will be reduced. This suggests that senior loans will be charged lower loan spread by
lender. H8 : Senior loans makes lender gives lower loan spread.
RESEARCH METHOD
Data collection procedure begins with collecting all transactions data from the data of
all loan corporations that were recorded on Dealscan LPC (Loan Pricing Corporation).
From the data, this research sort it based on these characteristics: (1) loan contracts in
the period 2006 – 2010 (2) loans located in the Asia Pacific region, specifically in 17
countries, i.e. China, Japan, Australia, South Korea, Indonesia, Taiwan, Thailand,
Malaysia, Hong Kong, Singapore, Philippines, Sri Lanka, Vietnam, Bangladesh, Macau,
Cambodia and Laos (3) U.S. dollar denomination loans (4) loans with LIBOR base rate.
After following the characteristics, the sample have total 886 loan transactions.
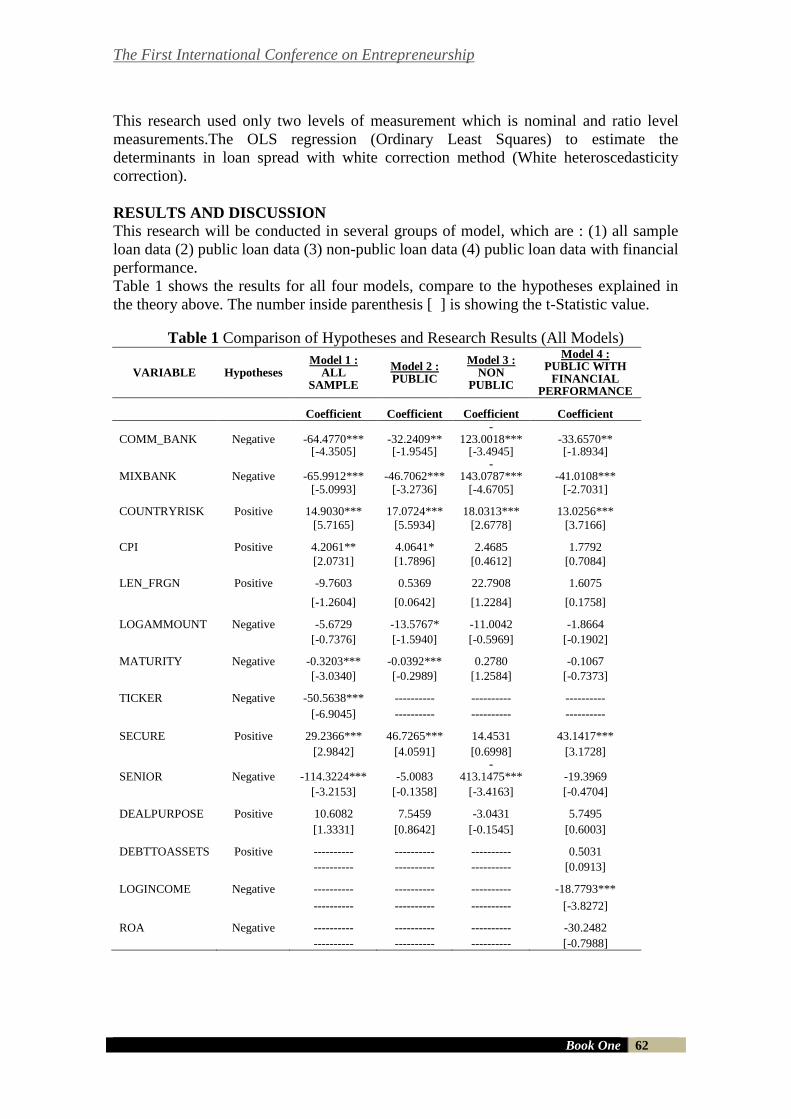
The First International Conference on Entrepreneurship
Book One 62
This research used only two levels of measurement which is nominal and ratio level
measurements.The OLS regression (Ordinary Least Squares) to estimate the
determinants in loan spread with white correction method (White heteroscedasticity
correction).
RESULTS AND DISCUSSION
This research will be conducted in several groups of model, which are : (1) all sample
loan data (2) public loan data (3) non-public loan data (4) public loan data with financial
performance.
Table 1 shows the results for all four models, compare to the hypotheses explained in
the theory above. The number inside parenthesis [ ] is showing the t-Statistic value.
Table 1 Comparison of Hypotheses and Research Results (All Models)
VARIABLE Hypotheses Model 1 :
ALL SAMPLE
Model 2 : PUBLIC
Model 3 : NON
PUBLIC
Model 4 : PUBLIC WITH
FINANCIAL PERFORMANCE
Coefficient Coefficient Coefficient Coefficient
COMM_BANK Negative -64.4770*** -32.2409** -
123.0018*** -33.6570**
[-4.3505] [-1.9545] [-3.4945] [-1.8934]
MIXBANK Negative -65.9912*** -46.7062*** -
143.0787*** -41.0108***
[-5.0993] [-3.2736] [-4.6705] [-2.7031]
COUNTRYRISK Positive 14.9030*** 17.0724*** 18.0313*** 13.0256***
[5.7165] [5.5934] [2.6778] [3.7166]
CPI Positive 4.2061** 4.0641* 2.4685 1.7792
[2.0731] [1.7896] [0.4612] [0.7084]
LEN_FRGN Positive -9.7603 0.5369 22.7908 1.6075
[-1.2604] [0.0642] [1.2284] [0.1758]
LOGAMMOUNT Negative -5.6729 -13.5767* -11.0042 -1.8664
[-0.7376] [-1.5940] [-0.5969] [-0.1902]
MATURITY Negative -0.3203*** -0.0392*** 0.2780 -0.1067
[-3.0340] [-0.2989] [1.2584] [-0.7373]
TICKER Negative -50.5638*** ---------- ---------- ----------
[-6.9045] ---------- ---------- ----------
SECURE Positive 29.2366*** 46.7265*** 14.4531 43.1417***
[2.9842] [4.0591] [0.6998] [3.1728]
SENIOR Negative -114.3224*** -5.0083 -
413.1475*** -19.3969
[-3.2153] [-0.1358] [-3.4163] [-0.4704]
DEALPURPOSE Positive 10.6082 7.5459 -3.0431 5.7495
[1.3331] [0.8642] [-0.1545] [0.6003]
DEBTTOASSETS Positive ---------- ---------- ---------- 0.5031
---------- ---------- ---------- [0.0913]
LOGINCOME Negative ---------- ---------- ---------- -18.7793***
---------- ---------- ---------- [-3.8272]
ROA Negative ---------- ---------- ---------- -30.2482
---------- ---------- ---------- [-0.7988]
The First International Conference on Entrepreneurship
Book One 63
The test results showed negative and significant coefficient at 1% between loan spread
with commercial bank . This shows that commercial bank lender have the tendency to
give lower loan spread to the borrower. This happened because commercial bank have a
better ability to reduce asymmetric information compare to investment bank that will
lead to a cheaper loan pricing decision (Marciano, 2008). This research results is in
accordance with the research results conducted by Tanjung and Marciano (2012) that
conclude significant negative relationships between loan spread and commercial bank.
Mix bank variable showed negative and significant coeficient at 1%.The results of this
analysis is in accordance with the statement of Drucker and Puri (2003) which revealed
that the investment bank has a higher monitoring costs due to weak evaluation
capability compare to commercial bank. While Gupta, Singh, and Zebedee (2008) adds
that universal banks are more flexible than an investment bank because the bank
function are between investment banks and universal banks.
Countryrisk variable showed positive and significant coeficient at 1%. This suggests
that the riskier the country, the higher the loan spread. In their book, Jorion (2002),
Heffernan (2008), Eaton et al., (1894) stated that credit risk is a risk of borrower’s
incapability to perform their duties as stated in loan agreement, which means that the
borrower could not paid the loans because of bankruptcy, or late payment for loan’s
interest. This findings is in accordance with the findings of Lasmono and Marciano
(2010) who found that higher risk of loan will cause lender to require greater
monitoring capabilities.
CPI variable showed positive and significant coeficient at 5%. This suggests that the
higher the corruption index will lead the lender to assign higher spread. Because the
lenders will try to protect themselves by increasing its monitoring capabilities. This
finding is similar with the research done by Lasmono and Marciano (2010) which
explained that when the level of corruption of a country is very high, then the
asymmetry information also predicted to be greater, thus the lenders will enlarge its
share.
Maturity variable showed negative and significant coeficient at 1%. This shows that the
longer the maturity given, lender will assign lower spread because a long term maturity
indicates that the lender didn’t need to reevaluate or remonitoring oftenly. Shorter term
maturity rate will give a chance for creditor to reevaluate or remonitoring when the
loan is due, which mean there is positive coeficient between maturity rate with debtor’s
quality (Barclay and Smith, 1995; Stoch and Mauer, 1996). If the debtor’s quality is
good, it means that the risk of the company could not paid the loan is lower. Thus, the
lender will give lower loan spread to a long term maturity date.
Ticker variable showed negative and significant coeficient at 1%. The finding is
consistent with the results of Denis and Mulleneaux (2000) which revealed that if the
borrower is registered in the capital markets, it may reduce the lender’s monitoring
cost. It is also supported by the findings of Booth (1992) which explained that listed
borrowers will have lower loan spread because there are cross monitoring that
conducted by the public claimholders, analyst and bond rating agencies. Information is
easier to obtain in listed company than private or non listed company, the situation
where the information is easier to obtain could reduce the level of asymmetry
information between lenders and borrowers.
The First International Conference on Entrepreneurship
Book One 64
Secure variable showed positive and significant coeficient at 1%. This suggests that if
there is a guarantee / collateral in the loan, the loan spread will be higher. The findings
are consistent with the results from Tanjung and Marciano (2012). Berger, Udell (1990)
also associated collateral with a riskier loans, since collateral usually are found in a loan
transaction that need more monitoring. The existence of collateral assumed as a signal
of high risk loan (Harhoff and Korting, 1998). Smith and Warner (1979) shows that
secured loans need more monitoring than unsecured loans or loan without collateral. In
conclusion, loan with collateral is considered riskier thus lender will assign higher loan
spread to the borrower.
Senior variable showed negative and significant coeficient at 1%. This suggests that if
the loan is senior, the lender will assign lower spread because the existence of seniority
would lead a lower need of lenders to monitor the borrower (Godlewski and Weill,
2007). The findings are consistent with research by Tanjung and Marciano (2012)
which showed a negative and significant coeficient for seniority variable.
The test results for model 2 showed negative and significant coeficient at 5% between
loan spread with commercial bank . This shows that commercial bank lender have the
tendency to give lower loan spread to the borrower. This happened because commercial
bank have a better ability to reduce asymmetric information compare to investment
bank that will lead to a cheaper loan pricing decision (Marciano, 2008). This research
results is in accordance with the research results conducted by Tanjung and Marciano
(2012) that conclude significant negative relationships between loan spread and
commercial bank.
Mix bank variable showed negative and significant coeficient at 1%. The results of this
analysis is in accordance with the statement of Drucker and Puri (2003) which revealed
that the investment bank has a higher monitoring costs due to weak evaluation
capability compare to commercial bank. While Gupta, Singh, and Zebedee (2008) adds
that universal banks are more flexible than an investment bank because the bank
function are between investment banks and universal banks.
Countryrisk variable showed positive and significant coeficient at 1%. This suggests
that the riskier the country, the higher the loan spread. In their book, Jorion (2002),
Heffernan (2008), Eaton et al., (1894) stated that credit risk is a risk of borrower’s
incapability to perform their duties as stated in loan agreement, which means that the
borrower could not paid the loans because of bankruptcy, or late payment for loan’s
interest. This findings is in accordance with the findings of Lasmono and Marciano
(2010) who found that higher risk of loan will cause lender to require greater
monitoring capabilities.
CPI variable showed positive and significant coeficient at 10%. This suggests that the
higher the corruption index will lead the lender to assign higher spread. Because the
lenders will try to protect themselves by increasing its monitoring capabilities. This
finding is similar with the research done by Lasmono and Marciano (2010) which
explained that when the level of corruption of a country is very high, then the
asymmetry information also predicted to be greater, thus the lenders will enlarge its
share.
Secure variable showed positive and significant coeficient at 1%. This suggests that if
there is a guarantee / collateral in the loan, the loan spread will increase. Berger, Udell
(1990) also associated collateral with a riskier loans, since collateral usually are found
The First International Conference on Entrepreneurship
Book One 65
in a loan transaction that need more monitoring. The existence of collateral assumed as
a signal of high risk loan (Harhoff and Korting, 1998). Smith and Warner (1979) shows
that secured loans need more monitoring than unsecured loans or loan without collateral.
In conclusion, loan with collateral is considered riskier thus lender will assign higher
loan spread to the borrower.
The test results for model 3 showed negative and significant coeficient at 1% between
loan spread with commercial bank . This shows that commercial bank lender have the
tendency to give lower loan spread to the borrower. This happened because commercial
bank have a better ability to reduce asymmetric information compare to investment
bank that will lead to a cheaper loan pricing decision (Marciano, 2008). This research
results is in accordance with the research results conducted by Tanjung and Marciano
(2012) that conclude significant negative relationships between loan spread and
commercial bank.
Mix bank variable showed negative and significant coeficient at 1%. This suggests that
the lender with mixed functions (commercial and investment banks) would have a better
monitoring capability compared to omitted variable (investment bank) so the spread
will be decline and credit risk exposure of the overall lenders will be reduced as well
(Tanjung and Marciano, 2012).The results of this analysis is in accordance with the
statement of Drucker and Puri (2003) which revealed that the investment bank has a
higher monitoring costs due to weak evaluation capability compare to commercial
bank. While Gupta, Singh, and Zebedee (2008) adds that universal banks are more
flexible than an investment bank because the bank function are between investment
banks and universal banks.
Countryrisk variable showed positive and significant coeficient at 1%. This suggests
that the riskier the country, the higher the loan spread. In their book, Jorion (2002),
Heffernan (2008), Eaton et al., (1894) stated that credit risk is a risk of borrower’s
incapability to perform their duties as stated in loan agreement, which means that the
borrower could not paid the loans because of bankruptcy, or late payment for loan’s
interest. This findings is in accordance with the findings of Lasmono and Marciano
(2010) who found that higher risk of loan will cause lender to require greater
monitoring capabilities.
Senior variable showed negative and significant coeficient at 1%. This suggests that if
the loan is senior, the lender will assign lower spread because the existence of seniority
would lead a lower need of lenders to monitor the borrower (Godlewski and Weill,
2007). The findings are consistent with research by Tanjung and Marciano (2012)
which showed a negative and significant coeficient for seniority variable.
The test for model 4 results showed negative and significant coeficient at 5% between
loan spread with commercial bank. This happened because commercial bank have a
better ability to reduce asymmetric information compare to investment bank that will
lead to a cheaper loan pricing decision (Marciano, 2008). This research results is in
accordance with the research results conducted by Tanjung and Marciano (2012) that
conclude significant negative relationships between loan spread and commercial bank.
Mix bank variable showed negative and significant coeficient at 1%. The results of this
analysis is in accordance with the statement of Drucker and Puri (2003) which revealed
that the investment bank has a higher monitoring costs due to weak evaluation
capability compare to commercial bank. While Gupta, Singh, and Zebedee (2008) adds
The First International Conference on Entrepreneurship
Book One 66
that universal banks are more flexible than an investment bank because the bank
function are between investment banks and universal banks.
Countryrisk variable showed positive and significant coeficient at 1%. This suggests
that the riskier the country, the higher the loan spread. In their book, Jorion (2002),
Heffernan (2008), Eaton et al., (1894) stated that credit risk is a risk of borrower’s
incapability to perform their duties as stated in loan agreement, which means that the
borrower could not paid the loans because of bankruptcy, or late payment for loan’s
interest. This findings is in accordance with the findings of Lasmono and Marciano
(2010) who found that higher risk of loan will cause lender to require greater
monitoring capabilities.
Secure variable showed positive and significant coeficient at 1%. This suggests that if
there is a guarantee / collateral in the loan, the loan spread will increase. Berger, Udell
(1990) also associated collateral with a riskier loans, since collateral usually are found
in a loan transaction that need more monitoring. The existence of collateral assumed as
a signal of high risk loan (Harhoff and Korting, 1998). Smith and Warner (1979) shows
that secured loans need more monitoring than unsecured loans or loan without collateral.
In conclusion, loan with collateral is considered riskier thus lender will assign higher
loan spread to the borrower.
Senior variable showed negative but not significant coeficient. This suggests that
whether the borrower’s company is senior or not, it would not affect the amount of
spread given to the borrower. The negative coeficient shows that if the loan is senior,
the lender will assign lower spread because the existence of seniority would lead a
lower need of lenders to monitor the borrower (Godlewski and Weill, 2007). Besides
that, the results is not significant because the data is grouped in different specification,
so for public with financial performance testing tend to have a more dominant data on
dummy 1 (senior loans).
Log income variable showed negative and significant coeficient at 1%. This suggests
that the higher the income of a company will lead to a lower spread. This happened
because high income indicates that the company have a good financial performance.
This findings is similar with the results of Tanjung and Marciano (2012) which explains
that the better the financial performance of the company will push the lenders to lose its
lead share, because good financial performance lead to a lower default risk, so
lenders may reduce the monitoring cost too.
CONCLUSION AND RECOMMENDATION
The purpose of this research is to know the relationship of the independent variables
(commercial bank, mix bank, country risk, CPI, foreign lender, log amount, maturity,
ticker, secure, senior, deal purpose, and sector industries) to the dependent variables
(loan spread).Based on the test with four models, it is concluded that some significant
factors are the type of creditor, the country risk, the corruption perception index,
maturity, the borrower’s companies whether they are listed or not, seniority and whether
their loan is secured or not.
The First International Conference on Entrepreneurship
Book One 67
REFERENCES
Atmojo, I., 2004, Penilaian Harga Pinjaman Korporasi : Studi Empiris di Indonesia,
unpublished.
Barclay, M., and Smith, C., 1995, The maturity structure of corporate debt, Journal of Finance,
50, 609-631.
Berger, A., and Udell, G., collateral, loan quality, and Bank Risk, job paper 25.
Berlin, M., and Mester, L.J., 1992, Debt Covenants and Renegotiation, Journal of Financial
Intermediation, Vol.2, No.2, pp.95-133.
Besanko, D., and Thakor, A., 1987, Collateral and Rationing: Shorting equilibrium in
Monopolistic and Competitive Credit Markets, International Economic Review, 671-
689.
Booth, J., 1992, Contract Costs, Bank Loans, and the cross-monitoring hypothesis, Journal of
Financial Economics, Vol.31, pp.25-41.
Booth, J.R. and Chua, L., 1995, Structure and Pricing of Large Bank Loans, Federal Research
Bank of San Fransisco, Working Paper, pp.52-62.
Carey, M., Post, M., and Sharpe, S.A., 1998, Does Corporate Lending by Banks and Finance
Companies Differ? Evidence on Specialization in Privatee Debt Contracting, Journal of
Finance, Vol.53, June, pp.845-878.
Carey, M. and Nini, G., 2003, Is the Corporate Loan Market Globally Integrated? A Pricing
Puzzle, Working Paper.
Chen, A.H., Mazumdar, S.C., Hung, M.W., 1996, Regulations, Lender Identity and Bank Loan
Pricing, Pacific-Basin Finance Journal, Vol.4, pp.1-1-14.
Chen, A.H., Mazumdar, S.C., Yan, Y., 2000, Monitoring and Bank Loan Pricing, Pacific-Basin
Finance Journal, Vol.8, pp.1-24.
Darmodaran, A., 2003, Measuring Company Exposure to Country Risk : Theory and Practice,
Working Paper.
Datta, S., Datta, M.I., and Patel, A., 1999, Bank Monitoring and the Pricing of Corporate
Public Debt, Journal of Financial Economics, Vol.51, pp.435-449.
Dennis, S.A., Mullineaux, D.J., 2000, Syndicated Loans, Journal of Financial Intermediation 9:
404-426.
Diamond, D., 1984, Financial Intermediation and Delegated Monitoring, Review of Economic
Studies, Vol.51, pp.393-414.
Drucker, P., and Puri, M., 2003, Typing Knots: Lending to Win Equity Underwriting Business,
Unpublished working paper.
The First International Conference on Entrepreneurship
Book One 68
Fama, E.F., Jensen, M.C., 1983, Separation of Ownership and Control, Journal of Law and
Economics (June), 301-325.
Eaton, J., Gersovitz, M., and Stiglitz, J.E.,1894, The Pure Theory of Country Risk, National
Bureau Economics of Research 1050.
Godlewski, C.J., Weill L., 2008, Syndicated Loans in Emerging Markets, working paper 28.
Hallak, I., 2002, Why Borrower Pay Premium to Larger Lenders: Empirical Evidence from
Sovereign Syndicated Loans, Center for Financial Studies, 2002/02, Working Paper.
Hanafi, M.M., 2009, Risk Management, 2nd edition, UPP STIM YKPN.
Harhoff, D., Korting, T., 1998, Lending Relationships in Germany:Empirical Results from
Survey Data, CEPR Discussion Paper No. 1917.
Harjoto, M., Mullineaux, D.J., and Yi, H.C., 2004, Loan Pricing at Investment Banks and
Commercial Banks, Working Paper, Unpublished.
Heffernan, S., 1966, Modern Banking in Theory and Practice, Jhon Wiley and Sons.
Syndications : Evidence for 1995 to 1999, Economic and Policy Analysis Working
Paper 10.
Husnan, S., 1998, Dasar-Dasar Teori Portfolio dan Analisis Sekuritas, UPP AMP YKPN, Edisi
ketiga.
Ivashina, V., 2009, Asymmetric Information Effects on Loan Spread, Journal of Financial
Economics 92, 300-319.
James, C., 1987, Some Evidence of the Uniqueness of Bank Loans, Journal of Financial
Economics, Vol.19, pp217-235.
Jorion, P., 2002, Value at Risk, 2nd edition, Mc Graw Hill.
La Porta, R., De-Silanes, F.L., Shleifer, A., and Vishny, R.W., 1997, Legal Determinants of
External Finance, Journal of Finance, Vol.52, No.3, pp.1131-1150.
Lasmono, D., 2010, Pengaruh Tingkat Korupsi dan Resiko Negara Terhadap Keputusan
Pembentukan Sindikasi Dan Struktur Sindikasi di Asia Pada Tahun 1999-2003,
UBAYA.
Marciano, D., 2004, Loan Pricing in United States, Europe and Asia, working paper.
Marciano, D., 2008, The Impact of Information Asymmetry, Moral Hazard and The Structure of
Funding on Corporate U.S. Dollars Loan Pricing : The Empirical Study in Indonesia
The Period 1990-1997, Gadjah Mada University.
Millon, M.H., and Thakor, A.V., 1985, Moral Hazard and Information Sharing: A Model of
Financial Information Gathering Agencies, Journal of Finance, (December), 1403-1422.
The First International Conference on Entrepreneurship
Book One 69
Petersen, M., and Rajan, R., 2002, Does Distance Still Matter: the Information Revolution in
Small Business Lending, Journal of Finance, Vol.57, pp.2533-2570.
Sinkey, J.F.Jr., 2002, Commercial Bank Financial Management in the Financial-Services
Industry, Prentice Hall, Sixth edition.
Smith, C., and Warner, J., 1979, On Financial Contracting : An Analysis of Bond Covenants,
Journal of Financial Economic 7, 117-161.
Stiglitz, J., and Weiss, A., 1981, Credit Rationing in Markets with Imperfect Information,
American Economic Review 71, 393-410.
Stochs, M., and Mauer, D., 1996, The Determinants of Corporate Debt Maturity Structure,
Journal of Business, Vol.69, pp.279-312.
Tanjung, Y., and Marciano, D., 2012, Asymmetry Information and Diversification Effect on
Loan Pricing in Asia Pacific Region 2006-2010, UBAYA.
White, H., 1980, A Heteroskedasticity- Consistent CovarianceEstimator and A Direct Test for
Heteroskedasticity, Econometrica 48, 817-838
The First International Conference on Entrepreneurship
Book One 70
R TRADING COMPANY DEVELOPMENT FEASIBILITY STUDY
Dean Michael Reyhan1, David Sukardi Kodrat2
INDONESIA
E-mails: [email protected], [email protected]
ABSTRACT
The purpose of this study was to increase R trading company turnover from
Rp500.000.000,00 per year to become Rp1.500.000.000,00 per year by business
environment aspect, industrial structure aspect, market and marketing aspect,
technical aspect, human resources and management aspect, also financial
aspect.
This study used feasibility study method by analyze many aspects of business. In
this study belong to the population from newcomer, supplier, customer,
substitute, competitor, use sampling method: purposive sampling, saturation
sampling, non-proportionated random sampling, accidental sampling,
purposive sampling. Data retrieval used with documentation, interview, and
observation.
The result of this study summarized that in market and marketing aspect,
technical aspect, human resources and management aspect this development
was feasible. For financial aspect this development was only feasible for
optimistic scenario analysis.
Keywords: Feasibility Study, Business Environment Aspect, Industrial
Structure Aspect, Market And Marketing Aspect, Technical Aspect,
INTRODUCTION
Food sector is one of the business that have sustainable life cycle because this business
provides basic human needs. East Java economics at 2013 supported by three main
sector, agriculture (14,91%), processing industry (26,60%), also trade, hotel, and
restaurants (31,34%). Indonesia’s national FMCG growth also shows that FMCG (Fast
Moving Consumer Goods) industry have a good growth from Q2 2012 until Q3 2013.
R trading company is established since 2010, however this family business actually
started at 1999, but the researcher have a little intervention of this business.
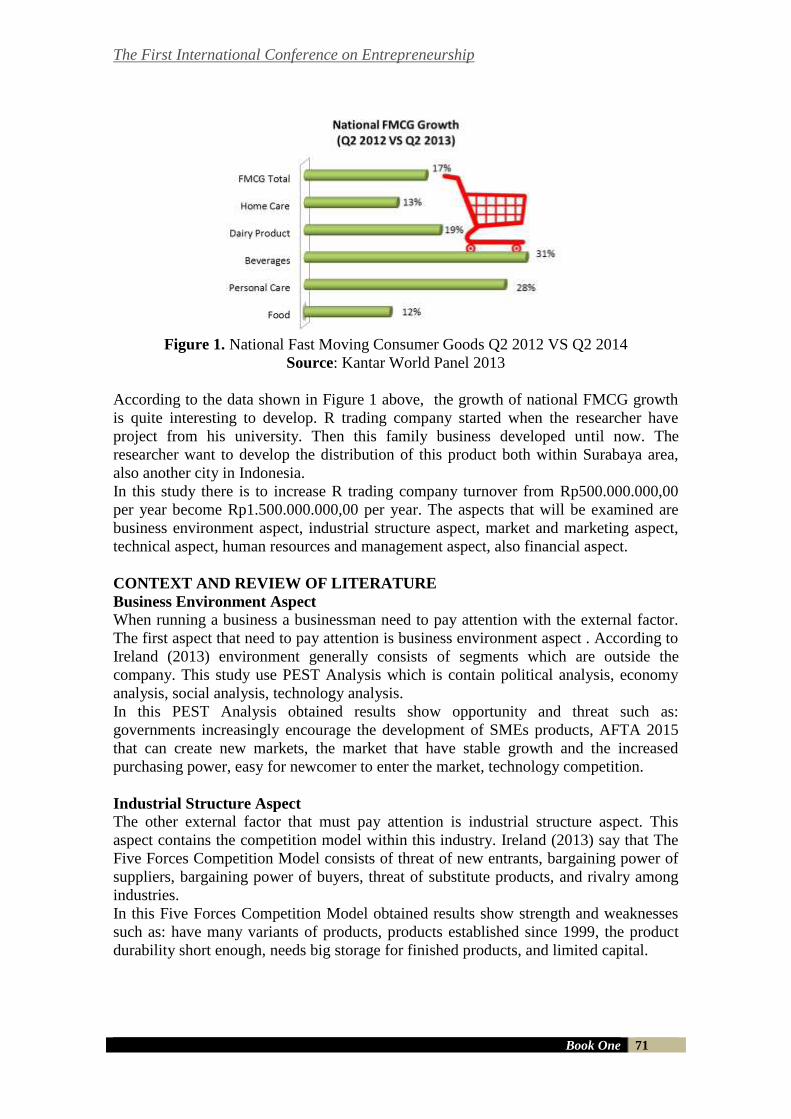
The First International Conference on Entrepreneurship
Book One 71
Figure 1. National Fast Moving Consumer Goods Q2 2012 VS Q2 2014
Source: Kantar World Panel 2013
According to the data shown in Figure 1 above, the growth of national FMCG growth
is quite interesting to develop. R trading company started when the researcher have
project from his university. Then this family business developed until now. The
researcher want to develop the distribution of this product both within Surabaya area,
also another city in Indonesia.
In this study there is to increase R trading company turnover from Rp500.000.000,00
per year become Rp1.500.000.000,00 per year. The aspects that will be examined are
business environment aspect, industrial structure aspect, market and marketing aspect,
technical aspect, human resources and management aspect, also financial aspect.
CONTEXT AND REVIEW OF LITERATURE
Business Environment Aspect
When running a business a businessman need to pay attention with the external factor.
The first aspect that need to pay attention is business environment aspect . According to
Ireland (2013) environment generally consists of segments which are outside the
company. This study use PEST Analysis which is contain political analysis, economy
analysis, social analysis, technology analysis.
In this PEST Analysis obtained results show opportunity and threat such as:
governments increasingly encourage the development of SMEs products, AFTA 2015
that can create new markets, the market that have stable growth and the increased
purchasing power, easy for newcomer to enter the market, technology competition.
Industrial Structure Aspect
The other external factor that must pay attention is industrial structure aspect. This
aspect contains the competition model within this industry. Ireland (2013) say that The
Five Forces Competition Model consists of threat of new entrants, bargaining power of
suppliers, bargaining power of buyers, threat of substitute products, and rivalry among
industries.
In this Five Forces Competition Model obtained results show strength and weaknesses
such as: have many variants of products, products established since 1999, the product
durability short enough, needs big storage for finished products, and limited capital.
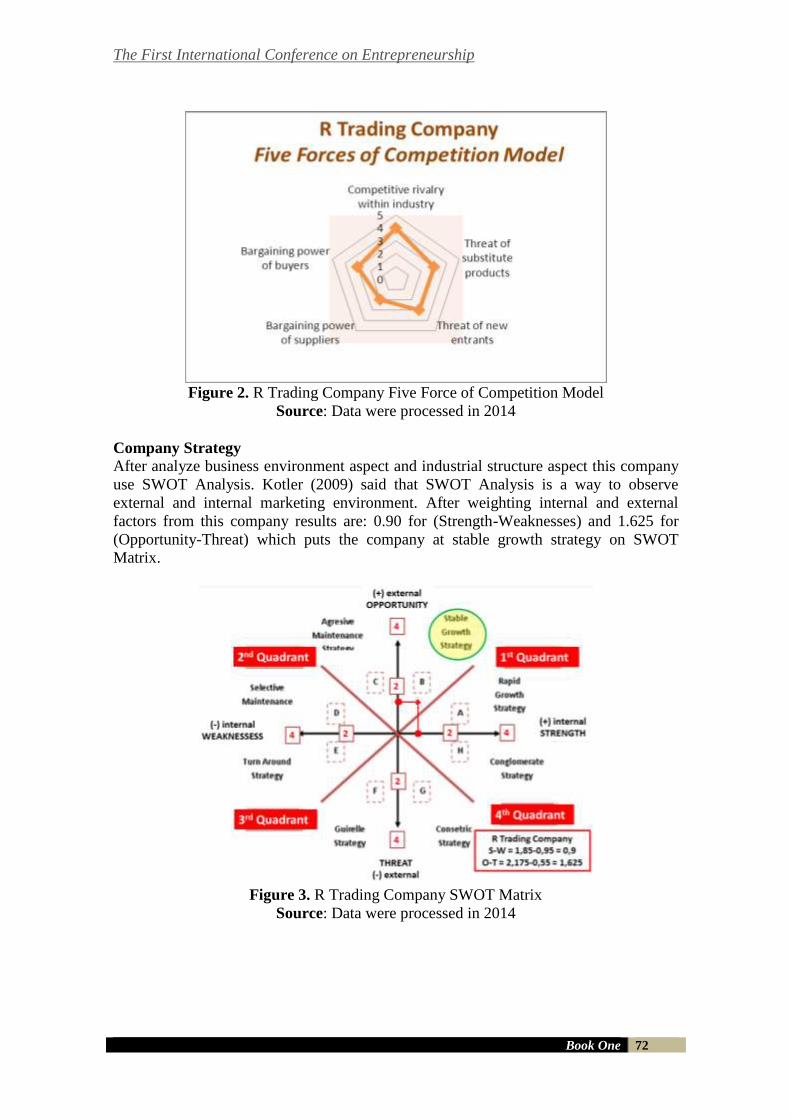
The First International Conference on Entrepreneurship
Book One 72
Figure 2. R Trading Company Five Force of Competition Model
Source: Data were processed in 2014
Company Strategy
After analyze business environment aspect and industrial structure aspect this company
use SWOT Analysis. Kotler (2009) said that SWOT Analysis is a way to observe
external and internal marketing environment. After weighting internal and external
factors from this company results are: 0.90 for (Strength-Weaknesses) and 1.625 for
(Opportunity-Threat) which puts the company at stable growth strategy on SWOT
Matrix.
Figure 3. R Trading Company SWOT Matrix
Source: Data were processed in 2014
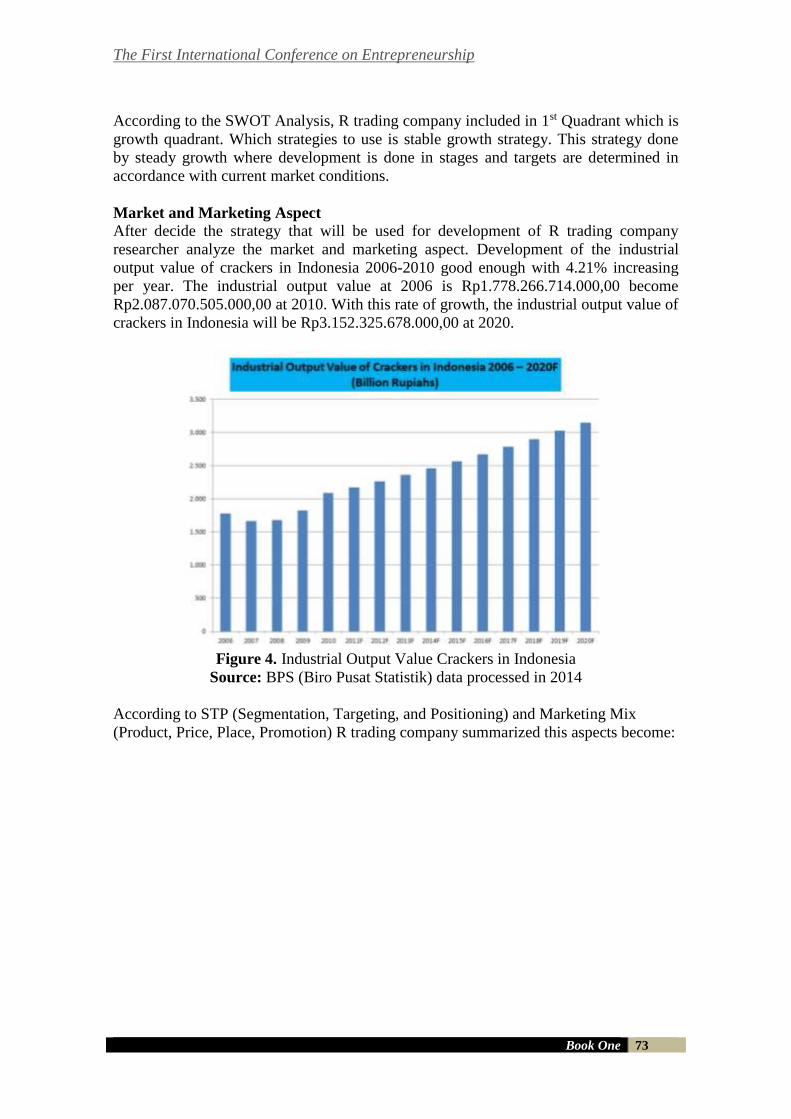
The First International Conference on Entrepreneurship
Book One 73
According to the SWOT Analysis, R trading company included in 1st Quadrant which is
growth quadrant. Which strategies to use is stable growth strategy. This strategy done
by steady growth where development is done in stages and targets are determined in
accordance with current market conditions.
Market and Marketing Aspect
After decide the strategy that will be used for development of R trading company
researcher analyze the market and marketing aspect. Development of the industrial
output value of crackers in Indonesia 2006-2010 good enough with 4.21% increasing
per year. The industrial output value at 2006 is Rp1.778.266.714.000,00 become
Rp2.087.070.505.000,00 at 2010. With this rate of growth, the industrial output value of
crackers in Indonesia will be Rp3.152.325.678.000,00 at 2020.
Figure 4. Industrial Output Value Crackers in Indonesia
Source: BPS (Biro Pusat Statistik) data processed in 2014
According to STP (Segmentation, Targeting, and Positioning) and Marketing Mix
(Product, Price, Place, Promotion) R trading company summarized this aspects become:
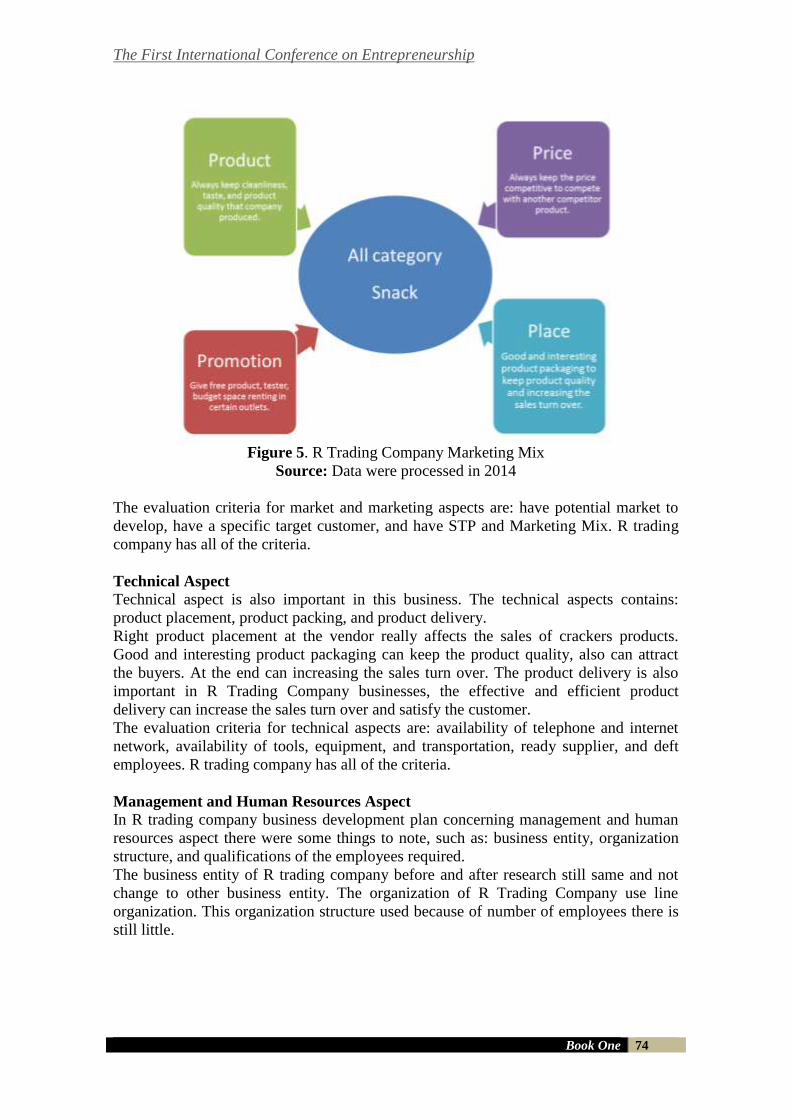
The First International Conference on Entrepreneurship
Book One 74
Figure 5. R Trading Company Marketing Mix
Source: Data were processed in 2014
The evaluation criteria for market and marketing aspects are: have potential market to
develop, have a specific target customer, and have STP and Marketing Mix. R trading
company has all of the criteria.
Technical Aspect
Technical aspect is also important in this business. The technical aspects contains:
product placement, product packing, and product delivery.
Right product placement at the vendor really affects the sales of crackers products.
Good and interesting product packaging can keep the product quality, also can attract
the buyers. At the end can increasing the sales turn over. The product delivery is also
important in R Trading Company businesses, the effective and efficient product
delivery can increase the sales turn over and satisfy the customer.
The evaluation criteria for technical aspects are: availability of telephone and internet
network, availability of tools, equipment, and transportation, ready supplier, and deft
employees. R trading company has all of the criteria.
Management and Human Resources Aspect
In R trading company business development plan concerning management and human
resources aspect there were some things to note, such as: business entity, organization
structure, and qualifications of the employees required.
The business entity of R trading company before and after research still same and not
change to other business entity. The organization of R Trading Company use line
organization. This organization structure used because of number of employees there is
still little.
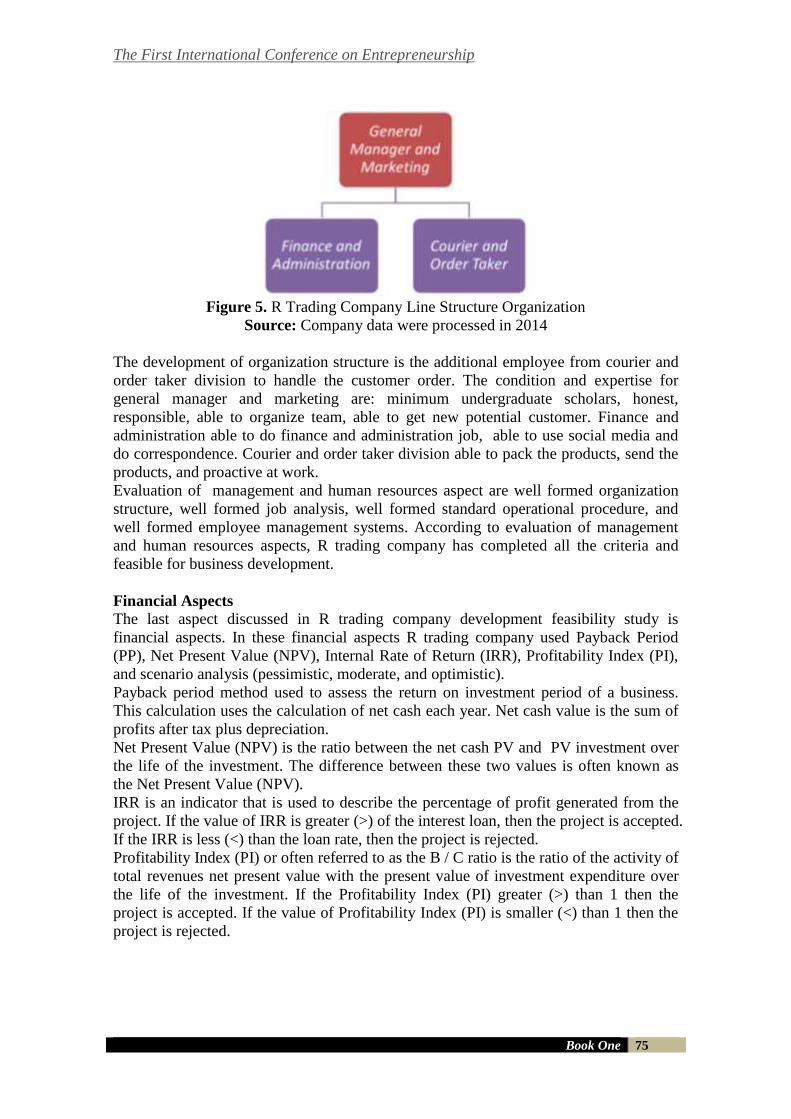
The First International Conference on Entrepreneurship
Book One 75
Figure 5. R Trading Company Line Structure Organization
Source: Company data were processed in 2014
The development of organization structure is the additional employee from courier and
order taker division to handle the customer order. The condition and expertise for
general manager and marketing are: minimum undergraduate scholars, honest,
responsible, able to organize team, able to get new potential customer. Finance and
administration able to do finance and administration job, able to use social media and
do correspondence. Courier and order taker division able to pack the products, send the
products, and proactive at work.
Evaluation of management and human resources aspect are well formed organization
structure, well formed job analysis, well formed standard operational procedure, and
well formed employee management systems. According to evaluation of management
and human resources aspects, R trading company has completed all the criteria and
feasible for business development.
Financial Aspects
The last aspect discussed in R trading company development feasibility study is
financial aspects. In these financial aspects R trading company used Payback Period
(PP), Net Present Value (NPV), Internal Rate of Return (IRR), Profitability Index (PI),
and scenario analysis (pessimistic, moderate, and optimistic).
Payback period method used to assess the return on investment period of a business.
This calculation uses the calculation of net cash each year. Net cash value is the sum of
profits after tax plus depreciation.
Net Present Value (NPV) is the ratio between the net cash PV and PV investment over
the life of the investment. The difference between these two values is often known as
the Net Present Value (NPV).
IRR is an indicator that is used to describe the percentage of profit generated from the
project. If the value of IRR is greater (>) of the interest loan, then the project is accepted.
If the IRR is less (<) than the loan rate, then the project is rejected.
Profitability Index (PI) or often referred to as the B / C ratio is the ratio of the activity of
total revenues net present value with the present value of investment expenditure over
the life of the investment. If the Profitability Index (PI) greater (>) than 1 then the
project is accepted. If the value of Profitability Index (PI) is smaller (<) than 1 then the
project is rejected.
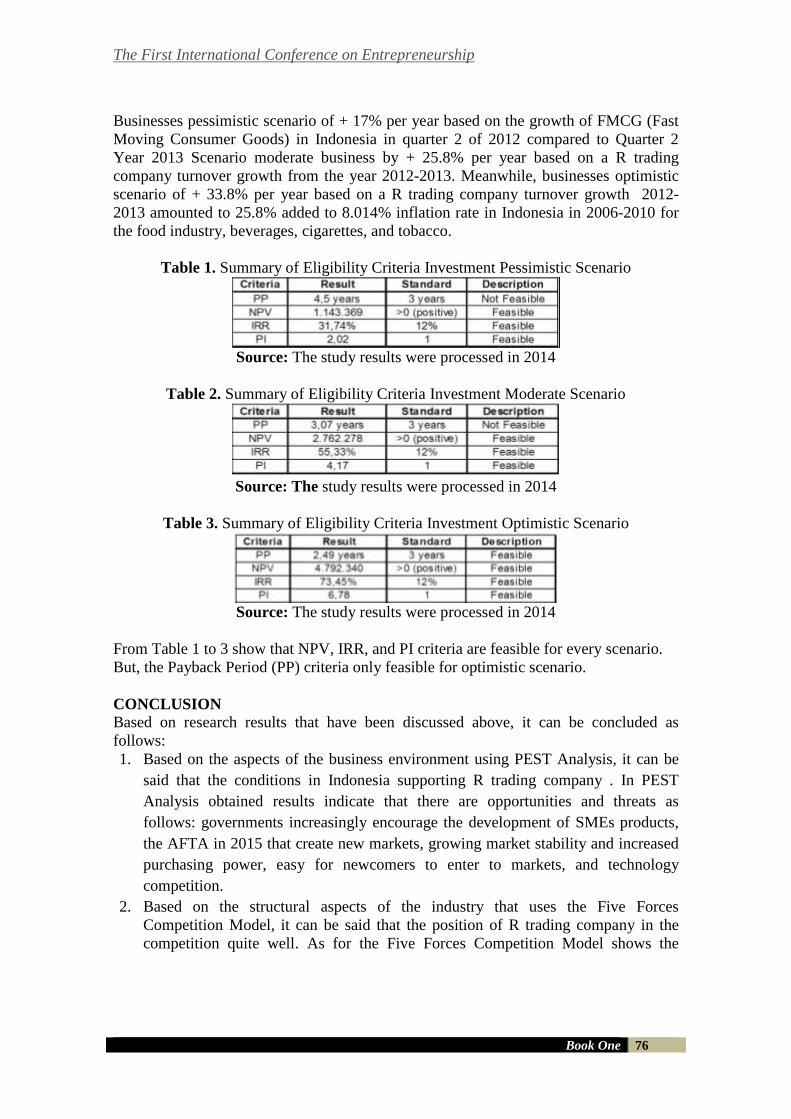
The First International Conference on Entrepreneurship
Book One 76
Businesses pessimistic scenario of + 17% per year based on the growth of FMCG (Fast
Moving Consumer Goods) in Indonesia in quarter 2 of 2012 compared to Quarter 2
Year 2013 Scenario moderate business by + 25.8% per year based on a R trading
company turnover growth from the year 2012-2013. Meanwhile, businesses optimistic
scenario of + 33.8% per year based on a R trading company turnover growth 2012-
2013 amounted to 25.8% added to 8.014% inflation rate in Indonesia in 2006-2010 for
the food industry, beverages, cigarettes, and tobacco.
Table 1. Summary of Eligibility Criteria Investment Pessimistic Scenario
Source: The study results were processed in 2014
Table 2. Summary of Eligibility Criteria Investment Moderate Scenario
Source: The study results were processed in 2014
Table 3. Summary of Eligibility Criteria Investment Optimistic Scenario
Source: The study results were processed in 2014
From Table 1 to 3 show that NPV, IRR, and PI criteria are feasible for every scenario.
But, the Payback Period (PP) criteria only feasible for optimistic scenario.
CONCLUSION
Based on research results that have been discussed above, it can be concluded as
follows:
1. Based on the aspects of the business environment using PEST Analysis, it can be
said that the conditions in Indonesia supporting R trading company . In PEST
Analysis obtained results indicate that there are opportunities and threats as
follows: governments increasingly encourage the development of SMEs products,
the AFTA in 2015 that create new markets, growing market stability and increased
purchasing power, easy for newcomers to enter to markets, and technology
competition.
2. Based on the structural aspects of the industry that uses the Five Forces
Competition Model, it can be said that the position of R trading company in the
competition quite well. As for the Five Forces Competition Model shows the
The First International Conference on Entrepreneurship
Book One 77
results of the strengths and weaknesses such as: having a lot of variance / types of
products that are marketed, a product from a supplier that has been in existence
since 1999, the durability of the product is not too long / short enough, needed a
storage area large enough to finished products, as well as sufficient capital is
limited.
3. Based on the analysis of the environmental aspects and the business aspects of the
industry structure of companies applying SWOT Analysis of strengths, weaknesses,
opportunities, and threats owned by UD. R. The results obtained in the entrance
quadrant I particularly stable growth strategy where the strategy is done by means
of steady growth and a gradual manner specified targets according to the conditions
of the existing market.
4. In the aspect of the market and marketing indicates that market growth experienced
crackers industry average increase in turnover of 4.21% per year. This illustrates
the potential of this industry to achieve Rp3.152.325.678.000,00 turnover in 2020.
R trading company satisfy the criteria used in the market and marketing aspects
are: the market potential for development, having specifics customer, and has STP
and Marketing Mix.
5. The technical aspects of the company using product placement, product packaging,
and delivery of products. As for the R trading company has met the benchmark for
the evaluation of the technical aspects of the availability of telephone and internet,
the availability of tools and transportation, the supplier who is always ready and
agile workforce.
6. In the aspect of human resource management and R trading company still uses the
same business entity. As for the structure of organizations still use the simple form
of the line organization.
7. In the financial aspects of the company using indicators Payback Period (PP), Net
Present Value (NPV), Internal Rate of Return (IRR), Profitability Index (PI), as
well as risk analysis (pessimistic, moderate and optimistic). Based on the
calculation results of this feasibility study shows that the NPV, IRR, and PI feasible
for the third scenario analysis. As for the PP only feasible for the optimistic
scenario.
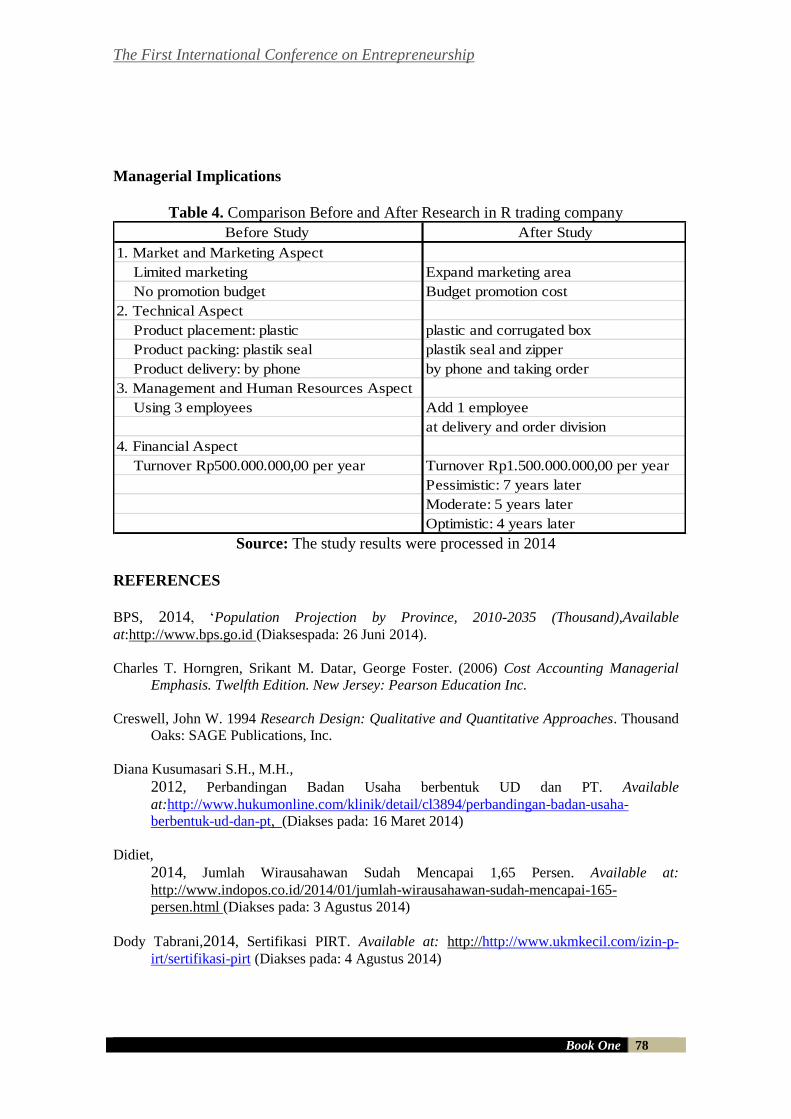
The First International Conference on Entrepreneurship
Book One 78
Managerial Implications
Table 4. Comparison Before and After Research in R trading company
Before Study After Study
1. Market and Marketing Aspect
Limited marketing Expand marketing area
No promotion budget Budget promotion cost
2. Technical Aspect
Product placement: plastic plastic and corrugated box
Product packing: plastik seal plastik seal and zipper
Product delivery: by phone by phone and taking order
3. Management and Human Resources Aspect
Using 3 employees Add 1 employee
at delivery and order division
4. Financial Aspect
Turnover Rp500.000.000,00 per year Turnover Rp1.500.000.000,00 per year
Pessimistic: 7 years later
Moderate: 5 years later
Optimistic: 4 years later
Source: The study results were processed in 2014
REFERENCES
BPS, 2014, ‘Population Projection by Province, 2010-2035 (Thousand),Available
at:http://www.bps.go.id (Diaksespada: 26 Juni 2014).
Charles T. Horngren, Srikant M. Datar, George Foster. (2006) Cost Accounting Managerial
Emphasis. Twelfth Edition. New Jersey: Pearson Education Inc.
Creswell, John W. 1994 Research Design: Qualitative and Quantitative Approaches. Thousand
Oaks: SAGE Publications, Inc.
Diana Kusumasari S.H., M.H.,
2012, Perbandingan Badan Usaha berbentuk UD dan PT. Available
at:http://www.hukumonline.com/klinik/detail/cl3894/perbandingan-badan-usaha-
berbentuk-ud-dan-pt, (Diakses pada: 16 Maret 2014)
Didiet,
2014, Jumlah Wirausahawan Sudah Mencapai 1,65 Persen. Available at:
http://www.indopos.co.id/2014/01/jumlah-wirausahawan-sudah-mencapai-165-
persen.html (Diakses pada: 3 Agustus 2014)
Dody Tabrani,2014, Sertifikasi PIRT. Available at: http://http://www.ukmkecil.com/izin-p-
irt/sertifikasi-pirt (Diakses pada: 4 Agustus 2014)
The First International Conference on Entrepreneurship
Book One 79
Givem, Lisa M., 2008 The Sage Encyclopedia of Qualitative Research Methods: Volume 1
and 2. California: Sage Publication, Inc.
Harrel, Gilbert D. 2008 Marketing: Connecting with Customers. Chicago: Education Press.
Ibrahim, Yacob. 2009 Studi Kelayakan Bisnis. Edisi Revisi. Jakarta: Rineka Cipta
Indra Arif Pribadi,
2014, Populasi Kelas Menengah Indonesia Meningkat Tajam. Available at:
http://www.antaranews.com/berita/429636/populasi-kelas-menengah-indonesia-
meningkat-tajam (Diakses pada: 25 Juli 2014)
Ireland, R.Duane, Hoskisson, Robert E., Hitt, Michael A. 2013 The Management of Strategy
Concepts and Cases, 10th edition. Canada: Nelson Education, Ltd.
Jumingan. 2009 Studi Kelayakan Bisnis. Cetakan Pertama. Jakarta: PT Bumi Aksara.
Kementrian Perindustrian Republik Indonesia,
2013, Available at: http://kemenperin.go.id/statistik, (Diaksespada: 3 November 2013).
Kartajaya, Hermawan. 2010 Grow with Character. Jakarta: PT Gramedia Pustaka Utama.
Kasmir, Jakfar. 2009 Studi Kelayakan Bisnis. Edisi Kedua. Jakarta: Prenada Media Group.
Kodrat, David Sukardi. 2009 Manajemen Distribusi. Edisi Pertama. Yogyakarta: GrhaI lmu.
Kotler, Philip dan Kevin Lane Keller. 2009 Manajemen Pemasaran. Edisi Ketiga belas. Jakarta:
PT. Gelora Aksara Pratama.
Kuncoro, Mudrajad. 2009 Metode Riset untuk Bisnis dan Ekonomi. Edisi Ketiga. Jakarta:
Erlangga.
Rangkuti, F. 2013 Teknik Membedah Kasus Bisnis Analisis SWOT (Edisi Revisi). Jakarta:
PT Gramedia Pustaka Utama.
Soegoto, Eddy Soeryanto. 2009 Entrepreneurship Menjadi Pebisnis Ulung. Cetakan Pertama.
Jakarta: PT Gramedia.
Suliyanto. 2010 Studi Kelayakan Bisnis. Yogyakarta: Penerbit Andi.
Sumarsono. 2010 Kewirausahaan. Cetakan Pertama. Yogyakarta: Graha Ilmu.
Swasembada. 2009 ‘Makanan dan Minuman: Merebut Peluang di Industri Kalis Krisis’,
Majalah SWA, XXV 19 Feb-14Mar 2009, pp.30.
Tjiptono, Fandy. 2008 Strategi Pemasaran. Edisi Ketiga. Yogyakarta: Penerbit Andi.
Yin, Robert K. 2009 Case Study Research Design and Methods: Fourth
Edition.California:Sage Publication.
The First International Conference on Entrepreneurship
Book One 80
PLANNING AND CONTROLLING OF RAW MATERIAL IN
ACCUMULATOR PRODUCTION AT THE PT XX
Nurmawati1
Engineering Faculty - Universitas 45 Surabaya
Jl. Mayjen Sungkono No. 106 Surabaya
INDONESIA
Email : [email protected]
ABSTRACT
In the industrial planning and controlling area, the production of raw material is
one of the factors that is important to the company. PT XX, the accumulator
company is a type of business that produces batteries in a variety of sizes. Up to
present, the company has produced batteries by conventional method but
sometimes there are problems of process production because of the lack of
material or raw material in the warehouse. There are excess of other raw
material and there are lack of another. Production and raw material did not
match well because the company still had the trouble in making planning and
controlling of raw materials, especially in determining the amount and time of
ordering.
To produce 1096 unit 12V 75 Ah batteries based on production planning in 2014,
the cost for raw material will be Rp. 1,521,357,600.00
Keywords : Planning and Controlling of Raw Material
INTRODUCTION
The most important thing for companies to win competition in the free market area is
how to be able to produce smoothly without undesirable delay so that companies will be
more efficient and will improve the competitiveness of products in the market.
Smooth production process is dependent on accurate production planning, if not it will
give very adverse impact to the company. Or it may be the cessation of the production
process.
Companies need to consider the factors supporting production activity such as raw
materials, production facilities, labors and others. Therefore it does scheduling,
production planning and raw material planning in order to support the smooth running
of the production process in determining the amount and time of ordering.
LITERATURE
Planning and Controlling of Materials
Inventories can be defined as material that is stored in the warehouse to be used in
production or sale. Inventories of raw materials are related to the role of management in
the company to succeed the goal of companies. In order to achieve the objectives of
companies in expediting the process of planning and control of production, raw
The First International Conference on Entrepreneurship
Book One 81
materials are required. Planning of raw material consists of Master Production Schedule
(JIP) into any required materials. This schedule includes when and how the amount of
raw material is required and ordered. The planning is a process to predict what will
happen in the future. Therefore the planning and controlling of raw materials is an
attempt to estimate the raw material requirements for the foreseeable future, and
determine the volume / amount of stock to ensure smooth production process.
Forecasting
Forecasting is an estimation of the expected level of demand for a product or multiple
products in a given period of time in the future. Forecasting is basically estimation.
However by using certain way of forecasting can be more than estimation. The results
of forecasting will affect the plan so production activities can be aligned with the
requests of consumer. Because of that they are important factors that will affect the
production plan on the future relating to the supply of raw materials required in the
production process. Several methods are used in forecasting trends such as Straight Line
and Trend Line Curves Method.
Material Requirement Planning
Material Requirement Planning is a method used to finish up the issue of raw materials
used to make products where the finished product depends on how much and when the
finished product is needed. Master Planning Schedule is a plan regarding how many
products are needed and when these products will be needed. Master Planning Schedule
is the first step of the MRP system by inputting Bill of Materials of the product
concerned, the above data can be processed by the MRP method given the circumstance
of existing inventory in the company.
There are two ways in determining the amount of required material in accordance with
the master planning schedule i.e. i) purchasing quantity based on Master Planning
Schedule and ii) purchasing quantity based on Economic Order Quantity.
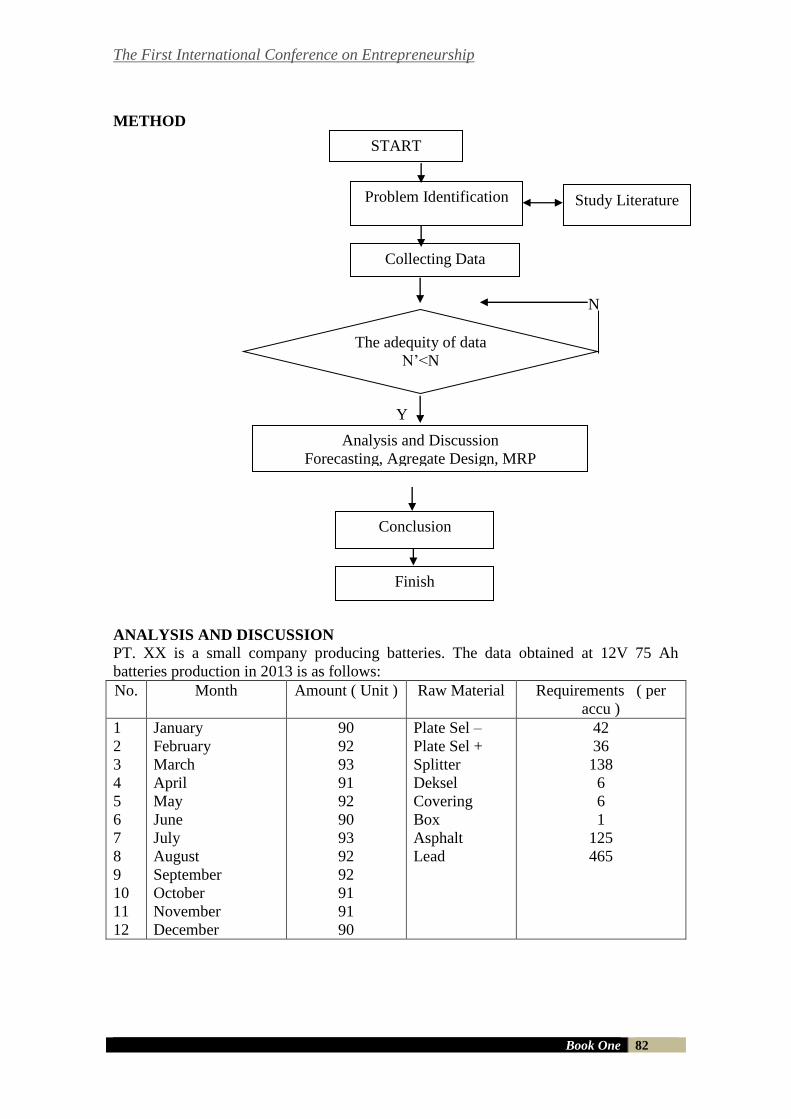
The First International Conference on Entrepreneurship
Book One 82
METHOD
N
Ya
Y
ANALYSIS AND DISCUSSION
PT. XX is a small company producing batteries. The data obtained at 12V 75 Ah
batteries production in 2013 is as follows:
No. Month Amount ( Unit ) Raw Material Requirements ( per
accu )
1
2
3
4
5
6
7
8
9
10
11
12
January
February
March
April
May
June
July
August
September
October
November
December
90
92
93
91
92
90
93
92
92
91
91
90
Plate Sel –
Plate Sel +
Splitter
Deksel
Covering
Box
Asphalt
Lead
42
36
138
6
6
1
125
465
START
Collecting Data
The adequity of data
N’˂N
and uniformity test
a
Analysis and Discussion
Forecasting, Agregate Design, MRP
Conclusion
Finish
Problem Identification Study Literature Study Lapangan
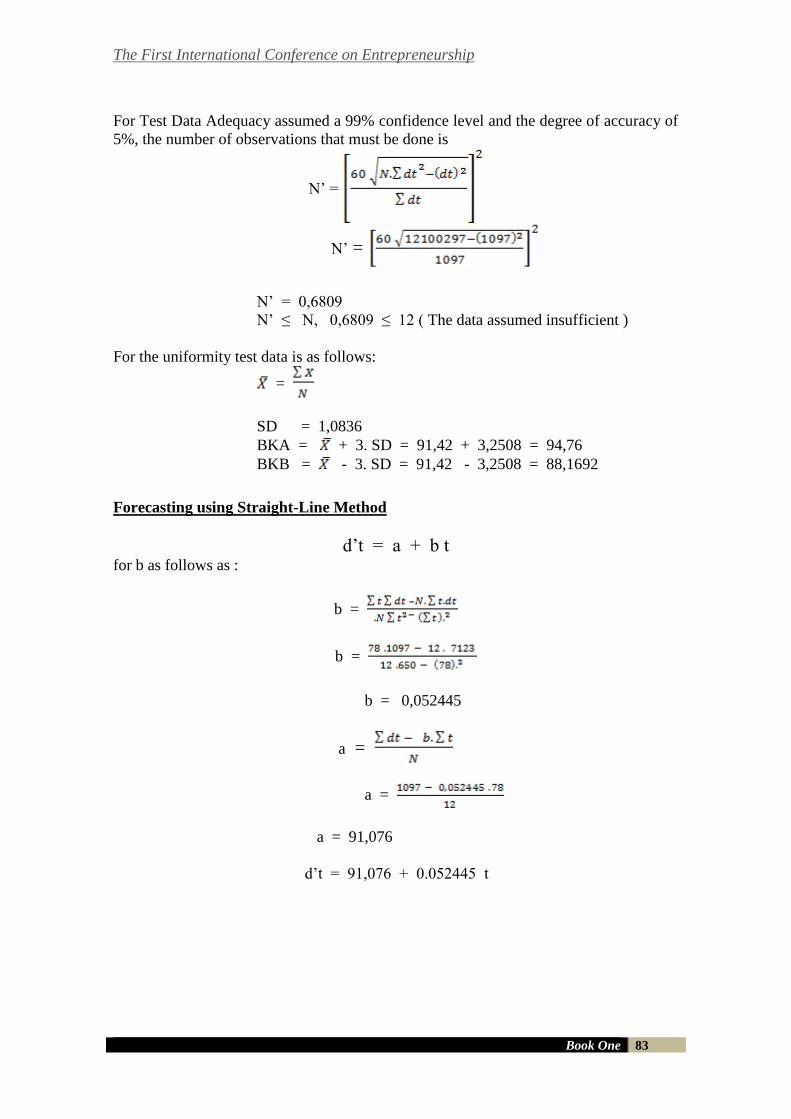
The First International Conference on Entrepreneurship
Book One 83
For Test Data Adequacy assumed a 99% confidence level and the degree of accuracy of
5%, the number of observations that must be done is
N’ =
N’ =
N’ = 0,6809
N’ ≤ N, 0,6809 ≤ 12 ( The data assumed insufficient )
For the uniformity test data is as follows:
=
SD = 1,0836
BKA = + 3. SD = 91,42 + 3,2508 = 94,76
BKB = - 3. SD = 91,42 - 3,2508 = 88,1692
Forecasting using Straight-Line Method
d’t = a + b t for b as follows as :
b =
b =
b = 0,052445
a =
a =
a = 91,076
d’t = 91,076 + 0.052445 t
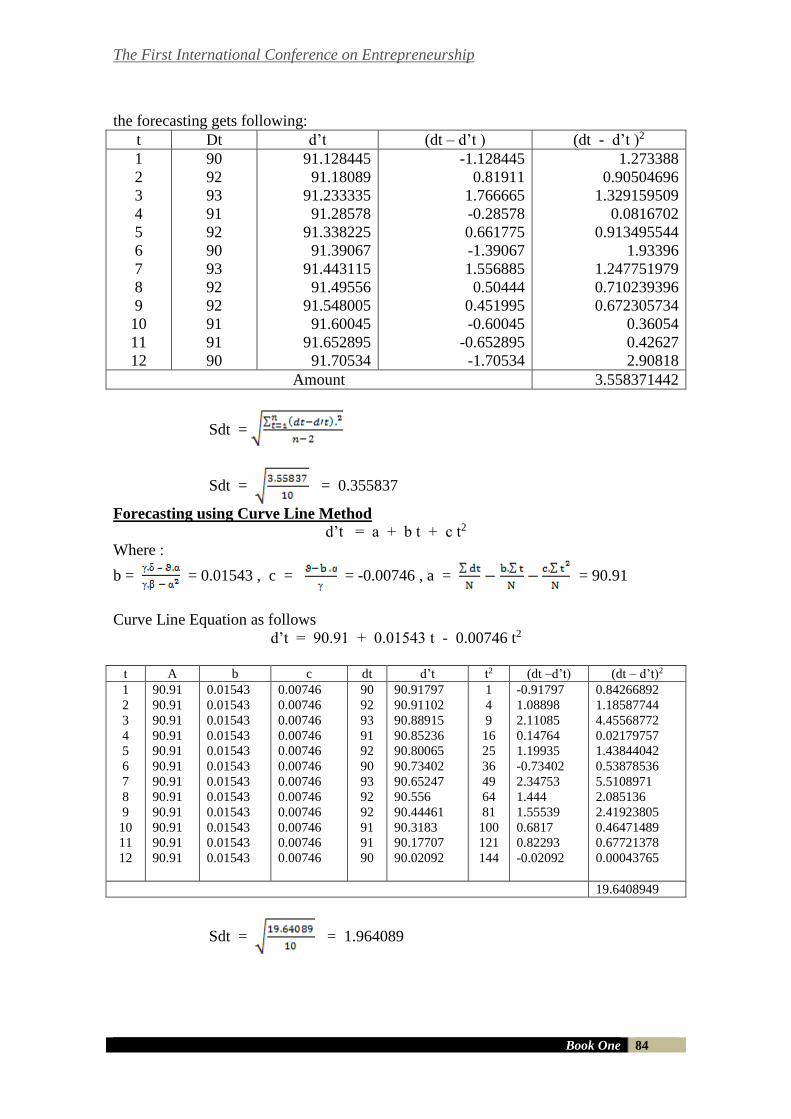
The First International Conference on Entrepreneurship
Book One 84
the forecasting gets following:
t Dt d’t (dt – d’t ) (dt - d’t )2
1
2
3
4
5
6
7
8
9
10
11
12
90
92
93
91
92
90
93
92
92
91
91
90
91.128445
91.18089
91.233335
91.28578
91.338225
91.39067
91.443115
91.49556
91.548005
91.60045
91.652895
91.70534
-1.128445
0.81911
1.766665
-0.28578
0.661775
-1.39067
1.556885
0.50444
0.451995
-0.60045
-0.652895
-1.70534
1.273388
0.90504696
1.329159509
0.0816702
0.913495544
1.93396
1.247751979
0.710239396
0.672305734
0.36054
0.42627
2.90818
Amount 3.558371442
Sdt =
Sdt = = 0.355837
Forecasting using Curve Line Method
d’t = a + b t + c t2
Where :
b = = 0.01543 , c = = -0.00746 , a = = 90.91
Curve Line Equation as follows
d’t = 90.91 + 0.01543 t - 0.00746 t2
t A b c dt d’t t2 (dt –d’t) (dt – d’t)2
1
2
3
4
5
6
7
8
9
10
11
12
90.91
90.91
90.91
90.91
90.91
90.91
90.91
90.91
90.91
90.91
90.91
90.91
0.01543
0.01543
0.01543
0.01543
0.01543
0.01543
0.01543
0.01543
0.01543
0.01543
0.01543
0.01543
0.00746
0.00746
0.00746
0.00746
0.00746
0.00746
0.00746
0.00746
0.00746
0.00746
0.00746
0.00746
90
92
93
91
92
90
93
92
92
91
91
90
90.91797
90.91102
90.88915
90.85236
90.80065
90.73402
90.65247
90.556
90.44461
90.3183
90.17707
90.02092
1
4
9
16
25
36
49
64
81
100
121
144
-0.91797
1.08898
2.11085
0.14764
1.19935
-0.73402
2.34753
1.444
1.55539
0.6817
0.82293
-0.02092
0.84266892
1.18587744
4.45568772
0.02179757
1.43844042
0.53878536
5.5108971
2.085136
2.41923805
0.46471489
0.67721378
0.00043765
19.6408949
Sdt = = 1.964089
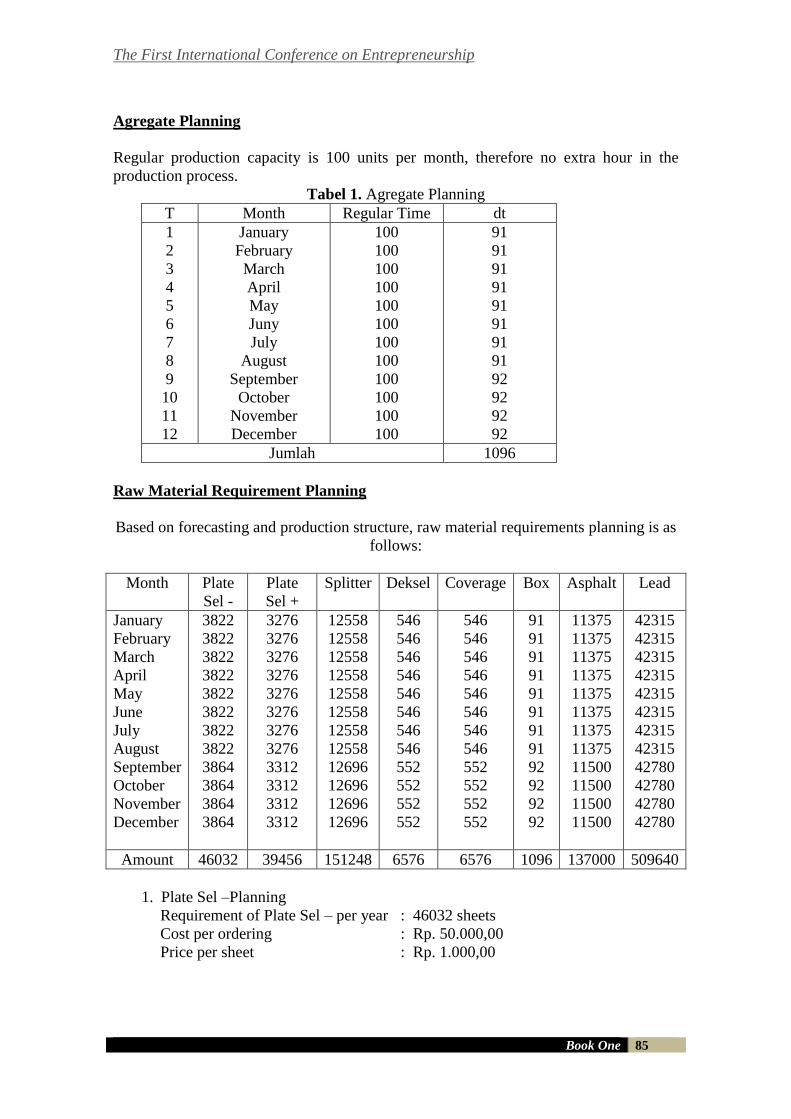
The First International Conference on Entrepreneurship
Book One 85
Agregate Planning
Regular production capacity is 100 units per month, therefore no extra hour in the
production process.
Tabel 1. Agregate Planning
T Month Regular Time dt
1
2
3
4
5
6
7
8
9
10
11
12
January
February
March
April
May
Juny
July
August
September
October
November
December
100
100
100
100
100
100
100
100
100
100
100
100
91
91
91
91
91
91
91
91
92
92
92
92
Jumlah 1096
Raw Material Requirement Planning
Based on forecasting and production structure, raw material requirements planning is as
follows:
Month Plate
Sel -
Plate
Sel +
Splitter Deksel Coverage Box Asphalt Lead
January
February
March
April
May
June
July
August
September
October
November
December
3822
3822
3822
3822
3822
3822
3822
3822
3864
3864
3864
3864
3276
3276
3276
3276
3276
3276
3276
3276
3312
3312
3312
3312
12558
12558
12558
12558
12558
12558
12558
12558
12696
12696
12696
12696
546
546
546
546
546
546
546
546
552
552
552
552
546
546
546
546
546
546
546
546
552
552
552
552
91
91
91
91
91
91
91
91
92
92
92
92
11375
11375
11375
11375
11375
11375
11375
11375
11500
11500
11500
11500
42315
42315
42315
42315
42315
42315
42315
42315
42780
42780
42780
42780
Amount 46032 39456 151248 6576 6576 1096 137000 509640
1. Plate Sel –Planning
Requirement of Plate Sel – per year : 46032 sheets
Cost per ordering : Rp. 50.000,00
Price per sheet : Rp. 1.000,00
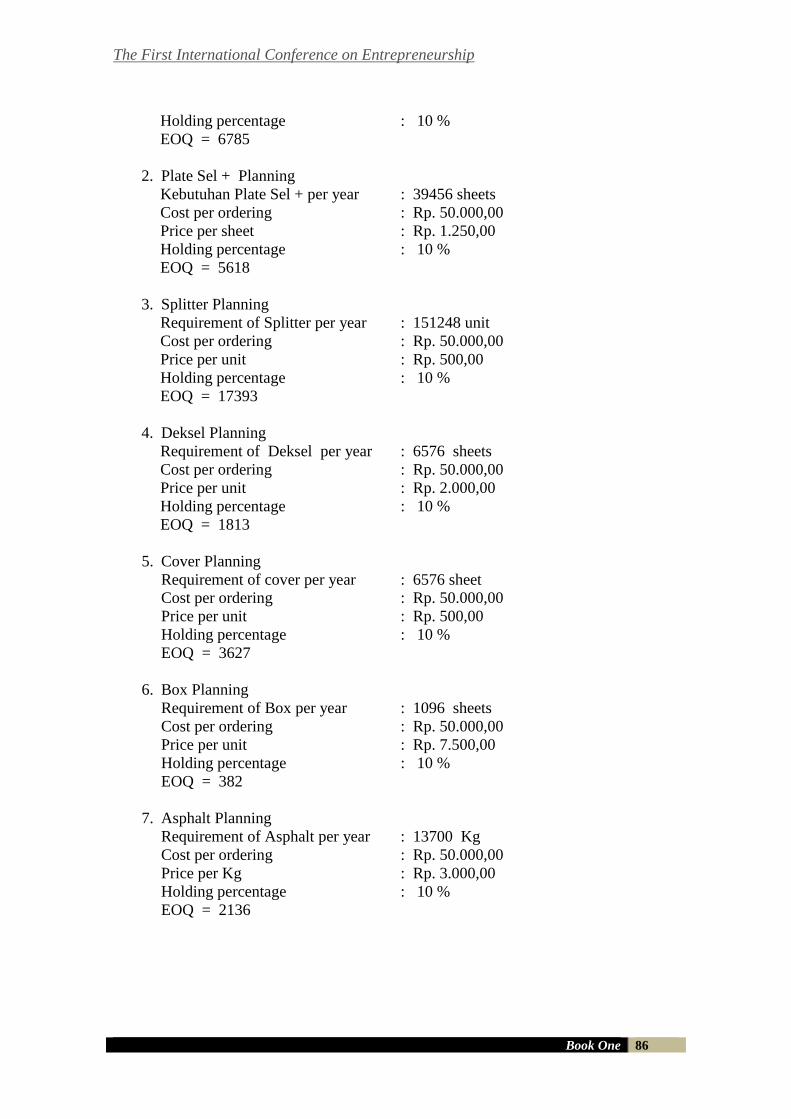
The First International Conference on Entrepreneurship
Book One 86
Holding percentage : 10 %
EOQ = 6785
2. Plate Sel + Planning
Kebutuhan Plate Sel + per year : 39456 sheets
Cost per ordering : Rp. 50.000,00
Price per sheet : Rp. 1.250,00
Holding percentage : 10 %
EOQ = 5618
3. Splitter Planning
Requirement of Splitter per year : 151248 unit
Cost per ordering : Rp. 50.000,00
Price per unit : Rp. 500,00
Holding percentage : 10 %
EOQ = 17393
4. Deksel Planning
Requirement of Deksel per year : 6576 sheets
Cost per ordering : Rp. 50.000,00
Price per unit : Rp. 2.000,00
Holding percentage : 10 %
EOQ = 1813
5. Cover Planning
Requirement of cover per year : 6576 sheet
Cost per ordering : Rp. 50.000,00
Price per unit : Rp. 500,00
Holding percentage : 10 %
EOQ = 3627
6. Box Planning
Requirement of Box per year : 1096 sheets
Cost per ordering : Rp. 50.000,00
Price per unit : Rp. 7.500,00
Holding percentage : 10 %
EOQ = 382
7. Asphalt Planning
Requirement of Asphalt per year : 13700 Kg
Cost per ordering : Rp. 50.000,00
Price per Kg : Rp. 3.000,00
Holding percentage : 10 %
EOQ = 2136
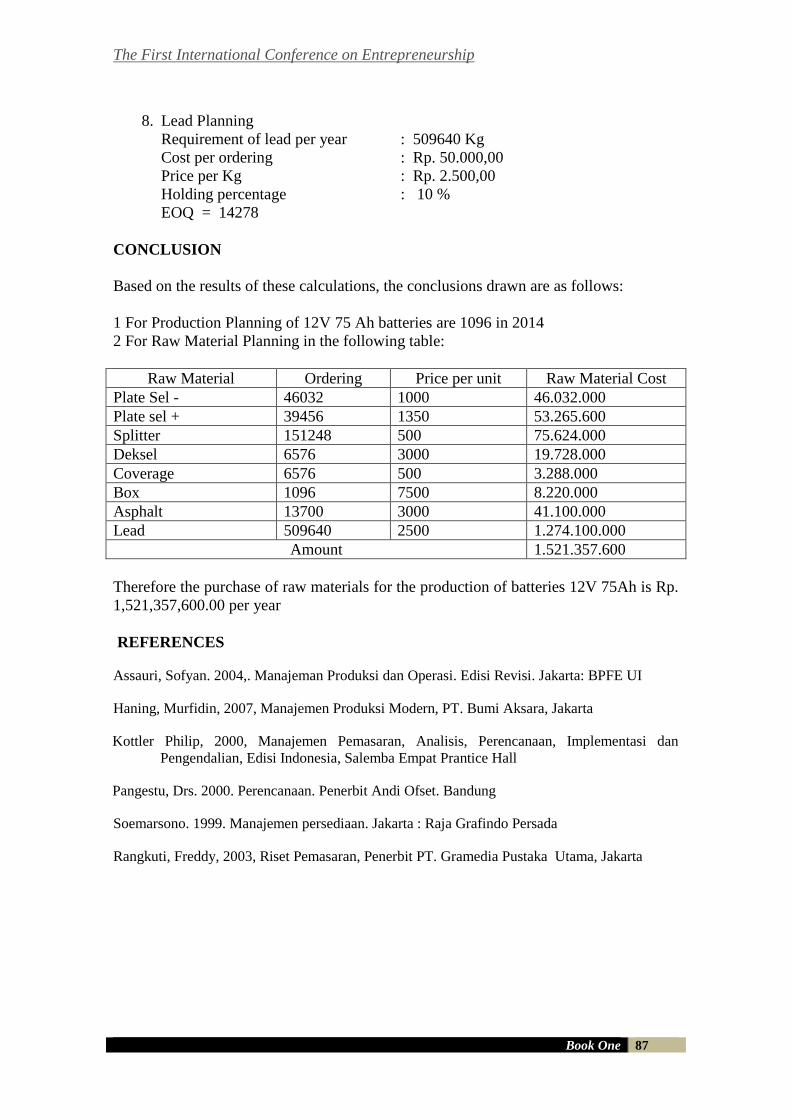
The First International Conference on Entrepreneurship
Book One 87
8. Lead Planning
Requirement of lead per year : 509640 Kg
Cost per ordering : Rp. 50.000,00
Price per Kg : Rp. 2.500,00
Holding percentage : 10 %
EOQ = 14278
CONCLUSION
Based on the results of these calculations, the conclusions drawn are as follows:
1 For Production Planning of 12V 75 Ah batteries are 1096 in 2014
2 For Raw Material Planning in the following table:
Raw Material Ordering Price per unit Raw Material Cost
Plate Sel - 46032 1000 46.032.000
Plate sel + 39456 1350 53.265.600
Splitter 151248 500 75.624.000
Deksel 6576 3000 19.728.000
Coverage 6576 500 3.288.000
Box 1096 7500 8.220.000
Asphalt 13700 3000 41.100.000
Lead 509640 2500 1.274.100.000
Amount 1.521.357.600
Therefore the purchase of raw materials for the production of batteries 12V 75Ah is Rp.
1,521,357,600.00 per year
REFERENCES
Assauri, Sofyan. 2004,. Manajeman Produksi dan Operasi. Edisi Revisi. Jakarta: BPFE UI
Haning, Murfidin, 2007, Manajemen Produksi Modern, PT. Bumi Aksara, Jakarta
Kottler Philip, 2000, Manajemen Pemasaran, Analisis, Perencanaan, Implementasi dan
Pengendalian, Edisi Indonesia, Salemba Empat Prantice Hall
Pangestu, Drs. 2000. Perencanaan. Penerbit Andi Ofset. Bandung
Soemarsono. 1999. Manajemen persediaan. Jakarta : Raja Grafindo Persada
Rangkuti, Freddy, 2003, Riset Pemasaran, Penerbit PT. Gramedia Pustaka Utama, Jakarta
The First International Conference on Entrepreneurship
Book One 88
THE EFFECT OF PRICE AND PRODUCT QUALITY ON BUYING
DECISION OF PHOTO CABIN SERVICES
Rendy Iswanto1, Tina Melinda2
Ciputra University
INDONESIA
E-mails: [email protected], [email protected]
ABSTRACT
The main purpose of this research is to determine the effect of price, and
product quality on buying decision OF Photo Cabin services. The population in
this research are Surabaya people whose been a client to Photo Cabin during
April 2012 to November 2013 which is consist of 31 clients. This study uses
multiple regression analysis and uses the validity test and reliability test before
to test the validity and reliability of any statement filled. Hypothesis testing is
performed using F test, t test, correlation coefficient of determination. This
research used classical assumption test, which is consist of multicolinearity test,
normality test, heterokedastisity test, auto correlation tes, and linearity test
The result of this research shown that there were significant effect between
Price (X1), and Product Quality (X2) on buying decision of Photo Cabin (Y)).
Keywords: Price, Product Quality, Buying Decision of Photo Cabin
Services
INTRODUCTION
The digital revolution has brought tremendous development in the photographic
industry. Now thanks to advances in digital technology, it is no longer needed to wait
long to see the photos and to print the pictures. These technological advances lead to
innovations such as photo corner. According Sianipar (2012), the definition of Photo
Corner is a photographic services using a backdrop or background that placed in the
corner of a party, wether it is a birthday party, wedding, and etc, that are intended for
the guests of the party. To print the picture only takes about 10-20 seconds, so that the
guests who had been done taking a photo session at the photo corner, do not have to
wait long or wait until the event is over to get the result of the picture.
Photo Cabin is a company engaged in the photo corner business which started its
business on 1 April 2012 with a laptop, digital camera, studio lighting sets and a Kodak
605 printer as its first capital asset. The main threat that Photo Cabin faces in the photo
corner business is the high competitor rate. Photo Corner is a business with a low
barrier entry level which means it is not difficult for a newcomer to start a their own
photo corner business. This is definitely bring a negative impact on the sales volume of
Photo Cabin.
Based on interview with Andanu Samudra whom served as the regional manager of PT.
Samafitro on14-10-2013, as the supplier of HITI printer which are now widely used in
photo corner business, he stated that within a month HITI printers are sold 10 units per
The First International Conference on Entrepreneurship
Book One 89
month minimum in 2012-2013, in which the printers mostly sold to re-sellers and partly
are sold to the photo corner business player in Surabaya. Based on the data obtained
from the sales figures of PT. Samafitro, Andanu estimated there are ± 100 photo corner
business in Surabaya that uses the HITI printer, that number does not include the
number of photo corner businesses that uses apart from HITI printer, such as Kodak and
Photo Luxio.
To know what factors are taken into consideration by the prospective client of photo
corner in Surabaya, therefore conducted a pre-survey using 10 people. The respondent
of this pre-survey are people that lived on Surabaya,and already knew Photo Cabin as
one of the photo corner players in Surabaya, and this 10 peoples also who has been a
guest of an event or party that uses the Photo Cabin as its photo corner needs. Results of
pre-survey dictates that 10 of the 10 respondents concerned to the price factor and
product quality of a vendor photo corner.
PRICE’S DEFINITION
Price’s Understanding in according to Kotler (2012: 290) is the amount of money that
paid for a product or service, in which the amount of money by the consumer is other
the benefits of ownership or use of a product or service. This is consistent with the
proposed by Swastha on Sugiyanto (2012: 36) where the notion of price is the amount
of money paid in order to obtain some goods or services and their service. However, to
setting the price, to be cheapest is not always be the best option, because, quality of
products / services are also important in the purchase decision. Even if the products /
services at a higher price could be preferred by consumers than a lower price. (Owusu
2013: 181). This is explained by a Kottler on Owusu (2013: 182) in which consumers
use price as an indicator for the quality of a product / service and it also relates also to
the prestige of the consumer. Here there are the indicators that characterize the price
proposed by Stanton on Sagita (2013): Affordability of the price, Price’s conformance
on product quality, Price’s competitiveness, Price’s conformance with benefits
QUALITY PRODUCT’S DEFINITION According to Kotler and Keller (2012: 143) is the product quality is the totality of
features and characteristics of a product or service that related to its ability to satisfy
stated or implied the needs. Kotler said (2012: 4) Consumers will prefer products that
offer the best quality, performance and features, therefore it is necessary for producers
or organizations to further improve their product quality, because the quality of the
product plays an important role to attract consumers. According to Kottler and Keller
(2009: 8), the dimensions of the quality of the product include: Performance , refers to
the functional specifications of the products or services and is the primary factor being
taken into consideration by the consumer in the purchase and use of products or
services, Features, refers to the additional specifications, or specifications
complementary addition to the basic specifications, closely with a choice of products or
services and development, Reliability, refers to the probability of a product or service
when its success in carrying out the functions in a certain period of time, Conformance
to Specifications, referring to the specification of the product or service to what has
been previously defined or declared in accordance with the wishes of consumers,
Durability, refers to the durability or the life of a product, or the life of the operation of
The First International Conference on Entrepreneurship
Book One 90
a product that used under normal conditions, Aesthetics (Asthethic), refers to how
consumers feel about the existence of the products as quality, it is subjective as it relates
to individual preferences and personal consideration of aesthetic factors, Serviceability
refers to the services
BUYING DECISION DEFINITION
According to Peter (2010: 5), to defines consumer behavior as a process that involving
thoughts, experiences, and actions of a person to consume a product or service, and the
process is influenced by factors that exist around the person's environment, such as
comments from other consumers , advertising, pricing information, product packaging,
product appearance, etc.. Indicator purchasing decisions according to Kotler in Widodo
(2012: 14), namely: Stability on a product or service, Habits in purchasing a product or
service, Provide recommendations to others, Restate to purchase
THE INFLUENCES OF PRICE VARIABLE TO BUYING DECISION
VARIABLE According Tedjakusuma in S. R, Larosa (2010: 6) The result of the high competition
between companies or similar efforts, make consumers sensitive to price, so if the price
is raised, then the consumer will be inclined to move the other company or
manufacturers that provide products or similar services. This proves that the price factor
is important to the process of purchasing a product or service decisions. This is
supported in Utami Research (2012) which states that the application of the right pricing
strategy is crucial in an effort to attract consumers. If a consumer get the price is fitting
of they would prefer a store or vendor that provides goods or services at that price, and
if a consumer was not getting the price match, they will buy to the store or alternative
vendors which provide similar products or services. It can be concluded that the factor
price is an important factor in consumer buying decision process. And from the results
of previous studies by Purwati (2012) which is used as reference in this research also
states that the correlation between the price and the purchase decision factors tested
positive significant impact. If the price of a product or service is low, the demand will
be high, and if the price of a product or service is higher the demand will be low. Price
often becomes a major concern in the strategic purchasing decisions so that proper
pricing is considered essential, in order to increase the purchasing decision.
From research by Wahyudi (2012) found that the price factor has a positive influence in
the purchase decision, so it can be concluded that consumers somehow will consider
how much money must be spent to get the benefit or satisfaction of the products or
services that have been purchased, so it also affects consumers in making purchasing
decisions.
THE INFLUENCES OF QUALITY PRODUCT VARIABLE TO BUYING
DECISION VARIABLE According to research by Owusu (2013) stated that the quality of products have a
considerable influence on the value of a product or service. This is supported by
previous research that used as reference by the research Shaharudin et al (2011) where
in the research stated that the product quality is a factor that has positive influence on
purchasing decisions. Quality factor of the product is able to help consumers to
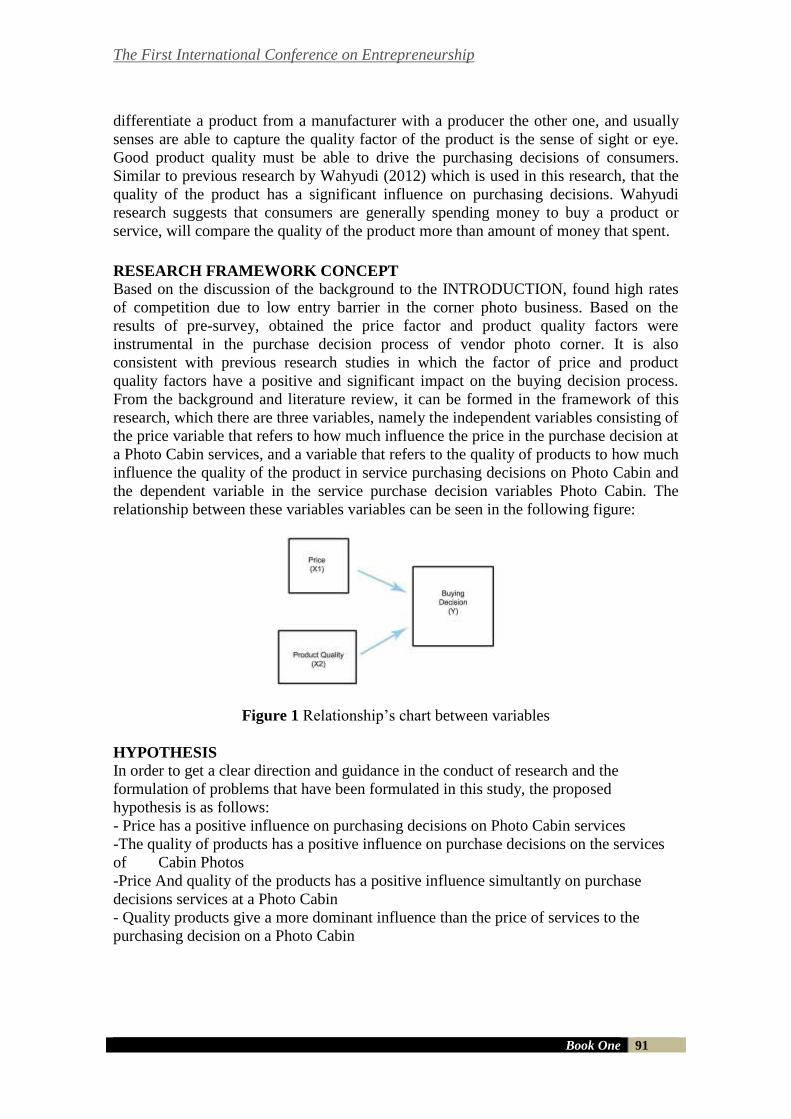
The First International Conference on Entrepreneurship
Book One 91
differentiate a product from a manufacturer with a producer the other one, and usually
senses are able to capture the quality factor of the product is the sense of sight or eye.
Good product quality must be able to drive the purchasing decisions of consumers.
Similar to previous research by Wahyudi (2012) which is used in this research, that the
quality of the product has a significant influence on purchasing decisions. Wahyudi
research suggests that consumers are generally spending money to buy a product or
service, will compare the quality of the product more than amount of money that spent.
RESEARCH FRAMEWORK CONCEPT Based on the discussion of the background to the INTRODUCTION, found high rates
of competition due to low entry barrier in the corner photo business. Based on the
results of pre-survey, obtained the price factor and product quality factors were
instrumental in the purchase decision process of vendor photo corner. It is also
consistent with previous research studies in which the factor of price and product
quality factors have a positive and significant impact on the buying decision process.
From the background and literature review, it can be formed in the framework of this
research, which there are three variables, namely the independent variables consisting of
the price variable that refers to how much influence the price in the purchase decision at
a Photo Cabin services, and a variable that refers to the quality of products to how much
influence the quality of the product in service purchasing decisions on Photo Cabin and
the dependent variable in the service purchase decision variables Photo Cabin. The
relationship between these variables variables can be seen in the following figure:
Figure 1 Relationship’s chart between variables
HYPOTHESIS In order to get a clear direction and guidance in the conduct of research and the
formulation of problems that have been formulated in this study, the proposed
hypothesis is as follows:
- Price has a positive influence on purchasing decisions on Photo Cabin services
-The quality of products has a positive influence on purchase decisions on the services
of Cabin Photos
-Price And quality of the products has a positive influence simultantly on purchase
decisions services at a Photo Cabin
- Quality products give a more dominant influence than the price of services to the
purchasing decision on a Photo Cabin
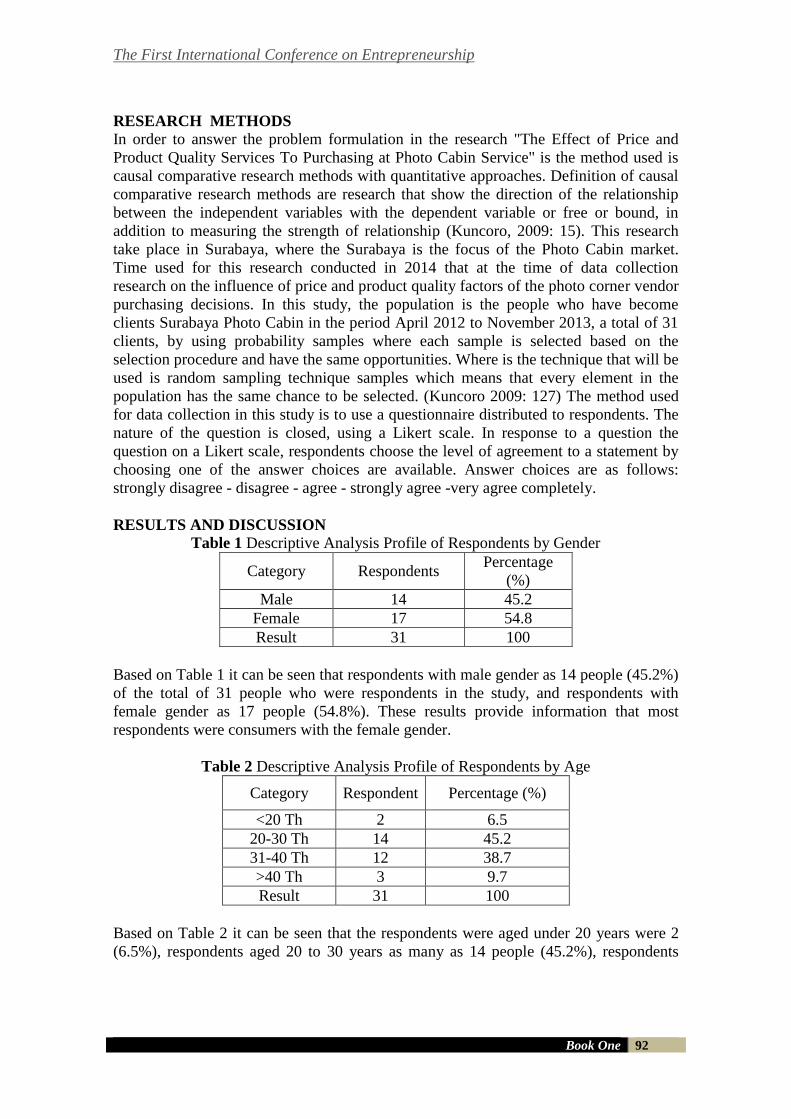
The First International Conference on Entrepreneurship
Book One 92
RESEARCH METHODS
In order to answer the problem formulation in the research "The Effect of Price and
Product Quality Services To Purchasing at Photo Cabin Service" is the method used is
causal comparative research methods with quantitative approaches. Definition of causal
comparative research methods are research that show the direction of the relationship
between the independent variables with the dependent variable or free or bound, in
addition to measuring the strength of relationship (Kuncoro, 2009: 15). This research
take place in Surabaya, where the Surabaya is the focus of the Photo Cabin market.
Time used for this research conducted in 2014 that at the time of data collection
research on the influence of price and product quality factors of the photo corner vendor
purchasing decisions. In this study, the population is the people who have become
clients Surabaya Photo Cabin in the period April 2012 to November 2013, a total of 31
clients, by using probability samples where each sample is selected based on the
selection procedure and have the same opportunities. Where is the technique that will be
used is random sampling technique samples which means that every element in the
population has the same chance to be selected. (Kuncoro 2009: 127) The method used
for data collection in this study is to use a questionnaire distributed to respondents. The
nature of the question is closed, using a Likert scale. In response to a question the
question on a Likert scale, respondents choose the level of agreement to a statement by
choosing one of the answer choices are available. Answer choices are as follows:
strongly disagree - disagree - agree - strongly agree -very agree completely.
RESULTS AND DISCUSSION Table 1 Descriptive Analysis Profile of Respondents by Gender
Category Respondents Percentage
(%)
Male 14 45.2
Female 17 54.8
Result 31 100
Based on Table 1 it can be seen that respondents with male gender as 14 people (45.2%)
of the total of 31 people who were respondents in the study, and respondents with
female gender as 17 people (54.8%). These results provide information that most
respondents were consumers with the female gender.
Table 2 Descriptive Analysis Profile of Respondents by Age
Category Respondent Percentage (%)
<20 Th 2 6.5
20-30 Th 14 45.2
31-40 Th 12 38.7
>40 Th 3 9.7
Result 31 100
Based on Table 2 it can be seen that the respondents were aged under 20 years were 2
(6.5%), respondents aged 20 to 30 years as many as 14 people (45.2%), respondents
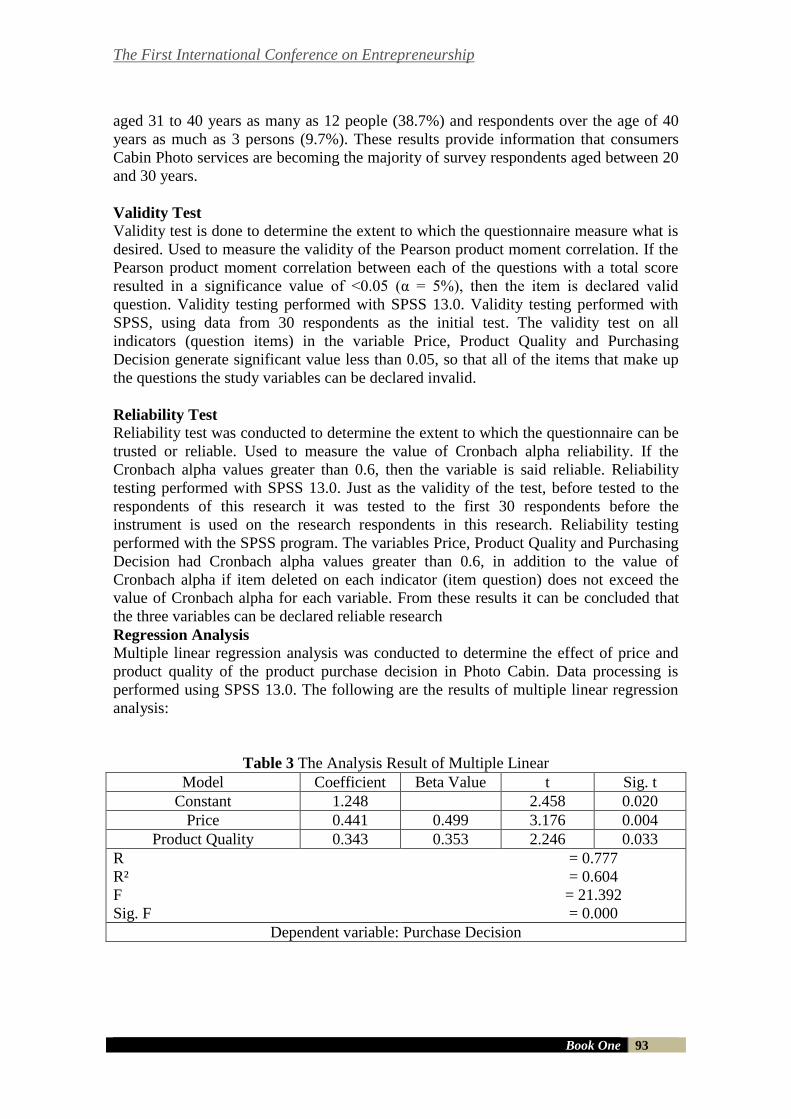
The First International Conference on Entrepreneurship
Book One 93
aged 31 to 40 years as many as 12 people (38.7%) and respondents over the age of 40
years as much as 3 persons (9.7%). These results provide information that consumers
Cabin Photo services are becoming the majority of survey respondents aged between 20
and 30 years.
Validity Test Validity test is done to determine the extent to which the questionnaire measure what is
desired. Used to measure the validity of the Pearson product moment correlation. If the
Pearson product moment correlation between each of the questions with a total score
resulted in a significance value of <0.05 (α = 5%), then the item is declared valid
question. Validity testing performed with SPSS 13.0. Validity testing performed with
SPSS, using data from 30 respondents as the initial test. The validity test on all
indicators (question items) in the variable Price, Product Quality and Purchasing
Decision generate significant value less than 0.05, so that all of the items that make up
the questions the study variables can be declared invalid.
Reliability Test Reliability test was conducted to determine the extent to which the questionnaire can be
trusted or reliable. Used to measure the value of Cronbach alpha reliability. If the
Cronbach alpha values greater than 0.6, then the variable is said reliable. Reliability
testing performed with SPSS 13.0. Just as the validity of the test, before tested to the
respondents of this research it was tested to the first 30 respondents before the
instrument is used on the research respondents in this research. Reliability testing
performed with the SPSS program. The variables Price, Product Quality and Purchasing
Decision had Cronbach alpha values greater than 0.6, in addition to the value of
Cronbach alpha if item deleted on each indicator (item question) does not exceed the
value of Cronbach alpha for each variable. From these results it can be concluded that
the three variables can be declared reliable research
Regression Analysis
Multiple linear regression analysis was conducted to determine the effect of price and
product quality of the product purchase decision in Photo Cabin. Data processing is
performed using SPSS 13.0. The following are the results of multiple linear regression
analysis:
Table 3 The Analysis Result of Multiple Linear
Model Coefficient Beta Value t Sig. t
Constant 1.248 2.458 0.020
Price 0.441 0.499 3.176 0.004
Product Quality 0.343 0.353 2.246 0.033
R = 0.777
R² = 0.604
F = 21.392
Sig. F = 0.000
Dependent variable: Purchase Decision
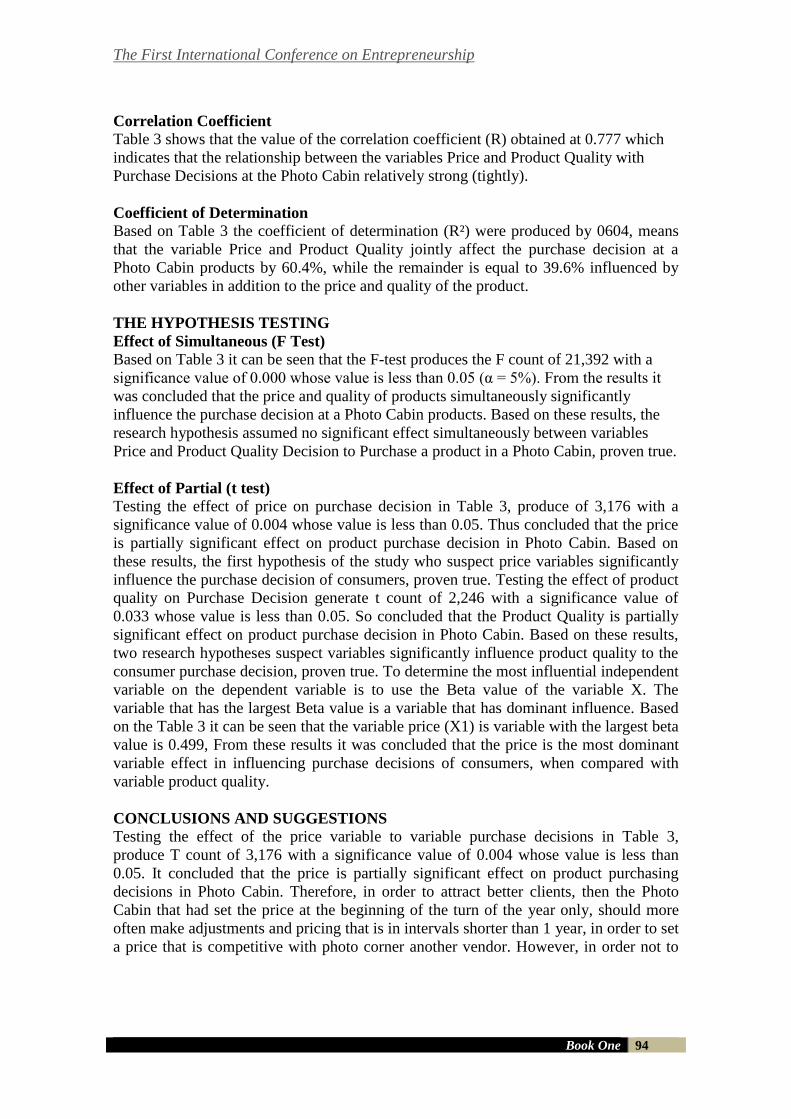
The First International Conference on Entrepreneurship
Book One 94
Correlation Coefficient Table 3 shows that the value of the correlation coefficient (R) obtained at 0.777 which
indicates that the relationship between the variables Price and Product Quality with
Purchase Decisions at the Photo Cabin relatively strong (tightly).
Coefficient of Determination Based on Table 3 the coefficient of determination (R²) were produced by 0604, means
that the variable Price and Product Quality jointly affect the purchase decision at a
Photo Cabin products by 60.4%, while the remainder is equal to 39.6% influenced by
other variables in addition to the price and quality of the product.
THE HYPOTHESIS TESTING
Effect of Simultaneous (F Test) Based on Table 3 it can be seen that the F-test produces the F count of 21,392 with a
significance value of 0.000 whose value is less than 0.05 (α = 5%). From the results it
was concluded that the price and quality of products simultaneously significantly
influence the purchase decision at a Photo Cabin products. Based on these results, the
research hypothesis assumed no significant effect simultaneously between variables
Price and Product Quality Decision to Purchase a product in a Photo Cabin, proven true.
Effect of Partial (t test) Testing the effect of price on purchase decision in Table 3, produce of 3,176 with a
significance value of 0.004 whose value is less than 0.05. Thus concluded that the price
is partially significant effect on product purchase decision in Photo Cabin. Based on
these results, the first hypothesis of the study who suspect price variables significantly
influence the purchase decision of consumers, proven true. Testing the effect of product
quality on Purchase Decision generate t count of 2,246 with a significance value of
0.033 whose value is less than 0.05. So concluded that the Product Quality is partially
significant effect on product purchase decision in Photo Cabin. Based on these results,
two research hypotheses suspect variables significantly influence product quality to the
consumer purchase decision, proven true. To determine the most influential independent
variable on the dependent variable is to use the Beta value of the variable X. The
variable that has the largest Beta value is a variable that has dominant influence. Based
on the Table 3 it can be seen that the variable price (X1) is variable with the largest beta
value is 0.499, From these results it was concluded that the price is the most dominant
variable effect in influencing purchase decisions of consumers, when compared with
variable product quality.
CONCLUSIONS AND SUGGESTIONS Testing the effect of the price variable to variable purchase decisions in Table 3,
produce T count of 3,176 with a significance value of 0.004 whose value is less than
0.05. It concluded that the price is partially significant effect on product purchasing
decisions in Photo Cabin. Therefore, in order to attract better clients, then the Photo
Cabin that had set the price at the beginning of the turn of the year only, should more
often make adjustments and pricing that is in intervals shorter than 1 year, in order to set
a price that is competitive with photo corner another vendor. However, in order not to
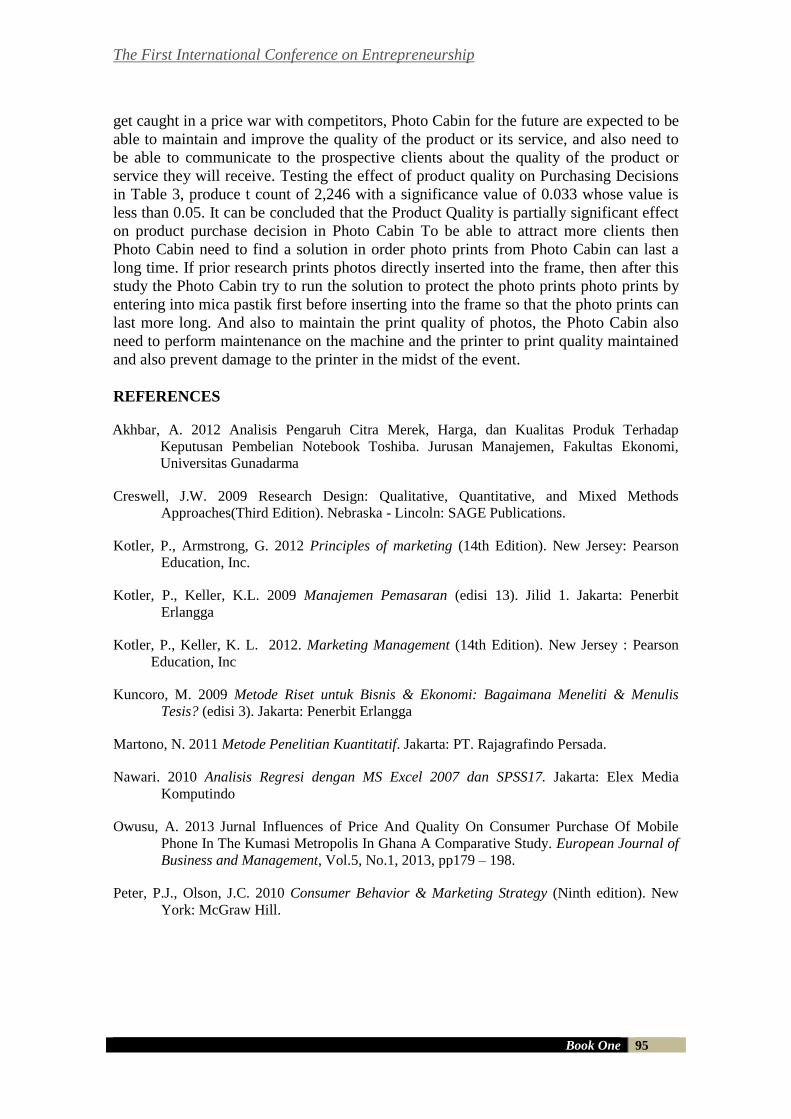
The First International Conference on Entrepreneurship
Book One 95
get caught in a price war with competitors, Photo Cabin for the future are expected to be
able to maintain and improve the quality of the product or its service, and also need to
be able to communicate to the prospective clients about the quality of the product or
service they will receive. Testing the effect of product quality on Purchasing Decisions
in Table 3, produce t count of 2,246 with a significance value of 0.033 whose value is
less than 0.05. It can be concluded that the Product Quality is partially significant effect
on product purchase decision in Photo Cabin To be able to attract more clients then
Photo Cabin need to find a solution in order photo prints from Photo Cabin can last a
long time. If prior research prints photos directly inserted into the frame, then after this
study the Photo Cabin try to run the solution to protect the photo prints photo prints by
entering into mica pastik first before inserting into the frame so that the photo prints can
last more long. And also to maintain the print quality of photos, the Photo Cabin also
need to perform maintenance on the machine and the printer to print quality maintained
and also prevent damage to the printer in the midst of the event.
REFERENCES
Akhbar, A. 2012 Analisis Pengaruh Citra Merek, Harga, dan Kualitas Produk Terhadap
Keputusan Pembelian Notebook Toshiba. Jurusan Manajemen, Fakultas Ekonomi,
Universitas Gunadarma
Creswell, J.W. 2009 Research Design: Qualitative, Quantitative, and Mixed Methods
Approaches(Third Edition). Nebraska - Lincoln: SAGE Publications.
Kotler, P., Armstrong, G. 2012 Principles of marketing (14th Edition). New Jersey: Pearson
Education, Inc.
Kotler, P., Keller, K.L. 2009 Manajemen Pemasaran (edisi 13). Jilid 1. Jakarta: Penerbit
Erlangga
Kotler, P., Keller, K. L. 2012. Marketing Management (14th Edition). New Jersey : Pearson
Education, Inc
Kuncoro, M. 2009 Metode Riset untuk Bisnis & Ekonomi: Bagaimana Meneliti & Menulis
Tesis? (edisi 3). Jakarta: Penerbit Erlangga
Martono, N. 2011 Metode Penelitian Kuantitatif. Jakarta: PT. Rajagrafindo Persada.
Nawari. 2010 Analisis Regresi dengan MS Excel 2007 dan SPSS17. Jakarta: Elex Media
Komputindo
Owusu, A. 2013 Jurnal Influences of Price And Quality On Consumer Purchase Of Mobile
Phone In The Kumasi Metropolis In Ghana A Comparative Study. European Journal of
Business and Management, Vol.5, No.1, 2013, pp179 – 198.
Peter, P.J., Olson, J.C. 2010 Consumer Behavior & Marketing Strategy (Ninth edition). New
York: McGraw Hill.
The First International Conference on Entrepreneurship
Book One 96
Priyatno, D., 2013 “Mandiri Belajar Analisis Statistik Data dengan SPSS.” Yogyakarta:
Mediakom.
Purwati., Setiawan, H., Rohmawati. 2012 Pengaruh Harga dan Kualitas Produk Terhadap
Keputusan Pembelian Motor Honda Matic Beat (Studi Kasus Pada PT. Nusantara Solar
Sakti). Jurnal Ekonomi Dan Informasi Akuntansi (Jenius) Vol. 2 No. 3 Sept 2012,
pp260 - 277.
Sugiyono. 2009 Statistik Untuk Penelitian. Bandung: CV Alfa Beta.
Sugiyanto, F. 2012 Analisis Produk, Harga, Lokasi dan Pelayanan Mempengaruhi Kepuasan
Konsumen Pada Foodcourt “I Love Fruit” di DP Mall Semarang, Jurnal Dinamika
Manajemen Vol. 3 No. 1 April 2013, pp.33 – 48.
Sagita, F.E. 2013 Pengaruh Brand Image Dan Harga Terhadap Keputusan Pembelian Ulang
Produk Kentucky Fried Chicken (KFC) di Cabang Basko Grand Mall Oleh Mahasiswa
Negeri Padang. Jurnal Managemen Vol.2, No.2 (2013).
Sianipar, M. 2012 “Jasa Photobooth Profesional Di Pekanbaru”. Available at:
http://www.magiccorner.com/index.php?option=comcontent&view=article&id=77:jasa-
photobooth_profesional-di%20pekanbaru&catid=35: artikel&Itemid=156 (accessed at:
5 October 2013).
Setyadharma, A. 2010 Uji Asumsi Klasik Dengan SPSS 16.0. Fakultas Ekonomi Universitas
Negri Semarang.
Shaharudin, M.R., et al. 2011 The relationship between product quality and purchase intention:
The case of Malaysia’s national motorcycle/scooter manufacturer, African Journal of
Business Management Vol. 5(20), 16 September, 2011, pp. 8163 – 8176.
Larosa, S.R., Sugiarto, P.H. 2010 Analisis Pengaruh Harga, Kualitas Produk, dan Lokasi
Terhadap Keputusan Pembelian (Studi Kasus Pada Warung-Warung Makan di Sekitar
Simpang Lima Semarang). Jurusan Manajemen Fakultas Ekonomika dan Bisnis,
Universitas Diponegoro.
Schiffman, L.G. et al. 2010 Consumer Behavior (Tenth edition). New York: Prentice Hall.
Sunyoto, Danang. 2011 Analisis Regresi dan Uji Hipotesis. Yogyakarta: CAPS.
Swastha, B. 2009 Azas-Azas Marketing (cetakan ketujuh). Yogyakarta: Liberty Yogyakarta.
Utami, C.W. 2012. Manajemen Ritel (Strategi dan Implementasi Ritel Modern). Edisi ke 3.
Jakarta: Salemba Empat.
Wahyudi, S. 2012 Analisa Faktor-faktor yang Mempengaruhi Perilaku Konsumen Dalam
Keputusan Pembelian Sepeda Motor Honda Matik Pada CV. Kurnia Sakti Semarang,
Jurnal Dinamika Manajemen Vol. 3 No. 1 April 2013, pp.97 - 112.
Widodo, O.W. 2012 Analisis Pengaruh Kualitas Produk, Kualitas Layanan, Dan Promosi
Terhadap Keputusan Pembelian (Studi kasus pada 123 Design and Photography di
Semarang), Jurusan Manajemen Fakultas Ekonomika dan Bisnis, Universitas Diponegoro.

The First International Conference on Entrepreneurship
Book One 97
Wijaya, Tony. 2009 Analisis Data Penelitian Menggunakan SPSS. Yogyakarta: Universitas
Atma Jaya
Wikipedia. 2013 “Fotografi”. Available at: http://id.wikipedia.org/wiki/Fotografi (accessed at: 5
October 2013)
The First International Conference on Entrepreneurship
Book One 98
THE INFLUENCE OF INTRINSIC MOTIVATION AND
EXTRINSIC MOTIVATION TOWARDS PLAYER
PERFORMANCE IN KNIGHTS MANAGEMENT
Jeffry1, Christina Whidya Utami2
Universitas Ciputra
INDONESIA
E-mail: [email protected], [email protected]
ABSTRACT
The purpose of this study was to 1) determine the influence of intrinsic
motivation and extrinsic motivation on Knights management players
performance simultaneously; 2) determine the influence of intrinsic motivation
to Knights management players performance; 3) determine the influence of
exstrinsic motivation to Knights management players performance. This study used a quantitative approach with Regression Analysis aimed to
influence the intrinsic motivation (X1) dan extrinsic motivation (X2) on player
performance (Y). In this study belong to the population are Knights
management players as many as 34 people. The sample in this study was 34
respondents were obtained use sampel jenuh. Data retrieval technique using a
questionnaire. The results of this study indicate that the intrinsic motivation (X1) dan extrinsic
motivation (X2) simultaneously influence the player performance (Y), because
the obtained value of F 10,119 with significance level of 0.000. Partially,
intrinsic motivation (X1) significantly influence the player performance (Y), with
a value of 2,083 with a t-test significance level of 0,009. In addition, the
extrinsic motivation (X2) also has a significant influence player performance (Y),
where the value of 2,469 t-test with significance level of 0,019.
Keywords: Intrinsic Motivation, Extrinsic Motivation, Player
Performance
INTRODUCTION
Sports development in Indonesia has undergone a change. So much sport in Indonesia,
basketball is the number one sport for young people in Indonesia. Based on the survey
of teenager aged 13-17 years in 11 major cities which have hosted the Honda DBL at
least. The sample surveyed is random, youth are not only the school that became Honda
DBL. participants based on the survey, managed to become a favourite sport of
basketball.
CLS is one of the clubs that follow the NBL domiciled in Surabaya, joined the
management of the Knights in 2008 and renamed CLS Knights. With the formation of
the WNBL in 2011, the management of Knights formed the Surabaya Fever who is also
domiciled in Surabaya to follow the League's WNBL. Management of the Knights have
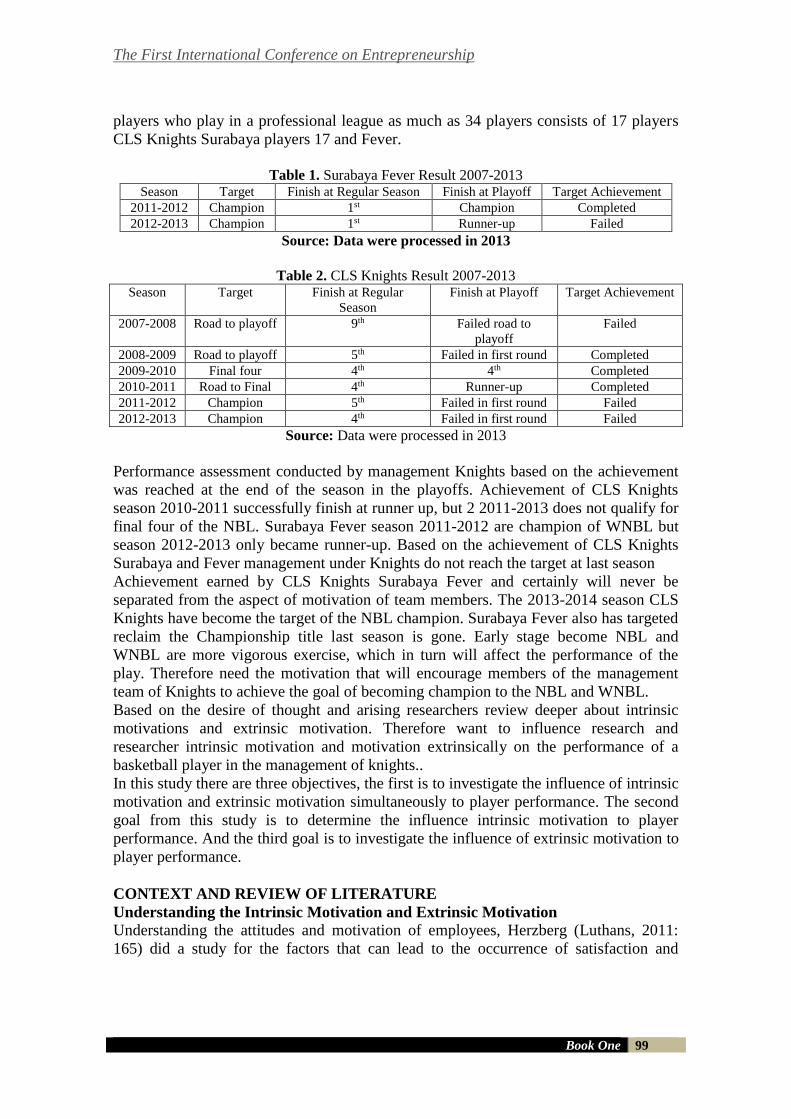
The First International Conference on Entrepreneurship
Book One 99
players who play in a professional league as much as 34 players consists of 17 players
CLS Knights Surabaya players 17 and Fever.
Table 1. Surabaya Fever Result 2007-2013
Season Target Finish at Regular Season Finish at Playoff Target Achievement
2011-2012 Champion 1st Champion Completed
2012-2013 Champion 1st Runner-up Failed
Source: Data were processed in 2013
Table 2. CLS Knights Result 2007-2013 Season Target Finish at Regular
Season
Finish at Playoff Target Achievement
2007-2008 Road to playoff 9th Failed road to
playoff
Failed
2008-2009 Road to playoff 5th Failed in first round Completed
2009-2010 Final four 4th 4th Completed
2010-2011 Road to Final 4th Runner-up Completed
2011-2012 Champion 5th Failed in first round Failed
2012-2013 Champion 4th Failed in first round Failed
Source: Data were processed in 2013
Performance assessment conducted by management Knights based on the achievement
was reached at the end of the season in the playoffs. Achievement of CLS Knights
season 2010-2011 successfully finish at runner up, but 2 2011-2013 does not qualify for
final four of the NBL. Surabaya Fever season 2011-2012 are champion of WNBL but
season 2012-2013 only became runner-up. Based on the achievement of CLS Knights
Surabaya and Fever management under Knights do not reach the target at last season
Achievement earned by CLS Knights Surabaya Fever and certainly will never be
separated from the aspect of motivation of team members. The 2013-2014 season CLS
Knights have become the target of the NBL champion. Surabaya Fever also has targeted
reclaim the Championship title last season is gone. Early stage become NBL and
WNBL are more vigorous exercise, which in turn will affect the performance of the
play. Therefore need the motivation that will encourage members of the management
team of Knights to achieve the goal of becoming champion to the NBL and WNBL.
Based on the desire of thought and arising researchers review deeper about intrinsic
motivations and extrinsic motivation. Therefore want to influence research and
researcher intrinsic motivation and motivation extrinsically on the performance of a
basketball player in the management of knights..
In this study there are three objectives, the first is to investigate the influence of intrinsic
motivation and extrinsic motivation simultaneously to player performance. The second
goal from this study is to determine the influence intrinsic motivation to player
performance. And the third goal is to investigate the influence of extrinsic motivation to
player performance.
CONTEXT AND REVIEW OF LITERATURE
Understanding the Intrinsic Motivation and Extrinsic Motivation
Understanding the attitudes and motivation of employees, Herzberg (Luthans, 2011:
165) did a study for the factors that can lead to the occurrence of satisfaction and
The First International Conference on Entrepreneurship
Book One 100
dissatisfaction by an employee in a work environment. According to Herzberg there are
two factors that motivate employees. Two of these factors are: motivation factor which
is called intrinsic motivation or satisfier, and keepers (maintenance factor) called
disatisfier or extrinsic motivation.
Herzberg in Hartati (2011) mention job satisfaction factors as internal motivation
factors sourced from within the person (intrinsic condition), it functions as a driving
factor for someone to Excel, or it can be said that the motivational factor (motivator)
needed to motivate employees to produce high performance, where those factors was
the result of an internal or comes from the inside of the employees. The factors that lead
to job satisfaction according to Herzberg (Robbins, 2012: 461) differ from the factors
that cause the dissatisfaction of work.
Herzberg in Schermerhorn (2008: 348) mentions factors that cause dissatisfaction as
factors keeping work coming from external or it can be said that the factor is hygiene
factors necessary to ascertain what the cause of disgruntled employees. This factor
cannot give rise to higher motivation of employees or may imply that employees
without any compulsion, this factor does not produce motivation but only movement. It
can be said that the factor hygiene only keeps job satisfaction does not decline so that
the motivation of the employees will not be decreased.
Herzberg in Hartati (2011) mention intrinsic motivation factors include: (1) job
satisfaction it self (the work it self), (2) chances to get ahead (advancement), (3) the
recognition of others (recognition), and (4) responsibility (responsibility). Job
satisfaction and responsibility can be said the need for self-actualization, whereas the
recognition of others is a requirement for the award.
Herzberg in Schermerhorn (2008: 348) mention the extrinsic motivation factors include:
(1) Compensation (compensation), (2) working conditions (working condition), (3) the
quality of supervision (quality supervisors), and (4) human relationships (interpersonal
relations).
Understanding the Performance
Rivai and Basri (Riani, 2011: 96) states that the performance is the result of someone's
overall during a certain period in the standard tasks, such as carrying out the work,
targets or goals or criteria have been determined in advance and agreed upon together.
In other words performance is the result of work that is a person in carrying out the task
assigned to him in accordance with the criteria set out and have a certain period.
Performance is the extent to which someone has to play its part in implementing the
strategy of the Organization (Riani, 2011: 50). Robbins (in Riani, 2011: 98) declares the
performance was as much an attempt individual issued on his work. Based on the
understanding of the performance can be defined as a person's results achieved
according to the measure that applies to the work in question. In addition to it's
performance can be defined as the role and efforts that have been made by a person or
group of people that is certain and is measured in units of time.
According to Prawirosentono (2008: 27), performance can be assessed or measured
with several indicators, namely: a) the effectiveness of the Group's objectives can be
achieved when needs are planned. b) responsibilities that are an integral part or as a
result of ownership of the work. c) Discipline that is obedient to the laws and rules in
force. Employee discipline employee concerned obedience is in honoring work
The First International Conference on Entrepreneurship
Book One 101
agreement with the company where he works. d) Initiative that is related to the intellect,
creativity in the form of an idea related to the purpose of the company. The nature of the
initiative should get attention or response company and a good supervisor. In other
words an employee initiative advances thrust will eventually affect the performance of
the employee.
Hypothesis
The hypotheses proposed in this study are as follows:
H1 : Intrinsic motivation and extrinsic motivation has to simultaneously influence
Knights management players performance.
H2 : intrinsic motivation has a significant influence Knights management players
performance.
H3 : Extrinsic motivation has a significant influence on Knights management
players performance.
RESEARCH METHODS
The research approach used in this study is quantitative approach. As for the type of
research used in this research is the explanatory research, that is research that outlines
the relationships between variables. According to Sugiyono (2012: 15) explanatory
research is intended to explain the position of the variables examined.
Total population in this study is determined from the number of Knights management
players 2013 is 34 people. In this study, for the collection of samples, the technique
used in this study is sampling jenuh. The technique of determination of the sample when
all members of a population is used as a sample.
Researchers chose sampling jenuh because of in this study because the number of total
population slightly (limited) so it is not possible to use the sample, so the researchers
took a number of samples of the same population or sampling jenuh called by basketball
players who are under the management of Knights that add up to 34 people consists of
17 players CLS Knights Surabaya players 17 and Fever.
The data used in this study is Data interval, which is associated with intrinsic motivation
and extrinsic motivation. Sources of data used in this study are divided into two, namely
internal and external. What is meant by the internal data is a data company. While
categorized into external data is data players and a wide range of literature review and
other sources such as previous studies, reference books, etc. Data collection methods
used in this study is through questionnaires.
Variables examined in this study can be divided into two. The first variable is called the
independent variable which consists of the intrinsic motivation () and extrinsic
motivation (). While the second variable is called the dependent variable is the player
performance (Y).
Data Analysis Techniques
1. Multiple Linear Regression Analysis
Multiple linear regression is a method used to determine whether there is influence
of independent variables on the dependent variable (Ghozali, 2011). Multiple linear
regression equation used in this study is as follows: Specification: Y : Dependent Variable (player performance)
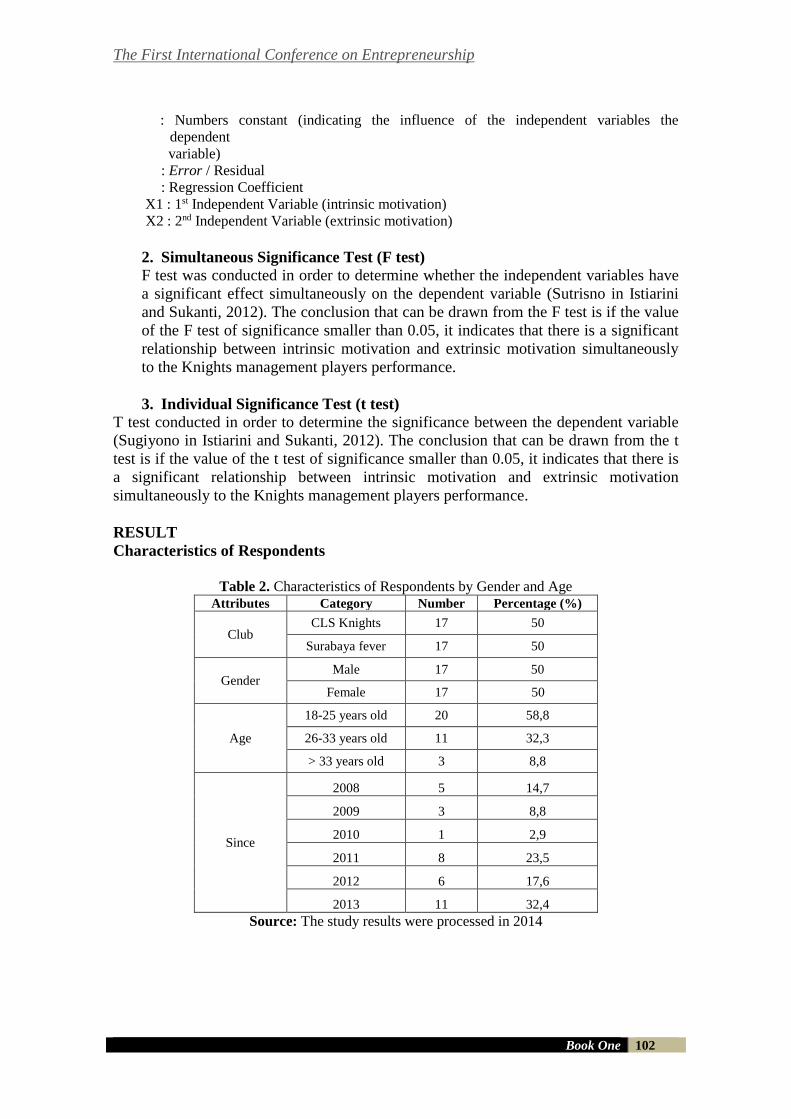
The First International Conference on Entrepreneurship
Book One 102
: Numbers constant (indicating the influence of the independent variables the
dependent variable) : Error / Residual : Regression Coefficient X1 : 1st Independent Variable (intrinsic motivation) X2 : 2nd Independent Variable (extrinsic motivation)
2. Simultaneous Significance Test (F test)
F test was conducted in order to determine whether the independent variables have
a significant effect simultaneously on the dependent variable (Sutrisno in Istiarini
and Sukanti, 2012). The conclusion that can be drawn from the F test is if the value
of the F test of significance smaller than 0.05, it indicates that there is a significant
relationship between intrinsic motivation and extrinsic motivation simultaneously
to the Knights management players performance.
3. Individual Significance Test (t test)
T test conducted in order to determine the significance between the dependent variable
(Sugiyono in Istiarini and Sukanti, 2012). The conclusion that can be drawn from the t
test is if the value of the t test of significance smaller than 0.05, it indicates that there is
a significant relationship between intrinsic motivation and extrinsic motivation
simultaneously to the Knights management players performance.
RESULT
Characteristics of Respondents
Table 2. Characteristics of Respondents by Gender and Age
Attributes Category Number Percentage (%)
Club CLS Knights 17 50
Surabaya fever 17 50
Gender Male 17 50
Female 17 50
Age
18-25 years old 20 58,8
26-33 years old 11 32,3
> 33 years old 3 8,8
Since
2008 5 14,7
2009 3 8,8
2010 1 2,9
2011 8 23,5
2012 6 17,6
2013 11 32,4
Source: The study results were processed in 2014
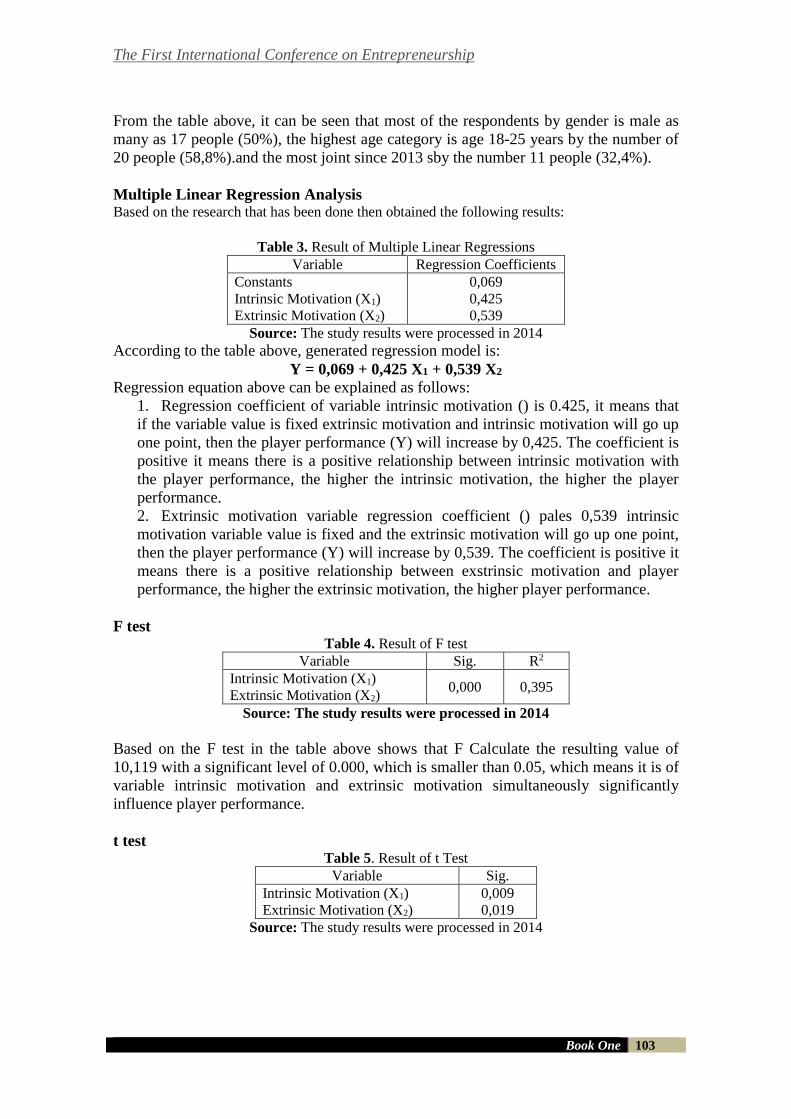
The First International Conference on Entrepreneurship
Book One 103
From the table above, it can be seen that most of the respondents by gender is male as
many as 17 people (50%), the highest age category is age 18-25 years by the number of
20 people (58,8%).and the most joint since 2013 sby the number 11 people (32,4%).
Multiple Linear Regression Analysis Based on the research that has been done then obtained the following results:
Table 3. Result of Multiple Linear Regressions
Variable Regression Coefficients Constants Intrinsic Motivation (X1) Extrinsic Motivation (X2)
0,069 0,425 0,539
Source: The study results were processed in 2014
According to the table above, generated regression model is:
Y = 0,069 + 0,425 X1 + 0,539 X2
Regression equation above can be explained as follows:
1. Regression coefficient of variable intrinsic motivation () is 0.425, it means that
if the variable value is fixed extrinsic motivation and intrinsic motivation will go up
one point, then the player performance (Y) will increase by 0,425. The coefficient is
positive it means there is a positive relationship between intrinsic motivation with
the player performance, the higher the intrinsic motivation, the higher the player
performance.
2. Extrinsic motivation variable regression coefficient () pales 0,539 intrinsic
motivation variable value is fixed and the extrinsic motivation will go up one point,
then the player performance (Y) will increase by 0,539. The coefficient is positive it
means there is a positive relationship between exstrinsic motivation and player
performance, the higher the extrinsic motivation, the higher player performance.
F test Table 4. Result of F test
Variable Sig. R2
Intrinsic Motivation (X1) Extrinsic Motivation (X2)
0,000 0,395
Source: The study results were processed in 2014
Based on the F test in the table above shows that F Calculate the resulting value of
10,119 with a significant level of 0.000, which is smaller than 0.05, which means it is of
variable intrinsic motivation and extrinsic motivation simultaneously significantly
influence player performance.
t test Table 5. Result of t Test
Variable Sig. Intrinsic Motivation (X1) Extrinsic Motivation (X2)
0,009 0,019
Source: The study results were processed in 2014
The First International Conference on Entrepreneurship
Book One 104
t value in the variable service quality by 2,803 to 0,009 below the significant level of
0.05, have indicated that intrinsic motivation variable partially influence on player
performance. Similarly, the extrinsic motivation variable, the resulting value of t at
2,469 with a significant level of 0,019 below 0.05, it means the extrinsic motivation
variable partially influence on player performance.
CONCLUSION
Based on research results that have been discussed in the previous chapter, it can be
concluded as follows:
1. Intrinsic motivation and extrinsic motivation have simultaneous influence on
player performance. Intrinsic motivation and extrinsic motivation together can
result in the same spirit of the players, because aside from the motivation in
yourself arise extrinsic motivation comes from outside themselves in the form of
compensation, good working conditions, the quality of supervision, and a good
human relationships within the Organization will be able to create good
performance among its players. The players will practice more diligently and with
good practice when based on the existence of a family atmosphere and good
cooperation between players. Hence the need of the intrinsic motivation and
extrinsic motivation to improve the performance of employees.
2. Intrinsic motivation has a significant influence on player performance. A high
intrinsic motivation cause the player with their own accord without being forced to
improve performance in playing basketball. Players are motivated from within
himself will feel the work is very valuable so the players will work hard in
completing the appropriate target that has been set.
3. Extrinsic motivation has a significant influence on the player performance.
Extrinsic motivation is a factor that makes people dissatisfied. That is, the
fulfillment of the extrinsic motivation will not make people happy, he was only
able to minimize dissatisfaction. In contrast to intrinsic motivation, a factor that
makes people happy. It means the fulfillment of these needs will increasingly add
to the satisfaction in life. A player may carry out work that is given to him well
and there's not. Target management can be achieved if the player had a good
performance, the performance of players comprising efficiency, responsibility,
discipline, and initiative. But if not then management needs to know the cause.
Usually performance degradation may occur due to the decline in the motivation
of the players, the management should be able to give you the motivation to
players while reducing player discontent.
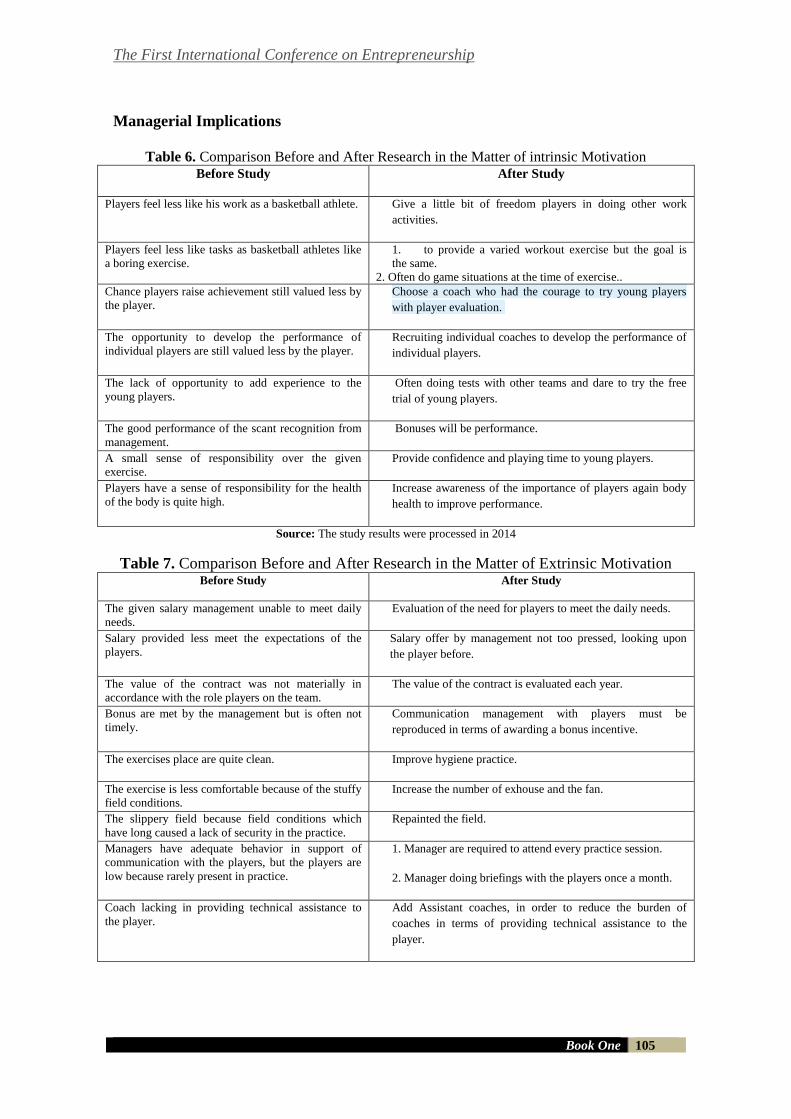
The First International Conference on Entrepreneurship
Book One 105
Managerial Implications
Table 6. Comparison Before and After Research in the Matter of intrinsic Motivation
Before Study
After Study
Players feel less like his work as a basketball athlete. Give a little bit of freedom players in doing other work
activities.
Players feel less like tasks as basketball athletes like
a boring exercise.
1. to provide a varied workout exercise but the goal is
the same.
2. Often do game situations at the time of exercise..
Chance players raise achievement still valued less by
the player.
Choose a coach who had the courage to try young players
with player evaluation.
The opportunity to develop the performance of
individual players are still valued less by the player.
Recruiting individual coaches to develop the performance of
individual players.
The lack of opportunity to add experience to the
young players.
Often doing tests with other teams and dare to try the free
trial of young players.
The good performance of the scant recognition from
management.
Bonuses will be performance.
A small sense of responsibility over the given
exercise.
Provide confidence and playing time to young players.
Players have a sense of responsibility for the health
of the body is quite high.
Increase awareness of the importance of players again body
health to improve performance.
Source: The study results were processed in 2014
Table 7. Comparison Before and After Research in the Matter of Extrinsic Motivation Before Study
After Study
The given salary management unable to meet daily
needs.
Evaluation of the need for players to meet the daily needs.
Salary provided less meet the expectations of the
players.
Salary offer by management not too pressed, looking upon
the player before.
The value of the contract was not materially in
accordance with the role players on the team.
The value of the contract is evaluated each year.
Bonus are met by the management but is often not
timely.
Communication management with players must be
reproduced in terms of awarding a bonus incentive.
The exercises place are quite clean. Improve hygiene practice.
The exercise is less comfortable because of the stuffy
field conditions.
Increase the number of exhouse and the fan.
The slippery field because field conditions which
have long caused a lack of security in the practice.
Repainted the field.
Managers have adequate behavior in support of
communication with the players, but the players are
low because rarely present in practice.
1. Manager are required to attend every practice session.
2. Manager doing briefings with the players once a month.
Coach lacking in providing technical assistance to
the player.
Add Assistant coaches, in order to reduce the burden of
coaches in terms of providing technical assistance to the
player.
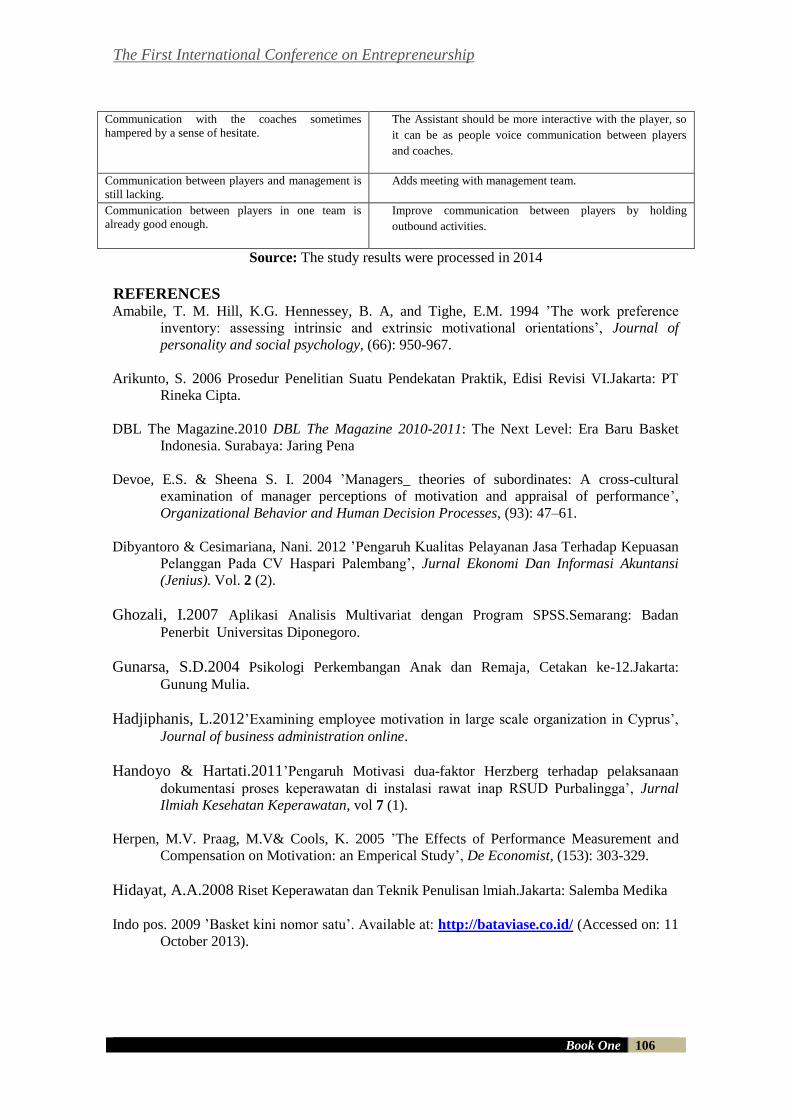
The First International Conference on Entrepreneurship
Book One 106
Communication with the coaches sometimes
hampered by a sense of hesitate.
The Assistant should be more interactive with the player, so
it can be as people voice communication between players
and coaches.
Communication between players and management is
still lacking.
Adds meeting with management team.
Communication between players in one team is
already good enough.
Improve communication between players by holding
outbound activities.
Source: The study results were processed in 2014
REFERENCES Amabile, T. M. Hill, K.G. Hennessey, B. A, and Tighe, E.M. 1994 ’The work preference
inventory: assessing intrinsic and extrinsic motivational orientations’, Journal of
personality and social psychology, (66): 950-967.
Arikunto, S. 2006 Prosedur Penelitian Suatu Pendekatan Praktik, Edisi Revisi VI.Jakarta: PT
Rineka Cipta.
DBL The Magazine.2010 DBL The Magazine 2010-2011: The Next Level: Era Baru Basket
Indonesia. Surabaya: Jaring Pena
Devoe, E.S. & Sheena S. I. 2004 ’Managers_ theories of subordinates: A cross-cultural
examination of manager perceptions of motivation and appraisal of performance’,
Organizational Behavior and Human Decision Processes, (93): 47–61.
Dibyantoro & Cesimariana, Nani. 2012 ’Pengaruh Kualitas Pelayanan Jasa Terhadap Kepuasan
Pelanggan Pada CV Haspari Palembang’, Jurnal Ekonomi Dan Informasi Akuntansi
(Jenius). Vol. 2 (2).
Ghozali, I.2007 Aplikasi Analisis Multivariat dengan Program SPSS.Semarang: Badan
Penerbit Universitas Diponegoro.
Gunarsa, S.D.2004 Psikologi Perkembangan Anak dan Remaja, Cetakan ke-12.Jakarta:
Gunung Mulia.
Hadjiphanis, L.2012’Examining employee motivation in large scale organization in Cyprus’,
Journal of business administration online.
Handoyo & Hartati.2011’Pengaruh Motivasi dua-faktor Herzberg terhadap pelaksanaan
dokumentasi proses keperawatan di instalasi rawat inap RSUD Purbalingga’, Jurnal
Ilmiah Kesehatan Keperawatan, vol 7 (1).
Herpen, M.V. Praag, M.V& Cools, K. 2005 ’The Effects of Performance Measurement and
Compensation on Motivation: an Emperical Study’, De Economist, (153): 303-329.
Hidayat, A.A.2008 Riset Keperawatan dan Teknik Penulisan lmiah.Jakarta: Salemba Medika
Indo pos. 2009 ’Basket kini nomor satu’. Available at: http://bataviase.co.id/ (Accessed on: 11
October 2013).

The First International Conference on Entrepreneurship
Book One 107
Leete , L.2000’Wage Equity and Employee Motivation in Nonprofit and For Profit
Organizations’, Journal of Economic Behavior and Organization, vol 43 (4): 423 – 446.
Luthans, F.2011 Organizational Behavior, 12th ed.New York: McGraw-Hill Education.
Mahar, I.2013’Pesepak bola sama dengan buruh’. Available at:
http://olahraga.kompasiana.com/ (Accessed on: 15 December 2013).
Prawirosentono, S. 2008 Manajemen Sumberdaya Manusia Kebijakan Kinerja
Karyawan.Yogyakarta: BPFE.
Quigley and Tymon Jr. 2006 ’Toward An Integrated Model Of Intrinsic Motivation And Career
Self-Management’.
Riani, A.L.2011 Budaya Organisasi, edisi pertama.Yogyakarta: Graha Ilmu
Riniwati, H.2011 Mendongkrak Motivasi dan Kinerja: Pendekatan Pemberdayaan
SDM.Malang: UB Press.
Robbins, S.P. 2006 Perilaku Organisasi, Edisi 10.Jakarta: Indeks Kelompok Gramedia.
Robbins, S.P. 2012 Management, 11th ed.England: Pearson Education Limited.
Robbins, S.P & Judge, T.A. 2007 Organizational Behavior, 12th ed.New Jersey: Pearson
Education, Inc.
Sekaran.2007 Research Methods For Business.Jakarta: Salemba Empat.
Schermerhorn, J.R.2008 Management, 9th ed.United States: John Wiley & Sons Inc.
Suara Merdeka.2012’Motivasi tim pengaruhi semangat bertanding Persiku’. Available at:
http://persiku-news.blogspot.com/ (Accessed on: 15 December 2013).
Sugiyono.2012 Metode Penelitian Kuantitatif Kualitatif dan R&D.Bandung: Alfabeta.
Thoyib, A.2005’Hubungan kepemimpinan, budaya, strategi, dan kinerja: Pendekatan konsep’,
Jurnal manajemen & Kewirausahaan, vol 7 (1): 60-73.
Tika H.M.2006 Budaya Organisasi dan Peningkatan Kinerja Perusahaan, Cetakan
Pertama.Jakarta: PT. Bhumi Aksara.
Wahjono, S.I.2010 Perilaku Organisasi, Edisi pertama.Yogyakarta: Graha Ilmu
Winardi, J.2007 Motivasi dan Pemotivasian.Jakarta: Penerbit Raja Grafindo Persada.
The First International Conference on Entrepreneurship
Book One 108
THE INTERNALIZATION OF ENTREPRENEURIAL LEARNING
IN AN EFFORT TO DEVELOP ENTREPRENEURIAL SPIRIT ON
VOCATIONAL HIGH SCHOOL STUDENTS
Kirwani Susanti1, Made Dudy Satyawan2, Renny Dwijayanti3
State University of Surabaya
INDONESIA
E-mail: [email protected]
ABSTRACT
The pedagogical challenge of entrepreneurial education lies on more holistic
entrepreneurial competence that covers three areas; cognitive, affective and
psychomotor areas, so the provision of material will be more effective when it
is accompanied with the sharpening of sense and eventually will develop
certain entrepreneurial behavior. The relatively high intention of becoming
entrepreneur is not always accompanied with entrepreneurial behaviors in the
forms of founding, managing and developing business. In this area there are
other factors that explain the reason why they only intend to do but not dare to
‘start’ or ‘realize’ Its relation to the direction of entrepreneurial education lies
on the demand that teacher as facilitator should have capability in
internalizing the spirit of entrepreneurship on students. Teacher plays
significant and decisive role in entrepreneurial learning. Teacher creativity
becomes the best model for students though methodologically it’s relatively
difficult to prove. Inviting students to practice entrepreneurial values turns out
to be actual way for teacher in implementing entrepreneurial values in their
daily life. Module based entrepreneurial learning provides specific facilitation
to students because module is managed in accordance with both student need
and characteristic. The comprehension is led to be more applicative with
objective to encourage the entrepreneurial interest on vocational high school
students.
Keywords: Entrepreneurial Learning, Entrepreneurial Spirit
INTRODUCTION
The recent increasing quantity of research on entrepreneurship indicates the growing
attention from various parties on the role of entrepreneurship in the national economy.
While developing countries such as Indonesia recognize the role of entrepreneurship as
providing significant contribution, developed countries in Europe recognize the role of
entrepreneurship in producing reliable entrepreneurs and impelling the national
economy growth. Such fact affirms McClelland statement (Wijaya, 2008) stating that
any country is moving to developed country when the amount of entrepreneur shows at
least 2% out of the total national population.
The First International Conference on Entrepreneurship
Book One 109
It is hard to deny that unemployment issue is one of critical issues for any country as
also found in Indonesia. Almost half of unemployment in Indonesia represents the
increasing amount of college graduates. The ironical phenomenon emerging from the
Indonesia education shows that the higher the education level of individual is, the
higher probability or chance of becoming unemployed will be. According to Statistic
Centre Office (BPS), in relation to education level, the amount of unemployed
workforce in Surabaya until the end of 2010 reaches 200 thousand people. It is
predicted that this figure is increasing unless new jobs are provided immediately.
The increasing number of unemployment deteriorates national condition and it will get
worse unless the situation is handled at once. Such problem along with the necessity to
increase refined fuel oil will urge vocational school students to graduate soon and get
personal income with the use of acquired knowledge and skill through entrepreneurship.
Entrepreneurship is rational choice due to its independent nature so entrepreneur will
not rely on the job availability.
Many parties in educational institutions seem to commence the effort to impel this
movement. The curriculum that includes entrepreneurial learning or entrepreneurial
subject is commonly found. However, the result is not evident. Based on the
preliminary study conducted by the author and the results of interview with subject
teacher on entrepreneurship in various Business and Management Vocational High
Schools in Surabaya, it is argued that the student enthusiasm on entrepreneurship during
the course of entrepreneurial field practice was very low. The result was known during
the final evaluation of entrepreneurship subject and in fact most students were reluctant
to start their own business because during the course of entrepreneurial field practice
they found many challenges and obstacles and they felt the anxiety of failure and risk
when they start new business. Such evidence reveals that the entrepreneurial spirit in the
form of courage to deal with the risk and audacity to meet failure are not formed yet.
Question often raised by many experts is “What makes some individuals have better
entrepreneurial spirit than others?”. Licht (Sarwoko, 2011).
Surabaya as one of big cities in Indonesia should provide its own opportunity for
Vocational High School graduates. Students have already had mindset that becoming
employee is more promising than becoming employer. Moreover Surabaya as a big city
becomes the target city that is under assault of new potential workers from other regions.
Considering the fact that job availability doesn’t match with the amount of new
potential workers, various opportunities must be developed with the use of skills
acquired by Vocational High School graduates. Potential businesses for Vocational
High School students vary according to the department they choose such as catering,
fashion, marketing, mechanic, multimedia and many other departments. Types of
business Vocational High School students could choose include selling food in food
stall, opening garage, and opening tailoring business.
The pedagogical challenge of entrepreneurial education lies on the more holistic
entrepreneurial competence that covers three areas; cognitive, affective, and
psychomotor areas so the provision of material will be more effective when it is
accompanied with the sharpening of sense and eventually will develop certain
entrepreneurial behavior (Tatiila, 2010). The relatively high intention of becoming
entrepreneur is not always accompanied with entrepreneurial behaviors in the forms of
founding, managing and developing business. In this area there are other factors that
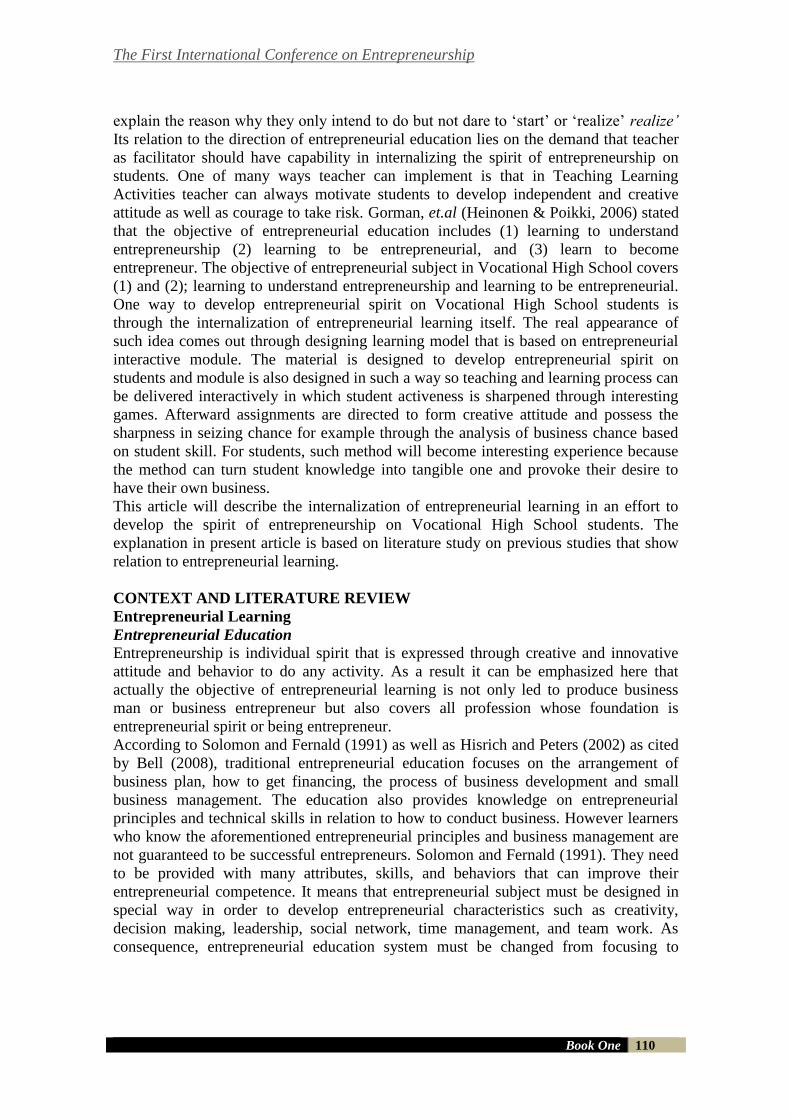
The First International Conference on Entrepreneurship
Book One 110
explain the reason why they only intend to do but not dare to ‘start’ or ‘realize’ realize’
Its relation to the direction of entrepreneurial education lies on the demand that teacher
as facilitator should have capability in internalizing the spirit of entrepreneurship on
students. One of many ways teacher can implement is that in Teaching Learning
Activities teacher can always motivate students to develop independent and creative
attitude as well as courage to take risk. Gorman, et.al (Heinonen & Poikki, 2006) stated
that the objective of entrepreneurial education includes (1) learning to understand
entrepreneurship (2) learning to be entrepreneurial, and (3) learn to become
entrepreneur. The objective of entrepreneurial subject in Vocational High School covers
(1) and (2); learning to understand entrepreneurship and learning to be entrepreneurial.
One way to develop entrepreneurial spirit on Vocational High School students is
through the internalization of entrepreneurial learning itself. The real appearance of
such idea comes out through designing learning model that is based on entrepreneurial
interactive module. The material is designed to develop entrepreneurial spirit on
students and module is also designed in such a way so teaching and learning process can
be delivered interactively in which student activeness is sharpened through interesting
games. Afterward assignments are directed to form creative attitude and possess the
sharpness in seizing chance for example through the analysis of business chance based
on student skill. For students, such method will become interesting experience because
the method can turn student knowledge into tangible one and provoke their desire to
have their own business.
This article will describe the internalization of entrepreneurial learning in an effort to
develop the spirit of entrepreneurship on Vocational High School students. The
explanation in present article is based on literature study on previous studies that show
relation to entrepreneurial learning.
CONTEXT AND LITERATURE REVIEW
Entrepreneurial Learning
Entrepreneurial Education
Entrepreneurship is individual spirit that is expressed through creative and innovative
attitude and behavior to do any activity. As a result it can be emphasized here that
actually the objective of entrepreneurial learning is not only led to produce business
man or business entrepreneur but also covers all profession whose foundation is
entrepreneurial spirit or being entrepreneur.
According to Solomon and Fernald (1991) as well as Hisrich and Peters (2002) as cited
by Bell (2008), traditional entrepreneurial education focuses on the arrangement of
business plan, how to get financing, the process of business development and small
business management. The education also provides knowledge on entrepreneurial
principles and technical skills in relation to how to conduct business. However learners
who know the aforementioned entrepreneurial principles and business management are
not guaranteed to be successful entrepreneurs. Solomon and Fernald (1991). They need
to be provided with many attributes, skills, and behaviors that can improve their
entrepreneurial competence. It means that entrepreneurial subject must be designed in
special way in order to develop entrepreneurial characteristics such as creativity,
decision making, leadership, social network, time management, and team work. As
consequence, entrepreneurial education system must be changed from focusing to
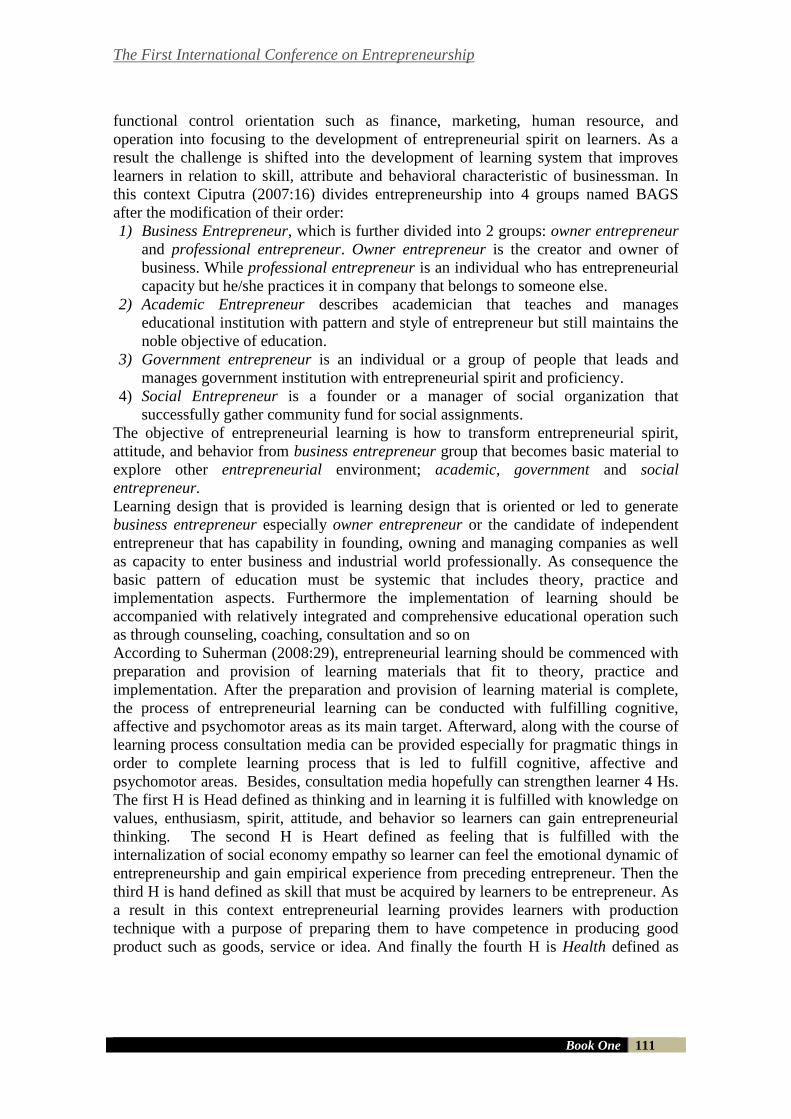
The First International Conference on Entrepreneurship
Book One 111
functional control orientation such as finance, marketing, human resource, and
operation into focusing to the development of entrepreneurial spirit on learners. As a
result the challenge is shifted into the development of learning system that improves
learners in relation to skill, attribute and behavioral characteristic of businessman. In
this context Ciputra (2007:16) divides entrepreneurship into 4 groups named BAGS
after the modification of their order:
1) Business Entrepreneur, which is further divided into 2 groups: owner entrepreneur
and professional entrepreneur. Owner entrepreneur is the creator and owner of
business. While professional entrepreneur is an individual who has entrepreneurial
capacity but he/she practices it in company that belongs to someone else.
2) Academic Entrepreneur describes academician that teaches and manages
educational institution with pattern and style of entrepreneur but still maintains the
noble objective of education.
3) Government entrepreneur is an individual or a group of people that leads and
manages government institution with entrepreneurial spirit and proficiency.
4) Social Entrepreneur is a founder or a manager of social organization that
successfully gather community fund for social assignments.
The objective of entrepreneurial learning is how to transform entrepreneurial spirit,
attitude, and behavior from business entrepreneur group that becomes basic material to
explore other entrepreneurial environment; academic, government and social
entrepreneur.
Learning design that is provided is learning design that is oriented or led to generate
business entrepreneur especially owner entrepreneur or the candidate of independent
entrepreneur that has capability in founding, owning and managing companies as well
as capacity to enter business and industrial world professionally. As consequence the
basic pattern of education must be systemic that includes theory, practice and
implementation aspects. Furthermore the implementation of learning should be
accompanied with relatively integrated and comprehensive educational operation such
as through counseling, coaching, consultation and so on
According to Suherman (2008:29), entrepreneurial learning should be commenced with
preparation and provision of learning materials that fit to theory, practice and
implementation. After the preparation and provision of learning material is complete,
the process of entrepreneurial learning can be conducted with fulfilling cognitive,
affective and psychomotor areas as its main target. Afterward, along with the course of
learning process consultation media can be provided especially for pragmatic things in
order to complete learning process that is led to fulfill cognitive, affective and
psychomotor areas. Besides, consultation media hopefully can strengthen learner 4 Hs.
The first H is Head defined as thinking and in learning it is fulfilled with knowledge on
values, enthusiasm, spirit, attitude, and behavior so learners can gain entrepreneurial
thinking. The second H is Heart defined as feeling that is fulfilled with the
internalization of social economy empathy so learner can feel the emotional dynamic of
entrepreneurship and gain empirical experience from preceding entrepreneur. Then the
third H is hand defined as skill that must be acquired by learners to be entrepreneur. As
a result in this context entrepreneurial learning provides learners with production
technique with a purpose of preparing them to have competence in producing good
product such as goods, service or idea. And finally the fourth H is Health defined as
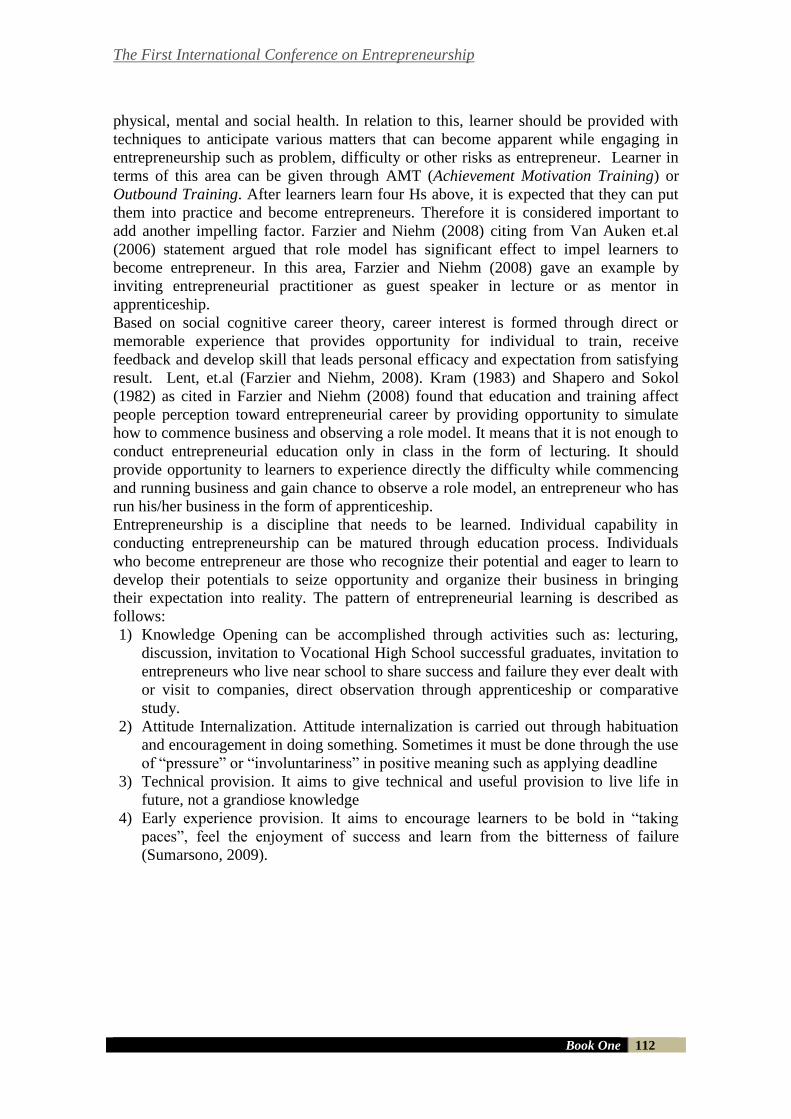
The First International Conference on Entrepreneurship
Book One 112
physical, mental and social health. In relation to this, learner should be provided with
techniques to anticipate various matters that can become apparent while engaging in
entrepreneurship such as problem, difficulty or other risks as entrepreneur. Learner in
terms of this area can be given through AMT (Achievement Motivation Training) or
Outbound Training. After learners learn four Hs above, it is expected that they can put
them into practice and become entrepreneurs. Therefore it is considered important to
add another impelling factor. Farzier and Niehm (2008) citing from Van Auken et.al
(2006) statement argued that role model has significant effect to impel learners to
become entrepreneur. In this area, Farzier and Niehm (2008) gave an example by
inviting entrepreneurial practitioner as guest speaker in lecture or as mentor in
apprenticeship.
Based on social cognitive career theory, career interest is formed through direct or
memorable experience that provides opportunity for individual to train, receive
feedback and develop skill that leads personal efficacy and expectation from satisfying
result. Lent, et.al (Farzier and Niehm, 2008). Kram (1983) and Shapero and Sokol
(1982) as cited in Farzier and Niehm (2008) found that education and training affect
people perception toward entrepreneurial career by providing opportunity to simulate
how to commence business and observing a role model. It means that it is not enough to
conduct entrepreneurial education only in class in the form of lecturing. It should
provide opportunity to learners to experience directly the difficulty while commencing
and running business and gain chance to observe a role model, an entrepreneur who has
run his/her business in the form of apprenticeship.
Entrepreneurship is a discipline that needs to be learned. Individual capability in
conducting entrepreneurship can be matured through education process. Individuals
who become entrepreneur are those who recognize their potential and eager to learn to
develop their potentials to seize opportunity and organize their business in bringing
their expectation into reality. The pattern of entrepreneurial learning is described as
follows:
1) Knowledge Opening can be accomplished through activities such as: lecturing,
discussion, invitation to Vocational High School successful graduates, invitation to
entrepreneurs who live near school to share success and failure they ever dealt with
or visit to companies, direct observation through apprenticeship or comparative
study.
2) Attitude Internalization. Attitude internalization is carried out through habituation
and encouragement in doing something. Sometimes it must be done through the use
of “pressure” or “involuntariness” in positive meaning such as applying deadline
3) Technical provision. It aims to give technical and useful provision to live life in
future, not a grandiose knowledge
4) Early experience provision. It aims to encourage learners to be bold in “taking
paces”, feel the enjoyment of success and learn from the bitterness of failure
(Sumarsono, 2009).
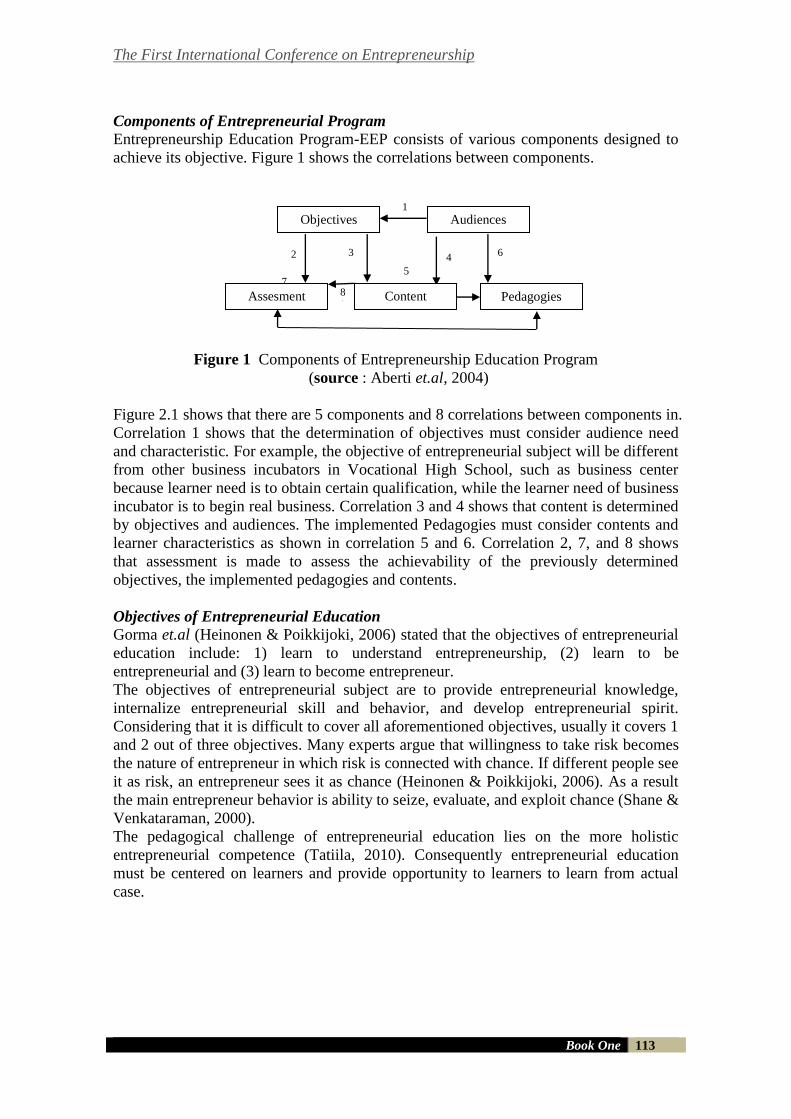
The First International Conference on Entrepreneurship
Book One 113
Components of Entrepreneurial Program
Entrepreneurship Education Program-EEP consists of various components designed to
achieve its objective. Figure 1 shows the correlations between components.
Figure 1 Components of Entrepreneurship Education Program
(source : Aberti et.al, 2004)
Figure 2.1 shows that there are 5 components and 8 correlations between components in.
Correlation 1 shows that the determination of objectives must consider audience need
and characteristic. For example, the objective of entrepreneurial subject will be different
from other business incubators in Vocational High School, such as business center
because learner need is to obtain certain qualification, while the learner need of business
incubator is to begin real business. Correlation 3 and 4 shows that content is determined
by objectives and audiences. The implemented Pedagogies must consider contents and
learner characteristics as shown in correlation 5 and 6. Correlation 2, 7, and 8 shows
that assessment is made to assess the achievability of the previously determined
objectives, the implemented pedagogies and contents.
Objectives of Entrepreneurial Education
Gorma et.al (Heinonen & Poikkijoki, 2006) stated that the objectives of entrepreneurial
education include: 1) learn to understand entrepreneurship, (2) learn to be
entrepreneurial and (3) learn to become entrepreneur.
The objectives of entrepreneurial subject are to provide entrepreneurial knowledge,
internalize entrepreneurial skill and behavior, and develop entrepreneurial spirit.
Considering that it is difficult to cover all aforementioned objectives, usually it covers 1
and 2 out of three objectives. Many experts argue that willingness to take risk becomes
the nature of entrepreneur in which risk is connected with chance. If different people see
it as risk, an entrepreneur sees it as chance (Heinonen & Poikkijoki, 2006). As a result
the main entrepreneur behavior is ability to seize, evaluate, and exploit chance (Shane &
Venkataraman, 2000).
The pedagogical challenge of entrepreneurial education lies on the more holistic
entrepreneurial competence (Tatiila, 2010). Consequently entrepreneurial education
must be centered on learners and provide opportunity to learners to learn from actual
case.
3
5
6
7
2
Objectives Audiences
Assesment Content Pedagogies
1
4
8 1
The First International Conference on Entrepreneurship
Book One 114
Module Based Learning
Module is printed teaching material designed to be learned independently by learners.
Module is also called media for self learning because module is completed with hints
for self learning. It means that readers can do learning activities without the direct
presence of teacher. Language, pattern, and other completing features found in module
is arranged in such way that it provides the impression of “instructor language” or
language of teacher who is teaching. Consequently, this media is often called as self
instructional material.
Modules functions as learning tool or media that contains material, method, limitations,
and evaluating way designed systematically and interestingly to achieve the expected
competence in accordance with its complexity level. Module can be considered a good
and interesting one is it has the following characteristics (Diknas, 2008):
1) Self Instructional; means that through the module someone or a learner is able to
learn independently, not dependent on other parties.
2) Self Contained; means that a module completely contains all learning materials of
a learned competency or sub competency unit.
3) Stand Alone; means that the developed module doesn’t rely on other media or is
necessarily used together with other learning media.
4) Adaptive; means that module should have high adaptive capacity toward the
development of knowledge and technology. It is regarded adaptive if module can
adapt to the development of knowledge and technology as well as being able to be
used in flexible.
5) User Friendly; means that module should be friendly to its users. Each instruction
and information description must he useful and friendly to its users, including the
easiness for its users in responding and accessing something in accordance with
their desire.
DISCUSSION
According to Government Regulation Number 19 2005, article 26 paragraph 3 stating
the graduate competence standard for vocational secondary education unit (SMK) aims
to improve intelligence, knowledge, personality, noble character, and skill for
independent living and continue to the next education level according to vocational
department. In the regulation of National Education Minister Number 23 2007 on
Graduate Competence Standard for Vocational Secondary Educational Unit
(SMK/MAK) states that acquiring the competence of expertise and entrepreneurship
program aims both to meet the employment demand and continue to high education
level according to the vocational department.
From the regulation described above it can be concluded that SMK (Vocational High
School) aims to prepare its graduate to enter employment and continue to higher
education level. In the context of preparation to employment, learners are prepared to be
intermediate level workers to meet the employment need or entrepreneur who starts
business and create occupational vacancy.
According to Regulation of National Education Minister Number 22 2007 on Content
Standard, the curriculum structure of SMK includes entrepreneurial subject with 192
hour time allocation. Graduate competence standard for entrepreneurial includes:
The First International Conference on Entrepreneurship
Book One 115
1) Able to identify business activities and chances in daily life, especially in local
community.
2) Implement entrepreneurial attitude and behavior in daily life in local community
3) Comprehend the principles of leadership and able to implement professional
achiever behavior in daily life
4) Able to design and manage small/micro business in his/her field
Vocational High School education is carried out in the form of industrial occupational
practice. Educational process starts from planning, implementation, and evaluation, the
process that is not only carried out by educational unit (SMK) but also involves
business and industry stakeholders. Learning load in Vocational High School
(SMK/MAK) consists of face-to-face learning activities, in school practices, and on site
practices in real location of business/industry equal in 36 lesson hours per week.
In the implementation of vocational high school education, there is division called as
Production Unit. The implementation of Production Unit functions as media for
productive learning in school that aims to assist the improvement of learning activities
in form of actual production for students so they can engage themselves in production
that is maintained to fit to employment standard, develop students entrepreneurial spirit
and aid the financial source for school.
The objective of Production Unit implementation follows the targets as stated in The
Ministerial Decree of National Education and Culture Number 0490/U/1992, Article 29,
paragraph (2) that reads as follows:
1) Provide opportunity to students and teachers to conduct practical activities oriented
to market.
2) Encourage students and teachers to develop economical and entrepreneurial insight.
3) Obtain additional fund to implement education
4) Improve the efficiency of educational resource in school.
5) Improve student and teacher creativity.
Internalization of Entrepreneurial Learning
Entrepreneurial Learning in Vocational High School (SMK) must be implemented
systematic and integrative fashion. Integration or any effort of integrating is a conscious
and structured attempt by teachers in order to integrate objectives between
entrepreneurial values into specific education and training program (inter discipline) in
learning process to accomplish the internalization and personalization of entrepreneurial
values intended to be known, understood, comprehended and implemented consistently.
The integration of entrepreneurial values should consider local potential in accordance
with location/place where students live. The other consideration must be given to the
heterogeneity of student background such as family life, school, community, and
developmental age level so as a result students will posses entrepreneurial spirit and
high consciousness to actualize their potential in intellectual way in society life.
The integration of entrepreneurial education and training subject must emphasize the
formation of entrepreneurial spirit found in teaching material under discussion so
teachers don’t need to find special material in order to shape entrepreneurial spirit in
education and training subject that is being taught.
In entrepreneurial learning, teachers play significant and decisive role. It is difficult to
describe methodologically but teacher creativity will become the best role model for
The First International Conference on Entrepreneurship
Book One 116
students. Inviting students to practice entrepreneurial values is one of actual examples
for teacher in implementing entrepreneurial values in his/her daily life.
The learning of entrepreneurial values integrated into education and training subject
uses various approaches and methods. Learning source is teaching material that comes
from various sources in specific education and training subject that meet educative
criteria, emphasize student competence both in individual or classroom area, and still
refer to student learning completion.
Module based entrepreneurial learning provides exceptional comfort for students in
which module is prepared according to student need and characteristic. Comprehension
is led to be more applicative with intention to encourage entrepreneurial career interest
on vocational high school students.
The core activities whose implementation aims to attract student attention and interest
must regard the following issues:
1) Entrepreneurial values that is successfully integrated into education and training
subject including those that are already understood and experienced by students in
their daily life, both directly or indirectly (contextual learning).
2) Provision of freedom and guidance to students in understanding (conceptualizing)
materials of entrepreneurial values under discussion (concept achievement and
constructivism learning).
3) Attempt to create activities that enable students to cooperate and collaborate in
understanding moral values under discussion (cooperative learning)
4) Opportunity provided to students to try and implement learnt materials.
5) Use of various learning media to facilitate students in sharpening and understanding
the learnt entrepreneurial values.
6) Preservation of student discipline and responsibility during learning process as well
as the prevention of activities that could generate boredom, deterioration of learning
motivation and finally interruption in student activity and creativity.
7) Learning directed to habituate students in conducting careful observation on
surrounding reality (local, regional, national and global)
8) Teacher who always functions as role model in thinking, attitude exposure, and
action in implementing proper entrepreneurial values.
CONCLUSION
Entrepreneur attitude and behavior gain more significance in society. Entrepreneur
attitude and behavior will grow and develop when characteristic from entrepreneur
personality has been internalized firmly within personality of individual student.
Consequently successful internalization of entrepreneur characteristic will give birth to
entrepreneur attitude and behavior and finally produce entrepreneur generation in
significant number. It must be preserved as attention focus because Indonesia still needs
more entrepreneurs in improving public welfare.
In an effort to produce tough entrepreneurs, educational institution (school) becomes
one of institutions that play significant role because school is expected to have capacity
in transforming entrepreneur characteristic to its students, especially Vocational High
School that aims to produce graduates who are prepared to enter employment, either
working in independent way or as employee. In the context of independent working, the
graduates must be able to become entrepreneur .
The First International Conference on Entrepreneurship
Book One 117
Education in this case Vocational High School plays significant role in producing
entrepreneur generation. Therefore Vocational High School must be prepared, managed
and controlled to achieve its objective, producing graduate with entrepreneurial mental.
To generate graduate with entrepreneurial mental, it is considered important to
familiarize students with entrepreneurial implementation. The familiarization of
entrepreneurial implementation in school can be carried out through teaching and
learning activities, implementation of entrepreneurial characteristic values in school and
entrepreneurial practices. Teaching and learning activities can be carried out through:
first, the implementation of entrepreneurial subject designed to open entrepreneurial
insight, the internalization of entrepreneurial attitude, the provision of preliminary
knowledge in conducting business; second, the integration of entrepreneurial
characteristic values into all subjects. Activities for entrepreneurial practice can be
implemented through: the student engagement in Production Unit activities and the
implementation of entrepreneurial extracurricular activities. By engaging students in
production unit, it is expected that such activities function as concept introduction,
attitude instilment, technical understanding development, and the provision of
entrepreneurial preliminary experience. Meanwhile by implementing extracurricular
activities, it is expected that such activities serve as attitude instilment and the provision
of both technical knowledge and entrepreneurial experience.
REFERENCES
Alberti e al., 2004. Entrepreneurship Education : Notes on a Ongoing Debate. Disajikan pada
14th Annual IntEnt Conference, Italy, 4-7 July 2004
Badan Pusat Statistik. 2011. Surabaya Dalam Angka 2011. Surabaya : Badan Pusat Statistik
Kota Surabaya.
Ciputra. 2008. Quantum Leap: Bagaimana Entrepreneurship Dapat Mengubah Masa Depan
Anda dan Masa Depan Bangsa. Jakarta : Elex Media Komputindo.
Frazier, B. & Niehm, L.S., 2008, “FCS Students’ Attitudes and Intentions Toward
Entrepreneurial Careers”, Journal of Family and Consumer Sciences, Vol. 100, No. 2,
April 2008, Academic Research library, pg 17.
Hisrich, et al., 2008. Kewirausahaan, Edisi 7, Jakarta : Penerbit Salemba Empat.
Heinonen, J. & Poikkijoki S. A. 2006. An Entrepreneurial Directed Approach to Entrepreneurial
Education: Mission Impossible ? Journal of Management Development, 25 (1).
Peraturan Pemerintah Nomor 19 tahun 2005 tentang Standar Nasional Pendidikan. Lembaran
Negara Republik Indonesia. Departemen Pendidikan Nasional
Peraturan Menteri Pendidikan Nasional Nomor 22 tahun 2007 tentang Standar Isi. Departemen
Pendidikan Nasional
Peraturan Menteri Pendidikan Nasional Nomor 23 tahun 2007 tentang Standar Kompetensi
Lulusan. Departemen Pendidikan Nasional
The First International Conference on Entrepreneurship
Book One 118
Shane, S & Venkataraman, S. 2000. The Promise of Entrepreneurship as a Feld of Research.
Academy of Management Review, 25 (1), 217-226
Sarwoko, Endi. 2011. Kajian Empiris Entreprenuer Intention Mahasiswa. Jurnal Ekonomi
Bisnis. 16(2): 126-134.
Undang-Undang Nomor 20 Tahun 2003 tentang Sistem Pendidikan Nasional. 2009. Tim
Nasional Implementasi KTSP. Departemen Pendidikan Nasional
Taatila. 2010. Learning Entrepreneurship in Higher Education. Education and Training.
(Online), 52 (1) : 48-61.
Wijaya, Toni. 2008. Kajian Model Empiris Perilaku Berwirausaha UKM DIY dan Jawa Tengah.
Jurnal Manajemen Dan Kewirausahaan, (Online), 10 (2) : 93-104.
The First International Conference on Entrepreneurship
Book One 119
EFFECT OF SOURCES OF COMPETITIVE ADVANTAGE OF
MARKETING ON THE PERFORMANCE OF FISH PROCESSING
INDUSTRY IN TAMBAK WEDI, SURABAYA
Bachtiar Jusuf Helmy1
Management, STIE Artha Bodhi Iswara Surabaya
INDONESIA
E-mail: [email protected]
ABSTRACT
To improve the competitiveness of companies, one way that can be achieved is
by developing the capability or competence of the company (Tambunan, 2001).
This research attempts to see the impact of competence in marketing of
competitive advantage, especially seen from a comparison of the relative
market share and market share growth. It is expected that the results of this
study can be used as an alternative solution to the company in exploring the
sources of competitive advantage, especially in the field of marketing to be able
to improve the performance of small scale industries.
The population in this study is the overall industry owners and employees Small
Pond Village Fish Processing in Wedi. In this study, samples were taken from
the Small Fish Processing Industry in the Village Pond Wedi, with a total of 100
people. Hypothesis testing used in this study was multivariate analysis with
Structural Equation Modeling (SEM). Assessment of influence on each - each
independent variable on the dependent variable using path coefficient.
Based on the research that has been done to analyze the influence of the
sources of competitive advantage in marketing to the company's performance,
showed that these variables have positive and significant influence
Keywords: Sources Of Competitive Advantage And Performance Of
Small Industry
INTRODUCTION
Development and environmental changes so quickly and dramatically, including
changes in consumer tastes, technological advances and socio-economic changes, has
resulted in the emergence of business competition in various industries that are so tight.
Developments and changes occurring across geographic. The popular development is
The First International Conference on Entrepreneurship
Book One 120
known as globalization. Such a condition requires the company to be able to explore
and develop sources of competitive advantage in order to survive. Source of competitive
advantage can be found from the ability of management competency in tapping the
corporate functional areas: competence in marketing, development and product design
and production.
Field of functional competence represents a real knowledge and skills that are
specifically reflected in the expertise, capabilities and performance of marketing,
innovation, technology use and production. Competence held by the company should
not be easily imitated by competitors and sustain the achievement of sustainable
competitive advantage. Competitive advantage is not a new idea, but penekanaannya in
the field of new marketing is a trend in the decade of the 1980s (Tjiptono, 1997). While
the traditional view of marketing place as one of the members of the body corporate.
Marketing is generally regarded as a task to create, introduce and deliver goods and
services to consumers and companies. Competitive advantage should be viewed as a
dynamic process rather than as the final result.
Competency directing patterns of diversification and how the company entered the
market (market entry). Special competence is the competitive advantage of companies
owned or done that gave him the strength to deal with competitors (Tjiptono, 1997).
Marketing competency is the ability and performance level of marketing that supports
the achievement of corporate strategic objectives. The amount of marketing competence
is calculated by knowing the total value of the performance factors of competitive
advantage is multiplied by the relative importance of these factors and the percentage of
responsibility in marketing. (Purnama, 2003: 111)
Corporate performance is the level of achievement as measured company in the form of
employment outcomes or performance outcomes (Rue & Byard, 1997). Based on
research results Szimansky, et al. (1993) indicators of performance measurement and
competitive advantage of the most frequently used is the market share and profitability.
Market share is a measurement of marketing performance or operational performance
that can distinguish between winners and losers. Volume sales of the company did not
disclose how well the company's performance compared to its competitors. If the
company increased market share means the company can outperform its competitors, if
the models share the company declined, saying the company could lose to competitors.
The definition of market share here is the relative market share, the company's total
sales expressed as a percentage of sales to major competitors. Measurements with the
overall market share is widely used because it only requires information on total sales
(Kotler, 1997)
Surabaya as a maritime city has a natural resource that is very supportive. Territory
coupled with the Java Sea and the Strait of Madura makes Surabaya has a strategic
position in the field of maritime. To enhance the role kemaritimannya, Surabaya should
facilitate traffic to and from the Port of Tanjung Perak. Therefore, continued to pursue
The First International Conference on Entrepreneurship
Book One 121
Surabaya building of railroads and highways that are biased closer to Tanjung Perak
with the hinterland. Support land transport system is really a big role in the development
of Surabaya as a maritime city.
Fisheries sector as one of supporting the economic sector has a role in national
economic development, which provide added value and strategic value, and may
provide financial or economic benefits, particularly in the provision of protein food,
foreign exchange earnings and providing employment. So far, the development of
fisheries conducted has shown real results and positive impact on national development.
This can be seen from the contribution of Gross Domestic Product (GDP) National
fisheries sector to GDP continues to increase. The contribution of fisheries and marine
sector to the national GDP reached about 12.4%. Even the fishing industry to absorb
more than 16 million workers directly (Dahuri, 2009).
Fish processing activities in the Village Pond Wedi, Surabaya mostly still done the
traditional form of domestic industry (home industry), such as fresh fish processing
(cooling), salted (salting), fish pindang (pemindangan), fish fillets, smoked fish
(fumigation), crackers, fish / shrimp, and shrimp paste.
Based on data from Directorate General of Capture Fisheries (2009), judging from the
way of treatment include marketed fresh (31.37%), drying / salting (46.41%),
pemindangan (15.52%), shrimp paste (0.41%), bike (0.002%), smoking (2.88%),
freezing (0.82%), fish meal (0.08%), and others (2.45%), in the region of Central Java
Province, dominated by the marketing of fishery products in the form of drying / salting.
Fish processing performed by the coastal communities in the Village Pond Wedi to
circumvent their income that is formed through SMEs continued to decline, fishing
village looking ponds Wedi largely a side income by empowering the processing of fish,
because of the many tourists who come to the Bridge tour, therefore, in empower
coastal fishermen are to be utilized in an optimal and sustainable (Sustainability), for
fisheries and marine resources, especially fish is a source of nutrition for the community.
Revenue of SMEs in the Village Pond Fish Processing Wedi fluctuated from year 2008
up to 2010. In 2008 the average income of Rp. 11,900,000 whereas 2009 decreased by
USD. 6,828,900, and in 2010 also returned a decrease of Rp. 5,237,766. This indicates a
decline in the performance of the alleged lack of precision implement strategies that
made by the central office that less can be applied into practice by the employee
because the competitive advantage associated with how the company chooses and is
really a generic strategy to implement in practice.
Many research scientists who have proved that superior skills or expertise (superior
skills) will produce superior performance (superior performance). Superior skills are
unique competence (distinctive competence), which supports the company to achieve
positional advantage (positional advantage). Positional advantages the company stated
with performance outcomes (performance outcomes). While the indicator most often
used to evaluate or measure the results of performance is market share (market share)
The First International Conference on Entrepreneurship
Book One 122
and profitability (Szimansky, et al, 1993). Some research in the field of marketing has
also been proved that marketing competence has a positive influence on the results of
the company's performance. So if the marketing competence increases, the results of the
company's performance will also increase, and vice versa. This research attempts to
examine the concept of relationship in manufacturing firms in Indonesia.
To improve the competitiveness of companies, one way that can be achieved is by
developing the capability or competence of the company (Tambunan, 2001). This
research attempts to see the impact of competence in marketing of competitive
advantage, especially seen from a comparison of the relative market share and market
share growth. It is expected that the results of this study can be used as an alternative
solution to the company in exploring the sources of competitive advantage, especially in
the field of marketing to be able to improve industrial performance.
Literatur Review
The concept of Competitive Advantage (Competitive Advantage) Competitive
advantage relates to the way how the company memilihan really can implement a
generic strategy into practice (Porter, 1994). All parts are there in the organization,
either in the form of resources and activities, can be a competitive advantage through
three alternative strategies: Cost leadership, differentiation, or focus. By introducing a
tool known as value chain analysis, management is able to separate the basic activities
undertaken by the company, ranging from the activities of design, production processes,
marketing to after sales service and all supporting activities ranging from human
resource management, infrastructure , purchasing and technology development. Porter
gives a new perspective on competitive strategy and practical by showing how all the
basic activities and support activities can be combined to form a synergy which in turn
will bring a competitive advantage.
By using this value chain analysis, management can do the following activities:
- Understanding the behavior of costs
- Identify what is creating value for buyers
- Selecting a technology strategy that reflects the significance of corporate
technology for competitive advantage
Cravens (1996) argued that competitive advantage should be viewed as a dynamic
process rather than seen as the final result. Competitive advantage has stage process
consisting of a source of excellence, excellence and achievement of final results
position as well as investment income to sustain excellence.
Competitive advantage analysis showed the differences and uniqueness among its
competitors. Source of competitive advantage is skill, resources and superior control.
Superior skills that allow organizations to select and implement strategies that will
differentiate the organization from the competition. Skills include technical capabilities,
The First International Conference on Entrepreneurship
Book One 123
managerial and operational. For example, knowledge about the wishes and demands of
consumers helps firms to use its ability to satisfy consumers.
Meanwhile, the superior resources that enable the formation of the dimensions of
excellence. For example, a strong distribution network, manufacturing capabilities,
marketing strength (an experienced sales force), technology and natural resources.
Superior control includes the ability to monitor and analyze processes and business
results. For example, the superior cost control costs and inhibit the introduction of the
field where the assessment and management action is required. The control system also
provides the performance stakes guess (bench mark).
Monitoring efforts should be more than just internal operations, but also includes
consumers, competitors and distribution networks. Advantages position is the result of
production with low cost (cost leadership) or differentiation that delivers superior value
for consumers. Lower costs enable the company to provide superior value by providing
a lower price than its competitors for the same product. Differences appearance
products that comply with buyer preferences to produce unique benefits that can cover
the high price. Important factor in seeking excellence is how to make a decision to
compete.
Definition of Small Industry Performance
Orally and in writing, many sides use different terms to discuss this small industry. In
addition to use the term small scale industries (small industry), there are a number of
other terms that mean the same, such as: small business (small business), small
companies (small enterprise or a small firm), small-scale enterprises (small scale
busines) and others . Some claimed the small industry is the sector, while small industry
is the sub-sector. This assumption should be ignored just because of all the terms it
basically has the same content.
Based on research results Szimansky, et al. (1993) indicators of performance
measurement and competitive advantage of the most frequently used is the market share
and profitability. In this study the researcher only uses market share (market share) as
indicators of company performance measurement which is then fitted with the growth
of market share (market share growth). Market share is a measurement of marketing
performance or operational performance that can distinguish between winners and
losers. Volume sales of the company did not disclose how well the company's
performance compared to its competitors. If the company increased market share means
the company can outperform its competitors, if the models share the company declined,
saying the company could lose to competitors. The definition of market share here is the
relative market share, the company's total sales expressed as a percentage of sales to
major competitors. Measurements with the overall market share is widely used because
it only requires information on total sales (Kotler, 1997). This study also uses a
The First International Conference on Entrepreneurship
Book One 124
measurement relative market share by asking the comparison market share of
respondents with their main competitors.
Effect of Sources of Competitive Advantage The Performance Company
To improve the competitiveness of companies, one way this can be achieved is by
developing capabilities in order to improve company performance (Tambunan, 2001).
Competency directing patterns of diversification and how the company entered the
market (market entry). Special competence is the competitive advantage of companies
owned or done that gave him the strength to deal with competitors (Tjiptono, 1997).
Marketing competency is the ability and performance level of marketing that supports
the achievement of corporate strategic objectives. The amount of marketing competence
is calculated by knowing the total value of the performance factors of competitive
advantage is multiplied by the relative importance of these factors and the percentage of
responsibility in marketing. (Purnama, 2003: 11).
RESEARCH METHOD
MeasurementVariables
Sources ofCompetitive Advantage(X)
Isthe abilityand performance levelofmarketingthatsupportsthe achievement
ofstrategicobjectiveswithindicators(Sukarno, 2009, 568)
1) AdvertisingCampaign
2) AbilityMeetsTargetMarketDemands
3) Pricing
4) The extent ofProduct Line
5) The extent ofDistributionCoverage
6) SelectiveDistribution
7) SalesMastery
Boundvariables:
Performance ofSmall Industries(Y)
Is the level ofachievementSmallFish ProcessingIndustriesismeasured in terms
ofworkwith theindicator(Muljaningsih andSukarno, 2011:148):
a) SalesGrowth
b) Profitability
Population
The populationinthis studyis theoverallindustryownersandemployeesFish Processingin
Tambak Wedi.
Sample
In this study, samples were taken from the Small Fish Processing Industry in the Village
Pond Wedi, with a number of indicators at least 9x10=90 customers. And tomeet the
The First International Conference on Entrepreneurship
Book One 125
requirements of the SEM test which requires a sample of 100-200, then the sample in
this study of 100 people.
TechnicalAnalysis
Hypothesis testing used in this study was multi variate analysis with Structural Equation
Modeling (SEM). Assessment of influence on each-each independent variable on the
dependent variable using path coefficient.
RESULTS AND DISCUSSION
EvaluationModelOne-StepApproachtoSEM
In the SE Mmodel, measurement modelandstructuralmodelparametersestimatedjointly.
This method is some what experienced difficulty in meeting the demands of the
modelfit. Most likely caused by the interaction between measurement models and
structural models are estimated jointly (one-step approachtoSEM).
One-step approach to SEM is used when the model is believed that based on strong
theory and the validity and reliability data is very good. (Hair.et.al, 1998).
Table1. EvaluationCriteria forGoodnessofFitIndices
Criteria
Results Critical Value
Evaluation Model
Cmin/DF 0.810 ≤ 2,00 good
Probability 0.594 ≥ 0,05 good RMSEA 0.000 ≤ 0,08 good
GFI 0.982 ≥ 0,90 good AGFI 0.953 ≥ 0,90 good
TLI 1.054 ≥ 0,95 good CFI 1.000 ≥ 0,94 good
From the results of evaluation of the model was one step elimination nof all goodness of
fitcriteria are used, all showing good results of the evaluation model, the modelis
consistent with the data. That is, the conceptual model was develop dandis based
theories have been fully supported by facts.
Causality Test
Judging from the number determinant ofthe sample covarian cematrix:
2532933763>0indicates there multi colinierity or Singularity in this dataso that
assumptions are met. Thus there gression coefficientof each factor can betrust edas seen
in the causality test below.
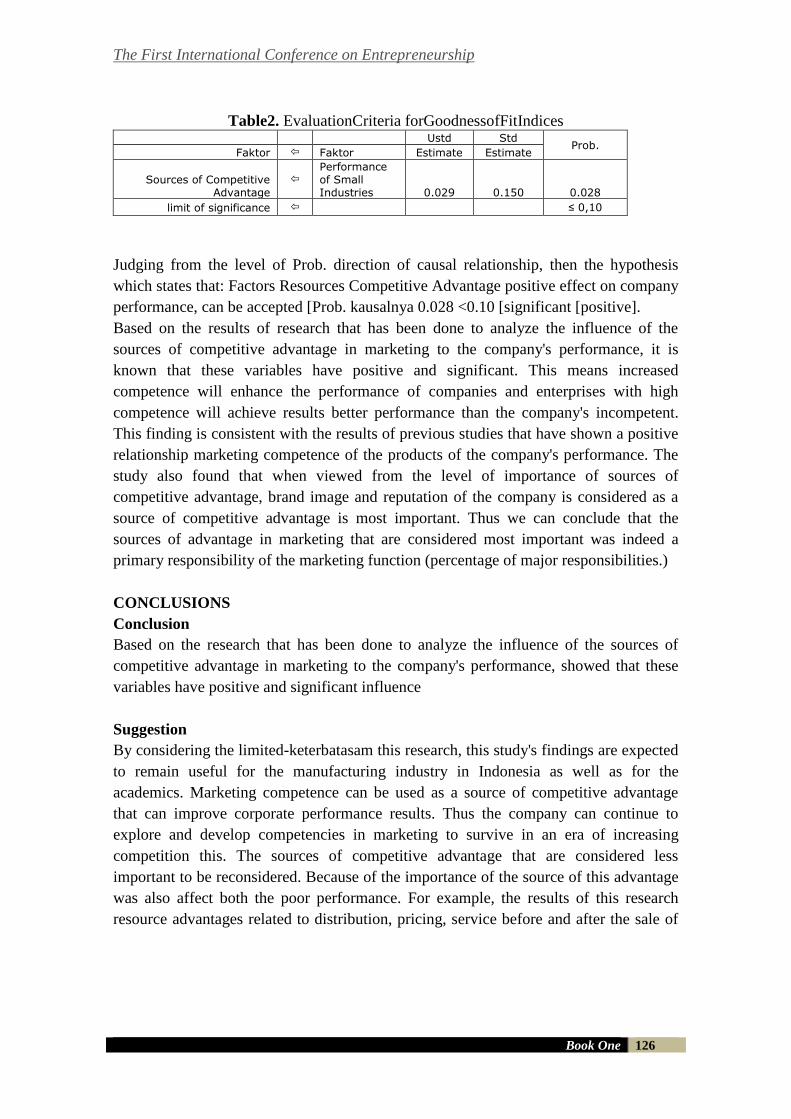
The First International Conference on Entrepreneurship
Book One 126
Table2. EvaluationCriteria forGoodnessofFitIndices
Ustd Std
Prob. Faktor Faktor Estimate Estimate
Sources of Competitive Advantage
Performance of Small Industries 0.029 0.150 0.028
limit of significance ≤ 0,10
Judging from the level of Prob. direction of causal relationship, then the hypothesis
which states that: Factors Resources Competitive Advantage positive effect on company
performance, can be accepted [Prob. kausalnya 0.028 <0.10 [significant [positive].
Based on the results of research that has been done to analyze the influence of the
sources of competitive advantage in marketing to the company's performance, it is
known that these variables have positive and significant. This means increased
competence will enhance the performance of companies and enterprises with high
competence will achieve results better performance than the company's incompetent.
This finding is consistent with the results of previous studies that have shown a positive
relationship marketing competence of the products of the company's performance. The
study also found that when viewed from the level of importance of sources of
competitive advantage, brand image and reputation of the company is considered as a
source of competitive advantage is most important. Thus we can conclude that the
sources of advantage in marketing that are considered most important was indeed a
primary responsibility of the marketing function (percentage of major responsibilities.)
CONCLUSIONS
Conclusion
Based on the research that has been done to analyze the influence of the sources of
competitive advantage in marketing to the company's performance, showed that these
variables have positive and significant influence
Suggestion
By considering the limited-keterbatasam this research, this study's findings are expected
to remain useful for the manufacturing industry in Indonesia as well as for the
academics. Marketing competence can be used as a source of competitive advantage
that can improve corporate performance results. Thus the company can continue to
explore and develop competencies in marketing to survive in an era of increasing
competition this. The sources of competitive advantage that are considered less
important to be reconsidered. Because of the importance of the source of this advantage
was also affect both the poor performance. For example, the results of this research
resource advantages related to distribution, pricing, service before and after the sale of
The First International Conference on Entrepreneurship
Book One 127
the lowest ranks (considered less important). As a result the performance of resource-
advantage Sumner tersebutpun less good than the sources of other advantages.
REFERENCE
Cravens, D.W., 1996, Pemasaran Strategis, Alih Bahasa: Lina Salim,Edisi Keempat, Jilid Satu,
Penerbit Erlangga, Jakarta.
Handoko, T.H., 1995, Manajemen, Edisi Dua, BPFE, Yogyakarta.
Heene, A. & Sanchez, R., 1997, Competence Based Strategic Management, John Willey & Sons,
New York,.
Kotler, P.,1997, Manajemen Pemasaran: Analisis, Perencanaan, Implementasi dan
Pengendalian, Penerbit Erlangga, Jakarta.
_________, 2000, Marketing Management, The Millenium Edition, Prentice Hall International,
Inc., Mexico.
Muljaningsih dan Sukarno, 2011,Faktor Kunci Dalam Meningkatkan Kinerja Usaha Kecil Di
Jawa Timur. Jurnal Ekonomi dan Bisnis Vol 1 No. 3.
Nasir, M., 1988, Metode Penelitian, Ghalia Indonesia, Jakarta.
Nitisemito, A.S.,1992,Manajemen Pemasaran: Analisis, Perencanaan, Implementasi dan
Pengendalian, Penerbit Erlangga, Jakarta.
Pawitra, T., 1993, Kelemahan Praktek Manajemen Pemasaran di Indonesia, Majalah
Manajemen, no. 113.
Porter, M.E.,1994,Keunggulan Bersaing, Tim Penerjemah Binarupa Aksara, Binarupa Aksara,
Jakarta.
Purnama, 2003, Analisis Pengaruh Sumber-Sumber Keunggulan BersaingBidang Pemasaran
Terhadap Kinerja PerusahaanManufaktur Di Indonesia, JSB No. 8 Vol. 2, Desember
2003
Rue, L.W. & Byars, L.L, 1997, Management, Skill & Aplication, Mc. Graw Hill Companies,.
Siagian, S.P., Manajemen Stratejik, Bumi Aksara, Jakarta, 1995.
Sukarno, Gendut, 2009,Kontribusi Sumber-Sumber Keunggulan Bidang Pemasaran Terhadap
Kinerja Perusahaan Alfamart Surabaya, Jurnal Ekonomi dan Bisnis Vol 1 No. 3.
Szymansky, D.M., Badrawaj, S.G. & Varadarajan, P.R., 1993, An Analysis of the Market Share,
Profitability Relationship, Journal of Marketing, vol. 57 (July): p. 1-18,.
Tambunan, T., Kinerja Ekspor Industri Manufaktur Indonesia, KADIN, Jakarta, 2001.
Tjiptono, F., Strategi Pemasaran, Edisi Dua, Penerbit Andi, Yogyakarta, 1997.
The First International Conference on Entrepreneurship
Book One 128
THE FACTORS SHAPING THE SPIRIT OF
ENTREPRENEURSHIP
(A STUDY IN SMALL AND MEDIUM ENTERPRISES)
Tina Melinda1, Meidiahna Kusuma2, Liliani3
Universitas Ciputra
INDONESIA
E-mails :[email protected], [email protected], [email protected]
ABSTRACT
Small and medium enterprises, which are often referred to as SMEs, play a
significant role in the economic growth and employment rate. This role is
categorized as a strategic role in national economic development. Considering
the scale of the role, the government has tried to support it by training,
mentoring, developing, and financing the subject, but the performance of SMEs
in reality did not meet the expectation. It is believed that the spirit of
entrepreneurship is a big factor in the success of SMEs. The purpose of this
research is to determine the factors that shape the spirit of entrepreneurship.
The sample of this research consists of 48 respondents who own small and
medium enterprises. Factor analysis is used as a means of data analysis in this
study. The result of the study suggests that the dimensions of entrepreneurship
spirit, which consist of market sensitivity, risk taker, and creativity and
innovation, provide a massive contribution to the creation of entrepreneurship
spirit.
Keywords: Entrepreneurship Spirit, Market Sensitivity, Risk Taker,
Creativity And Innovation
INTRODUCTION
Small and medium enterprises play a significant role in economic growth and
employment rate. This role is also considered as a strategic role in national economic
growth. SMEs are better equipped to survive economical crisis compared to large scale
enterprises.
Considering the scale of the role, the government has tried to support it by training,
mentoring, developing, and financing the subject, but the performance of SMEs in
reality did not meet the expectation (Partomo, 2002). Several researchers attempt to
explain the reasons behind this condition; Pambudi and Rabanni (1995) in Nurhayati
(2004) mention about how the interaction of several contributing factors such as
marketing, financial, management, technical, location, human resources, and financial
structures affects the performance of small enterprises. Meanwhile, Idrus (1990) and
Scarborough & Zimmerer (1993) suggest that management incapability, weak decision
The First International Conference on Entrepreneurship
Book One 129
making process, lack in experience, and weak financial supervision are the factors
behind the unsuccessful business run by small enterprises. This research is funded by the Directorate of Research and Community Service (Dit.Litabmas) from the Directorate General of High Education of Ministry of Culture and Education with funding from University Research Grant in 2013
Baswir (1995) and Christian (2008) insist that the dominant use of traditional
technology, capital shortage, and weak managerial aspects are the factors leading to the
low performance level of small enterprises. This condition is closely related to several
internal and external problems faced by SMEs. Several internal problems include the
inability to capture market opportunity, capital shortage, and managerial wekness,
which includes the inability in acquiring market access. These factors then affect the
ability of SMEs to increase their business scale which require them to increase turnover,
meet demands, and adjust their quality to consumer taste, as well as dealing with the
difficulty in selling goods, accessing market information source, and dealing with the
small amount of market research studies (Sangen, 2005). On the external side, we can
see that the unconducive national economic and political system influences the growth
of SMEs (Budi, 2003)
The same condition also happens to the food manufacturing industry in East Java. The
food manufacturing industry is a field that absorbs an ample number of employees,
especially in East Java. It employed 114.815 people in 2003, 126.240 people in 2004,
and 126.318 people in 2005 (BPS, 2009). The food manufacturing industry in East Java
escalates in number in 2003 as many as 44.371 business units, 56.536 units in 2004, and
56.618 units in 2005 (BPS 2009). These statistics are based on the assumption that the
enterprises belong to local ethnics such as Javanese, Padangese, Sundanese and
Maduranese who have specific characteristics and different cultures in managing their
businesss. Additionally, the statistics are measured using the most commonly produced
raw materials from each area. As quoted by Sangen (2005), Pelkam and Welson (1996)
states that these differences can strengthen their ability in doing market orientation. The
process of becoming entrepreneurs is highly affected by the factors of human and their
intuition, as well as the society and culture they come from.
The essence of entrepreneurship according to Drucker (1959), as quoted by Suryana
(2006), is the ability to create something new and different by using creative thinking
and innovative action to create an opportunity. The creative and innovative process is
performed by entrepreneurs with creative and innovative characters. According to
Suryana (2006), the characteristics include: (1) confidence, with indicators of high
confidence, optimism, commitment, discipline, and responsibility; (2) initiative, with
indicators of enthusiasm, pace, and active behavior; (3) high achiever, with indicators of
result orientation and insight for the future; (4) leadership, with indicators of being
different, trustworthy, and tough; and (5) calculated risk taker.
Zimmerer (1996:51) in his book Entrepreneurship and The New Venture Formation
discloses that creativity is creating something from nothing, and is a result of combining
old and new ways to create a simpler and better alternative.
From this definition, we can conclude that creativity is important for an entrepreneur to
create something from nothing and combine old and new ways to create a simpler and
The First International Conference on Entrepreneurship
Book One 130
better alternative. Meanwhile, Baldacchino (2009) states that accurate decision making
in a corporation can be defined as the creative and innovative ability to come up with
tips and resources in seeking a success opportunity. Creativity and innovation becomes
the basis of accurate decision making in a corporation. Creativity is a character that an
entrepreneur must have (Karutko 2009). Creativity is an important factor in creating
competitive advantage and business sustainability (Alma, 2009). In conclusion,
creativity is the ability to develop new ideas and find new ways to spot an opportunity.
The willingness and the ability to take risks are one of the main values in
entrepreneurship. An entrepreneur who is not willing to take risk will find it hard to
start or initiate a business. The value of entrepreneurship is the courage to bear the
calculated and realistic risks (Suryana, 2006). Additionally, it is also the ability to
consider the possibility of success and failure in reaching the goal, as well as being able
to continue if the failure possibility is low. According to Drummond (2009), most
people see risk as a bad possibility or a potential disaster. Sofjan (2009, 52) states that
failure is not something shameful or something to avoid. Therefore, an entrepreneur
should deal with risk in a calm manner (Yudiantoro 2006: 86-88).
On the other hand, an entrepreneur should keep a close watch on the potential of other
competitors. An entrepreneur must analyze their chance of developing new products,
successful experience in developing new products, financial support, and other
advantages that the competitors have in the market (Suryana, 2006). Therefore, an
entrepreneur has to understand his own strength and weakness as well as the ones
possessed by his competitors. As Dan & Bradstreet (1993) suggests, our weaknesses
and strengths, as well as our competitors’, are an interesting subject for analysis. Every
entrepreneur is expected to own a strong attitude and market sensitivity in order to look
to the future and fulfill the demands of the market. An entrepreneur also needs to be
able to identify the size of the penetrated market (Susanto, 2009). This can be defined as
the ability to identify the market in terms of goods and services and providing added
values and benefits to customers.
Vitale, et al., (2002) conducted a research with the purpose of getting managerial
implications that would help us understand what a company should do to apply
entrepreneurial orientation. Entrepreneurial orientation has been proven to have a
positive and strong relation to the company’s ability to perform in many researches
(Matsuno et all., 2000; Atuahene-Gima dan Ko, 2001; Miles, Munilla dan Cavin, 2002).
If entrepreneurs, executives, and managers can understand the relationship between
their works and the entrepreneurship orientation, they will then be able to perform better
(Sangen, 2005). The purpose of this research is to analyze the factors that shape the
spirit of entrepreneurship.
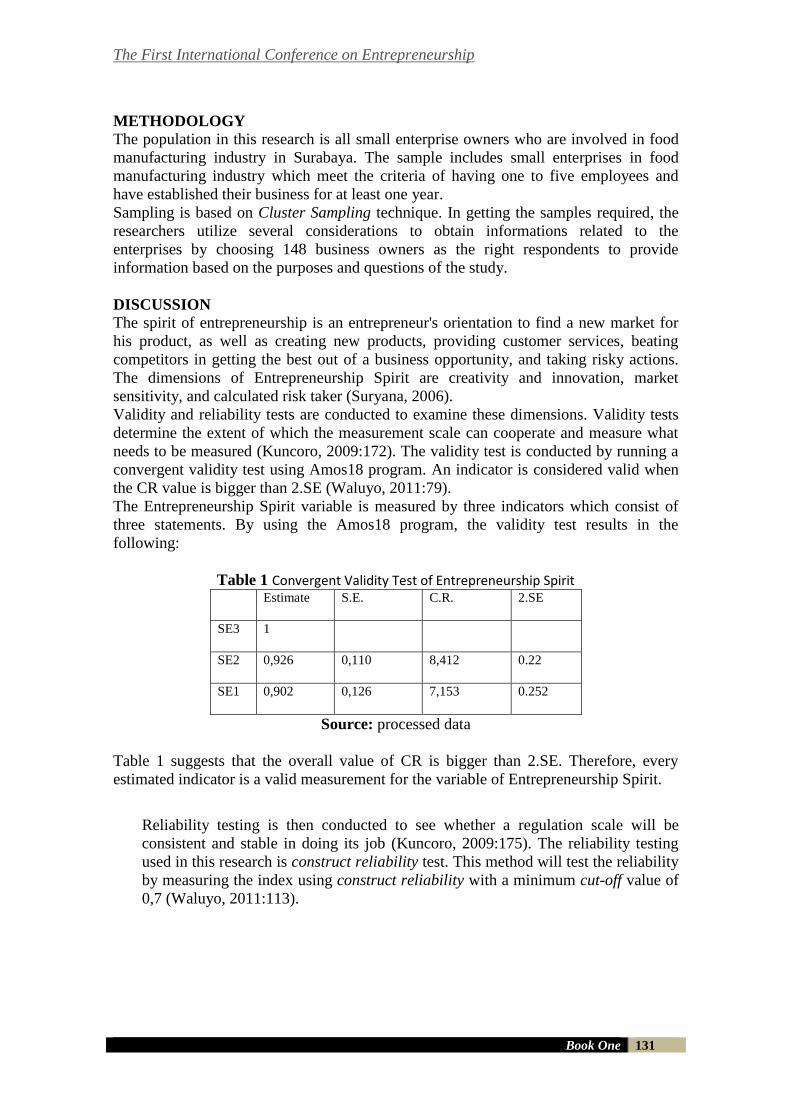
The First International Conference on Entrepreneurship
Book One 131
METHODOLOGY
The population in this research is all small enterprise owners who are involved in food
manufacturing industry in Surabaya. The sample includes small enterprises in food
manufacturing industry which meet the criteria of having one to five employees and
have established their business for at least one year.
Sampling is based on Cluster Sampling technique. In getting the samples required, the
researchers utilize several considerations to obtain informations related to the
enterprises by choosing 148 business owners as the right respondents to provide
information based on the purposes and questions of the study.
DISCUSSION
The spirit of entrepreneurship is an entrepreneur's orientation to find a new market for
his product, as well as creating new products, providing customer services, beating
competitors in getting the best out of a business opportunity, and taking risky actions.
The dimensions of Entrepreneurship Spirit are creativity and innovation, market
sensitivity, and calculated risk taker (Suryana, 2006).
Validity and reliability tests are conducted to examine these dimensions. Validity tests
determine the extent of which the measurement scale can cooperate and measure what
needs to be measured (Kuncoro, 2009:172). The validity test is conducted by running a
convergent validity test using Amos18 program. An indicator is considered valid when
the CR value is bigger than 2.SE (Waluyo, 2011:79).
The Entrepreneurship Spirit variable is measured by three indicators which consist of
three statements. By using the Amos18 program, the validity test results in the
following:
Table 1 Convergent Validity Test of Entrepreneurship Spirit Estimate S.E. C.R. 2.SE
SE3 1
SE2 0,926 0,110 8,412 0.22
SE1 0,902 0,126 7,153 0.252
Source: processed data
Table 1 suggests that the overall value of CR is bigger than 2.SE. Therefore, every
estimated indicator is a valid measurement for the variable of Entrepreneurship Spirit.
Reliability testing is then conducted to see whether a regulation scale will be
consistent and stable in doing its job (Kuncoro, 2009:175). The reliability testing
used in this research is construct reliability test. This method will test the reliability
by measuring the index using construct reliability with a minimum cut-off value of
0,7 (Waluyo, 2011:113).
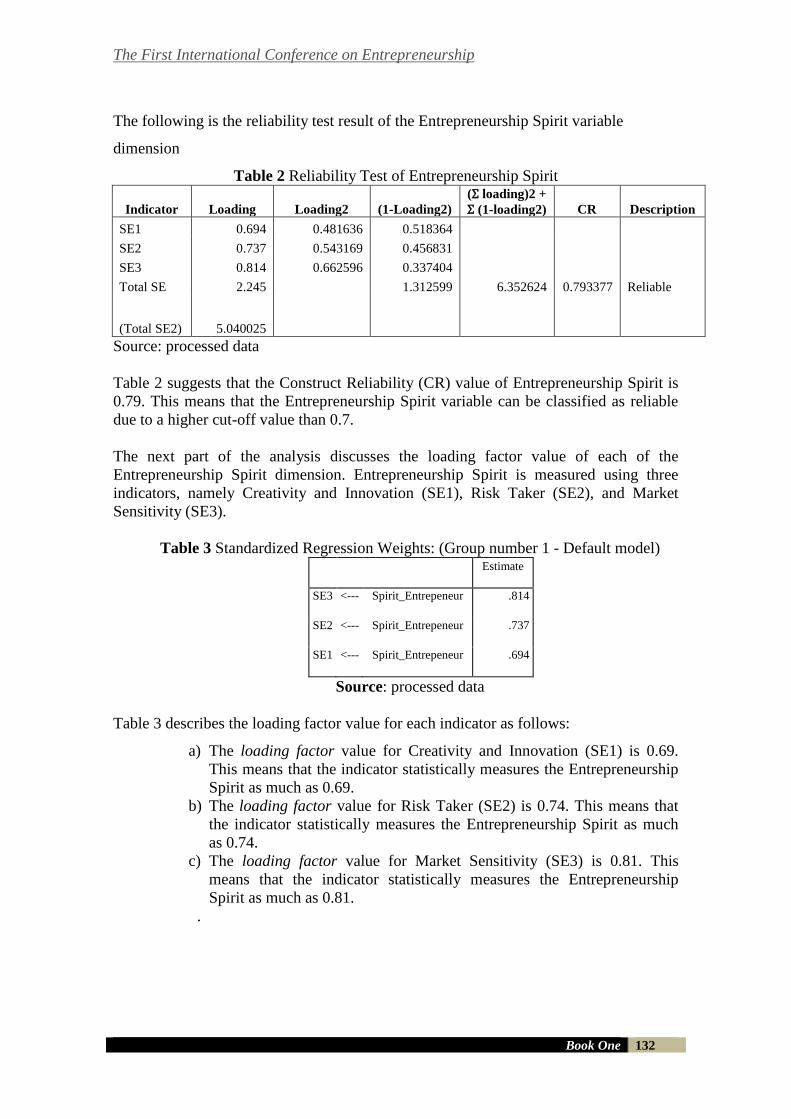
The First International Conference on Entrepreneurship
Book One 132
The following is the reliability test result of the Entrepreneurship Spirit variable
dimension
Table 2 Reliability Test of Entrepreneurship Spirit
Indicator Loading Loading2 (1-Loading2)
(Ʃ loading)2 +
Ʃ (1-loading2) CR Description
SE1 0.694 0.481636 0.518364
SE2 0.737 0.543169 0.456831
SE3 0.814 0.662596 0.337404
Total SE 2.245
1.312599 6.352624 0.793377 Reliable
(Total SE2) 5.040025
Source: processed data
Table 2 suggests that the Construct Reliability (CR) value of Entrepreneurship Spirit is
0.79. This means that the Entrepreneurship Spirit variable can be classified as reliable
due to a higher cut-off value than 0.7.
The next part of the analysis discusses the loading factor value of each of the
Entrepreneurship Spirit dimension. Entrepreneurship Spirit is measured using three
indicators, namely Creativity and Innovation (SE1), Risk Taker (SE2), and Market
Sensitivity (SE3).
Table 3 Standardized Regression Weights: (Group number 1 - Default model)
Estimate
SE3 <--- Spirit_Entrepeneur .814
SE2 <--- Spirit_Entrepeneur .737
SE1 <--- Spirit_Entrepeneur .694
Source: processed data
Table 3 describes the loading factor value for each indicator as follows:
a) The loading factor value for Creativity and Innovation (SE1) is 0.69.
This means that the indicator statistically measures the Entrepreneurship
Spirit as much as 0.69.
b) The loading factor value for Risk Taker (SE2) is 0.74. This means that
the indicator statistically measures the Entrepreneurship Spirit as much
as 0.74.
c) The loading factor value for Market Sensitivity (SE3) is 0.81. This
means that the indicator statistically measures the Entrepreneurship
Spirit as much as 0.81.
.
The First International Conference on Entrepreneurship
Book One 133
The data analysis result suggests that the three indicators shape the spirit of
entrepreneurship, and that market sensitivity is the biggest indicator of the three.
Therefore, it is essential that entrepreneurs pay good attention to these indicators in
order to maintain a good performance.
Companies with market sensitivity are market-oriented companies which constantly use
market information to fulfill their customers’ needs at present, as well as predict or
anticipate future needs. Therefore, companies must have quick access to market
information and respond to it. It is related to the adaptive ability of a company in the
available market (Jaworski & Kohli; 1993). Apart from these factors, every
entrepreneur is expected to have a strong market sensitivity attitude and character in
order to see the available opportunities and understand the unfulfilled needs of the
people at present time. An entrepreneur also needs to identify the size of the market he
will enter (Susanto 2009:126). This factor is strongly related to (1) the ability to identify
the market, (2) the ability to be sensitive to the market’s needs and movements, (3) the
ability to capture a market share, (4) the ability to be attractive, and (5) the need to
increase company capacity. Market-sensitive companies will apply marketing concepts
to fulfill the needs of the customers and are very effective and efficient in creating the
best value for their buyers while creating a productive company (Naver& Slater, 1990).
The dimension of calculated risk taker character is to calculate the possibility of success
and failure in fulfilling the set purpose, as well as being able to move on when the
possibility of a failure is low. Drummond (2009) finds that most people view risk as a
potential disaster. Another researcher suggests that failure is not an embarrassment that
should be avoided (Sofjan 2009, 52). Thus, an entrepreneur should not be afraid to take
risks and calmly deal with them (Yudiantoro 2006: 86-88). This idea is also applicable
to SME owners. They must consider failure as part of the process of being successful.
According to Suryana (2013:121), the risks often experienced are: (1) technical risks
related to expected product developments, (2) financial risks related to the financing and
development of new products, and (3) competition risk, which is can be defined as the
competitors’ ability to maintain their positions in the market.
Baldacchino (2009) states that accurate decision making in a corporation can be defined
as the creative and innovative ability to come up with tips and resources in seeking a
success opportunity. Creativity and innovation becomes the basis of accurate decision
making in a corporation. Creativity is a character that every entrepreneur must have
(Karutko 2009). Creativity is crucial for the establishment of competitive advantage and
business sustainability (Alma 2009). It is the ability to develop new ideas and find new
ways of looking at an opportunity. Fontana (2011) also suggests that SMEs are required
to innovate, because innovation is essential for financial success since it replaces old
methods with new ones in order to transform input into output that will lead to a
significant change in the value and price offered to consumers. Therefore, SMEs
entrepreneurs must be sensitive to the available market opportunity, ready to face any
risk, and able to create a breakthrough through creativity and innovation.
The First International Conference on Entrepreneurship
Book One 134
CONCLUSION
Fierce competition requires SMEs entrepreneurs to possess a spirit of entrepreneurship
in conducting their business. Data analysis suggests that the three dimensions of
entrepreneurship spirit contribute to the creation of entrepreneurship spirit. Market
Sensitivity becomes the biggest contributor, followed by Calculated Risk Taker and
Creativity and Innovation. By knowing the market sensitivity is the largest contribution
to the entrepreneurial spirit , the company should be oriented to the needs of the market ,
to find out information about the needs of the market and respond to the information.
Thus the company is required to be adaptive in responding to the needs of the market .
sensitivity to market will enable companies to create the best value for consumers as
well as to improve the performance of the company
REFERENCES
Alma, Buchari, 2009, Entrepreneurship for College Students and General Public, Bandung:
Alfabetha
Atuahene – Gima, K. 1996. Market Orientation and Innovation. Journal of Business
Research.35 (2), 93-104.
Arikunto, S. 1995. Research Management. Jakarta ; Rineka Cipta.
Baswir, Revrison. 1995. ”Small and Conglomeration Industry in Indonesia: Partnership
Prospect”, Prisma No.10 Tahun XXIV Oktober 1995. LP3ES. Jakarta.
Budi Santoso SJ., 2003. Manipulation in Economic Power (Indonesia 1800-1900): Strategis
Used by Chinese Entrepreneurs. Realino Studies Institute. Penerbit Kanisius
Yogyakarta, 7th Edition.
Christian Herdinata. 2008. Bank-Related Policies to Address the Fund Allocation Issues in the
Development of SMEs. Prosiding : UNAIR Surabaya.
Fontana,A,2011, Innovative We can!: How to Create Value through Innovation in Your
Organization and Society, Jakarta, Cipta Inovasi Sejahtera
Karutko, Hotggeds, 2009, Entrepreneurship, Theory Process Practice
Kuncoro, M, 2009, Research Methods for Business and Economy, Penerbit Erlangga
Matsuno, Ken., John T. Menzher, and Aysegul Ozsomer. 2002. The Effect of Entrepreneurial
Proclivily and on Business Performance, Journal of Marketing. 66 (July), 18-32.
Nurhayati.2004. Analysis on the Factors That Affect the Performance and Competitive
Advantage of Export-Oriented Small Enterprises in East Java. Postgraduate
Dissertation. Universitas Brawijaya Malang Unpublished.
Partomo, TitikSartika. 2002. Small and Medium Scale Economy and Cooperative. Penerbit
Ghalia Indonesia. Jakarta.

The First International Conference on Entrepreneurship
Book One 135
Sangen, Marijati. 2005. The Effect of Entrepreneurship Orientation, Market Orientation, and
Chinese, Bugis, and Banjar Ethnical Cultures Towards the Performance of Small
Enterprises. Postgraduate Dissertation. Universitas Brawijaya Malang. Unpublished.
Scarborough, N.M. and T.W. Zimmer.1993. The Effetive Small Management.Mac Millan. New
York.
Suryana. 2006. Practical Guide to Entrepreneurship: Success Tips and Process. Salemba
Empat : Jakarta.
Vitale, R.,J. Giglierano and M. Miles. 2002. Entrepreneurial Orientation, Market Orientation
and Performance in Established and Start up Firms, p. 1-12.
The First International Conference on Entrepreneurship
Book One 136
THE EFFECTS OF FISCAL DECENTRALITATION AND
INVESTMENT GROWTH ON ECONOMIC GROWTH IN EAST
JAVA
Nekky Rahmiyati 1
University of 17 Agustus 1945 Surabaya
INDONESIA
E-mail: [email protected]
ABSTRACT
This research is conducted to : (1) identify fiscal decentralitation which have
been done by the East Java Government, (2) identify economic growth in East
Java Province, (3) identify investment growth in East Java Province, and (4)
analyze the effect of fiscal decentralitation and investment growth on economic
growth on East Java Province. The result of this analyst shows that fiscal
decentralitation and investment growth has significant influence upon the
economical growth of East Java Province.
Keywords : Fiscal Decentralitation, Investment Growth, Economic
Growth.
INTRODUCTION
After Indonesia’s Government applied UU number 22 Year 1999 about Regional
Government and UU number 25 Year 1999 about Financial Balance Between Central
Government and Regional Government, revised into UU number 32 Year 2004 about
Regional Government and UU number 33 Year 2004 about Financial Balance Between
Central Government and Regional Government, then Regency / City in Indonesia have
been executing regional autonomy policies.
As consequences of a broad autonomy jurisdiction, regional government has obliged to
increase community services and wellfares democrately, fair, evently and
simultaneously. This obligation can be fullfilled if regional government is able to
manage their local potentials which are natural resources potentials, human resources
and financial resources optimaly. As it is, regional government is given autonomy rights
to determine their own Regional Income and Spending Budget (APBD) due to their
local needs and potentials. Regional Income and Spending Budget (APBD) is written as
regional government financial policies which are one of several triggers of regional
economic growths.
Basically there are three variants of fiscal decentralitation which are linked to the grade
of independency in acquiring regional policy. (1) Releasing responsibilty from central
government circle into regional government instancy vertically (2) Connecting with a
situation which the regional government is conducted as government representation to
execute certain functions on behalf of the government. (3) devolution as connecting to
a spesific situation but also authority to decide what have to be done locally.
The First International Conference on Entrepreneurship
Book One 137
It is interesting to see that if a country is decentralitating larger spending responsibility
than the available resources, then the level of services will be decreasing or regional
government will pressure central government to give additional fund. And if there are
more fund than spend which are decentralitating, then regional fund mobilitation can be
decreased and imbalancing of macro economy could occure.
If the goodness of decentralitation is followed by increasing resources mobility and
depressure of central financial, increasing accountability, and increasing common
performance and responsibilty then decentralitation is something valuable.
With fiscal decentralitation, regional government is urged to increasing their economy
strenght, so that they can compete with other regional government through gaining
regional government capital into investment needs. So it is necessary to make a study
about fiscal decentralitation effect on economic growth and investment in East Java.
Based on the descriptions above, it can be formed several researches’ issues which are :
(1) How is the implementation of fiscal decentralitation in East Java Province? (2) How
are the economic growth of East Java Province? (3) How is the investment growth on
East Java Province? And (4) What is the effects of fiscal decentralitation on economic
and investment growth on East Java Province ?
THEORETICAL FRAMEWORK
FISCAL DECENTRALITATION
Fiscal Decentralitation is granting authority to regional government to dig up income
resources, rights to achieve transfer from higher rank of governments, and decide
routine spending and investments. In short term regional government is given
opportunity to decide the regulation of budgeting.
Regional autonomy and fiscal decentralitation, in formally legal, is written in Laws
(UU) number 32 Year 2004 about Regional Government and Laws (UU) number 33
Year 2004 about Financial Balance Between Central Government and Regional
Government. Both laws are regulating basics of hand over authority into regional
government and funding over implementation of that authority. Beside that, there is also
Laws number 28 Year 2009 about Regional Tax and Restribution which are regulating
basics about Regional Government’s authority to conduct funds collecting to the
regional society in order to earn income resource for regional development. Both basics
laws and laws about regional tax and retributions mentioned above, basically are linked
in one basic principal that is commonly named as money follows function. In this
principal, functions which are given to regional by Laws number 32 Year 2004 is
followed by funding to accomodating those functions.
In order to implementation of fiscal decentralitation, main instrument which is used is
giving authority to the regional government to collect taxes (taxing power) and transfer
into regionals. Although regional government authority to collect regional taxes is very
limited, nevertheless year by year there is increasing role of regional income (PAD)
upon Regional Income and Spend Budget (APBD).
The First International Conference on Entrepreneurship
Book One 138
ECONOMY GROWTH
According to Sadono Sukirno (1996:33), economic growth is process of accelerating
output per capita which is continously in long term. The economic growth is one of the
indicator of development’s success. Higher the economic growth usually is followed by
higher society wellfare, although there are other indicator which is income distribution.
Adam Smith’s Teory of Growth (1723-1790) mentioned there are two aspects of
economic growth which are (1) total output growth, measured by Gross Domestic
Products (GDP) or Gross National Products (GNP); (2) Population Growth.
Benefits of Economic Growth among others as follows : speed of growth is to measure
economic progress as the result of national developments, income per capita is used to
measure level prosperity of the population, as the higher income per capita with
constant work means higher level prosperity of the populations and their productivity.
INVESTMENT GROWTH
Investment can be define as nett addition to existing capital stock (Nanga,2005:123) or
investment is a relief fund acquired by an industrial field or others which is come from
overseas or domestic, conducted by the government to financing a project, or expanding
existing projects to fulfilled increasing needs of life of the population.
According to Dornbusch (1991:268) investment is spendings to increase or maintaining
capital stocks. While according to Samuelson (2004:137) investment growth has
increadibly major role in economic growth, because : (1) investment is a quite large and
dinamic spending components, thus major change in investment very influences
agregat’s demand and eventually also influences output and work opportunity (2)
Investment collects accumulations of capital, by develop a number of buildings and
usefull tools, potentials output of a nation increases and so will the long term economic
growth too. Therefor investment is playing two major roles which are determines
number of output and incomes.
RESEARCH METHOD
This research is a quantity descriptive research, which is a study to explain in detail
about certain phenomena and supported by data and quantitative analyze.
TYPE AND DATA SOURCE
Type and Data Source used in this study is secondary data. Secondary data is panel data
which is time series data from year 2005-2011 and cross section from 38 regencies or
cities in East Java Province.
RESEARCH PROCEDURE
This study has several main steps as follows : (a) Preparation and Making of Study
Instruments, (b) Implemantation of Data Collecting based from the instruments, (c)
Editing and Data Analysis, and (d) Making tje report.
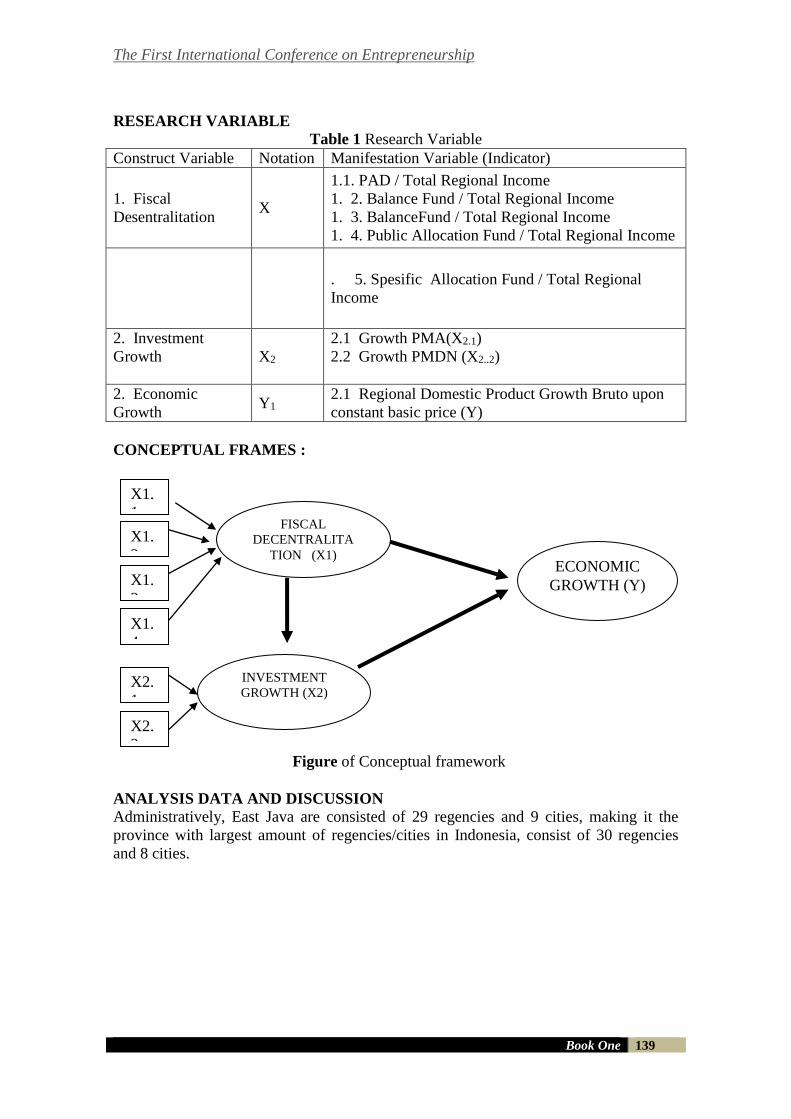
The First International Conference on Entrepreneurship
Book One 139
RESEARCH VARIABLE
Table 1 Research Variable
Construct Variable Notation Manifestation Variable (Indicator)
1. Fiscal
Desentralitation X
1.1. PAD / Total Regional Income
1. 2. Balance Fund / Total Regional Income
1. 3. BalanceFund / Total Regional Income
1. 4. Public Allocation Fund / Total Regional Income
. 5. Spesific Allocation Fund / Total Regional
Income
2. Investment
Growth
X2
2.1 Growth PMA(X2.1)
2.2 Growth PMDN (X2..2)
2. Economic
Growth Y1
2.1 Regional Domestic Product Growth Bruto upon
constant basic price (Y)
CONCEPTUAL FRAMES :
ANALYSIS DATA AND DISCUSSION
Administratively, East Java are consisted of 29 regencies and 9 cities, making it the
province with largest amount of regencies/cities in Indonesia, consist of 30 regencies
and 8 cities.
Figure of Conceptual framework
FISCAL
DECENTRALITA
TION (X1)
INVESTMENT
GROWTH (X2)
ECONOMIC
GROWTH (Y)
X1.
1
X1.
2
X1.
3
X2.
1
X2.
2
X1.
4
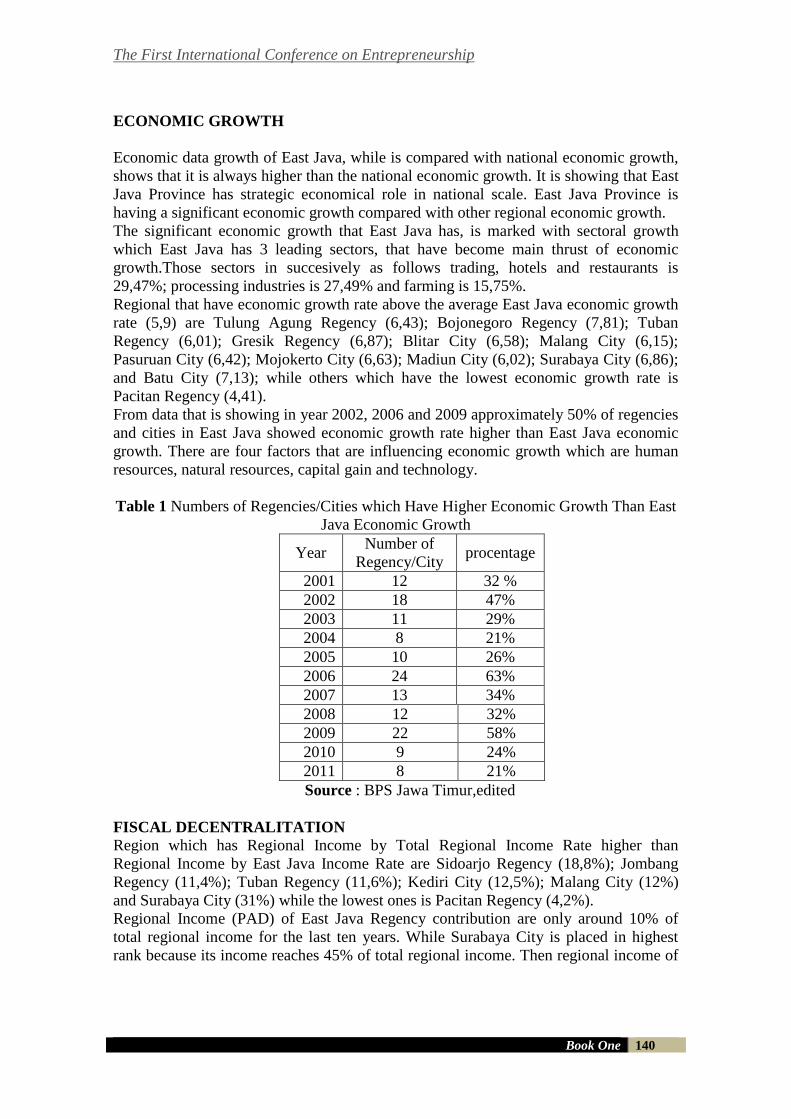
The First International Conference on Entrepreneurship
Book One 140
ECONOMIC GROWTH
Economic data growth of East Java, while is compared with national economic growth,
shows that it is always higher than the national economic growth. It is showing that East
Java Province has strategic economical role in national scale. East Java Province is
having a significant economic growth compared with other regional economic growth.
The significant economic growth that East Java has, is marked with sectoral growth
which East Java has 3 leading sectors, that have become main thrust of economic
growth.Those sectors in succesively as follows trading, hotels and restaurants is
29,47%; processing industries is 27,49% and farming is 15,75%.
Regional that have economic growth rate above the average East Java economic growth
rate (5,9) are Tulung Agung Regency (6,43); Bojonegoro Regency (7,81); Tuban
Regency (6,01); Gresik Regency (6,87); Blitar City (6,58); Malang City (6,15);
Pasuruan City (6,42); Mojokerto City (6,63); Madiun City (6,02); Surabaya City (6,86);
and Batu City (7,13); while others which have the lowest economic growth rate is
Pacitan Regency (4,41).
From data that is showing in year 2002, 2006 and 2009 approximately 50% of regencies
and cities in East Java showed economic growth rate higher than East Java economic
growth. There are four factors that are influencing economic growth which are human
resources, natural resources, capital gain and technology.
Table 1 Numbers of Regencies/Cities which Have Higher Economic Growth Than East
Java Economic Growth
Year Number of
Regency/City procentage
2001 12 32 %
2002 18 47%
2003 11 29%
2004 8 21%
2005 10 26%
2006 24 63%
2007 13 34%
2008 12 32%
2009 22 58%
2010 9 24%
2011 8 21%
Source : BPS Jawa Timur,edited
FISCAL DECENTRALITATION
Region which has Regional Income by Total Regional Income Rate higher than
Regional Income by East Java Income Rate are Sidoarjo Regency (18,8%); Jombang
Regency (11,4%); Tuban Regency (11,6%); Kediri City (12,5%); Malang City (12%)
and Surabaya City (31%) while the lowest ones is Pacitan Regency (4,2%).
Regional Income (PAD) of East Java Regency contribution are only around 10% of
total regional income for the last ten years. While Surabaya City is placed in highest
rank because its income reaches 45% of total regional income. Then regional income of
The First International Conference on Entrepreneurship
Book One 141
Sidoarjo reaches 21% of its total regional income in 2011. Based on Relationship
Pattern of Regional Ability, most regencies and cities in East Java are still instructive
exclude Surabaya City which has consultative relationship.
From the financial side of the country, implementation of fiscal decentralitation policy
have brought consequences upon changing fiscal management maps substantially. But,
up until now, source of regional development funds in Indonesia is reflecting
dependency upon endowment and aid from central government.
For ten years, it is showed that contribution of balance funds rate in East Java Province
upon East Java Total Income is 89,3%. Regions which have less contribution of balance
funds rate than contribution balance funds rate of East Java are Kediri Regency (85%);
Sidoarjo Regency (79%); Gresik Regency (82,8%); Tuban Regency (88,9%); Kediri
City (88,4%); Blitar City (85,9%); Probolinggo City (86,2%); Surabaya City (61,4%);
Batu City (76,9%)
Balance fund of East Java Province for ten years showed that contribution balance funds
rate of East Java by Total Income of East Javais 89,3%. While regions which have
lower contribution balance funds rate than contribution balance funds rate of East Java
are Kediri Regency (85%); Sidoarjo Regency (79%); Gresik Regency (82,8%); Tuban
Regency (88,9%); Kediri City (88,4%); Blitar City (85,9%); Probolinggo City (86,2%);
Surabaya City (61,4%); Batu City (76,9%)
Balance funds from 2001 to 2011 tendenciously decreasing. As proved, East Java
Province in 2001 has balance funds of 88% from its total regional income. And it is
decreasing into 71% in 2011. It is also happening in regencies / cities, it is decreasing
significantly. It is showing that fiscal decentralitation will be implemented well.
Significant decreasing happens on Surabaya City. In 2001 its balance funds is 67% of
total regional income, becoming 34% in 2011. There have been 33% decreasing.
INVESTMENT GROWTH IN EAST JAVA
Based on data from Capital Investment Agency (BPM), business fields on East Java are
divided into three groups which are primary sector, secondary sector and tertiary sector.
In further studies in secondary sector, sub sector that is in large demands by domestic
investor are chemistry industry, foods industry, non metal mineral industry, metal
industry and textile industry. It is showed by the large amounts of companies proposing
for business expansion on that sub sector mentioned.
DATA ANALYSIS
As follows are processed data SPSS using all collected datas, blank datas is assumed
have zero value and included in calculation.
EFFECTS OF FISCAL DECENTRALITATION UPON ECONOMIC GROWTH
Calculation result with SPSS software shows that Adjusted R Square value is 0,203. It
means that 20,3% PE variant can be explained by variation of fourth independent
variables DAK, DP, PAD and DAU. While the rest (100% - 20,3% = 79,7%) is
explained by causes beside the models. While probability value (Sig.) is 0,000. This
value is lower than 0,05 (5%), then the fourth independent variables DAK, DP, PAD
and DAU all together influences significantly upon PE.
The First International Conference on Entrepreneurship
Book One 142
Partial test result shows that from fourth independent variables DAK, DP, PAD and
DAU, individually PAD and DAU variables influences significantly upon PE because
probability value (Sig.) below 0,05 (5%). While DP and DAK individually does not
have any significant influences upon PE.
EFFECTS OF FISCAL DECENTRALITATION UPON INVESTMENT
GROWTH (PMDN)
Calculation result with SPSS software shows that Adjusted R Square value is 0,038. It
means that 3,8% PMDN variant can be explained by variation of fourth independent
variables DAK, DP, PAD and DAU. While the rest (100% - 3,8% = 96,2%) is explained
by causes beside the models. While probability value (Sig.) is 0,002. This value is lower
than 0,05 (5%), then the fourth independent variables DAK, DP, PAD and DAU all
together influences significantly upon PMDN.
Partial test result shows that from fourth independent variables DAK, DP, PAD and
DAU, individually PAD and DAU variables influences significantly upon PMDN
because probability value (Sig.) below 0,05 (5%). While DP and DAK individually does
not have any significant influences upon PMDN.
EFFECTS OF FISCAL DECENTRALITATION UPON INVESTMENT
GROWTH (PMA)
Adjusted R Square value is 0,036. It means that 3,6% PMA variant can be explained by
variation of fourth independent variables DAK, DP, PAD and DAU. While the rest
(100% - 3,6% = 96,4%) is explained by causes beside the models. While probability
value (Sig.) is 0,002. This value is lower than 0,05 (5%), then the fourth independent
variables DAK, DP, PAD and DAU all together influences significantly upon PMA.
From fourth independent variables DAK, DP, PAD and DAU, individually PAD, DAU
and DAK variables influences significantly upon PMA because probability value (Sig.)
below 0,05 (5%). While DP individually does not have any significant influences upon
PMA
EFFECTS OF INVESTMENT GROWTH UPON ECONOMIC GROWTH
Adjusted R Square value is negative 0,003. Because it is negative then Adjusted R
Square value is assumed zero value. It means that variants PMA and PMD can not
explain variants of PE.
Probability value (Sig.) is 0,608 which is much larger than 0,05% (5%), then
independent variable PMA and PMD equally does not influence significantly upon PE.
From both independent variables, PMA and PMD, individually those variables does not
influence significantly upon PE because they have probability value (Sig.) much above
0,05% (5%).
EFFECTS OF FISCAL DECENTRALITATION AND INVESTMENT GROWTH
UPON ECONOMIC GROWTH
Adjusted R Square value is 0,218. It means that 21,8% variants PE can be explained by
variants of sixth independent variables DAK, DP, PAD, DAU, PMD and PMA. While
the rest (100% - 21,8% = 78,2%) is explained by causes beside the model. Probability
The First International Conference on Entrepreneurship
Book One 143
value (Sig.) is 0,000 which is smaller than 0,05% (5%), therefor sixth independent
variables DAK, BDH, PAD, DAU, PMD and PMA equally significantly influence PE.
Partial test result shows that from sixth independent variables DAK, DP, PAD, DAU,
PMD and PMA, individually PAD and DAU variables influence significantly upon PE
because have probability value (Sig.) below 0,05 (5%). While DP, DAK, PMD, and
PMA individually does not influence significantly upon PE.
CONCLUSION AND SUGGESTION
CONCLUSION
- Independent variables such as DAK, DP, PAD, DAU, PMD and PMA
equally have significant influences upon economic growth.
- From sixth independents variables DAK, DP, PAD, DAU, PMD and
PMA, individually variables PAD and DAU is significantly influencing upon
economic growth. Independents variables PMA and PMD equally does not
significantly influence upon PE.
- Management of balance funds need to be increase so it can contribute
significantly upon economic growth enhancement, which is influenced in
population welfare improvements.
SUGGESTION
- Efficient tax systems and restributions are needed and reduce the cost of tax
collecting or restributions
- Implementation of preparing human resources which can understand the rules
and systems of taxes and regional restributions
- Identification prospective superior regional sector and which becomes regional
core competence
REFERENCES
Dornbusch, Rudiger, 1991. Ekonomi Makro, Rineka Cipta, Jakarta.
Hakim, Abdul, 2004. Ekonomi Pembangunan, Ekonisia, Yogyakarta.
Hakim, Abdul, 2004. Bunga Rampai Manajemen Keuangan Daerah, UPP AMP YKPN,
Yogyakarta.
Imawan, Risnanda. 2005. Desentralisasi, Demokratisasi, dan Pembentukan Good Governance,
dalam Desentralisasi dan Otonomi Daerah: Desentralisasi, Demokratisasi &
Akuntabilitas Pemerintahan Daerah. Editor: Syamsuddin Haris, Jakarta: LIPI Press.
Nanga, Muana, 2005. Makro Ekonomi, Teori, Masalah dan Kebijakan, PT Raja Grafindo
Persada, Jakarta.
Litvack & Seddon, dalam Sadu Wasistiono. 2005. Desentralisasi, Demokratisasi, dan
Pembentukan Good Governance, dalam Desentralisasi dan Otonomi Daerah:
Desentralisasi, Demokratisasi & Akuntabilitas Pemerintahan Daerah. Editor:
Syamsuddin Haris, Jakarta: LIPI Press.
The First International Conference on Entrepreneurship
Book One 144
Rudini, 1995. Otonomi Daerah sebagai Otonomi Nyata dalam Perspektif Ekonomi dan Politik,
dalam Otonomi Daerah: Peluang dan Tantangan. Disusun oleh Tim Suara Pembaruan,
Jakarta: Pustaka Sinar Harapan.
Sadu Wasistiono, 2005. Desentralisasi, Demokratisasi, dan Pembentukan Good Governance,
dalam Desentralisasi dan Otonomi Daerah: Desentralisasi, Demokratisasi &
Akuntabilitas Pemerintah Daerah, Editor: Syamsuddin Haris, LIPI Press, Jakarta.
Samuelson, Paul A. dan William D. Nordhaus, 2004. Ilmu Makro Ekonomi, Edisi ketujuh belas,
PT. Media Global Edukasi, Jakarta.
Sukirno, Sadono, 2005. Makro Ekonomi Modern, PT Raja Grafindo Persada, Jakarta.
Undang-undang Republik Indonesia Nomor 32 Tahun 004 tentang Pemerintahan Daerah.
Undang-undang Republik Indonesia Nomor 33 Tahun 2004 tentang Perimbangan Keuangan
antara Pemerintah Pusat dan Pemerintah Daerah.
Waluyono, Joko. 2007. Dampak Desentralisasi Fiskal terhadap Pertumbuhan Ekonomi dan
Ketimpangan Pendapatan antar-Daerah di Indonesia. Parallel Session IA: Fiscal
Decentralization, Kampus UI-Depok.
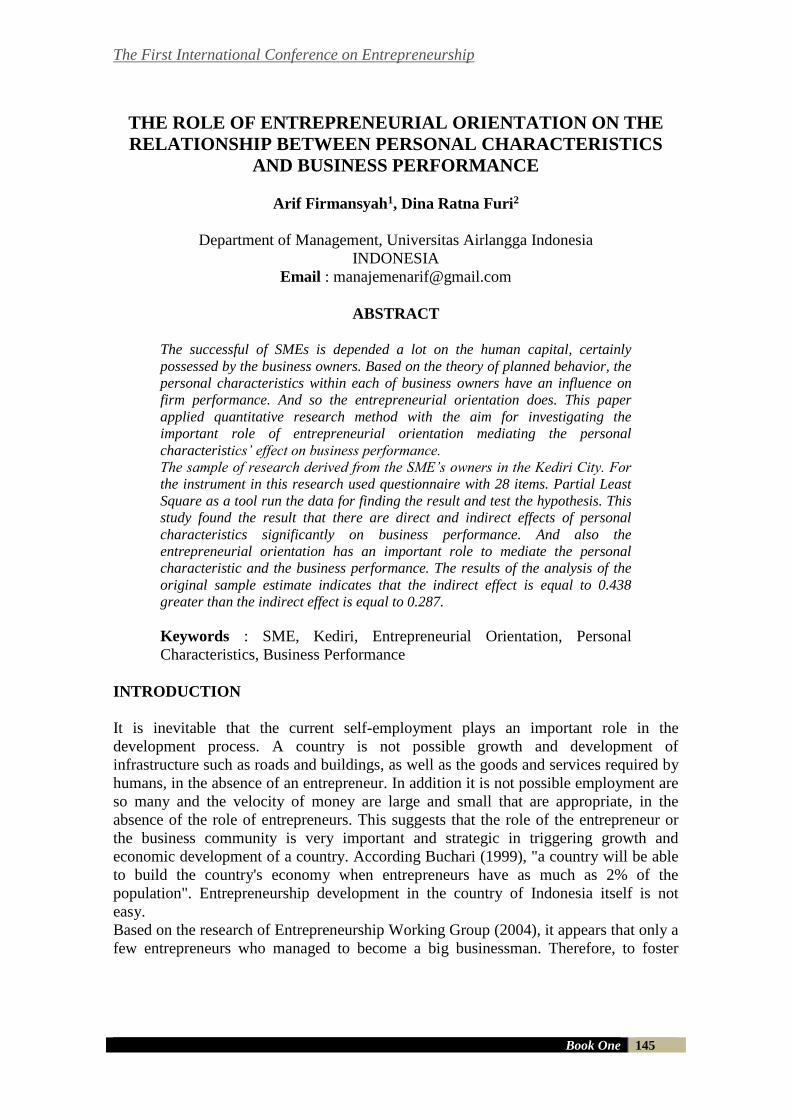
The First International Conference on Entrepreneurship
Book One 145
THE ROLE OF ENTREPRENEURIAL ORIENTATION ON THE
RELATIONSHIP BETWEEN PERSONAL CHARACTERISTICS
AND BUSINESS PERFORMANCE
Arif Firmansyah1, Dina Ratna Furi2
Department of Management, Universitas Airlangga Indonesia
INDONESIA
Email : [email protected]
ABSTRACT
The successful of SMEs is depended a lot on the human capital, certainly
possessed by the business owners. Based on the theory of planned behavior, the
personal characteristics within each of business owners have an influence on
firm performance. And so the entrepreneurial orientation does. This paper
applied quantitative research method with the aim for investigating the
important role of entrepreneurial orientation mediating the personal
characteristics’ effect on business performance.
The sample of research derived from the SME’s owners in the Kediri City. For
the instrument in this research used questionnaire with 28 items. Partial Least
Square as a tool run the data for finding the result and test the hypothesis. This
study found the result that there are direct and indirect effects of personal
characteristics significantly on business performance. And also the
entrepreneurial orientation has an important role to mediate the personal
characteristic and the business performance. The results of the analysis of the
original sample estimate indicates that the indirect effect is equal to 0.438
greater than the indirect effect is equal to 0.287.
Keywords : SME, Kediri, Entrepreneurial Orientation, Personal
Characteristics, Business Performance
INTRODUCTION
It is inevitable that the current self-employment plays an important role in the
development process. A country is not possible growth and development of
infrastructure such as roads and buildings, as well as the goods and services required by
humans, in the absence of an entrepreneur. In addition it is not possible employment are
so many and the velocity of money are large and small that are appropriate, in the
absence of the role of entrepreneurs. This suggests that the role of the entrepreneur or
the business community is very important and strategic in triggering growth and
economic development of a country. According Buchari (1999), "a country will be able
to build the country's economy when entrepreneurs have as much as 2% of the
population". Entrepreneurship development in the country of Indonesia itself is not
easy.
Based on the research of Entrepreneurship Working Group (2004), it appears that only a
few entrepreneurs who managed to become a big businessman. Therefore, to foster
The First International Conference on Entrepreneurship
Book One 146
entrepreneurial behavior in the society, especially the job seekers will be very important
and strategic for the development of human resources in Indonesia are qualified, have
foresight in creating their own creative business opportunities such as opening a
business, ranging from the food business, garment, and various other business. This
pioneering effort is included in the Micro, Small and Medium Enterprises (SMEs).
Micro, Small and Medium Enterprises (SMEs) have a strategic role in national
economic development, because in addition to a role in economic growth and
employment also play a role in the distribution of development outcomes. In the
economic crisis that occurred in this country since some time ago, where many large-
scale enterprises stagnated even stop its activity, the Micro, Small and Medium
Enterprises (SMEs) proved to be more resilient in the face of the crisis. Given the
experience that has been faced by Indonesia during the crisis, would not be excessive if
the private sector is focused on the development of SMEs, especially business unit is
often overlooked simply because their production on a small scale and have not been
able to compete with other business units. SME business is itself a majority in
Indonesia. To create jobs and help the overall economic growth, more emphasis on the
study of small and micro enterprises, in particular, to find a growth-oriented
entrepreneurs. The term "growth", "success", and "performance" are very closely related
and sometimes even used as synonyms in entrepreneurship research. Traditionally, all
of the company's performance is measured by financial measures, such as sales
turnover, or by increasing the number of employees. But so far, the company's
performance measurement tends to be
more focused on the financial side alone. This tendency adversely affects the company's
business continuity. Because the result of performance measurement is likely to be
partially obscure even hide the fact the company's ability to achieve economic value in
the future. Many corporate leaders considered successful if it managed to achieve a
certain financial level. Therefore, many companies are trying to increase profits by any
means. This can lead to companies trapped in the short-term orientation and ignore the
long-term business viability of the company.
Application performance measurement in SMEs is less, whereas SMEs in Indonesia is
very significant in number and have a relatively large degree of contribution in the
Indonesian economy. In general, to date in Indonesia is still a lot of SMEs are doing
business without having a vision, mission, and a clear management strategy. Even some
of the SMEs have never done an assessment of the performance of its business. So
despite resistance to economic shocks proved robust, but its business competitiveness in
the domestic and international markets is low. These conditions are not favorable for the
development efforts of SMEs and SMEs realize the pillars of a strong economy to
support economic growth.
Under that condition, is necessary to the review of the business strategy of SMEs within
the framework of the development of SME-focused performance improvement of
competitiveness in the future. The success of an SME depends on its human capital,
mainly owned by the SME entrepreneurs. When an entrepreneur starts a business, he
brings a unique package that is the human capital to do business as part of the resources
for the company. Penrose (1959) argues that "human capital, such as business skills,
experience, and other personal characteristics are a key resource companies". Own
personal characteristics have a large direct impact on the performance of the company
The First International Conference on Entrepreneurship
Book One 147
(Switzerland and Huang, 2007; Adams et al., 2005), and indirect effects on performance
mediated by speed of decision making, types of decisions, and strategy formulation
(Karami et al. , 2006).
Every entrepreneur has a goal each in its efforts to meet the desired objectives it
requires a strong motivation to be performing well and will have an impact on the
desired goal. There would be no motivation if not felt the need and satisfaction is the
motivation that has grown into the motor and the drive to achieve fulfillment. The
experts suggested that a person has an interest in entrepreneurship because of the
existence of a motive, namely the achievement motive. Achievement motive is a social
value that emphasizes the desire to achieve the best results in order to gain personal
satisfaction. For people who have the need for achievement (n-Ach) is high, money is
not the motivation triggers, but rather act as a benchmark achievement of targets. In
addition to need for achievement, there is also an internal locus of control, which is
owned by a businessman. Lefcourt in Smet (1994) states that "internal locus of control
(ILOC) is the degree of the individual in view of the events in his life as a consequence
of his actions, so it can be controlled".
If put in the context of the concept ILOC entrepreneurs in a competitive business
environment, it is conceivable that an entrepreneur with a strong ILOC would believe
that entrepreneurs can make something that happened, and that the success or failure of
a business is the result of the entrepreneur's own actions. Managers and entrepreneurs
with high ILOC also tend to be more innovative (Miller and Toulouse, 1986) and
effective (Govindarajan, 1989).
Besides, there is also a need for cognition (NFC). Entrepreneurs with higher levels of
NFC has a positive attitude towards stimuli that require complex thinking (Cacioppo et
al., 1986). Moreover, entrepreneurs with higher levels of NFC also supports extensive
information search, whereas the low-level NFC prefer existing resources and are more
likely to act based on perceptions and feelings (Mourali et al., 2005).
This study investigated a sample of personal characteristics which consisted of need for
achievement, internal locus of control, and need for cognition with the organization's
strategic choice-oriented entrepreneurship (entrepreneurial orientation) to achieve the
business performance of SMEs. It is important that is often overlooked in any
discussion of SMEs, which are expected entrepreneurial orientation adopted by the
SME entrepreneurs. Entrepreneurial orientation in question here, among others
inovativeness, pro-activeness, and risk taking. Rural atmosphere into the background of
SMEs often have a stake also in the form of performance. For example, in the area of
SMEs working rhythm running with relaxed and less active so often the cause of the
loss of the opportunities that exist.
The research was conducted in the municipality of Kediri, East Java, where the
municipal government of Kediri is an integral part of the Republic of Indonesia.
Therefore, policies and programs of economic development in order to strengthen the
foundation populist economic development with emphasis on the priority scale. As is
known that since the onset of the economic crisis of 1998 caused a decline in economic
growth and rising inflation communities resulting in lower quality of life, increasing the
number of poor and the unemployed.
The presence of micro, small, and medium is in the municipality of Kediri is a strategic
industry that is an opportunity for improvement of the regional economy. Micro, small,
The First International Conference on Entrepreneurship
Book One 148
and medium enterprises (SMEs) that can absorb labor in addition to very many in
number, which means reducing the unemployment rate, are also carriers of life for the
economy.
Basic program of economic development in the region itself Kediri is increasing with
the growing economy of the people's business climate conducive to prioritize SMEs and
cooperatives as authorized capital to economic growth and drive private sector
nationwide and abroad as a financier.
THE LITERATURE REVIEW
The Personal Characteristics
There is a management literature that seeks to identify the specific rules of personal
characteristics desirable for entrepreneurs in starting new businesses and run the
company effectively. Most of the managerial characteristics have been studied in the
management literature. For example, previous research has identified that achievement
motivation has positive influence on the speed of an entrepreneur in making decisions
(Kauer et al., 2007), risk-taking attitude affect strategic decision of an entrepreneur in
forming alliances with other businesses (Pansiri, 2007). Entrepreneurs with higher
education levels are more likely to develop a formal strategic plan (Karami et al., 2006),
and intuition lead employers prefer prospector strategy (Gallen, 2006).
Entrepreneurs with internal locus of control tend to be more innovative (Miller and
Toulouse, 1986) and effective (Govindarajan, 1989). Previous research has considered
the achievement motivation and internal locus of control as an important characteristic
of a successful entrepreneur (Littenen, 2000; Hansemark, 1998). According to Zhang
and Bruning (2011), there are three personal characteristics possessed by entrepreneurs,
among others, need for achievement (n-Ach), internal locus of control (ILOC), and need
for cognition (NFC).
The Need For Achievement
Motivation according to Mc Clelland cited by Nisfiannoor (2002) is also often referred
to as motifs. Motifs are obtained in daily life for the learning outcomes and
socialization, and it can also be said that the motive arises because of the culture and its
shape is a natural hierarchy or not. One of the motivations that influence human
behavior is achievement motivation. Achievement motivation was first proposed by
David Mc Clelland based on research conducted in India. Mc Clelland found that
entrepreneurs, scientists, and professionals have this level of achievement motivation
above average. An entrepreneur is not motivated solely because they want to achieve a
profit, but because he has a strong desire to excel.
According to Mc Clelland, quoted by Westrek (1991), "if a strong need to be in a
person, then the effect is motivated to use the behavior that leads to satisfying those
needs". If someone who has a need for achievement that high, then this requirement will
encourage the person to set challenging goals, working hard to achieve that goal by
using the skills and abilities necessary to achieve it. Achievement motivation can be
defined as an impulse in a person to do a particular task or activity or task as well as
possible in order to achieve a commendable achievement by the predicate. This is in
accordance with the opinion Jhonson (1984) who argued that "Achievement motive is
impetus to do well relative to some standard of excellence ". Gunarsa (1995) cited
The First International Conference on Entrepreneurship
Book One 149
Ninawati (2002) reveals achievement motivation is "the tendency to achieve success
and obtain what is desired final destination".
The desire for success is considered driving as revealed by Mc Clelland and Atkinson in
Slavin (1997), achievement motivation is "a general tendency to strive to achieve
success and goal oriented, activity success or failure". Mc Clelland (1987) cited
Nisfiannoor (2002) states that achievement motivation is "motive which encourages
individuals to achieve success and aim to succeed in competition with some measure of
excellence.
The size of these advantages can be seen from the achievements of others, but also can
be seen from his own achievement in the previous period ". Individuals who have high
achievement boost will differ from others in terms of the individual's strong desire to do
things better, looking for an opportunity where the individual has a personal
responsibility in finding answers to the problem and did not like the success obtained by
chance. From the explanation above it can be concluded that the achievement motive
urge or need to do something better or more efficiently than previously undertaken and
the results achieved are trying to outperform others, and more oriented to the work or
tasks performed to achieve success. There are four items to measure the need for
achievement (Wu et al., 2007), among others:
1. The necessity for having a challenge
2. The necessity to continue studying
3. The need for personal development
4. The requirement to prove that he can be successful
The Internal Locus of Control
Definition of locus of control is the degree of an individual's belief about the source of a
determinant or events that occur in his life, which is distinguished by an external locus
of control and internal locus of control (Robbins, 2003). Individuals who think that
success and failure is due to the surrounding environment, it can be said that people
have an external locus of control. While individuals who have the confidence that he is
able to carry out and complete the task well as on his own then that person can be said
to have an internal locus of control. This is because individuals who have an internal
locus of control perceive themselves to have excellent ability and have an optimistic
attitude that is high in completing the task. Therefore, an internal locus of control are
preferred to be owned by an entrepreneur in running a business dibandikan external
locus of control.
In individuals who have an internal locus of control (ILOC), the capability and the
business looked dominant. If it is assumed that the ability factors are considered fixed
and can not be changed, then the other factors that can be manipulated is a business.
Therefore, if an individual with ILOC failure, then the individual will blame himself for
lack of effort. Conversely if you have success, individuals with ILOC will feel proud of
the results of his efforts.
According to Lefcourt in Smet (1994) states that an internal locus of control is "the
degree of the individual in view of the events in his life as a consequence of his actions,
so it can be controlled". Individuals can be said to have an internal locus of control if
someone has a belief that all the events in his life influenced by his own actions or
characteristics that tend to remain unchanged or not.
The First International Conference on Entrepreneurship
Book One 150
Meanwhile, according to Crider (1983), internal locus of control is considered as "the
personality of the individual and associated with the control that comes from within
itself". Individuals who have an internal locus of control will tend to show as much as
possible existing capabilities in him, and if you have a failure, that individual will blame
himself. So in other words, the subject-oriented internal locus of control has the
following characteristics (Crider, 1983):
1.Having a high initiative;
2.Hardworking;
3.Always find solutions, what it does and what caused the problem occurs and so on;
4.Always try to think as effectively as possible because of the belief that one's success is
based on the efforts and actions of oneself
5.Individuals were classified as internally oriented locus of control has always had the
perception that businesses are doing to be as good as possible so that the goal can be
achieved
The Need For Cognition
Contemporary research on individual differences starting from the suggestions proposed
by Cacioppo and Petty (1982) that "there are individual differences in the tendency of
people to get involved and enjoy the cognitive effort". Individuals who have a low
intrinsic motivation to engage in cognitive effort characterized as chronic cognitive
misers, whereas individuals who have a high intrinsic motivation to train the intellect
regarded as a chronic owned cognizers.
Individual differences is then understood as the origin of past experience, supported by
historical events and behaviors that are accessed in real experience at this time, and the
effect on the acquisition or processing of information relevant to a problem. Cacioppo
and Petty (1982) states that "the factor analysis studies showed that the many
differences between individuals of the tendency of many people to get involved and
enjoy the cognitive effort that can be represented by a single factor called the need for
cogniton".
Existing research related to need for cognition on personality variables or other
demographic. The study tested the convergent and discriminant validity to establish the
need to think and to provide information about the location of this requirement in the
landscape of the personality and individual differences. Many studies on the need for
thinking imposed on the hypothesis that individuals differ in terms of needs that will
think different in terms of the individual's tendency to seek detailed information about
the individual's own life, engaging in cognitive activities effectively, and enjoy more or
less to the effective cognitive problems. Need for cognition which has been
conceptualized by Cacioppo and Petty (1982) at the macro level to represent the
differences between individuals in the general tendency to engage and enjoy cognitive
efforts are effectively not as a chronic tendency toward processing the information in a
particular domain or as individual differences in cognitive complexity. According to
Cacioppo and Petty (1982) quoted Zhang and Bruning (2011) that "a need to think
(NFC) is a tendency to engage and enjoy a thought". Individuindividu
psychology literature indicates that naturally differ in the level of owned NFC
(Cacioppo et al., 1996). Individuals with higher levels of NFC has a positive attitude
towards complex stimuli that require some thought (Cacioppo et al., 1986). and
The First International Conference on Entrepreneurship
Book One 151
individuals with higher levels of NFC also supports extensive information search,
whereas individuals with lower levels of NFC prefer existing resources and are more
likely to act based on perception and feeling special (Mourali et al., 2005). Managers
and entrepreneurs with higher NFC would be more successful in adaptive decision
making (Levin et al., 2000).
Research on the need for cognition suggests that this characteristic is a predictive
manner in which individuals deal with tasks and social information (Cacioppo and
Petty, 1982). A need for cognition scale has been revised to increase its efficiency as an
assessment instrument. Cacioppo et al. (1984) was to develop a scale to measure the
NFC version of the 18-item version, but the recent study reported that the need for
cognition (NFC) consists of four major components, namely, enjoying cognitive
stimulation, preference for complexity, cognitive effort commitment, and a desire to
understand (Lord and Putrevu 2006 in Zhang and Bruning, 2011).
The Entrepreneurial Orientation
Entrepreneurship is touted as a pioneer company to achieve sustainable economic
growth and high competitiveness. According Suryanita (2006), "entrepreneurship is a
creative and innovative capabilities that form the basis of, tips, and resources to find
opportunities for success". Entrepreneurship is known as a new approach in the renewal
of the company's performance. This certainly responded positively by companies began
trying to rise from the economic downturn caused by the prolonged crisis. The shape of
the application on entrepreneurial attitudes can be indicated with an entrepreneurial
orientation with an indication of the ability of innovation, pro-activeness, and ability to
take risks (Looy et al., 2003 in Suryanita, 2006).
Most empirical studies of entrepreneurial orientation has leveraged instruments
developed by Miller (1983) and extended by Covin and Slevin (1986, 1988, 1989).
Entrepreneurial Orientation (EO) related to the processes, practices, and decision-
making activities that lead to new ventures (Lumpkin and Dess, 1996). EO involves not
only intentions but also acts a key player in a dynamic generative process aimed at the
creation of new businesses. Covin and Slevin (1991) argues that "in addition to
affecting the creation of new businesses, the EO also affect the performance of an
existing company". Empirical evidence shows that firms with high EO are much more
likely to innovate (Manimala, 1992) and achieve better performance of the organization
as a whole (Smart and Conant, 1994).
The positive influence of EO on performance is very broad, and the strength of this
effect increases over time. There are three approaches to measuring the entrepreneurial
orientation (Lyon, Lumpkin, and Dess, 2000) that managerial perceptions, firm
behavior, and resource allocation. In this study, the approach used is the managerial
perception. Employers do not consider themselves to be risk takers, but often view
business situation more positively than non-entrepreneurs. Different orientation with
entrepreneurial entrepreneurship itself. Entrepreneurship refers to the entrants or new
players in the business. While the entrepreneurial orientation is more directed at the
process of how entrepreneurship is run that includes the methods, practices, and
decision-making style to act entrepreneurially.
According Quince and Whittaker (2003), the fundamental dimensions that characterize
the entrepreneurial orientation (entrepreneurial orientation), among others, the
The First International Conference on Entrepreneurship
Book One 152
innovation in question (inovativeness), pro-activeness (pro-activeness), and exposure to
risk (openness towards risk) (Miller, 1983; Covin and Slevin, 1986, 1989).
The Inovativeness
Innovativeness related to support and encourage new ideas, experimentation, and
creativity that are likely to generate new products, processes or similar service (Miller
and Friesen, 1983). Creative innovation plays a major role in an entrepreneurial.
Although enterprises operate in an environment that supports or does not support the
growth of ideas or new ideas, experimentation, new solutions, or the creative process,
but the entrepreneur still require innovative attitude as a very important dimension to
run its business. Creative innovative high culture will provide greater opportunities in
the development of new technologies, new products, new services, or new processes in
the society concerned. The indicators used to assess the innovation consists of the level
of involvement in R & D, the level of innovation, and workforce qualifications.
The Pro-activeness
Pro-activeness concentrate on the first-mover and other actions aimed at finding,
securing, and protecting market share, as well as the future perspectives are reflected in
the actions taken in anticipation of future
demand (Miller, 1983; Covin and Slevin, 1989 ; Lumpkin and Dess, 2001). Culture that
supports a proactive stance is characterized by the presence of a support for
entrepreneurial activity for anticipatory action against all odds market opportunities and
participation in the old or new.
The proactive individual who will do everything to realize the concept and the benefits
of excellence as the first to seize every opportunity. Pro-activeness indicator used here
consists of collaboration; incidence and magnitude of innovation, activities designed to
protect intellectual property and market structure.
The Risk Taking
Measuring the extent to which individuals differ in their willingness to take risks. And
the distinguishing factor is the way it is calculated risk (Norton and Moore, 2002).
Matters relating to entrepreneurship is the desire and courage in taking risks. The
individual who is ready to accept uncertainty and risk is often regarded as a person who
is able to work alone, in this study is a businessman. The attitude of risk-taking is an
important component of entrepreneurial orientation. Cultural environment that can spur
the bold attitude in the face of the risk of giving birth to more and more new
entrepreneurs are ongoing. This study focused on behaviors that may indicate a
willingness to take risks, which is looking for venture capital, and two indicators of
willingness to invest is certain, namely, the level of expenditure on R & D and
investments in off-job training.
The Business Performance
Whether or not the views of the performance of SMEs. Each SMEs want the best
performance that can be generated from its activities. This study also raised the
performance of SMEs as the ultimate goal to be achieved by the personal characteristics
of entrepreneurs consisting of need for achievement, internal locus of control, and need
for cognition, the strategic choice entrepreneurial oriented organization (entrepreneurial
orientation).
Business performance can be interpreted as the result or the performance obtained by an
organization. Performance of the company is the result of hard work of managers,
The First International Conference on Entrepreneurship
Book One 153
companies usually have a target explicitly given to the manager to then be evaluated
results of achievements as a form of performance (Merchant et al., 2000 in Moer, 2001).
Target referenced will impact on managerial company. The more difficult targets set for
the organization, the greater the effort required to achieve it. Conceptually there is no
exact definition of the performance, but there are some models that can be used for a
discussion of organizational performance. More emphasis on performance measurement
standards set by the organization. Measurement of performance has been generally
accepted is to use the movement parameters of the financial statements or the company's
stock price. Business performance is the result of the operation of the organization as a
whole, however, the right to assess the performance of the company is highly dependent
on the condition of the company concerned and the purpose of analysis.
Business performance is essentially the achievements of a business organization that
can be seen from the results of its performance, the results of this performance is not
quite right when viewed from one dimension only. According to Day and Wensley
(1988) and Jaworski and Kohli (1993), "the researchers agreed that business
performance measurement is not just simply use a single measure". According to
Walker and Ruekert (1987) cited Sutianti (2006) the performance of the company has
three dimensions
The Effectivity
Effectiveness associated with the comparison condition and the level of success of the
company. The effectiveness of the company can be judged from the rate of sales
growth, market share, customer retention, satisfaction and the level of customer
complaints.
The Efficiency
Efficiency associated with the company's ability to manage input and output ratio, labor
costs, the level of product failure, and the level of use of the engine company. This
assessment can be measured by using the rate of return on investment and profit before
tax.
The Adaptability
The Adaptability related to the company's ability to respond to changes that occur in the
environment. The Adaptability assessment can be done by looking at the ratio of the
volume of sales and sales of new products. Size of business performance that is often
used is profitability. Profitability shows the ability of the company makes a profit in
relation to sales, total assets, and the capital itself. Thus, profitability is the net result of
a series of policies and decisions. The higher the profitability, the better the
performance of the company.
In a study by Jaworski and Kohli (1993) in Chang (1998), measurement of business
performance is measured by the overall performance of the organization in the past year
and overall organizational performance
compared to its main competitors. While the research Narver and Slater (2000),
business performance is measured by profitability compared to the set target.
H1 : The Personal Characteristics Effect on Business Performance
The success of small businesses rely heavily on human capital, which is owned by the
entrepreneur (Jones et al., 2007). Penrose (1959) argues that "personal characteristics
The First International Conference on Entrepreneurship
Book One 154
are a key resource companies". Own personal characteristics have a large direct impact
on the performance of the company (Switzerland and Huang, 2007; Adam et al., 2005).
Zhang and Bruning (2011) also stated that "the personal characteristics of an
entrepreneur plays a very important role in the performance of the company, which
considers human resources, including business skills, experience, and personal
characteristics, organizational resources as an important strategy, and have a positive
impact on performance of the company ".
Many studies investigating the characteristics of entrepreneurship by using the theory of
Hambrick and Mason (1984) who considers that the company is the result of reflection
of the entrepreneur. In addition, Smith et al. (1996) have also revealed that "the
company's performance is largely influenced by the personal characteristics of
entrepreneurs".
H2 : The Entrepreneurial Orientation Effects on Business Performance
Entrepreneurial orientation with regard to the processes, practices, and decision-making
activities that lead to new ventures (Lumpkin and Dess, 1996). Meanwhile, according to
Covin and Slevin (1991), "entrepreneurial orientation also affect the performance of an
existing company". Empirical evidence shows that firms with high entrepreneurial
orientation is far more likely to achieve overall organizational performance (Smart and
Conant, 1994).
Zhang and Bruning (2011) states that "a businessman who adopt a strategic orientation
in the form of entrepreneurial orientation (entrepreneurial orientation) tend to be
positively correlated to the performance of the company". Several other empirical
studies found support for the impact or a positive impact of entrepreneurial orientation
on business performance (Wiklund, 1999; Zahra and Covin, 1995 in Wiklund and
Stepherd, 2005). Similarly, the study conducted by Covin and Slevin (1991). In
addition, the effect of entrepreneurial orientation on business performance is also
supported by the results of research conducted by Tan (1996) which states that
"proactive strategies, innovative, and risk taking in Zahra (1995), Zahra and Colvin
(1998), and Dess, Lumpkin, and Covin (1997) is part of the entrepreneurial orientation
dimensions, is positively related to the performance of the company ".
H3 : The Personal Characteristics Effect on Business Performance through
Entrepreneurial Orientation
Results of research conducted by Zhang and Bruning showed that "personal
charateristics positive effect on business performance through entrepreneurial
orientation". When an employer has a need for achievement, internal locus of control,
and need for cognition are likely to adopt an entrepreneurial orientation to give their
customers the best products and services through creativity and innovation, where it will
impact positively on the performance of the company. Lumpkin and Dess (1996) also
has declared that "there is a positive relationship between need for achievement and
entrepreneurial orientation". As explained in the theory of entrepreneurial orientation
that need for achievement is part of the personal characteristics indicator.
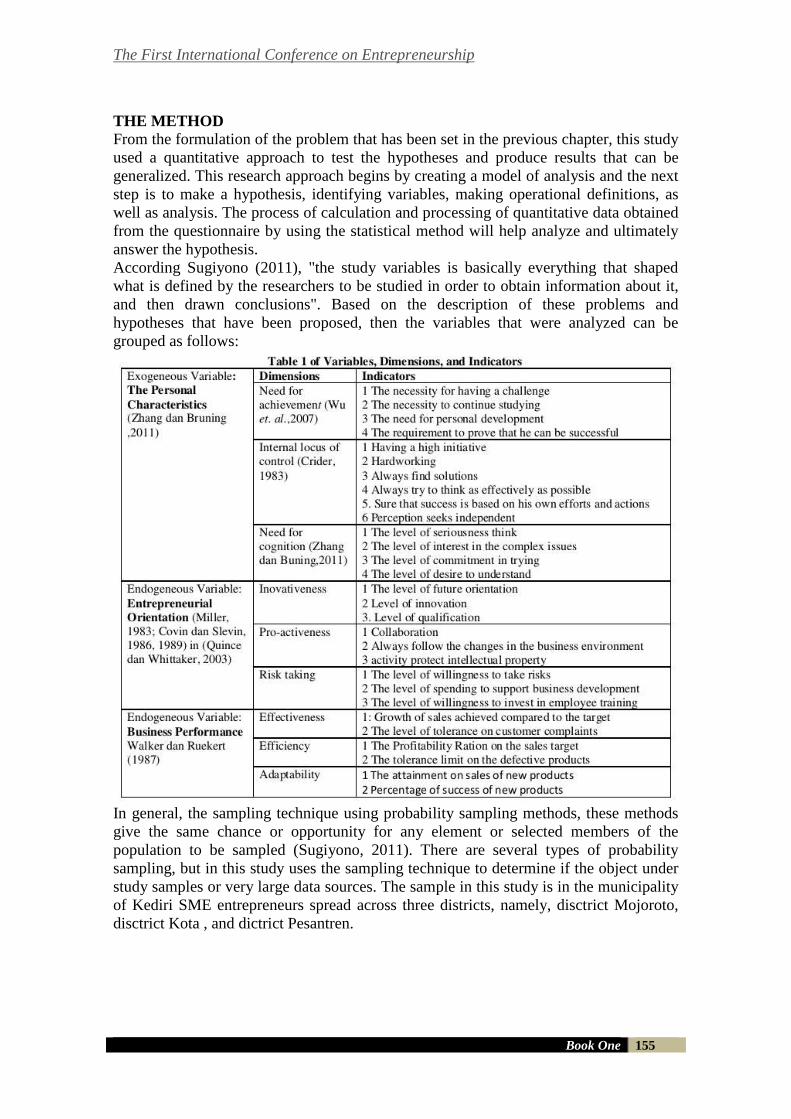
The First International Conference on Entrepreneurship
Book One 155
THE METHOD
From the formulation of the problem that has been set in the previous chapter, this study
used a quantitative approach to test the hypotheses and produce results that can be
generalized. This research approach begins by creating a model of analysis and the next
step is to make a hypothesis, identifying variables, making operational definitions, as
well as analysis. The process of calculation and processing of quantitative data obtained
from the questionnaire by using the statistical method will help analyze and ultimately
answer the hypothesis.
According Sugiyono (2011), "the study variables is basically everything that shaped
what is defined by the researchers to be studied in order to obtain information about it,
and then drawn conclusions". Based on the description of these problems and
hypotheses that have been proposed, then the variables that were analyzed can be
grouped as follows:
In general, the sampling technique using probability sampling methods, these methods
give the same chance or opportunity for any element or selected members of the
population to be sampled (Sugiyono, 2011). There are several types of probability
sampling, but in this study uses the sampling technique to determine if the object under
study samples or very large data sources. The sample in this study is in the municipality
of Kediri SME entrepreneurs spread across three districts, namely, disctrict Mojoroto,
disctrict Kota , and dictrict Pesantren.
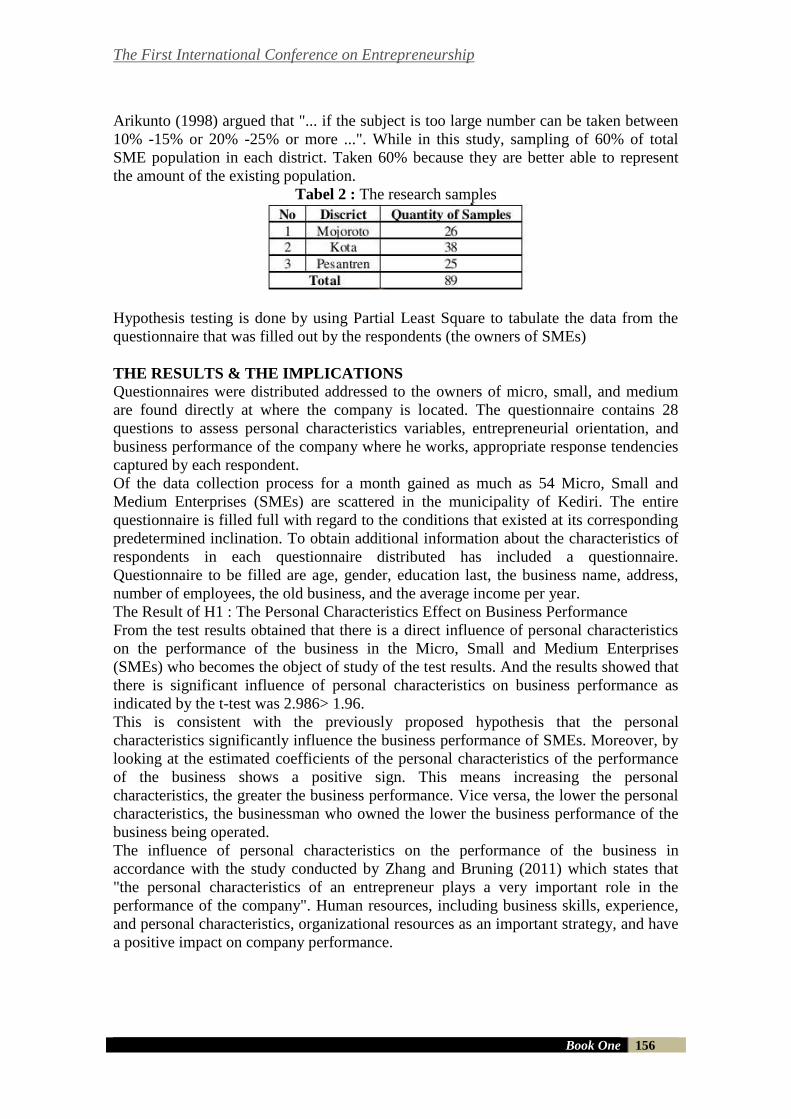
The First International Conference on Entrepreneurship
Book One 156
Arikunto (1998) argued that "... if the subject is too large number can be taken between
10% -15% or 20% -25% or more ...". While in this study, sampling of 60% of total
SME population in each district. Taken 60% because they are better able to represent
the amount of the existing population.
Tabel 2 : The research samples
Hypothesis testing is done by using Partial Least Square to tabulate the data from the
questionnaire that was filled out by the respondents (the owners of SMEs)
THE RESULTS & THE IMPLICATIONS
Questionnaires were distributed addressed to the owners of micro, small, and medium
are found directly at where the company is located. The questionnaire contains 28
questions to assess personal characteristics variables, entrepreneurial orientation, and
business performance of the company where he works, appropriate response tendencies
captured by each respondent.
Of the data collection process for a month gained as much as 54 Micro, Small and
Medium Enterprises (SMEs) are scattered in the municipality of Kediri. The entire
questionnaire is filled full with regard to the conditions that existed at its corresponding
predetermined inclination. To obtain additional information about the characteristics of
respondents in each questionnaire distributed has included a questionnaire.
Questionnaire to be filled are age, gender, education last, the business name, address,
number of employees, the old business, and the average income per year.
The Result of H1 : The Personal Characteristics Effect on Business Performance
From the test results obtained that there is a direct influence of personal characteristics
on the performance of the business in the Micro, Small and Medium Enterprises
(SMEs) who becomes the object of study of the test results. And the results showed that
there is significant influence of personal characteristics on business performance as
indicated by the t-test was 2.986> 1.96.
This is consistent with the previously proposed hypothesis that the personal
characteristics significantly influence the business performance of SMEs. Moreover, by
looking at the estimated coefficients of the personal characteristics of the performance
of the business shows a positive sign. This means increasing the personal
characteristics, the greater the business performance. Vice versa, the lower the personal
characteristics, the businessman who owned the lower the business performance of the
business being operated.
The influence of personal characteristics on the performance of the business in
accordance with the study conducted by Zhang and Bruning (2011) which states that
"the personal characteristics of an entrepreneur plays a very important role in the
performance of the company". Human resources, including business skills, experience,
and personal characteristics, organizational resources as an important strategy, and have
a positive impact on company performance.
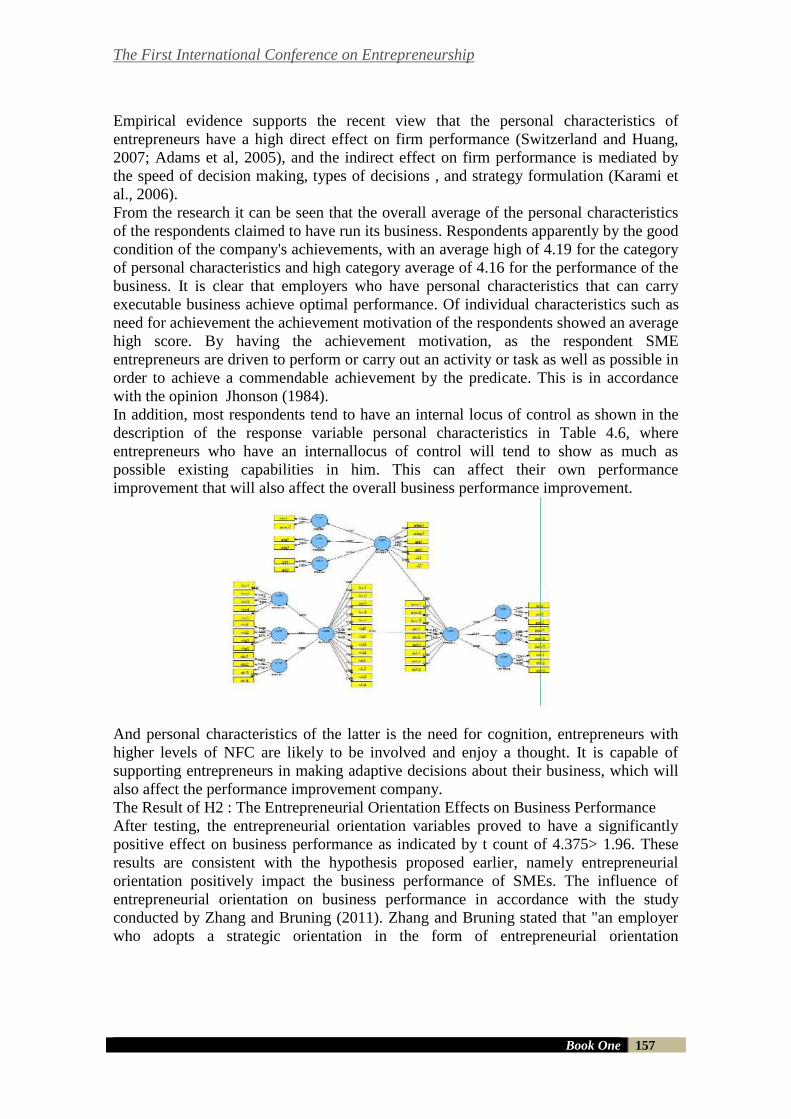
The First International Conference on Entrepreneurship
Book One 157
Empirical evidence supports the recent view that the personal characteristics of
entrepreneurs have a high direct effect on firm performance (Switzerland and Huang,
2007; Adams et al, 2005), and the indirect effect on firm performance is mediated by
the speed of decision making, types of decisions , and strategy formulation (Karami et
al., 2006).
From the research it can be seen that the overall average of the personal characteristics
of the respondents claimed to have run its business. Respondents apparently by the good
condition of the company's achievements, with an average high of 4.19 for the category
of personal characteristics and high category average of 4.16 for the performance of the
business. It is clear that employers who have personal characteristics that can carry
executable business achieve optimal performance. Of individual characteristics such as
need for achievement the achievement motivation of the respondents showed an average
high score. By having the achievement motivation, as the respondent SME
entrepreneurs are driven to perform or carry out an activity or task as well as possible in
order to achieve a commendable achievement by the predicate. This is in accordance
with the opinion Jhonson (1984).
In addition, most respondents tend to have an internal locus of control as shown in the
description of the response variable personal characteristics in Table 4.6, where
entrepreneurs who have an internallocus of control will tend to show as much as
possible existing capabilities in him. This can affect their own performance
improvement that will also affect the overall business performance improvement.
And personal characteristics of the latter is the need for cognition, entrepreneurs with
higher levels of NFC are likely to be involved and enjoy a thought. It is capable of
supporting entrepreneurs in making adaptive decisions about their business, which will
also affect the performance improvement company.
The Result of H2 : The Entrepreneurial Orientation Effects on Business Performance
After testing, the entrepreneurial orientation variables proved to have a significantly
positive effect on business performance as indicated by t count of 4.375> 1.96. These
results are consistent with the hypothesis proposed earlier, namely entrepreneurial
orientation positively impact the business performance of SMEs. The influence of
entrepreneurial orientation on business performance in accordance with the study
conducted by Zhang and Bruning (2011). Zhang and Bruning stated that "an employer
who adopts a strategic orientation in the form of entrepreneurial orientation
The First International Conference on Entrepreneurship
Book One 158
(entrepreneurial orientation) tend to be positively correlated to the performance of the
company".
Several other empirical studies found support for the impact or a positive impact of
entrepreneurial orientation on business performance (Wiklund, 1999; Zahra and Covin,
1995 in Wiklund and Stepherd, 2005). Similarly, the study conducted by Covin and
Slevin (1991) which states that "entrepreneurial orientation affects the performance of
an existing company". Empirical evidence shows that firms with high entrepreneurial
orientation is far more likely to achieve better performance of the organization as a
whole (Smart and Conant, 1994). The positive influence of entrepreneurial orientation
on performance is very broad, and the strength of this effect increases over time. These
results are also consistent with the study by Tan (1996) which states that a proactive
strategy, innovative, and risk taking in Zahra (1995), Zahra and Colvin (1998), and
Dess, Lumpkin, and Covin (1997) is the dimension of entrepreneurial orientation is
positively related to firm performance.
Value entrepreneurial orientation or high entrepreneurial orientation will lead to an
increase in the entrepreneurial spirit and the ability to compete globally (Nasution et al.,
2007). One of the fundamental dimensions that characterize the entrepreneurial
orientation (entrepreneurial orientation) is an innovative attitude. Where the innovative
attitude leads to the entrepreneurial spirit in the form of creativity and innovation.
Creativity and innovation is a critical success factor in the business world. Furthermore,
proactive attitude that leads to the entrepreneurial spirit of planning. Lack of planning
and a proactive attitude will ensure success and excellence in many aspects. And the
latter is a fundamental dimension of risk taking. Courageous in the face of calculated
risks is careful and intelligent attitude to compete and allow the company to achieve
better performance.
The Result of H3 : The Personal Characteristics Effect on Business Performance
Through
Entrepreneurial Orientation After testing, the personal characteristics variables shown to have a significantly
positive effect on entrepreneurial orientation as indicated by the t-test was 4.686. And
further the entrepreneurial orientation has significant influence on the performance of
the business with t-test was 4.375. The results in this study are consistent with studies
previously conducted by Zhang and Bruning (2011) which shows that personal
characteristics positive effect on business performance through entrepreneurial
orientation. When an employer has a need for achievement, internal locus of control,
and need for cognition are likely to adopt an entrepreneurial orientation to give
customers the best products and services through creativity and innovation, where it will
impact positively on the performance of the company. Lumpkin and Dess (1996) also
has declared that there is a positive relationship between need for achievement and
entrepreneurial orientation. As described in the previous chapter that the need for
achievement is part of the personal characteristics indicator. Entrepreneurs with the
level of achievement motivation (need for achievement) high are more likely to adopt or
implement entrepreneurial orientation, which in turn contribute to the performance of
the company. Lumpkin and Dess (1996) argue that entrepreneurs who have a direct
The First International Conference on Entrepreneurship
Book One 159
impact on the achievement motivation of corporate strategy and not directly on the
performance of the company.
Meanwhile, a businessman with an internal locus of control is high may not be willing
to cede control of the company. The businessmen prefer to control their own and
formulate competitive organizational culture that is internally driven by the ideas
themselves are innovative and creative. Entrepreneurs with internal locus of control tend
to be more innovative (Miller and Toulouse, 1986) and effective (Govindarajan, 1989).
Previous studies also showed positive effects of internal locus of control on firm
performance is mediated by risk taking (Boone et al., 1996).
An entrepreneur with a high need for cognition will tend to have an affinity towards
complex problems, where the interest is to prove that the employer bold in the face of
risk (risk-taking) of the problems faced. According to Zhang and Bruning (2011), a
businessman with a high need for cognition will place greater emphasis on logical
arguments and make strategic decisions based on extensive market research. With the
market research, entrepreneurs demonstrate a proactive attitude, which identify and take
advantage of market opportunities before competitors preceded.
To find out how much a personal relationship characteristics on business performance
through entrepreneurial orientation can be seen from the multiplication of the "original
sample estimate characteristics of the personal relationship of entrepreneurial
orientation" with "original sample estimate the relationship of entrepreneurial
orientation on business performance", where each figure shows 0.751 and
0.583. And the result is equal to 0.438 where the figure is greater than the "original
sample estimate personal relationship characteristics on business performance" which
shows the number 0,287. This means that the indirect effect of personal characteristics
on business performance through entrepreneurial orientation greater than the direct
influence of personal characteristics on business performance. An entrepreneur will
achieve a better performance of the company if other than the personal characteristics
apply in running the business also adopt a strategic orientation in the form of
entrepreneurial orientation consisting of innovativeness, pro-activeness, and risk taking.
REFERENCES Cacioppo, J.T. et al. 1984. The Efficient Assessment of Need for Cognition. Journal of
Personality
Assesment. Vol. 48, pp. 306-7. ------------. 1996. Disopositional Differences in Cognitive
Motivation: The Life an Times of Individuals
Varying in Need for Cognition. Psychological Bulletin. Vol. 119 No. 5, pp. 1032-43.
Covin, J.G. and D.P. Slevin. 1989. Strategic Management of Small Firms in Hostile and Benign
Environments. Strategic Management Journal. Vol. 10, No. 1, pp. 75-87. ------------. 1991. A
Conceptual Model of Entreprenurship as Firm Behavior. Entrepreneurship Theory and
Practice. Vol. 16 No.1, pp. 7-28.
The First International Conference on Entrepreneurship
Book One 160
Crider, A.B. 1983. Psychology. Glenview: Scott Forresmen And Co. Danim, Sudarwan. 1997.
Metode Penelitian untuk Ilmu-ilmu Perilaku: Acuan Dasar bagi Mahasiswa Program
Sarjana dan Peneliti Pemula. Edisi Pertama. Jakarta: Bumi Aksara.
Dess, G. and R. Robinson. 1984. Measuring Organizational Performance in the Absence of
Objective Measures: The Caseof Privately-Held Firm and Conglomerate Business Unit.
Strategic Management Journal. Vol. 36 No. 6, pp. 1196-1250.
Gallen, T. 2006. Managers and Strategic Decisions: Does the Cognitive Style Matter”, The
Journal of
Management Development. Vol. 25 No. 2, pp. 118-33.
Ghozali, Imam. 2008. Structural Equation Modelling Metode Alternatif dengan Partial Least
Square (PLS).
Edisi Kedua. Semarang: Badan Penerbit – Undip.
Govindarajan, V. 1989. Implementing Competitive Strategies at the Business Unit Level.
Strategic Management Journal. Vol. 10 No. 3, pp. 251-69.
Hami, Suryaman. 2009. Entrepreneurial Leadership, Orientasi Pasar, dan Kinerja Bisnis pada
Usaha Menengah di Jawa Timur.
Karami, A. et al. 2006. The CEOs’ Characteristics and Their Strategy Development in the UK
SME Sector:
An Empirical Study. The Journal of Management Development. Vol. 25 No. 3, pp. 316-24.
Katalog BPS : 1102001.3571 tahun 2010
Kauer, D. et al. 2007. Effects of Top Management Team Characteristics on Strategic Decision
Making. Management Decision. Vol. 45 No. 6, pp. 942.
Kohli and Jaworski. 1993. Markor: A Measure of Marketing Orientation. Journal of Marketing
Research. Vol. 30, p: 467-477.
Kuncoro, Mudrajad. 2003. Metode Riset untuk Bisnis dan Ekonomi. Yogyakarta: Erlangga.
Lumpkin, G.T. and G.G. Dess. 1996. Clarifying The Entrepreneurial Orientation Construct and
Linking it to Performance. Academy of Management Review. Vol. 21 No. 1, 135-172.
Nasution, A.H. dkk. 2007. Entrepreneurship Membangun Spirit Teknopreneurship. Yogyakarta:
CV Andi Offset.
Prameshinta, H.T. 2009. Entrepreneurial Leadership, Relationship Marketing Orientation, dan
Kinerja
Bisnis pada Usaha Menengah di Jawa Timur. Sekaran, Uma. 2006. Reseach Method For
Business:
Sugiyono. 2011. Metode Penelitian Kuantitatif, Kualitatif, dan R & D. Bandung: CV. Alfabeta.
The First International Conference on Entrepreneurship
Book One 161
Sutianti, Mindralina. 2006. Pengaruh Orientasi Pasar, Orientasi Pembelajaran, dan Inovasi
Terhadap Kinerja Bisnis Perusahaan Mebel Kayu di Indonesia.
Walker and Ruekert. 1987. Marketing’s Role in the Implementation of Business Strategies: a
Critical Review and Conceptual Frame Work. Journal of Marketing. Vol. 51, p: 15-33.
Whittaker, H. and T. Quince. 2003. Entrepreneurial Orientation and Entrepreneur’s Intentions
and Objectives. ESRC Centre for Business Research, University of Cambridge.Working
Paper No. 271.
Wiklund, J. 1999. The Sustainability of the Entrepreneurial Orientation- Performance
Relationship. Entrepreneurship Theory and Practice. Vol. 24 No. 1, pp. 37-48.
Wu, Sibin et al. 2007. Need for Achievement, Business Goal, and Entrepreneurial Persistence.
Management Research News. Vol. 30 No. 12, pp. 928-941.
Zhang, D.D. and E. Bruning. 2011. Personal Characteristics and Strategic Orientation:
Entrepreneurs in Canadian Manufacturing Companies. International Journal of
Entrepreneurial Behaviour & Research. Vol. 17 No. 1, pp. 82-103.
The First International Conference on Entrepreneurship
Book One 162
IbK PROGRAM FOR CREATING STUDENT ENTREPRENEURS
AT THE WIDYAGAMA UNIVERSITY
Wiwin Purnomowati1, Ismini2
Widya Gama University
INDONESIA
E-mail: [email protected]
ABSTRACT
Changing students’ mindset from job seekers to be job creators when they are
already at university is not easy. Many entrepreneurial programs at University
have not been able to create new entrepreneurs significantly. One of program
creating new entrepreneurs at Widyagama University is Ipteks bagi
Kewirausahaan (IbK program).
Science and technology program for entrepreneurship (IbK) is a Dikti (Higher
Education Directorate) program that aims to create student entrepreneurs.
Higher Education formulate a program with a mission to produce new
entrepreneurs from campus, through an integrated program with the creation of
a method that left entirely to the organizers of IBK. Each university has the right
to manage the IBK program involving a number of professors who are
experienced entrepreneurs from various disciplines. IBK implement business
management training for tenants and a number of other creative activities to
generate new independent entrepreneur based science and technology.
IbK program at the Widyagama University implemented in the form of
entrepreneurship training, internships in SMEs, business plan competition and
facilitate student entrepreneurship. Training conducted to provide knowledge
entrepreneurship, encouraging the growth of entrepreneurial motivation,
improve understanding of management (organization, production, finance and
marketing) and create a business plan. The facilitation of entrepreneurship
students in the form of capital, mentoring and exhibition.
Keywords: Entrepreneurship, Internship, Business Plan
INTRODUCTION
The Need of Entrepreneurial Programs
Based on data from the Central Bureau of Statistics, up to February 2012 an
Unemployment Rate (TPT) reached 6.32 percent to the total number of unemployed
reached 7.6 million men. To TPT Diploma and Degree levels, respectively 7.5 percent
and 6.95 percent of the unemployment rate. In this situation, unemployment problem
will impact negatively to social stability. This condition is supported by fact that the
most of university graduated are job seekers. It is happened because learning system in
universities is focused on how to prepare the students graduate fast and get job, not to
prepare them as job creator. So, it’s very important for universities to motivate their
students be young entrepreneurs. One effort to overcome and prevent unemployment
The First International Conference on Entrepreneurship
Book One 163
among the educated, is a need to prepare for entrepreneurial generation seriously since
early age. It will create the young generation as job creators.
According to Ciputra (2008), there are three ideas to create entrepreneur. First, in the
primary and secondary level there should be curriculums that teach about
entrepreneurship. Second, entrepreneurs should be created and developed in the
graduate level by implementing entrepreneurship education and entrepreneurship
project such as IbK (Ipteks bagi Kewirausahaan) and PMW (Program Mahasiswa
Wirausaha), where students acquire training (provisioning), apprenticeship, business
planning, starting up business and business assistance.
From the formation side of the character of entrepreneurs, universities should create an
atmosphere that can encourage independent attitude to the academic community. This
can be achieved by: 1) developing and getting used to working in creative ideas and
independent attitude to the students in the learning process (models emphasize exercise,
independent tasks, problem solving, decision-making, taking opportunity, etc.), 2)
inculcate honest attitudes and behaviors in communication and act in all development
activities, education and learning as a foundation in building entrepreneurial mental on
student s, 3) Education Practitioners also need to share and give support on
entrepreneurship mental education to the institutions related to the emerging field of
business services in the community that really works and prepare policies to facilitate
and serve the community. Educational practitioners are also important to liaise closely
with the business in order to create a process of learning by doing.
Third, there should be national entrepreneurship training movements done by the
government and people in order to teach a wider group of people. Nowadays, many
government institutions have entrepreneurship program to create new entrepreneurs or
empower SMEs. Program of DIKTI (Minister of National Education) is aimed to
creating new entrepreneurs among the students. Program of other government
institutions such as Minister of Cooperative and SMEs is aimed to empower
Cooperative and SMEs. Program of Minister of Youth and Sport is creating young
entrepreneurs. Besides the government institutions, private companies also have
program for empowering SMEs through their CSR (Corporate Social Responsibility).
Changing students’ mindset from job seekers to be job creators when they are already at
university is not easy. Many entrepreneurial programs at University have not been able
to create new entrepreneurs significantly. One of program creating new entrepreneurs
at Widyagama University is Ipteks bagi Kewirausahaan (IbK program).
Science and technology program for entrepreneurship (IbK) is a Dikti (Higher
Education Directorate) program that aims to create student entrepreneurs. Higher
Education formulate a program with a mission to produce new entrepreneurs from
campus, through an integrated program with the creation of a method that left entirely to
the organizers of IBK. Each university has the right to manage the IBK program
involving a number of professors who are experienced entrepreneurs from various
disciplines. IBK implement business management training for tenants and a number of
other creative activities to generate new independent entrepreneur based science and
technology.
IbK program at the Widyagama University implemented in the form of entrepreneurship
training, internships in SMEs, business plan competition and facilitate student
entrepreneurship. Training conducted to provide knowledge entrepreneurship,
The First International Conference on Entrepreneurship
Book One 164
encouraging the growth of entrepreneurial motivation, improve understanding of
management (organization, production, finance and marketing) and create a business
plan. The facilitation of entrepreneurship students in the form of capital, business
mentoring and product exhibition.
Entrepreneurship Condition at the Widyagama University
Widyagama University has established the identity of toward scientific research and
entrepreneurship university. There are three key words that need to be outlined. First
word is toward. Towards shows the meaning of determination, dynamic and honest at
the same time. University at this time is still not aware of the competence and quality as
expected. Therefore, the Widyagama University determined to achieve that goal through
relevant policies and programs that can be operated. Second word is Research. Research
shows (determination): (i) the learning process at faculties of Widyagama University
that never ceases to identify problems and seek the truth for the benefit of mankind, (ii)
the achievement of the performance measure of research quality or competency
universities in the international academic community, and (iii) the basis for an objective
framework for the systematic formation and maturation (and competence) and the
academic community of the University. Third word is entrepreneurship.
Entrepreneurship University demonstrated ability in terms of: (i) high commitment
academic of faculty to interact with the real world, face variety of problems and
challenges, (ii) a broad-spectrum competence that puts the university can take part in
various activities and field, and (iii) anticipated environmental strategic lead to
globalization and advances in information technology. Three words indicate that
Widyagama University is dedicated to improving and developing the quality of
academic resources for the benefit of science and society.
Implementation research and entrepreneurship can not be mutually exclusive. Both
work in synergy with each other (vertically and horizontally) enriching academic
competence, as well as produce the variety and quality of the research or scientific work
quality. Therefore, the implementation of scientific identity towards research and
entrepreneurial university should be formulated and projected in programs oriented to
the front.
As the implementation of research and entrepreneurial university, Centre for
Entrepreneurship Development (P2K) was established on June 24, 2005 based on the
Decree of the Rector of University Widyagama No. 11/ PTS.030.H1/Kep/VI/2005.
Entrepreneurship Development Centre (P2K) is an agency under the rector that
functions in the management of entrepreneurship programs at the Widyagama
University. P2K draft planning and development, as well as coordinate activities that
build on the basic concepts of science, technology and art from resources in the
University. Sources of competence, ie laboratories, faculty, and supporting resources are
managed to provide value-added knowledge and skills.
Cultivation and Development of Entrepreneurship in addition accommodated in the
curriculum as Course (2 credits) are also given in the form of Competence
Entrepreneurship Program which is mandatory for students who are managed by the
Centre for Entrepreneurship Development (Pusat Pengembangan Kewirausahaan/P2K).
However P2K management system is not optimal due to the potential development of
entrepreneurship has not synergize and available resources; pattern is not sustainable
The First International Conference on Entrepreneurship
Book One 165
entrepreneurial development (short term) and the lack of a new entrepreneurial
incubation units. P2K performance since 2005 to 2010 to produce entrepreneurs still not
up yet indicated the significance of the number of participants and the lack of a business
plan competition entrepreneur generated number. Availability of information access
facilities (internet) not fully utilized like to explore business opportunities / business,
promotions and marketing. Several laboratories have untapped potential for the
development of entrepreneurship such as agro-processing laboratories, engineering
laboratories and computer labs. In addition, the faculty as educators as well as the most
experienced entrepreneurs and practitioners have not been involved in the development
of entrepreneurship optimally.
Pioneering fostering entrepreneurship began to appear in 2009 with the assistance
obtained from the PMW Kopertis VII which produces 4 people who pioneered micro-
scale entrepreneurs / small. Since that year the business plan competition from
entrepreneurial start the program competencies tested to explore the potential student
entrepreneurs and creative ideas though not maximized because of the general proposal
is still not able to produce a business plan implementation. The development of PKM
(Student Creativity Program) shows progress is being made with the achievements of 13
titles funded 19 titles in 2010 and funded in 2011 that demonstrated the ability to
develop creative ideas and began to rise. Beginning in 2011 there were 5 groups of
students got the opportunity to get funding sourced from P2KPN Assistance Program.
In 2011, Entrepreneurship Development Centre (P2K) also got a grant for strengthening
entrepreneurship center. In 2012 P2K got IBK program for the first year and also got
PMW program in producing and marketing La Soya Plus. In 2013, P2K got IbK
program for the second year and an integrated learning program work (Cooperative
Academic Education Program/COOP) and a PKMK program. In 2014, P2K got IbK
program for the third year and COOP program for the second year.
IbK is a Dikti (Higher Education Directorate) program for creating new entrepreneurs.
Dikti formulate a program with a mission to produce new entrepreneurs from campus,
through an integrated program with the creation of a method that left entirely to the
organizers of IbK. Each university has the right to manage the IbK program involving a
number of professors who are experienced entrepreneurs from various disciplines. IbK
implement business management training for tenants and a number of other creative
activities to generate new independent entrepreneur based science and technology.
PURPOSE OF THE PROGRAM
* The purpose of the program IBK are :
a. Creating new independent entrepreneurs based on science and technology;
b. Improving business management skills for an industrial society; and
c. Creating a suitable entrepreneurial training method for students PKMK / other PKM / student who is starting a business / entrepreneurial alumnus.
The First International Conference on Entrepreneurship
Book One 166
IMPLEMENTATION METHOD
* Recruitment Patterns
a. Recording the students who get the PKMK or other PKM program.
b. Students/alumnus who starting a business can enroll for the IbK program.
c. Selection of participants is done with the interview and test the entrepreneurial
(fill in the questionnaire) to determine the extent of the interest and motivation
of student.
d. Selection of participants to obtain as many as 20 participants per year.
* Method of approach
a. Education and entrepreneurial Training, including:
- Knowledge of entrepreneurship to strengthen entrepreneurial motivation.
- Creating a business plan.
- Management (organization, production, finance, marketing)
The materials will be provided by the speakers either by experienced lecturers in
Science and technology and entrepreneurship as well as practitioners who have
had business experience. Model of education and training in addition to
theoretical also provide practice cases so that the participants are expected to
understand the theory and practice.
b. Internship at SME partners
This internship will provide practical experience for students. The materials
studied are work culture, production technology, financial management and
marketing, as well as product development and market strategy. After internship,
students are required to make a report.
c. Mentoring and coaching
At this stage of development is done in a variety of aspects related to business
issues, ranging from strengthening the mental attitudes of entrepreneurs,
mastery of production technology, financial management and marketing as well
as access to additional capital in the search.
d. Evaluation:
the material that is used to evaluate the success of coaching includes a
commitment to follow the students in activities that can be represented on
attendance, ability to match the quality of the expected production and
marketing capabilities of products, development of business turnover.
e. Financing:
For training, apprenticeship and production as well as the introduction of a
product into the market covered executive team. When the good market response
and capable of independent tenants will be given a loan (working capital).
f. The problem solving
The problem solving through consultation and mentoring by field instructors and
speakers. In the event of problems will be evaluated and resolved problems.
During the training period, participants allowed to utilize the facilities provided
by the IbK team according to the agreement that has been done.
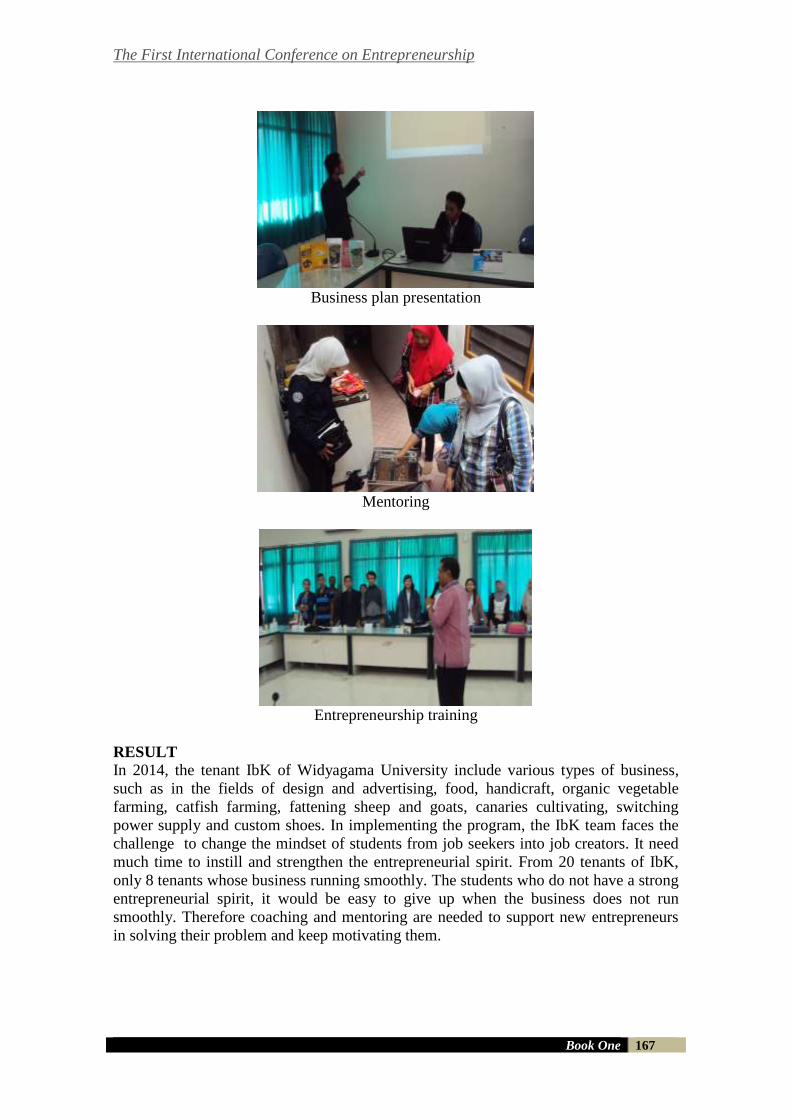
The First International Conference on Entrepreneurship
Book One 167
Business plan presentation
Mentoring
Entrepreneurship training
RESULT
In 2014, the tenant IbK of Widyagama University include various types of business,
such as in the fields of design and advertising, food, handicraft, organic vegetable
farming, catfish farming, fattening sheep and goats, canaries cultivating, switching
power supply and custom shoes. In implementing the program, the IbK team faces the
challenge to change the mindset of students from job seekers into job creators. It need
much time to instill and strengthen the entrepreneurial spirit. From 20 tenants of IbK,
only 8 tenants whose business running smoothly. The students who do not have a strong
entrepreneurial spirit, it would be easy to give up when the business does not run
smoothly. Therefore coaching and mentoring are needed to support new entrepreneurs
in solving their problem and keep motivating them.
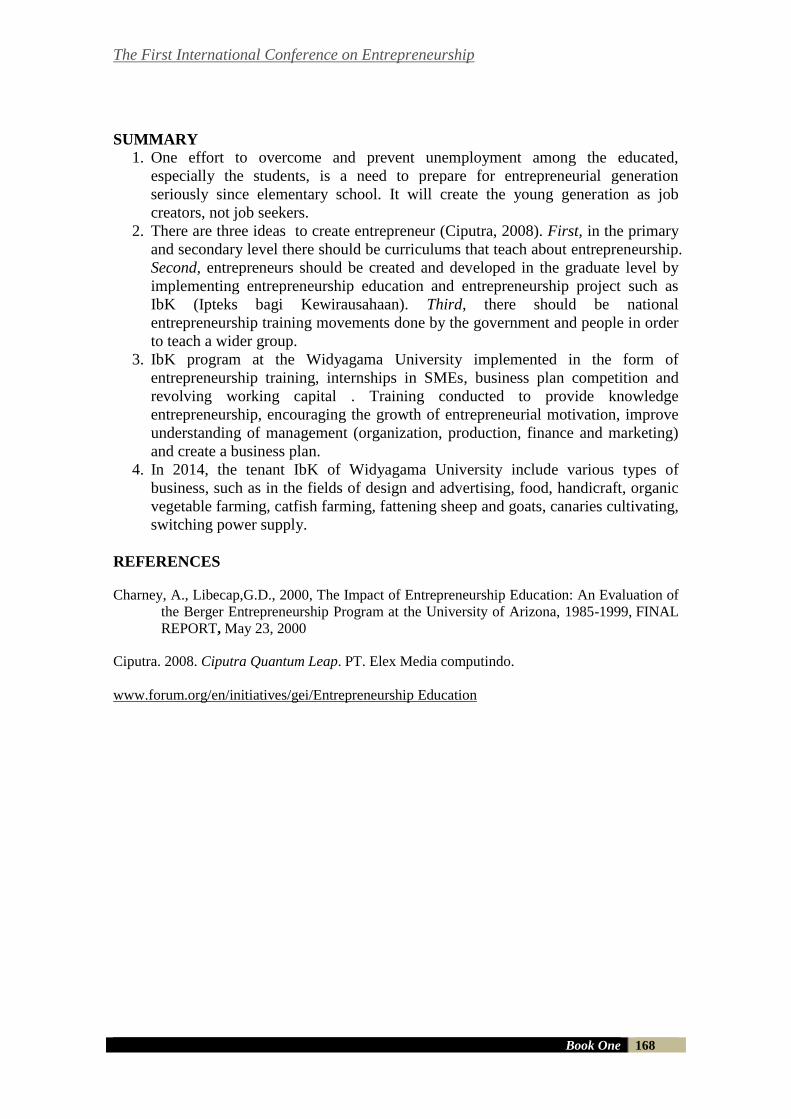
The First International Conference on Entrepreneurship
Book One 168
SUMMARY
1. One effort to overcome and prevent unemployment among the educated,
especially the students, is a need to prepare for entrepreneurial generation
seriously since elementary school. It will create the young generation as job
creators, not job seekers.
2. There are three ideas to create entrepreneur (Ciputra, 2008). First, in the primary
and secondary level there should be curriculums that teach about entrepreneurship.
Second, entrepreneurs should be created and developed in the graduate level by
implementing entrepreneurship education and entrepreneurship project such as
IbK (Ipteks bagi Kewirausahaan). Third, there should be national
entrepreneurship training movements done by the government and people in order
to teach a wider group.
3. IbK program at the Widyagama University implemented in the form of
entrepreneurship training, internships in SMEs, business plan competition and
revolving working capital . Training conducted to provide knowledge
entrepreneurship, encouraging the growth of entrepreneurial motivation, improve
understanding of management (organization, production, finance and marketing)
and create a business plan.
4. In 2014, the tenant IbK of Widyagama University include various types of
business, such as in the fields of design and advertising, food, handicraft, organic
vegetable farming, catfish farming, fattening sheep and goats, canaries cultivating,
switching power supply.
REFERENCES
Charney, A., Libecap,G.D., 2000, The Impact of Entrepreneurship Education: An Evaluation of
the Berger Entrepreneurship Program at the University of Arizona, 1985-1999, FINAL
REPORT, May 23, 2000
Ciputra. 2008. Ciputra Quantum Leap. PT. Elex Media computindo.
www.forum.org/en/initiatives/gei/Entrepreneurship Education
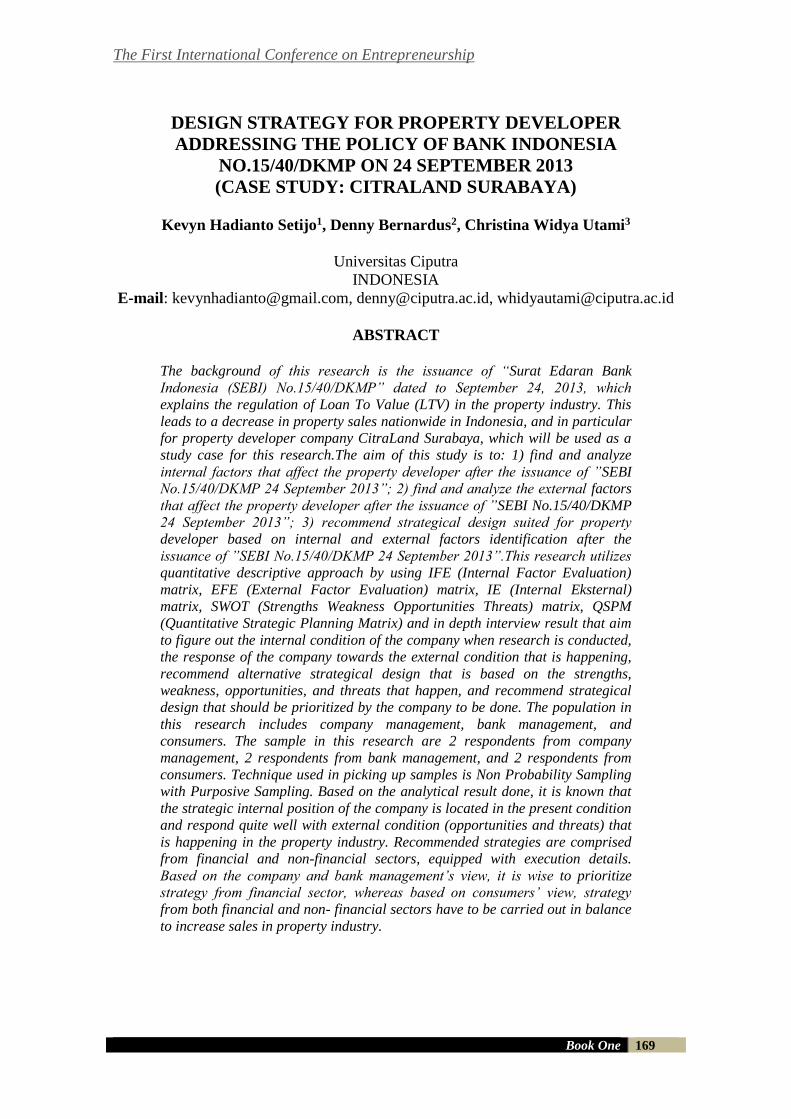
The First International Conference on Entrepreneurship
Book One 169
DESIGN STRATEGY FOR PROPERTY DEVELOPER
ADDRESSING THE POLICY OF BANK INDONESIA
NO.15/40/DKMP ON 24 SEPTEMBER 2013
(CASE STUDY: CITRALAND SURABAYA)
Kevyn Hadianto Setijo1, Denny Bernardus2, Christina Widya Utami3
Universitas Ciputra
INDONESIA
E-mail: [email protected], [email protected], [email protected]
ABSTRACT
The background of this research is the issuance of “Surat Edaran Bank
Indonesia (SEBI) No.15/40/DKMP” dated to September 24, 2013, which
explains the regulation of Loan To Value (LTV) in the property industry. This
leads to a decrease in property sales nationwide in Indonesia, and in particular
for property developer company CitraLand Surabaya, which will be used as a
study case for this research.The aim of this study is to: 1) find and analyze
internal factors that affect the property developer after the issuance of ”SEBI
No.15/40/DKMP 24 September 2013”; 2) find and analyze the external factors
that affect the property developer after the issuance of ”SEBI No.15/40/DKMP
24 September 2013”; 3) recommend strategical design suited for property
developer based on internal and external factors identification after the
issuance of ”SEBI No.15/40/DKMP 24 September 2013”.This research utilizes
quantitative descriptive approach by using IFE (Internal Factor Evaluation)
matrix, EFE (External Factor Evaluation) matrix, IE (Internal Eksternal)
matrix, SWOT (Strengths Weakness Opportunities Threats) matrix, QSPM
(Quantitative Strategic Planning Matrix) and in depth interview result that aim
to figure out the internal condition of the company when research is conducted,
the response of the company towards the external condition that is happening,
recommend alternative strategical design that is based on the strengths,
weakness, opportunities, and threats that happen, and recommend strategical
design that should be prioritized by the company to be done. The population in
this research includes company management, bank management, and
consumers. The sample in this research are 2 respondents from company
management, 2 respondents from bank management, and 2 respondents from
consumers. Technique used in picking up samples is Non Probability Sampling
with Purposive Sampling. Based on the analytical result done, it is known that
the strategic internal position of the company is located in the present condition
and respond quite well with external condition (opportunities and threats) that
is happening in the property industry. Recommended strategies are comprised
from financial and non-financial sectors, equipped with execution details.
Based on the company and bank management’s view, it is wise to prioritize
strategy from financial sector, whereas based on consumers’ view, strategy
from both financial and non- financial sectors have to be carried out in balance
to increase sales in property industry.
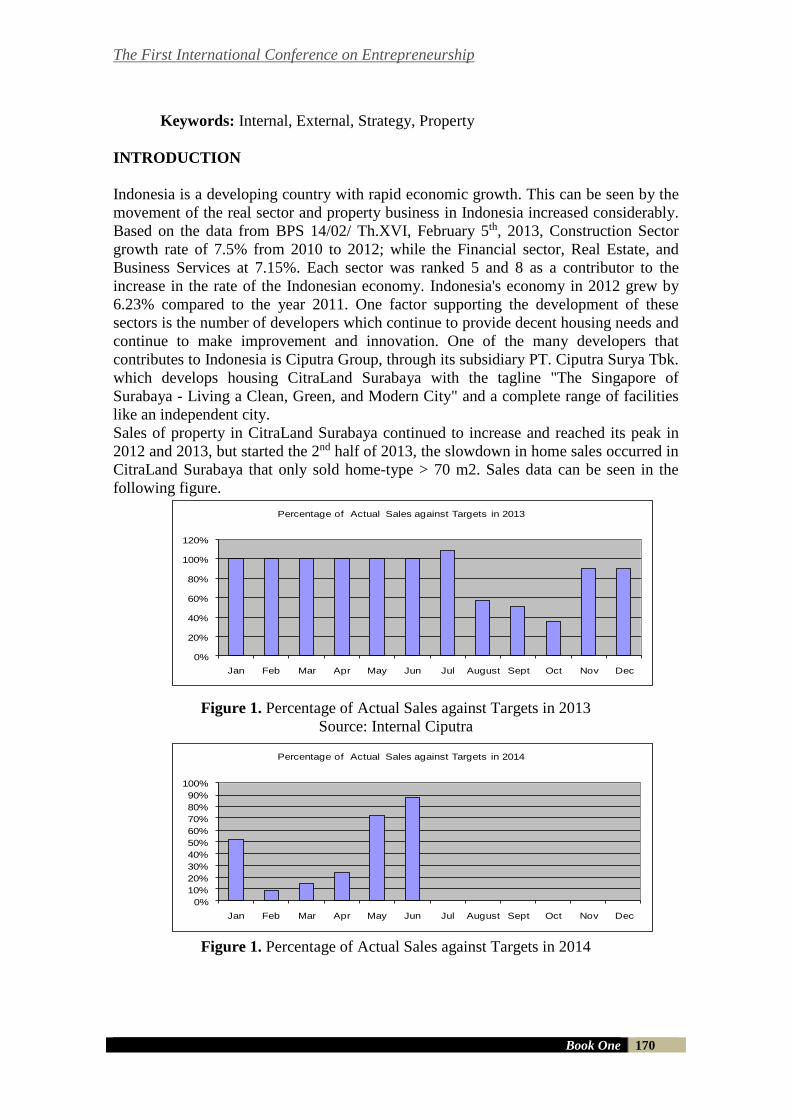
The First International Conference on Entrepreneurship
Book One 170
Keywords: Internal, External, Strategy, Property
INTRODUCTION
Indonesia is a developing country with rapid economic growth. This can be seen by the
movement of the real sector and property business in Indonesia increased considerably.
Based on the data from BPS 14/02/ Th.XVI, February 5th, 2013, Construction Sector
growth rate of 7.5% from 2010 to 2012; while the Financial sector, Real Estate, and
Business Services at 7.15%. Each sector was ranked 5 and 8 as a contributor to the
increase in the rate of the Indonesian economy. Indonesia's economy in 2012 grew by
6.23% compared to the year 2011. One factor supporting the development of these
sectors is the number of developers which continue to provide decent housing needs and
continue to make improvement and innovation. One of the many developers that
contributes to Indonesia is Ciputra Group, through its subsidiary PT. Ciputra Surya Tbk.
which develops housing CitraLand Surabaya with the tagline "The Singapore of
Surabaya - Living a Clean, Green, and Modern City" and a complete range of facilities
like an independent city.
Sales of property in CitraLand Surabaya continued to increase and reached its peak in
2012 and 2013, but started the 2nd half of 2013, the slowdown in home sales occurred in
CitraLand Surabaya that only sold home-type > 70 m2. Sales data can be seen in the
following figure.
Figure 1. Percentage of Actual Sales against Targets in 2013
Source: Internal Ciputra
Figure 1. Percentage of Actual Sales against Targets in 2014
0%
10%
20%
30%
40%
50%
60%
70%
80%
90%
100%
Jan Feb Mar Apr May Jun Jul August Sept Oct Nov Dec
Percentage of Actual Sales against Targets in 2014
0%
20%
40%
60%
80%
100%
120%
Jan Feb Mar Apr May Jun Jul August Sept Oct Nov Dec
Percentage of Actual Sales against Targets in 2013
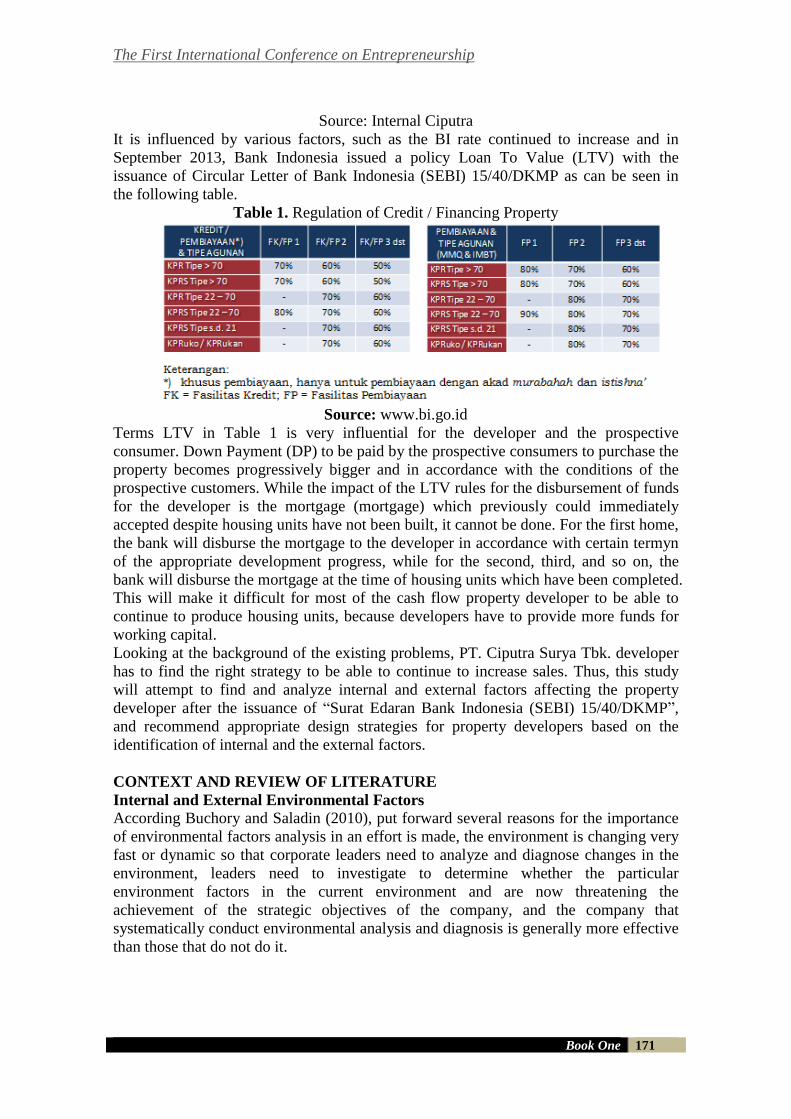
The First International Conference on Entrepreneurship
Book One 171
Source: Internal Ciputra
It is influenced by various factors, such as the BI rate continued to increase and in
September 2013, Bank Indonesia issued a policy Loan To Value (LTV) with the
issuance of Circular Letter of Bank Indonesia (SEBI) 15/40/DKMP as can be seen in
the following table.
Table 1. Regulation of Credit / Financing Property
Source: www.bi.go.id
Terms LTV in Table 1 is very influential for the developer and the prospective
consumer. Down Payment (DP) to be paid by the prospective consumers to purchase the
property becomes progressively bigger and in accordance with the conditions of the
prospective customers. While the impact of the LTV rules for the disbursement of funds
for the developer is the mortgage (mortgage) which previously could immediately
accepted despite housing units have not been built, it cannot be done. For the first home,
the bank will disburse the mortgage to the developer in accordance with certain termyn
of the appropriate development progress, while for the second, third, and so on, the
bank will disburse the mortgage at the time of housing units which have been completed.
This will make it difficult for most of the cash flow property developer to be able to
continue to produce housing units, because developers have to provide more funds for
working capital.
Looking at the background of the existing problems, PT. Ciputra Surya Tbk. developer
has to find the right strategy to be able to continue to increase sales. Thus, this study
will attempt to find and analyze internal and external factors affecting the property
developer after the issuance of “Surat Edaran Bank Indonesia (SEBI) 15/40/DKMP”,
and recommend appropriate design strategies for property developers based on the
identification of internal and the external factors.
CONTEXT AND REVIEW OF LITERATURE
Internal and External Environmental Factors According Buchory and Saladin (2010), put forward several reasons for the importance
of environmental factors analysis in an effort is made, the environment is changing very
fast or dynamic so that corporate leaders need to analyze and diagnose changes in the
environment, leaders need to investigate to determine whether the particular
environment factors in the current environment and are now threatening the
achievement of the strategic objectives of the company, and the company that
systematically conduct environmental analysis and diagnosis is generally more effective
than those that do not do it.
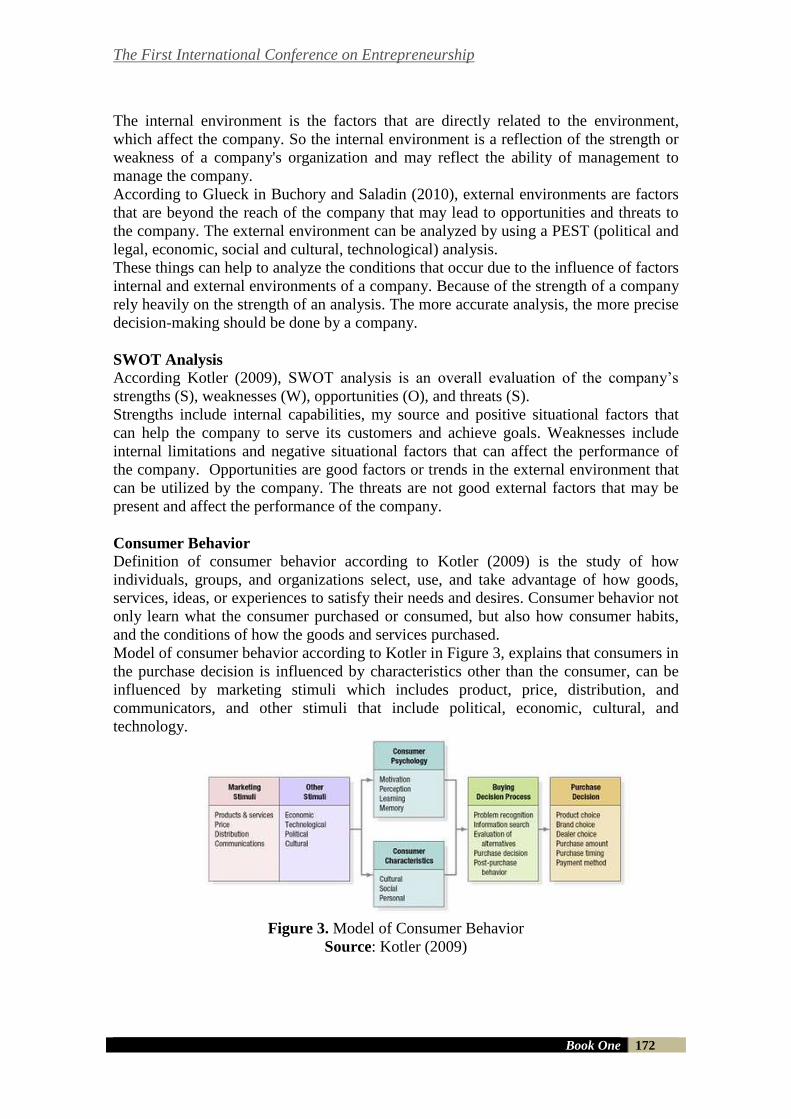
The First International Conference on Entrepreneurship
Book One 172
The internal environment is the factors that are directly related to the environment,
which affect the company. So the internal environment is a reflection of the strength or
weakness of a company's organization and may reflect the ability of management to
manage the company.
According to Glueck in Buchory and Saladin (2010), external environments are factors
that are beyond the reach of the company that may lead to opportunities and threats to
the company. The external environment can be analyzed by using a PEST (political and
legal, economic, social and cultural, technological) analysis.
These things can help to analyze the conditions that occur due to the influence of factors
internal and external environments of a company. Because of the strength of a company
rely heavily on the strength of an analysis. The more accurate analysis, the more precise
decision-making should be done by a company.
SWOT Analysis According Kotler (2009), SWOT analysis is an overall evaluation of the company’s
strengths (S), weaknesses (W), opportunities (O), and threats (S).
Strengths include internal capabilities, my source and positive situational factors that
can help the company to serve its customers and achieve goals. Weaknesses include
internal limitations and negative situational factors that can affect the performance of
the company. Opportunities are good factors or trends in the external environment that
can be utilized by the company. The threats are not good external factors that may be
present and affect the performance of the company.
Consumer Behavior
Definition of consumer behavior according to Kotler (2009) is the study of how
individuals, groups, and organizations select, use, and take advantage of how goods,
services, ideas, or experiences to satisfy their needs and desires. Consumer behavior not
only learn what the consumer purchased or consumed, but also how consumer habits,
and the conditions of how the goods and services purchased.
Model of consumer behavior according to Kotler in Figure 3, explains that consumers in
the purchase decision is influenced by characteristics other than the consumer, can be
influenced by marketing stimuli which includes product, price, distribution, and
communicators, and other stimuli that include political, economic, cultural, and
technology.
Figure 3. Model of Consumer Behavior
Source: Kotler (2009)
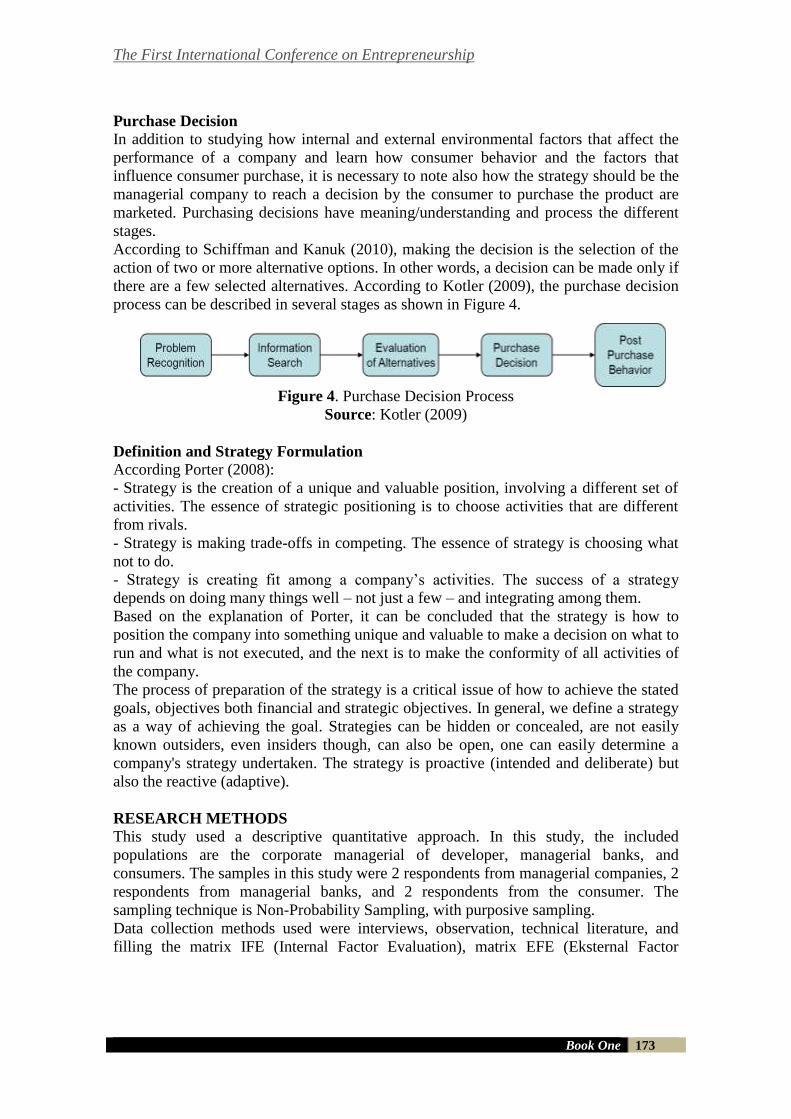
The First International Conference on Entrepreneurship
Book One 173
Purchase Decision
In addition to studying how internal and external environmental factors that affect the
performance of a company and learn how consumer behavior and the factors that
influence consumer purchase, it is necessary to note also how the strategy should be the
managerial company to reach a decision by the consumer to purchase the product are
marketed. Purchasing decisions have meaning/understanding and process the different
stages.
According to Schiffman and Kanuk (2010), making the decision is the selection of the
action of two or more alternative options. In other words, a decision can be made only if
there are a few selected alternatives. According to Kotler (2009), the purchase decision
process can be described in several stages as shown in Figure 4.
Figure 4. Purchase Decision Process
Source: Kotler (2009)
Definition and Strategy Formulation
According Porter (2008):
- Strategy is the creation of a unique and valuable position, involving a different set of
activities. The essence of strategic positioning is to choose activities that are different
from rivals.
- Strategy is making trade-offs in competing. The essence of strategy is choosing what
not to do.
- Strategy is creating fit among a company’s activities. The success of a strategy
depends on doing many things well – not just a few – and integrating among them.
Based on the explanation of Porter, it can be concluded that the strategy is how to
position the company into something unique and valuable to make a decision on what to
run and what is not executed, and the next is to make the conformity of all activities of
the company.
The process of preparation of the strategy is a critical issue of how to achieve the stated
goals, objectives both financial and strategic objectives. In general, we define a strategy
as a way of achieving the goal. Strategies can be hidden or concealed, are not easily
known outsiders, even insiders though, can also be open, one can easily determine a
company's strategy undertaken. The strategy is proactive (intended and deliberate) but
also the reactive (adaptive).
RESEARCH METHODS This study used a descriptive quantitative approach. In this study, the included
populations are the corporate managerial of developer, managerial banks, and
consumers. The samples in this study were 2 respondents from managerial companies, 2
respondents from managerial banks, and 2 respondents from the consumer. The
sampling technique is Non-Probability Sampling, with purposive sampling.
Data collection methods used were interviews, observation, technical literature, and
filling the matrix IFE (Internal Factor Evaluation), matrix EFE (Eksternal Factor
The First International Conference on Entrepreneurship
Book One 174
Evaluation), matrix IE (Internal-Eksternal), matrix SWOT (Strengths Weakness
Opportunities Threats), and QSPM (Quantitative Strategic Planning Matrix).
Processing and data analysis methods used in this study are the approaches to the
concept of strategic management. Analysis of environmental data is through descriptive
analysis presented in the form of tables, charts and descriptions. In the early stages
descriptive analysis through observation in the location of research, interviews with
internal and external parties and company literature. Once the internal and external
factors are identified then performed reconfirmation to the management of the company
to determine the accuracy of the data obtained. The resulting quantitative analysis in this
study is a result of the weight, rating and scores. The data collected will be processed
and analyzed in three stages: the input stage, matching stage, and the decision stage.
Data Analysis
1. The Input Stage
External Environment Analysis, to identify some of the opportunities and
threats in the political and legal factors, economic, social and cultural, and
technological changes that may affect the property business.
Internal Environmental Analysis identifies the strengths and weaknesses of the
company to be able to cope with the changes that occur.
IFE and EFE Matrix, based on the identification of external and internal factors
obtained will be determined the weight of each factor with a paired
comparison method. Then, it was conducted to determine the rating of the
results of the analysis of the company's situation with a predetermined scale.
The result of multiplying the weight by the rating will get the value of IFE
and EFE. EFE matrix values show how companies respond to the
opportunities and threats that exist in the industry. Value IFE matrix describes
the condition of the company internally.
2. Matching Stage
IE Matrix, puts the position on the x-axis value of the IFE and EFE values on
the y-axis, to determine the position of the company is located in quadrant
know how and what strategy should be done.
SWOT Matrix, develops a strategy based on internal and external
environmental situation. Strategy obtained is divided into four types of
strategies: SO (strengths-opportunities; strengths-opportunities), WO
(weaknesses-opportunities; weakness-opportunities), ST (strengths-threats;
strength-threats) and WT (weaknesses-threats; weakness-threats).
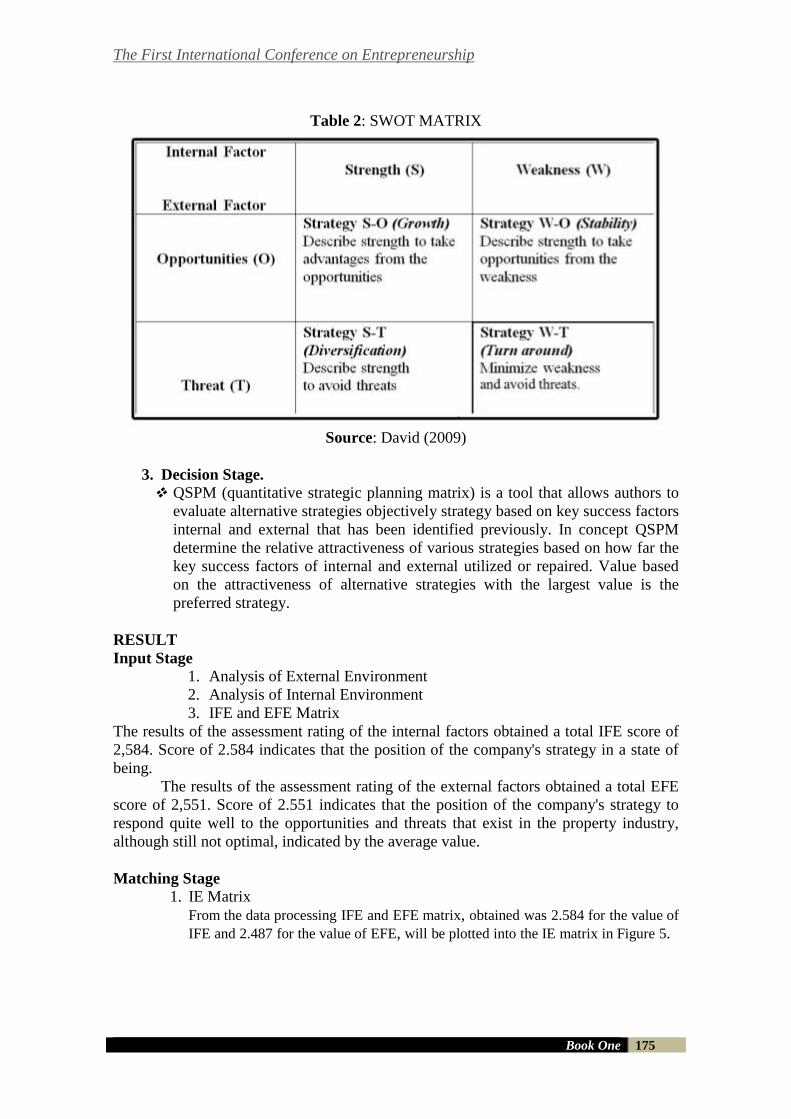
The First International Conference on Entrepreneurship
Book One 175
Table 2: SWOT MATRIX
Source: David (2009)
3. Decision Stage.
QSPM (quantitative strategic planning matrix) is a tool that allows authors to
evaluate alternative strategies objectively strategy based on key success factors
internal and external that has been identified previously. In concept QSPM
determine the relative attractiveness of various strategies based on how far the
key success factors of internal and external utilized or repaired. Value based
on the attractiveness of alternative strategies with the largest value is the
preferred strategy.
RESULT
Input Stage 1. Analysis of External Environment
2. Analysis of Internal Environment
3. IFE and EFE Matrix
The results of the assessment rating of the internal factors obtained a total IFE score of
2,584. Score of 2.584 indicates that the position of the company's strategy in a state of
being.
The results of the assessment rating of the external factors obtained a total EFE
score of 2,551. Score of 2.551 indicates that the position of the company's strategy to
respond quite well to the opportunities and threats that exist in the property industry,
although still not optimal, indicated by the average value.
Matching Stage 1. IE Matrix
From the data processing IFE and EFE matrix, obtained was 2.584 for the value of
IFE and 2.487 for the value of EFE, will be plotted into the IE matrix in Figure 5.
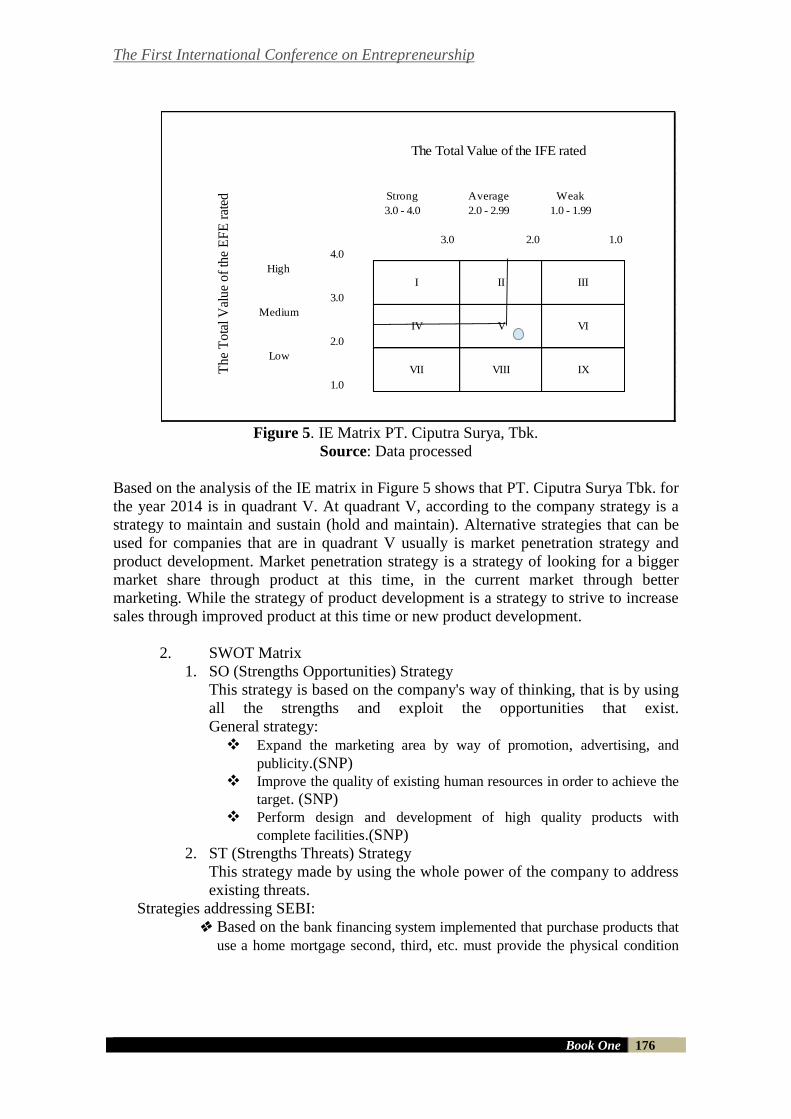
The First International Conference on Entrepreneurship
Book One 176
Figure 5. IE Matrix PT. Ciputra Surya, Tbk.
Source: Data processed
Based on the analysis of the IE matrix in Figure 5 shows that PT. Ciputra Surya Tbk. for
the year 2014 is in quadrant V. At quadrant V, according to the company strategy is a
strategy to maintain and sustain (hold and maintain). Alternative strategies that can be
used for companies that are in quadrant V usually is market penetration strategy and
product development. Market penetration strategy is a strategy of looking for a bigger
market share through product at this time, in the current market through better
marketing. While the strategy of product development is a strategy to strive to increase
sales through improved product at this time or new product development.
2. SWOT Matrix
1. SO (Strengths Opportunities) Strategy
This strategy is based on the company's way of thinking, that is by using
all the strengths and exploit the opportunities that exist.
General strategy:
Expand the marketing area by way of promotion, advertising, and
publicity.(SNP) Improve the quality of existing human resources in order to achieve the
target. (SNP) Perform design and development of high quality products with
complete facilities.(SNP)
2. ST (Strengths Threats) Strategy
This strategy made by using the whole power of the company to address
existing threats.
Strategies addressing SEBI:
Based on the bank financing system implemented that purchase products that
use a home mortgage second, third, etc. must provide the physical condition
Strong Average Weak
3.0 - 4.0 2.0 - 2.99 1.0 - 1.99
3.0 2.0 1.0
4.0
High
3.0
Medium
2.0
Low
1.0
VII VIII IX
The Total Value of the IFE rated
Th
e T
ota
l V
alu
e o
f th
e E
FE
rat
ed
I II III
IV V VI
The First International Conference on Entrepreneurship
Book One 177
that is so, then the company must provide the product home property stock in
sufficient quantities to not spend too much working capital.(SNP)
General Strategy: Maintain and improve product quality with minimal production costs and
selling prices remain competitive.(SNP)
Improve the product warranty and after sales service.(SNP) Utilize cooperation and good relations with the consumer to dampen the
competitors.(SNP)
3. WO (Weakness Opportunities) Strategy
This strategy is based on exploiting the opportunities that exist in a way
that overcomes these weaknesses.
General Strategy:
Implement sales system sales booking numbers to products sold in the
moments before launching.(SNP)
Open new business line sales of the secondary products, in addition to primary
products.(SNP) Provide assurance handover on time products to consumers in accordance with
the following agreed time with the consequences.(SNP)
4. WT (Weakness Threats) Strategy This strategy is based on activities that are defensive and trying to minimize weaknesses and avoid.
Strategies addressing SEBI: Implement a more flexible system of financing for the purchase of products by
consumers.(SP) Provide convenience for the consumer finance through cooperation with the
banks.(SP)
Strategi secara umum: Provide innovative bonuses and more helpful for consumers in the purchase of
the product by the consumer only at certain events.(SNP)
Based on the SWOT matrix is done, get some good alternative strategy of SO, WO,
ST, and WT. From the analysis of several alternative strategies, can be seen there are
two sectors which are the core of each of these strategies, namely finance and non-
finance sectors. Therefore, an alternative strategy would be divided into 2 groups of
strategies, as follows:
1. Financing Strategy (Strategy coded SP).
2. Non-Financing Strategy (Strategy coded SNP).
Furthermore, there are two alternative strategies will be analyzed using QSPM
(Quantitative Strategic Planning Matrix).
The Decision Stage Based on the results of the QSPM analysis with the managerial department of CitraLand
Surabaya represented by the General Manager/Associate Director and Marketing Manager by
filling in the value of the (AS) Attractives Score, it can be seen that the strategy that had
highest value of TAS (Total Attractives Score) was the alternative strategy from the financial
sector (strategy I), with a total score of 5.140 and 5.519, compared with the alternative strategy
of non-financial sector (strategy II), with a total score of 4.112 and 4.920.
The First International Conference on Entrepreneurship
Book One 178
Based on the QPSM analysis with the banks represented by the Head of the Office of Consumer
Credit at Bank Central Asia and the Secured Loan Manager of Bank OCBC NISP, by filling in
the value of the AS (Attractives Score), it can be seen that the strategy that had the highest
value of TAS (Total Attractives Score) was the alternative strategy from financial sector
(strategy I) with a total score of 6.177 and 5.492, compared with the alternative strategy of
non-financial sector (strategy II), with a total score of 4.978 and 4.816. Based on the QSPM analysis with the Citraland Surabaya consumers represented by Mr. Stephanus Pribudi and Mr. Teguh Lauwis, by filling in the value of the AS (Attractives Score),
it can be seen that the strategy that had the highest value of TAS (Total Attractives Score) was
the alternative strategy of non-financial sector (strategy II) with a total score of 5.897 and
5.798, compared with alternative strategies of financial sector (strategy I), with a total score
of 5.806 and 5.780. However, there was almost no difference between the strategies so it can be
said that from the customer's perspective, both strategies should be made and applied to answer
the needs and desires of consumers.
The value of the total score of the managerial department and the banks showed similar
result: the financial sector strategies (Strategy I) took precedence over non-financial sector strategies (Strategy II), thus according to the managerial and banking, financial sector strategies must be analyzed in detail to be applied by property developers after the issuance of SEBI 15/40/DKMP. This is because the SEBI policies highly affect the cash flow for
developers and the financial sources of the developers are sourced from the cooperation
with the banks.
On the other hand, the value of the total score from the consumers showed different results
than the managerial and banking: the financial sector strategy (Strategy I) and non-financial
sector strategy (Strategy II) were strategies that should be prioritized in balance, thus for the
consumers, both financial sector strategies and non financial sector strategies must be analyzed in detail to be applied by property developers after the issuance of SEBI 15/40/DKMP. This is because consumers do not just put the funds needed to purchase the
property and the prevailing lending rates into priority, but also to maintain the quality of
products being purchased, the availability of the demanded products, and the warranties and
after sales service service on products being purchased.
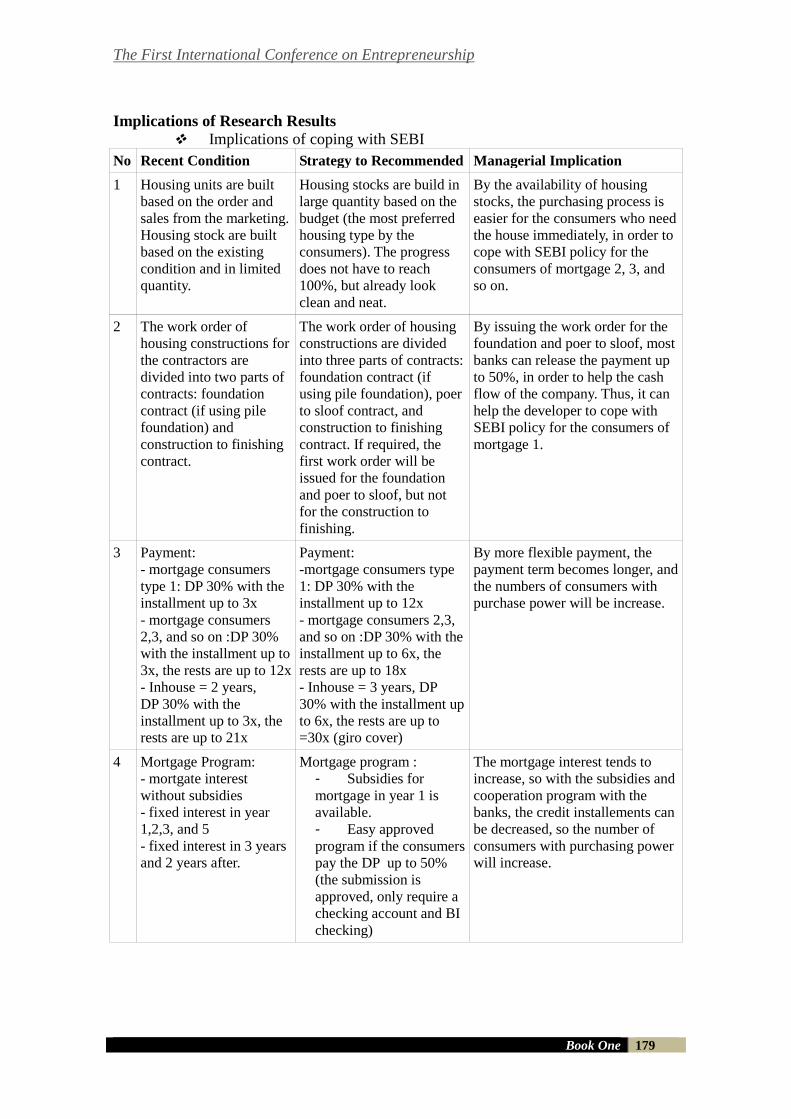
The First International Conference on Entrepreneurship
Book One 179
Implications of Research Results Implications of coping with SEBI
No Recent Condition Strategy to Recommended Managerial Implication
1 Housing units are built
based on the order and
sales from the marketing.
Housing stock are built
based on the existing
condition and in limited
quantity.
Housing stocks are build in
large quantity based on the
budget (the most preferred
housing type by the
consumers). The progress
does not have to reach
100%, but already look
clean and neat.
By the availability of housing
stocks, the purchasing process is
easier for the consumers who need
the house immediately, in order to
cope with SEBI policy for the
consumers of mortgage 2, 3, and
so on.
2 The work order of
housing constructions for
the contractors are
divided into two parts of
contracts: foundation
contract (if using pile
foundation) and
construction to finishing
contract.
The work order of housing
constructions are divided
into three parts of contracts:
foundation contract (if
using pile foundation), poer
to sloof contract, and
construction to finishing
contract. If required, the
first work order will be
issued for the foundation
and poer to sloof, but not
for the construction to
finishing.
By issuing the work order for the
foundation and poer to sloof, most
banks can release the payment up
to 50%, in order to help the cash
flow of the company. Thus, it can
help the developer to cope with
SEBI policy for the consumers of
mortgage 1.
3 Payment:
- mortgage consumers
type 1: DP 30% with the
installment up to 3x
- mortgage consumers
2,3, and so on :DP 30%
with the installment up to
3x, the rests are up to 12x
- Inhouse = 2 years,
DP 30% with the
installment up to 3x, the
rests are up to 21x
Payment:
-mortgage consumers type
1: DP 30% with the
installment up to 12x
- mortgage consumers 2,3,
and so on :DP 30% with the
installment up to 6x, the
rests are up to 18x
- Inhouse = 3 years, DP
30% with the installment up
to 6x, the rests are up to
=30x (giro cover)
By more flexible payment, the
payment term becomes longer, and
the numbers of consumers with
purchase power will be increase.
4 Mortgage Program:
- mortgate interest
without subsidies
- fixed interest in year
1,2,3, and 5
- fixed interest in 3 years
and 2 years after.
Mortgage program :
- Subsidies for
mortgage in year 1 is
available.
- Easy approved
program if the consumers
pay the DP up to 50%
(the submission is
approved, only require a
checking account and BI
checking)
The mortgage interest tends to
increase, so with the subsidies and
cooperation program with the
banks, the credit installements can
be decreased, so the number of
consumers with purchasing power
will increase.
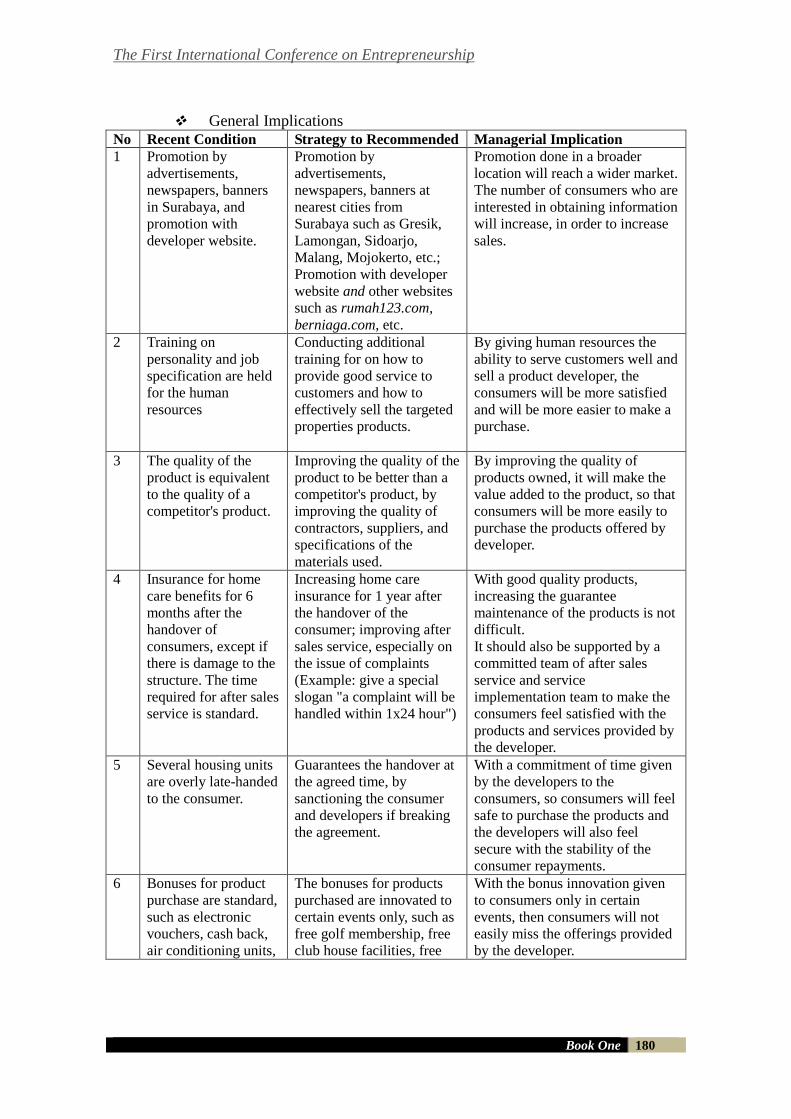
The First International Conference on Entrepreneurship
Book One 180
General Implications
No Recent Condition Strategy to Recommended Managerial Implication
1 Promotion by
advertisements,
newspapers, banners
in Surabaya, and
promotion with
developer website.
Promotion by
advertisements,
newspapers, banners at
nearest cities from
Surabaya such as Gresik,
Lamongan, Sidoarjo,
Malang, Mojokerto, etc.;
Promotion with developer
website and other websites
such as rumah123.com,
berniaga.com, etc.
Promotion done in a broader
location will reach a wider market.
The number of consumers who are
interested in obtaining information
will increase, in order to increase
sales.
2 Training on
personality and job
specification are held
for the human
resources
Conducting additional
training for on how to
provide good service to
customers and how to
effectively sell the targeted
properties products.
By giving human resources the
ability to serve customers well and
sell a product developer, the
consumers will be more satisfied
and will be more easier to make a
purchase.
3 The quality of the
product is equivalent
to the quality of a
competitor's product.
Improving the quality of the
product to be better than a
competitor's product, by
improving the quality of
contractors, suppliers, and
specifications of the
materials used.
By improving the quality of
products owned, it will make the
value added to the product, so that
consumers will be more easily to
purchase the products offered by
developer.
4 Insurance for home
care benefits for 6
months after the
handover of
consumers, except if
there is damage to the
structure. The time
required for after sales
service is standard.
Increasing home care
insurance for 1 year after
the handover of the
consumer; improving after
sales service, especially on
the issue of complaints
(Example: give a special
slogan "a complaint will be
handled within 1x24 hour")
With good quality products,
increasing the guarantee
maintenance of the products is not
difficult.
It should also be supported by a
committed team of after sales
service and service
implementation team to make the
consumers feel satisfied with the
products and services provided by
the developer.
5 Several housing units
are overly late-handed
to the consumer.
Guarantees the handover at
the agreed time, by
sanctioning the consumer
and developers if breaking
the agreement.
With a commitment of time given
by the developers to the
consumers, so consumers will feel
safe to purchase the products and
the developers will also feel
secure with the stability of the
consumer repayments.
6 Bonuses for product
purchase are standard,
such as electronic
vouchers, cash back,
air conditioning units,
The bonuses for products
purchased are innovated to
certain events only, such as
free golf membership, free
club house facilities, free
With the bonus innovation given
to consumers only in certain
events, then consumers will not
easily miss the offerings provided
by the developer.
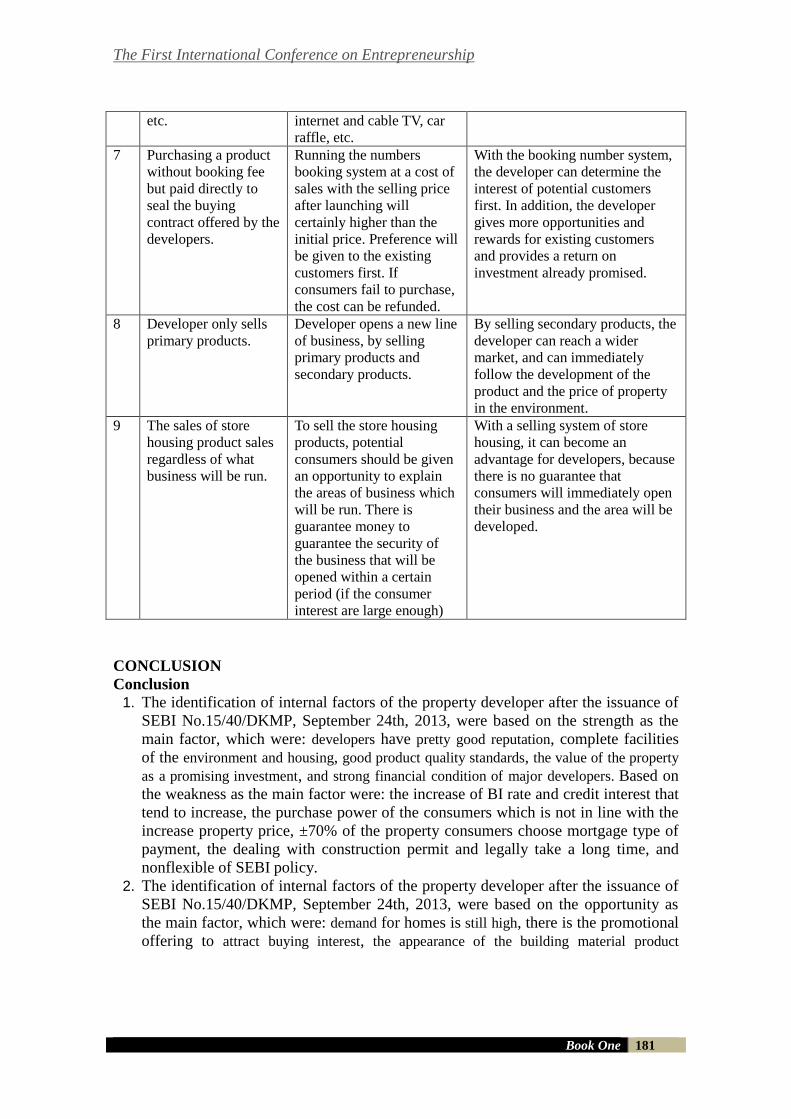
The First International Conference on Entrepreneurship
Book One 181
etc. internet and cable TV, car
raffle, etc.
7 Purchasing a product
without booking fee
but paid directly to
seal the buying
contract offered by the
developers.
Running the numbers
booking system at a cost of
sales with the selling price
after launching will
certainly higher than the
initial price. Preference will
be given to the existing
customers first. If
consumers fail to purchase,
the cost can be refunded.
With the booking number system,
the developer can determine the
interest of potential customers
first. In addition, the developer
gives more opportunities and
rewards for existing customers
and provides a return on
investment already promised.
8 Developer only sells
primary products.
Developer opens a new line
of business, by selling
primary products and
secondary products.
By selling secondary products, the
developer can reach a wider
market, and can immediately
follow the development of the
product and the price of property
in the environment.
9 The sales of store
housing product sales
regardless of what
business will be run.
To sell the store housing
products, potential
consumers should be given
an opportunity to explain
the areas of business which
will be run. There is
guarantee money to
guarantee the security of
the business that will be
opened within a certain
period (if the consumer
interest are large enough)
With a selling system of store
housing, it can become an
advantage for developers, because
there is no guarantee that
consumers will immediately open
their business and the area will be
developed.
CONCLUSION
Conclusion 1. The identification of internal factors of the property developer after the issuance of
SEBI No.15/40/DKMP, September 24th, 2013, were based on the strength as the
main factor, which were: developers have pretty good reputation, complete facilities
of the environment and housing, good product quality standards, the value of the property
as a promising investment, and strong financial condition of major developers. Based on
the weakness as the main factor were: the increase of BI rate and credit interest that
tend to increase, the purchase power of the consumers which is not in line with the
increase property price, ±70% of the property consumers choose mortgage type of
payment, the dealing with construction permit and legally take a long time, and
nonflexible of SEBI policy.
2. The identification of internal factors of the property developer after the issuance of
SEBI No.15/40/DKMP, September 24th, 2013, were based on the opportunity as
the main factor, which were: demand for homes is still high, there is the promotional
offering to attract buying interest, the appearance of the building material product
The First International Conference on Entrepreneurship
Book One 182
innovation, the more efficient work system/method in the development, and a lot of
small developers who are out of property business. Based on the threat as the main
factor were: the characteristics of government policies that tend to change, the
delayed development as resulted by the shortgage of working capital for the developers,
the increase in the price of building production, the secondary property becomes
more competitive to purchased, the investors postpone to purchase the property and
divert the funds to other investments, and the business property experiences a
slowdown up to 15-20%.
3. The QSPM results of the managerial and the banking showed similar result; the financial
sector strategies took precedence over non-financial sector, thus according to the
managerial and the banking, the financial sector strategies must be analyzed in detail to be
applied by the property developers after the issuance of SEBI No.15/40/DKMP. This is
because the SEBI policies highly affect the cash flow for developers and the developer
financing sources are sourced from the banks. On the other hand, the QSPM results of
the consumer showed different results compared with the QSPM results of the
managerial and the banking; the financial sector strategy and non financial sector
strategies should both be prioritized in a balanced way. Thus, according to the
consumers, the strategy of sector financing and non-financing must be analyzed in more
detail to be applied by the property developers after the issuance of SEBI 15/40/DKMP.
This is because the consumers do not just put the funds needed to purchase the property
and the prevailing lending rates as the priority, but also maintain the quality of products
being purchased, the availability of the demanded products, the guarantees and after sales
service on products being purchased.
4. The strategies to recommend in order to cope with SEBI No.15/40/DKMP, issued on
September 24th, 2013, based on the non financial sector, were to build the stock of
the most preferred house type by the consumers in large quantity with the allocated
budget. The progress does not have to reach 100%, but should reach the clean and
neat condition. With the availability of the optimal house stock, the sale can be easily
done (for consumers who need a home immediately) and can cope with SEBI policy for
the mortgage consumers type 1,2,3, and so on which requires that the housing units being
purchased should have been completed. However, the problem that is faced by the
developers was how to set the optimal cash flow for the all types of mortgage consumers. This can be done by issuing the work order for the housing construction and dividing the
work order into three contracts: foundation contract (for the pile foundation), poer to sloof
contract, and construction to finishing contract. If required, the work order for the
foundation (for the pile foundation) and poer to sloof can be issued first, but not with
the work order for the construction to finishing. Therefore, most banks will disburse the
payments to developers up to 50% at the time of purchasing by the consumer, because
the foundation up to the sloof have been completed. This can help the developers to
arrange the cash flow and to overcome with the SEBI policy no. 15/40/DKMP.
Additionally, there are many strategies to be done on the non-financial sector to support
the performance of the properties developers, such as the innovations in marketing
strategy, improving the quality of products and services, opening new lines of business,
and so on. Detailed explanation can be found in general implications that have been
outlined in Chapter V.
The First International Conference on Entrepreneurship
Book One 183
5. The strategies to recommend in order to cope with SEBI No.15/40/DKMP, issued on
September 24th, 2013, based on the financial sector, were to adjust with the
payment system which are applicable. For the mortgage consumers type 1, the Down
Payment of 30% can be paid in installments up to 12x, while the type 2 and 3 and so on,
the down payment of 30% can be paid in installments up to 6x, and the remaining
installments are up to 18x. The inhouse consumers / installments to developer are allowed
to do installments up to 3 years, with the down payment of 30%, with the detail that the
installments are up to 6x and the rests are up to 30x with giro cover. In addition, the
developer should work with the banks to provide mortgage programs, such as mortgage
interest subsidies for the first and second year, the easy approved program if the consumer
pays the down payment up to 50% (only require a checking account and BI checking),
and other programs. With a more flexible payment system, the payment period
becomes longer; the interest subsidy programs in cooperation with banks are available so
the number of consumers who have purchase power will be increased. The condition can
be reached because the selling price of property continues to rise and the consumers will
be more easily to purchase the products offered by developer.
Recommendations
Based on the background of the case and the policy of Loan To Value (LTV) with the issuance
of SEBI No.15/40/DKMP on September 24th ,2013, it can be ascertained that the society
has slight decrease of their interest in purchasing houses. If this situation continuously happens,
the climatic condition the housing business will decline. To overcome these problems, the
government and the banks have to cooperate. Banks are expected to review the LTV policy that
has become a burden for the developer and the consumer. The government is expected to
review the system of housing contract in Indonesia. This is because if the people who face
difficulty to purchase houses as resulted by unaffordable down payment will make them
shift to the housing contract system that is cheaper.
In addition to those problems, it is expected that there will be a further research to measure
the successful of strategies design for the property developers that have been suggested in this
study, due to the circumstances and conditions that are constantly changing.
REFERENCES Anastasia, N, Lieyanto, Y, dan Wongosari, F. 2005 ’Analisa Faktor-Faktor yang
Dipertimbangkan Konsumen dalam Pembelian Properti di CitraRaya Surabaya’,Civil
Engineering Dimension7(2):75-80.
Buchory, Herry Achmad dan Saladin, Djaslim.(2010)Manajemen pemasaran. Bandung: CV
Linda Karya.
Cahyana dan Sudaryatmo. 2002 Rumahku Istanaku: Panduan Membeli Rumah
Hunian.Jakarta.:PT. Gramedia.
Creswell, J.W. 2007 Research Design: Qualitative, Quantitative and Mixed Methods
Approaches.Second Edition.SAGE Publications.
David, Fred R.2009 Manejemen Strategis.Jakarta: Salemba Empat.

The First International Conference on Entrepreneurship
Book One 184
Delaney, Patrick R, and Whittington,O.Ray. 2010 Business Environment and Concepts.New
Jersey: John Wiley&Sons, Inc.
Diela.2013’Aturan LTV Seharusnya Batasi Praktik Spekulasi’. Available at:
http://www.properti.kompas.com (Accessed: 7 Desember 2013).
Engel, Blackwell, and Miniard. 2006 Consumer behavior.10th Edition.Thomson South-Western.
Kotler, Philip.2009 Manajemen Pemasaran.Edisi Milenium.Jakarta:Prehallindo.
Latief. 2014’ Mutlak, Kebijakan LTV Harus Ditinjau Ulang’. Available at:
http://www.properti.kompas.com (Accessed: 19 Maret 2014).
Latief, Wasis.2011’Analisis Faktor Psikologi Konsumen Dan Pengaruhnya Terhadap
Keputusan Pembelian’,Jurnal Administrasi Indonesia1(1).
Marilyn and Judy. 2010 ’Exploring SWOT analysis – where are we now?: A review of
academic research from the last decade’,Emerald Management Journal of Strategy and
Management3(3): 215-251.
Munizu, Musran.2010’ Pengaruh Faktor-Faktor Eksternal dan Internal Terhadap Kinerja
Usaha Mikro dan Kecil (UMK) di Sulawesi Selatan’,Jurnal Manajemen dan
Kewirausahaan(12):33-41.
Peter, Palm.2013’ Strategies in real estate management: two strategic pathways’,Emerald
Management Property Management31(4):311 – 325.
Porter, Michael E.2008 Strategi Bersaing.Jakarta:Erlangga.
Grover, Richard, and Grover, Christine. 2013’Property cycles’,Emerald Management Journal of
Property Investment & Finance31(5):502 – 516.
Schiffman, Leon and Kanuk, Leslie Lazar. 2010 Consumer Behavior. 10th.Edition.Pearson
Prentice-Hall.
Setiadi, Nugroho.2008 Perilaku Konsumen.Jakarta:PT.Kencana Prenada Media.
Wispandono.2010 ’Pengaruh Lingkungan Bisnis Terhadap Kinerja Pengrajin Industri Batik Di
Kabupaten Bangkalan’,Jurnal Mitra Ekonomi dan Manajemen Bisnis Universitas
Trunojoyo1(2):152-162.
Zuraya, N. 2013 ’BI: Pertumbuhan KPR Oktober Turun’. Available at:
http://www.republika.co.id (Accessed: 28 November 2013).
The First International Conference on Entrepreneurship
Book One 185
THE INFLUENCE OF PRICE, PRODUCT QUALITY, SERVICE
QUALITY ON CUSTOMER SATISFACTION AND CUSTOMER
LOYALTY OF DCK SURABAYA
Daniel Kurniawan1, J. E. Sutanto2
Universitas Ciputra
INDONESIA
E-mails: [email protected], je [email protected]
ABSTRACT
The higher the number of exported furniture from China, the more difficult it is
for the furniture SMEs (Small and Medium Enterprises) in Indonesia to compete
in global market. The marketing performance is one of the obstacles SME
entrepreneurs should deal with in the competition. This study is aimed to
examine and analyze some variables that influence marketing performance,
such as price, product quality, service quality, customer satisfaction, and
customer loyalty.
Each variable is formed by several indicators, on of which is price consisting of
flexibility, customization, differentiation, and promotion. Product quality is
formed by defect, durability, matchness, and consistency. Service quality is
formed by tangible, reliability, assurance, responsiveness, and empathy.
Customer satisfaction is formed by complaint, referral, and repurchase
likelihood. Customer loyalty, on the other hand, is formed by brand loyalty,
customer retention, and demand growth.
This study uses random sampling method. The samples were taken from
population consisting of all customers that have been served by DCK. The
samples number were taken by Slovin formula. Primary data was collected
through direct interview to obtain the respondents’ perceptions on every
question given in questionnaire.
Instrument validation test of this research uses construct validity; the research
is considered valid if the correlation coefficient is positive and higher than 0,50.
Reliability test is done using construct reliability; the research is called reliable
if it has construct reliability which is higher than 0,70. The analysis technique
used to analyze the research data is structural equation modeling with partial
least square approach. Statistical program applied in the data analysis is
smartPLS.
The main conclusion obtained from this study is that non-significance of
relationship from price and product quality to customer loyalty. Other main
conclusion is the negative but significance relationship from service quality and
customer satisfaction to customer loyalty.
Keywords: Price, Product Quality, Service Quality, Customer
Satisfaction, Customer Loyalty
The First International Conference on Entrepreneurship
Book One 186
INTRODUCTION
CV. Dharma Citra Kencana, here in after referred to as DCK, standing in Surabaya
since 1993. Its service provided at first is a general contractor for the renovation of
homes, offices, shops, storefronts, and many other kinds of furnishing work. But in its
development, not only the renovation is being done, but also the company has been able
to build homes, factories, warehouses and other property types, from zero to finished.
Even to this moment, DCK services has also penetrated into the interior design,
complete with furniture making.
With the growing demand for increasingly large market, because people have started to
realize that home or place of business is an expensive asset to be enhanced existence,
DCK was also experiencing growth in the amount of turnover and production from year
to year. Central Bureau of Statistics (BPS) published the official report on the growth of
the sector production value of furniture belonging to small industry, which in 2012 the
total value of 2.59 trillion rupiah, increased to 20.2 trillion rupiah in 2013 (BPS, 2014).
Therefore, anticipation DCK to continue to develop the business should be done, to
keep the trend of increasingly complex needs of the community with regard to the
business field.
Although DCK has high turnover growth, but this does not necessarily lead to the
increase in gross margin for the DCK. In the last five years, the average increase in
turnover of 25% per year. The ease of access to the internet since last 5 years, has
brought a new landscape competition, because consumers can easily and quickly assess,
compare prices is a design services company with another company. Intense
competition prices and interior design services company increasing prices of raw
materials, making the gross margin down.
Every year the price of raw materials has increased significantly, resulting in COGS
(cost of goods sold) higher, and consequently the gross profit (gross margin) obtained
by DCK also declined. DCK marketing performance over the last 5 years is not too
encouraging. On the one hand, the sales turnover increasing from year to year (except
for the period 2011-2012), but on the other hand, a decline in gross margin which forms
the negative trend from year to year.
With more and more competitors in Surabaya, the price of services offered to the
market even today's increasingly competitive, sometimes even DCK got little profit
margin in order to compete in the market. With this phenomenon, research is needed to
determine whether the price of the services offered to the consumer for this is in
accordance with the intended target market segments. With the creation of the right
price, will increase the competitiveness of the business compared DCK future
competitors. The competitiveness of a firm increases when the price of the product
indicated is no longer a major consumer objections before making a purchase decision
(Hawkins & Mothersbaugh, 2011).
The First International Conference on Entrepreneurship
Book One 187
More than 50% of the number of DCK customers ordering home furnishings, which
earned gross margins are much higher than ordering furniture for office furniture. That
is, the chances of future market development is still very promising. This research aims
to assess the perceptions of consumers who never buy DCK services, whether the price
of services purchased are in accordance with the wishes and expectations of consumers.
In addition to price, the success of business services and furniture design is largely
determined by the quality of the resulting product. Expected product is a product that is
the result of consumers in accordance with the design drawings given at the beginning
of the order. In addition, these products do not have disabilities during installation and
at the time of delivery. The strength and durability of the product is also a major
consideration when consumers want to buy DCK services. Product quality that were
produced by DCK is sometimes not so good, so it is still often leads to complaints from
consumers, particularly consumers who more than once to make a purchase. DCK is
less consistency in providing products for this service can be seen from some of the
negative responses of consumers who ever take the services.
This research also aims to determine whether the products are good enough in quality
and can consistently increase sales turnover of DCK, or even consumers are actually
looking for quality products that mediocre origin in accordance with the budget alone.
Important factors in addition to price and quality of products are sought after by DCK
consumers maybe is the quality of service. Currently DCK still do not have a standard
of service, particularly related to issues of delivery and installation of furniture in the
location. This research also aims to determine whether the service quality affects
customer satisfaction of DCK or not.
At this time, the factor that also being a problem in the DCK is customer satisfaction,
because this factor can be a way to differentiate itself, compared to other companies.
Typically consumers in Surabaya have different perceptions of the quality of the
product in its interior and furniture compared to other big cities. In general, consumers
are looking for a high quality product, but on the one hand, the desired price is very
cheap. Therefore, it can no longer DCK only emphasizes the price or quality of the
product alone, but rather in terms of service quality and customer satisfaction, in order
to reassure consumers and create loyal customers and continue to do repeat buying from
time to time.
RESEARCH QUESTION
Based on the background described, the formulation of the problem of this research are:
1. Does the Price have the effect on Customer Satisfaction?
2. Does the Product Quality have the effect on Customer Satisfaction?
3. Does the Quality of Service have the effect on Customer Satisfaction?
4. Does the Customer Satisfaction have the effect on Consumer Loyalty?
5. Does the Price have the effect on Consumer Loyalty?
6. Does the Product Quality have the effect on Consumer Loyalty?
7. Does the Quality of Service have the effect on Consumer Loyalty?
The First International Conference on Entrepreneurship
Book One 188
REVIEW OF LITERATURE
Singh (2013) conducted a study which aims to determine the impact of service quality
on customer loyalty. The population of this study are all large supermarket consumers
in India. The research sample was taken as 600 customer, was obtained from 7 major
supermarkets from different districts in India. The variables used in this research is the
quality of service, customer satisfaction and loyalty. The analysis uses descriptive
statistics and one-way ANOVA. The results showed that if the quality of service with a
good note, it shows positive results and significant customer loyalty.
Shi & Smith (2012) conducted a study of furniture manufacturers in China. The purpose
of this study is to get a way for the producers to reduce the cost of production but not to
sacrifice the quality of furniture products, both domestically and are absorbed
requirement for export purposes. The population of this research is the furniture
industry and a large middle class who are members of associations Chinese National
Furniture Association (CNFA) and are often involved in international exhibitions. 4297
acquired a company that is willing to be responsden research. Data obtained by
conducting a survey to each exhibitor who participated in the international exhibition 9
different places in China. The variable used is cost effectiveness and product quality.
Statistical analysis is used to determine the average and trend of furniture producers in
making production and marketing strategies. The results of the study found that the
furniture manufacturers in China can still get high profit margins without sacrificing
quality by using raw materials and cheap replacement available in large quantities in the
market.
CONSUMER LOYALTY
Consumer loyalty is the degree of the extent to which a consumer show repeated
purchasing behavior, and continuously from a service provider or product. The degree
to which consumers continue to have a positive attitude towards the tendency of the
company. Consumers will always consider the existence of the company first, when the
need arises to use the services or specific product before looking for alternatives to other
similar companies.
Grewal & Levy (2012: 364) argues that a consumer is said to be loyal when the show
regularly purchasing behavior which itself obligated to purchase at least two times
within a certain time interval. Measures to repurchase a preferred product or service in
the future (repeat buying), is evidence of the creation of customer loyalty.
Consumer loyalty dimensions used in this study are the dimensions developed by Tetu,
et al. (2013), namely Brand Loyalty, Consumer Retention and Sales Growth. Here is an
explanation for each of these dimensions:
1. Brand Loyalty Is the degree to which the relation of a consumer to a product brand or company name.
This reflects that a consumer who is loyal to a brand will not easily move their
purchases to other brands, no matter what happens with the brand. Loyal consumers in
general will continue to purchase the brand, although faced with various alternative
brands of competitors' products that offer superior product characteristics is viewed
from different angles attributes.
The First International Conference on Entrepreneurship
Book One 189
2. Consumer Retention Is a state where the consumer wants to remain on good terms with the company on an
ongoing basis. Some sizes are used in consumer retention is a positive feedback to
companies such as always giving suggestions for improvement of the quality of
products and services. In addition, customer retention can be measured from the contact
continuity of the company so far to consumers.
3. Sales Growth
Is the degree to which consumers will make repeat purchases are more numerous in the
future. If consumers only buy products with a nominal amount or the same volume in
the future, then surely the company has not experienced an increase in performance
marketing. A consumer can not necessarily be said to have contributed positively to the
performance of the new marketing if only buy once, because do not necessarily repeat
buying in the future, or if the conduct of repeat buying once, not necessarily or nominal
volume purchases more than ever before. Therefore, the dimensions of consumer
loyalty indicators need to be measured from the increase in demand or also called sales
growth.
CONSUMER SATISFACTION
Satisfaction is a person's level of feeling both pleased and disappointed after comparing
the perceived performance or results when compared with the expectations. Grewal &
Levy (2012: 361) defines customer satisfaction as an emotional response to the
evaluation of the consumption experience of a product or service. In addition, customer
satisfaction is formulated as purnabeli evaluation, the degree of consumer perceptions of
the performance of the products or services that are chosen to meet the expectations
prior to purchase.
Customer satisfaction is very important to note because the consumer can provide long-
term benefits to the company, among which are the following: 1) Consumers want to
buy products with greater amounts; 2) Consumers want to buy a new product or
enhanced products from companies in the future; 3) Consumers are willing to share
praise for the company and its products to others; 4) Consumers are becoming less
attention to the brand and advertising competitor, and less sensitive to the price of a
competitor; 6) Consumers are willing to give new ideas for the development of the
goods or services of the company, because consumers have a greater sense of belonging.
Dimensions of customer satisfaction were used in this study are the dimensions
developed by Jayasankar & Kumar (2012), the Complaint, Referral, and Repurchase
Likelihood. Here is an explanation for each of these dimensions:
1. Complaint Is the degree to which consumers are not satisfied with the quality of the products or
services provided by the company. Indicator contradiction with consumer satisfaction is
deliberately used to direct the company to understand what factors actually sought
consumer satisfaction. The higher the degree of the complaint, the lower the perceived
level of customer satisfaction. Complaints of consumers can be caused by several
The First International Conference on Entrepreneurship
Book One 190
factors, among them the promise of a discrepancy with the results of a given company.
For a company that made the production process along with the consumer, the
possibility of the biggest complaints is caused by the time production and delivery of
products turns past the deadline that has been agreed.
2. Referral
Is the degree to which consumers are willing to refer friends or other people to buy a
product from the same company, without the promised incentives or benefits over the
company. The higher degree of consumer referrals made to indicate the higher the
perceived level of satisfaction. Referral or also called Word of mouth (WOM) is
positive can be done by means of a proactive and passive. Consumers who do
proactively referral can be seen from the behavior that deliberately show off the excess
product without first asked by his friend. While passive referral usually occurs if the
consumer is asked by his first, then answer questions such as where to buy, at what
price, and so on.
3. Repurchase Likelihood
Is the degree to which the consumer has the greatest potential to buy again the same
product or different products from the same company at a later date. Consumers who
are satisfied may be indicated by his willingness to do repeat buying. Because the
products purchased and services company have been enjoyed by consumers, and
consumer expectations have been met, then it is likely to buy back (repurchase
likelihood) will be created by itself. Dimensions of consumer satisfaction can be
measured with other types of products, volume of purchases, and when it re-purchase
took place at a later date.
PRICE
Price is the value that appears in the mind of the consumer of the product or service
transaction deal value specified by the buyer or the seller (through bargaining) or set by
the seller for the same price to all buyers (Ellickson, et al., 2012). Price is the amount of
money charged for a product or service, the amount of the exchangeable value of the
consumer to the benefits of having or using a product or service. Under normal
circumstances, demand and price have an inverse relationship or negative. This means
that the higher the price is set, the smaller the demand. But for a product - a prestigious
product (prestige) can be unidirectional or prices have a positive relationship.
According to Grewal & Levy (2012: 390), Price has two main roles in the decision
making process of the buyer is: 1) The role of the allocation of the price, ie the price
function in helping the buyer to decide how to obtain the expected benefits based on the
highest purchasing power. Thus, the existence of price can help buyers to decide how to
allocate its purchasing power in different types of goods or services. Buyers to compare
prices of various alternatives available, then decide the allocation of funds desired.
2) The role of the information of price, ie the price function in "educating" consumers
about the product factors, such as quality. This is especially helpful in situations where
buyers have difficulties to assess the factors of production or benefits objectively. The
common perception is that it applies a high price reflects its high quality.
The First International Conference on Entrepreneurship
Book One 191
Dimensions prices used in this study refers to research conducted Alptekinoglu &
Corbett (2012), which is the flexibility, customization, differentiation, and price
promotions. Here is an explanation for each of these dimensions:
1. Flexibility
Price created from the method of payment that will be made by the consumer.
Consumers can choose whether the method of payment in installments or in cash.
Companies can apply different prices for different payment methods. Repayment period
is longer (longer payment terms), is a price that can be paid off in a shorter period of
time, but as a consequence, the price of which is set to be higher than if paid in cash up
front. In this case the company stretching out the loan for a longer period.
2. Customization
In addition to the price that can be paid is flexible in terms of repayment, price can also
be created through product customization. That is, the pricing on the consumer to other
consumers can be different, depending on the type and quality of raw materials required
to make the product, thus consumers would think that the product price is relative,
depending on the type of need and demand. The application of these rates can be
applied to companies directly involving the role of the consumer in the production
process. Companies can make the exact same product at different prices when the
desired materials and different qualities of each consumer.
3. Differentiation
Price can also be created for all types of consumers being served, the amount of the
purchase volume, and when the time of booking. Higher prices can be aimed at the
home user who purchases less volume when compared to corporations (corporate user).
Likewise, if a company is to have a lot of stock of raw materials, pricing is cheaper than
the price of a product can usually be done in order to sell quickly, and the company
does not hoard goods in the warehouse. Pricing is suitable for companies that serve
multiple segments at once. In this way, consumers will have the perception that the
price is relative, depending on market conditions and company policies.
4. Promotion Price
Promotion price is one way of creating price that aims to increase the number of sales
turnover in the short term. Promotion price (promotion price) is an effective strategy to
influence consumer purchase decisions immediately. This method uses a cross-subsidy
approach, in which the loss arises because the price of a type of product promotion has
actually been closed by the high profits of other types of products. Concrete shape in the
form of discounts, bonuses for pembelajaan with certain nominal, and many others.
PRODUCT QUALITY
The quality of products according to Lovelock & Wirtz (2011: 96) is to consider
companies in building consumer trust. Performance (performance) is a basic
characteristic of a product, is the most important element of a product that is sought
after by consumers. According to Grewal & Levy (2012: 348), the performance is the
degree to which a product is able to perform its functions properly according to
The First International Conference on Entrepreneurship
Book One 192
standards of the company. Performance (performance) is a principal operating
characteristics of the product core (core product) purchased.
Another element is the product quality characteristics of the product or additional
features (features), which is a special characteristic that adds differentiation complement
the use of the product compared to other products. Reliability (reliability) is the degree
to which the product will be damaged or fails, the company should be considered to
maintain the quality standards of its products.
Another factor is the quality of the product durability (durability), which is a factor of
the length of an acceptable product before the product is to be replaced, due to wear or
below the initial standard. Durability (durability) related to how long the product can
continue to be used. These dimensions include technical life or the economic life of the
product.
In addition to factors inherent in the product itself, there is also a factor which is a
complement of the product, but its existence can not be separated, that is aesthetic, is
how the product appearance, taste, sound, smell. Aesthetics can also be interpreted with
the product appeal to the five senses. External factors are product quality perceived
service quality (perceived quality), is taken from the quality reputation of the
manufacturer of the product, how the standard of services provided by the company,
(Golder, et al. 2012).
Dimensions of quality products used in this study are the dimensions developed by
Golder, et al. (2012), ie Defect, Durability, Matchness, and Consistency. Here is an
explanation for each of these dimensions:
1. Defect Is the degree to which the presence or absence of defects when the product is received
by the consumer, if there is a product defect, the extent to which the level of consumer
acceptance or tolerance of the possibility of such defects. Dimensional quality of this
product is suitable for companies that process of production carried out jointly by the
consumer, and still involves a labor-intensive process. Production is usually done made
by order, meaning that production is done if there are orders from customers. Thus,
consistency of manufacture of the product and the quality is very vulnerable to the
availability of raw materials, particularly related to the quality of the raw materials that
existed at that time. In addition, the labor factor also affects this dimension, which is
when there are orders from consumers, labor experts may not be able to handle it alone,
so it must be assisted by the new labor and inexperienced.
2. Durability
Is the degree to which a product is resistant to factors that may cause damage in the
future. The products are not including consumer goods where there explicitly expire
date on the packaging, should have the durability (durabilty) the better, because the use
of these types of products are usually for long term and permanent, eg household
The First International Conference on Entrepreneurship
Book One 193
appliances, furniture, vehicles , and so on. For products produced from wood in
particular, resistance (durabilty) can be seen from the changes in texture, color, strength
in the weight-bearing, and the rate of loss.
3. Matchness
Is the degree to which the products produced by the company is in compliance or not
with the customer order. Because it is made by order, it is possible that the resulting
product does not correspond to the initial consumer tastes and expectations. In contrast
to a company that is already finished and ready products purchased by consumers, in
this case the consumer still can and have the opportunity to choose. The company that
made the production process along with consumers, should pay attention to product
quality matchness dimensions, whether the design, choice of colors, choice of finishing
processes, are in accordance with the expectations of the consumer or not.
4. Consistency
Is the degree to which companies are able to deliver quality products to maximum and
consistent, appropriate consumer expectations. Companies that consistently maintain
the product quality to consumers, will have an impact on customer satisfaction itself.
Consistency of product quality can be maintained by each staff and employees in the
company should be able to keep and do SOP (standard operating procedure) that have
been made. This consistency can be reflected in the standard of quality that has always
felt the same product by the consumer from time to time.
SERVICE QUALITY
Companies that are able to produce quality products alone will not be able to compete
with competitors who in addition to having quality products, are also able to provide
better quality of service to consumers. Quality of service is a factor mandatory for
companies to do the differentiation. The quality of service can be seen from how far the
difference between expectation and reality consumers for services received. Quality of
service can be measured by comparing consumer perceptions of service received by the
expected actual service (Lovelock & Wirtz, 2011: 52).
In addition, the quality of the actual service consumer assessment will refer to the
company as a whole and overall, the assessment of the quality of work the whole team
or staff within the organization. If there are consumers disappointed with the services of
a waiter in a restaurant, then it implies that negative perceptions will appear also in the
minds of consumers, that the quality of the restaurant management will be undermined.
Service quality dimensions used in this study are the dimensions developed by
Parasuraman in Chabbra (2013), namely Tangibles, Reliability, Responsiveness,
Assurance, and Empathy. Here is an explanation for each of these dimensions:
The First International Conference on Entrepreneurship
Book One 194
1. Tangibles
Is the degree of the company's ability to show their existence to external parties. This
ability is manifested in the appearance and capabilities of physical infrastructure
companies and the state of the surrounding environment.
2. Reliability
Is the degree of the company's ability to deliver as promised services accurately and
reliably.
3. Responsiveness
Is the degree of the company's ability to assist and provide services to customers
quickly and accurately, with clear information delivery.
4. Assurance Is the degree of the company's ability to foster a sense of trust of the consumers towards
the company.
5. Empathy
Is the degree of the company's ability to deliver genuine concern and personal, given to
consumers by trying to understand consumer desires one by one.
RESEARCH MODEL
Proposition that is based on theoretical studies and empirical studies will be explained
how many hypotheses are to be compiled, the variables contained in each of these
hypotheses and how to influence the relationship between variables. Here is a picture of
the conceptual framework of the study.
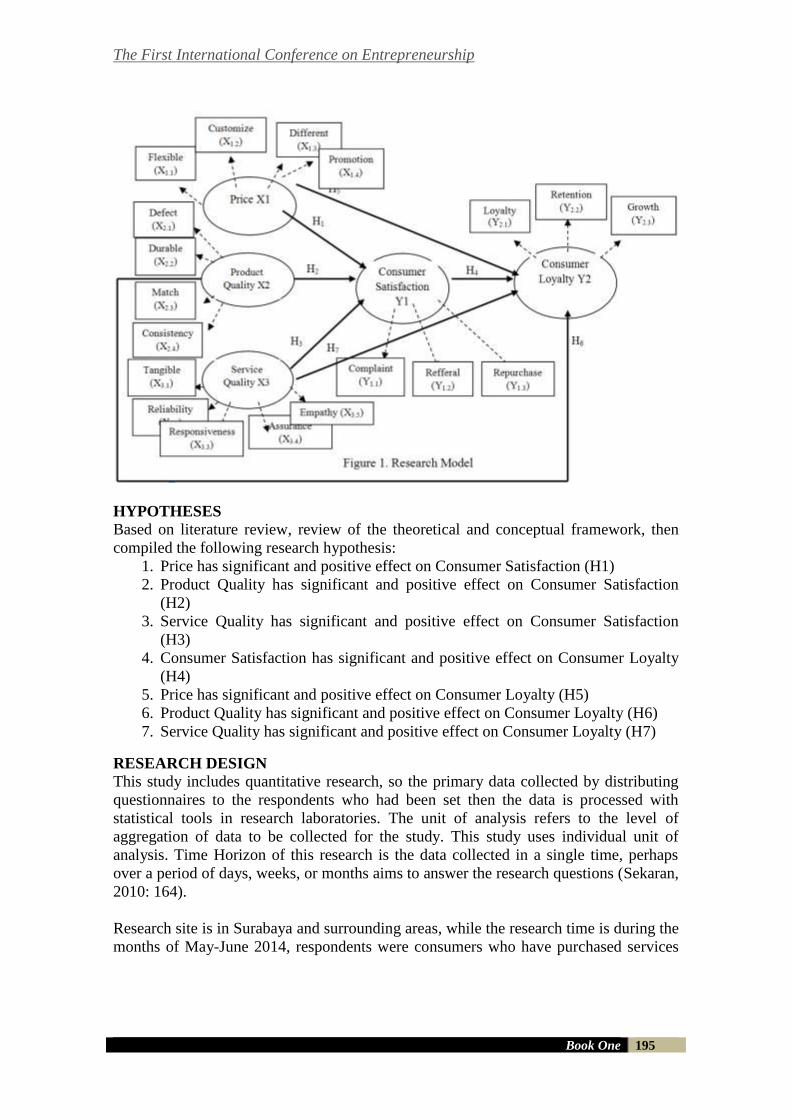
The First International Conference on Entrepreneurship
Book One 195
HYPOTHESES
Based on literature review, review of the theoretical and conceptual framework, then
compiled the following research hypothesis:
1. Price has significant and positive effect on Consumer Satisfaction (H1)
2. Product Quality has significant and positive effect on Consumer Satisfaction
(H2)
3. Service Quality has significant and positive effect on Consumer Satisfaction
(H3)
4. Consumer Satisfaction has significant and positive effect on Consumer Loyalty
(H4)
5. Price has significant and positive effect on Consumer Loyalty (H5)
6. Product Quality has significant and positive effect on Consumer Loyalty (H6)
7. Service Quality has significant and positive effect on Consumer Loyalty (H7)
RESEARCH DESIGN
This study includes quantitative research, so the primary data collected by distributing
questionnaires to the respondents who had been set then the data is processed with
statistical tools in research laboratories. The unit of analysis refers to the level of
aggregation of data to be collected for the study. This study uses individual unit of
analysis. Time Horizon of this research is the data collected in a single time, perhaps
over a period of days, weeks, or months aims to answer the research questions (Sekaran,
2010: 164).
Research site is in Surabaya and surrounding areas, while the research time is during the
months of May-June 2014, respondents were consumers who have purchased services
The First International Conference on Entrepreneurship
Book One 196
DCK. This study used a purposive sampling method to draw a sample. The sampling
criteria were: (1) Buy DCK services with a nominal minimum of 15 million dollars to
the top, and (2) Live in Surabaya; (3) Has a minimum purchase DCK services a year
ago (in 2013). The total population currently there are 96 consumers.
The data used in this study are as follows: 1) Nominal data, such as name, sex, purpose
of purchase of furniture products; 2) ordinal data, such as the educational background of
respondents; 3) Data interval, i.e. all respondents perceptional questions will be variable
pricing, product quality, service quality, customer satisfaction and loyalty; 4) ratio data,
such as the age of respondents, long been a customer, the nominal purchase of products
that have been done.
Sources of data used in this study there are two kinds, namely primary data source,
taken from a questionnaire answered by the respondents to be collected in this study.
Total respondents 30 consumers who have purchased DCK services with a nominal 15
million dollars to the top. While other data sources are secondary data source that the
data from the relevant government agencies such as the BPS furniture sales in the
region. This data serves as the reference market development trends that occur.
Techniques of data collection using questionnaires. Once the questionnaire is made,
then the respondents who had previously contacted to make an appointment to meet,
given the time to answer all the questions in the questionnaire. Researchers waited and
provide explanations when filling out the questionnaire conducted by the respondent.
The following table is the data which will be the study respondents.
All the indicators that make up the latent variables in this study use traditional scale
interval indicator stating something that is abstract. Variable price, product quality,
customer satisfaction, and customer loyalty in this study were measured using a Likert
scale or Summated ratings method and measurement results are in the form of interval
scale data. The size of each of these variables is based on the average of the values of
each item were obtained from respondents to these items, by selecting a value in a five-
point scale. A value of 1 indicates the respondent strongly disagreed with the statement
that there is in the questionnaire, the value of 2 indicates respondents disagreed, a value
of 3 indicates respondents are neutral toward the statement, a value of 4 indicates the
respondents agreed, and the value of 5 indicates the respondents strongly agreed with
the statement that there is.
Data analysis in this study using Partial Least Square (PLS). PLS can be used on any
kind of scale of data (nominal, ordinal, interval, ratio) and assuming a more flexible
terms. PLS was also used to measure the relationship of each indicator with the
construct. In addition, the test can be done PLS bootstrapping to structural models that
are outer and inner model. Because in this study using indicators to measure each
construct, and also a structural measurement model, it was decided to use PLS.
FINDINGS
An indicator is valid if it has a factor loading above 0.5 on the intended constructs.
SmartPLS output loading factor to give results like in the attachment. Testing validity
for reflective indicator using the correlation between the scores of items with a score
konstruknya. Measurements with a reflective indicator indicates a change in an indicator
in a construct if other indicators on the same constructs changed (or removed from the
model). Reflective indicators suitable for measuring the perception that this study uses a
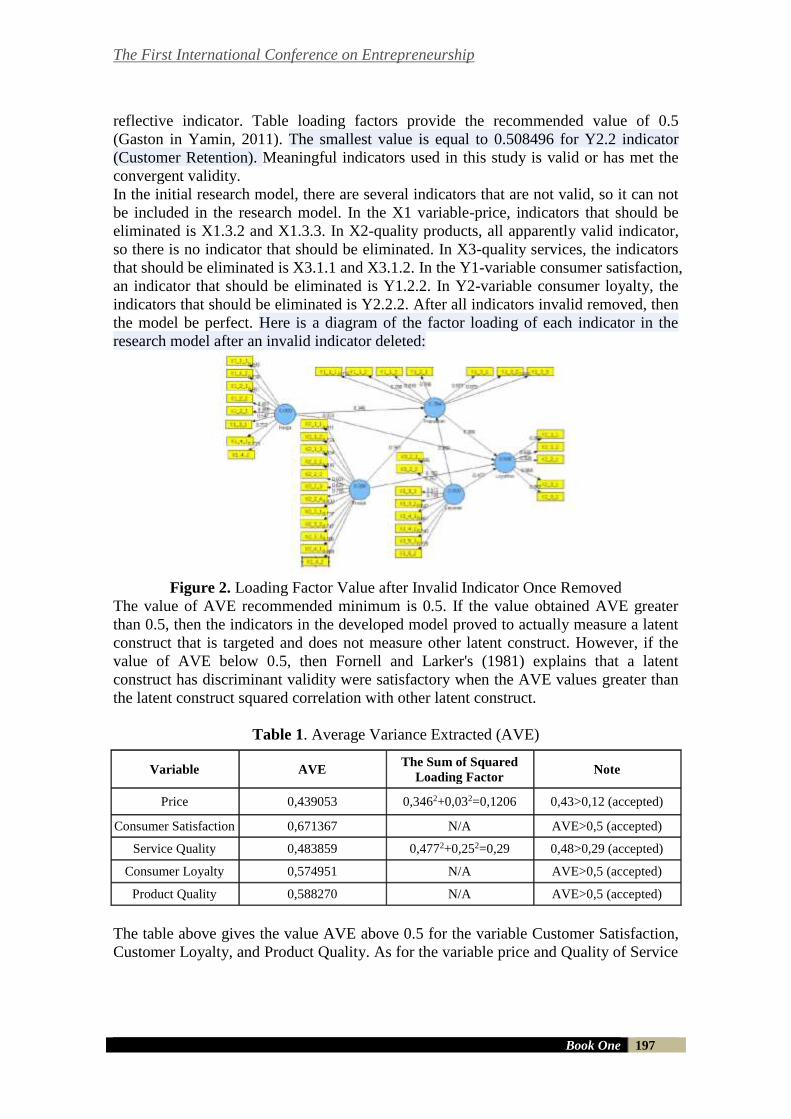
The First International Conference on Entrepreneurship
Book One 197
reflective indicator. Table loading factors provide the recommended value of 0.5
(Gaston in Yamin, 2011). The smallest value is equal to 0.508496 for Y2.2 indicator
(Customer Retention). Meaningful indicators used in this study is valid or has met the
convergent validity.
In the initial research model, there are several indicators that are not valid, so it can not
be included in the research model. In the X1 variable-price, indicators that should be
eliminated is X1.3.2 and X1.3.3. In X2-quality products, all apparently valid indicator,
so there is no indicator that should be eliminated. In X3-quality services, the indicators
that should be eliminated is X3.1.1 and X3.1.2. In the Y1-variable consumer satisfaction,
an indicator that should be eliminated is Y1.2.2. In Y2-variable consumer loyalty, the
indicators that should be eliminated is Y2.2.2. After all indicators invalid removed, then
the model be perfect. Here is a diagram of the factor loading of each indicator in the
research model after an invalid indicator deleted:
Figure 2. Loading Factor Value after Invalid Indicator Once Removed
The value of AVE recommended minimum is 0.5. If the value obtained AVE greater
than 0.5, then the indicators in the developed model proved to actually measure a latent
construct that is targeted and does not measure other latent construct. However, if the
value of AVE below 0.5, then Fornell and Larker's (1981) explains that a latent
construct has discriminant validity were satisfactory when the AVE values greater than
the latent construct squared correlation with other latent construct.
Table 1. Average Variance Extracted (AVE)
Variable AVE The Sum of Squared
Loading Factor Note
Price 0,439053 0,3462+0,032=0,1206 0,43>0,12 (accepted)
Consumer Satisfaction 0,671367 N/A AVE>0,5 (accepted)
Service Quality 0,483859 0,4772+0,252=0,29 0,48>0,29 (accepted)
Consumer Loyalty 0,574951 N/A AVE>0,5 (accepted)
Product Quality 0,588270 N/A AVE>0,5 (accepted)
The table above gives the value AVE above 0.5 for the variable Customer Satisfaction,
Customer Loyalty, and Product Quality. As for the variable price and Quality of Service
The First International Conference on Entrepreneurship
Book One 198
has the lowest AVE value below 0.5. However, the value of the latent construct squared
correlation is still below the value of the existing AVE. For the price variable, (0.3462 +
0.032) <0.439. For the variable quality of service, (0.4772 + 0.252) <0.483. Explanation
for this may happen due to the purchases that consumers have lasted long enough, so
the price and quality of service that consumers perceived that time and time becomes
less valid survey.
Table 2. Composite Reliability
Variable Composite Reliability
Price 0.860570
Consumer Satisfaction 0.934430
Service Quality 0.881582
Consumer Loyalty 0.865515
Product Quality 0.944302
Value of composite reliability for all constructs are above 0.7 which indicates that all
constructs in the model were estimated to meet criteria for discriminant validity. Lowest
composite reliability value is equal to 0.860570 to construct price.
Table 3. Cronbach’s Alpha
Variable Cronbachs Alpha
Price 0.816173
Consumer Satisfaction 0.917611
Service Quality 0.846921
Consumer Loyalty 0.805184
Product Quality 0.934846
Reliability test can also be strengthened by Cronbach's Alpha. The recommended value
is above 0.5 and Cronbach's Alpha value for all constructs be above 0.5. The lowest
value is equal to 0.805184 (Customer Loyalty). Once the model is estimated to meet
criteria Outer Model, subsequent testing structural models (Inner models). Here is the
R-square value in the construct:
Table 4. R-Square Value
Variable R Square
Price N/A
Consumer Satisfaction 0.783620
Service Quality N/A
Consumer Loyalty 0.605550
Product Quality N/A
The First International Conference on Entrepreneurship
Book One 199
The above table gives the value of 0.783620 for Consumer Satisfaction constructs
which means that the price (X1), Product Quality (X2) and Quality of Service (X3) is
able to explain the variance of Customer Satisfaction (Y1) of 78.3620%. R-square
values are also contained in the Consumer Loyalty is influenced by price, Quality
Products, Quality Service and Customer Satisfaction is equal to 0.605550. R-square
value on customer satisfaction and loyalty is already above the required threshold is the
lowest value of 0.19 (Gaston in Yamin, 2011).
To validate the model as a whole, then used a goodness of fit can be measured using a
Q-Square predictive relevance formula.
Q2 = 1 – ( 1 – R12) ( 1 – R2
2 ) ... ( 1- Rp2 )
Where R12 , R2
2 ... Rp2 is R square endogen variable in a model.
Hence, the value of Q2 is
Q2 = 1 – (1 –( R square Kepuasan)2) . (1 – (R square Loyalitas)2)
Q2 = 1 – (1 - 0,7836202).(1 – 0,6055502)
Q2 = 0.752; means still higher than the required threshold value is Q2> 0. Q-square
value greater than 0 (zero) value indicates that the model has predictive relevance,
whereas Qsquare value is less than 0 (zero) indicates that the model lacks predictive
relevance (Gaston in Yamin, 2011).
Testing the hypothesis is as follows:
Table 5. Path Coefficients (Mean, STDEV, T-Values)
Original
Sample Sample Mean
Standard
Deviation
Standard
Error T Statistics
Price
Satisfaction 0,346 0,350 0,003 0,083 4,167
Price
Loyalty 0,033 0,025 0,129 0,229 0,257
Satisfaction
Loyalty 0,986 0,982 0,139 0,139 7,077
Service
Satisfaction 0,290 0,291 0,093 0,003 3,092
Service
Loyalty -0,476 -0,480 0,128 0,128 3,718
Product
Satisfaction 0,353 0,348 0,083 0,083 4,229
Product
Loyalty 0,160 0,180 0,175 0,175 0,915
DISCUSSION
The new findings in this study supported the hypothesis is not the fifth, sixth, and
seventh, ie the relationship between price, product quality, and service quality on
consumer loyalty. The fifth and sixth hypotheses are not proven significantly, in other
words there is actually no direct relationship between price and customer loyalty, and
product quality and customer loyalty. This is probably caused by the price and quality
of the products is expected in early expectations by the consumer before the purchase of
the product, not the re-purchase or nature reps, because customer loyalty leads to long-
term repetition.
The First International Conference on Entrepreneurship
Book One 200
This concurs with Chhabra (2013) which examines the consumer loyalty.
While the seventh hypothesis proved to be significant but the result is negative, it means
improving the quality of service even lower consumer loyalty. This is most likely due to
products purchased once its installed, or need long-term nature. So the quality of service
is not required, but the other aspects that are more important to consumers, such as the
price and quality of products. Agree with Chen (2012) which examines the relationship
of price and service quality on loyalty, it is evident that the role of price has more
influence on loyalty than quality of service.
The Effect of Price on Consumer Satisfaction
Relationship between the price with satisfaction is statistically significant at the T-
4.167955 (> 1.96). Estimate the value of the original sample is positive is equal to
0.346161 which indicates that the direction of the relationship between the price the
consumer satisfaction is positive. Thus hypothesis H1 in this study which states that
'price significantly influence consumer satisfaction' is acceptable. The empirical fact is
an example of proof of this hypothesis is another study with the title influence the
quality of service, product, and price fairness on satisfaction and customer loyalty in
Lnc Skin Care Singaraja conducted by Amryyanti & Sukaatmadja (2013).
The Effect of Product Quality on Consumer Satisfaction
Relationship between Product Quality on Consumer Satisfaction is significant with a T-
statistic of 4.229643 (> 1.96). Estimate the value of the original sample is positive is
equal to 0.353393 which indicates that the relation between Quality Products with
Customer Satisfaction is positive. Thus the hypothesis H2 in this study which states that
'The quality of products significantly influence consumer satisfaction' is acceptable.
Empirical fact another study conducted Amryyanti & Sukaatmadja (2013) also showed
the same thing, ie the quality of the products have a significant effect on customer
satisfaction.
The Effect of Service Quality on Consumer Satisfaction
Relationship between Service Quality on Consumer Satisfaction is statistically
significant at the T-3.092975 (> 1.96). Estimate the value of the original sample is
positive is equal to 0.29041 which indicates that the relation between Quality of Service
with Customer Satisfaction is positive. Thus hypothesis H3 in this study which states
that 'The quality of services significantly influence customer satisfaction' is acceptable.
Empirical fact another study conducted Amryyanti & Sukaatmadja (2013) also showed
the same thing, ie the quality of services significantly influence customer satisfaction.
The Effect of Consumer Satisfaction on Consumer Loyalty
Relationship between Consumer Satisfaction with Consumer Loyalty is statistically
significant at the T-7.077814 (> 1.96). Estimate the value of the original sample is
positive is equal to 0.986457 which indicates that the direction of the relationship
between Customer Satisfaction with Customer Loyalty is positive. Thus the hypothesis
H4 in this study which states that "consumer satisfaction have a significant effect on
consumer loyalty 'is acceptable. Empirical fact another study conducted Amryyanti &
The First International Conference on Entrepreneurship
Book One 201
Sukaatmadja (2013) also showed the same thing, namely customer satisfaction
significantly influence customer loyalty.
The Effect of Price on Consumer Loyalty
Relationship between the price and the Consumer Loyalty is not significant, because the
T-statistic of only 0.257899 (<1.96). Thus hypothesis H5 in this study which states that
'price have a significant effect on consumer loyalty' is unacceptable. Empirical fact
another study conducted Amryyanti & Sukaatmadja (2013) also showed the same thing,
namely the reasonableness of the price no significant effect on customer loyalty.
The Effect of Product Quality on Consumer Loyalty
Relationship between Product Quality on Consumer Loyalty is not significant, because
the T-statistic of only 0.915336 (<1.96). Thus the hypothesis H6 in this study which
states that 'The quality of the products have a significant effect on consumer loyalty' is
unacceptable. Empirical fact another study conducted Amryyanti & Sukaatmadja (2013)
also showed the same thing, ie the quality of the product does not have a significant
effect on consumer loyalty.
The Effect of Service on Consumer Loyalty
Relationship between Service Quality on Consumer Loyalty is significant with a T-
statistic of 3.718646 (> 1.96). Estimate the value of the original sample was negative in
the amount of -0.476597 which indicates that the relation between Quality of Service
with Customer Loyalty is negative. Thus the hypothesis H7 in this study which states
that 'The quality of services significantly influence customer loyalty' is acceptable, but
the relationship is inversely or negatively. Empirical facts Amryyanti & Sukaatmadja
(2013) shows the difference, namely that customer satisfaction turns positive and
significant effect on customer loyalty.
CONCLUSION
This study includes the effect of price, product quality, and service quality on customer
satisfaction and loyalty. From the research conducted, it can be concluded some points
as follows:
1. Price has significant and positive effect on consumer satisfaction.
2. Product quality has significant and positive effect on consumer satisfaction.
3. Service quality has significant and positive effect on consumer satisfaction.
4. Consumer satisfaction has significant and positive effect on consumer loyalty.
5. Price has no significant effect on consumer loyalty.
6. Product quality has no significant effect on consumer loyalty.
7. Service quality has significant, but negative effect on consumer loyalty.
The resulting research conclusions about similarities and differences between previous
research that studied researchers compared the results obtained. The implications of this
research as conclusions can be drawn on the chart comparison with the results of
previous research the following research hypothesis.
The First International Conference on Entrepreneurship
Book One 202
Based on the research results, advice that can justify the following, among others: 1)
Variable Price and product quality can not be directly checked conjunction with
consumer loyalty, meaning that these two variables can indeed affect loyalty but not
directly, because it must pass through the first stage of customer satisfaction; 2)
Variable quality of service may be a more appropriate moderator variable that is located
between variables consumer satisfaction and loyalty, not to the independent variables
that are causal, but moderation.
Here are some suggestions for the next study authors: 1) The study population was
limited to furniture consumers in Surabaya, it is necessary to conduct further research
with a broader scope of the industry such as industry or cross the same but regionally
and across industries within the same region. Thus would explain the causal relationship
between price, product quality, service quality, satisfaction, and customer loyalty in a
wider scale; 2) The unit of analysis of this study is a mixture of consumers for
household furniture or office, then we need to do further research on each type of
consumer. Because consumer households and offices have a preference needs quite
different from each other.
REFERENCES
Alptekinoglu, A., Corbett, C. 2008. Mass Customization Vs. Mass Production: Variety and
Price Competition. Manufacturing & Service Operation Management, Vol. 10 (2), p.
204-217.
Chen, J., Rizzo, J. 2012. Pricing dynamics and product quality: the case of antidepressant drugs.
Empirical Economics, vol. 42, p. 279-300.
Chhabra, N. 2013. Measurement of Consumers’ Perception of Service Quality in Organized
Retail Using Servqual Instrument. Management Dynamics, vol. 13 (1), p. 70-82.
Ellickson, Paul B., Misra, S., Nair H. 2012. Repositioning Dynamics and Pricing Strategy.
Journal of Marketing Research, XLIX (Dec 2012), p. 750-772.
Ferdinand, A. 2010. Structural Equation Modeling Dalam Penelitian Manajemen (4th Edition
ed.). Semarang: Badan Penerbit Universitas Diponegoro.
Gherasim 2012. Prices Marketing Strategies. Economy Transdiscplinarity Cognition, vol. 15 (2),
p. 180-185.
Golder, P., Mitra, D., Moorman, C. 2012. What is Quality? An Integrative Framework of
Processes and States. Journal of Marketing, Vol. 76, July 2012, p. 1-23.
Grewal, D. & Levy, M. 2012. Marketing, 3ed. New York: McGraw Hill.
Hawkins, D., Mothersbaugh, D. 2011. Consumer Behavior: Building Marketing Strategy, 11th
ed. New York: McGraw Hill.
Jayasankar, C., Kumar, V. 2012. Antecedents and Consequences of Customer Satisfaction in
Food & Grocery Retailing: An Empirical Analysis. Decision, Vol. 39 (3), p. 101 – 140.
The First International Conference on Entrepreneurship
Book One 203
Lovelock, C., Wirtz, J. 2011. Services Marketing, 7th ed. New York: Prentice Hall.
Neuman, W. L. 2003. Social Research Methods: Qualitative and Quantitative Approaches (5th
Edition ed.). Boston: Allyn and Bacon.
Rawson, A., Duncan, E., Jones, C. The Truth about Customer Experience. Harvard Business
Review, Sept 2013, p. 90-98.
Rust, R. & Huang, M. 2012. Optimizing Service Productivity. Journal of Marketing, Vol. 76
(March 2012), p. 47-66.
Sekaran, U. 2010. Research Method for Business. Chicago: Thompson.
Singh, A. 2013. Comparison of Service Quality, Customer Satisfaction and Behavioral
intentions across the Various Formats (Supermarket, Hypermarket & Departmental
Store) in India. Business & Economic Research, Vol. 3 (1), p. 344 – 355.
Tetu, Y., Yuhlin, S., Kuihsu, T. 2013. The Impact of Brand Image and Customer Commitment
on Loyalty: An Empirical Study of Automobile Sector. Information Management &
Business Review, Vol. 5 (4), p. 181 – 193.
Yamin. 2011. Regresi dan Korelasi dalam Genggaman Anda. Jakarta: Salemba Empat
The First International Conference on Entrepreneurship
Book One 204
THE IMPLEMENTATION OF STUDENTS’ ENTREPRENEUR
THROUGH THE COOPERATIVE-BASED ENTREPRENEUR
INSTRUCTIONAL MODEL
Sri Sutrismi1
Universitas Tulungagung
Ngunut-Tulungagung. Jawa Timur
INDONESIA
E-mail: [email protected]
ABSTRACT
This research is entitled the implementation of students’ entrepreneur through
the cooperative-based entrepreneur instructional model, initialized by the
meeting of all rectors of 23 universities and Indonesia Boards of Cooperatives,
and involving Indonesian cooperative development studies, followed by the
memorandum of understanding for the development of cooperative-based
entrepreneur. The long term goal of this research is to actualize students’
entrepreneur independence, while the short term goal of this research is to
develop the cooperative-based entrepreneur instructional model. To achieve
these goals, the development activities were divided into two phases. In each
phase, the research steps to do were: 1) Exploring the potential of the students’
entrepreneurial behavior and environment. 2) Developing the instructional
model for lecturing by developing cooperative-based entrepreneur instructional
model. This study used a four-d models (Thiaragajan et.al, 1994). The first
phase of the study (conducted on first semester), based on the data analysis
from the behaviors and environment instrument through the making of idea,
showed that from the 40 students as the research samples, 75% students had
high potential while 25% students had medium potential. The result also
showed that the instructional method used before this failed to balanced the
hard skills and soft skills thus the students’ entrepreneurship independence was
less optimal. The results of the second phase of the study (the second half)
showed that: 1) Before testing the cooperative-based entrepreneur instructional
model, the researchers already developed a learning model assessment sheets
which were declared as valid under the proper category though still needed
improvement. 2) The results showed that the instructional model was capable to
meet the efforts of actualizing student’ entrepreneur independence.
Keywords: Cooperative-Based Entrepreneur Instructional Model,
Exploring The Entrepreneur Potential, Students’ Entrepreneur
Independence
INTRODUCTION
As inspired by the actualization of entrepreneurial students’ independence, this research
is aimed to design the most effective instructional model. This research is then
The First International Conference on Entrepreneurship
Book One 205
developed from the meetings of the rectors of 23 universities and Indonesia Boards of
Cooperatives (DEKOPIN) of East Java Province in 2010 facilitated by the Department
of Cooperatives, Indonesian cooperative development studies and SMEs (small micro
and medium business) in East Java, then followed up with the memorium of
understanding for the idea of developing cooperative-based entrepreneur. The result
from those meetings and MoU was the module of cooperative-based entrepreneur
modules as a text reference. The modules are one of learning references. The definition
of student learning in term of process and products is to prepare the student to apply for
the job applicants available, as well as to create their own work or to be an entrepreneur.
The needed human resources for that is human resources that have potential and highly
competitive skills. Therefore, balancing the hard-skill and soft-skill learning in higher
educational institutions is very essential.
Universities are obliged to to carry out their job to create human resources efficiently
and effectively as quality human capital investment. Productive human resources will
be ready to compete in the global market to face the Asean Economic Community in
2014. To achieve this objective, the quality of education requires continuous
improvement. The quality of the education can not be separated with the process and
product quality. The expected quality education can be achieved by creating effective
and efficient learning process in implementing real and meaningful science and
knowledge. The product quality can be achieved if the students demonstrate their level
of mastery in the work-sphere and the level of autonomy as relevant with the real life,
such as entrepreneurship. Related to the above description, in order to foster
entrepreneurial independence attitudes and behaviors, it is necessary to create a
instructional model that is appropriate, such as a instructional model that integrates the
characteristics of entrepreneurial spirit with the philosophy of the cooperative: the spirit
of mutual cooperation and unity. Thus, based on the above explanation, this study is
aimed to develop a cooperative-based entrepreneur instructional model.
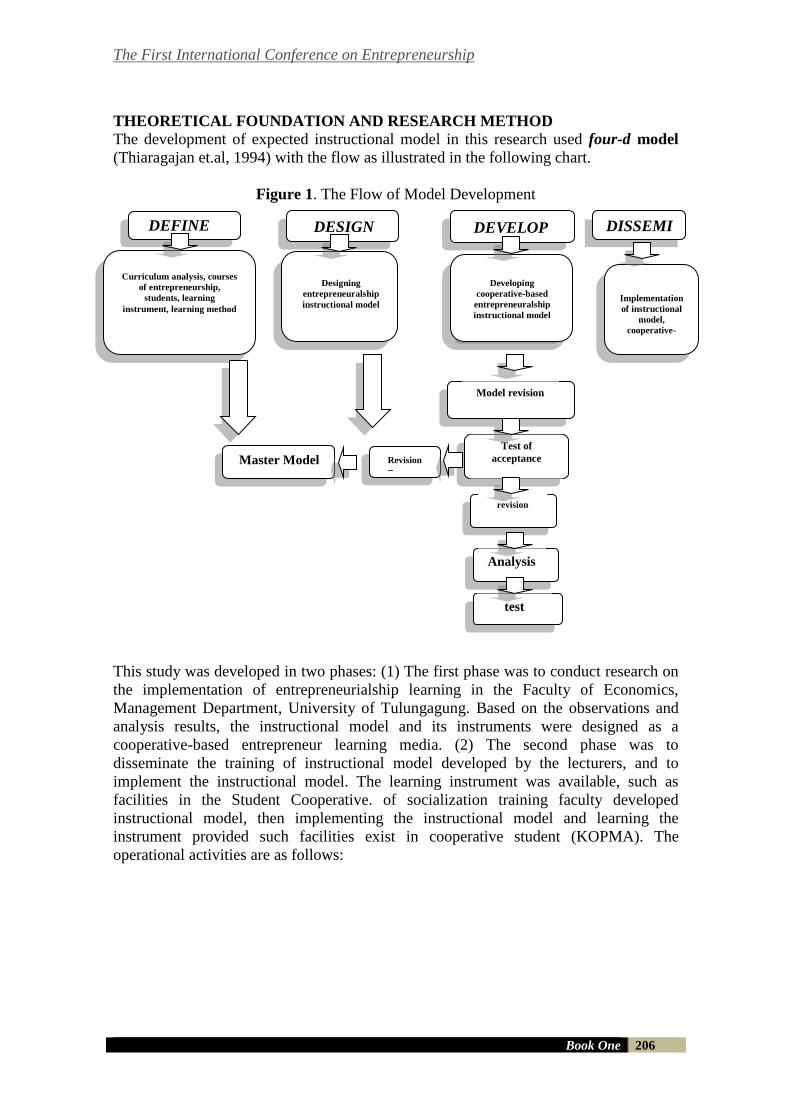
The First International Conference on Entrepreneurship
Book One 206
THEORETICAL FOUNDATION AND RESEARCH METHOD
The development of expected instructional model in this research used four-d model
(Thiaragajan et.al, 1994) with the flow as illustrated in the following chart.
Figure 1. The Flow of Model Development
This study was developed in two phases: (1) The first phase was to conduct research on
the implementation of entrepreneurialship learning in the Faculty of Economics,
Management Department, University of Tulungagung. Based on the observations and
analysis results, the instructional model and its instruments were designed as a
cooperative-based entrepreneur learning media. (2) The second phase was to
disseminate the training of instructional model developed by the lecturers, and to
implement the instructional model. The learning instrument was available, such as
facilities in the Student Cooperative. of socialization training faculty developed
instructional model, then implementing the instructional model and learning the
instrument provided such facilities exist in cooperative student (KOPMA). The
operational activities are as follows:
DEFINE DEVELOP DISSEMI
NATE
Curriculum analysis, courses
of entrepreneurship,
students, learning
instrument, learning method
Revision
n
Analysis
test
revision
Test of
acceptance
Model revision
Designing
entrepreneuralship
instructional model
Developing
cooperative-based
entrepreneuralship
instructional model
Implementation
of instructional
model,
cooperative-
based
entrepreneursh
ip
Master Model
DESIGN
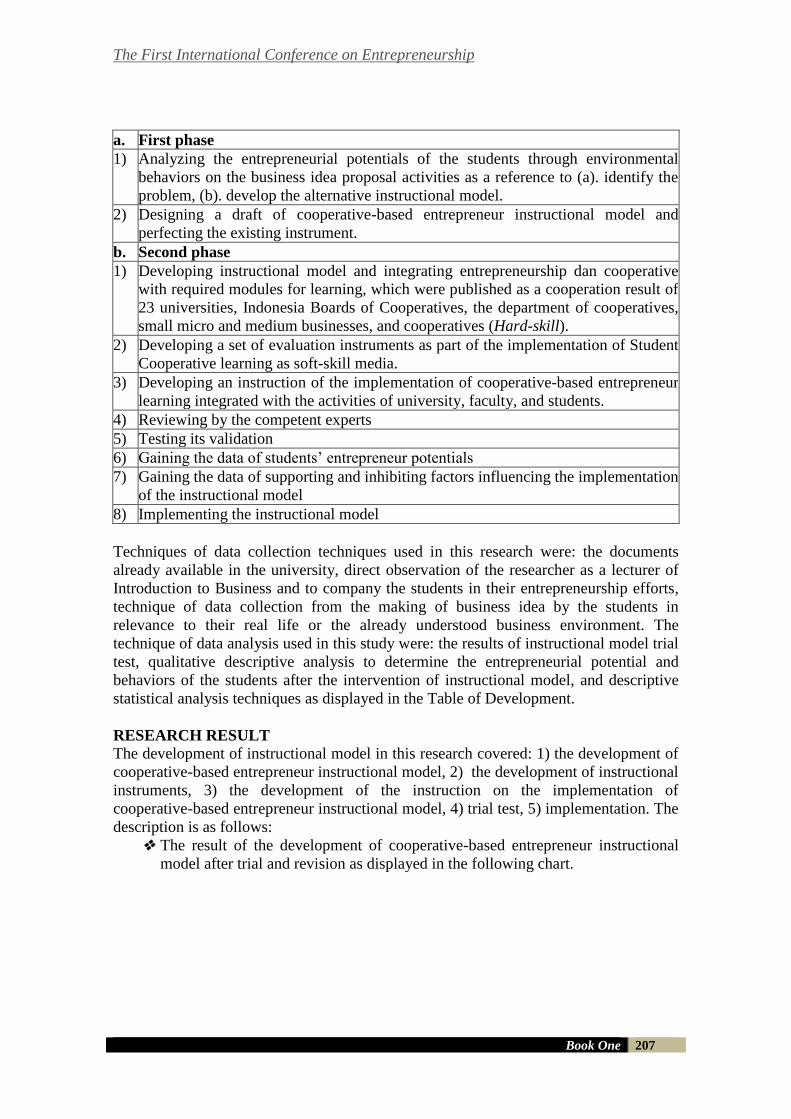
The First International Conference on Entrepreneurship
Book One 207
a. First phase
1) Analyzing the entrepreneurial potentials of the students through environmental
behaviors on the business idea proposal activities as a reference to (a). identify the
problem, (b). develop the alternative instructional model.
2) Designing a draft of cooperative-based entrepreneur instructional model and
perfecting the existing instrument.
b. Second phase
1) Developing instructional model and integrating entrepreneurship dan cooperative
with required modules for learning, which were published as a cooperation result of
23 universities, Indonesia Boards of Cooperatives, the department of cooperatives,
small micro and medium businesses, and cooperatives (Hard-skill).
2) Developing a set of evaluation instruments as part of the implementation of Student
Cooperative learning as soft-skill media.
3) Developing an instruction of the implementation of cooperative-based entrepreneur
learning integrated with the activities of university, faculty, and students.
4) Reviewing by the competent experts
5) Testing its validation
6) Gaining the data of students’ entrepreneur potentials
7) Gaining the data of supporting and inhibiting factors influencing the implementation
of the instructional model
8) Implementing the instructional model
Techniques of data collection techniques used in this research were: the documents
already available in the university, direct observation of the researcher as a lecturer of
Introduction to Business and to company the students in their entrepreneurship efforts,
technique of data collection from the making of business idea by the students in
relevance to their real life or the already understood business environment. The
technique of data analysis used in this study were: the results of instructional model trial
test, qualitative descriptive analysis to determine the entrepreneurial potential and
behaviors of the students after the intervention of instructional model, and descriptive
statistical analysis techniques as displayed in the Table of Development.
RESEARCH RESULT
The development of instructional model in this research covered: 1) the development of
cooperative-based entrepreneur instructional model, 2) the development of instructional
instruments, 3) the development of the instruction on the implementation of
cooperative-based entrepreneur instructional model, 4) trial test, 5) implementation. The
description is as follows:
The result of the development of cooperative-based entrepreneur instructional
model after trial and revision as displayed in the following chart.
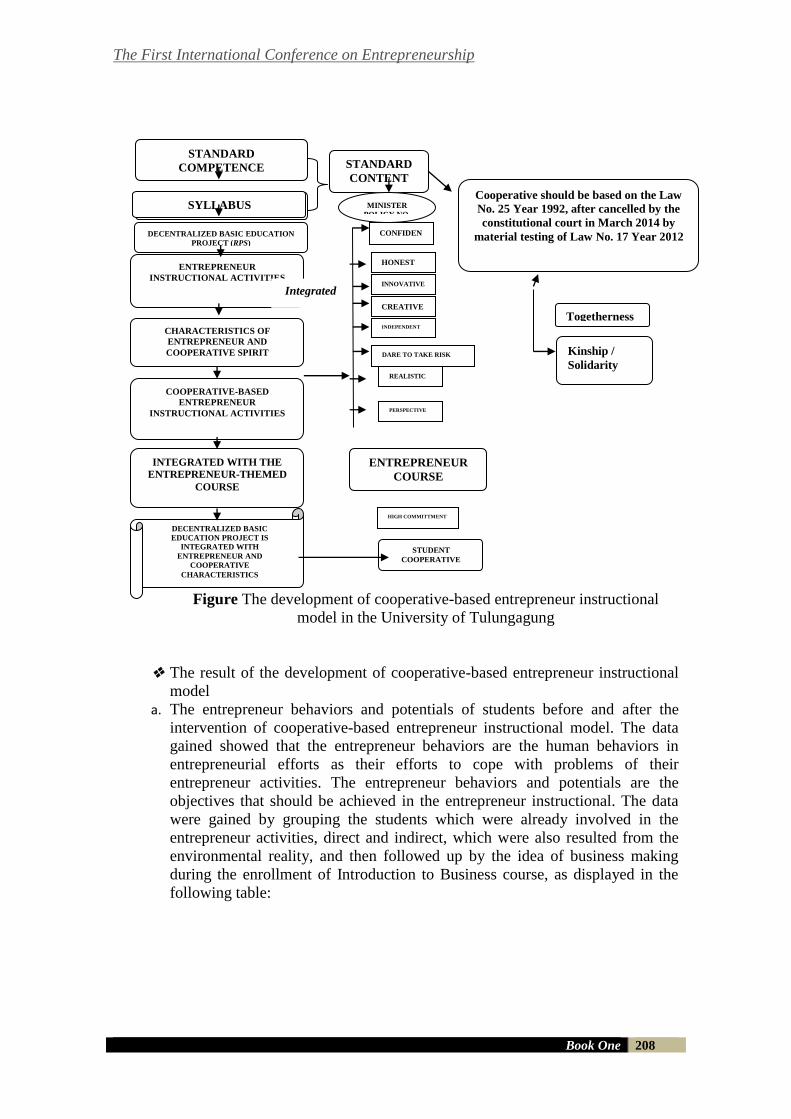
The First International Conference on Entrepreneurship
Book One 208
Figure The development of cooperative-based entrepreneur instructional
model in the University of Tulungagung
The result of the development of cooperative-based entrepreneur instructional
model
a. The entrepreneur behaviors and potentials of students before and after the
intervention of cooperative-based entrepreneur instructional model. The data
gained showed that the entrepreneur behaviors are the human behaviors in
entrepreneurial efforts as their efforts to cope with problems of their
entrepreneur activities. The entrepreneur behaviors and potentials are the
objectives that should be achieved in the entrepreneur instructional. The data
were gained by grouping the students which were already involved in the
entrepreneur activities, direct and indirect, which were also resulted from the
environmental reality, and then followed up by the idea of business making
during the enrollment of Introduction to Business course, as displayed in the
following table:
STANDARD
COMPETENCE
BASIC COMPETENCE SYLLABUS
DECENTRALIZED BASIC EDUCATION
PROJECT (RPS)
ENTREPRENEUR
INSTRUCTIONAL ACTIVITIES
CHARACTERISTICS OF
ENTREPRENEUR AND
COOPERATIVE SPIRIT
COOPERATIVE-BASED
ENTREPRENEUR
INSTRUCTIONAL ACTIVITIES
INTEGRATED WITH THE
ENTREPRENEUR-THEMED
COURSE
DECENTRALIZED BASIC
EDUCATION PROJECT IS
INTEGRATED WITH
ENTREPRENEUR AND
COOPERATIVE
CHARACTERISTICS
STANDARD
CONTENT
MINISTER
POLICY NO.
22 Year 2006
ENTREPRENEUR
COURSE
STUDENT
COOPERATIVE
Cooperative should be based on the Law
No. 25 Year 1992, after cancelled by the
constitutional court in March 2014 by
material testing of Law No. 17 Year 2012
Togetherness
Kinship /
Solidarity
CONFIDEN
T
HONEST
INNOVATIVE
CREATIVE
REALISTIC
PERSPECTIVE
DARE TO TAKE RISK
INDEPENDENT
HIGH COMMITTMENT
Integrated
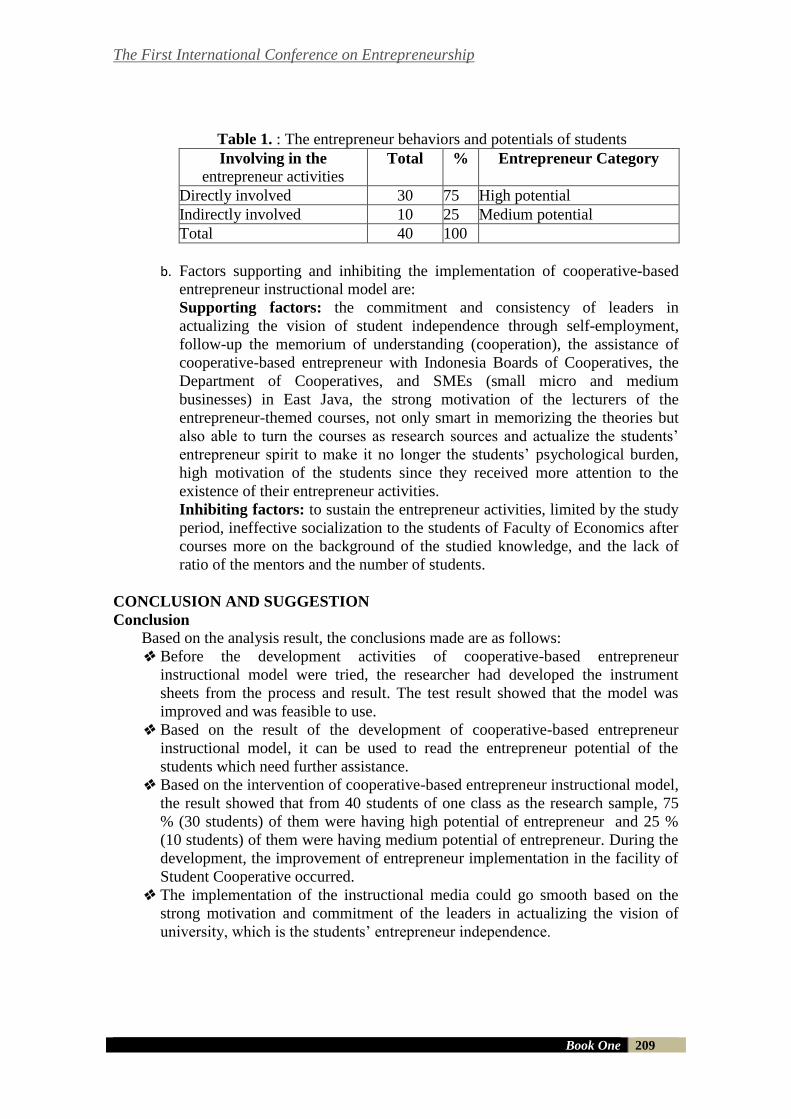
The First International Conference on Entrepreneurship
Book One 209
Table 1. : The entrepreneur behaviors and potentials of students
Involving in the
entrepreneur activities Total % Entrepreneur Category
Directly involved 30 75 High potential
Indirectly involved 10 25 Medium potential
Total 40 100
b. Factors supporting and inhibiting the implementation of cooperative-based
entrepreneur instructional model are:
Supporting factors: the commitment and consistency of leaders in
actualizing the vision of student independence through self-employment,
follow-up the memorium of understanding (cooperation), the assistance of
cooperative-based entrepreneur with Indonesia Boards of Cooperatives, the
Department of Cooperatives, and SMEs (small micro and medium
businesses) in East Java, the strong motivation of the lecturers of the
entrepreneur-themed courses, not only smart in memorizing the theories but
also able to turn the courses as research sources and actualize the students’
entrepreneur spirit to make it no longer the students’ psychological burden,
high motivation of the students since they received more attention to the
existence of their entrepreneur activities.
Inhibiting factors: to sustain the entrepreneur activities, limited by the study
period, ineffective socialization to the students of Faculty of Economics after
courses more on the background of the studied knowledge, and the lack of
ratio of the mentors and the number of students.
CONCLUSION AND SUGGESTION
Conclusion
Based on the analysis result, the conclusions made are as follows:
Before the development activities of cooperative-based entrepreneur
instructional model were tried, the researcher had developed the instrument
sheets from the process and result. The test result showed that the model was
improved and was feasible to use.
Based on the result of the development of cooperative-based entrepreneur
instructional model, it can be used to read the entrepreneur potential of the
students which need further assistance.
Based on the intervention of cooperative-based entrepreneur instructional model,
the result showed that from 40 students of one class as the research sample, 75
% (30 students) of them were having high potential of entrepreneur and 25 %
(10 students) of them were having medium potential of entrepreneur. During the
development, the improvement of entrepreneur implementation in the facility of
Student Cooperative occurred.
The implementation of the instructional media could go smooth based on the
strong motivation and commitment of the leaders in actualizing the vision of
university, which is the students’ entrepreneur independence.

The First International Conference on Entrepreneurship
Book One 210
SUGGESTIONS
1. Sustain the instructional model to be more perfect in actualizing and
exploring the students’ entrepreneur potential and entrepreneur
independence.
2. More effective socialization is needed to the internal and external
stakeholders to condusively support the atmosphere of the university to do
entrepreneur activities.
The First International Conference on Entrepreneurship
Book One 211
THE INFLUENCE PERCEIVED STIMULATION AND
PERCEIVED CROWDING AGAINST IMPULSE BUYING AND
CUSTOMER SATISFACTION RAMAYANA DEPARTMENT
STORE IN SURABAYA
Bambang Purwoko1
University of WR.Supratman
INDONESIA
E-mail: [email protected]
ABSTRACT
The retail business growth that is increasing concurrent with the increase
purchasing power which increased. Ramayana Department store Surabaya is
counters that able to give the added value for its customers by selling some
cosmetic products, clothing, shoes and the need to work divide in full branded.
Purchasing decisions can back onto factors individual customers who tend to
behave affective and perceived stimulation and perceived crowding. In addition,
the research aims to learn more marketing impact relational databases and
commitment relational databases on customer loyalty Ramayana Department
store in Surabaya.
Samples of this research 105 person and data analysis with the model analysts
track mingled with the program SPSS. Results of the discussion can be
concluded that (1) significantly influenced satisfaction to our commitment
relational customers in perceived stimulation partially affect impulse buying
Ramayana Department store in Surabaya, (2) Perceived stimulation partially
affects impulse buying Ramayana Department store in Surabaya, (3) Impulse
buying influence on customer satisfaction Ramayana Department store in
Surabaya, (4) Perceive stimulation partially influential to customer satisfaction
Ramayana Department store in Surabaya with impulse buying variables as
mediation and (5) Perceived stimulation partially affected impulse buying
Ramayana Department store in Surabaya.
Keywords: Perceived Stimulation And Perceived Crowding, Impulse
Buying And Customer Satisfaction
INTRODUCTION
The growth Department store in Indonesia, increase that is quite significant. This was
marked with the increasing glow Department store found in some big cities. Some
Department store as the Sun, SOGO, Ramayana and others, tried to attract customers to
come to travel. The competition was forcing some peritel buyback strategy aimed to be
able to compete with other peritel. One of the strategy to be able to compete with
applying visual merchandise sales strategies with the way display products of the aim to
attract buying interest consumers. This strategy is very effective, because products
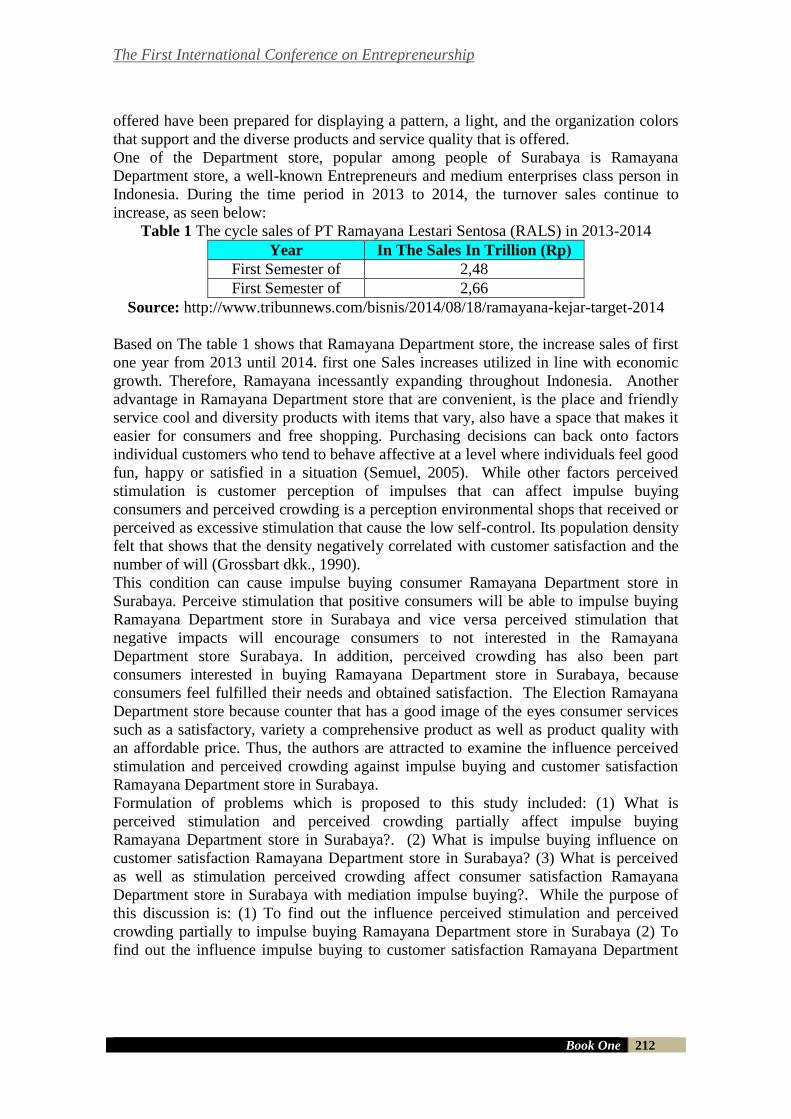
The First International Conference on Entrepreneurship
Book One 212
offered have been prepared for displaying a pattern, a light, and the organization colors
that support and the diverse products and service quality that is offered.
One of the Department store, popular among people of Surabaya is Ramayana
Department store, a well-known Entrepreneurs and medium enterprises class person in
Indonesia. During the time period in 2013 to 2014, the turnover sales continue to
increase, as seen below:
Table 1 The cycle sales of PT Ramayana Lestari Sentosa (RALS) in 2013-2014
Year In The Sales In Trillion (Rp)
First Semester of
2013
2,48
First Semester of
2014
2,66
Source: http://www.tribunnews.com/bisnis/2014/08/18/ramayana-kejar-target-2014
Based on The table 1 shows that Ramayana Department store, the increase sales of first
one year from 2013 until 2014. first one Sales increases utilized in line with economic
growth. Therefore, Ramayana incessantly expanding throughout Indonesia. Another
advantage in Ramayana Department store that are convenient, is the place and friendly
service cool and diversity products with items that vary, also have a space that makes it
easier for consumers and free shopping. Purchasing decisions can back onto factors
individual customers who tend to behave affective at a level where individuals feel good
fun, happy or satisfied in a situation (Semuel, 2005). While other factors perceived
stimulation is customer perception of impulses that can affect impulse buying
consumers and perceived crowding is a perception environmental shops that received or
perceived as excessive stimulation that cause the low self-control. Its population density
felt that shows that the density negatively correlated with customer satisfaction and the
number of will (Grossbart dkk., 1990).
This condition can cause impulse buying consumer Ramayana Department store in
Surabaya. Perceive stimulation that positive consumers will be able to impulse buying
Ramayana Department store in Surabaya and vice versa perceived stimulation that
negative impacts will encourage consumers to not interested in the Ramayana
Department store Surabaya. In addition, perceived crowding has also been part
consumers interested in buying Ramayana Department store in Surabaya, because
consumers feel fulfilled their needs and obtained satisfaction. The Election Ramayana
Department store because counter that has a good image of the eyes consumer services
such as a satisfactory, variety a comprehensive product as well as product quality with
an affordable price. Thus, the authors are attracted to examine the influence perceived
stimulation and perceived crowding against impulse buying and customer satisfaction
Ramayana Department store in Surabaya.
Formulation of problems which is proposed to this study included: (1) What is
perceived stimulation and perceived crowding partially affect impulse buying
Ramayana Department store in Surabaya?. (2) What is impulse buying influence on
customer satisfaction Ramayana Department store in Surabaya? (3) What is perceived
as well as stimulation perceived crowding affect consumer satisfaction Ramayana
Department store in Surabaya with mediation impulse buying?. While the purpose of
this discussion is: (1) To find out the influence perceived stimulation and perceived
crowding partially to impulse buying Ramayana Department store in Surabaya (2) To
find out the influence impulse buying to customer satisfaction Ramayana Department
The First International Conference on Entrepreneurship
Book One 213
store in Surabaya and (3) To find out the influence perceived stimulation and perceived
crowding to customer satisfaction Ramayana Department store in Surabaya with
mediation impulse buying.
LITERATURE REVIEW
Theoretical Approach
The attitude is most important concepts in their studies consumer behavior, with
influence the consumers, the marketer hope to be able to influence on will consumers.
According to Schifman and Kanuk (Simamora, 2002:152) the attitude is an expression
feelings (Inner feeling), which reflects what is a happy/not happy, like/dislike and agree
or not to a subject. Mowen and Minor (2002:319) define this attitude as efeksi or feeling
for or against a stimulus. Mowen and Minor (2002) presents the attitude:319 is at the
core of liked and did not want to, the group, the situation, objects, and ideas did not
come into existence.
1. Perceived Stimulation were categorized into three categories based on individual
comment about the scale stimulation (Mattila and Wirtz, 2008):
a. Stimulation becomes a less (the 0 to 3.5);
b. Neutrals (the scale 3.6 to 4.5); and
c. Stimulation becomes a higher rate (4.6 to 7).
Or previously in psychology shows that a self-decreases when their ability to self-
decreases (Muraven et al,1998). Self-Control that cannot be controlled also applied for
the consumer (Mattila and Wirtz, 2008).
2. Perceived Crowding is a perception reaction affective consumer behavior and
the reaction to the crowded the physical environment (Mattila and Wirtz, 2008).
Research on the density and the number of will that he felt it shows that the density man
is correlated with satisfaction from a negative buyer (Mattila and Wirtz, 2008). Direct
effect of crowding on the room will affect the satisfaction of buyer's shopping and
indirectly led to the emotional changes of the buyer.
3. Impulse Buying
Kotler & Armstrong (2001:195) refers to on will ends the households and individuals
buy goods and services for personal consumption is one of the forms are impulse
buying. According to Bitner, Booms and Tetreault (in 1990), the implications of the
environment shopping toward the behavior will support the assumption that physical
services provide an environment affect consumer behavior. Rook (1998:191), impulse
buying as it happened when consumers suddenly, a strong desire and firm to buy
something as soon as possible.
4. Consumer satisfaction
Wyckop that was quoted from Fandy Tjiptono (2008:59) quality of service as a measure
how good high service that is given to be able to in accordance with ekspetasi customers.
Parasuraman in Precatorius Lupioadi and A. Hamdani (2008:180) quality of service is a
comprehensive assessment on high a good service, the service quality (service quality)
as a result perception of a comparison between hope customers with the actual
performance service. Kotler (2005:36) satisfaction is a joy or disappointed eseorang
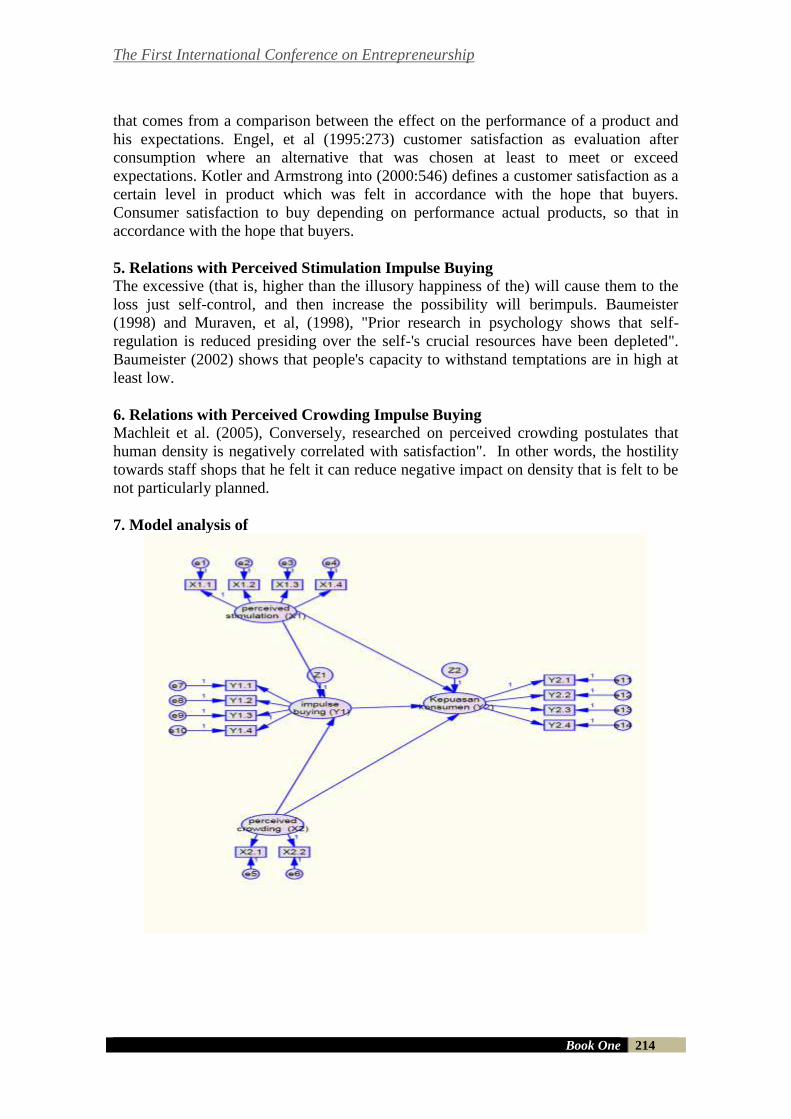
The First International Conference on Entrepreneurship
Book One 214
that comes from a comparison between the effect on the performance of a product and
his expectations. Engel, et al (1995:273) customer satisfaction as evaluation after
consumption where an alternative that was chosen at least to meet or exceed
expectations. Kotler and Armstrong into (2000:546) defines a customer satisfaction as a
certain level in product which was felt in accordance with the hope that buyers.
Consumer satisfaction to buy depending on performance actual products, so that in
accordance with the hope that buyers.
5. Relations with Perceived Stimulation Impulse Buying
The excessive (that is, higher than the illusory happiness of the) will cause them to the
loss just self-control, and then increase the possibility will berimpuls. Baumeister
(1998) and Muraven, et al, (1998), "Prior research in psychology shows that self-
regulation is reduced presiding over the self-'s crucial resources have been depleted".
Baumeister (2002) shows that people's capacity to withstand temptations are in high at
least low.
6. Relations with Perceived Crowding Impulse Buying
Machleit et al. (2005), Conversely, researched on perceived crowding postulates that
human density is negatively correlated with satisfaction". In other words, the hostility
towards staff shops that he felt it can reduce negative impact on density that is felt to be
not particularly planned.
7. Model analysis of
The First International Conference on Entrepreneurship
Book One 215
8. The hypothesis
H1 : Perceived stimulation partially affect impulse buying Ramayana Department store
in Surabaya.
H2 : Perceived crowding partially affect impulse buying Ramayana Department store in
Surabaya.
H3 : Impulse buying influence on customer satisfaction Ramayana Department store in
Surabaya.
H4 : Perceived stimulation and perceived crowding affect impulse buying Ramayana
Department store in Surabaya with impulse buying variable as moderation.
H5 : Perceived stimulation and perceived crowding affect impulse buying Ramayana
Department store in Surabaya with impulse buying variable as moderation.
RESEARCH METHOD
The loading technique samples are non-probability samplings. The withdrawal samples
of using sampling techniques aksidental that is determining samples based on chance.
According to Sugiyono (2005:55) population is a region that are composed
generalization; objects or subjects that have certain characteristics quantity and
determined by researchers to be learned and then drawn to conclude".
The population of this research is that people who have to use and buy Ramayana
Department store in Surabaya. Sugiyono (2005:56) samples are part of the number and
characteristics which is owned by populations that were as many as 105 respondents.
Samples taking do during the week on 15-24 july, 2014 in Ramayana Department Store
THR Mall, Jl. Kusuma Bangsa 116-118, and Ramayana Department Store JMP Plaza, Jl.
Jayengrono 2 Surabaya.
1. The identification variables
Formulated four variables which is to be determined to do and be categorized as
follows:
a. The free variables, namely:
a. Perceived stimulation (X1)
b. Perceived crowding (X2)
b. Variables bound as:
a. Impulse buying (Y1)
b. Consumer satisfaction (Y2)
2. Operational Definition.
a. The Perceived stimulation (X1), Perceived stimulation
is stimulation of consumer perception of positive or
negative ransangan (Mattila's and Wirtz, 2008).
b. Perceived crowding (X2), Perceived crowding is a perception reaction
affective consumer behavior and the reaction to the crowded the physical
environment (Mattila and Wirtz, 2008).
c. Impulse buying (Y1), Impulse buying is done by the consumer Ramayana
Department Store Surabaya in this research impulse buying, presented by
Stern (1962)
d. consumer satisfaction Variable (Y2), The consumer satisfaction is a
feeling happy or upset someone who comes from the comparison of the
The First International Conference on Entrepreneurship
Book One 216
effect on performance or outcomes of a product and his expectations in the
store (Kotker, 2005: 36).
3. Data Sources.
To obtain the relevant data, collecting data throughsurvey questionnaires by
spreading in ways that give you a questionnaire that is closed to the consumer in
accordance with the specified characteristics.
4. Data Analysis techniques.
a. Test Validity.
According to Sugiyono (2005: 267), "Valid means the instrument can be used to
measure what is measured". If the value of the probability of less
than 0.05 so that statement is said to be valid.
b. Test Reliability.
According to Ghozali (2009: 45) is a device used to
measure reliability a questionnaire that is an indicator of variable or invalid
constructs. An invalid constructs or variables are said to be reliability if
cronbach alpha value above 0.6 (Nunnally, 1960) in Ghozali (2009: 46).
c. Test Path Analysis.
According to Al-Rashid (2005), before noticing some assumptions need to
be analysed as follows: (1) the relationships between variables to be linear and
additive, (2) all residue variable had no correlation to each other, (3) patterns
of relationships between variables is recursive or relationship that does not
involve a reciprocal influence direction, (4) the level of measurement interval is
at least all the variables. Based on a conceptual framework, then this
research uses techniques of path analysis is a technique for analyzing
causal relations occurring on multiple regression - free if the variable
affects variables depends not only directly, but also indirectly
(Rutherford 1993 in Sarwono 2007:1). As for the analyst pathway is:
a. Determine the path diagram model based on the paradigm of relationships
between variables.
b. Make a diagram of the route parallels its structure.
c. Analyze by using SPSS to equation substructure analysis of 1 to 4.
1) substructure Equations 1
Y1 = α0 + α1X1 + α2X2 + ε1
Description: Y1 = Impulse buying
X 1 = Perceived stimulation
X 2 = Perceived crowding
α0 = constants
α1, 2, = regression Coefficient associated with the variable free
ε1 = Variable outside of the model (error)
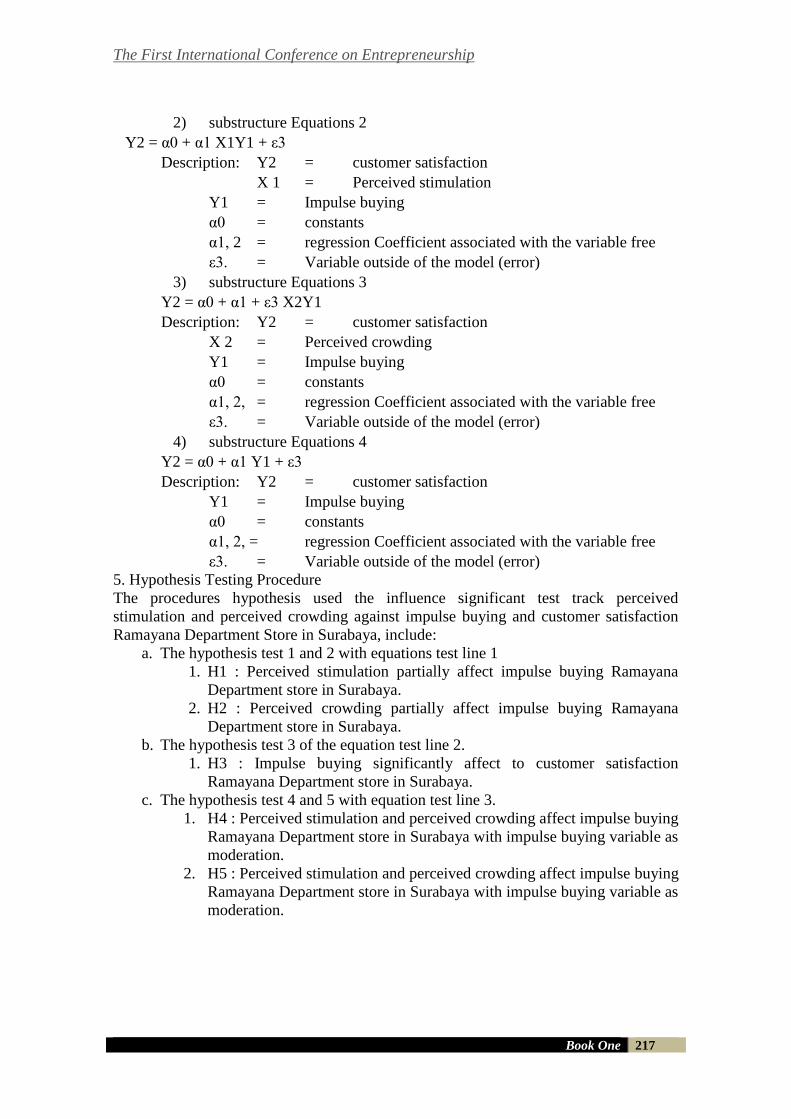
The First International Conference on Entrepreneurship
Book One 217
2) substructure Equations 2
Y2 = α0 + α1 X1Y1 + ε3
Description: Y2 = customer satisfaction
X 1 = Perceived stimulation
Y1 = Impulse buying
α0 = constants
α1, 2 = regression Coefficient associated with the variable free
ε3. = Variable outside of the model (error)
3) substructure Equations 3
Y2 = α0 + α1 + ε3 X2Y1
Description: Y2 = customer satisfaction
X 2 = Perceived crowding
Y1 = Impulse buying
α0 = constants
α1, 2, = regression Coefficient associated with the variable free
ε3. = Variable outside of the model (error)
4) substructure Equations 4
Y2 = α0 + α1 Y1 + ε3
Description: Y2 = customer satisfaction
Y1 = Impulse buying
α0 = constants
α1, 2, = regression Coefficient associated with the variable free
ε3. = Variable outside of the model (error)
5. Hypothesis Testing Procedure
The procedures hypothesis used the influence significant test track perceived
stimulation and perceived crowding against impulse buying and customer satisfaction
Ramayana Department Store in Surabaya, include:
a. The hypothesis test 1 and 2 with equations test line 1
1. H1 : Perceived stimulation partially affect impulse buying Ramayana
Department store in Surabaya.
2. H2 : Perceived crowding partially affect impulse buying Ramayana
Department store in Surabaya.
b. The hypothesis test 3 of the equation test line 2.
1. H3 : Impulse buying significantly affect to customer satisfaction
Ramayana Department store in Surabaya.
c. The hypothesis test 4 and 5 with equation test line 3.
1. H4 : Perceived stimulation and perceived crowding affect impulse buying
Ramayana Department store in Surabaya with impulse buying variable as
moderation.
2. H5 : Perceived stimulation and perceived crowding affect impulse buying
Ramayana Department store in Surabaya with impulse buying variable as
moderation.
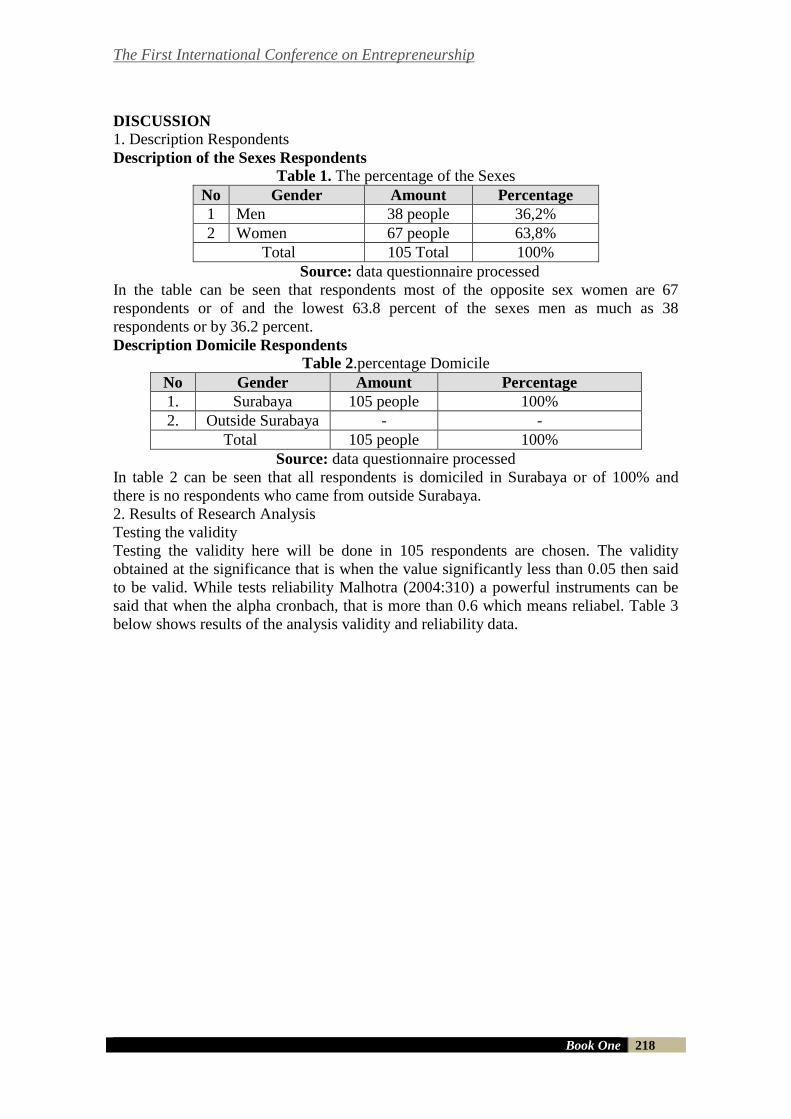
The First International Conference on Entrepreneurship
Book One 218
DISCUSSION
1. Description Respondents
Description of the Sexes Respondents
Table 1. The percentage of the Sexes
No Gender Amount Percentage
1 Men 38 people 36,2%
2 Women 67 people 63,8%
Total 105 Total 100%
Source: data questionnaire processed
In the table can be seen that respondents most of the opposite sex women are 67
respondents or of and the lowest 63.8 percent of the sexes men as much as 38
respondents or by 36.2 percent.
Description Domicile Respondents
Table 2.percentage Domicile
No Gender Amount Percentage
1. Surabaya 105 people 100%
2. Outside Surabaya - -
Total 105 people 100%
Source: data questionnaire processed
In table 2 can be seen that all respondents is domiciled in Surabaya or of 100% and
there is no respondents who came from outside Surabaya.
2. Results of Research Analysis
Testing the validity
Testing the validity here will be done in 105 respondents are chosen. The validity
obtained at the significance that is when the value significantly less than 0.05 then said
to be valid. While tests reliability Malhotra (2004:310) a powerful instruments can be
said that when the alpha cronbach, that is more than 0.6 which means reliabel. Table 3
below shows results of the analysis validity and reliability data.
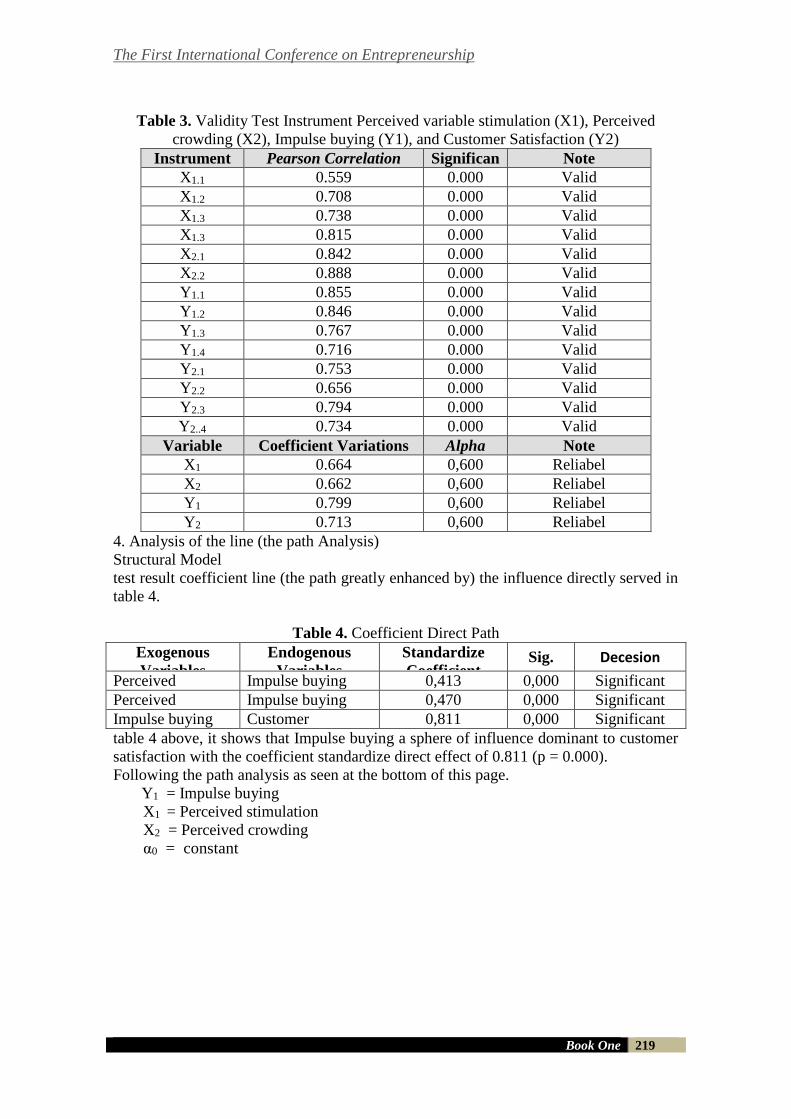
The First International Conference on Entrepreneurship
Book One 219
Table 3. Validity Test Instrument Perceived variable stimulation (X1), Perceived
crowding (X2), Impulse buying (Y1), and Customer Satisfaction (Y2)
Instrument Pearson Correlation Significan
t
Note
X1.1 0.559 0.000 Valid
X1.2 0.708 0.000 Valid
X1.3 0.738 0.000 Valid
X1.3 0.815 0.000 Valid
X2.1 0.842 0.000 Valid
X2.2 0.888 0.000 Valid
Y1.1 0.855 0.000 Valid
Y1.2 0.846 0.000 Valid
Y1.3 0.767 0.000 Valid
Y1.4 0.716 0.000 Valid
Y2.1 0.753 0.000 Valid
Y2.2 0.656 0.000 Valid
Y2.3 0.794 0.000 Valid
Y2..4 0.734 0.000 Valid
Variable Coefficient Variations
Alpha
Alpha
Cronbach
Note
X1 0.664 0,600 Reliabel
X2 0.662 0,600 Reliabel
Y1 0.799 0,600 Reliabel
Y2 0.713 0,600 Reliabel
4. Analysis of the line (the path Analysis)
Structural Model
test result coefficient line (the path greatly enhanced by) the influence directly served in
table 4.
Table 4. Coefficient Direct Path
Exogenous
Variables
Eksogen
Endogenous
Variables
Endogen
Standardize
Coefficient
standardize
Sig. Decesion
Perceived
stimulation
Impulse buying 0,413 0,000 Significant
Perceived
crowding
Impulse buying 0,470 0,000 Significant
Impulse buying Customer
satisfaction
0,811 0,000 Significant
table 4 above, it shows that Impulse buying a sphere of influence dominant to customer
satisfaction with the coefficient standardize direct effect of 0.811 (p = 0.000).
Following the path analysis as seen at the bottom of this page.
Y1 = Impulse buying
X1 = Perceived stimulation
X2 = Perceived crowding
α0 = constant
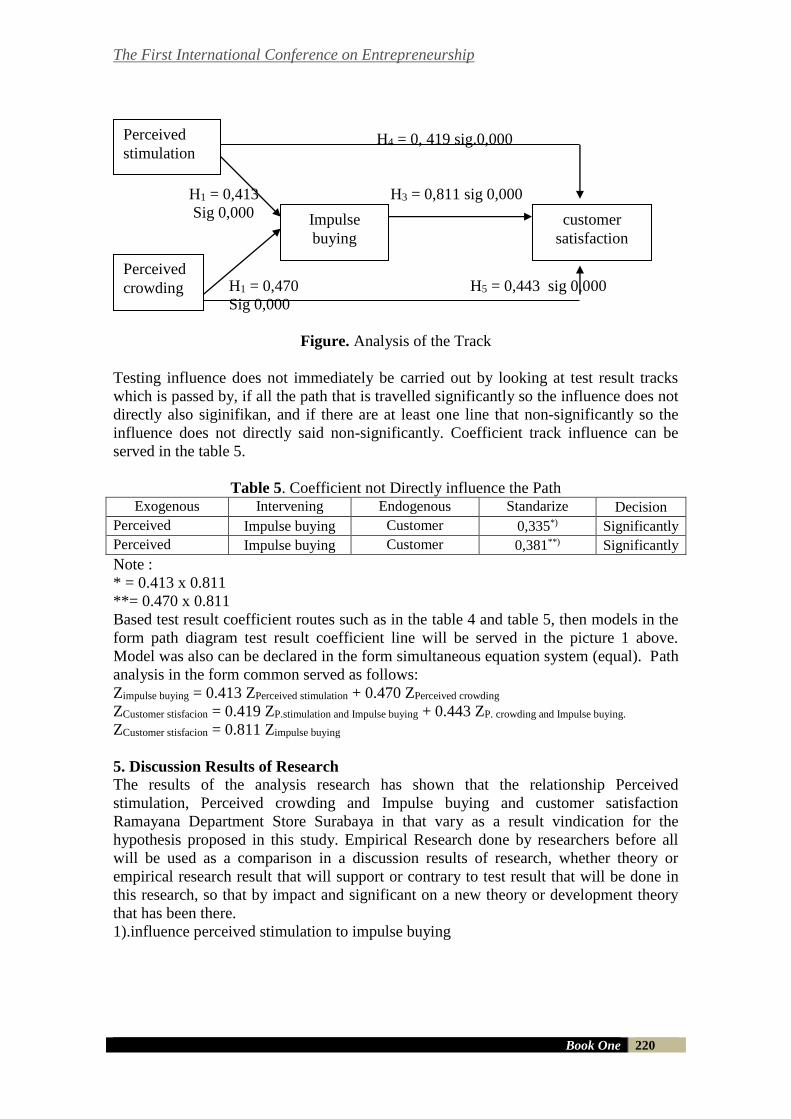
The First International Conference on Entrepreneurship
Book One 220
H4 = 0, 419 sig.0,000
H1 = 0,413 H3 = 0,811 sig 0,000
Sig 0,000
H1 = 0,470 H5 = 0,443 sig 0,000
Sig 0,000
Figure. Analysis of the Track
Testing influence does not immediately be carried out by looking at test result tracks
which is passed by, if all the path that is travelled significantly so the influence does not
directly also siginifikan, and if there are at least one line that non-significantly so the
influence does not directly said non-significantly. Coefficient track influence can be
served in the table 5.
Table 5. Coefficient not Directly influence the Path Exogenous
Variable eksogen
Intervening
Variable
Endogenous
Variable
Standarize
Coefficient Decision
Perceived
stimulation Impulse buying Customer
stisfacion 0,335*) Significantly
Perceived
crowding Impulse buying Customer
stisfacion 0,381**) Significantly
Note :
* = 0.413 x 0.811
**= 0.470 x 0.811
Based test result coefficient routes such as in the table 4 and table 5, then models in the
form path diagram test result coefficient line will be served in the picture 1 above.
Model was also can be declared in the form simultaneous equation system (equal). Path
analysis in the form common served as follows:
Zimpulse buying = 0.413 ZPerceived stimulation + 0.470 ZPerceived crowding
ZCustomer stisfacion = 0.419 ZP.stimulation and Impulse buying + 0.443 ZP. crowding and Impulse buying.
ZCustomer stisfacion = 0.811 Zimpulse buying
5. Discussion Results of Research
The results of the analysis research has shown that the relationship Perceived
stimulation, Perceived crowding and Impulse buying and customer satisfaction
Ramayana Department Store Surabaya in that vary as a result vindication for the
hypothesis proposed in this study. Empirical Research done by researchers before all
will be used as a comparison in a discussion results of research, whether theory or
empirical research result that will support or contrary to test result that will be done in
this research, so that by impact and significant on a new theory or development theory
that has been there.
1).influence perceived stimulation to impulse buying
Perceived
stimulation
Perceived
crowding
customer
satisfaction
Impulse
buying
The First International Conference on Entrepreneurship
Book One 221
Based on test track coefficient direct effect that is served in the table 4 produced a hits
that perceived stimulation to significantly affect impulse buying Surabaya, because the
value significantly 0,000 (<0.05). These research results in the direction of the research
done by Simamora (2004), which shows that the behavior buy consumer is influenced
by store environment or environmental shops. Or Mattila and Wirtz (2008) shows that
such an environment shops are very stimulating and fun so that it will cause an increase
in the drive.
2).influence perceived crowding against impulse buying
Based on test track coefficient direct effect that is served in the table 4 produced a hits
that perceived crowding significantly affect to impulse buying Surabaya, because the
value significantly 0,000 (<0.05). This research is contrary to the statement Stokols in
Vaske and Shelby (2008) that defines a jostled as negative evaluation of its population
density and involves consideration that the density or the number of meetings with other
visitors too much.
3).influence impulse buying to customer satisfaction
Based test track coefficient direct effect that is served in the table 4 produced a hits that
impulse buying significantly affect to customer satisfaction Ramayana Department
Store Surabaya, because the value significantly 0,000 (<0.05). More consumers get
what he hoped at the time it, then it is very likely that consumers will buy back (Wong
and Sohal, 2003).
4).influence perceived stimulation to customer satisfaction with impulse buying variable
as mediation.
Based on test track coefficient influence not directly served in the table 5 produced a
hits that perceived stimulation significantly affect to customer satisfaction with impulse
buying variable as mediation, because the value significantly 0,002 (<0.05). From test
result can be concluded that the hypothesis 4 stating that perceived stimulation
significantly affect to customer satisfaction with impulse buying as mediation is proven.
This research is supported with the research done by Mattila and Wirtz (2008) shows
that such an environment shops are very stimulating and fun so that it will cause an
increase in the drive. Consumer decision to buy impulsif can resulted by the high level
of comfort that was created by the stimulus environmental shops (Chen, 2008).
5).influence perceived crowding to customer satisfaction with impulse buying variable
as mediation.
Based on test track coefficient direct effect that is served in the table 5 produced a hits
that perceived crowding significantly affect to impulse buying Surabaya, because the
value significantly 0,000 (<0.05). From test result can be concluded that the hypothesis
5 (five) stating that perceived crowding significantly affect to customer satisfaction with
impulse buying as mediation is proven. This research is contrary to the statement
Stokols in Vaske and Shelby (2008) that defines a jostled as negative evaluation of its
population density and involves consideration that the density or the number of
meetings with other visitors too much.
Baumeister (1998) and Muraven, et al, (1998), "Prior research in psychology shows that
self-regulation is reduced presiding over the self-'s crucial resources have been
depleted". Baumeister (2002) shows that people's capacity to hold the most humble is
at the level at the end of the day when the spirit to shop more decreases.
The First International Conference on Entrepreneurship
Book One 222
THE CONCLUSIONS, , IMPLICATIONS AND LIMITATIONS
1. The conclusions
Based on the results of the analysis and discussion on, so it can be conclused as follow:
a. Perceived stimulation affect impulse buying Ramayana Department store in
Surabaya with the value of 0.413 coefficient standardise and significantly of
0.000.
b. Perceived stimulation affect impulse buying Ramayana Department store in
Surabaya with the value of 0.470 coefficient standardise and significantly of
0.000.
c. Impulse buying influence on customer satisfaction Ramayana Department store
in Surabaya with the value of 0.811 coefficient standardise and significantly of
0.000.
d. Perceived stimulation influential to customer satisfaction Ramayana Department
store in Surabaya with impulse buying variable as mediation have the coefficient
standardise of 0.419 and significantly of 0.000.
e. Perceived stimulation affect impulse buying Ramayana Department store in
Surabaya with the coefficient standardise each of 0.443 and significantly of
0.000.
2. The implications
After these variables in analysis that is observed in this research and her conclusion,
there are several implications:
a. The policies that when it comes to perceived stimulation and perceived
stimulation that had been implemented by Ramayana Department store in
Surabaya in marketing, especially in in policies to influence on buy impulsif put
must be maintained and improved so that intention consumer spending will
increase.
b. Customers to be satisfied with the environment that is comfortable and cool and
not jostled shopping time that given by Ramayana Department store in
Surabaya.
c. Advanced researchers should be added variables which are used to measure, so
or become more perfect
3. Limitations
limitation in this research is:
a. In this research did not discuss customer loyalty Ramayana Department store
in Surabaya in terms of the life style that results of research is only focused
relashionship marketing. This means that the loyal customers this research to
Ramayana Department store in Surabaya, due to the fact that the relationship
between customer and Ramayana Department store, it is not because customers
require Ramayana Department store because to follow the trend or lifestyle.
b. In this research respondents only who lived in Surabaya.
The First International Conference on Entrepreneurship
Book One 223
REFERENCES
Algifari, 2000, Analisis Regresi Teori, Kasus dan Solusi, Edisi 2, Yogyakarta: BPFE.
Anoraga, P., 2004, Manajemen Bisnis, Jakarta: Rhineka Cipta.
Berry, L., 1995, Relationship Marketing of Services Growing Interest: Emerging Perspectives,
Journal of the Academy Marketing Science, Vol. 23. No.4, page 236-245.
Chen, Tsai. 2008. Impulse Purchase Varied by Products and Marketing Channels.Journal
ofInternational Management Studies.
Cooper, D.R., and Schindler, P.S., 2003, Business Research Methods, Eight Edition, Mc
GrawHill: Boston
Ghozali, Imam., 2007, Aplikasi: Analisis Multivariate dengan Program SPSS, Semarang:
Universitas Diponegoro.
Kim, K.H., Kim, K.S., Kim, D.Y., Kim, J.H., dan Kang, S.H., 2008, Brand Equity in Hospital
Marketing, Journal of Business Research 61, 75-82.
Kuncoro, M., 2003, Metode Riset untuk Bisnis dan Ekonomi. Jakarta: Erlangga.
Malhotra, N.K, 2005, Riset Pemasaran: Pendekatan Terapan, Jakarta: Indeks Kelompok
Gramedia.
Mattila, A. S. and Wirtz, J. 2008. The role of store environmental stimulation and social factors
on impulse purchasing. Journal of Services Marketing, Vol.22, No. 7, pp. 562-567.
Mattila, Anna S. dan Wirtz, Jochen. 2007. TheRole of Store Environmental Stimulation And
Social Factors on Impulse Purchasing, Journal ofServices Marketing,
Morgan, R., M., and Shelby D. Hunt, 1994, The Comminment Trust Theory of Relationship
Marketing, Journal of Marketing, July.
Mowen, J. C. and Michael Minor. 2001. Consumer Behavior. Fifth Edition, Harcourt, Inc.
Mowen, John C., 1995, Customer Behavior, Fourth Edition, International Edition, Englewood
Cliffs, New Jersey: Prentice Hall Inc..
Prasasti, R.D., Chaniago, H., dan Sutarso, Y., .2003, Pengaruh Relationship Marketing terhadap
Kepuasan Pelanggan dalam Industri Jasa Asuransi Jiwa, Jurnal Ventura, Vol.6, No.2,
Agustus 127-145.
Sarwono, J., 2007, Analisis Jalur untuk Riset Bisnis dengan SPSS, Andi: Yogyakarta
Soehartono, I., 2008, Metode Penelitian Sosial, Bandung: Remaja Rosdakarya.
Sugiyono, 2005, Statistika untuk Penelitian, Bandung: Alfabeta.
Tjiptono, F., 2006, Manajemen Jasa, Yogyakarta: Andi.

The First International Conference on Entrepreneurship
Book One 224
Umar, H, 2003, Riset Akuntansi, Jakarta: Gramedia.
Widiana, M., E., 2004, Dampak Faktor-faktor Pemasaran Relasional dalam Membentuk
Loyalitas Nasabah Pada Bisnis Asuransi, Majalah Ekonomi, Universitas Airlangga
Tahun XIV, No.3 Desember, Surabaya.
Yamit, Zulian, 2004, Manajemen Kualitas Produk dan Jasa, Yogyakarta: Ekonisia.
http://www.tribunnews.com/bisnis/2014/08/18/ramayana-kejar-target-2014, diakses tanggal 20
Agustus 2014
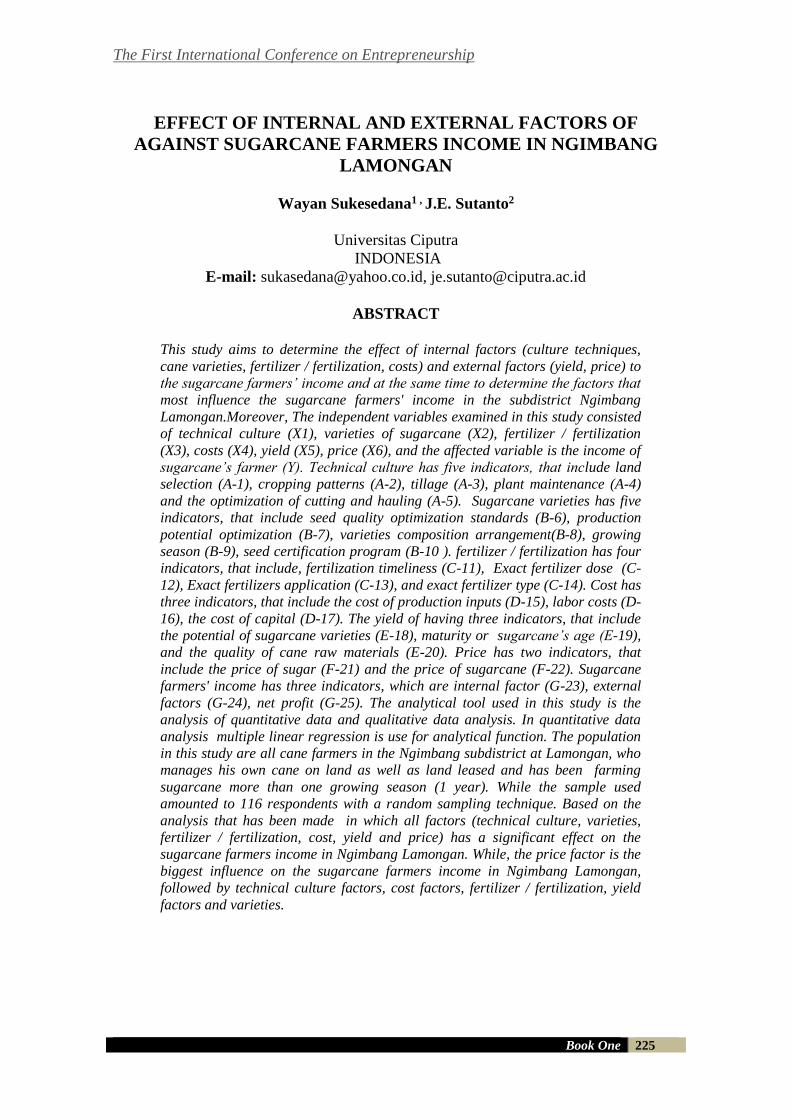
The First International Conference on Entrepreneurship
Book One 225
EFFECT OF INTERNAL AND EXTERNAL FACTORS OF
AGAINST SUGARCANE FARMERS INCOME IN NGIMBANG
LAMONGAN
Wayan Sukesedana1 , J.E. Sutanto2
Universitas Ciputra
INDONESIA
E-mail: [email protected], [email protected]
ABSTRACT
This study aims to determine the effect of internal factors (culture techniques,
cane varieties, fertilizer / fertilization, costs) and external factors (yield, price) to
the sugarcane farmers’ income and at the same time to determine the factors that
most influence the sugarcane farmers' income in the subdistrict Ngimbang
Lamongan.Moreover, The independent variables examined in this study consisted
of technical culture (X1), varieties of sugarcane (X2), fertilizer / fertilization
(X3), costs (X4), yield (X5), price (X6), and the affected variable is the income of
sugarcane’s farmer (Y). Technical culture has five indicators, that include land
selection (A-1), cropping patterns (A-2), tillage (A-3), plant maintenance (A-4)
and the optimization of cutting and hauling (A-5). Sugarcane varieties has five
indicators, that include seed quality optimization standards (B-6), production
potential optimization (B-7), varieties composition arrangement(B-8), growing
season (B-9), seed certification program (B-10 ). fertilizer / fertilization has four
indicators, that include, fertilization timeliness (C-11), Exact fertilizer dose (C-
12), Exact fertilizers application (C-13), and exact fertilizer type (C-14). Cost has
three indicators, that include the cost of production inputs (D-15), labor costs (D-
16), the cost of capital (D-17). The yield of having three indicators, that include
the potential of sugarcane varieties (E-18), maturity or sugarcane’s age (E-19),
and the quality of cane raw materials (E-20). Price has two indicators, that
include the price of sugar (F-21) and the price of sugarcane (F-22). Sugarcane
farmers' income has three indicators, which are internal factor (G-23), external
factors (G-24), net profit (G-25). The analytical tool used in this study is the
analysis of quantitative data and qualitative data analysis. In quantitative data
analysis multiple linear regression is use for analytical function. The population
in this study are all cane farmers in the Ngimbang subdistrict at Lamongan, who
manages his own cane on land as well as land leased and has been farming
sugarcane more than one growing season (1 year). While the sample used
amounted to 116 respondents with a random sampling technique. Based on the
analysis that has been made in which all factors (technical culture, varieties,
fertilizer / fertilization, cost, yield and price) has a significant effect on the
sugarcane farmers income in Ngimbang Lamongan. While, the price factor is the
biggest influence on the sugarcane farmers income in Ngimbang Lamongan,
followed by technical culture factors, cost factors, fertilizer / fertilization, yield
factors and varieties.
The First International Conference on Entrepreneurship
Book One 226
Keywords: Technical Culture, Varieties, Fertilizer / Fertilization, Cost,
Yield, And Price
INTRODUCTION
Indonesia has experienced the glory of sugar industry in the 1930s. This can happen due
to the ease of obtaining fertile land, cheap labor, irrigation priorities, and discipline in
the technology application (Susila, 2005: 1)
As a country with growing purchasing power, Indonesia has the potential to become one
of the world's largest sugar consumer. In accordance with research Sugiyanto (2007)
Indonesian sugar consumption in 2014 reached 11.47 kg per capita/year and will
increase to 13.06 kg per capita/year by 2020, this figure is still below the average of
world sugar consumption that have been reach 20 kg per capita per year (Sugiyanto,
2007: 114).
Government and sugar industry stakeholder in Indonesia should aware of business
opportunities above and take proper action. Indonesia was known as the leading world
sugar producer in the past. The main production center of sugarcane plantations in
Indonesia are located in: East Java, Central Java, Lampung, West Java and DI
Yogyakarta, reaching 99.28% contribution to the total production of sugarcane
plantations in Indonesia.
Sugarcane (Saccharum officinarum Linn.) Is a strategic commodity as the main raw
material for the sugar manufacturer (Asmara and Nurholifah, 2010: 109). Demand
increment for sugar should be able to provide the opportunities for sugarcane farmers to
do farming. Sutrisno (2009: 155) says that agriculture and farming today not merely as
a "way of life" but also has become the real business. Therefore, the farmers have to
consider the business cost and income, including the income of farmers in managing the
business.
Empirical data shows drop in sugar prices impact on farmers for their losses (read: a
decrease of the farmers income), followed by shrinkage of sugarcane area, especially in
the region that are highly dependent on sugarcane farmers, such as in East Java. As a
matter of fact, in 2002 when the price of sugar fell from Rp 3,400 to Rp 2,600 per kg,
sugar cane area in East Java in 2003 shrank as many as 11 thousand hectares. The sugar
price reduction not only reducing sugarcane plantation area but also decreasing crop
productivity, as farmers are reluctant to maintain good cane. Proven in 2002 averages
the crystal (sugar) dropped from 5.27 tons per hectare to 5.17 tons per hectare
(Toharisman, 2013). The low price of sugar is not the only one that affects the level of
income of farmers. But is also influenced by factors in the sugar mills and cane growers
quality (off farm and on farm).
The low yield and production of crystal sugar by Sutrisno (2009) due to the lack of
proper technical culture, especially in terms of the selection of land, cropping pattern,
soil tillage, crop maintenance, harvesting and transport optimization. Cultivation and
management of sugarcane varieties that have not been in accordance with the planting
season, is also a cause of low yield and production of crystal sugar.
In addition to the above problems, the determination of HPP (basic price) sugar policy
in 2014 by the government through the Minister of Trade Regulation No. 25/2014
The First International Conference on Entrepreneurship
Book One 227
Benchmark Pricing White Crystal Sugar Growers in 2014 amounted to Rp 8,250 per kg
was considered too low, where as the results based on yield calculations APTRI
(farmers organizations) including Cost of Goods Manufactured (BPP) and the land lease
should be Rp 9,500 per kg (Sunanto and Musyawir in Azizah, 2014).
From the description above, Internal Factors (teknnis culture, cane varieties, fertilizer /
fertilizer, and costs) and External Factors (yield and price) simultaneously or partially
can affect sugarcane farmers' income in Indonesia (Sutrisno, 2009 and Yanutya, 2013)
including east of Java, Lamongan and Ngimbang. On the basis of the above problems,
then a study entitled: “Effect of Internal and External Factors for Sugarcane Farmers
Income in Ngimbang Lamongan”, was performed.
Identification and Formulation of Problem
1. Are there affect of technical factors, cane varieties, fertilizer / fertilization,
cost, yield, and price of against income cane farmers in Ngimbang
Lamongan?
2. what is the most factor influential of incomes against sugarcane farmers in
Ngimbang Lamongan?
Research Objectives
1. To determine the influence of technical culture, cane varieties, fertilizer /
fertilization, cost, yield, and price of against income cane farmers in
Ngimbang Lamongan.
2. To determine the most factor influential of incomes against sugarcane farmers
in Ngimbang Lamongan.
Technical culture
According Kuntorohartono in Sutrisno (2009) technical culture is defined technically as
a set of activities required to prepare the environmental conditions for the growth and
development of sugarcane. Selection technique of field such as irrigated land done on
the pattern A (May-July), while the rain-fed land, must follow the pattern B
(September-November). Tillage aims to create the best conditions for the growth and
development of sugarcane roots. Plant maintenance including fertilization, cultivation,
weeding, pest control and disease, irrigation or drainage, and leaf stripping, should be
intensively done and on time. Optimization of cutting transport associated with the age
and maturity of the cane. Because transport is very complex cutting jobs, the amount of
supply of cane every day, the availability of logging, transportation, the readiness of the
road, cutting transport infrastructure, etc. Technical culture of sugar cane is often
regarded as a pre-condition to support the response of fertilizer, improved varieties,
irrigation, weed and pest control of the cooking process or filling the sugar in cane
stalks (Sutrisno, 2009).
Sugarcane varieties
Variety is defined as a collection of plants which have genetic and phenotypic
properties of the same. Yielding varieties is a collection of the same plant and have
certain superior properties (Sugiyarta in Sutrisno, 2009). Some important things to note
The First International Conference on Entrepreneurship
Book One 228
associated with sugarcane varieties, are as follows: Optimization of seed quality
standards through seed certification test. Optimization of the production potential by
ensuring as much as possible so that the full potential of a superior varieties can be
realized. Efforts to optimize the production potential of each variety can be a way to
meet all the requirements to grow the best. Structuring varieties namely arranging
varieties to match the maturity level of each variety of sugar cane and adapted to the
harvest period. Planting season is the perfect time to perform activities of sugarcane
cultivation.
In a study Sutrisno (2009) found that varieties very significant effect on sugarcane
farmers income, it is reinforced by research Pratiwi and Priest (2003) which says that
the contribution to the production of sugar varieties can reach 60%.
Fertilizers and Fertilization
Fertilizers are solids, liquids or gases containing nutrients that plants require, non toxic
and can be administered through soil (Ismail in Sutrisno 2009). Applications and
fertilization know-how is very important to produce optimal sugarcane yield (Nazir.
Et.al, 2013). Research results Hussain and Khattak in Dlamini and Masuku (2012)
found that increased use of chemical fertilizers can increase sugarcane productivity if
applied on time, right dose, right methode of application, and the exact type of fertilizer
used. Timely means fertilization when plants need extra nutrients. Fertilization should
be done several stages according to the phases of sugarcane growth. This is consistent
with that proposed by Sandara in Chidoko and Chimwai (2011) that timely aplicated
fertilizer will produce the most good plant growth. Mean dose to the exact fertilizer
application should be in accordance with the results of soil analysis. Exactly how the
application means the application of fertilizer should be done the right way. The goal is
that the fertilizer applied is not lost (especially nitrogen fertilizer) and also fertilizers are
not easily swept away in the flow of surface water. The right kind of fertilizer meant for
the use of fertilizers that have the exact nutrient content.
Cost
Cost is around the sacrifices or the input value used for farming process. Costs are
grouped into: production cost, labor costs, and capital costs. Cost of production, are
consisted of all supporting facilities costs that is related to sugarcane cultivation, these
include: the cost of fertilizers, agricultural chemical costs, and others. Labor costs,
which are expenses incurred to pay the wages of all workers or laborers for sugarcane
cultivation activities. The capital costs associated with the additional amount of interest
from each source of funds borrowed and used by farmers in the farm. Research Sutrisno
(2009) found that the cost factor affects the income of farmers in sugar cane plant of
Mojo Sragen.
Yield
Yield is sugar content in sugarcane expressed in percentage. Mochtar in Sutrisno (2009)
yield is sugar produced from each quintal of sugarcane. Yield of sugarcane is strongly
influenced by: the variety, maturity (sugarcane age) and quality of raw materials from
the field until the sugar cane milled (Marjayanti 2006 in Sutrisno, 2009). Several factors
that affect the yield are as follows: The potential varieties or any variety characters in
The First International Conference on Entrepreneurship
Book One 229
addition to the technical culture, climate factors influence on the yield of sugarcane,
Maturity and age related to the future sugarcane planting. If the cane is planted in the
right age and maturity of the obtained optimal cane. The quality of raw materials
associated with slash transport process. Harvested cane must be sweet, clean and fresh.
The results of the study Sutrisno (2009) that the yield factor biggest impact on farmers
income in the plant cane sugar Mojo Sragen.
Price
Price is the amount of money exchanged for a product or service. Price is the amount of
value exchanged for a number of consumer benefits by having or using a product or
service. The common perception is that it applies a high price reflects its high quality
(Tjiptono 2008 in Yanutya, 2013). Sugar price despite market affecting its mechanism,
but HPP (basic price) of sugar from the government remain as the benchmark. Yanutya
Research (2013) find that the price has a positive and significant relationship to the
sugarcane farmers income in Japon Blora.
Sugarcane Farmers Income
Rahim in Yanutya (2013) says that farm income is the difference between revenue and
all costs incurred in farming. Revenues and costs of farming can be influenced by
internal and external factors. Internal factors that affect farmers' income include:
technical culture, varieties, fertilizers, and farming costs. External factors that affect
farmers' income, including: the yield and price of sugarcane. Gross receipts is the result
obtained by multiplying production by selling price in the sugar cane milling season (in
Yanutya Rahim, 2013). Net profit (income) is the difference between total revenue and
total cost incurred in the production process, in which all inputs family-owned
calculated as production costs (Sukirno in Yanutya, 2013).
Hipotesis
H1 : The technical culture would affect sugarcane farmer’s income
H2 : The sugarcane varieties would affect sugarcane farmer’s income
H3 : The fertilizer / fertilization would affect sugarcane farmer’s income
H4 : The cost factor would affect sugarcane farmer’s income
H5 : The yield of sugarcane would affect sugarcane farmer’s income
H6 : The price of sugarcane would affect sugarcane farmer’s income
Research approach
This study was a quantitative descriptive survey method. To confirm and clarify the
results of quantitative research, qualitative research was also conducted using in-depth
interviews with some farmers selected respondents. Interviewed farmers should be able
to represent the overall sugarcane farmers, as well as having extensive knowledge and
insight about the sugar cane farming. Both studies quantitative and qualitative
conducted in the same population, ie sugar cane farmers who are sub district of
Ngimbang Lamongan. This method is said to be suitable Sugiyono (2014: 83) that the
survey method used to obtain the data from a particular place is conventionally using
the data collection instrument or in the form of questionnaires and interviews.
The First International Conference on Entrepreneurship
Book One 230
Sampling Method
The sampling method with probability sampling, the sampling techniques that provide
equal opportunities for every member of the population to be elected as members of the
sample. The population in this study were all cane farmers in the district who are
Ngimbang Lamongan, has made farming more than one growing season. The sample is
part of a population whose characteristics are considered representative of the
population.
Data Collection Method
1. Quantitative Data Collection
Questionnaire used in the data collection according Likert scale, which is commonly
used to measure attitudes, opinions, and perceptions of a person or group of people
about the phenomenon. The Likert scale gradation, as follows: (4) Strongly Agree, (3)
Agree, (2) Disagree, (1) Strongly Disagree. Before being used to retrieve data, such
instruments will be tested for validity and reliability.
2. Qualitative Data Collection
Qualitative data was collected by conducting in-depth interviews (indept interview)
against three farmers (informants) were purposefully selected and has advantages
compared with other farmers. And the data were extracted from the interview revolves
around the statements contained in the instrument (questionnaire) from quantitative
research.
Quantitative Data Analysis
1. Multiple Linear Regression Analysis
Multiple linear regression analysis formula, as follows:
Y = a + b1x1+b2X2+ b3X3+ b4X4+b5X5+b6X6+ Є
Y = income of farmers
X1 = technical culture
X2 = sugarcane varieties
X3 = Fertilizer / fertilization
X4 = Cost
X5 = Yield of
X6 = Price
A = constant Numbers
b1 = regression coefficient of the variable X1
b2 = regression coefficient of variable X2
b3 = regression coefficient of variable X3
b4 = regression coefficient of variable X4
b5 = Regression coefficient variable X5
b6 = regression coefficient of variable X6
Є = Error (error term).
The First International Conference on Entrepreneurship
Book One 231
2. Testing Parameters
2.1. Individual Significance Test (Test Statistically t)
Aiming to compare whether two samples are from the same population or not.
According Kuncoro (2013: 244) t statistical test basically shows how far the influence
of the individual independent variables in explaining the affected variable variation.
2.2. Accuracy Test Model
2.2.1. Simultaneous Significance Test (Test Statistic F)
F statistic test shows whether all the independent variables included in the model have
jointly effecting the dependent variable.
2.2.2. The coefficient of determination (R2)
Determination coefficient (R2) measures how far the model's ability to explain
variation in the dependent variable. Determination coefficient is between zero and one.
Value close to one means that the independent variables provide almost all the
information needed to predict the dependent variable (Kuncoro, 2013: 246).
2.2.3. Coefficient of Partial Determination (Partial R2)
Partial determination coefficient (R2 partial) aims to determine the most influential
independent variable on the dependent variable. The independent variables that have the
largest partial R2 values are independent variables that the most influence to the
dependent variable.
Qualitative Data Analysis
According Creswell in Sugiyono (2014: 347) says that qualitative research means the
process of exploration and understanding the meaning of the behavior of individuals
and groups, describing social problems or problems of humanity.
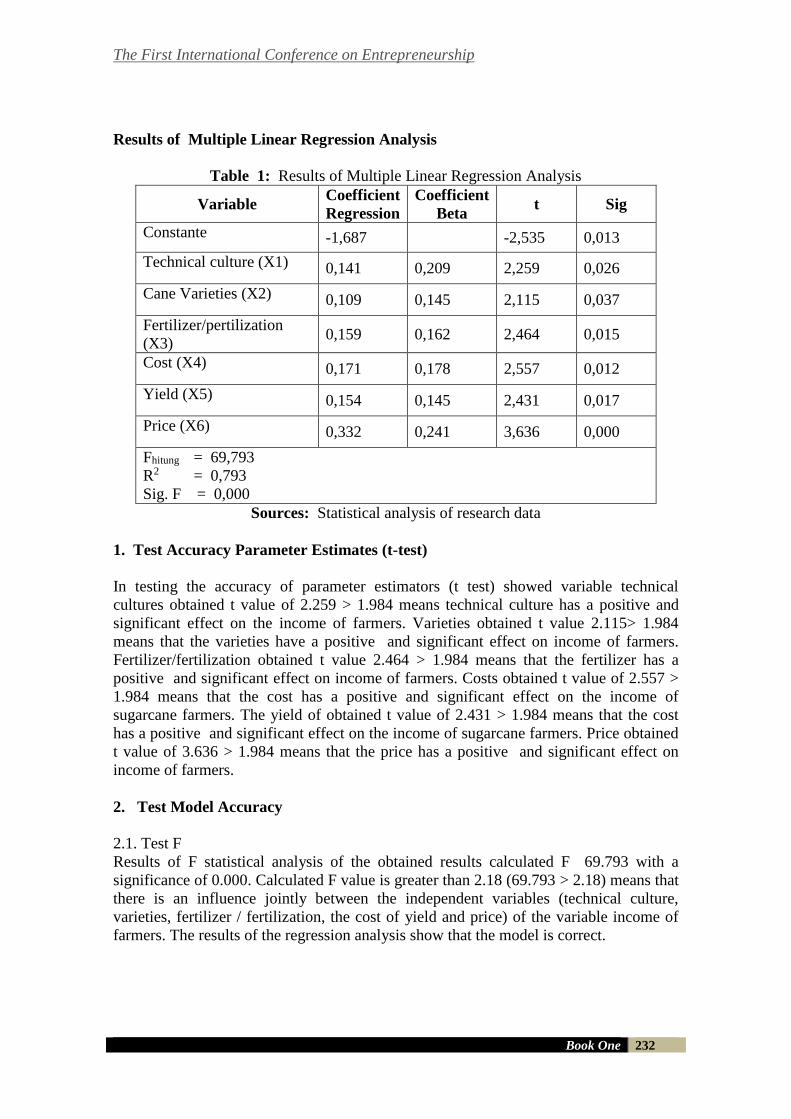
The First International Conference on Entrepreneurship
Book One 232
Results of Multiple Linear Regression Analysis
Table 1: Results of Multiple Linear Regression Analysis
Variable Coefficient
Regression
Coefficient
Beta t Sig
Constante -1,687 -2,535 0,013
Technical culture (X1) 0,141 0,209 2,259 0,026
Cane Varieties (X2) 0,109 0,145 2,115 0,037
Fertilizer/pertilization
(X3) 0,159 0,162 2,464 0,015
Cost (X4) 0,171 0,178 2,557 0,012
Yield (X5) 0,154 0,145 2,431 0,017
Price (X6) 0,332 0,241 3,636 0,000
Fhitung = 69,793
R2 = 0,793
Sig. F = 0,000
Sources: Statistical analysis of research data
1. Test Accuracy Parameter Estimates (t-test)
In testing the accuracy of parameter estimators (t test) showed variable technical
cultures obtained t value of 2.259 > 1.984 means technical culture has a positive and
significant effect on the income of farmers. Varieties obtained t value 2.115> 1.984
means that the varieties have a positive and significant effect on income of farmers.
Fertilizer/fertilization obtained t value 2.464 > 1.984 means that the fertilizer has a
positive and significant effect on income of farmers. Costs obtained t value of 2.557 >
1.984 means that the cost has a positive and significant effect on the income of
sugarcane farmers. The yield of obtained t value of 2.431 > 1.984 means that the cost
has a positive and significant effect on the income of sugarcane farmers. Price obtained
t value of 3.636 > 1.984 means that the price has a positive and significant effect on
income of farmers.
2. Test Model Accuracy
2.1. Test F
Results of F statistical analysis of the obtained results calculated F 69.793 with a
significance of 0.000. Calculated F value is greater than 2.18 (69.793 > 2.18) means that
there is an influence jointly between the independent variables (technical culture,
varieties, fertilizer / fertilization, the cost of yield and price) of the variable income of
farmers. The results of the regression analysis show that the model is correct.
The First International Conference on Entrepreneurship
Book One 233
2.2. The coefficient of determination (R2)
The coefficient of determination is used to determine how much the independent
variables can explain the dependent variable. R2 value of 0.793 indicates the selection
of the independent variables in explaining the variation in revenue of 79.3%, the
remaining 20.7% is determined by other variables outside the model. Thus the selected
explanatory variables are able to explain the variation in income.
2.3. Coefficient of Partial Determination (Partial R2)
Based on the analysis of the data found that the independent variable has a value price
largest partial R2, is equal to 0.241 This means the greatest effect on the dependent
variable Y (sugarcane farmers income). Followed by variable technical culture = 0.209;
variable costs = 0,178; variable fertilizer / fertilization = 0.162 and variable yield and
sugarcane varieties respectively = 0.145
Discussion
1. Effect of Technical Culture Against Farmers Income
Technical culture positive and significant effect on income of sugarcane farmers in
Ngimbang Lamongan. This means determine the technical culture of sugarcane farmer’s
income. The more intensive cultivation of the technical implementation of sugarcane
production and farmers income will be higher. It is appropriate that the Kuntorohartono
in Sutrisno (2009) said that the technical culture is a set of activities required to prepare
the environmental conditions for growth and development that is good for the plant cane,
then Dlamini and Masuku (2012) says that a good technical culture is very important to
increase production sugarcane farmers, so as to increase the income of farmers. This fits
well with one of said cane farmers in Ngimbang named: Ismuntoyo, in an interview
with the researcher, as follows:
"...... we have to increase farmer awareness in proper cane cultivation" (02 / IS / II / 20-22).
With regression coefficient of the variable X1 (b1) is equal to 0.141 means that if
another state does not change then any changes and increase agronomic treatments led
to an increase in farmers' income of up to 14.1%.
2. Effect of Varieties Against Farmers Income
Sugarcane varieties grown by farmers has positive and significant effect on their income.
If the other variables does not change, then the proper selection of varieties of sugar
cane, can increase revenue by as much as 10.9% compared to the previous. The
importance of selecting appropriate varieties of sugar cane Sutrisno (2009) said that the
varieties of very significant effect on sugarcane farmers income, it is reinforced by
research Pratiwi and Priest (2003) which says that contribute to the production of sugar
varieties can reach 60%. However, the actual implementation is not fully utilize. This is
similar to sugar cane growers say (informant) Ngimbang named Soli, as follows:
"While this plant was no pack is how it fits great varieties in dry land was still difficult, which many here
is the only BL, the BL is susceptible to dry, well yes indeed the yield is low" (01 / SL / III / 4 -6).

The First International Conference on Entrepreneurship
Book One 234
In addition, local sugar factory should become farmers advisor in each sugar cane
development region.But in the otherhand, they failed to perform this role actively, this
is in accordance with the farmers Ismuntoyo statements:
"Composition ... varieties, we should get important guidance with intensive counseling, insight to our
farmers more detail maybe we can arrange it, however sugar factories previously was not prioritizing
varieties depiction, in this point, early, middle end "(02 / iS / III / 29-33)
3. Effect of Fertilizer / fertilization Against Farmers Income
Fertilizer/fertilization positive and significant impact on the sugarcane farmers income.
If the other variables does not change, then the fertilization is done on time, exact dose,
exact methode and the right type of fertilizer, it will be able to increase the sugarcane
farmers income up by 15.9% from the previous state. This is in accordance with
Hussain and Khattak in Dlamini and Masuku (2012) that the increased use of chemical
fertilizers can increase sugarcane productivity if applied on time, right dose, right way
of application, and the exact type of fertilizer used. Similarly, Sandara said in Chidoko
and Chimwai (2011) that timely fertilizers application will produce the most good plant
growth. But the influence of Fertilizer/fertilization especially in Ngimbang should still
be improved. Because of interviews with informants, sugar factory has not given
intensive counseling and sustainable sugarcane farmers surrogate; as well as the
procurement of fertilizer for farmers is also not maximized. It is appropriate that said
farmer (informant) Ismuntoyo:
"During this time, you may ask all farmers and you might be wondering maybe sugar factory does not
exist here, only vast sugar cane plantation, the sugar factory management does not educate us on how to
cultivate good cane quality with high yield" (02 / IS / IV / 17-20).
"as the time goes, it is more difficult to find fertilizer in lamongan and the price become more expensive
every year. If there are no more choices, farmers sometime buy non-subsidized fertilizer. I feel pity to our
farmers,"(02 / IS / IV / 26-31).
Farmers sometimes do not get the full subsidized fertilizer quota , therefore aiming for
the right dose also became an obstacle. This situation is reinforced by Soli farmers
statement, as follows:
"It is correct that sugar factory itself never facilitate the needs of farmers. For example one ha, one ha can
use up to to one and a half-ton, but it is sometimes only seven hundred were sent"(01 / SL / IV / 26-29)
4. Effect of Costs Against Income Farmers
The cost factor farming positive and significant impact on farmers income. From the
results of this study demonstrated that with the proper allocation of costs could increase
farmers income of up to 17.1% (other conditions being equal). This is supported by the
results of the same research Sutrisno (2009) in Mojo sugar mill in Sragen, that is very
influential factor in the cost-to-income farmers. consistently Soli (informant) also
stated: "Highly influential pack (read: fertilizer), and a lot of capital, probably added big maybe" (01 / SL / V /
31-32)
Similarly Ismuntoyo say about this cost issue, as follows:
The First International Conference on Entrepreneurship
Book One 235
"certainly influencing the income, if we're managing the cost properly then we would be able to lower
the cost. (02 / IS / V / 4-10).
5. Effect The yield Against of Farmers Income
The sugarcane yield would positively and impacting singnificantly on the sugarcane
farmers income. Any increase in yield can affect farmers income by 15.4% (if the other
state does not change). This is in contrast to research Sutrisno (2009) in Mojo Sragen,
where it says the greatest influence; however not the case in Ngimbang. This is
probably caused by differences in the region and the condition of farmers in each of
these regions. Effect of the yield to the income of farmers is also justified by the farmer
Ahmad Basoni, as follows:
"The Sugar cane variety can affect yield and quality" (03 / BS / VI / 3-5)
6. Effect the Price of Against Farmers Income
Posisitif factors influence the price and very significant compared to other factors. If
other conditions remain, so if there is an increase in sugar prices by the government and
or increase in sugarcane prices for farmers as a result of market mechanisms; then the
situation can increase farmers income by 33.2%. This situation is in line with the results
of the research Yanutya (2013) in the sub district Japon Blora, that price has a positive
and significant relationship to the sugarcane farmers' income. Toharisman in "20th Asia
International Sugar Conference 25-28 August 2014" in Jogjakarta, also reinforces this
situation, as follows: "Price reflecting sugar policy. Sugarcane (sugar) production,
productivity and area were strongly affected by the relative price of sugar (farmer
benefits)" One of the farmers in Ngimbang (Soli) related to the issue price also says:
" Yes, It would affected (read: price)" (01 / SL / VI / 5)
"expensive labor, transportation also getting more expensive" (01 / SL / VI / 7)
"The price is really low, currently already reached Rp8,200,-/kg" (01 / SL / VI / 9-10)
Then the same thing is said by farmers Ismuntoyo and Ahmad Basoni related to the
issue price, as follows:
"Definetely , sugar price decrease so the sugarcane price during the action will also fall. While the cost
for maintenance, cuting and transportation cost are getting more expensive each day. This made farmers
lose hope "(02 / IS / VI / 7-10 )
"Yes obviously, with the current pricing issue, we could not survie" (03 / AB / VI / 5-6)
7. Effects of All Variables Against Farmers Income
Based on multiple linear regression analysis it is known that the regression coefficients
of each independent variable is positive, so that said variable technical culture, varieties,
fertilizer / fertilization, cost, yield, and price jointly positive effect on sugarcane farmers
income.
From the analysis of the above data, the value of the coefficient of determination (R2)
of 0.793. This means that the relative contribution provided by a combination of
variable technical culture, varieties, fertilizer / fertilization, yield, and price to earnings
The First International Conference on Entrepreneurship
Book One 236
sugarcane farmers in Ngimbang Lamongan amounted to 79.3% while the rest is
influenced by other variables.
Among all independent variables were tested, it is known that the variable X6 has the
greatest value of the beta coefficient: 0.241. Thus it can be said, that the price factor is
the biggest impact among the six other factors, especially in Ngimbang Lamongan.
Conclusion
Based on the analysis of data and the above discussion it can be concluded as follows:
1. The internal factors (technical culture, sugarcane varieties, fertilizer /
fertilization, and costs), respective positive and significant effect on farmers
income. Furthermore, external factors (yield and price) of each positive and
significant impact on the sugarcane farmers income.
2. Contributions sixth variable (technical culture, varieties, fertilizer / fertilization,
cost, yield, and price) to the sugarcane farmers income reached 79.3%; while
the remaining 20.7% determined by variables outside the model.
3. Price factors is the biggest factor influence on sugarcane farmers income in
Ngimbang Lamongan.
Suggestion
1. For academics, further research needs to be conducted to determine other factors
that may affect sugarcane farmers income.
2. For the government it is advisable to focus more on policy determines the price
of sugar, as this is the most decisive factor in the sustainability of farmers trying
to farm sugar cane.
3. For the sugar factory recommended providing intensive and ongoing counseling
to reduce the cost of farming. Thus, the sugarcane farmers' income could be
increased.
REFERENCES
Anonim 2008 Bercocok Tanam Tebu. Balai Informasi Pertanian kayuambon, Forum
komunikasi PBT Departemen Pertanian. Lembang Jawa Barat Jabar.
Anonim 2012 ‘Lamongan dalam Angka (Lamongan in Figure) 2012’, Badan Pusat Statistik
Kabupaten Lamongan, Katalog BPS 1102001.3524.
Anonim 2013 Kerangka Acuan Analisis Dampak Lingkungan (KA - Andal)
Pembangunan Pabrik Gula PT. Kebun Tebu Mas, PT. KTM, Ngimbang -Lamongan.
Anonim 2013 Informasi Ringkas Komoditas Perkebunan, Pusat Data dan Sistem Informasi
Pertanian, No. 02/01/I, pp. 1 – 2.
Asmara, R. & Nurholifah, R. (2010) ‘Analisis Pendapatan dan Faktor – faktor yang
Mempengaruhi Pendapatan Petani Tebu dalam Keanggotaan Suatu Koperasi’,
AGRISE Volume X No. 2, ISSN: 1412- 1425, pp. 108 – 120.
The First International Conference on Entrepreneurship
Book One 237
Dlamini. M.B. & Masuku. M.B. (2012) ‘Productivity of Smallholder Sugarcane Farmers in
Swaziland: The Case of Komati Downstream Development Programme (KDDP)
Farmers’ Associations, 2005 - 2011’, Environment and Natural Resources
Research, Vol. 2, No. 4, ISSN 1927 - 0488 E-ISSN 1927-0496, pp. 1 – 7.
Girei. A.A. and Giroh. D.Y. (2012) ‘Analysis of the Factors affecting Sugarcane
(Saccharum officinarum) Production under the Out growers Scheme in
Numan Local Government Area Adamawa State, Nigeria’, Journal of
Education and Practice, ISSN 2222- 1735 (Paper) ISSN 2222- 288X
(Online), Vol 3, No.8, pp.195 – 200.
Haposan, Iskandarini, dan Salmiah. (2012) ’Analisis Perbandingan Pendapatan Program
Kemitraan PT. Perkebunan Nusantara II dengan Petani Tebu Rakyat Intensifikasi
(TRI)’, Journal on Social Economic of Agricultural and Agribusiness, vol. 1 No. 1,
pp. 1 – 14.
Kuncoro. M. 2013 Metode Riset Untuk Bisnis & Ekonomi, Edisi IV, Erlangga, Jogjakarta.
Miller. J. D. & Gilbert. R. A. and Odero. D. C. (2012) ‘Sugarcane Botany: A
Brief View’, University of Florida (UF), SS-AGR-234, pp. 1 – 5.
Nazir. A. & Jariko.G.A & Junejo. M.A. (2013) ‘Factors Affecting Sugarcane Production in
Pakistan’, Pak J Commer Soc Sci Pakistan Journal of Commerce and Social Sciences,
Vol. 7 (1), pp. 128- 140.
Raharjo. S. 2013 Belajar Praktek Analisis Multivariate dengan SPSS (IBM SPSS
Statistics), Edisi 1, Konsistensi. Klaten-Jawa Tengah
Siregar. 2014 Statistik Parametrik untuk Penelitian Kuantitatif, Bumi Aksara, Jakarta.
Sugiyanto. C. 2007 Permintaan Gula Di Indonesia, Jurnal Ekonomi Pembangunan, Vo.
8 No. 2, pp. 113 – 127.
Sugiyono. 2014 Metode Penelitian Manajemen, Alfa Beta, Bandung.
Susila. W. R. 2005 Dinamika Impor Gula Indonesia: Sebuah Analisis Kebijakan, Agri
Media, Volume 10 No. 1- ISSN-0853-8468, pp. 1 – 15.
Susila. W.R. dan Sinaga. B.M. (2005) Analisis Kebijakan Industri Gula
Indonesia, Jurnal Agro Ekonomi Volume 23 No. 1, pp. 29 - 53
Sutrisno, B. 2009 ’Anlisis Faktor - faktor yang Mempengaruhi Tingkat Pendapatan
Petani Tebu Pabrik Gula Mojo Sragen’, Daya Saing Jurnal Ekonomi
Manajemen Sumber Daya, Vol. 10, No. 2, pp. 155 – 164.
Toharisman. A. 2013 ‘Anomali Iklim 2013: Dampak Terhadap Penurunan Produksi
Gula dan Upaya Antisipasinya’, Rumusan Diskusi Terbatas Pusat Penelitian
Perkebunan Gula Indonesia (P3GI), P3GI - Pasuruan.
Wijaya. 2008 ‘Uji Asumsi Klasik Regresi Linear’. Fakultas Pertanian- Universitas
Swadaya Gunung Jati, Cirebon.

The First International Conference on Entrepreneurship
Book One 238
Yanutya. P.A.T. 2013 ‘Analisis Pendapatan Petani Tebu Di Kecamatan
Japon Kabupaten Blora’, Economics Development Analysis Journal, EDAJ 2 (4),
ISSN 2252-6765, pp. 286 – 296.
Yusuf. Y; Aulia. A. F. dan Martadi. S. (2013) Permintaan Gula Pasir Indonesia, Jurnal
Ekonomi, vol. 18 No. 03, pp. 1 - 8
The First International Conference on Entrepreneurship
Book One 239
FLEASIBILITY STUDY FOR DEVELOPMENT BUSINESS PT. J
Jaya, Adi Gama Tengtarto1, David Sukardi Kodrat2
Universitas Ciputra
INDONESIA
E-mails: [email protected], [email protected]
ABSTRACT
Analysis of the feasibility for development business of PT. J is intended to
determine the feasibility of the business plan development and investment
capabilities within providing benefit to the amount of capital invested.
This study examined the feasibility of developing business through five aspects,
namely, the environmental aspects of the industry, market aspects and
marketing, technical aspects and technology, management and human
resources, and financial aspects. From the five aspects of the business
development plan indicates that PT. J are acceptable and feasible.
This study use four methods for calculating investment feasibility analysis tool
with the results of the following calculation: Method NPV (Net Present Value)
obtained a positive value of Rp 2,192,392,228. Method IRR (Internal Rate of
Return) obtained an interest rate of 13.18%. Payback Period method showed
that the time required to cover the investment of Rp 1.8 billion is 5 years and 5
months. Methods PI (Profitability Index) show the results obtained greater than
1 that is equal to 2.22. From the calculations using these four methods can be
interpreted that the business development plans of PT. J are acceptable and
feasible.
Keywords: Feasibility Study, Business Development, Family Business,
Analysis
INTRODUCTION
Trade in this globalization era is growing rapidly along with the increasing needs of the
global community. In fact, it takes the role of manufacturers to produce goods that have
better quality with competitive prices. Opportunities to develop business in the field of
manufacturing knitted gloves manufacturer in Indonesia still widely open, because
Indonesia is a developing country.
PT. J is a family company that is engaged in manufacturing knitted gloves and has been
established since 2000 with the number of machines early as 20 machines, and at this
time amounted to 216 machines. The purpose of developing this family business is to
master the local market in Indonesia.
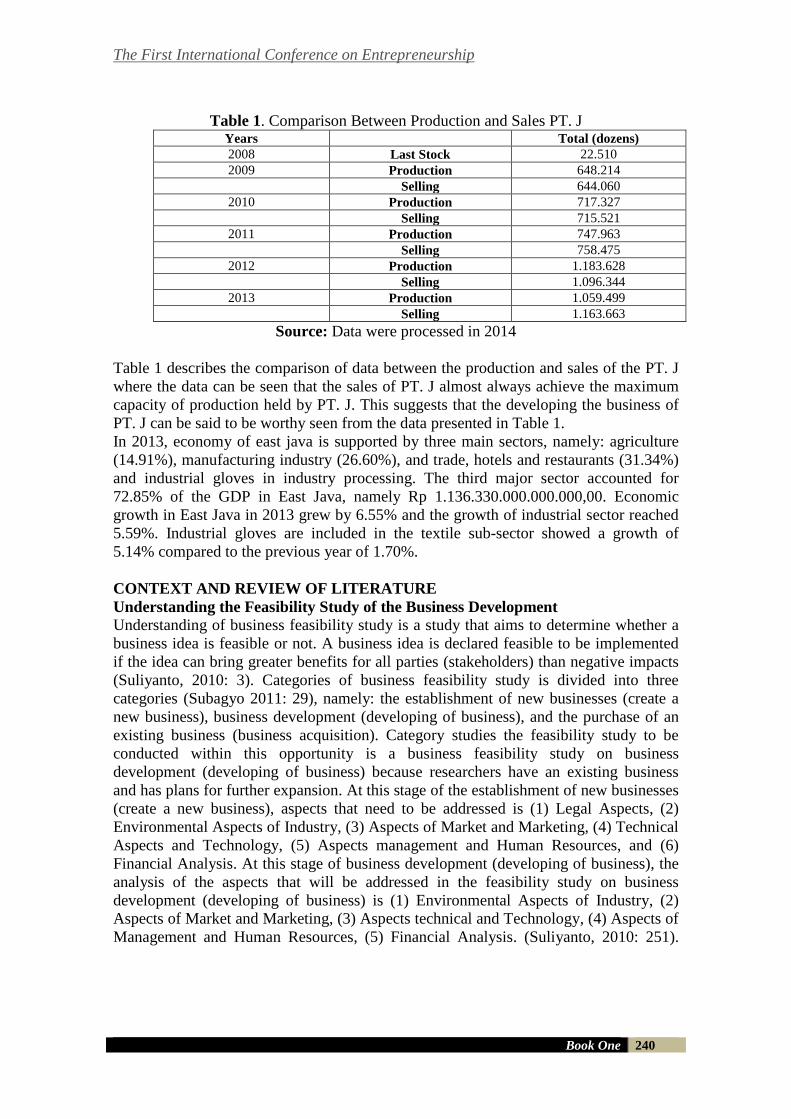
The First International Conference on Entrepreneurship
Book One 240
Table 1. Comparison Between Production and Sales PT. J Years Total (dozens)
2008 Last Stock 22.510
2009 Production 648.214
Selling 644.060
2010 Production 717.327
Selling 715.521
2011 Production 747.963
Selling 758.475
2012 Production 1.183.628
Selling 1.096.344
2013 Production 1.059.499
Selling 1.163.663
Source: Data were processed in 2014
Table 1 describes the comparison of data between the production and sales of the PT. J
where the data can be seen that the sales of PT. J almost always achieve the maximum
capacity of production held by PT. J. This suggests that the developing the business of
PT. J can be said to be worthy seen from the data presented in Table 1.
In 2013, economy of east java is supported by three main sectors, namely: agriculture
(14.91%), manufacturing industry (26.60%), and trade, hotels and restaurants (31.34%)
and industrial gloves in industry processing. The third major sector accounted for
72.85% of the GDP in East Java, namely Rp 1.136.330.000.000.000,00. Economic
growth in East Java in 2013 grew by 6.55% and the growth of industrial sector reached
5.59%. Industrial gloves are included in the textile sub-sector showed a growth of
5.14% compared to the previous year of 1.70%.
CONTEXT AND REVIEW OF LITERATURE
Understanding the Feasibility Study of the Business Development
Understanding of business feasibility study is a study that aims to determine whether a
business idea is feasible or not. A business idea is declared feasible to be implemented
if the idea can bring greater benefits for all parties (stakeholders) than negative impacts
(Suliyanto, 2010: 3). Categories of business feasibility study is divided into three
categories (Subagyo 2011: 29), namely: the establishment of new businesses (create a
new business), business development (developing of business), and the purchase of an
existing business (business acquisition). Category studies the feasibility study to be
conducted within this opportunity is a business feasibility study on business
development (developing of business) because researchers have an existing business
and has plans for further expansion. At this stage of the establishment of new businesses
(create a new business), aspects that need to be addressed is (1) Legal Aspects, (2)
Environmental Aspects of Industry, (3) Aspects of Market and Marketing, (4) Technical
Aspects and Technology, (5) Aspects management and Human Resources, and (6)
Financial Analysis. At this stage of business development (developing of business), the
analysis of the aspects that will be addressed in the feasibility study on business
development (developing of business) is (1) Environmental Aspects of Industry, (2)
Aspects of Market and Marketing, (3) Aspects technical and Technology, (4) Aspects of
Management and Human Resources, (5) Financial Analysis. (Suliyanto, 2010: 251).
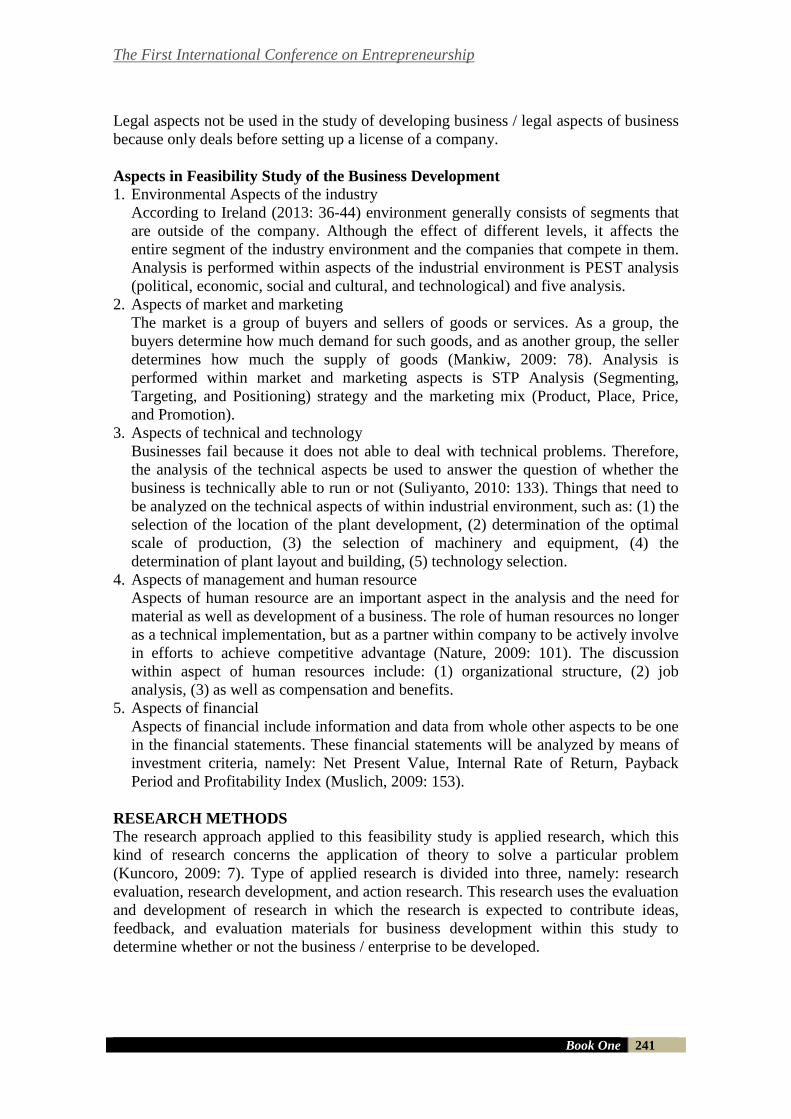
The First International Conference on Entrepreneurship
Book One 241
Legal aspects not be used in the study of developing business / legal aspects of business
because only deals before setting up a license of a company.
Aspects in Feasibility Study of the Business Development
1. Environmental Aspects of the industry
According to Ireland (2013: 36-44) environment generally consists of segments that
are outside of the company. Although the effect of different levels, it affects the
entire segment of the industry environment and the companies that compete in them.
Analysis is performed within aspects of the industrial environment is PEST analysis
(political, economic, social and cultural, and technological) and five analysis.
2. Aspects of market and marketing
The market is a group of buyers and sellers of goods or services. As a group, the
buyers determine how much demand for such goods, and as another group, the seller
determines how much the supply of goods (Mankiw, 2009: 78). Analysis is
performed within market and marketing aspects is STP Analysis (Segmenting,
Targeting, and Positioning) strategy and the marketing mix (Product, Place, Price,
and Promotion).
3. Aspects of technical and technology
Businesses fail because it does not able to deal with technical problems. Therefore,
the analysis of the technical aspects be used to answer the question of whether the
business is technically able to run or not (Suliyanto, 2010: 133). Things that need to
be analyzed on the technical aspects of within industrial environment, such as: (1) the
selection of the location of the plant development, (2) determination of the optimal
scale of production, (3) the selection of machinery and equipment, (4) the
determination of plant layout and building, (5) technology selection.
4. Aspects of management and human resource
Aspects of human resource are an important aspect in the analysis and the need for
material as well as development of a business. The role of human resources no longer
as a technical implementation, but as a partner within company to be actively involve
in efforts to achieve competitive advantage (Nature, 2009: 101). The discussion
within aspect of human resources include: (1) organizational structure, (2) job
analysis, (3) as well as compensation and benefits.
5. Aspects of financial
Aspects of financial include information and data from whole other aspects to be one
in the financial statements. These financial statements will be analyzed by means of
investment criteria, namely: Net Present Value, Internal Rate of Return, Payback
Period and Profitability Index (Muslich, 2009: 153).
RESEARCH METHODS
The research approach applied to this feasibility study is applied research, which this
kind of research concerns the application of theory to solve a particular problem
(Kuncoro, 2009: 7). Type of applied research is divided into three, namely: research
evaluation, research development, and action research. This research uses the evaluation
and development of research in which the research is expected to contribute ideas,
feedback, and evaluation materials for business development within this study to
determine whether or not the business / enterprise to be developed.
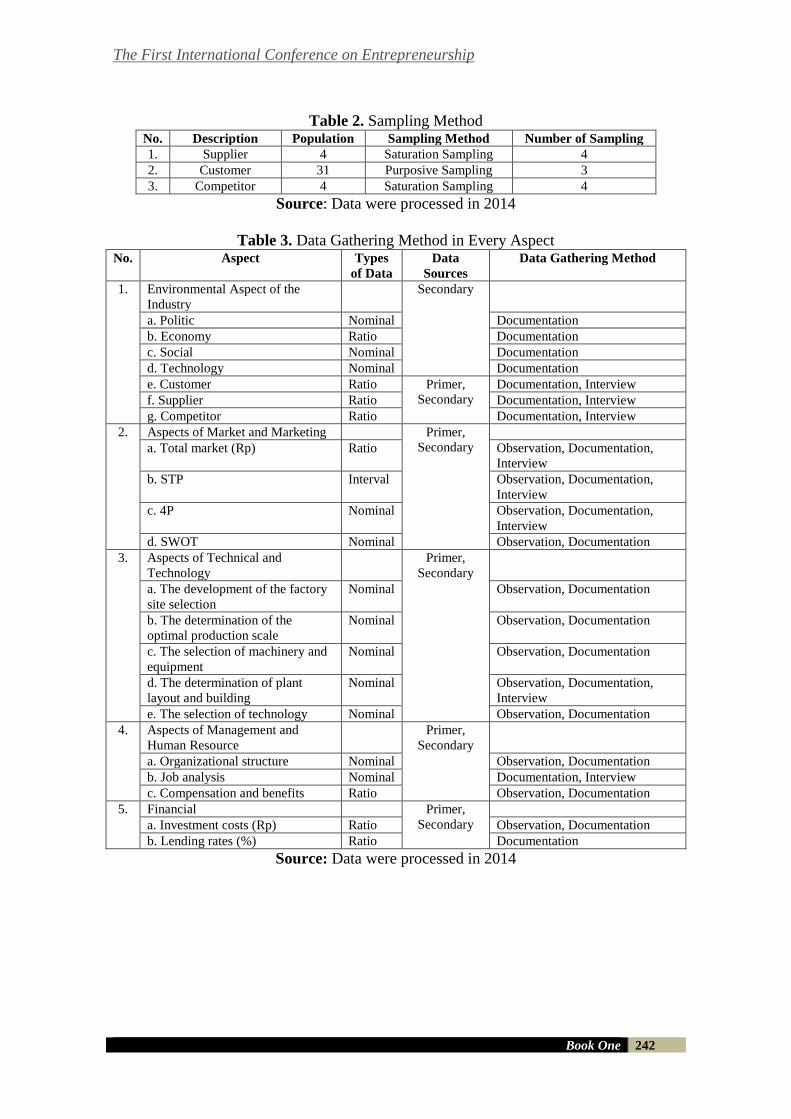
The First International Conference on Entrepreneurship
Book One 242
Table 2. Sampling Method No. Description Population Sampling Method Number of Sampling
1. Supplier 4 Saturation Sampling 4
2. Customer 31 Purposive Sampling 3
3. Competitor 4 Saturation Sampling 4
Source: Data were processed in 2014
Table 3. Data Gathering Method in Every Aspect No. Aspect Types
of Data
Data
Sources
Data Gathering Method
1. Environmental Aspect of the
Industry
Secondary
a. Politic Nominal Documentation
b. Economy Ratio Documentation
c. Social Nominal Documentation
d. Technology Nominal Documentation
e. Customer Ratio Primer,
Secondary
Documentation, Interview
f. Supplier Ratio Documentation, Interview
g. Competitor Ratio Documentation, Interview
2. Aspects of Market and Marketing Primer,
Secondary
a. Total market (Rp) Ratio Observation, Documentation,
Interview
b. STP Interval Observation, Documentation,
Interview
c. 4P Nominal Observation, Documentation,
Interview
d. SWOT Nominal Observation, Documentation
3. Aspects of Technical and
Technology
Primer,
Secondary
a. The development of the factory
site selection
Nominal Observation, Documentation
b. The determination of the
optimal production scale
Nominal Observation, Documentation
c. The selection of machinery and
equipment
Nominal Observation, Documentation
d. The determination of plant
layout and building
Nominal Observation, Documentation,
Interview
e. The selection of technology Nominal Observation, Documentation
4. Aspects of Management and
Human Resource
Primer,
Secondary
a. Organizational structure Nominal Observation, Documentation
b. Job analysis Nominal Documentation, Interview
c. Compensation and benefits Ratio Observation, Documentation
5. Financial Primer,
Secondary
a. Investment costs (Rp) Ratio Observation, Documentation
b. Lending rates (%) Ratio Documentation
Source: Data were processed in 2014
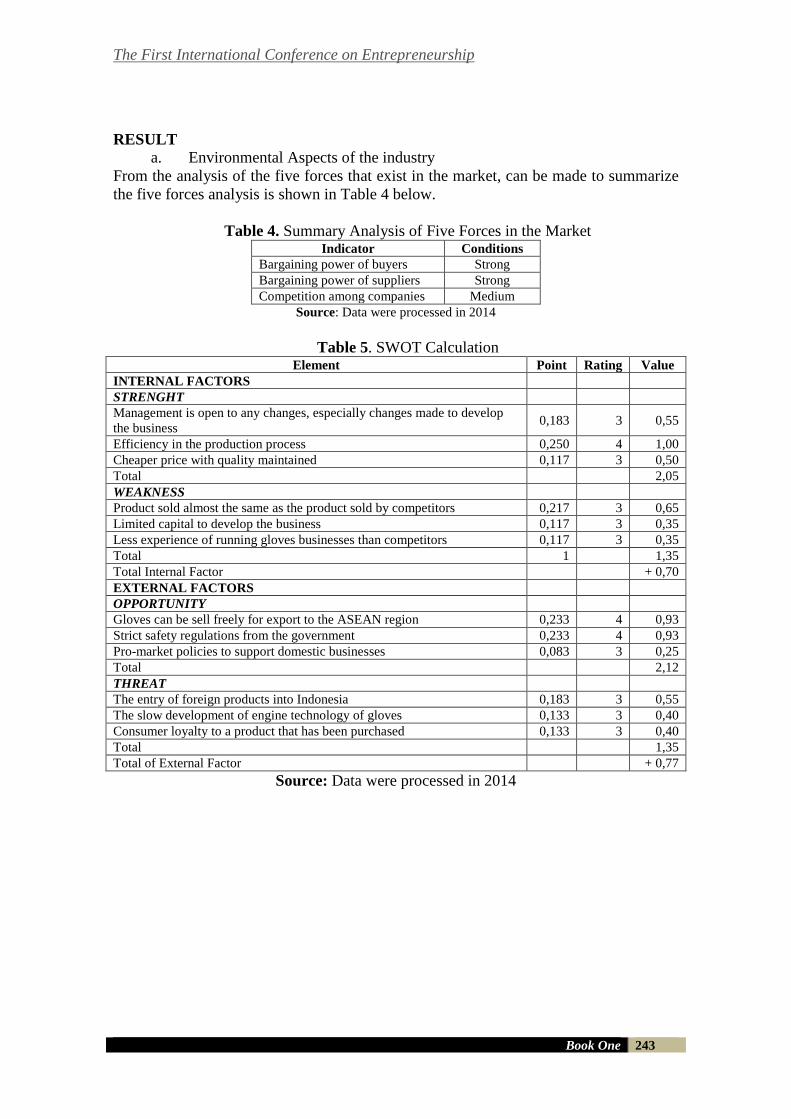
The First International Conference on Entrepreneurship
Book One 243
RESULT
a. Environmental Aspects of the industry
From the analysis of the five forces that exist in the market, can be made to summarize
the five forces analysis is shown in Table 4 below.
Table 4. Summary Analysis of Five Forces in the Market Indicator Conditions
Bargaining power of buyers Strong
Bargaining power of suppliers Strong
Competition among companies Medium
Source: Data were processed in 2014
Table 5. SWOT Calculation Element Point Rating Value
INTERNAL FACTORS
STRENGHT
Management is open to any changes, especially changes made to develop
the business 0,183 3 0,55
Efficiency in the production process 0,250 4 1,00
Cheaper price with quality maintained 0,117 3 0,50
Total 2,05
WEAKNESS
Product sold almost the same as the product sold by competitors 0,217 3 0,65
Limited capital to develop the business 0,117 3 0,35
Less experience of running gloves businesses than competitors 0,117 3 0,35
Total 1 1,35
Total Internal Factor + 0,70
EXTERNAL FACTORS
OPPORTUNITY
Gloves can be sell freely for export to the ASEAN region 0,233 4 0,93
Strict safety regulations from the government 0,233 4 0,93
Pro-market policies to support domestic businesses 0,083 3 0,25
Total 2,12
THREAT
The entry of foreign products into Indonesia 0,183 3 0,55
The slow development of engine technology of gloves 0,133 3 0,40
Consumer loyalty to a product that has been purchased 0,133 3 0,40
Total 1,35
Total of External Factor + 0,77
Source: Data were processed in 2014
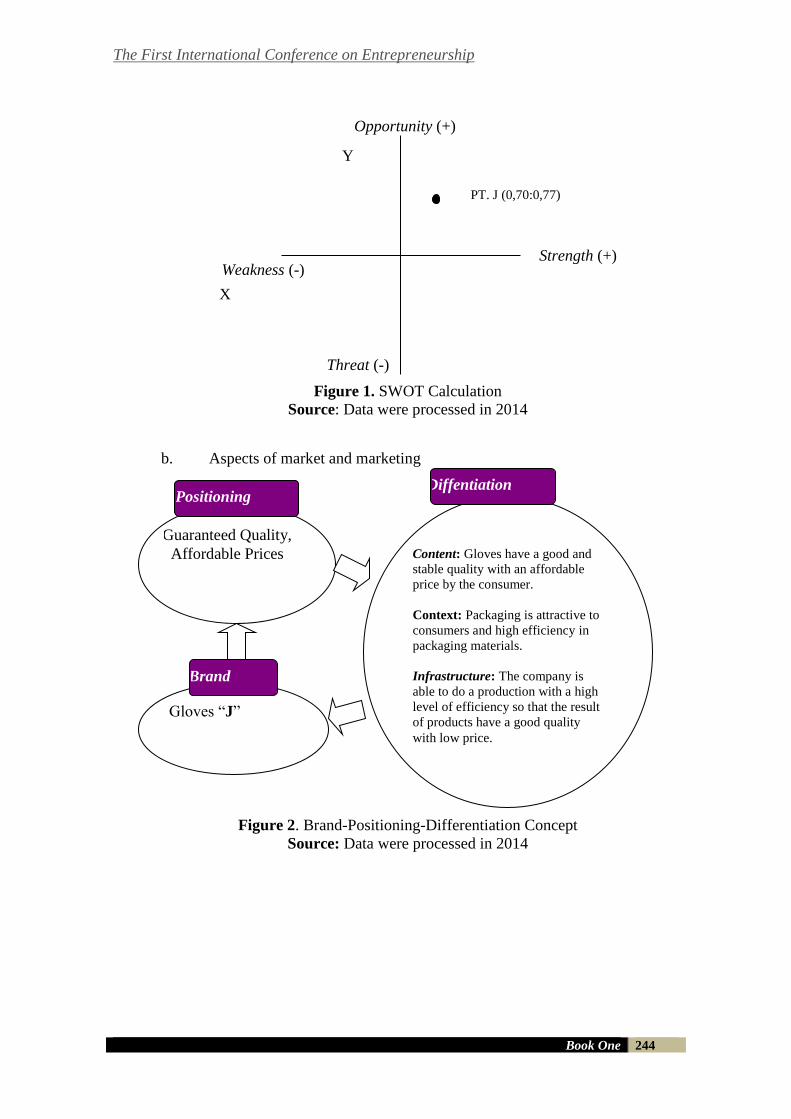
The First International Conference on Entrepreneurship
Book One 244
Figure 1. SWOT Calculation
Source: Data were processed in 2014
b. Aspects of market and marketing
Figure 2. Brand-Positioning-Differentiation Concept
Source: Data were processed in 2014
Guaranteed Quality,
Affordable Prices
Gloves “J”
Content: Gloves have a good and
stable quality with an affordable
price by the consumer.
Context: Packaging is attractive to
consumers and high efficiency in
packaging materials.
Infrastructure: The company is
able to do a production with a high
level of efficiency so that the result
of products have a good quality
with low price.
Brand
Positioning Diffentiation
Opportunity (+)
Threat (-)
PT. J (0,70:0,77)
X
Y
Strength (+) Weakness (-)
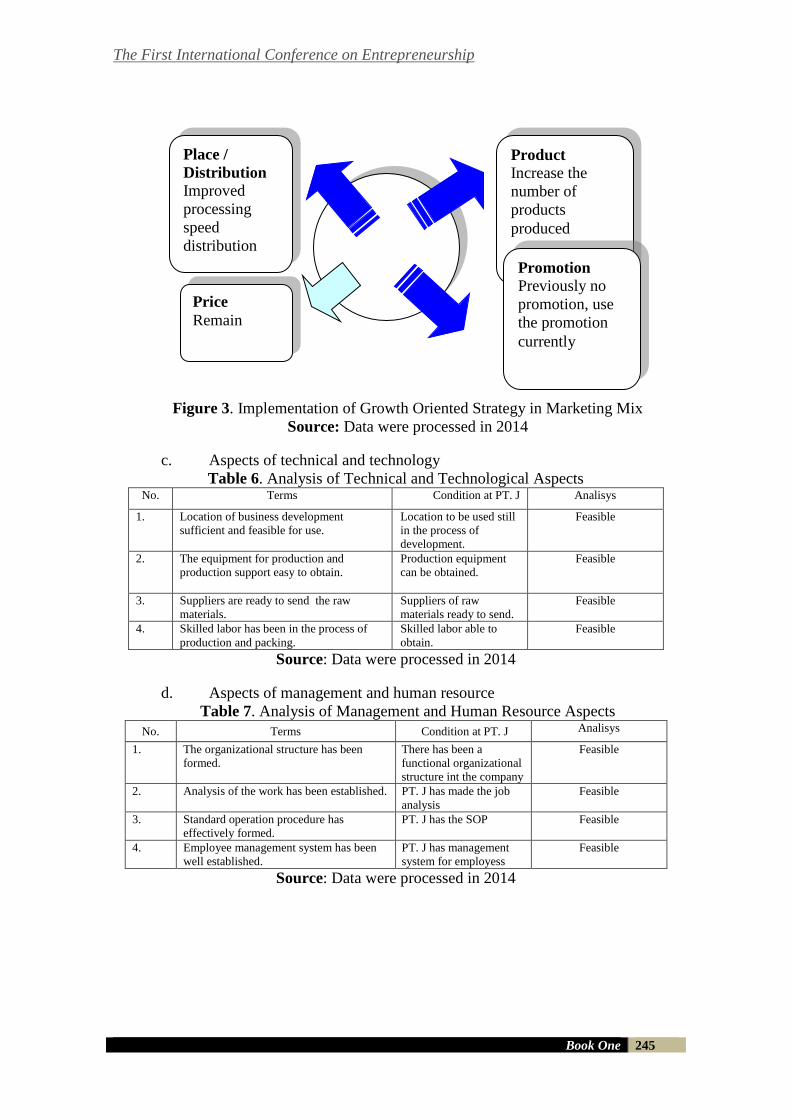
The First International Conference on Entrepreneurship
Book One 245
Figure 3. Implementation of Growth Oriented Strategy in Marketing Mix
Source: Data were processed in 2014
c. Aspects of technical and technology
Table 6. Analysis of Technical and Technological Aspects No. Terms Condition at PT. J Analisys
1. Location of business development
sufficient and feasible for use.
Location to be used still
in the process of
development.
Feasible
2. The equipment for production and
production support easy to obtain.
Production equipment
can be obtained.
Feasible
3. Suppliers are ready to send the raw
materials.
Suppliers of raw
materials ready to send.
Feasible
4. Skilled labor has been in the process of
production and packing.
Skilled labor able to
obtain.
Feasible
Source: Data were processed in 2014
d. Aspects of management and human resource
Table 7. Analysis of Management and Human Resource Aspects
No. Terms Condition at PT. J Analisys
1. The organizational structure has been
formed.
There has been a
functional organizational
structure int the company
Feasible
2. Analysis of the work has been established. PT. J has made the job
analysis
Feasible
3. Standard operation procedure has
effectively formed.
PT. J has the SOP Feasible
4. Employee management system has been
well established.
PT. J has management
system for employess
Feasible
Source: Data were processed in 2014
Product
Increase the
number of
products
produced
Promotion
Previously no
promotion, use
the promotion
currently
Place /
Distribution
Improved
processing
speed
distribution
Price
Remain
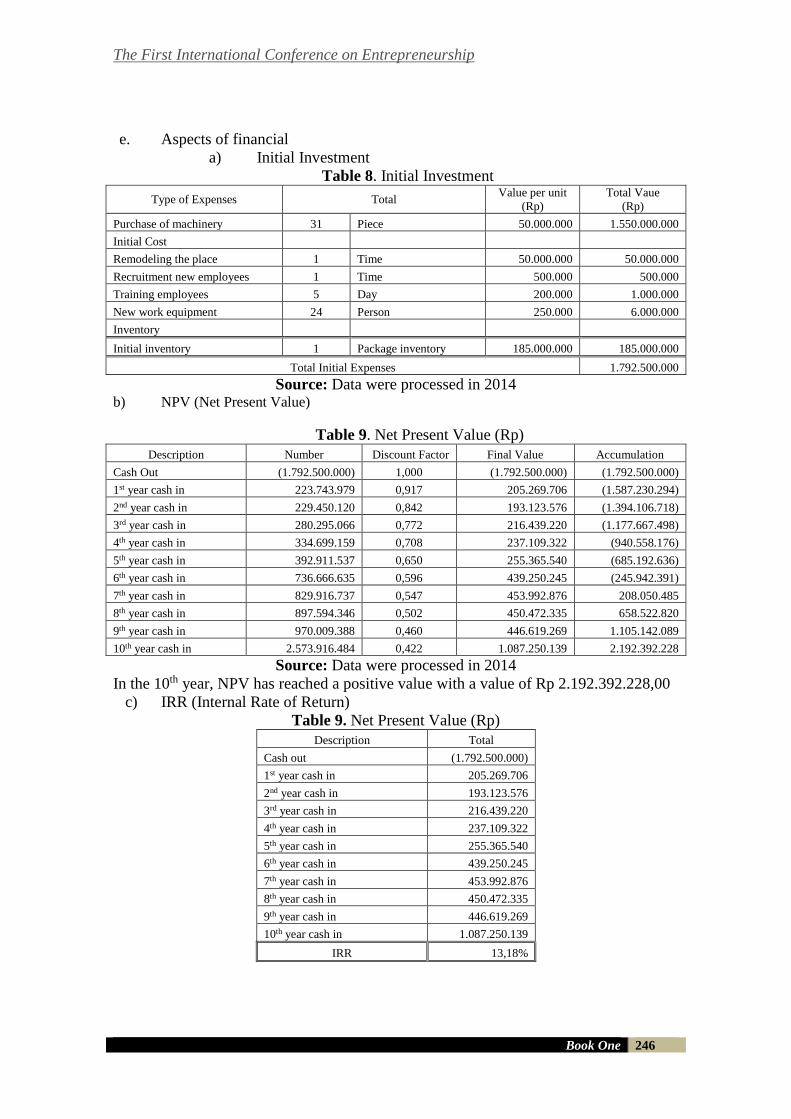
The First International Conference on Entrepreneurship
Book One 246
e. Aspects of financial
a) Initial Investment
Table 8. Initial Investment
Type of Expenses Total Value per unit
(Rp)
Total Vaue
(Rp)
Purchase of machinery 31 Piece 50.000.000 1.550.000.000
Initial Cost
Remodeling the place 1 Time 50.000.000 50.000.000
Recruitment new employees 1 Time 500.000 500.000
Training employees 5 Day 200.000 1.000.000
New work equipment 24 Person 250.000 6.000.000
Inventory
Initial inventory 1 Package inventory 185.000.000 185.000.000
Total Initial Expenses 1.792.500.000
Source: Data were processed in 2014 b) NPV (Net Present Value)
Table 9. Net Present Value (Rp)
Description Number Discount Factor Final Value Accumulation
Cash Out (1.792.500.000) 1,000 (1.792.500.000) (1.792.500.000)
1st year cash in 223.743.979 0,917 205.269.706 (1.587.230.294)
2nd year cash in 229.450.120 0,842 193.123.576 (1.394.106.718)
3rd year cash in 280.295.066 0,772 216.439.220 (1.177.667.498)
4th year cash in 334.699.159 0,708 237.109.322 (940.558.176)
5th year cash in 392.911.537 0,650 255.365.540 (685.192.636)
6th year cash in 736.666.635 0,596 439.250.245 (245.942.391)
7th year cash in 829.916.737 0,547 453.992.876 208.050.485
8th year cash in 897.594.346 0,502 450.472.335 658.522.820
9th year cash in 970.009.388 0,460 446.619.269 1.105.142.089
10th year cash in 2.573.916.484 0,422 1.087.250.139 2.192.392.228
Source: Data were processed in 2014
In the 10th year, NPV has reached a positive value with a value of Rp 2.192.392.228,00
c) IRR (Internal Rate of Return)
Table 9. Net Present Value (Rp)
Description Total
Cash out (1.792.500.000)
1st year cash in 205.269.706
2nd year cash in 193.123.576
3rd year cash in 216.439.220
4th year cash in 237.109.322
5th year cash in 255.365.540
6th year cash in 439.250.245
7th year cash in 453.992.876
8th year cash in 450.472.335
9th year cash in 446.619.269
10th year cash in 1.087.250.139
IRR 13,18%
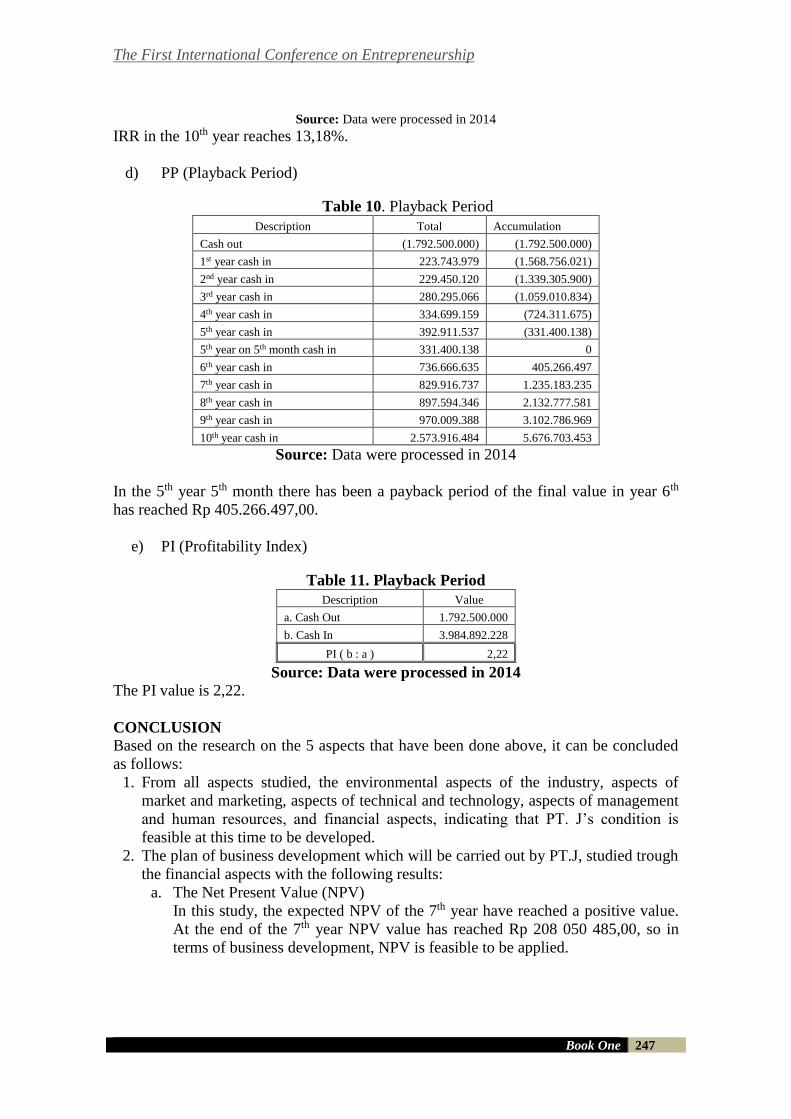
The First International Conference on Entrepreneurship
Book One 247
Source: Data were processed in 2014
IRR in the 10th year reaches 13,18%.
d) PP (Playback Period)
Table 10. Playback Period
Description Total Accumulation
Cash out (1.792.500.000) (1.792.500.000)
1st year cash in 223.743.979 (1.568.756.021)
2nd year cash in 229.450.120 (1.339.305.900)
3rd year cash in 280.295.066 (1.059.010.834)
4th year cash in 334.699.159 (724.311.675)
5th year cash in 392.911.537 (331.400.138)
5th year on 5th month cash in 331.400.138 0
6th year cash in 736.666.635 405.266.497
7th year cash in 829.916.737 1.235.183.235
8th year cash in 897.594.346 2.132.777.581
9th year cash in 970.009.388 3.102.786.969
10th year cash in 2.573.916.484 5.676.703.453
Source: Data were processed in 2014
In the 5th year 5th month there has been a payback period of the final value in year 6th
has reached Rp 405.266.497,00.
e) PI (Profitability Index)
Table 11. Playback Period
Description Value
a. Cash Out 1.792.500.000
b. Cash In 3.984.892.228
PI ( b : a ) 2,22
Source: Data were processed in 2014
The PI value is 2,22.
CONCLUSION
Based on the research on the 5 aspects that have been done above, it can be concluded
as follows:
1. From all aspects studied, the environmental aspects of the industry, aspects of
market and marketing, aspects of technical and technology, aspects of management
and human resources, and financial aspects, indicating that PT. J’s condition is
feasible at this time to be developed.
2. The plan of business development which will be carried out by PT.J, studied trough
the financial aspects with the following results:
a. The Net Present Value (NPV)
In this study, the expected NPV of the 7th year have reached a positive value.
At the end of the 7th year NPV value has reached Rp 208 050 485,00, so in
terms of business development, NPV is feasible to be applied.
The First International Conference on Entrepreneurship
Book One 248
b. Internal Rate of Return Method (IRR)
In this study, the limit value for IRR is 9%. The calculations show that the IRR
is equal to 13.18%, so in terms of business development, IRR is feasible to be
applied.
c. Payback Period Method (PP)
In this study, the payback period is to be achieved within seven years. The
calculations show that the PP occurred in the 5th year 5th month, so in terms of
business development, PP is feasible to be applied.
d. Profitability Index Method (PI)
In this study, the PI is expected after running the business for ten years is 1.5.
The calculations show that the PI value of 2.22, so in terms of the PI, business
development is feasible to be applied.
REFERENCES
Delaney, Patrick R, and Whittington, O.Ray.(2010) Business Environment and Concepts.New
Jersey:John Wiley & Sons, Inc.
Husnan, S. dan Muhammad.2009 Studi Kelayakan.Yogyakarta:Graha Ilmu.
Ireland, R.Duane, Hoskisson, Robert E., Hitt, Michael A.2013 The Management of Strategy
Concepts and Cases, 10th edition. Canada: Nelson Education, Ltd.
Jakfar, dan Kasmir.2010 Studi Kelayakan Bisnis.Jakarta:Kencana Prenada Media Grup.
Kartajaya, Hermawan.2010 Grow with Character.Jakarta:PT Gramedia Pustaka Utama.
Kodrat, David Sukardi.2009 Manajemen Distribusi: Old Distribution Channel dan Postmo
Distribution Channel Approach.Yogyakarta:Graha Ilmu.
Kodrat, David Sukardi. 2009 Manajemen Strategi: Membangun Keunggulan Bersaing Era
Global di Indonesia Berbasis Kewirausahaan.Yogyakarta:Graha Ilmu.
Kodrat, David Sukardi. 2010 Manajemen Eksekusi Bisnis. Yogyakarta:Graha Ilmu.
Kotler, Philip dan Gary Amstrong. 2007 Marketing an Introduction. Eight Edition. New Jersey:
Pearson Education Inc.
Kotler, Philip dan Kevin Lane Keller.2007 Manajemen Pemasaran. Edisi Kedua. Klaten Utara:
PT. Macanan Jaya Cemerlang.
Kuncoro, Mudrajad. 2009 Metode Riset untuk Bisnis & Ekonomi: Bagaimana Meneliti &
Menulis Tesis. Edisi 3.Jakarta:Penerbit Erlangga.
Lazuardi, Reza Fiqhi. 2014 Analisis Kelayakan Usaha Mobile Carwash di Kota Bandung,
Jurnal Teknik Industri Itenas, I(3), pp. 48-56.
The First International Conference on Entrepreneurship
Book One 249
Mankiw, Gregory N. 2009 Principles of Economics: Pengantar Ekonomi Mikro. Edisi
3.Jakarta:Penerbit Salemba Empat.
Mulyadi. 2012 Akuntansi Biaya. Edisi 5.Yogyakarta:Unit Penerbit dan Percetakan Akademi
Manajemen Perusahaan YKPN.
Muslich, Mohammad. 2009 Manajemen Risiko Operasional : Teori dan Praktik.Jakarta:Bumi
Aksara.
Nanang. 2011 Pertumbuhan Pasar Ekspor di Indonesia.Harian Umum Kompas, 22 Agustus
2011,pp.12.
Nurfuadah. 2011 Pertumbuhan Industri Fashion di Indonesisa.Harian Umum Kompas,
15Agustus 2011,pp.14.
Rangkuti, F. 2011 Analisis SWOT: Teknik Membedah Kasus Bisnis. Jakarta: PT Gramedia
Pustaka Utama ; Jakarta
Rivai, Veithzal. 2009 Manajemen Sumber Daya Manusia untuk Perusahaan. Edisi
Kedua.Jakarta:Raja Grafindo Persada.
Siyanbola, Trimisiu Tunji, and Raji, Gbolagade Mojeed.(2013) The Impact of Cost Control on
Manufacturing Industries Profitability,International Journal of Management and Social
Sciences Research, II(4), pp.1-7.
Subagyo, Ahmad 2011 Modul Studi Kelayakan Bisnis.Jakarta:PT Elex Media Komputindo.
Suliyanto. 2010 Studi Kelayakan Bisnis: Pendekatan Praktis.Yogyakarta:Penerbit Andi.
Supriyanto 2009 'Business Plan Sebagai Langkah Awal Memulai Usaha',Jurnal Ekonomi dan
Pendidikan, VI(1), pp. 73-83.
Suwinto, Johan 2011 Studi Kelayakan Pengembangan Bisnis.Yogyakarta:Graha Ilmu.
Waringin, Tung Desem. 2008 Marketing Revolution.Jakarta:PT Gramedia Pustaka Utama.
The First International Conference on Entrepreneurship
Book One 250
THE SUCCESSION PROGRAM PLANNING
OF DAMAI SEJAHTERA FAMILY BUSINESS
Ongkowidjojo, Kevin Alexander1, Damelina Tambunan2
Universitas Ciputra, Surabaya
INDONESIA
ABSTRACT
This research was conducted to describe the succession program planning at
Damai Sejahtera family business. This research was a qualitative design in which
the data were gained through conducting survey supported with non-participative
observation and in-depth interview for unconfirmed answer given. Four internal
informants of Damai Sejahtera were interviewed to gain the data needed. The
informants were the CEO, the wife of CEO as the family member, the employee as
a CEO’s confidant, and the future successor.
The succession program planning of Damai Sejahtera covered five basic factors
of succession planning, namely the CEO preparation, the business preparation,
the successor development, the family preparation, and the owner preparation in
order to find out the readiness of the business and the family to the succession
program that would be implemented. The result of the research concluded that
Damai Sejahtera is not ready for succession program planning program and has
to follow managerial implications that covers 5 basic factors proposed by Aronoff.
Keywords: CEO, Family Business, Succession Program, Successor,
Indonesia.
INTRODUCTION
Family business is an important pillar for the economy of Asia, family businesses in the
region recorded a total cumulative profit is equal to 261% during 2000-2010, with a
compound annual growth rate of 13.7% during this period (Kompas Ekonomi, 2011). In
Indonesia, the majority of family businesses engaged in wholesale and retail trading for
36%, 24% on manufacturing and distribution, professional services 14%, two types of
business on 13%, agriculture and fishing for 4%, 3% on construction, finance, real
estate for 2%, transportation, hotel and entertainment only 1% (Grant Thorton Indonesia,
2013). Succession is a must do in a family business considering of CEO or founder’s
performance will continue to decrease as they are getting older so that should be a
transfer of corporate responsibility to the next generation. The purpose is to maintain
the continuity of the family business is because there is no certainty on when the CEO
of the family business will be off from duty so that later the company has a system of
self-organization that can be passed to the next generation (Aronoff CE, 2011: 9-10).
Preparation for succession planning program will be implemented in Damai Sejahtera, a
family business managed by the first generation or founder named Soewarno
Ongkowidjojo who handles almost all of the activity from finance, marketing, human
resources and operational with some assigned workers.
The First International Conference on Entrepreneurship
Book One 251
Damai Sejahtera has been doing business of plastic mica for over 15 years and handles
almost all of the packing materials using plastic mica like souvenirs’ packs for special
events such as wedding, valentine and other celebrations, packs for dried foods, baby
shoes, underwear and also distributes unprocessed plastic mica from suppliers to
customers in rolls with various sizes and thickness levels of plastic mica or made to
consumer’s demand to be processed either in the form of sheet mica or printed
following the shape desired by the customer.
The main issue for Damai Sejahtera is that this company has not prepare succession
program planning for the second generation and as written that the entire existing
activities in the company is controlled by founder and using his own efforts rather than
rely on or involve other family members to work on part of the company.
The second generation has not fully briefed and no detailed deepening in Damai
Sejahtera so it can be said that the second generation is not ready to be a successor, it is
exacerbated by the presence of internal conflict within the family over the last 4 years
because of differences in opinions and principle issues in financial so that the
relationship is not going on well and effected on the company because of this ineffective
communication. Succession program became essential to be done in order to provide
preparation for Damai Sejahtera to the first and second generation for the survival of the
family business. The research is expected to provide an overview of how the program is
being prepared for succession.
Based on this issue, this paper formulates the research question as follows:
(1) How about the readiness of succession program planning in Damai Sejahtera
family business?
LITERATURE REVIEW
Sentot (2014) conducted a case study on succession in family businesses in Indonesia
found that succession is a crucial issue, with a continuation percentage of first-
generation family business is only 30% to second and third generation continues to only
12%, that number continues to shrink with the shift to the next generation. It is mostly
caused by first generation for feeling hampered of unpreparedness of the second
generation. Nyanyu and Wawan (2012) found that succession can be started from the
successor’s intention to continue the family business as well as gaining the trust of the
family to continue as the basic in family business that has been running and connected
to the needs, goals and successor’ abilities as main indicator, it was found also that the
successor does not have to be the first child and family problems may also make the
next generation able to decide to enter the family business or not.
Succession is achieved with leadership transition from CEO to be by a successor. Every
CEO in family businesses has a way to do that is succession; according to Poza (2010:
112-116) there are six systems that are used in the majority of CEOs with different
scales in preparing the family business succession, starting with The Monarch where
there is no thought from the CEO to retire and there is no discussion of succession, The
General where CEO seemed looking forward to succession but the CEO have prepared
a plan to return, The Ambassador which is giving the responsibility to the next
generation or professional management for business operations the CEO is still holding
role to represent the company, The Governor is where CEO has set a time for
succession to the next generation and then announce it to the public with a commitment
The First International Conference on Entrepreneurship
Book One 252
aims to prepare the succession as a whole before the specified time, The Inventor is
where CEO has built a business with the operational structure that will help the
successor to lead the company, the CEO in this system also provides training, advice
and negotiating meeting to discuss measures to be implemented in the company,
Transition Czar is where CEO will act to provide training and support to each successor
in different ways and forms divisions structured so that the successor will still has a
good relationship in the family business level and also with the CEO.
Gimeno & Coma-Cros (2010: 72-77) has a different view of the model system for the
family business and preparation for succession, first is Captain and Emperor Models
where it has two systems have in common in succession to prepare working CEOs and
elderly led to a succession of not performing as well as having a business structure that
is at risk, Professional Family Model is developed in the mid-level succession, the
successor able to overcome the problems with maintaining relationships between family
members and still be professional in accordance with their respective capabilities,
Corporation Model is developed by a succession of different models from the family
professional model which is more focused on professionalism in management roles with
or without family members.
Business preparation for leadership transition is also preparing for family business that
will be continued by the successor with following indicators (Aronoff CE, 2011: 28), (a)
Sales and profit growth, (b) Location (c) Attractive product with high demand on the
present and future, (d) Marketing program focuses on a well-defined marketing segment,
(e) Employees are trained to take responsibility, (f) Financial statements, management
reports that are reliable and good control, (g) Facilities and the latest equipment, (h)
Standard procedures and policies on site, (i) No threat to the regulations and potential
litigation. Transition of leadership by the CEO to successor, carried following indicators
to be ensured successful (Poza, 2010: 89), (a) Possessed in knowledge and passion in
family business, (b) Understand the capabilities and shortcomings as well as having the
experience and education, (c) Determination to lead and serve, (d) Support from the
generation predecessor, mentor and professional, (e) Good relationship and able to
adjust to other people, (f) Trust on non-family professionals, (g) Control of the
leadership and ownership, (h) Appreciation from employees, customers, suppliers and
family, (i) Able to suit the business needs of the family, (j) Appreciate the past and
focus on future business and family.
The successor profile had to have the basic things to be fulfilled in order to reach
success in both business and family. Those are trust, good communication and values
that are mutually shared life in the family business (Michael Henry, 2013). Family
Preparation for future leadership transition is in following indicators, (Aronoff CE,
2011: 53), (a) Family values relating to the business, (b) Family involvement policy in
business, (c) The principle of compensation for family members, (d) Ethic code relating
to business, (e) Policies in the financial information, (f) Guidelines to form a family
organization. Preparation for ownership is in following indicators (Aronoff CE, 2011:
60), (a) Successor seeing themselves as business people, (b) Consider the welfare of
others (business, family and shareholders) as themselves, (c) Education about business
ownership, (d) Understand the privilege of ownership, (e) Business value addition as an
institution.
The First International Conference on Entrepreneurship
Book One 253
In preparation for the succession program there are 5 basic factors that are universally
recognized in the family business succession,
(1) CEO Preparation, as a business owner, CEO prepared to provide control for the
successor to the business planning and preparation for retirement. (2) Business
Preparation, the CEO shall be independent in order to make the system ready with new
leadership. (3) Successor Development, the value of life, ability and ethic code. Future
development will focus on successor for the future of the business, including for the top
leadership position. (4) Family Preparation, support of the family in the form of a
discussion on the influence of the family business as well as approval for same vision
and mission of the business as well as in family. (5) Ownership Preparation, the
transition from the CEO or founder to successor in the family business with
acknowledgement on business ownership, business arrangements and cooperation.
These five basic factors have purpose to let the family business able to be continued by
a successor with a independent system that leads to perfect leadership in family business
and five basic steps used as reference in succession for problems and solutions for a
variety of family business (Aronoff CE, 2011: 4.17-18).
Research Method and Result
Putra (2013: 87) says the qualitative research is to provide a major concern on the
meaning rather than measure and is often described as the cause of cultural studies
focusing on the relationship between human beings and / or human relations with the
products, services and brands in a specific cultural context. In this research the author
will examine Damai Sejahtera family business that specializes in plastic mica for 15
years involving the four people as internal part of Damai Sejahtera, the first is Soewarno
Ongkowidjojo as CEO, Cicilia Ira Ratnawati as administrator, Adi as employee who
have worked more than five years and become confidant of the CEO who knows the
family and the business internally, Christopher Gerry as the author's brother who is still
attending senior high school as a potential successor. The main issue in the family
business is there is no preparation for the second-generation succession program
planning as the first generation is still in charge on the overall activities at Damai
Sejahtera so that the second generation has not had the preparation as a successor for the
future.
Method of Data Collection
In researching of Damai Sejahtera family business succession readiness, the author use
the survey questionnaire because the scope of the answer only refers to the indicator
points at each step to determine the succession preparation program planning proposed
by Aronoff (2011).
Validity and Reliability
Surveys were conducted by distributing questioner to the four informants and
accompany each informant to answer each point of the five-step, non-participatory
observation on the business and family. It conducted unstructured interviews that refer
to confirm the answers that are not clear in the survey for example that in the family
preparation to the question 'Does the family have a family values relating to the
business? 'Questions on the four informants, for example, if the CEO answered' yes'
The First International Conference on Entrepreneurship
Book One 254
then the answer will be tested its validity by asking 3 other informants such as the
CEO's wife who answered 'yes', because at a time when a family gathering, the CEO
expressed to successor to not to be greedy in taking advantage when doing business in
the future. Employee answered ' Do not know’ due to not following the family meeting
and the successor has the same answer with CEO's wife so it has a validity of data so
that it does not use in-depth interviews but only to give general reasons for any answers
given of each point.
Method of Data Analysis
The research will follow the 5 basic factors of preparation program of Damai Sejahtera
business succession. Analysis of these data will be processed in a descriptive and
detailed thoroughly explained with existing data with primary data obtained by the
survey (Aldoranuary, 2012) which will be established in general because of the
limitations of the study are based on a survey in accordance with the help of non-
participatory observation and unstructured interviews which are elaborated on validity
and reliability. Four informants are using code as A is CEO, Wife of the CEO is B, C is
Employee and D is Successor. Indicators of 5 basic factors are in the following (Aronoff
CE, 2011),
CEO Preparation which includes (a) CEO readiness for succession, (b) Financially
secured, (c) Strategic plan for the family business, (d) An election to the successor and
retirement, (e) Complete property planning, (f) Life after retirement, (g) Permit to
successor to take risks in the family business, (h) Sense of comfort with the successor
model of leadership in business and the new system by the successor.
Business Preparation which includes (a) Sales and profit growth, (b) Location (c)
Attractive product with high demand on the present and future, (d) Marketing program
focuses on a well-defined marketing segment, (e) Employees are trained to take
responsibility, (f) Financial statements, management reports that are reliable and good
control, (g) Facilities and the latest equipment, (h) Standard procedures and policies on
site, (i) No threat to the regulations and potential litigation.
Successor Development that includes (a) A work experience outside of the family
business, (b) A personal development plan, (c) A family member or tutor to help
successor, (d) Opportunity to contribute independently and in a real business. (e)
Sustainable way to learn skills and values in business and beyond, (f) A mentor or
family member to teach the history, philosophy and business strategy, (g) Opportunity
to practice outside of business leads and gains appreciation, (h) Develop a rational
individual to work in the business, (i) Time with other family members to share the
interest.
Family Preparation that includes (a) Family values relating to the business, (b) Family
involvement policy in business, (c) The principle of compensation for family members,
(d) Ethic code relating to business, (e) Policies in the financial information, (f)
Guidelines to form a family organization.
Ownership Preparation that includes (a) Successor seeing themselves as business people,
(b) Consider the welfare of others (business, family and shareholders) as themselves, (c)
Education about business ownership, (d) Understand the privilege of ownership, (e)
Business value addition as an institution. Research at Damai Sejahtera is conducted to
explain the succession readiness program planning in the family business. Researcher
The First International Conference on Entrepreneurship
Book One 255
has chosen four informants to be involved in the family business for an interview
including CEO, the CEO's wife, employee (CEO confidant) and successor.
Preliminary research on family business succession program planning in Damai
Sejahtera, referring to the 5 basic factors proposed by Aronoff because it is used as
reference in succession for problems and solutions for a variety of family business
(Aronoff CE, 2011: 4.17-18). Based on the results of the research that has been done
can be concluded that the Damai Sejahtera is not ready to do succession program
planning with several factors succession as successor still too young, employees are not
familiar with the successor and the following result:
1. CEO Preparation with six of the eight indicators show the CEO has been
prepared to implement the program and still need preparation through
managerial implications succession when the program starts.
2. Business Preparation with eight of the nine indicators show the business is ready
to implement the succession program and only needs to overcome doubts on
successor and employee about mica plastic’ products.
3. Successor Development with eight of 10 indicators showed the successor is not
ready to implement the program and will be guided so that when the program is
executed successor will be ready.
4. Family Preparation six out of six indicators showed the family was ready to
implement a succession program
5. Ownership Preparation of four of the five indicators indicates ownership by the
successor of preparation and is not ready to take a concerted education and
ownership of the business.
CONCLUSION
The research has shown that Damai Sejahtera is not ready for succession program
planning based on 5 basic factors by Aronoff and suggestions for further research is to
involve consumers and suppliers as external parties to determine insightful market, then
using a family mediator in order to obtain more accurate data and neutral side whether
in a good family situation and conflict as well and using in-depth interviews in each
informant to obtain information so that the quality of the information obtained, the
research can answer perfectly.
The study was conducted in order to obtain maximum results, but this study cannot be
separated from the limitations, the results of this study using only simple survey for a
variety of internal conflicted conditions and advised to the family to use the interview
directly to obtain more accurate data for further research.
The First International Conference on Entrepreneurship
Book One 256
REFERENCES
Aldoranuary 2012 .Deskriptif Kualitatif.
http://aldoranuary26.blog.fisip.uns.ac.id/2012/02/29/deskriptif-kualitatif/. Accessed on
May 28, 2014
Arnoff, Craig E., Ward, John L., 2011. Family Business Value 1st Edition. India:
Palgrave Macmillan
Cooper, Donald R. and Pamela S. Schindler, 2011. Business Research Methods.
New York: Mcgraw Hill Irwin
Gero, Pieter P., 2011. Bisnis Keluarga Pilar Penting bagi Perekonomian
Asia.Jakarta: PT Kompas Cyber Media
Gimeno, Albert, Coma-Cros, Gemma Baulenas & Joan.2010. Family Business
Models.United Kingdom: Palgrave Macmillan
Henry, Michael, Ronel Erwee & Eric Kong.2013.Family Business Succession:
Trust and gender issues in family and non-family succession, the European Academy of
Management, Turkey Galatasaray University, 2013
Poza, Ernesto J.2010.Family business 3E.United States of America: South-
Western Cengage Learning
Putra, Nusa.2013.Metode Penelitian Kualitatif Manajemen.Indonesia:
PT RajagrafindoPersada
Thorton, Grant.Potret Bisnis dan Perusahaan Keluarga Indonesia
http://ybisnis.com/potret-bisnis-dan-perusahaan-keluarga-indonesia/. Accessed on March 12,
2014
Tirdasari, Nyanyu and Henry Dhewanto.2012.Family Business Succession in
Indonesia: A Study of the Hospitality Industry, International Conference on
Asia Pacific Business Innovation and Technology Management,
Procedia - Social and Behavioral Sciences 69-74, 2012
Wahyono, Imam Sentot.2014.Suksesi Dalam Perusahaan Keluarga, Jurnal Ilmiah
Dosen UMSurabaya, 2014
The First International Conference on Entrepreneurship
Book One 257
CREATING COMFORT ZONE WITH ENTREPRENEURSHIP
Wulandari Harjanti1
STIE Mahardhika
Surabaya INDONESIA
E-mail: [email protected]
ABSTRACT
Studying the comfort zone was intriguing because according to
Bernadette Kusdiantari, Consultant Experd, the comfort zone is a
situation when a person is already comfortable with the situation. The
crisis that hit Indonesia since 1996 not only affected business, but also
affected the public welfare. The world of work is getting narrower, while
the people who need jobs is increasing. Unemployment caused by the
absence of jobs eventually becomes a burden on society as well.
Unemployment is a result of the difficulty of getting a job, especially in
big cities. It required courage to open comfort zone to make a new
breakthrough in the world of entrepreneurship. The government is
expected to support the advancement of entrepreneurship in Indonesia by
providing marketing assistance and capital goods that have been
produced so that the entrepreneur can establish a business without a
hitch on the cost of capital and marketing. Job seekers were initially only
interested in the formal sector is also expected to change his views and
switch on the informal sector entrepreneurs
Keywords: Comfort Zone, Entrepreneurship, Opportunity
INTRODUCTION
Human life is very challenging to a more in the works. Studying the comfort zone was
intriguing because according to Bernadette Kusdiantari, Experd Consultant, the comfort
zone is a situation when a person is already comfortable with the situation. Targets that
you received are not challenging yourself to do something more than current. Someone
who has been in a comfortable position usually tend to enjoy what you already have and
do not push themselves to achieve better terms and are satisfied with the current state.
The crisis that hit the Indonesian nation since 1996 not only affect business, but also
affect the public welfare. The world of work is getting narrower, while the people who
need jobs is increasing. Unemployment caused by the absence of jobs eventually
become a burden on society as well. Unemployment is a result of the difficulty of
getting a job, especially in big cities. People living in urban areas often expect to get a
formal job in offices, while employment in the formal sector offers very limited and it is
still in the added presence of the word outsourcing became a familiar sound in our ears.
Unfortunately however, there are still many who do not understand about what is
actually referred to outsourcing labor itself.What is it outsourced?
The First International Conference on Entrepreneurship
Book One 258
Referring to Law No. 13 of 2003 on employment, Outsourcing known as the provision
of labor services as stipulated in article 64, 65 and 66 In the world of Industrial
Psychology, recorded outsourcing employees are contract employees who are supplied
from a provider of outsourcing. Initially, outsourcing company providing the kind of
work that is not directly related to the core business of the company and do not care
about career path. Such as telephone operators, call centers, security guards and
cleaning personnel or cleaning service. But currently, outsourcing is used more
widespread to various lines of activity of the company.
The higher quality of human resources required and the higher the specificity demands
more difficult to fulfill. Limited employment make people find a way to survive in order
to live properly. By looking at the situation of the informal sector is an alternative that
can help absorb unemployment. Entrepreneurship is the best alternative solution.
Entrepreneur is a person who has the willpower to perform helpful actions.
Entrepreneurship is also defined as a person who has ideas and manages and run his or
her project. Entrepreneurship is the ability to mobilize people and resources to create,
develop and implement solutions to various problems in order to create meaning and to
meet human needs.
Based on the above situation, the presence and role of entrepreneurship course will give
effect to the economic progress and improvement in the economic situation in Indonesia
today. Being entrepreneurial means to be able to find and evaluate opportunities to
collect source, the necessary resources and act to take advantage of opportunities. With
the rise of entrepreneurship, Indonesia's economy is also expected to increase. Based on
the background of the problems described above, the problem of this research is how
entrepreneurship will open comfort zone to explore the capabilities in entrepreneurship,
and whether the risk of entrepreneurs in business development in order to increase the
revenue.
LITERATURE REVIEW
Comfort Zone
The majority of people interpret that as long in one company or have worked in an
institution will feel comfortable to undergo what is already in the works and can be
taken every month or do the work on a regular basis, then you've arrived at a
comfortable zone. In this case, a person enters the comfort zone, if in performing career
or work does not set a higher target or make improvements to a more challenging ability,
knowledge, or skills themselves.
The solution is not merely looking for another company, but how to get out of the
secure zone. An example, when in a job you can give a new method, a new target, or
improvements that can further improve the effectiveness and efficiency in your work
unit. It could also contribute in providing solutions to develop the existing business, or
other proposals followed by concrete actions to make it happen, instead of just running
the existing work processes.
Entrepreneurship
Several decades have shown social change and economically very rapidly as a result of
the globalization process in various sectors and the opening of a wide range of trade
cooperation. Although on the other hand, concern arises by inflation, unemployment,
The First International Conference on Entrepreneurship
Book One 259
and economic dilemmas and carrying a balance on this planet. The existence of this
desire led to increasingly demanding creative leadership in solving complex issues and
venture out of the grip or the culture in the region. The next generation of now and
required to be able and trained to deal with this and a variety of social change and
human needs.
In a country that is mired in various aspects such as Indonesia today, food shortages and
famine and humanitarian tragedies often occur. Such conditions lead to a loss of
confidence in the ability of self and the ability to manage the future as there is no more
to be done and just waiting for help without any pass except march on humanitarian
grounds, and it is very vulnerable, especially considering in East Java there are 5
regions lagged behind ie Bondowoso, Situbondo, Bangkalan, Sampang, Pamekasan
(http://www.kemenegpdt.go.id/hal/300027/183-kab-area-behind).
Looking at the above facts about economic life that does not go well, the extent to
which entrepreneurship can provide solutions relevance of economic, environmental,
social and humanitarian problems. Entrepreneurship has a very important role in all
dimensions of life. Rebuilt communities have vitality and energy that started from
entrepreneurial activity.
Entrepreneurship is the ability to mobilize people and resources to create, develop and
implement solutions to various problems in order to meet human needs. A society in
which there are people who have an entrepreneurial spirit will be able to respond to
changing needs and realities. This entrepreneurial spirit is shown by the desire to take
the initiative and be creative and innovative in managing people and resources in order
to achieve satisfactory results. The entrepreneur is an agent of social change, political
and economic.
In general, people associate the entrepreneurship as a pioneering company in the
economic sector. Surely the entrepreneurial spirit can grow and thrive in the economic
sector or NGO such as: a new community organization, a new rehabilitation center, or a
new institution in the field of art. The unique character of entrepreneurship is the
pioneer and builds something new and more effective than continuing something that
already exists.
The linkage between the development of Entrepreneurship with the Economy
Over the past two years, the condition of Indonesia in various fields showed no
significant change. The government policy is still confusing, the law is not clear,
disaster is everywhere, and social conditions increasingly uncertain. In the economic
sector, there is no change towards a better condition. Layoffs persist because many
entrepreneurs are no longer interested in starting or developing a business, and foreign
investors have been many who decided to move their operations to other countries more
promising.
On the other hand, the population of productive age can not be idle. Life still have to
run and steady income to be sought to cover the cost of living that getting more
expensive. Various business ideas sprung and discussed in various forums both formal
and informal meetings. Most of these ideas is simply a "beautiful dream" but some
responded with great enthusiasm. From this it appears that our society should feel
encouraged when faced with a prolonged crisis. This is in line with the opinions
expressed David Fagin (in the book Crouch, 2002), which says that most challenges can
The First International Conference on Entrepreneurship
Book One 260
be faced with creativity. Without creativity, problem is rarely transformed into
opportunities.
The contribution of entrepreneurship to economic development of a country can not be
doubted anymore. A country that can grow and can construct ideally, should have
entrepreneurs at 2% of the total population (UN). The entrepreneur is meant here is that
according to the criteria of professional expertise, has a strong entrepreneurial character,
have high achievement motivation (McClelland) and the ability to innovate (Drucker)
and the ability of the affiliated or build alliances.
Positive Effect of Entrepreneurship
The positive impact of socio-economical that the entrepreneur who create jobs, improve
quality of life, improve income distribution, harness and mobilize national resources to
increase productivity, and improve the welfare of government through government
programs, such as taxes and others. Hendra Esmara forwarded ideas measurement
Indonesian development consisting of three components and 20 indicators. The third
component is the population and employment, economic growth, and equity and social
welfare. Based on these ideas, the entrepreneurship can improve the development of
Indonesia because entrepreneurship can provide jobs that improve the welfare of society.
According to Michael P. Todaro, a source of economic progress could include a wide
range of factors, but in general it can be said that the main sources of economic growth
is the existence of investments that can improve the quality of capital or human and
physical resources, which in turn managed to increase quantity of productive resources
and that can raise the productivity of all resources through new discoveries, innovation,
and technological progress. Based on these opinions, entrepreneurship may affect the
rate of economic growth of a country.
Given the positive impact entrepreneurs, the job seekers are initially only interested in
the formal sector is expected to change their views and switch on the informal sector.
According to Stephen R. Covey, the change is often a painful process. It is a change that
must be motivated by a higher purpose, by the willingness to play down what you think
you want now for what you want in the future.
RESEARCH METHODOLOGY This study is a quantitative descriptive which means that qualitative is valued by an
average score of results with a population of workers who use 8 hours of work and rest
of time to run entrepreneurial activity where researcher have obtained 100 respondents
randomly in East Surabaya, with 8 questions to determine that a person must be able
and willing to get out of the comfort zone. The statement structure includes:
1. How much is the revenue gained from the activity apart of the permanent job?
2. What entrepreneurial field/activity is done off the office hour?
3. How much capital has been issued?
4. How much risk does ever appear?
5. Is it difficult to start the job?
6. Where is the location chosen?
7. What reason exists to work outside the office?
8. How long has a business been run?
The First International Conference on Entrepreneurship
Book One 261
RESULT AND DISCUSSION Along with the development effort is usually followed by a change in management style,
then at the same time entrepreneurs are faced with various risks. Basically there are two
risks faced by entrepreneurs when given the opportunity to develop their business. Both
of these risks are real risks, the risks are visible, can be counted, can be anticipated and
avoided and psychological risk, ie the risk that is not visible, can not be calculated, it
can be anticipated, but not necessarily inevitable.
According to Walter Wriston (in the book chouch, 2002), life is a process of risk
regulation, not abolition. Complaints such as those mentioned above should not be the
case if the entrepreneur has prepared the infrastructure of human resource development
effort since the decision was made. In fact, HR planning is rarely done by the
entrepreneurs and often forgotten. Placement of professionals in the business into a
process that is often called the entry and exit of employees ataupu contestable markets
as a result of piracy against professionals, but not necessarily the exact pirated
professional results with the business needs in lakoni, entrepreneurs often end up being
disappointed.
In the opinion of Douglas Mc Gregor (the book Sadarachmat, 2001), there are two types
of theories that show human nature at work, namely the theory X and theory Y. Theory
X assumes that humans basically are lazy, always trying little as possible, not have
ambition, do not want to take the initiative that they want is a sense of security, has no
responsibility. While the theory Y assumes that people are basically not opposed to the
need to organize and view work as an activity that is reasonable or needs, such as eating,
sleeping, resting, and so on. Human salalu ready and wants to take responsibility. Based
on this theory, we can imagine if the assumptions of the theory of X is all around us,
how hard and difficult it to take care of an organization. This is what inhibits the
development of entrepreneurship.
The statement structure includes:
1. How much is the revenue gained from the activity apart of the permanent job?
a. Obtain under 1 million answered by 25 respondents
b. Obtain above 1 million to 5 million answered by 45 respondents
c. Obtain above 5 million answered by 30 respondents
2. This shows that the respondents have understood the advantages that can be
gained by doing some efforts out of their comfort zone.
3. What entrepreneurial field/activity is done off the office hour?
a. laundry services, health; answered by 20 respondents
b. Products like culinary answered by 45 respondents
c. Business franchises and multi-level marketing answered by 35
respondents
4. This shows that the majority of respondents understand the business run and its
risk.
5. How much capital has been issued?
a. Over 40 million, answered by 25 respondents
b. Between 10-40 million, answered by 55 respondents
c. Below 10 million answered by 20 respondents
The First International Conference on Entrepreneurship
Book One 262
6. This shows the big amount of capital absorbed outside the comfort zone and the
need to take into account the risks that might be occured.
7. How much risk does ever appear?
8. Over 10 million , answered by 5 respondents
9. Under 10 million , answered by respondents
10. There is absolutely no risk , answered by respondents
11. Respondent who choose that “There is absolutely no risk” because they have
obtained the break-even point so they do not feel the loss of doing hobby, such
as joining Multi-level Marketing or culinary.
12. Is it difficult to start the job?
a. It is difficult, answered by 30 respondents to the initial word initially
“embarrassed” and do not know how to do business so it needs such
meetings and consultations in the MLM business
b. Easy, answered by 70 respondents because all comes from their hobby
and implemented well
c. Where is the location chosen?
13. In front of the house, answered by 70 respondents 10 respondents
14. Hire stand, answered by 70 respondents 70 respondents
15. Cyber , answered by 70 respondents 20 respondents
16. Nearly 90 respondents to open a business outside the house-zone due to the
profit gained.
17. What reason exists to work outside the office?
18. Getting financial excess, answered “yes” by 80 respondents
19. Implementing hobby that can not be done in the office, answered by 20
respondents
20. How long has a business been run?
a. Less than 1, answered by 30 respondents
b. Between 1-10 years, answered by 50 respondents
c. More than 10 years, , answered by 20 respondents
21. Running a business that is less than one year are due to try and enjoy new
business increase, and jumping from one business to another business and not
feel fit yet with the business run, but of all the business outside the office are
very promising and prove the truth of the book Robert T. Rich Dad Son
Kiyoshaki about Rich.
CONCLUSIONS AND RECOMMENDATIONS
Conclusion
The presence and the role of entrepreneurs have an impact on economic progress and
improvement in the economic situation in Indonesia today because entrepreneurs can
create jobs, improve the quality of life, improve income distribution, harness and
mobilize national resources to increase productivity, and improve the welfare of
government. Thus, the increasing development of entrepreneurship can improve the
economy in Indonesia.
The First International Conference on Entrepreneurship
Book One 263
Recommendation
After doing research on opening a comfort zone with entrepreneurial ability to dig
themselves, it is advisable entrepreneurship can be a viable alternative in the effort to
alleviate poverty and unemployment in Indonesia. The government is expected to
support the advancement of entrepreneurship in Indonesia by providing marketing
assistance and capital goods that have been produced so that the entrepreneur can
establish a business without a hitch on the cost of capital and marketing. Job seekers
were initially only interested in the formal sector is also expected to change his views
and switch on the informal sector entrepreneurs. And workers who feel the need for a
better life can enjoy free time after working with entrepreneurial businesses.
REFERENCES
Covey, Stephen R. The 7 Habits 1997 of Highly Effective People. Jakarta: Binarupa script.
Crouch, Van. Pocket Book 2002 The CEO (Chief Executive Officer). New York: Harvest
Publication House.
Esmara, Hendra. 1986 Planning and Development in Indonesia. Jakarta: PT. Scholastic.
Sadarachmat, Duduh. 2001 Flower Potpourri Management. Surabaya: Magazine Partners.
Todaro, Michael P. 2000 Economic Development in the Third World Seventh Edition. New
York: McGraw.
Todaro, Michael. "The Urban Employment Problem in Less Developed Countries - An Analysis
of Demand and Supply". ProQuest. Retrieved January 14, 2014
Internet sources
http://www.amikom.info/resiko-entrepreneur-in-development-bisnis/
Indonesia. Law no. 13 of 2003 on Employment

The First International Conference on Entrepreneurship
Book One 264
Note: ----------------------------------------------------------------------------------------------------------
--------------------------------------------------------------------------------------------------------------------
--------------------------------------------------------------------------------------------------------------------
--------------------------------------------------------------------------------------------------------------------
--------------------------------------------------------------------------------------------------------------------
--------------------------------------------------------------------------------------------------------------------
--------------------------------------------------------------------------------------------------------------------
--------------------------------------------------------------------------------------------------------------------
--------------------------------------------------------------------------------------------------------------------
--------------------------------------------------------------------------------------------------------------------
--------------------------------------------------------------------------------------------------------------------
--------------------------------------------------------------------------------------------------------------------
--------------------------------------------------------------------------------------------------------------------
--------------------------------------------------------------------------------------------------------------------
--------------------------------------------------------------------------------------------------------------------
--------------------------------------------------------------------------------------------------------------------
--------------------------------------------------------------------------------------------------------------------
--------------------------------------------------------------------------------------------------------------------
--------------------------------------------------------------------------------------------------------------------
--------------------------------------------------------------------------------------------------------------------
--------------------------------------------------------------------------------------------------------------------
--------------------------------------------------------------------------------------------------------------------
--------------------------------------------------------------------------------------------------------------------
--------------------------------------------------------------------------------------------------------------------
--------------------------------------------------------------------------------------------------------------------
--------------------------------------------------------------------------------------------------------------------
--------------------------------------------------------------------------------------------------------------------
--------------------------------------------------------------------------------------------------------------------
--------------------------------------------------------------------------------------------------------------------
--------------------------------------------------------------------------------------------------------------------
--------------------------------------------------------------------------------------------------------------------
--------------------------------------------------------------------------------------------------------------------
------------------------------------------------------------------------------------------------------------------- --------------------------------------------------------------------------------------------------------------------
--------------------------------------------------------------------------------------------------------------------
--------------------------------------------------------------------------------------------------------------------
--------------------------------------------------------------------------------------------------------------------
--------------------------------------------------------------------------------------------------------------------
------------------------------------------------------------------------------------------------------------------- --------------------------------------------------------------------------------------------------------------------
--------------------------------------------------------------------------------------------------------------------
--------------------------------------------------------------------------------------------------------------------
--------------------------------------------------------------------------------------------------------------------

The First International Conference on Entrepreneurship
Book One 265
Note: ----------------------------------------------------------------------------------------------------------
--------------------------------------------------------------------------------------------------------------------
--------------------------------------------------------------------------------------------------------------------
--------------------------------------------------------------------------------------------------------------------
--------------------------------------------------------------------------------------------------------------------
--------------------------------------------------------------------------------------------------------------------
--------------------------------------------------------------------------------------------------------------------
--------------------------------------------------------------------------------------------------------------------
--------------------------------------------------------------------------------------------------------------------
--------------------------------------------------------------------------------------------------------------------
--------------------------------------------------------------------------------------------------------------------
--------------------------------------------------------------------------------------------------------------------
--------------------------------------------------------------------------------------------------------------------
--------------------------------------------------------------------------------------------------------------------
--------------------------------------------------------------------------------------------------------------------
--------------------------------------------------------------------------------------------------------------------
--------------------------------------------------------------------------------------------------------------------
--------------------------------------------------------------------------------------------------------------------
--------------------------------------------------------------------------------------------------------------------
--------------------------------------------------------------------------------------------------------------------
--------------------------------------------------------------------------------------------------------------------
--------------------------------------------------------------------------------------------------------------------
--------------------------------------------------------------------------------------------------------------------
--------------------------------------------------------------------------------------------------------------------
--------------------------------------------------------------------------------------------------------------------
--------------------------------------------------------------------------------------------------------------------
--------------------------------------------------------------------------------------------------------------------
--------------------------------------------------------------------------------------------------------------------
--------------------------------------------------------------------------------------------------------------------
--------------------------------------------------------------------------------------------------------------------
--------------------------------------------------------------------------------------------------------------------
--------------------------------------------------------------------------------------------------------------------
------------------------------------------------------------------------------------------------------------------- --------------------------------------------------------------------------------------------------------------------
--------------------------------------------------------------------------------------------------------------------
--------------------------------------------------------------------------------------------------------------------
--------------------------------------------------------------------------------------------------------------------
--------------------------------------------------------------------------------------------------------------------
------------------------------------------------------------------------------------------------------------------- --------------------------------------------------------------------------------------------------------------------
--------------------------------------------------------------------------------------------------------------------
--------------------------------------------------------------------------------------------------------------------
--------------------------------------------------------------------------------------------------------------------
--------------------------------------------------------------------------------------------------------------------
--------------------------------------------------------------------------------------------------------------------
--------------------------------------------------------------------------------------------------------------------
--------------------------------------------------------------------------------------------------------------------
--------------------------------------------------------------------------------------------------------------------
--------------------------------------------------------------------------------------------------------------------
--------------------------------------------------------------------------------------------------------------------

The First International Conference on Entrepreneurship
Book One 266
Note: ----------------------------------------------------------------------------------------------------------
--------------------------------------------------------------------------------------------------------------------
--------------------------------------------------------------------------------------------------------------------
--------------------------------------------------------------------------------------------------------------------
--------------------------------------------------------------------------------------------------------------------
--------------------------------------------------------------------------------------------------------------------
--------------------------------------------------------------------------------------------------------------------
--------------------------------------------------------------------------------------------------------------------
--------------------------------------------------------------------------------------------------------------------
--------------------------------------------------------------------------------------------------------------------
--------------------------------------------------------------------------------------------------------------------
--------------------------------------------------------------------------------------------------------------------
--------------------------------------------------------------------------------------------------------------------
--------------------------------------------------------------------------------------------------------------------
--------------------------------------------------------------------------------------------------------------------
--------------------------------------------------------------------------------------------------------------------
--------------------------------------------------------------------------------------------------------------------
--------------------------------------------------------------------------------------------------------------------
--------------------------------------------------------------------------------------------------------------------
--------------------------------------------------------------------------------------------------------------------
--------------------------------------------------------------------------------------------------------------------
--------------------------------------------------------------------------------------------------------------------
--------------------------------------------------------------------------------------------------------------------
--------------------------------------------------------------------------------------------------------------------
--------------------------------------------------------------------------------------------------------------------
--------------------------------------------------------------------------------------------------------------------
--------------------------------------------------------------------------------------------------------------------
--------------------------------------------------------------------------------------------------------------------
--------------------------------------------------------------------------------------------------------------------
--------------------------------------------------------------------------------------------------------------------
--------------------------------------------------------------------------------------------------------------------
--------------------------------------------------------------------------------------------------------------------
--------------------------------------------------------------------------------------------------------------------
--------------------------------------------------------------------------------------------------------------------
--------------------------------------------------------------------------------------------------------------------
--------------------------------------------------------------------------------------------------------------------
--------------------------------------------------------------------------------------------------------------------
--------------------------------------------------------------------------------------------------------------------
--------------------------------------------------------------------------------------------------------------------
--------------------------------------------------------------------------------------------------------------------
--------------------------------------------------------------------------------------------------------------------
--------------------------------------------------------------------------------------------------------------------
--------------------------------------------------------------------------------------------------------------------
--------------------------------------------------------------------------------------------------------------------
--------------------------------------------------------------------------------------------------------------------
--------------------------------------------------------------------------------------------------------------------
--------------------------------------------------------------------------------------------------------------------
--------------------------------------------------------------------------------------------------------------------
--------------------------------------------------------------------------------------------------------------------
--------------------------------------------------------------------------------------------------------------------

The First International Conference on Entrepreneurship
Book One 267
Note: ----------------------------------------------------------------------------------------------------------
--------------------------------------------------------------------------------------------------------------------
--------------------------------------------------------------------------------------------------------------------
--------------------------------------------------------------------------------------------------------------------
--------------------------------------------------------------------------------------------------------------------
--------------------------------------------------------------------------------------------------------------------
--------------------------------------------------------------------------------------------------------------------
--------------------------------------------------------------------------------------------------------------------
--------------------------------------------------------------------------------------------------------------------
--------------------------------------------------------------------------------------------------------------------
--------------------------------------------------------------------------------------------------------------------
--------------------------------------------------------------------------------------------------------------------
--------------------------------------------------------------------------------------------------------------------
--------------------------------------------------------------------------------------------------------------------
--------------------------------------------------------------------------------------------------------------------
--------------------------------------------------------------------------------------------------------------------
--------------------------------------------------------------------------------------------------------------------
--------------------------------------------------------------------------------------------------------------------
--------------------------------------------------------------------------------------------------------------------
--------------------------------------------------------------------------------------------------------------------
--------------------------------------------------------------------------------------------------------------------
--------------------------------------------------------------------------------------------------------------------
--------------------------------------------------------------------------------------------------------------------
--------------------------------------------------------------------------------------------------------------------
--------------------------------------------------------------------------------------------------------------------
--------------------------------------------------------------------------------------------------------------------
--------------------------------------------------------------------------------------------------------------------
--------------------------------------------------------------------------------------------------------------------
--------------------------------------------------------------------------------------------------------------------
--------------------------------------------------------------------------------------------------------------------
--------------------------------------------------------------------------------------------------------------------
--------------------------------------------------------------------------------------------------------------------
--------------------------------------------------------------------------------------------------------------------
--------------------------------------------------------------------------------------------------------------------
--------------------------------------------------------------------------------------------------------------------
--------------------------------------------------------------------------------------------------------------------
--------------------------------------------------------------------------------------------------------------------
--------------------------------------------------------------------------------------------------------------------
--------------------------------------------------------------------------------------------------------------------
--------------------------------------------------------------------------------------------------------------------
--------------------------------------------------------------------------------------------------------------------
--------------------------------------------------------------------------------------------------------------------
--------------------------------------------------------------------------------------------------------------------
--------------------------------------------------------------------------------------------------------------------
--------------------------------------------------------------------------------------------------------------------
--------------------------------------------------------------------------------------------------------------------
--------------------------------------------------------------------------------------------------------------------
--------------------------------------------------------------------------------------------------------------------
--------------------------------------------------------------------------------------------------------------------
--------------------------------------------------------------------------------------------------------------------

The First International Conference on Entrepreneurship
Book One 268
Note: ----------------------------------------------------------------------------------------------------------
--------------------------------------------------------------------------------------------------------------------
--------------------------------------------------------------------------------------------------------------------
--------------------------------------------------------------------------------------------------------------------
--------------------------------------------------------------------------------------------------------------------
--------------------------------------------------------------------------------------------------------------------
--------------------------------------------------------------------------------------------------------------------
--------------------------------------------------------------------------------------------------------------------
--------------------------------------------------------------------------------------------------------------------
--------------------------------------------------------------------------------------------------------------------
--------------------------------------------------------------------------------------------------------------------
--------------------------------------------------------------------------------------------------------------------
--------------------------------------------------------------------------------------------------------------------
--------------------------------------------------------------------------------------------------------------------
--------------------------------------------------------------------------------------------------------------------
--------------------------------------------------------------------------------------------------------------------
--------------------------------------------------------------------------------------------------------------------
--------------------------------------------------------------------------------------------------------------------
--------------------------------------------------------------------------------------------------------------------
--------------------------------------------------------------------------------------------------------------------
--------------------------------------------------------------------------------------------------------------------
--------------------------------------------------------------------------------------------------------------------
--------------------------------------------------------------------------------------------------------------------
--------------------------------------------------------------------------------------------------------------------
--------------------------------------------------------------------------------------------------------------------
--------------------------------------------------------------------------------------------------------------------
--------------------------------------------------------------------------------------------------------------------
--------------------------------------------------------------------------------------------------------------------
--------------------------------------------------------------------------------------------------------------------
--------------------------------------------------------------------------------------------------------------------
--------------------------------------------------------------------------------------------------------------------
--------------------------------------------------------------------------------------------------------------------
--------------------------------------------------------------------------------------------------------------------
--------------------------------------------------------------------------------------------------------------------
--------------------------------------------------------------------------------------------------------------------
--------------------------------------------------------------------------------------------------------------------
--------------------------------------------------------------------------------------------------------------------
--------------------------------------------------------------------------------------------------------------------
--------------------------------------------------------------------------------------------------------------------
--------------------------------------------------------------------------------------------------------------------
--------------------------------------------------------------------------------------------------------------------
--------------------------------------------------------------------------------------------------------------------
--------------------------------------------------------------------------------------------------------------------
--------------------------------------------------------------------------------------------------------------------
--------------------------------------------------------------------------------------------------------------------
--------------------------------------------------------------------------------------------------------------------
--------------------------------------------------------------------------------------------------------------------
--------------------------------------------------------------------------------------------------------------------
--------------------------------------------------------------------------------------------------------------------
--------------------------------------------------------------------------------------------------------------------


![[Drum] Essential styles for the drummer & bassist - Book One.pdf](https://img.pdfslide.us/doc/110x75/5695d4121a28ab9b02a02dc5/drum-essential-styles-for-the-drummer-bassist-book-onepdf.jpg)