Embed Size (px)
Citation preview

817
Introduction
Forestry is the practice of creating, managing, using, and con-serving forests to sustainably meet desired social goals, needs, and values. In California, active forest management is cur-rently limited to productive timberlands that are not in parks or preserves. Timberlands are forests that can be managed for the sustainable production of wood products. The 1.65 mil-lion hectares of private timberlands and 2.55 million hect-ares of National Forest timberlands represent 30% of Califor-nia’s total forest area (Table 36.1). Forest lands not classified as timberlands either have low site productivity or are reserved forest lands. An additional 0.88 million hectares of ecolog-ically similar forests are permanently reserved from wood products utilization through statute or administrative desig-nation. The reserved forest lands provide an example of what timberlands could look like without harvesting. From an eco-nomic standpoint, economic timberlands can be described as lands that, under guidance by local, state, and federal envi-ronmental regulations, can sustain positive revenues from the sale of wood products such as building materials, fuel-wood, and paper products after deducting resource manage-ment expenses. If they do not provide positive net revenues,
private timberlands can be converted to residential or recre-ational land uses, and public timberlands need to be financed like parks through general government revenues and user fees. In addition to the global ecosystem service of carbon sequestration that the forest and wood products provide, dif-ferent forest management approaches also affect other ecosys-tem services such as biodiversity, water quality and quantity, and amenity values. The goal of this chapter is to describe how different management regimes affect California’s forest ecosystems and their provision of ecosystem services.
Most of California’s timberlands fall into four of the ten major forest type groups defined by the Forest Inventory and Analysis (FIA) program (Christensen 2008). California mixed conifer, ponderosa pine, Douglas-fir, and redwood for-est types contain commercially valuable tree species such as ponderosa pine (Pinus ponderosa), Jeffrey pine (P. jeffreyii), sugar pine (Pinus lambertiana), Douglas-fir (Pseudotsuga men-ziesii), white fir (Abies concolor), incense cedar (Calocedrus decurrens), and coast redwood (Sequoia sempervirens). The Cali-fornia mixed conifer forests are the most extensive type and are intermixed with ponderosa pine forests on drier and less
THIRTY-SIX
ForestryWILLIAM STEWART, BENKTESH SHARMA, ROB YORK, LOWELL DILLER,
NADIA HAMEY, ROGER POWELL, and ROBERT SWIERS
54709p669-984.indd 817 9/24/15 11:30 AM

818 Managed SySteMS
productive sites. the redwood forests type hugs the Pacific Ocean and grades into douglas-fir forests on drier and more interior sites. the FIa network consists of thousands of for-est plots that are remeasured every decade. this provides an unbiased database of vegetation across wide ranges of physio-graphic and ownership conditions (Figure 36.1).
A Natural Experiment
California’s timberlands have been shaped by a long and varied history of anthropogenic and natural influences. Pri-vate and public ownership classes within timberlands of each forest type share broadly similar geology, climate, fire regimes, fauna and flora. these characteristics are described in other chapters in this book (see Chapters 26– 28). the cur-rent mosaic of vegetation and habitat diversity on the timber-lands reflects a long legacy of active timber harvesting since the 1850s, effective fire suppression since the 1920s, a depen-dence on natural regeneration rather than plantation plant-ings, and the ongoing impact of large wildfires and other disturbance agents such as insects and pathogens. the FIa program provides plot-level and aggregated data that includes forest area, detailed tree demographics, basic life form infor-mation on forbs and shrubs, and other soils, disturbances, and air pollution data (Christensen 2008). the amount of wood products removed or potentially removable is com-monly measured in terms of the amount of final product. Board foot measurements refer to the amount of lumber, or sawn wood, that could be extracted from a tree or forest stand (tappeiner et al. 2007). this represents about half of the total usable volume measured in board feet of wood that is currently utilized for lumber, energy, pulpwood, and other wood products (Morgan et al. 2012). Harvest volumes in this chapter have been converted to metric units from the more widely used estimates based on board foot measurements unless noted otherwise.
Harvests, fires, grazing, and biotic disturbances such as dis-ease and insect outbreaks have extensively altered current and historical timberlands since the California gold Rush. His-torical harvesting and fires followed by natural regeneration
often involved significant levels of soil erosion and impacts to other forest characteristics such as fish and wildlife habitats. Forest harvesting and regeneration on private timberlands are regulated under California’s Forest Practice Rules (California department of Forestry and Fire Protection 2013), where Sec-tion 897 describes how landowners who desire a harvesting permit are required to “achieve a balance between growth and harvest over time consistent with the harvesting meth-ods within the rules of the Board, maintain functional wild-life habitat . . . , retain or recruit late and diverse seral stage habitat components . . . , and maintain growing stock, genetic diversity, and soil productivity.” Management of timberlands in federal ownership depends on the land management plans that direct management actions (U.S. Forest Service and U.S. Bureau of Land Management 2000, U.S. Forest Service Pacific Southwest Region 2004), legal definitions on some areas that prohibit commercial timber harvesting, and budget con-straints. Since 2000, most national Forest timberlands have experienced very limited management actions except for fire suppression (USda Forest Service PSW Region Remote Sens-ing Lab 2007) (in Christensen 2008). the reserved forest land category may have had some historical harvests but are now mainly in state parks, national parks, wilderness, or roadless areas where commercial timber harvesting is not permitted. For simplicity, the minor amounts of forest under Bureau of Land Management, department of defense, and U.S. Fish and Wildlife Service management are also placed in the reserved forest land statistics.
For the timberlands at the focus of this chapter, govern-ment ownership dominates the interior California mixed conifer and ponderosa pine forest types while private owner-ship dominates the douglas-fir forests and the redwood for-est type closer to the coast (table 36.2). the highly produc-tive redwood forests are in either private ownership or public parks after being purchased by private, state, and federal enti-ties. Private timberlands in interior forest types generally pro-duce 10– 15% more timber than public timberlands and cur-rently have 25% lower inventories due to more harvests over time (tables 36.3 and 36.4).
Having three distinct management regimes— private tim-berlands, national Forest timberlands, and reserved forest land— on forests that all have the biological capacity to be managed to produce wood products is essentially a broadly applied, ongoing natural experiment (Walters and Holling 1990). Comparing these three regimes can provide retrospec-
taBLe 36.1
Forest area by owner of all forests in California (hectares)
Forest typesPrivate
forest land national forest
timberland Reserved
forest land total
Major timberland forests (California mixed conifer, ponderosa pine, douglas-fir, redwood)
1,653,000 2,255,000 878,000 4,785,000
Other coniferous forests 414,000 632,000 1,857,000 2,903,000
Hardwood forests and nonstocked forest lands
3,075,000 811,000 1,626,000 5,512,000
ToTal foresT 5,141,000 3,698,000 4,361,000 13,200,000
source: PnW-FIa 2013.
Photo on previous page: ten- to one-hundred-year-old regenerating forest stands in a central Sierra mixed conifer forest. Photo: Rob york.
54709p669-984.indd 818 9/24/15 11:30 AM

Forestry 819
tive insights into how historic and current forestry activities affect both global and local ecosystem services. As with many natural experiments, consistency of initial conditions, rep-lications, and controls are somewhat constrained. the most significant global ecosystem services provided by timberlands are the global carbon cycle impacts of maintaining high for-est carbon stocks (Hayes et al. 2012); and the sustainable sup-ply of products that can replace fossil-fuel based alternatives such as coal, cement, steel, and plastics as well as provide additional carbon storage (Nabuurs et al. 2007, Canadell and raupach 2008, Malmsheimer et al. 2011). While historic con-version efficiencies of trees to products were low (Harmon et
al. 1996), they are increasing (skog 2008, smith et al. 2009, Morgan et al. 2012) and further improvements are feasible. Different forest management practices also affect localized ecosystem services such as plant and animal biodiversity, pro-tection of clean air and clean water resources, and the mainte-nance of soil resources. the amenity values of forests are pri-marily a function of visitation and visibility. Amenity values are highest for scenic forests near urban areas and in acces-sible parks, moderate on public forests and family-owned for-ests, and lowest on industrial forest lands where recreational infrastructure is limited (Fire and resource Assessment Pro-gram 2003).
3000 50 100 200
km
Private, DF
Private, MC
Private, PP
Private, RW
Public, DF
Public MC
Public, PP
Public, RW
American semidesert and desert
California coastal range open woodland-shrub-coniferous forest-meadow
California coastal steppe-mixed forest-redwood forest
California dry steppe
Intermountain semidesert
Intermountain semidesert and desert
Sierran steppe-mixed forest-coniferous forest-alpine meadow
Ecoregion provinces
California coastal chaparral forest and shrub
Legend
FIGURE 36.1 Locations of FIA (Forest Inventory and Analysis) plots of the four major production forest types by ownership class (private, public). source: PNW-FIA 2013.
DF: Douglas-fir, MC: mixed conifer, PP: ponderosa pine, RW: redwood.
54709p669-984.indd 819 10/8/15 5:31 AM

820 Managed SySteMS
History of California’s Timberlands
1849– 1949
the gold Rush set off a huge growth in the demand for lum-ber to build flumes, mining towns, new cities, and railroads. the first sawmills were built in the Sierra nevada near gold-mining regions where wood was also the main source of heat.
When John Leiberg surveyed the forests of the Feather, yuba, Bear, american, and truckee watersheds in the 1890s, he esti-mated that 42% of the forests had been harvested for lumber or fuel and that 24% of the forests had been severely burned by wildfires that were intentionally or accidentally set by the new residents (Leiberg 1902).
access to the enormous redwood forests along the north Coast started in the 1860s, leading to the development of
taBLe 36.2
Forest area by owner of the four major timberland types (hectares)
Forest typePrivate
timberland national forest
timberland Reserved
forest land total
California mixed conifer 847,000 1,680,000 630,000 3,157,000
Ponderosa pine 304,000 477,000 119,000 900,000
douglas-fir 273,000 98,000 71,000 441,000
Redwood 229,000 – 58,000 287,000
ToTal foresT 1,653,000 2,255,000 878,000 4,785,000
source: PnW-FIa 2013.
taBLe 36.3
average site productivity by forest type and owner (m3 ha-1 year-1) based on FIa estimates of potential annual commercial wood volume production
Forest typePrivate
timberland national forest
timberland Reserved
forest land
California mixed conifer 7.7 7.0 6.8
Ponderosa pine 6.4 4.8 5.4
douglas-fir 9.2 5.8 9.1
Redwood 12.9 – 12.2
area weighted average for four timberland forest types
8.4 6.4 7.1
area weighted average for nonredwood forests
7.7 6.5 6.8
source: PnW-FIa 2013.
taBLe 36.4
average and interquartile range for carbon mass (MgC ha-1) by forest type and owner
Forest typePrivate
timberland national forest
timberland Reserved
forest land
California mixed conifer 70 (31–92) 108 (46–150) 104 (54–137)
Ponderosa pine 51 (22–71) 59 (18–69) 63 (22–64)
douglas-fir 118 (64–140) 142 (43–208) 157 (83–240)
Redwood 153 (61–227) n/a 435 (205–552)
source: PnW-FIa 2013.
54709p669-984.indd 820 9/24/15 11:31 AM
Forestry 821
many sawmills that sent much of their production to san Francisco, which then became the hub of a maritime-lum-ber market. the san Francisco– based lumber market deliv-ered wood around the Pacific rim (Williams 1989). In addi-tion, large areas of forests were given to companies by the federal government in a checkerboard pattern to entice them to build railroads. the federal forest reserve system brought an end to the policy of the federal government selling forest lands and resulted in large areas of forest eventually becom-ing managed as National Forests and National Parks (Dana and Fairfax 1980).
California’s sawmill production surveys from 1849 to 1946 record harvests of 2.4 million cubic meters (1.0 billion board feet) of lumber per year (steer 1948). oregon and Washing-ton produced 10.4 million cubic meters (4.4 billion board feet) of lumber per year over this span and exported much of their production to California (steer 1948). sawmill- and for-est-based volume estimates reported in board feet of lumber refer to the volume of finished products rather than the vol-ume of trees harvested. It is estimated that at least an equiv-alent amount of biomass was removed for products such as fuel (Figure 36.2), other building products, and pulpwood (Hair and Ulrich 1967). tops, branches, and small trees were left at the logging sites where there was not a strong demand for fuelwood. Preferential harvesting of pines shifted the spe-cies balance towards less valuable white fir and incense cedar across much of California’s mixed conifer and pine forests. During this era, statewide output was mainly pine (53%), red-wood (23%), and Douglas-fir (11%) with the shade-tolerant true firs and incense cedar making up only 10% of the total lumber harvest (steer 1948).
1950– 1999
Increased demand from a growing economy and the open-ing up of National Forests to more timber harvesting charac-terized this half-century. Annual timber output during this period averaged 8.5 million cubic meters (3.6 billion board feet) per year of lumber with roughly equivalent removals for pulp chips and energy (Hair and Ulrich 1967). Private tim-ber production peaked in the early 1950s, but newly roaded areas of the National Forests kept statewide harvest levels high through the 1970s. Beginning in the 1970s, large areas of National Forest lands with forest cover, some of which had been harvested, received wilderness and roadless desig-nations and were then removed from the production base. While reductions in forest cover and biomass have been doc-umented to increase water yields (Zhang et al. 2001) that are highly valued in California when they can be diverted to farms and cities, damages to water quality led to major efforts to strengthen regulations and to improve best management practices (Ice et al. 2004, rice et al. 2004) to limit erosion from logging operations and roads.
As the century ended, concerns over a number of endan-gered animal and fish species associated with forests and for-est streams led to sharp reductions in harvests on both fed-eral and private timberlands. the expansion of the temporary and permanent road and skid trail networks related to timber harvesting during this period had led to significant increases in soil erosion into streams. the most significant negative impacts occurred in the highly erosive North Coast, where road building and mechanical timber harvesting generated huge pulses of sediment into streams and rivers that severely
impacted salmonid populations (yoshiyama and Moyle 2010; see Chapter 33, “rivers”). expensive restoration efforts to improve salmonid habitats began near the end of the century.
2000– 2013
After a fifty-year era of significant harvests from both private and federal lands, harvest volumes now come primarily from private lands. Annual timber harvests have declined to 2.6 million cubic meters (1.1 billion board feet) with two-thirds of the current timber harvest consisting of high-value species such as redwood, Douglas-fir, and pines, and the remaining one-third consisting mainly of lower-value white fir (Morgan et al. 2012). Harvest methods on private timberlands in Cal-ifornia are unique on the West Coast in that they are dom-inated by selection and intermediate harvests rather than clearcut harvests to produce timber. Harvesting only some of the trees in any given area leaves the majority of the trees and other vegetation but also involves more frequent entries into the forest. However, in the years preceding the economic slowdown of 2008, the area permitted for selection harvest prescriptions on private lands declined more rapidly than that permitted for 1– 20 hectare units of clearcut harvests (Fig-ures 36.3, 36.4).
Private landowners who want to reduce numbers of small trees to reduce fire risk or shift resource availability to more commercially valuable trees typically bundle these activities with commercial harvests (stewart and Nakamura 2012). By the end of this period, the U.s. Forest service restated their mission around the concept of ecological restoration, which limited the amounts of harvested products (U.s. Forest ser-vice Pacific southwest region 2013). on the North Coast, eco-logical restoration related to protecting and improving sal-monid habitats has been accomplished with considerable investment of public funds. In addition, projects such as the creation of the 9,000 hectare yurok tribal Community Forest from lands previously owned by Green Diamond resources Company create forests where fisheries and wildlife habitat protection become the dominant management goals.
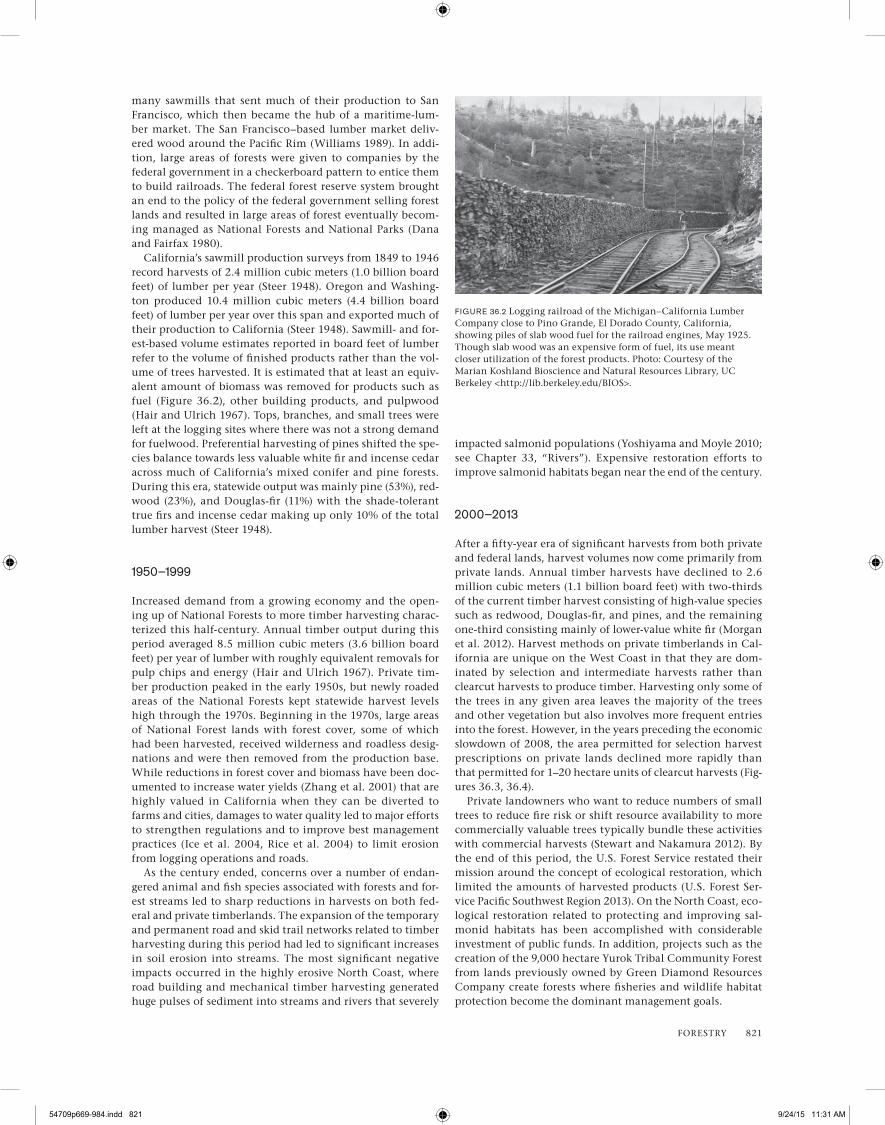
FIGURE 36.2 Logging railroad of the Michigan– California Lumber Company close to Pino Grande, el Dorado County, California, showing piles of slab wood fuel for the railroad engines, May 1925. though slab wood was an expensive form of fuel, its use meant closer utilization of the forest products. Photo: Courtesy of the Marian Koshland Bioscience and Natural resources Library, UC Berkeley <http://lib.berkeley.edu/BIos>.
54709p669-984.indd 821 9/24/15 11:31 AM

822 Managed SySteMS
Global Ecosystem Services under Different Forest Management Regimes
temperate forests are major carbon sinks (Ciais et al. 2013) even with the majority of these forests periodically harvested for products (Smith et al. 2009, nabuurs et al. 2013, Canadian Forest Services 2013). different forest types as well as manage-ment regimes have unique net tree growth, natural emissions, and harvest patterns that influence forest carbon sequestra-tion estimates (Hayes et al. 2012). Private timberland own-ers typically have a greater focus on maximizing net growth than managers of national Forest timberlands. Within each major forest type, private timberlands maintain lower inven-tory per hectare (see table 36.4) but produce considerably more wood products (tables 36.5 and 36.6). Losses to fires, insects, and disease are more pronounced in California’s dry interior forests than in the moister redwood and douglas-fir forests along the Coast. How effectively society uses the har-vested wood products to reduce fossil fuel– related emissions and maintain carbon storage during wood product use life-times as well as in landfills depends on regulations, resource use practices, and the costs of new product and of old prod-uct disposal.
California’s three major forest management regimes pro-vide different levels of products (see table 36.5). Private tim-berlands account for 42% of California’s timberlands (see table 36.1) and now produce 85% of forest products (Morgan et al. 2012; see table 36.6) in California. the larger area of national Forest timberlands produces most of the remainder, with only small amounts coming from other public lands. although the common board foot measurement of forest inventories refers to the volume of sawn lumber, over half of all the harvested volume is wood chips used for bioenergy or shipped to pulpmills in Oregon (Morgan et al. 2012). While some accounting systems consider wood used for energy to be “lost” to the forest/forest products sector and do not account for it in the energy sector (e.g., Hayes et al. 2012), we follow the IPCC guidelines used in the national greenhouse gas accounting (U.S. environmental Protection agency 2013), where wood used for bioenergy is considered carbon-neutral if forest inventories are stable. When corrected for differences in site productivity, private timberlands are producing about six times as much harvested product per hectare as national Forest timberlands (see table 36.6).
Local Ecosystem Services under Different Forest Management Regimes
In addition to the significant global ecosystem benefits of for-est carbon inventories (Hayes et al. 2012, PnW-FIa 2013) as well as the direct carbon storage and substitution benefits when harvested products are used instead of fossil-fuel inten-sive products (Malmsheimer et al. 2011, Fried 2013), stand- and tree-level characteristics influence plant diversity, ani-mal biodiversity, and amenity benefits. all three are often positively associated with a mosaic of diverse forest struc-tures with trees of all sizes and ages. Christensen et al. (2008)
1947 1957
Tribal and other public forests
1967 1977 1987 1997 2007
Cub
ic m
eter
s of
woo
d (h
undr
ed th
ousa
nds)
2
4
6
8
10
12
14
16
National forests
0
Year
Private forests
1997 1999 2001 2003 2005 2007 2009 2011
Are
a un
der n
ew 3
-yea
r har
vest
per
mit
(ha
x 10
00) Selection harvest
Intermediate harvestClearcut harvest
Year
10
0
20
30
40
50
60
FIGURE 36.3 California timber harvest by ownership class, 1947– 2012. Morgan et al. 2012.
FIGURE 36.4 area of private harvest by major silvicultural types. Source: Cal Fire 2013b.
54709p669-984.indd 822 9/24/15 11:31 AM

Forestry 823
provides detailed FIA plot-based analyses of disturbances, stressors, trees, and understory vegetation for all forest types. the following section focuses on the interactions of harvests, natural disturbances, and forest regeneration under different management regimes.
one metric for assessing forest stand diversity is the mix of stand ages, measured by the age of the dominant trees that are assumed to represent the oldest trees. In California’s timberlands, private stands have an average age of 71 years, National Forest timberlands have an average age of 104 years, and reserved forest lands have an average stand age of 115 years. the distribution of forest area by forest stand age (Fig-
ure 36.5) is often used as a proxy for structural classes (oliver and Larson 1996) or seral classes (Hall et al. 1995) that are important to the food web and habitat requirements of many animal species (spurr and Barnes 1980).
We analyzed plot-level tree lists and vegetative cover per-centages from hundreds of FIA plots to provide a compari-son across the different management regimes. Median and mean values are both presented (see table 36.6), as high-value outliers for many attributes are common across manage-ment regimes. the interquartile and the full range of forest plot biomass densities illustrate the similarities and differ-ences among forest stands under the three primary manage-
tABLe 36.5
Harvested products from private and U.s. Forest service timberlands in California in 2006 in (MgC)
Land ownershipsawn wood
products Pulp Bioenergy total
Private 708,633 253,083 506,166 1,467,882
National forest 105,835 36,812 115,038 257,685
ToTal 814,468 289,895 621,204 1,725,567
Percentage of total 47% 17% 36% 100%
Source: Morgan et al. 2012. NoTe: the cubic foot harvest volumes in Morgan et al. 2012 have been converted to MgC based
on Food and Agriculture organization (FAo 1947) conversions to make them comparable to in-forest carbon stocks data in these sections.
tABLe 36.6
Median and mean values for forest metrics for four production forests by management regime
Private timberland (n = 602)
National forest timberland (n = 980)
reserved forest land (n = 329)
Metric Median Mean Median Mean Median Mean
All live trees (MgC ha-1) 63.55 85.21A 75.01 98.24B 93.59 121.07C
<=25 cm dbh (MgC ha-1) 8.65 11.32A 6.40 9.02B 4.14 7.14C
26–64 cm dbh (MgC ha-1) 32.47 41.84A 31.80 38.32A,B 26.71 35.22B
>65 cm dbh (MgC ha-1) 10.38 32.05A 24.88 50.90B 46.82 78.72C
All standing dead trees (MgC ha-1) 1.26 3.89A 2.72 7.17B 5.21 11.65C
<=38 cm dbh standing (MgC ha-1) 0.19 1.02A 0.30 1.41B 0.38 2.04C
>38 cm dbh standing (MgC ha-1) 0.00 2.87A 1.45 5.76B 3.84 9.62C
Downed wood (MgC ha-1) 8.95 12.72A 7.60 10.86B
shrub cover (%) 12 18 11 18
Forb cover (%) 4 8 3 5
Graminoid cover (%) 2 5 2 4
2006 removals (MgC ha-1) 0.89 0.11
NoTe: Means with different letters are statistically significantly different from each other (Wilcoxon signed-rank test, p <0.05). one-tenth of the plots were measured each year between 2002 and 2011.
54709p669-984.indd 823 9/24/15 11:31 AM

824 Managed SySteMS
ment regimes (Figures 36.6 and 36.7). the range, median, and mean values for small trees, medium trees, and small snags are similar across management regimes. differences in overall, stand-level tree biomass densities across manage-ment regimes were driven primarily by the biomass in live trees larger than 65 centimeters in diameter and in snags larger than 38 centimeters in diameter. downed wood den-sities and understory vegetation cover were similar between private timberlands and national Forest timberlands. the upper quartile of private timberland plots had considerable biomass in large snags, but many plots had few if any large snags, which are important habitat elements for some birds and mammals.
Understory vegetation is important for floristic diversity and is an important source of food and cover for many ani-mals that live on the forest floor. the use of clearcut harvest followed by systematic replanting is practiced on a minor por-tion of private timberlands, but overall life form abundance of shrubs, forbs, and graminoids is similar for private timber-lands and public timberlands (Figure 36.8). detailed floristic surveys comparing plantations to adjacent mixed-age stands across seventy-three paired plantation/natural forest sites in northern California showed that the plantations can rapidly acquire floristic diversity and can eventually achieve simi-lar levels of floristic diversity after their initial establishment (James et al. 2012).
Beyond meeting the regulatory requirements of water quality and wildlife agencies, relatively little is published on how owners of private timberlands manage their resources to achieve positive outcomes. In the following section, we provide examples of forest management with goals for both long-term timber productivity and broader forest ecosys-tem attributes. While some of the examples described lack the certainty that can come from well-designed experiments, they illustrate forest management approaches that are able to meet both economic and ecological goals. the first exam-ple highlights results from an experimental forest where a broad range of management approaches have been used for
Private forest lands
USFS timberlands
Other government
Stand age in years (for dominant trees in the stand)0 – 40 41–80 81–120 120–160 160+
Are
a (h
a x
1000
)
2000
1750
1500
1250
1000
750
500
250
0
Ownership type
++
+
+
+ + +
++
++
−1
<=25 cm dbh trees 26−64 cm dbh trees >65 cm dbh trees
All live trees
50
150
200
250
300
0
100
Mg
C h
a
+
National Foresttimberland(n = 980)
Reservedforest lands(n = 329)
Private timberland(n = 602)
FIGURE 36.5 age of dominant trees in stands for the private forest lands, U.S. Forest Service (USFS) timberlands, and ecologically similar forests in government parks and roadless areas (other government). Source: PnW-FIa 2013.
FIGURE 36.6 Carbon stocks in live trees in timberlands and ecologically similar forests under different management regimes; 1 Mg = 1,000 kg. the box defines the interquartile range (IQR) around the median value. the whiskers are 1.5 × IQR. Outliers are not shown for clarity. the population mean is shown by the (+); n is the number of plots in each group. Plot data were collected from 2002 through 2011. Source: PnW-FIa 2013.
+
+
+
+ + ++
+
+
+
+
+
<=38 cm dbh standing >38 cm dbh standing Downed wood
All standing dead trees
Not
ava
ilabl
e
+
+
++
++
+
+ ++
+
010
2030
Mg
C h
a-1
Ownership type
USFS nonreserved timberland(n = 980)
Reservedforest lands(n = 329)
Private forest land(n = 602)
FIGURE 36.7 Carbon stocks in dead standing and downed trees in private and federal timberlands and ecologically similar reserved forest lands. Source: PnW-FIa 2013.
+ +
+
++
+
+ +
+
Notavailable
ShrubsForbsGraminoids
0
10
20
30
40
50
60
Ownership type
Per
cent
age
cove
r (%
)
+
++
+
+ +
USFS nonreserved timberland(n = 980)
Reservedforest lands(n = 329)
Private forest land(n = 602)
FIGURE 36.8 Understory cover in timberlands and ecologically similar forests. Source: PnW-FIa 2013.
54709p669-984.indd 824 9/25/15 10:34 AM

Forestry 825
decades on adjacent stands. the second summarizes the eco-logically oriented actions of family forest owners who own half the private timberlands in California. the third example summarizes an innovative effort to introduce a rare mam-mal onto managed timberlands within its historic range. the fourth describes major efforts to address floral and faunal bio-diversity within the construction of approved habitat conser-vation plans of a large timber company. the final example illustrates the challenge of managing for rare plants whose growth requirements are not necessarily aligned with local forest management regulations.
Experimental Managed Forests
experimental forests with a designed range of treatments can act as “rosetta stones” to translate differences in global and local ecosystem services across different forest management approaches. the 12 square kilometer Blodgett Forest research station of the University of California (Blodgett) is one of the few locations in California where a gradient of forest man-agement approaches is applied and evaluated within a long-term experimental framework. A primary focus of Blodgett management over the past fifty years has been to achieve and document the creation of a sustained timber yield while also sustaining wildlife, water, soil, archaeological, and visual resources as required by the California Forest Practices rules. similar research results for ponderosa pine forests in north-ern California have come from experimental forests managed by the U.s. Forest service (Zhang et al. 2008, youngblood 2011, Zhang et al. 2012). In both cases, well-documented and diverse stand conditions can be a template for research on tree-related and non-tree-related resources under different disturbance conditions.
Blodgett (approximately at 38.9102°N, 120.6627°W) lies between 1,200 and 1,500 meter elevation on the western slope of the sierra Nevada, where annual precipitation averaged 158 centimeters per year. soils are productive, with canopy trees typically reaching 27– 34 meters tall in fifty to sixty years. Fol-lowing extensive logging with railroads and steam engines from 1900 to 1933, the young stands were compartmentalized and assigned to a wide range of management alternatives that span all silvicultural systems including reserves, even-aged, and uneven-aged methods. Harvest activity on the regenerat-ing forest began in earnest in 1962 and has continued annu-ally to the present. the wide range of treatments applied con-sistently over time, coupled with comprehensive permanent plots established in 1974, has enabled the longest available empirical assessment of diverse forest management impacts and trade-offs in productive forests of the sierra Nevada in the context of fire exclusion. even-aged stands consist of both mature stands that have been thinned (i.e., “second-growth”) and regenerated plantations (i.e., “third-growth”) ranging from one to thirty-five years of age. Uneven-aged stands con-sist of complex canopy structures created with periodic selec-tion harvests. From an overhead view, uneven-aged stands have a rougher texture and are more open than the high-den-sity canopies of reserve stands (Figure 36.9).
the combination of productive soils, active management, and long rotations of one hundred years or more has resulted in forest biomass densities greater than those on public lands in mixed conifer forests that had considerably less harvesting. Active management typically involves reductions in the num-ber of trees less than 25 centimeters in diameter. Compared
to the other management regimes, Blodgett also has the high-est proportion of total biomass in the large-tree class. While the median values for large-tree carbon densities are similar across these three management regimes, overall variability among stands is inversely related to forest management inten-sity. Considerably more small-diameter trees are found on the National Forest timberlands and private timberlands than on reserved forest lands and at Blodgett (Figure 36.10). the small trees represent less than 10% of the total stand biomass but constitute a significant component of the ladder fuels in fire-prone forests (Collins et al. 2007).
A comparison of treatment effects on productivity and spe-cies composition at Blodgett (olson and Helms 1996) con-cluded that:
1. standing volume and basic structural diversity increased as a result of postdisturbance stand develop-ment and thirty years of active management.
2. timber productivity across various partial harvest methods was similar in terms of net growth and harvest.
3. Natural regeneration of all species was adequate to sus-tain tree diversity in all of the silvicultural methods.
4. Clearcutting and overstory removal had the least amount of fuels after treatment; individual tree selec-tion and reserves had the most.
the continuation of treatments since this last comparison, coupled with repeated measurement of permanent plots and new analytical tools, allows an update on the productivity, composition, and structure after what is now fifty years of active management at Blodgett. Unless otherwise cited, val-ues are from the Blodgett vegetation database. Between 1995 and 2009, standing tree volume increased while 75% of gross growth was harvested. structural diversity in terms of patch size and age has increased greatly as clearcut and regeneration harvests have created openings ranging in size from 0.01 to 8 hectares. Numerous small openings in uneven-aged stands create a complex structure across the whole ownership, with a wide variety of openings and edges between stands with trees of very different ages (Figure 36.11).
A shift in species composition is clearly occurring in the for-ests managed as reserves. similar to other undisturbed mixed conifer forests (e.g., Ansley and Battles 1998), the reserves have experienced a reduction in ponderosa pine recruitment and a relative increase in white fir and incense cedar. A simi-lar pattern within young single-tree selection stands led to adjustments in harvest patterns that regenerated a more balanced mix of species (york et al. 2012). even-aged meth-ods involve planting and density management and include all native tree species. total species richness (including under-story plants) generally increases with canopy openness at Blodgett (Battles et al. 2001). young even-aged and group selection stands tended to have the highest levels of species richness but also had a higher richness of exotic species. Large wildfires have been effectively excluded from Blodgett since the 1930s with substantial surface and ladder fuel loads as a result. the fire and fire surrogate studies compared the use of prescribed fire and mechanical treatments to reduce high fuel loads in mature forest stands. the results demonstrated that fire risks can be reduced with both mechanical and pre-scribed fire approaches with few negative ecological impacts (Hartsough et al. 2008, Moghaddas et al. 2008, stephens et al. 2009, stephens et al. 2012).
54709p669-984.indd 825 9/24/15 11:31 AM

050
010
0015
0020
0025
000
500
1000
1500
2000
2500
050
010
0015
0020
0025
00
+
+
+
+
+
+
+
+
+ + + ++ + + +
Tree
s ha
−1
<=25 cm dbh trees 26−64 cm dbh trees >65 cm dbh trees
All live trees
0
500
1000
1500
2000
2500
BlodgettForest
(n = 790)
USFS nonreservedtimberland(n = 659)
Tree
s ha
-1
+
+
+
+
+
+
++
+
+ +
+
+
++
+
Reservedforest lands(n = 242)
Private forest land(n = 284)
Ownership type Patch sizes (ha) created by harvests
0 2 4 6 8 10 12 14 16
1
10
100
1000
Num
ber o
f pat
ches
FIGURE 36.9 Even aged, uneven aged, and reserve forest stands at Blodgett Forest (center: 38.9099˚N, 120.6571˚W). Sources: Imagery ©2014 Google, DigitalGlobe, U.S. Geological Survey, USDA Farm Service Agency.
A = reserve (no management except fire suppression), B = single tree selection, C = group selection, D = shelterwood, post seed-step, E = ten-year-old plantation, F = twenty-five-year-old plantation.
FIGURE 36.10 Tree density in California mixed conifer forests by management regime. The box defines the interquartile range (IQR) around the median value. The whiskers are 1.5× the IQR. Outliers are not shown for clarity. The population mean is shown by the (+). Source: PNW-FIA 2013 and Blodgett Forest Research Station 2013.
FIGURE 36.11 Distribution (y-axis transformed with log scale) of patch sizes across Blodgett Forest following fifty years of annual harvests, including both even-aged and uneven-aged harvests. Only patches created by harvests were included. The smallest patch size considered was 0.04 ha. Source: Blodgett Forest Research Station 2013.
54709p669-984.indd 826 9/25/15 10:35 AM

Forestry 827
Increasing forest resilience to projected dramatic yet uncer-tain climatic changes is a key long-term goal for the forest. the two primary assumptions driving this new objective are that a changing climate will have significant yet uncertain effects and that the primary management tool available at Blodgett is the application of silvicultural treatments to influ-ence stand density, species composition, genetic composi-tion, and fuel structure. the limitations of models for pre-dicting ecosystem responses to climate change (e.g., Chmura et al. 2011) force a focus on hedging against uncertainty with active adaptive management (Walters and Holling 1990). the establishment at Blodgett of a wide variety of stand struc-tures and age classes provides an opportunity to test alter-native strategies for building resilient forest stand structures. A high-diversity seed bank is being built that includes seeds from hotter/wetter and hotter/drier climates large enough to replant all of Blodgett in the event of a high-severity fire.
the current gradient of stand densities and age classes will be maintained by continuing all forms of basic regeneration methods (even-aged and uneven-aged methods), while test-ing new approaches for reducing fire severity and increasing drought resistance. stands with a low density of large trees and high frequency of pine species will be developed with the objective of producing stands resistant to extended peri-ods of exceptionally high climatic water deficit. the reserves will be maintained to illustrate how a “hands-off” approach will influence shifts in tree species composition, differential response to drought, and changing fire-risk levels common to stands harvested once with minimal ongoing manipulation. Managing for high levels of timber productivity from for-est stands with high levels of within-stand and across-stand diversity creates a forest that is more ecologically complex than high-yield forest plantations while still providing sig-nificant volumes of wood products and revenue for landown-ers. Finally, the research focus at Blodgett provides an oppor-tunity to study the interactions of various ecosystem services across a wide range of forest structures.
Family Forests
While large timber companies are more visible, around half of private timberland in California is owned by families where revenue, stewardship, amenity, and aesthetic values are more varied (Butler 2008, Christensen et al. 2008, Ferranto et al. 2011). Compared to industrial and national forest timber-lands, family ownerships have lower total inventories per hectare and lower proportions of more commercially valu-able species (Christensen et al. 2008). timber harvesting was reported by 80% of the ownerships with more than 200 hect-ares but becomes progressively less common for smaller own-erships (stewart et al. 2012). owners that harvested timber were nearly twice as likely as those who did not harvest tim-ber to undertake non-revenue-generating stewardship activi-ties such as protection of water quality, improvement of fish and wildlife habitats, and removal of individual trees to pro-mote forest health (table 36.7).
sustainable timber production is the primary revenue-gen-erating alternative to real estate development for forest prop-erties. However, the higher regulatory costs of timber pro-duction in California compared to other states and Canadian provinces are often cited as a significant challenge by for-est land owners (stewart et al. 2012). Where additional costs make a timber harvest uneconomical, associated investments
in road and drainage infrastructures, water quality improve-ments, and wildlife habitat improvements are delayed or not undertaken (Ferranto et al. 2011).
Managing Landscape-scale Biodiversity on Private Timberlands
the following case studies of various ecological restoration projects, programs, and approaches illustrate ways in which owners of private production forests address the maintenance and often the expansion of the populations of rare plant species as well as candidate or listed species under the fed-eral endangered species Act (esA) or the California endan-gered species Act (CesA). Assessments of how different forest management regimes affect wildlife populations are difficult and expensive when they involve monitoring and analysis of populations, food webs, specific habitat elements such as snag trees with cavities, and predator populations. In forest areas with significant numbers of threatened or endangered species, a number of the larger timber companies have been required to provide considerable documentation to regulating state and federal agencies when they propose forest manage-ment practices more active than the default precautionary or no-action approaches.
Expanding Fishers into Their Historical Range
An innovative fisher (Pekania [formerly Martes] pennanti) rein-troduction project (Lewis et al. 2012) involves the formal cooperation of the California Department of Fish and Wild-life, the U.s. Fish and Wildlife service, sierra Pacific Indus-tries, and North Carolina state University. When the project was conceived, the fisher was a candidate for endangered or threatened status under both the U.s. endangered species Act and the California endangered species Act. each cooperator contributed its particular capacity to planning, capture and release, and monitoring. the long-term project started with a formal assessment of the sustainability of potential donor
tABLe 36.7
Correlation between environmental stewardship activities and timber harvesting for forest ownerships larger than 20 hectares (n=96)
environmental stewardship activity
Harvest timber
Do not harvest timber p value
remove exotics .525 .457 .5245
Improve water quality
.738 .389 .0007
Improve riparian habitat
.721 .389 .0012
Improve wildlife habitat
.836 .486 .0003
Cut trees for forest health
.921 .500 .0001
Source: stewart et al. 2012.
54709p669-984.indd 827 9/24/15 11:32 AM

828 Managed SySteMS
populations and likelihood of successful establishment of the introduced population under different scenarios.
the selection goal was healthy females at the beginning of their reproductive lives and males at the peak of their ability to breed with many females. Fishers in some source populations were infected with eye worms (Thelazia califor-nica), and some fishers from Humboldt and western trinity Counties were infected with a previously undescribed trema-tode that could negatively affect fisher survival. these fish-ers were rejected as candidates for translocation. the source population eventually selected in the eastern Klamath Region of northern California had been previously monitored and its population dynamics modeled (Swiers 2013). Because of ongoing monitoring in the eastern Klamath Region, for the first time the effects on a source population of having ani-mals removed could be documented (Swiers 2013). Research-ers found that removing ten adult fishers with the highest reproductive values from the eastern Klamath population had no statistically discernible effect on population growth, annual reproduction, or annual survival of that source population. the project also included modeling of habitat quality of potential release sites before reintroduction (Cal-las and Figura 2008).
From late 2009 through late 2011, the cooperators released forty fishers (24F, 16M) onto the Stirling Management area owned by Sierra Pacific Industries (SPI) in the northern Sierra nevada and southern Cascade Mountains (Figure 36.12) (Powell et al. 2012). Personnel from north Carolina State Uni-versity and the California department of Fish and Wildlife have since conducted monitoring and research on the rein-troduced population. they have, to date, monitored all fish-ers for survival, reproduction, dispersal, and home range development. all released fishers established home ranges and, as in other established populations studied, males had larger home ranges and traveled further than females. the majority of the fishers stayed on the Stirling Management area rather than move to adjacent national forest lands. the released fishers enjoyed high survival during both the ini-tial postrelease period (four months) and for up to two years after release. through 2013, sixteen fishers were known to have died. Females from all annual release cohorts repro-duced in all years. approximately 75– 80% of females each year were tracked to natal dens where they gave birth, produc-ing approximately two kits apiece each year. the estimated minimum population in that area was thirty-seven fishers, representing a growing population. On average, released female fishers upon recapture had increased their weights by 0.1 kilogram and males by 0.4 kilogram. Juvenile fishers cap-tured on Stirling weighed more than similarly aged juveniles from other parts of California. these data, though early, indi-cate that the reintroduced population is healthy and poten-tially self-sustaining. the overall process also illustrates the institutional complexity, extensive resources, and expertise necessary to undertake an experiment to expand the sustain-able population of a wildlife species for which there is limited information.
Habitat Conservation Plans on Private Timberlands
Many of the larger timber ownerships in California use habitat conservation plans or similar agreements to address the habi-tat requirements of rare plants and animals. green diamond Resource Company (green diamond) owns approximately
2,000 square kilometers of forested land in northwestern Cal-ifornia and has developed multiple habitat conservation plans to address the numerous species of concern on its lands. It developed a habitat conservation plan (HCP) for northern spotted owls in cooperation with the U.S. Fish and Wildlife Service in 1992, a deadwood Management Plan and a Sensi-tive Plant Conservation Plan in cooperation with California department of Fish and game in 2005, a second HCP cov-ering six listed or sensitive aquatic species with dual juris-dictions approved by the U.S. Fish and Wildlife Service and national Marine Fisheries Service in 2007, a consistency deter-mination issued for coho salmon by the California depart-ment of Fish and game in 2008, and an incidental take permit for the trinity bristle snail (Monadenia setosa) in 2009. a new forest HCP (FHCP) is expected to be completed in the near future and will include updated conservation measures for the northern spotted owl (Strix occidentalis caurina), the fisher, and two species of tree voles. the approved plans, maps, and mon-itoring reports are available on green diamond’s website.
the earliest plans covered active forest management in areas that overlapped with the ranges of many plant spe-cies and the home ranges of animals of many species that are threatened, endangered, or are under consideration for designation. northern spotted owls are generally associated with old-growth or late seral forests (USFWS 1990, Powell and Zielinksi 1994, Carroll et al. 1999, Courtney et al. 2004, Zie-linski 2004). genetic exchange occurs among owls through-out coastal California and the Klamath Province (Haig et al. 2004), where a variety of forest management regimes are used. In the 1990s the estimated density of northern spot-ted owls on green diamond’s lands was among the highest reported in the scientific literature (diller and thome 1999). green diamond’s mark-recapture study over the last twenty-two years has indicated that juvenile spotted owls disperse to and from green diamond’s lands to the eel River drainage to the south, north into southern Oregon, and to the Hoopa and Willow Creek study areas to the east.
demographic analysis found that the spotted owl popula-tion on green diamond’s timberlands was stable from 1990 to 2001 but then decreased. growing evidence strongly sug-gests that the invasion of barred owls (Strix varia) into north-
0 50 100 200km
California
Oregon
Nev
ada
Trap locations by yearYear 1 (2009–2010)
Year 2 (2010–2011)
Year 3 (2011–2012)
Eastern Klamath
Stirling
FIGURE 36.12 Location of fisher collection trap sites including the eastern Klamath Study area (eKSa) and relocation site on the Stirling Management area owned by Sierra Pacific Industries. Source: Robert Swiers.
54709p669-984.indd 828 9/24/15 11:32 AM

Forestry 829
ern California is responsible for the decline. Preliminary results of a recently initiated removal experiment suggest that control of barred owls is operationally feasible and that spotted owls respond rapidly and favorably where barred owls are removed. When barred owls were removed from historical spotted owl sites covering half of a study area, the sites were recolonized by spotted owls (Diller et al. 2012). While spotted owls prefer to roost and nest in old forests in coastal Califor-nia, their primary small mammal prey occur in young forests such as the ones found on Green Diamond’s land. Long-term demographic studies of spotted owls using mark-recapture data have found that habitat heterogeneity in the form of a mosaic of young and old forests likely contributes to main-taining spotted owls in northern California (Franklin et al. 2000, Diller et al. 2010). Given that fire has largely been elim-inated from managed forests in the redwood region (skinner et al. 2006, stuart and stephens 2006), creating openings of diverse sizes through timber management with retention of some larger live and dead trees could provide valuable eco-tone habitat for spotted owls.
one reason for the prevalence of spotted owls near younger forest plantations may be the high density of dusky-footed woodrats (Neotoma fuscipes). Dusky-footed woodrats tend to be associated with early seral shrub and pole-staged stands (sakai and Noon 1993, Hamm 1995, Hughes 2005) and are an important food source for spotted owls. sustaining a mosaic of early seral stands with significant woodrat popu-lations within a forest environment can be accomplished with harvest blocks or wildfires. Woodrat habitat appears to depend on having sufficient sunlight to promote the growth of early seral plant species that are eaten by woodrats. Under low light levels, unpalatable, shade-tolerant shrubs— such as salal (Gaultheria shallon), evergreen huckleberry (Vaccinium ovatum), and Pacific rhododendron (Rhododendron macrophyl-lum)— dominate understory vegetation. In one study of wood-rats living in areas with various levels of thinning, woodrats did not colonize stands until they reached a level of thinning equivalent to clearcutting or variable retention standards in California (Hamm and Diller 2009). In the portion of their range on company lands, Green Diamond has concluded that spotted owls appear to be compatible with even-age manage-ment where openings, dense stands, and large residual trees maintain habitat heterogeneity (Diller et al. 2010).
Fishers are another rare animal that no longer occupies its historic range and is generally associated with old-growth or late seral forests (UsFWs 1990, Powell and Zielinksi 1994, Carroll et al. 1999, Courtney et al. 2004, Zielinski et al. 2004). No barriers inhibit genetic exchange among fishers within the coastal redwood region and the western Klamath Prov-ince, a contiguous population of fishers in forests from south-ern oregon to the eel river. Fisher densities on Green Dia-mond’s lands are similar to some densities reported elsewhere in North America (thompson 2008) but are considerably lower than those recently reported for the Hoopa Indian res-ervation located to the east of Green Diamond’s lands (Mat-thews et al. 2011, Matthews et al. 2013).
A key to creating a forest matrix used by fishers is identify-ing and maintaining elements such as large-diameter snags and retained live trees with cavities across an ownership where even-aged silviculture is practiced. Unharvested live trees and snags eventually become downed logs and coarse woody debris that are important to some late-seral wildlife species. In addition to late-seral habitat elements, structural complexity of the stand layers (i.e., shrub, intermediate can-
opy, and overstory canopy) and diversity of tree species are important. In particular, conifer stands with a mix of hard-wood species tend to be important to selected species of wild-life such as fishers (Zielinski et al. 2013). A combination of monitoring and managing individual legacy trees and other forms of structural complexity along with recruitment of future habitat elements is central to an information-based approach to timber management. Maintaining noncommer-cial species such as tanoak (Lithocarpus densiflorus), California bay (Umbellularia californica), and Pacific madrone (Arbutus menziesii) that exhibit coppice growth create high structural and species diversity in timberland units in a manner similar to some attributes of late-seral forests. over time, the spread of sudden oak death (P. ramorum) (Filipe et al. 2010) into some of these host trees could have negative impacts on some hard-wood trees in the region.
Habitat conservation plans have also been implemented on Green Diamond’s lands for a number of salmonids and amphibians. Across California, erosion from historical land uses, water diversions, and pollution have negatively impacted salmonid populations. Fish surveys on Green Diamond’s lands revealed that historical salmonid streams continue to support significant populations of these fish (Green Diamond resources Company 2013). the initial foci of surveys initiated in 1993 were coho and Chinook salmon (Oncorhynchus kisutch and O. tshawytscha), steelhead (O. mykiss), and cutthroat trout (O. clarki) with annual monitoring of juvenile popula-tions and outmigrant smolt populations in key watersheds throughout the ownership. two potential contributors to the persistence of healthy salmonid populations are the mainte-nance of best management practices for reducing sediment delivery from roads and harvest operations into streams, and the productivity-enhancing role of additional sunlight on res-ident salmonids populations. experiments with different lev-els of sunlight on streams on Green Diamond’s lands showed a positive impact from increased sunlight onto stream reaches on salmonid biomass, density, and growth (Wilzbach et al. 2005).
Managing Sun-demanding Plants within Shade-tolerant Forests
the santa Cruz Mountains historically provided some of the most accessible timber source for the expanding human pop-ulation of the san Francisco Bay area and nearby agricultural areas. Consequently, they were the first forested region in California where nearly all private land was harvested by the 1930s. Forest regrowth and limited harvesting have led to the presence in the santa Cruz Mountains of the densest forests in the state (Christensen et al. 2008). In some cases, dense for-ests without the disturbances historically created by wildfires will not necessarily support the full range of plants that are native to the area (Land trust of santa Cruz County 2011).
County-specific regulations (California Department of For-estry and Fire Protection 2013) allow only single-tree selec-tion and small-group selection harvests. single-tree selection has been practiced on approximately 40% of the land within the timberland Production Zone (tPZ) area in the santa Cruz Mountains. A common characteristic of forests managed by single-tree selection is that only limited light reaches the for-est floor. the central part of this region is home to a number of species that evolved in high-sunlight patches within larger forest areas. santa Cruz manzanita (Arctostaphylos anderso-
54709p669-984.indd 829 9/24/15 11:32 AM

830 Managed SySteMS
nii) inhabits an ecological niche on the edge of southern red-wood– douglas-fir forests in association with blue-blossom ceanothus (Ceanothus thrysiflorus), madrone (Arbutus menzie-sii), California coffeeberry (Frangula californica), and toyon (Heteromeles arbutifolia).
Santa Cruz manzanita is an obligate seeder that produces seed at an early age. More than a dozen manzanita species occur in the Santa Cruz Mountains, occupying a wide vari-ety of niches. Only a few have burls and sprout after fire, but all depend on fire (or mechanical clearing) to provide open-ings for sunlight and bare mineral soil for germination. In the absence of fires or management, there is a lack of recruit-ment of a wide variety of understory species, including Santa Cruz manzanita and several other rare species. the selective removal of small groups of redwood and douglas-fir trees can provide the light penetration to the forest floor necessary to trigger regeneration of many of these understory species. In unmanaged stands, Santa Cruz manzanita is frequently shaded out by an increasing overstory canopy. Perhaps as a result, many of the private lands historically managed for timber production have more of the Santa Cruz manzanita than parks, residential, and recreational parcels with no har-vests. However, the disturbances associated with harvesting also have the potential to introduce and spread exotic species.
Summary
timberlands are forests that can be managed for the sustain-able production of wood products. California’s principal tim-berlands are the California mixed conifer, ponderosa pine, and douglas-fir forests of the interior and redwood forests close to the Pacific Ocean. they cover slightly less than 4 million of the 13 million hectares of forests in California. differences in timberland ownership and management, including practices on the roughly 1 million hectares of reserved forest lands eco-logically similar to harvested areas, create a natural experi-ment that provides insights into how different combinations of managed disturbances (harvests, regeneration, thinning) and natural disturbances (fires, insects, diseases, droughts) affect the provision of global and local ecosystem services.
Redwood forests are nearly twice as productive as other tim-berlands in California and are now mainly private timber-lands or parks. More than half of California mixed conifer, ponderosa pine, and douglas-fir forest types are managed as national Forests, with the rest mainly in private ownership. these mixed conifer forests experience considerably more natural disturbance such as fires, insect and disease infesta-tions, and droughts. Private timberlands, national Forest tim-berlands, and reserve forest lands all have high levels of for-est carbon storage but very different flows of wood products. after correcting for site primary productivity differences, mean inventories on private timberlands are 25% lower than those on similar national Forest timberlands and reserved for-est lands. the total carbon cycle benefits derived from for-est products depend on how efficiently consumers use, reuse, and recycle wood products. Private timberlands annually har-vest approximately six times as much product per hectare as national Forest timberlands while sustaining their invento-ries. the revenues from products and services are important to private timberland owners to keep them from accepting more lucrative offers to sell land for residential and recreational uses.
Private timberlands have similar vegetation characteristics to the less intensively managed national Forest timberlands
and reserve forest lands in many respects, with the exceptions of live trees larger than 65 centimeters in diameter and large snags. Successful efforts to maintain and enhance biodiver-sity while still producing revenue have been demonstrated on some experimental forests, through habitat conservation plans, and through voluntary stewardship actions on family-owned forests. achieving high levels of biodiversity and resil-ience requires considerable investment in intensive monitor-ing of specific species of interest, protection of key habitat elements, and attention to disease and disturbance threats. active management through harvesting, planned regen-eration, and managed fire can increase overall resilience to unknown but changing future conditions. Our understand-ing of forests would benefit from more explicit experiments on both private and national Forest timberlands as we move towards a more uncertain future.
Acknowledgments
the authors want to thank all the research foresters and wild-life biologists from the University of California, the U.S. For-est Service, and many of the private timber companies in Cal-ifornia who provided documents, publications, and valuable review comments. the careful comments of four anonymous reviewers also improved the manuscript.
Recommended Reading
Christensen, g. a., S. J. Campbell, and J. S. Fried, technical editors. 2008. California’s forest resources, 2001– 2005: Five-year forest inventory and analysis report. PnW gtR 763. U.S. Forest Service, Pacific northwest Research Station, Portland, Oregon.
Christensen, g. a., K. Waddell, S. Stanton, O. Kuegler, technical edi-tors. 2015. California’s forest resources: Forest inventory and anal-ysis, 2001– 2010. U.S. Forest Service, Pacific northwest Research Station, Portland, Oregon.
Lanner, R. M. 1999. Conifers of California. Cachuma Press, Los Olivios, California.
tappeiner, J. C., II, d. a. Maguire, and t. B. Harrington. 2007. Silvi-culture and ecology of western U.S. Forests. Oregon State Univer-sity Press, Corvallis, Oregon.
Glossary
DBH diameter of the stem of a tree measured at breast height (1.37 m or 4.5 feet) from the ground.
Group selection trees are harvested within discrete locations within stands to create cleared canopy gaps large enough to facilitate high levels of resource availability for regeneration of all species, including those adapted to colonizing disturbed forests. group sizes generally range from 0.1 hectare to 1.0 hectare.
sinGle tree selection Individual or small groups of trees of all size classes are removed to create growing space for new regeneration and to create highly complex stand structures diffusely across entire stands.
References
ansley, J. S. and J. J. Battles. 1998 Forest composition, structure, and change in an old growth mixed conifer forest in the north-ern Sierra nevada. Journal of the torrey Botanical Society 125: 297–308.
54709p669-984.indd 830 9/24/15 11:32 AM

Forestry 831
Battles, J. J., A. J. shlisky, r. H. Barrett, r. C. Heald, and B. H. Allen-Diaz. 2001. the effects of forest management on plant species diversity in a sierran conifer forest. Forest ecology and Manage-ment 146: 211–222.
Blodgett Forest research station. 2013. Continuous Forest Inventory Database. University of California Center for Forestry, Berkeley, California.
Butler, Brett J. 2008. Family Forest owners of the United states, 2006. Nrs-Gtr-27. Newtown square, PA: U.s. Department of Agriculture, Forest service, Northern research station. 72 p.
California Department of Forestry and Fire Protection (Cal Fire). 2013a. California forest practice rules 2013. Page 306. sacremento, California.
California Department of Forestry and Fire Protection. 2013b. Forest Practice Geographical Information system (GIs). statewide timber Harvest Data.
Callas, r. L., and P. Figura. 2008. translocation plan for the rein-troduction of fishers (Martes pennanti) to lands owned by sierra Pacific Industries in the northern sierra Nevada of Califor-nia. California Department of Fish and Game. sacramento, California.
Canadell, J. G., and M. r. raupach. 2008. Managing forests for cli-mate change mitigation. science 320:1456– 1457.
Canadian Forest service. 2013. the state of Canada's Forests: Annual report 2013. Natural resources Canada. ottawa, Canada.
Carroll, C. r., W. J. Zielinski, and r. F. Noss. 1999. Using pres-ence-absence data to build and test spatial habitat models for the fisher in the Klamath region, U.s.A. Conservation Biology 13:1344– 1359.
Chmura, D. J., P. D. Anderson, G. t. Howe, C. A. Harrington, J. e. Halofsky, D. L. Peterson, D. C. shaw, and J. B. st. Clair. 2011. For-est responses to climate change in the northwestern United states: ecophysiological foundations for adaptive management. Forest ecology and Management 261:1121– 1142.
Christensen, G., J. Fried, and s. Campbell, technical editors. 2008. California’s forest resources, 2001– 2005: Five-year forest inventory and analysis report. PNW-Gtr-763. U.s. Forest service, Pacific Northwest research station, Portland, oregon.
Ciais, P., C. sabine, G. Bala, L. Bopp, V. Brovkin, J. Canadell, A. Chhabra, r. DeFries, J. Galloway, M. Heimann, C. Jones, C. Le Quéré, r. B. Myneni, s. Piao, and P. thornton. 2013. Carbon and other biogeochemical cycles. Pages 465–570 in t. F. stocker, D. Qin, G.-K. Plattner, M. tignor, s. K. Allen, J. Boschung, A. Nauels, y. Xia, V. Bex, and P. M. Midgley, editors. the Physi-cal science Basis. Contribution of Working Group I to the Fifth Assessment report of the Intergovernmental Panel on Climate Change. Cambridge University Press, Cambridge, UK, and New york, New york.
Collins, B. M., J. J. Moghaddas, and s. L. stephens. 2007. Initial changes in forest structure and understory plant communities fol-lowing fuel reduction activities in a sierra Nevada mixed conifer forest. Forest ecology and Management 239:102– 111.
Courtney, s. P., J. A. Blakesley, r. e. Bigley, M. L. Cody, J. P. Dum-bacher, r. C. Fleisher, A. B. Franklin, J. F. Franklin, r. J. Gutiér-rez, J. M. Marzluff, and L. sztukowski. 2004. scientific evaluation of the status of the northern spotted owl. sustainable ecosystems Institute, Portland, oregon.
Dana, s. t., and s. K. Fairfax. 1980. Forest and range policy: Its devel-opment in the United states. McGraw-Hill Book Company, New york, New york.
Diller, L., K. Hamm, D. Lamphear, and t. McDonald. 2012. two decades of research and monitoring of the northern spotted owl on private timberlands in the redwood region: What do we know and what challenges remain? Pages 399– 408 in r. B. standiford, t. J. Weller, D. D. Piirto, J. D. stuart, editors. Proceedings of coast redwood forests in a changing California: A symposium for scien-tists and managers. PsW-Gtr-238. Pacific southwest research sta-tion, Forest service, U.s. Department of Agriculture, Albany, Cali-fornia, and santa Cruz, California.
———. 2010. Green Diamond resource Company, northern spot-ted owl habitat conservation plan, ten-year review report. report available from U.s. Fish and Wildlife service, Arcata Fish and Wildlife office, Arcata, California.
Diller, L. V., and D. M. thome. 1999. Population density of northern spotted owls in managed young-growth forests in coastal north-ern California. Journal of raptor research 33:275– 286.
Ferranto, s., L. Huntsinger, C. Getz, G. Nakamura, W. stewart, s. Drill, y. Valachovic, M. DeLasaux, and M. Kelly. 2011. Forest and rangeland owners value land for natural amenities and as finan-cial investment. California Agriculture 65:184– 191.
Filipe, J. A. N., r. C. Cobb, D. M. rizzo, r. K. Meetemeyer, and C. A. Gilligan. 2010. strategies for control of sudden oak death in Hum-boldt County— Informed guidance based on a parameterized epi-demiological model. Pages 122–125 in s. J. Frankel, J. t. Kliejunas, and K. M. Palmieri, editors. Proceedings of the sudden oak Death Fourth science symposium. PsW-Gtr-229. U.s. Department of Agriculture, Forest service, Pacific southwest research station, Albany, California.
Fire and resource Assessment Program. 2003. the changing Cali-fornia: Forest and range 2003 assessment. Department of Forestry and Fire Protection, sacramento, California.
Food and Agriculture organization. 1947. Conversion factors. Unasylva 1:1:62–63.
Franklin, A. B., D. r. Anderson, r. J. Gutierrez, and K. P. Burnham. 2000. Climate, habitat quality, and fitness in northern spotted owl populations in northwestern California. ecological Monographs 70:539– 590.
Fried, J. 2013. Do carbon offsets work?: the role of forest manage-ment in greenhouse gas mitigation. science Findings 155. U.s. Department of Agriculture, Forest service, Pacific Northwest research station, Portland, oregon.
Green Diamond resources Company. 2013. Aquatic habitat conserva-tion plan: 2013 biennial report. Korbel, California.
Haig, s. M., t. D. Mullins, e. D. Forsman, P. W. trail, and L. I. V. Wennerberg. 2004. Genetic Identification of spotted owls, barred owls, and their hybrids: Legal implications of hybrid identity. Conservation Biology 18:1347– 1357.
Hair, D., and A. H. Ulrich. 1967. the demand and price situation for forest products 1964. Miscellaneous. Publication 983. U.s. Depart-ment of Agriculture Forest service, Washington, D.C.
Hall, F. C., L. Bryant, r. Claunitzer, K. Geier-Hayes, r. Keane, J. Ker-tis, and A. shlisky. 1995. Definitions and codes for seral status and structure of vegetation. PNW-Gtr-363. U.s. Department of Agri-culture, Forest service, Pacific Northwest research station, Port-land, oregon.
Hamm, K. A. 1995. Abundance of dusky-footed woodrats in managed forests of north coastal California. Ms thesis. Humboldt state Uni-versity, Arcata, California.
Hamm, K. A., and L. V. Diller. 2009. Forest management effects on abundance of woodrats in northern California. Northwestern Nat-uralist 90:97– 106.
Harmon, M. e., J. M. Harmon, W. K. Ferrell, and D. Brooks. 1996. Modeling carbon stores in oregon and Washington forest prod-ucts: 1900– 1992. Climatic Change 33:521– 550.
Hartsough, B. r., s. Abrams, r. J. Barbour, e. s. Drews, J. D. McIver, J. J. Moghaddas, D. W. schwilk, and s. L. stephens. 2008. the eco-nomics of alternative fuel reduction treatments in western United states dry forests: Financial and policy implications from the National Fire and Fire surrogate study. Forest Policy and econom-ics 10:344– 354.
Hayes, D. J., D. P. turner, G. stinson, A. D. McGuire, y. Wei, t. o. West, L. s. Heath, B. de Jong, B. G. McConkey, r. A. Birdsey, W. A. Kurz, A. r. Jacobson, D. N. Huntzinger, y. Pan, W. M. Post, and r. B. Cook. 2012. reconciling estimates of the contemporary North American carbon balance among terrestrial biosphere models, atmospheric inversions, and a new approach for estimating net ecosystem exchange from inventory-based data. Global Change Biology 18:1282– 1299.
Hughes, K. D. 2005. Habitat associations of dusky-footed woodrats in managed Douglas-fir / hardwood forests of northern California. Ms thesis. Humboldt state University, Arcata, California.
Ice, G. G., P. W. Adams, r. L. Beschta, H. A. Froelich, and G. W. Brown. 2004. Forest management to meet water quality and fish-eries objectves: Watershed studies and assessment tools in the Pacific Northwest. Pages 239– 261 in G. G. Ice and J. D. stednick, editors. A Century of Forest and Wildland Watershed Lessons. society of American Foresters, Bethesda, Maryland.
James, C. e., B. Krumland, and D. W. taylor. 2012. Comparison of floristic diversity between young conifer plantations and second-growth adjacent forests in California’s northern interior. Western Journal of Applied Forestry 27:60– 71.
Land trust of santa Cruz County. 2011. A conservation blueprint: An
54709p669-984.indd 831 9/24/15 11:32 AM

832 Managed SySteMS
assessment and recommendations from the Land trust of Santa Cruz County. Santa Cruz, California.
Leiberg, J. R. 1902. Forest conditions in the northern Sierra nevada, California. United States geological Survey, department of the Interior, Washington, d.C.
Lewis, J. C., R. a. Powell, and W. J. Zielinski. 2012. Carnivore trans-locations and conservation: Insights from population models and field data for fishers (“Martes pennanti”). PLoS One 7:e32726.
Malmsheimer, R. W., J. L. Bowyer, J. S. Fried, e. gee, R. L. Izlar, R. a. Miner, I. a. Munn, e. Oneil, and W. C. Stewart. 2011. Managing forests because carbon matters: Integrating energy, products, and land management policy. Journal of Forestry 109:S7– S51.
Matthews, S. M., J. M. Higley, J. S. yaeger, and t. K. Fuller. 2011. den-sity of fishers and the efficacy of relative abundance indices and small-scale occupancy estimation to detect a population decline on the Hoopa Valley Indian Reservation, California. Wildlife Soci-ety Bulletin 35:69– 75.
Matthews, S. M., J. M. Higley, K. M. Rennie, R. e. green, C. a. god-dard, g. M. Wengert, M. W. gabriel, and t. K. Fuller. 2013. Repro-duction, recruitment, and dispersal of fishers (Martes pennanti) in a managed douglas-fir forest in California. Journal of Mammal-ogy 94:100– 108.
Moghaddas, J. J., R. a. york, and S. L. Stephens. 2008. Initial response of conifer and California black oak seedlings following fuel reduction activities in a Sierra nevada mixed conifer forest. Forest ecology and Management 255:3141– 3150.
Morgan, t. a., J. P. Brandt, K. e. Songster, C. e. Keegan III, and g. a. Christensen. 2012. California’s forest products industry and tim-ber harvest, 2006. PnW-gtR-866. U.S. department of agricul-ture, Forest Service, Pacific northwest Research Station, Portland, Oregon.
nabuurs, g.-J., M. Lindner, P. J. Verkerk, K. gunia, P. deda, R. Micha-lak, and g. grassi. 2013. First signs of carbon sink saturation in european forest biomass. nature Climate Change 3:792– 796.
nabuurs, g. J., O. Masera, K. andrasko, P. Benitez-Ponce, R. Boer, M. dutschke, e. elsiddig, J. Ford-Robertson, P. Frumhoff, t. Karj-alainen, O. Krankina, W. a. Kurz, M. Matsumoto, W. Oyhantca-bal, n. H. Ravindranath, M. J. Sanz Sanchez, and X. Zhang. 2007. Forestry. In Climate Change 2007: Mitigation. Contribution of Working group III to the Fourth assessment Report of the Inter-governmental Panel on Climate Change. B. Metz, O. R. david-son, P. R. Bosch, R. dave, L. a. Meyer (eds), Cambridge University Press, Cambridge.
Oliver, C. d., and B. C. Larson. 1996. Forest stand dynamics. John Wiley and Sons, new york, new york.
Olson, C. M., and J. a. Helms. 1996. Forest growth and stand struc-ture at Blodgett Forest Research Station 1933– 1955. Pages 681– 732 in Sierra nevada ecosystem Project: Final Report to Congress. Vol-ume II, assessments and Scientific Basis for Management Options. Centers for Water and Wildland Resources, University of Califor-nia, davis, California.
Pacific northwest Research Station Forest Inventory and analysis (PnW-FIa). 2013. the Pacific northwest forest inventory and anal-ysis database annual inventory data, 2001– 2011. U.S. department of agriculture, Forest Service, Pacific northwest Research Station, Portland, Oregon.
Powell, R. a., and W. J. Zielinksi. 1994. Fisher. Pages 38– 73 in L. F. Ruggiero, K. B. aubry, S. W. Buskirk, L. J. Lyon, and W. J. Zielinski, editors. the scientific basis for conserving forest carnivores: amer-ican marten, fisher, lynx, wolverine in the western United States. U.S. department of agriculture Forest Service, Rocky Mountain Forest and Range experiment Station, Fort Collins, Colorado.
Powell, R. a., J. C. Lewis, B. g. Slough, Scott M. Brainerd, n. R. Jor-dan, a. V. abramov, V. Monakhov, P. a. Zollner, and t. Murakami. 2012. evaluating translocation of martens, sables, and fishers. Pages 93– 137 in W. J. Z. Keith B. aubry, Martin g. Raphael, gilbert Proulx, and Steven W. Buskirk, editors. Biology and Conservation of Martens, Sables, and Fishers. Cornell University Press, Ithaca, new york.
Rice, R. M., R. R. Ziemer, and J. Lewis. 2004. evaluating forest man-agement effects on erosion, sediment, and runoff: Caspar Creek and northwestern California. Pages 223– 238 in g. g. Ice and J. d. Stednick, editors. a Century of Forest and Wildland Watershed Lessons. Society of american Foresters, Bethesda, Maryland.
Sakai, H. F., and B. R. noon. 1993. dusky-footed woodrat abundance
in different-aged forests in northwestern California. Journal of Wildlife Management 57:373– 382.
Skinner, C. n., a. H. taylor, and J. K. agee. 2006. Klamath Moun-tains bioregion. Page 596 in n. g. Sugihara, J. W. v. Wagtendonk, K. e. Shaffer, J. Fites-Kaufman, and a. e. thode, editors. Fire in California’s ecosystems. University of California Press, Berkeley, California.
Skog, K. e. 2008 Sequestration of carbon in harvested wood products for the United States. Forest Products Journal 58:56– 72.
Smith, W. B., technical coordinator; P d. Miles, data coordinator; C. H. Perry, map coordinator; and S. a. Pugh, data coordinator. 2009. Forest resources of the United States, 2007. gtR-WO-78. U.S. department of agriculture, Forest Service, Washington, d.C.
Spurr, S. H., and B. V. Barnes. 1980. Forest ecology. John Wiley and Sons, new york, new york.
Steer, H. B. 1948. Lumber production in the United States, 1799– 1946. U.S. department of agriculture Miscellaneous Publication no. 669. government Printing Office, Washington, d.C.
Stephens, S. L., B. M. Collins, and g. Roller. 2012. Fuel treatment longevity in a Sierra nevada mixed conifer forest. Forest ecology and Management 285:204– 212.
Stephens, S. L., J. J. Moghaddas, C. edminster, C. e. Fiedler, S. Haase, M. Harrington, et al. 2009. Fire treatment effects on vegetation structure, fuels, and potential fire severity in western U.S. forests. ecological applications 19:305–320.
Stewart, W. C., and g. nakamura. 2012. documenting the full cli-mate benefits of harvested wood products in northern Califor-nia: Linking harvests to the U.S. greenhouse gas inventory. Forest Products Journal 62:340– 353.
Stewart, W., S. Ferranto, g. nakamura, C. getz, L. Huntsinger, and M. Kelly. 2012. Subdivide or silviculture: Choices facing family forest owners in the Redwood region. Page 626 in R. B. Standi-ford, t. J. Weller, d. d. Piirto, and J. d. Stuart, editors. Proceed-ings of coast redwood forests in a changing California: a sympo-sium for scientists and managers. PSW-gtR-238. Pacific Southwest Research Station, Forest Service, U.S. department of agriculture, albany, California, and Santa Cruz, California.
Stuart, J. d., and S. L. Stephens. 2006. north Coast bioregion. Page 596 in n. g. Sugihara, J. W. v. Wagtendonk, K. e. Shaffer, J. Fites-Kaufman, and a. e. thode, editors. Fire in California’s ecosys-tems. University of California Press, Berkeley, California.
Swiers, R. C. 2013. non-invasive genetic sampling and mark-recap-ture analysis of a fisher (Martes pennanti) population in northern California used as a reintroduction source. MS thesis. north Caro-lina State University, Raleigh, north California.
tappeiner, J. C., II, d. a. Maguire, and t. B. Harrington. 2007. Silvi-culture and ecology of western U.S. Forests. Oregon State Univer-sity Press, Corvallis, Oregon.
thompson, J. L. 2008. density of fisher on managed timberlands in north coastal California. MS thesis. Humboldt State University, arcata, California.
U.S. department of agriculture (USda), Forest Service, Pacific South-west Research Station (PSW) Region Remote Sensing Lab. 2007. Western core table reports. Sacramento, California.
U.S. environmental Protection agency. 2013. Inventory of U.S. greenhouse gas emissions and sinks: 1990– 2011. Washington, d.C.
U.S. Forest Service and U.S. Bureau of Land Management. 2000. Final supplemental environmental impact statement for amendment to the survey and manage, protection buffer, and other mitigating measures standards and guidelines. U.S. Forest Service. Portland, Oregon.
U.S. Forest Service Pacific Southwest Region. 2013. ecological restora-tion implementation plan. R5-MB-249. U.S. department of agri-culture Forest Service, Vallejo, California.
———. 2004. Sierra nevada forest plan amendment, final supplemen-tal environmental impact statement. R5-MB-046. U.S. depart-ment of agriculture Forest Service, Vallejo, California.
USFWS (U.S. Fish and Wildlife Service). 1990. the 1990 status review: northern spotted owl: Strix occidentalis caurina. U.S. department of the Interior Fish and Wildlife Service, Portland, Oregon.
Walters, C. J., and C. S. Holling. 1990. Large-scale management experiments and learning by doing. ecology 71:2060– 2068.
Williams, M. 1989. american and their forests: a historical geogra-phy. Cambridge University Press, Cambridge, UK.
54709p669-984.indd 832 9/24/15 11:32 AM

Forestry 833
Wilzbach, M. A., B. C. Harvey, J. L. White, and r. J. Nakamoto. 2005. effects of riparian canopy opening and salmon carcass addition on the abundance and growth of resident salmonids. Canadian Journal of Fisheries and Aquatic sciences 62:58– 67.
york, r.A., J. J. Battles, r. C. Wenk, and saah. 2012. A gap-based approach for regenerating pine species and reducing surface fuels in multi-aged mixed conifer stands in the sierra Nevada, Califor-nia. Forestry, 85:203–213.
yoshiyama, r. N., and P. B. Moyle. 2010. Historical review of eel river anadromous salmonids, with emphasis on Chinook salmon, coho salmon, and steelhead. Center for Watershed sciences Working Paper. University of California, Davis, California.
youngblood, A. 2011. ecological lessons from long-term studies in experimental forests: Ponderosa pine silviculture at Pringle Falls experimental Forest, central oregon. Forest ecology and Manage-ment 261:937– 947.
Zhang, J., J. Webster, r. F. Powers, and J. Mills. 2008. reforestation
after the Fountain fire in northern California: An untold success story. Journal of Forestry 106:425– 430.
Zhang, J., r. F. Powers, W. W. oliver, and D. H. young. 2013. response of ponderosa pine plantations to competing vegetation control in northern California, UsA: A meta-analysis. Forestry. 86:3–11.
Zhang, L., W. r. Dawes, and G. r. Walker. 2001. response of mean annual evapotranspiration to vegetation changes at catchment scale. Water resources research 37:701– 708.
Zielinski, W. J., C. M. thompson, K. L. Purcell, and J. D. Garner. 2013. An assessment of fisher (Pekania pennanti) tolerance to forest management intensity on the landscape. Forest ecology and Man-agement 310:821–826.
Zielinski, W. J., r. L. truex, G. A. schmidt, F. V. schlexer, K. N. schmidt, and r. H. Barrett. 2004. Home range characteristics of fishers in California. Journal of Mammalogy 85:649– 657.
54709p669-984.indd 833 9/24/15 11:32 AM

54709p669-984.indd 834 9/24/15 11:32 AM