Embed Size (px)
Citation preview
Forest Stand Dynamics

Defining Forest Stand Dynamics
• Forest dynamics describes the underlying physical and biological forces that shape and change a forest
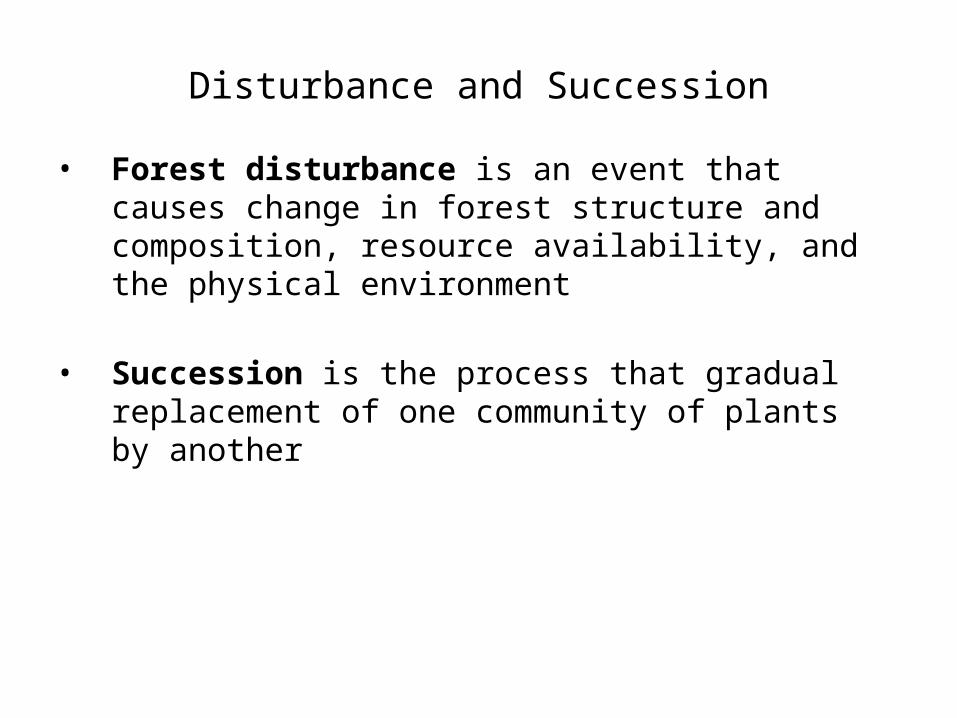
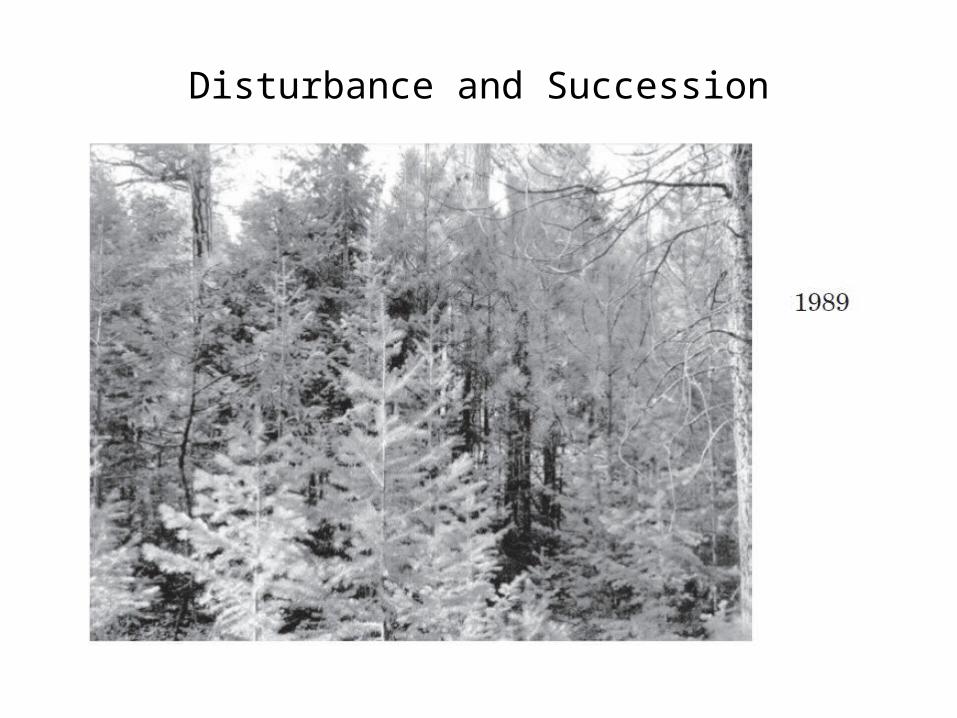
Disturbance and Succession
• Forest disturbance is an event that causes change in forest structure and composition, resource availability, and the physical environment
• Succession is the process that gradual replacement of one community of plants by another
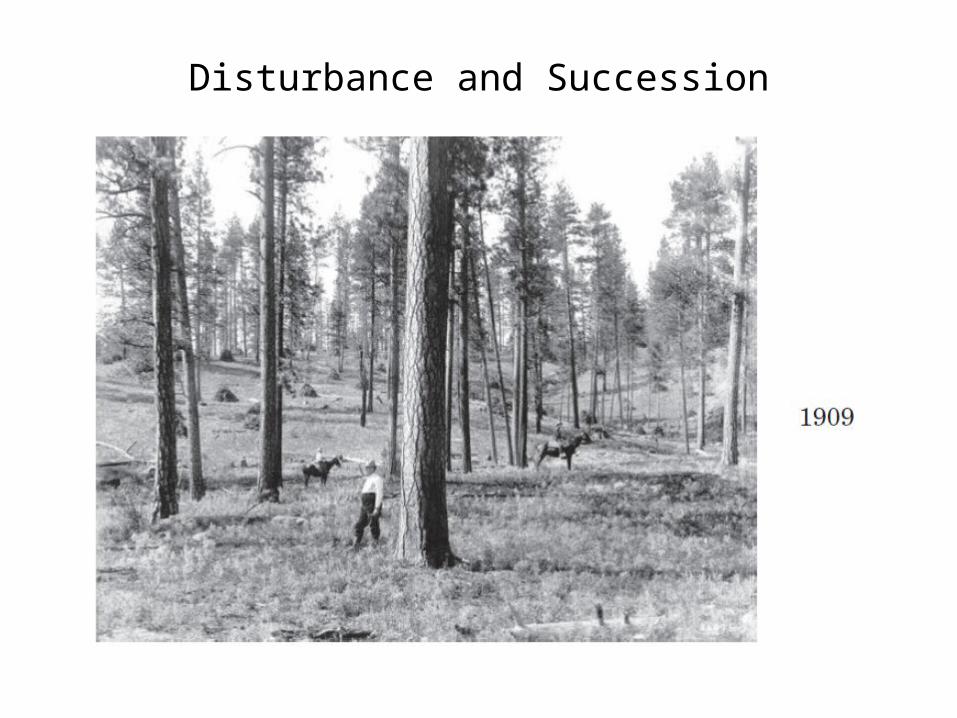
Disturbance and Succession

Disturbance and Succession
Disturbance and Succession
Range of Forest Disturbance
• Forest disturbances vary in type, frequency, spatial scale, and severity
• Disturbance types:
• A continuum of disturbance from individual tree-level to landscape scale
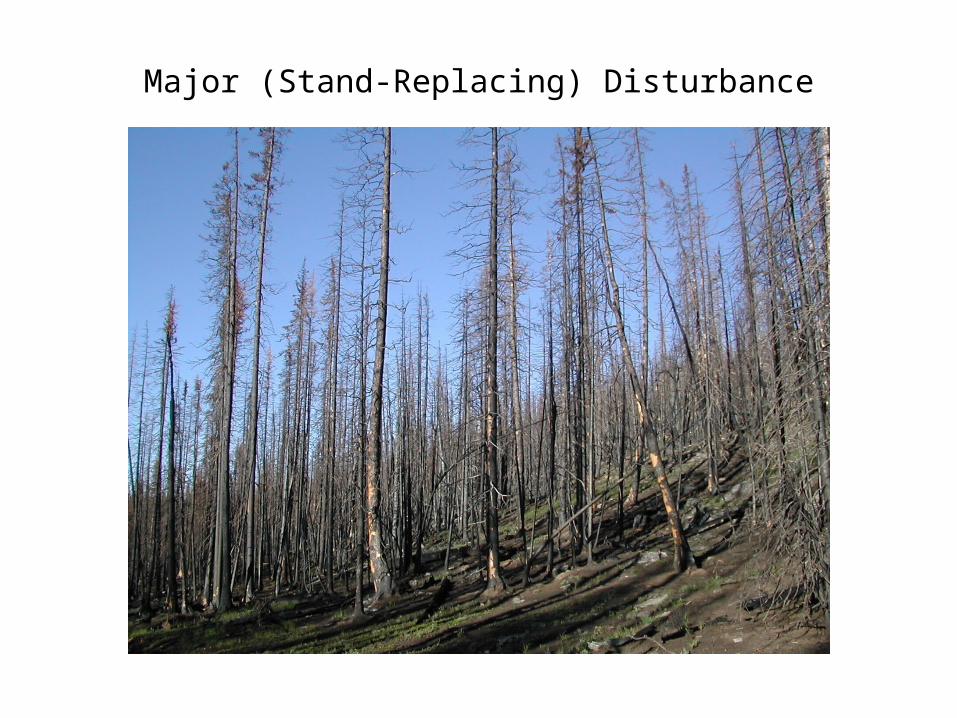
Major (Stand-Replacing) Disturbance
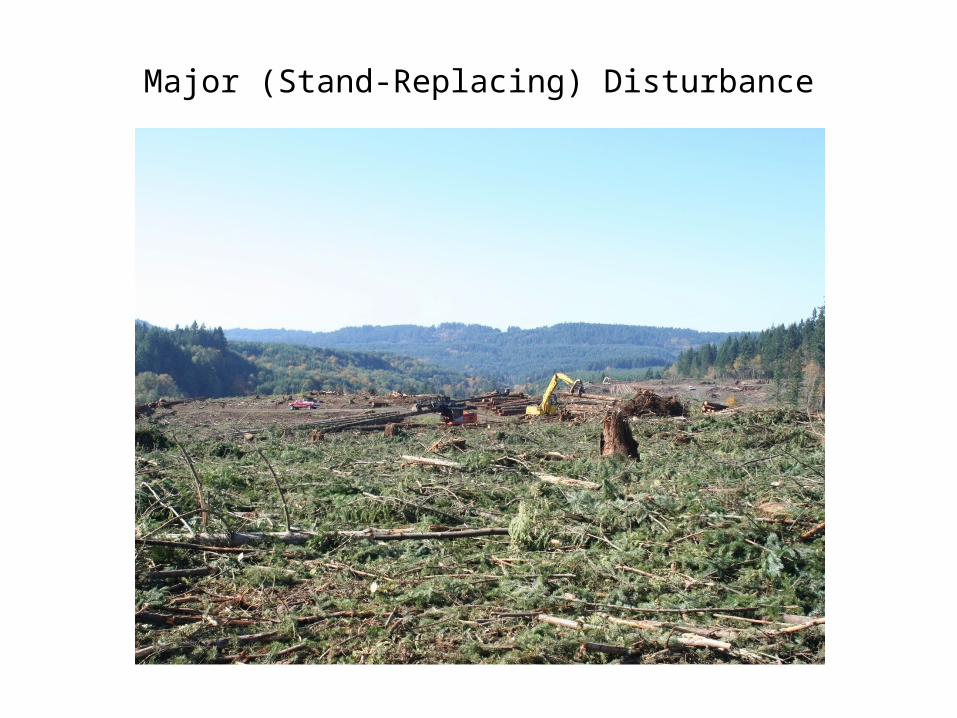
Major (Stand-Replacing) Disturbance
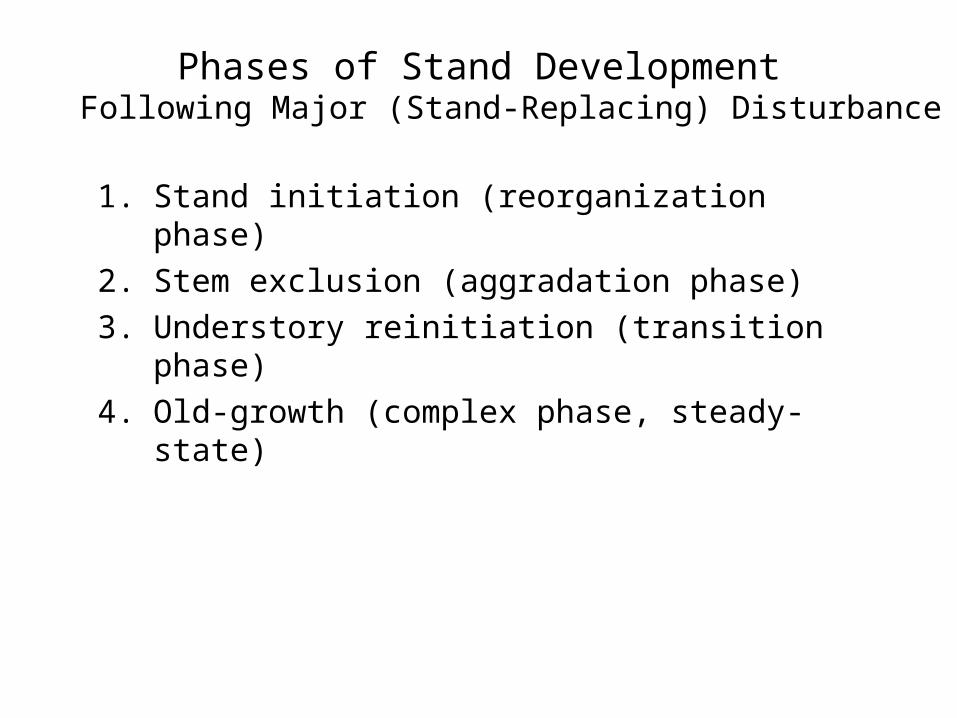
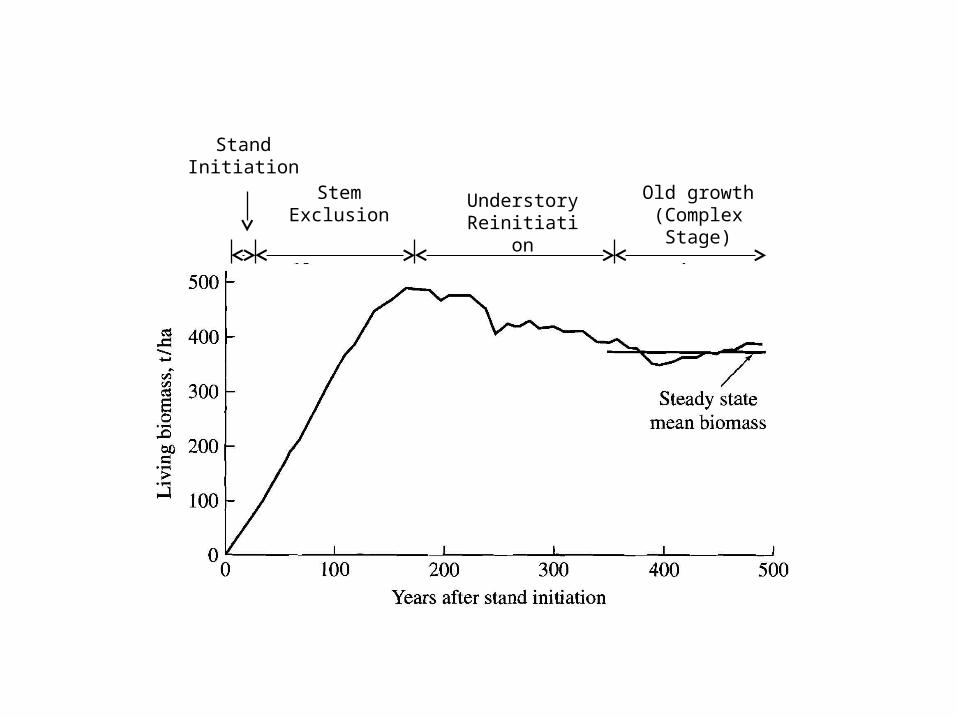
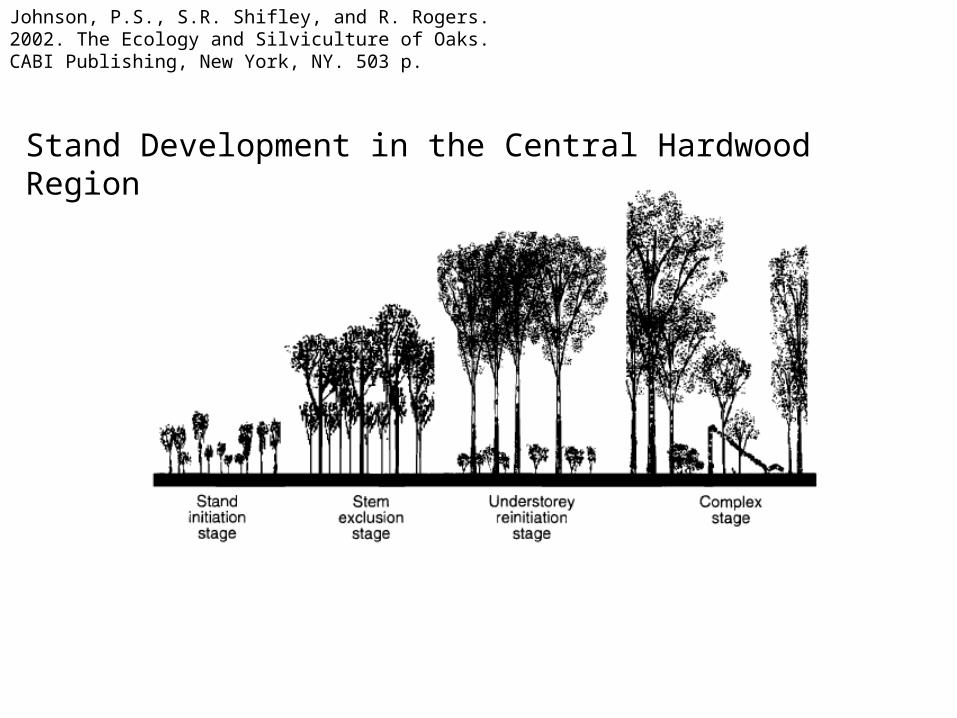
Phases of Stand DevelopmentFollowing Major (Stand-Replacing) Disturbance
1. Stand initiation (reorganization phase)
2. Stem exclusion (aggradation phase)
3. Understory reinitiation (transition phase)
4. Old-growth (complex phase, steady-state)
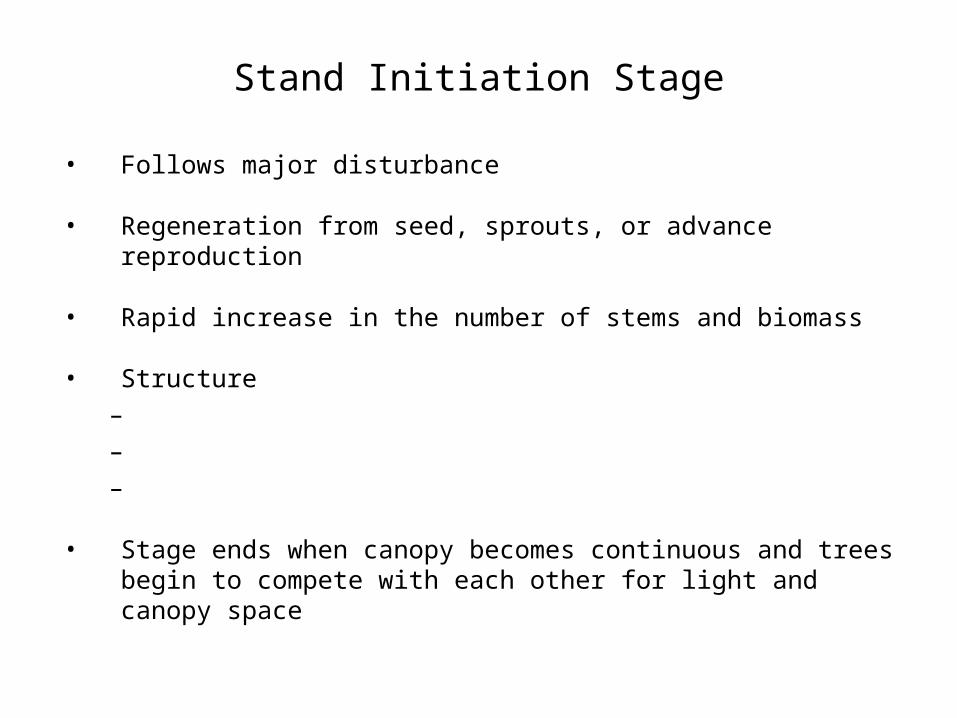
Stand Initiation Stage
• Follows major disturbance
• Regeneration from seed, sprouts, or advance reproduction
• Rapid increase in the number of stems and biomass
• Structure– – –
• Stage ends when canopy becomes continuous and trees begin to compete with each other for light and canopy space
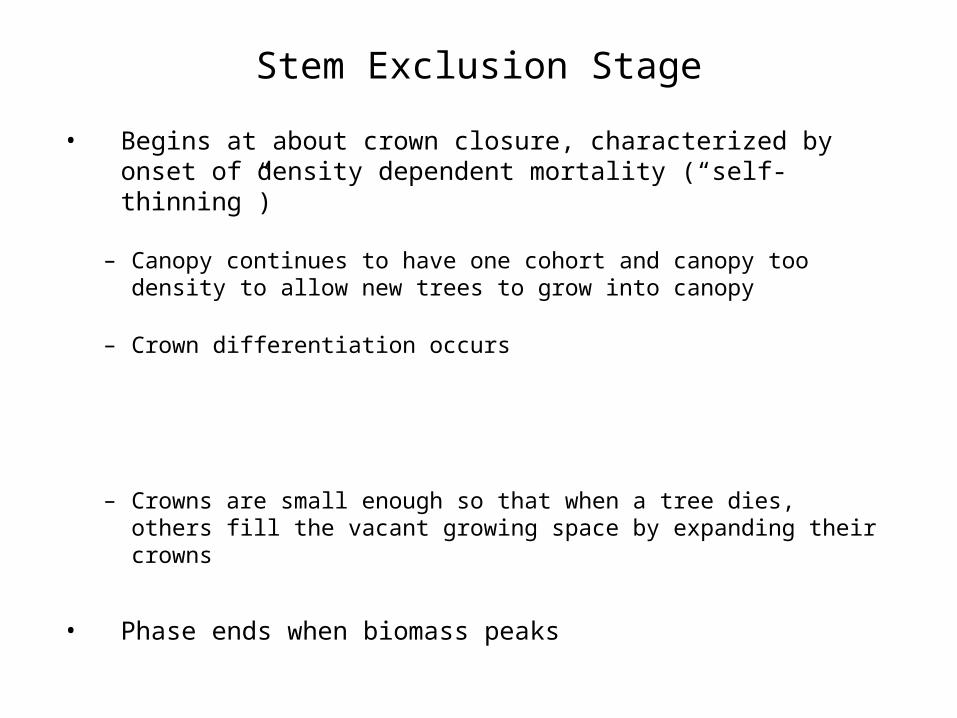
Stem Exclusion Stage
• Begins at about crown closure, characterized by onset of density dependent mortality (“self-thinning”)
– Canopy continues to have one cohort and canopy too density to allow new trees to grow into canopy
– Crown differentiation occurs
– Crowns are small enough so that when a tree dies, others fill the vacant growing space by expanding their crowns
• Phase ends when biomass peaks
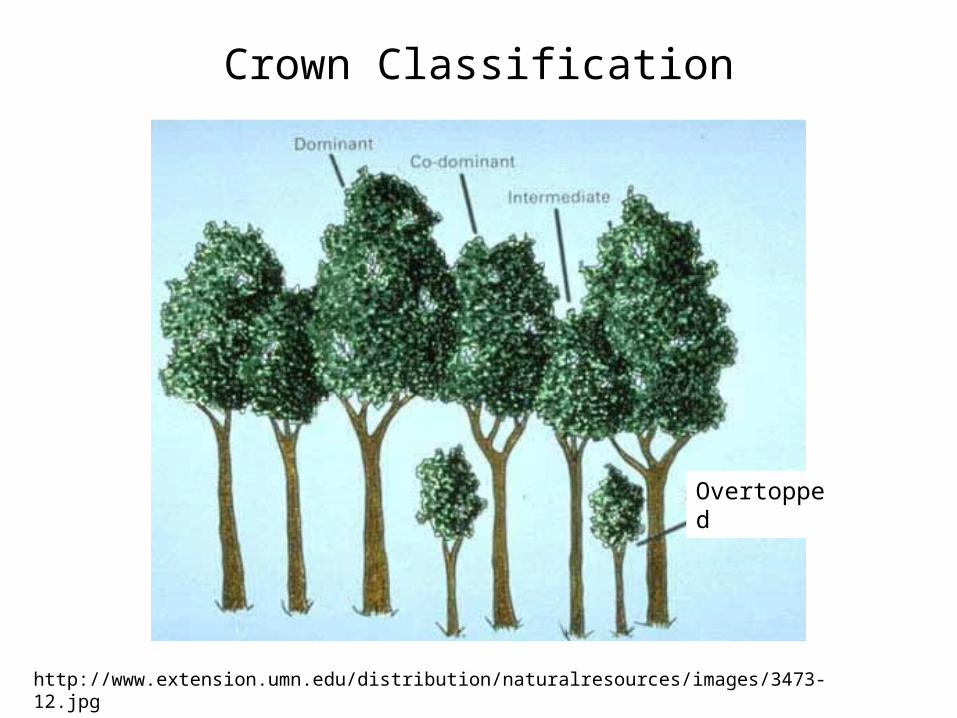
Crown Classification
http://www.extension.umn.edu/distribution/naturalresources/images/3473-12.jpg
Overtopped

Crown Classification
• Dominant: Crown is larger than average and typically above the general upper level of the canopy; receives full top light, considerable side light
• Codominant: Top of crown is at upper canopy height; receives full top light, little from sides; medium-sized crown, usually somewhat crowded on its sides. Often wide range around “average canopy” tree.
• Intermediate: Top of crown is below the top of the general canopy; receives some top light from directly above, none from the side; conspicuously narrower, smaller and shorter than the average crown.
• Overtopped: Crown entirely below some foliage of the upper canopy; receives no direct top light; small, weak crown with low vigor

Understory Reinitiation Stage
• Mortality of individuals cannot be closed by adjacent individuals
• Permanent canopy gaps form
• Permanent understory forms
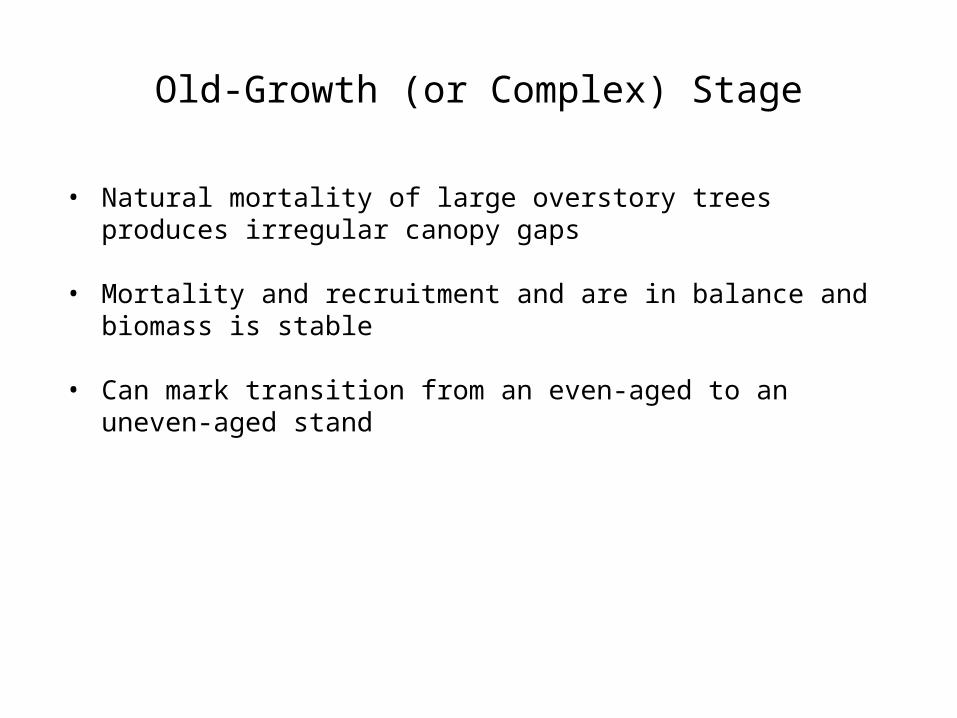
Old-Growth (or Complex) Stage
• Natural mortality of large overstory trees produces irregular canopy gaps
• Mortality and recruitment and are in balance and biomass is stable
• Can mark transition from an even-aged to an uneven-aged stand
StandInitiation
StemExclusion
UnderstoryReinitiation
Old growth(Complex Stage)
Johnson, P.S., S.R. Shifley, and R. Rogers. 2002. The Ecology and Silviculture of Oaks. CABI Publishing, New York, NY. 503 p.
Stand Development in the Central Hardwood Region

Tree Growth and the Environment
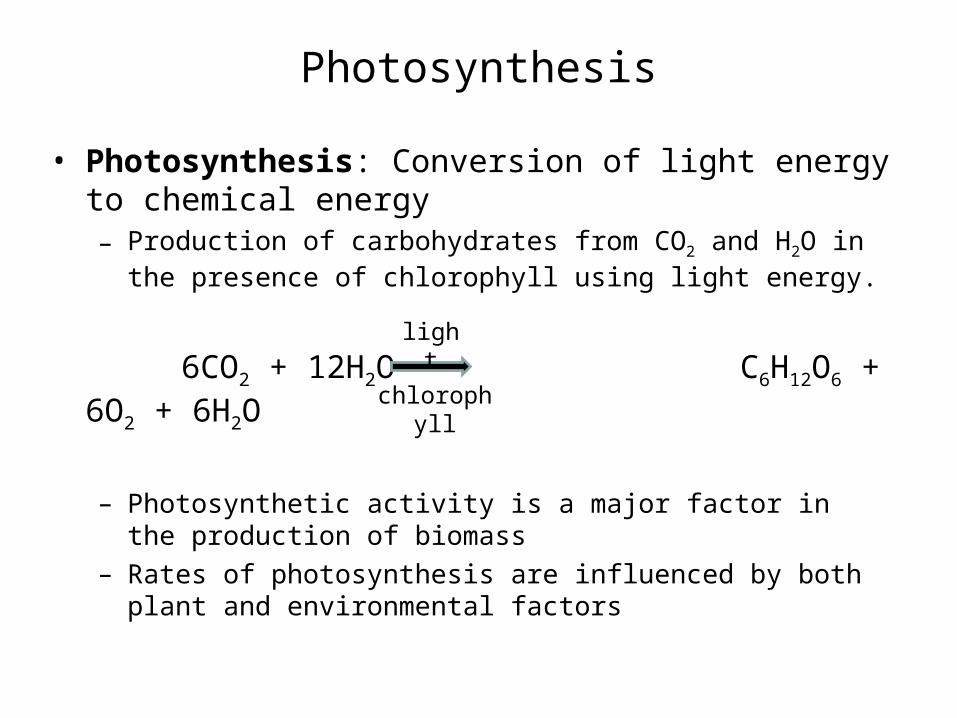
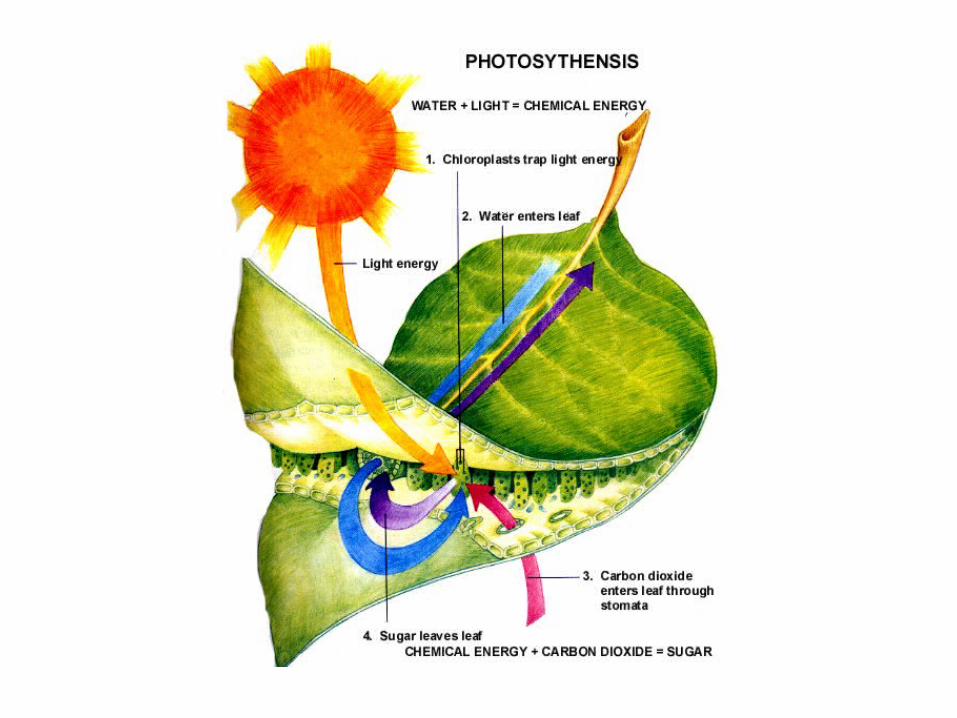
Photosynthesis
• Photosynthesis: Conversion of light energy to chemical energy– Production of carbohydrates from CO2 and H2O in the presence
of chlorophyll using light energy.
6CO2 + 12H2O C6H12O6 + 6O2 + 6H2O
– Photosynthetic activity is a major factor in the production of biomass
– Rates of photosynthesis are influenced by both plant and environmental factors
chlorophyll
light

Respiration
• Respiration is the process by which energy fixed by photosynthesis is made available for metabolic processes
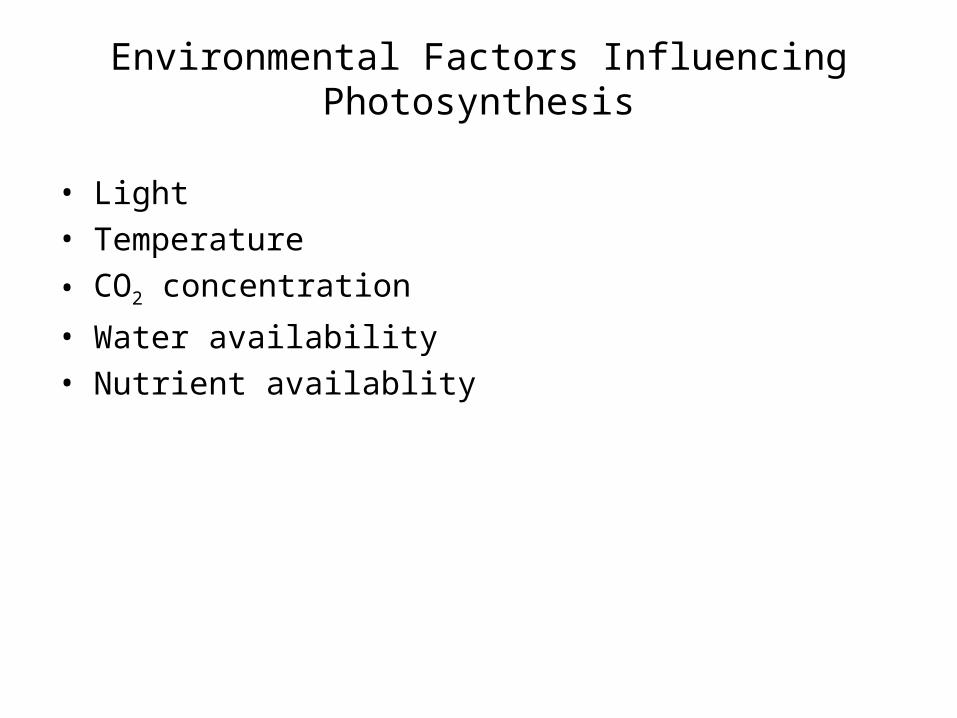
Environmental Factors Influencing Photosynthesis
• Light• Temperature
• CO2 concentration
• Water availability• Nutrient availablity
Environmental Factors Influencing Photosynthesis
• Light
Environmental Factors Influencing Photosynthesis
• Light– Light environment in a stand is influence by the vertical and
horizontal forest structure

Inverse Relationship between Canopy Openness and Light Availability
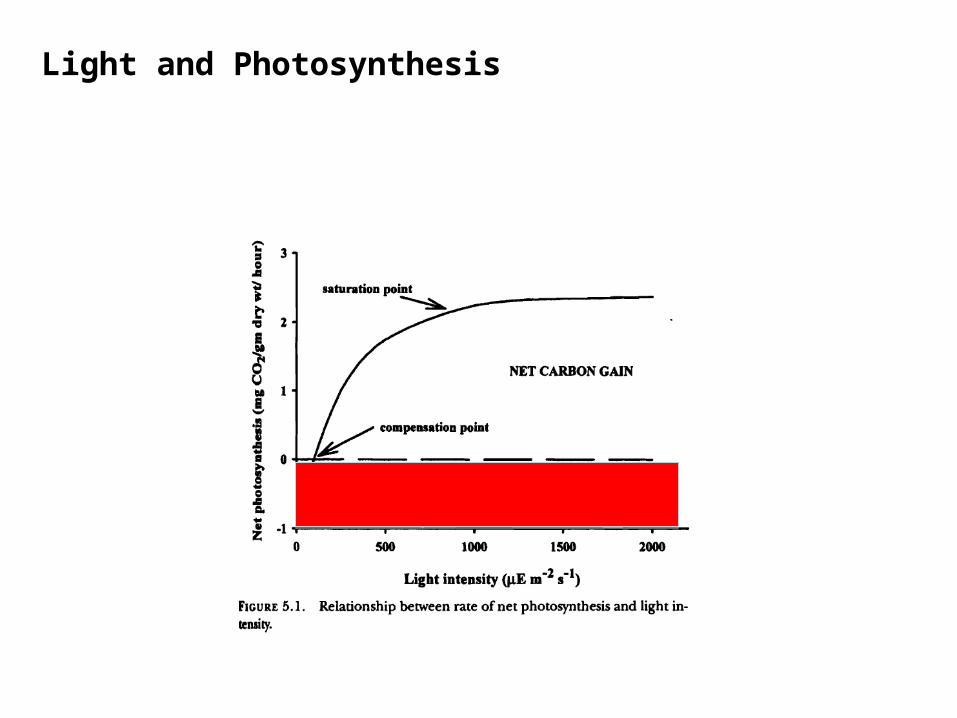
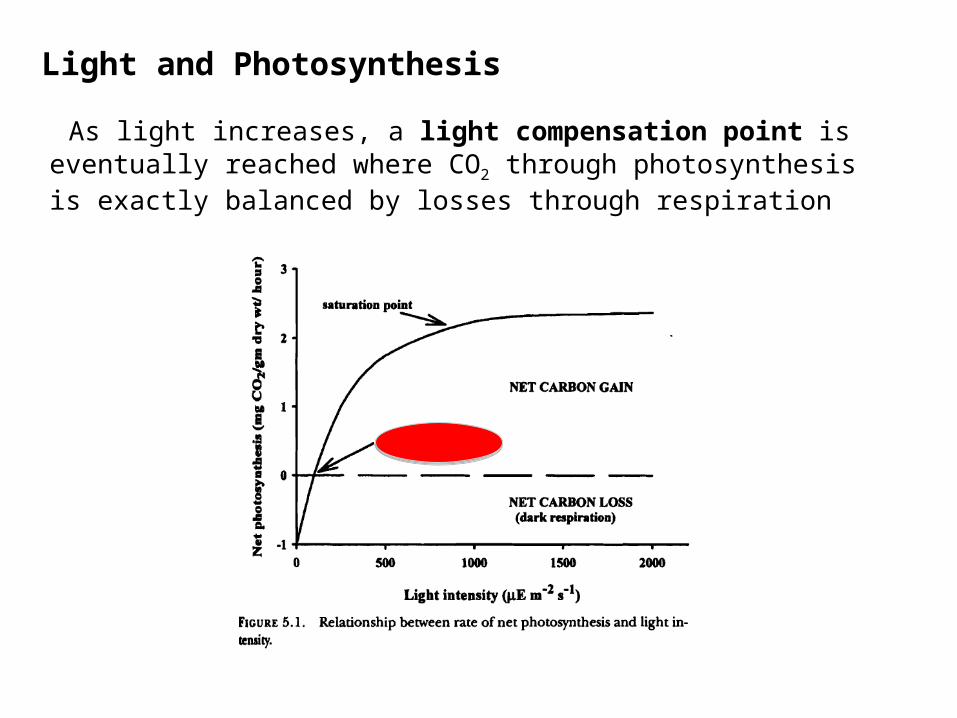
Light and Photosynthesis
Light and Photosynthesis
As light increases, a light compensation point is eventually reached where CO2 through photosynthesis is exactly balanced by losses through respiration

Above the light compensation point, photosynthesis increases until the amount of carboxylation enzyme or available CO2 limits photosynthesis.
• Plateau in the rate of photosynthesis is know as light saturation point

Light and Photosynthesis
• Light compensation points and light saturation levels vary:

Environmental Factors Influencing Photosynthesis
• Temperature– Temperature is a very important factor in photosynthesis but
unlikely to become a limiting factor in forests of temperate regions except during the winter
Environmental Factors Influencing Photosynthesis
• CO2 concentration–
– Concentrations in the forest are often higher but show vertical gradients which change diurnally and seasonally
– Stands whose structure permits continued circulation of air provide more favorable conditions from the standpoint of CO2 supply than those with a tight canopy or those which are multi-storied.
– CO2 enrichment (i.e. atmospheric rise due to fossil fuel burning) has been shown to increase growth rates
Environmental Factors Influencing Photosynthesis
• Water availability– Only minute quantities of water are consumed in the process of
photosynthesis
Environmental Factors Influencing Photosynthesis
• Water availability– Issues with moisture availability for photosynthesis and
hydration:
Environmental Factors Influencing Photosynthesis
• Water availability– Moisture availability is dictated by
• Soil properties
• Topography
Environmental Factors Influencing Photosynthesis
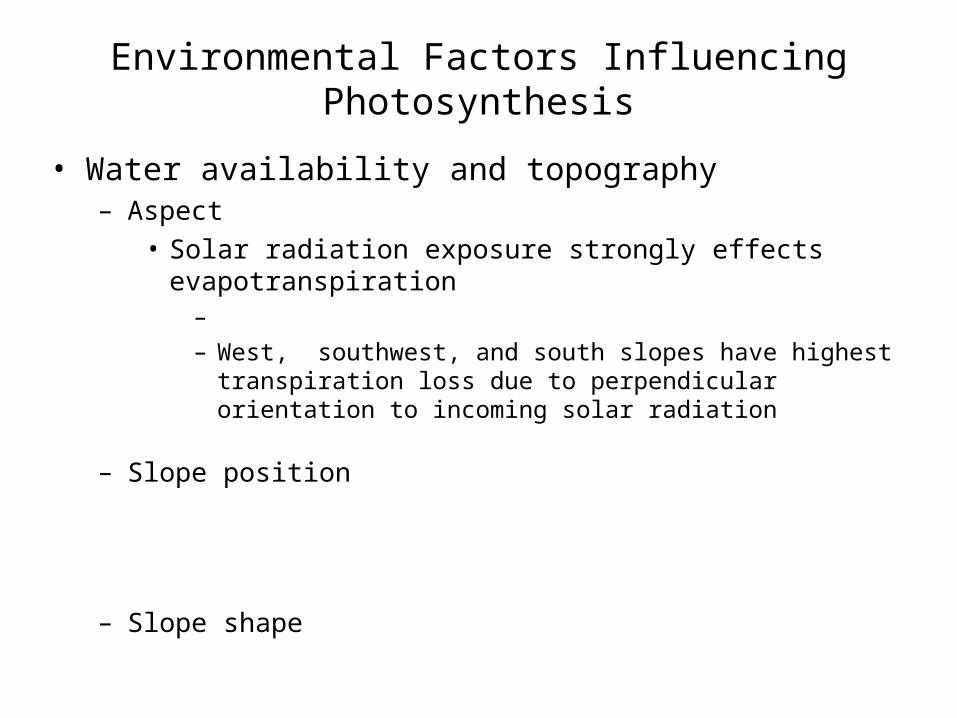
• Water availability and topography– Aspect
• Solar radiation exposure strongly effects evapotranspiration–
– West, southwest, and south slopes have highest transpiration loss due to perpendicular orientation to incoming solar radiation
– Slope position
– Slope shape
Environmental Factors Influencing Photosynthesis
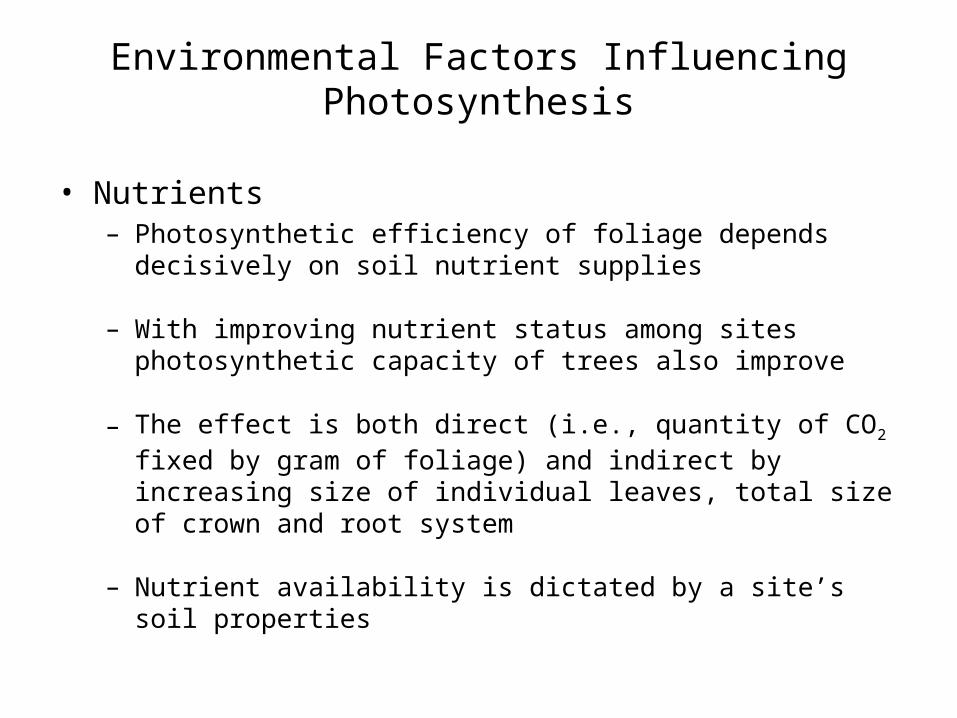
• Nutrients– Photosynthetic efficiency of foliage depends decisively on soil
nutrient supplies
– With improving nutrient status among sites photosynthetic capacity of trees also improve
– The effect is both direct (i.e., quantity of CO2 fixed by gram of foliage) and indirect by increasing size of individual leaves, total size of crown and root system
– Nutrient availability is dictated by a site’s soil properties
Plant Factors Influencing Photosynthesis
• Leaf age• Position within crown• Crown class and species• Sun and shade adaptations
Plant Factors Influencing Photosynthesis
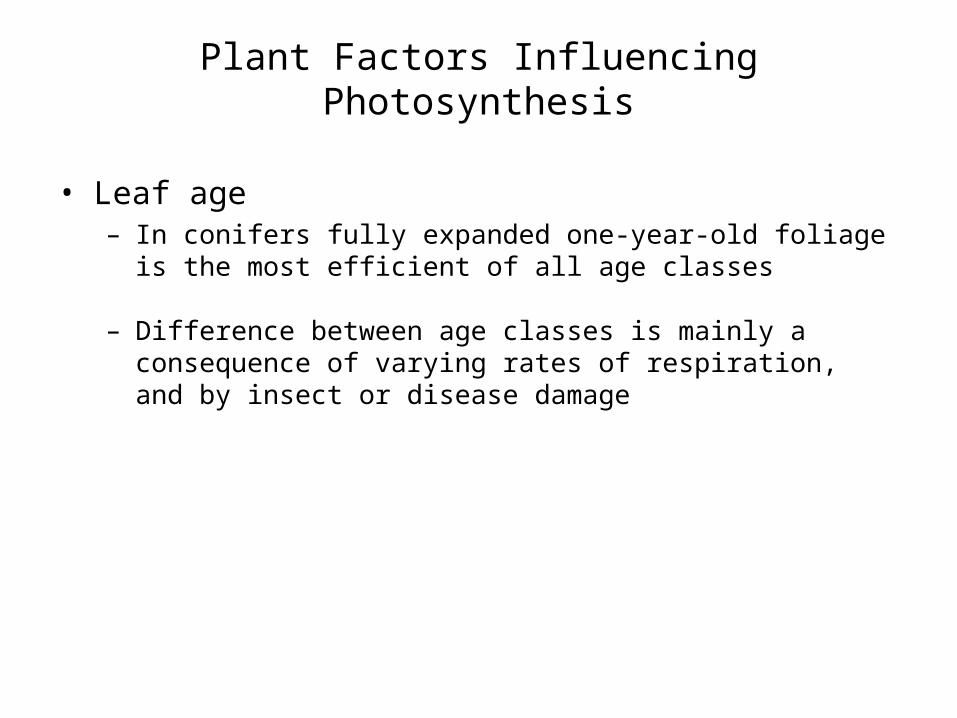
• Leaf age– In conifers fully expanded one-year-old foliage is the most
efficient of all age classes
– Difference between age classes is mainly a consequence of varying rates of respiration, and by insect or disease damage
Plant Factors Influencing Photosynthesis
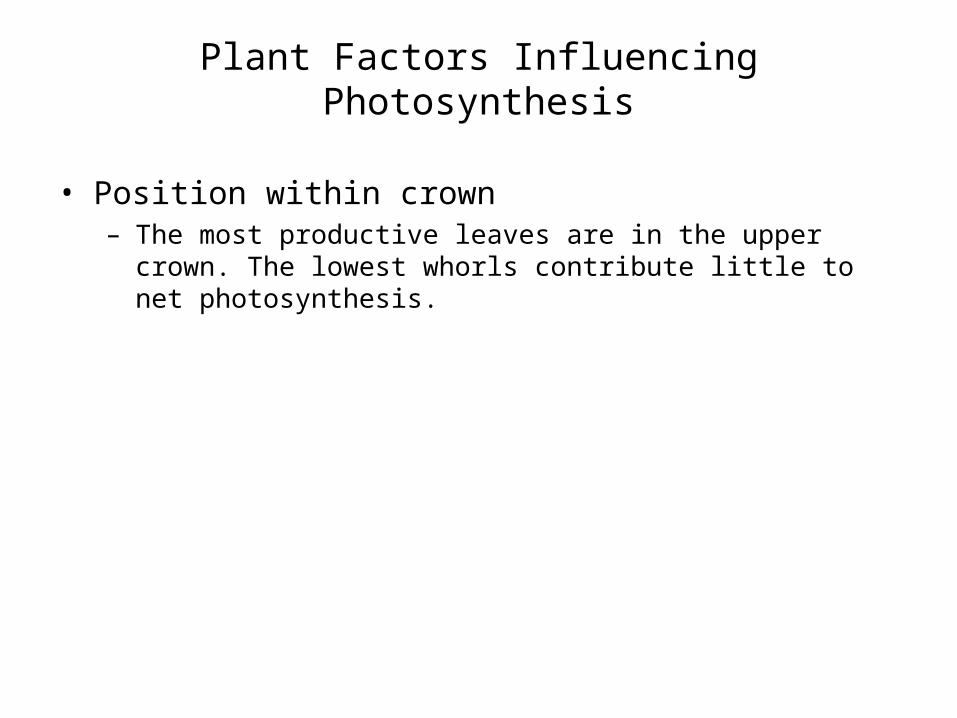
• Position within crown– The most productive leaves are in the upper crown. The lowest
whorls contribute little to net photosynthesis.
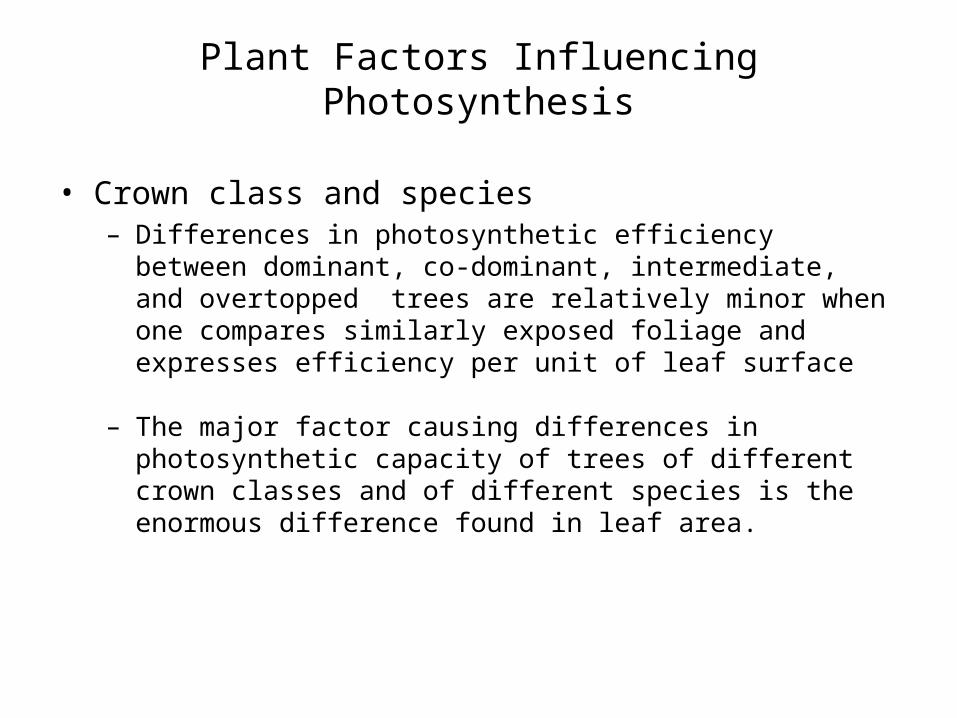
Plant Factors Influencing Photosynthesis
• Crown class and species– Differences in photosynthetic efficiency between dominant, co-
dominant, intermediate, and overtopped trees are relatively minor when one compares similarly exposed foliage and expresses efficiency per unit of leaf surface
– The major factor causing differences in photosynthetic capacity of trees of different crown classes and of different species is the enormous difference found in leaf area.
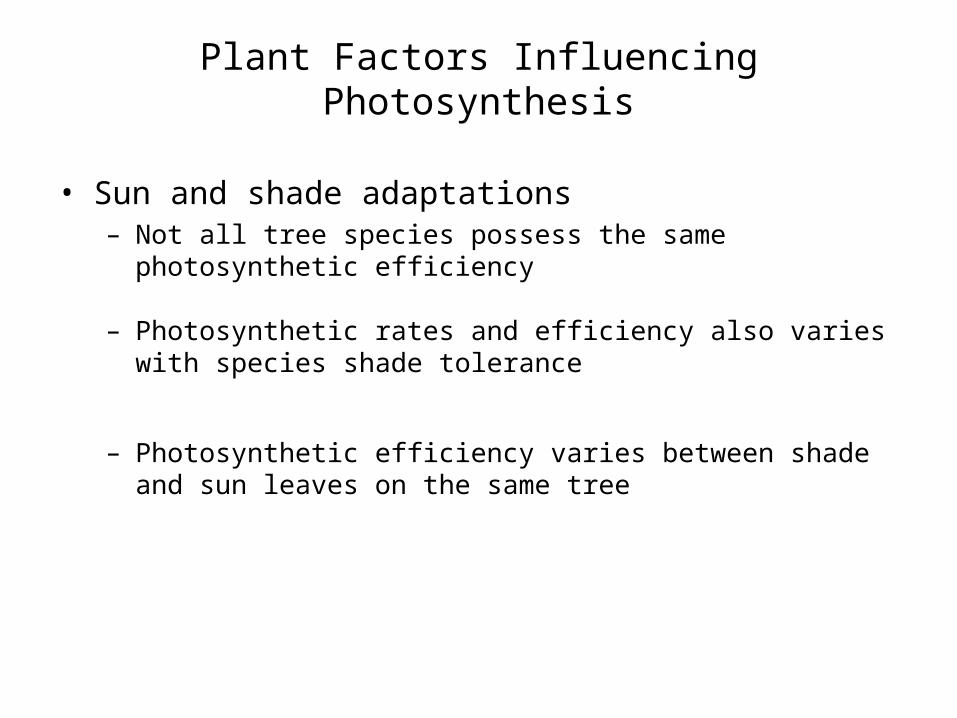
Plant Factors Influencing Photosynthesis
• Sun and shade adaptations– Not all tree species possess the same photosynthetic efficiency
– Photosynthetic rates and efficiency also varies with species shade tolerance
– Photosynthetic efficiency varies between shade and sun leaves on the same tree

The Carbon Budget of Trees
Carbon budget of a tree (or any plant) can be expressed like a bank balance:
Income = carbohydrates manufactured in photosynthesis
Expenditures = carbohydrates used in growth and maintenance (construction and maintenance respiration)
Balance = carbohydrates stored
(so-called nonstructural carbohydrates and other compounds)
Individual Tree Growth
• Amount of carbohydrates produced through photosynthesis by a given tree is influence by:
• Extent to which a tree increases mechanical support (i.e., stem diameter) depends upon:

Shade Tolerance
• Shade tolerance – Definition: Having the capacity to compete for survival under
shaded conditions
• Understanding of shade tolerance is a cornerstone of silviculture
• Critical to silviculture in the following ways:

Shade Tolerance and Photosynthesis
• Shade tolerant species– Species adapted to growing at reduced light intensities– Generally have lower compensation points and levels of light
saturation than shade intolerant species
• Shade intolerant species saturate at relatively high light levels– Yield increased carbon gain in high light environments
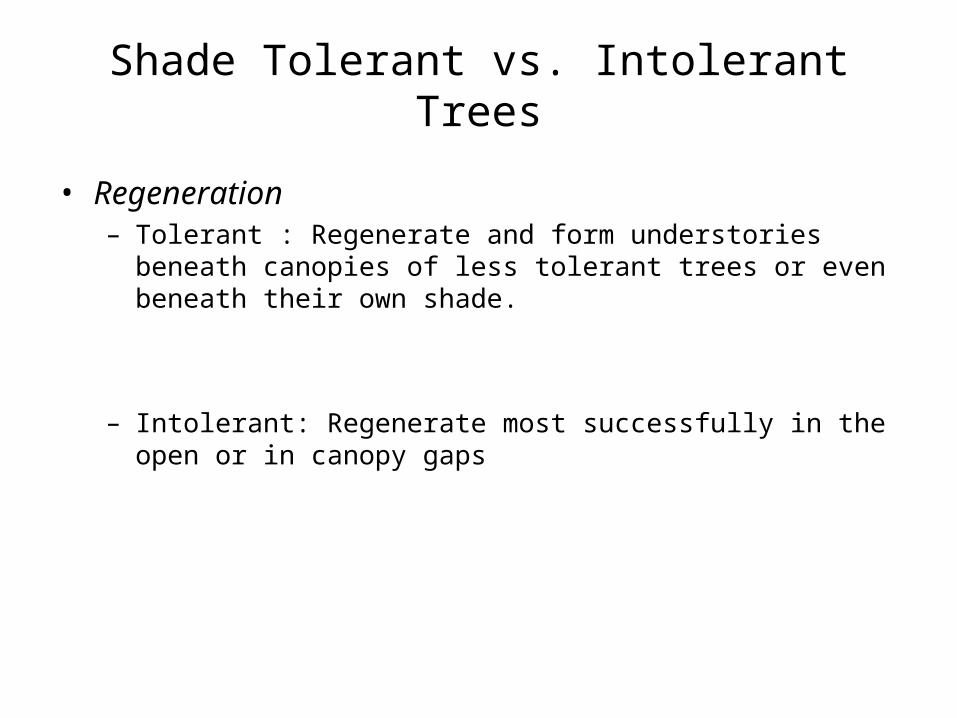
Shade Tolerant vs. Intolerant Trees
• Regeneration – Tolerant : Regenerate and form understories beneath canopies
of less tolerant trees or even beneath their own shade.
– Intolerant: Regenerate most successfully in the open or in canopy gaps
Shade Tolerant vs. Intolerant Trees
• Ability to Persist in the Understory – Tolerant: Able to establish and persist in shaded understory
– Intolerant: Sometimes establish in shaded understory, but they cannot survive for extended periods without increased understory light availability
Remember: All this is relative! It is a manner of degree

Shade Tolerant vs. Intolerant Trees
• Response to Release – Tolerant trees: When released by canopy opening, they respond
rapidly and maintain good growth
– Intolerant trees: • Normally die (or are significantly suppressed) following long-
periods in dense shade • If they are released after a long-period in dense shade, they
respond with sluggish growth
Shade Tolerant vs. Intolerant Trees
• Crown Characteristics – Tolerant trees: Have heavy crowns of several leaf layers, the
innermost remaining functional in very low levels of light
– Intolerant trees: Have thin, open crowns of well-lighted leaves.
Shade Tolerant vs. Intolerant Trees
• Natural Pruning – Tolerant trees: clean their boles of side branches relatively
slowly because the leaves remain alive in low light
– Intolerant trees: Clean their trunks rapidly, "self-pruning", even if grown in the open

Shade Tolerant vs. Intolerant Trees
• Bole Form– Tolerant trees: Because of differences in the degree of natural
pruning, tolerant trees have more cone-shaped boles
– Intolerant trees: Tend to have cylindrical-shaped boles
Shade Tolerant vs. Intolerant Trees
• Seed Production – Tolerant trees: Reach seed bearing age late and may produce
periodic seed crops
– Intolerant trees: Produce seed early in live and produce large, regular seed crops
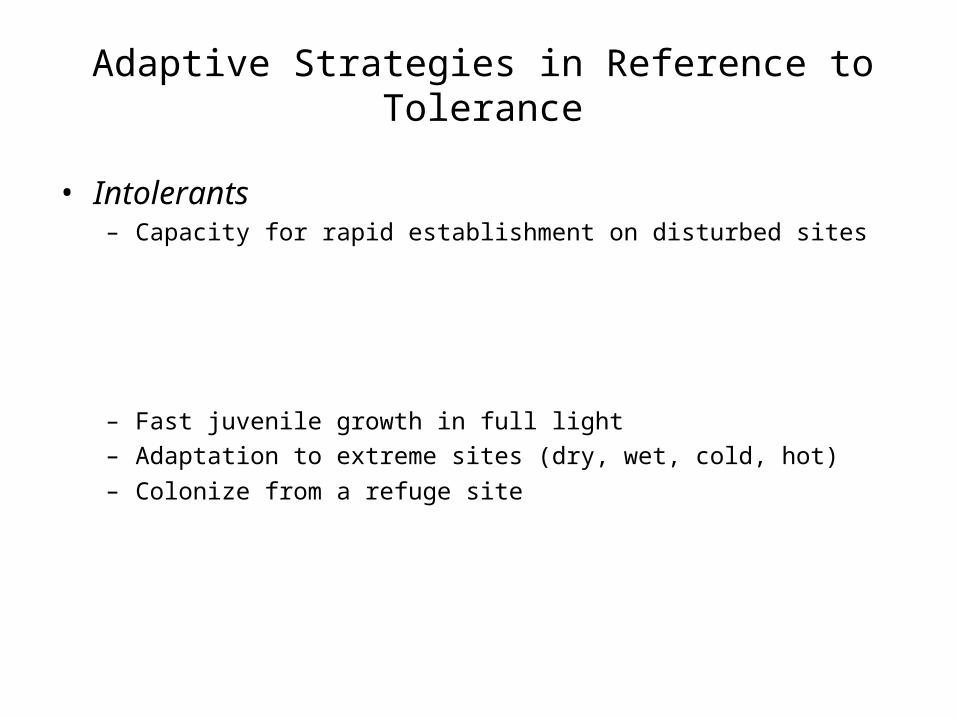
Adaptive Strategies in Reference to Tolerance
• Intolerants – Capacity for rapid establishment on disturbed sites
– Fast juvenile growth in full light
– Adaptation to extreme sites (dry, wet, cold, hot)
– Colonize from a refuge site

Adaptive Strategies in Reference to Tolerance
• Tolerant species – Typically adapted to sheltered, moist, fertile sites
– Gradually replace intolerants in the absence of disturbance
A special case: gap-phase species

Silvics in Central Hardwood Forest Region
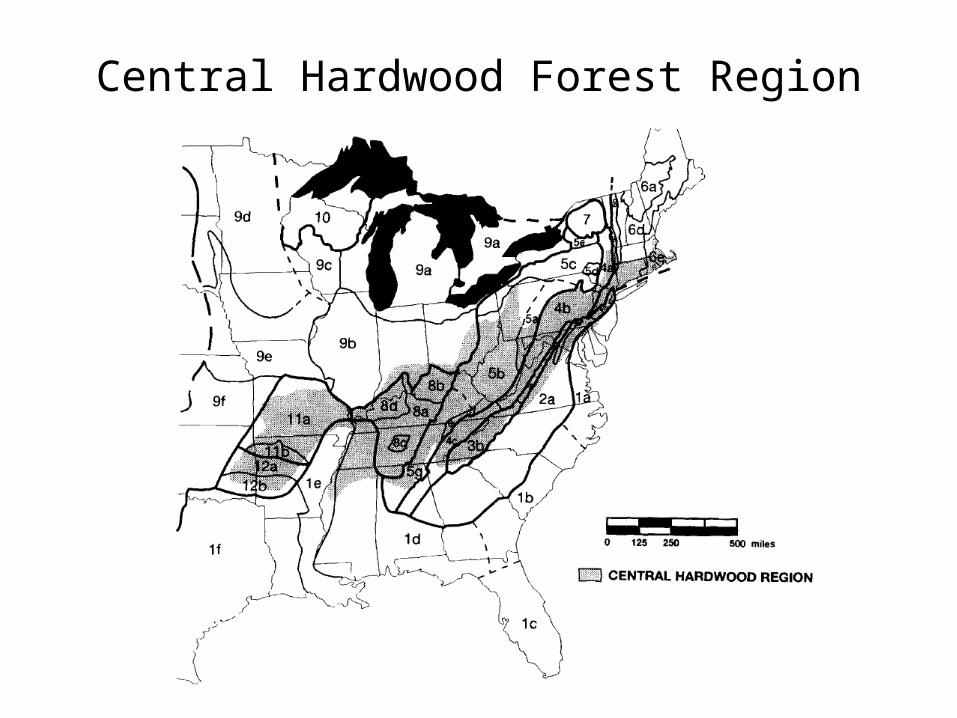
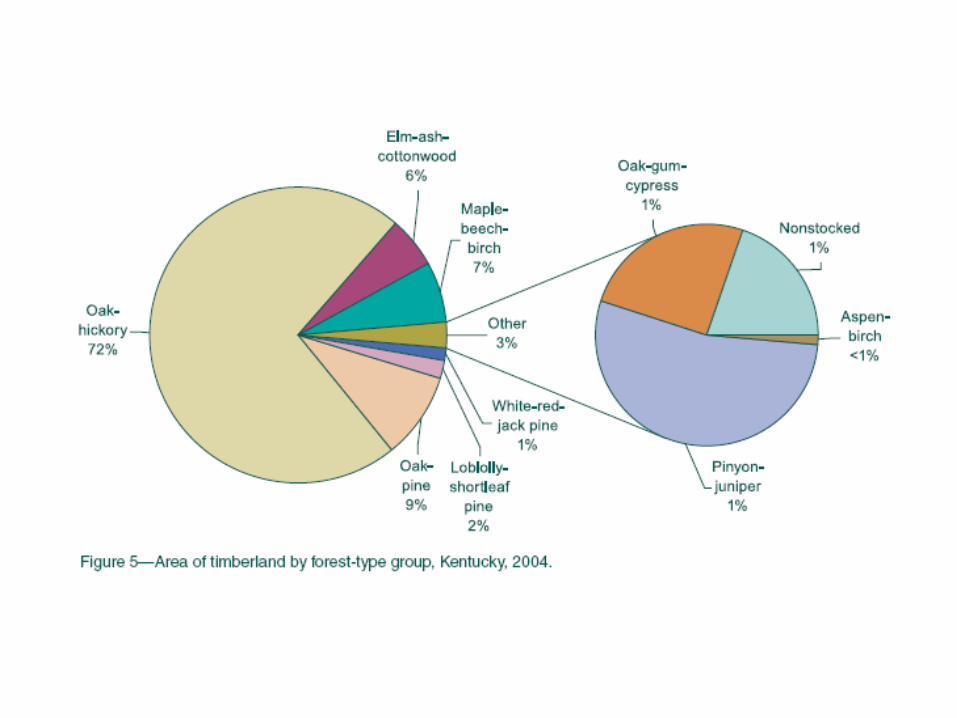
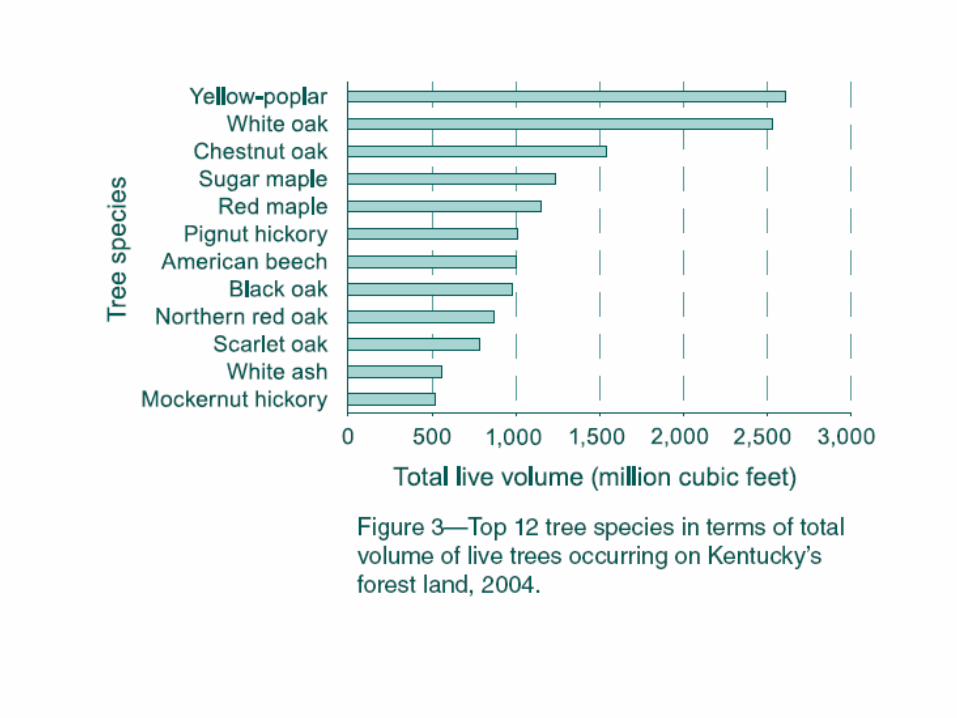
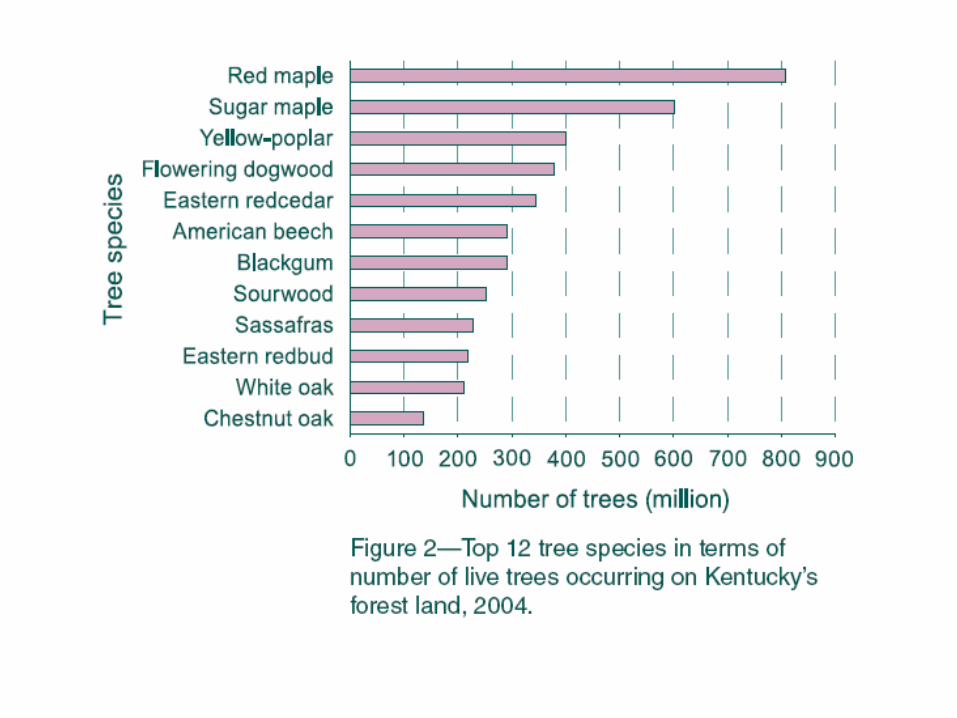
Central Hardwood Forest Region
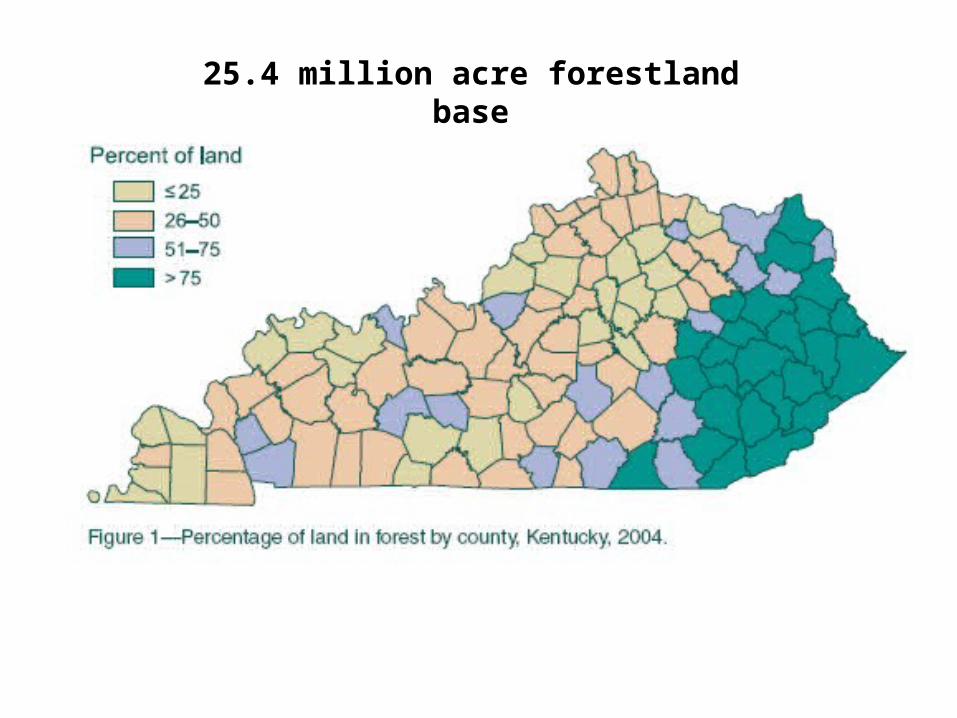
25.4 million acre forestland base
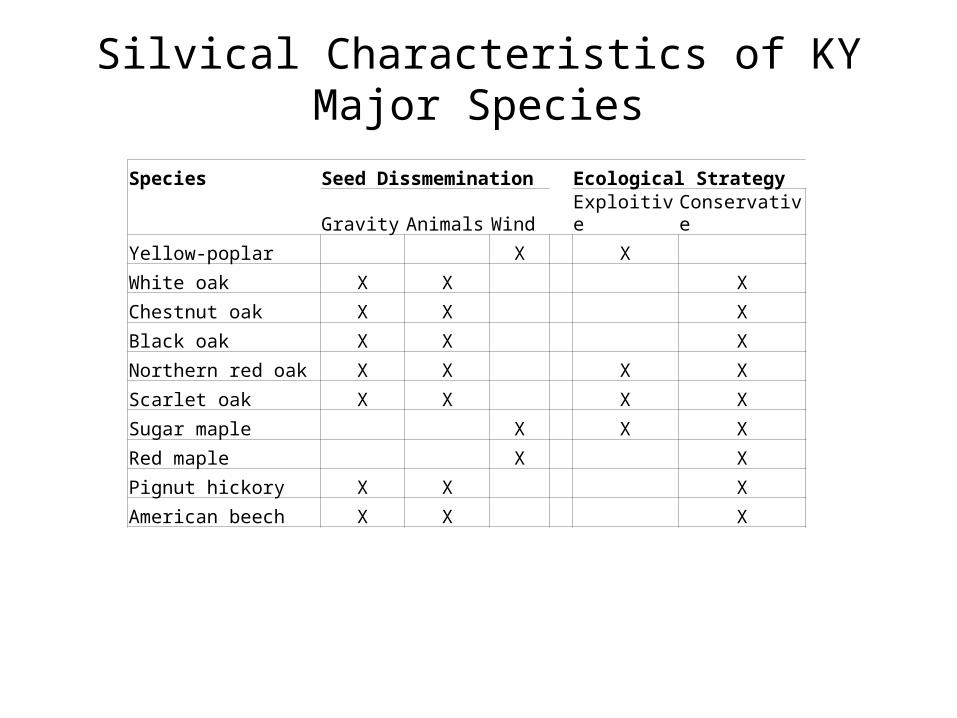
Silvical Characteristics of KY Major Species
Species Seed Dissmemination Ecological Strategy
Gravity Animals Wind Exploitive Conservative
Yellow-poplar X X
White oak X X X
Chestnut oak X X X
Black oak X X X
Northern red oak X X X X
Scarlet oak X X X X
Sugar maple X X X
Red maple X X
Pignut hickory X X X
American beech X X X

Silvical Characteristics of KY Major Species
Species Shade Tolerance Growth Rate Longevity Intolerant Intermediate Tolerant Slow Medium Fast < 100 100-200 >200Yellow-poplar X X XWhite oak X X XChestnut oak X X XBlack oak X X XNorthern red oak X X XScarlet oak X X X Sugar maple X X XRed maple X X XPignut hickory X X XAmerican beech X X X
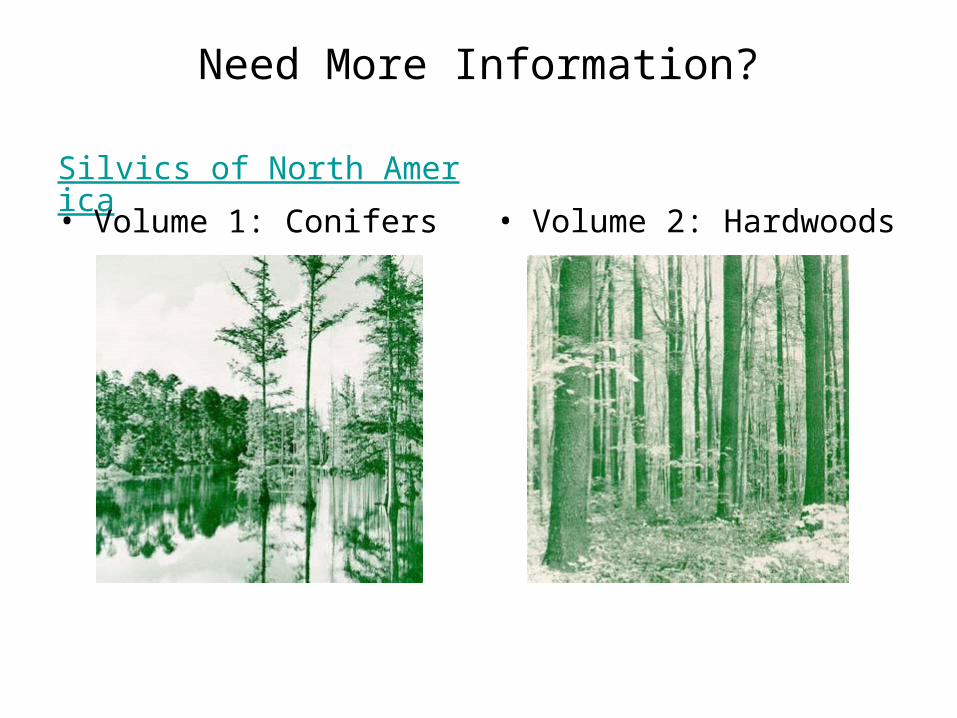
Need More Information?
Silvics of North America
• Volume 1: Conifers • Volume 2: Hardwoods
Growth and Yield of Stands
The Stand
• The basic unit for silvicultural practice
• Stands are usually classified by age, composition, and structure

Site
• Site is the sum of the effective environmental conditions under which a forest lives
• Site factors can be grouped as:
• Site quality is the capacity of a site for production– Two categories of site indicators are used
• Direct measurement of environment• Correlates such as Site Index
Site
• Site Index (SI): A measure of actual or potential forest productivity expressed in terms of the average height of dominants and co-dominants in the stand at an index age (base age) for a particular species.
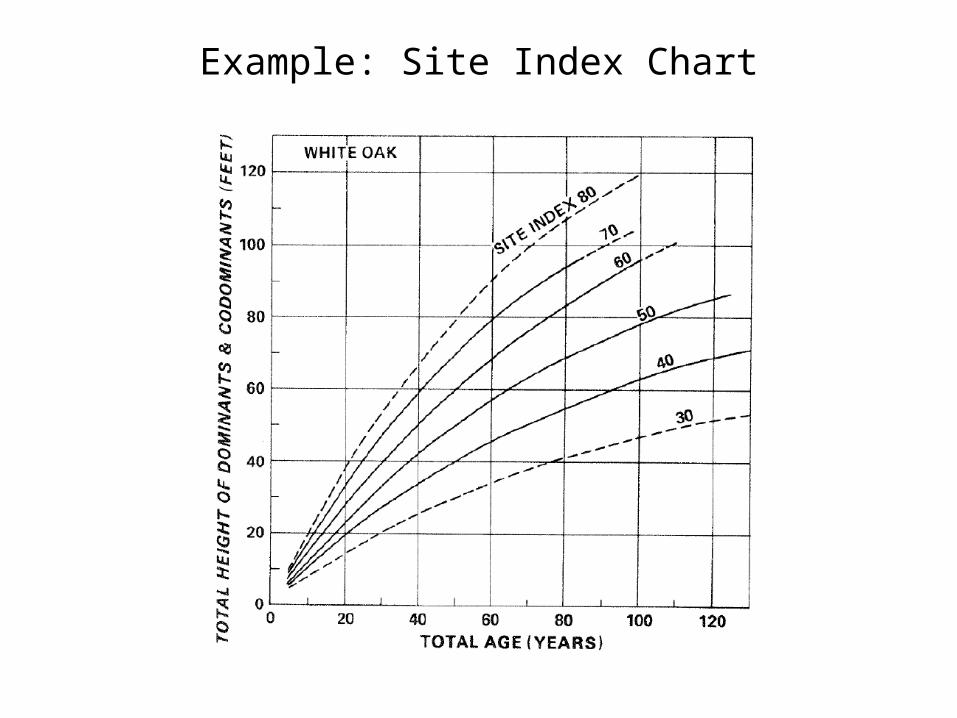
Example: Site Index Chart

Growth
• Growth is increase in size of an individual or a stand
• Growth is usually expressed as a change in size per unit time and area
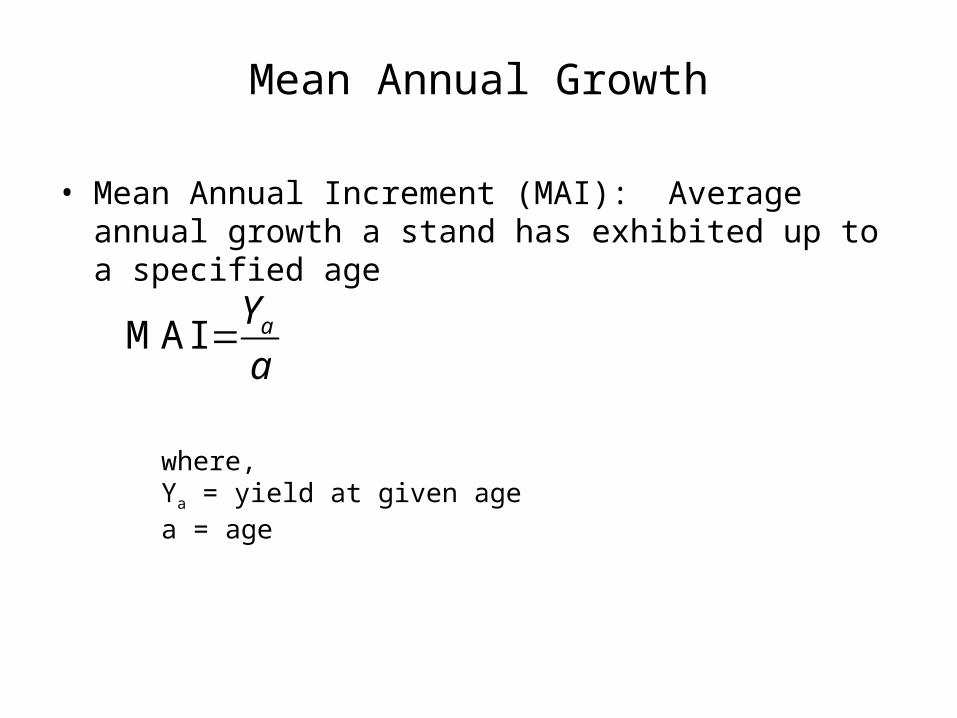
Mean Annual Growth
• Mean Annual Increment (MAI): Average annual growth a stand has exhibited up to a specified age
MAI aY
a
where,Ya = yield at given agea = age

Periodic Growth
• Periodic Annual Increment (PAI): Average annual growth a stand exhibited during a specific time period
where,
Y is the yield at times 1 and 2
T1 represents the year starting the growth period, and
T2 is the end year
2 1
2 1
PAIY Y
T T

Relationship between PAI and MAI
Net Yield
Yield
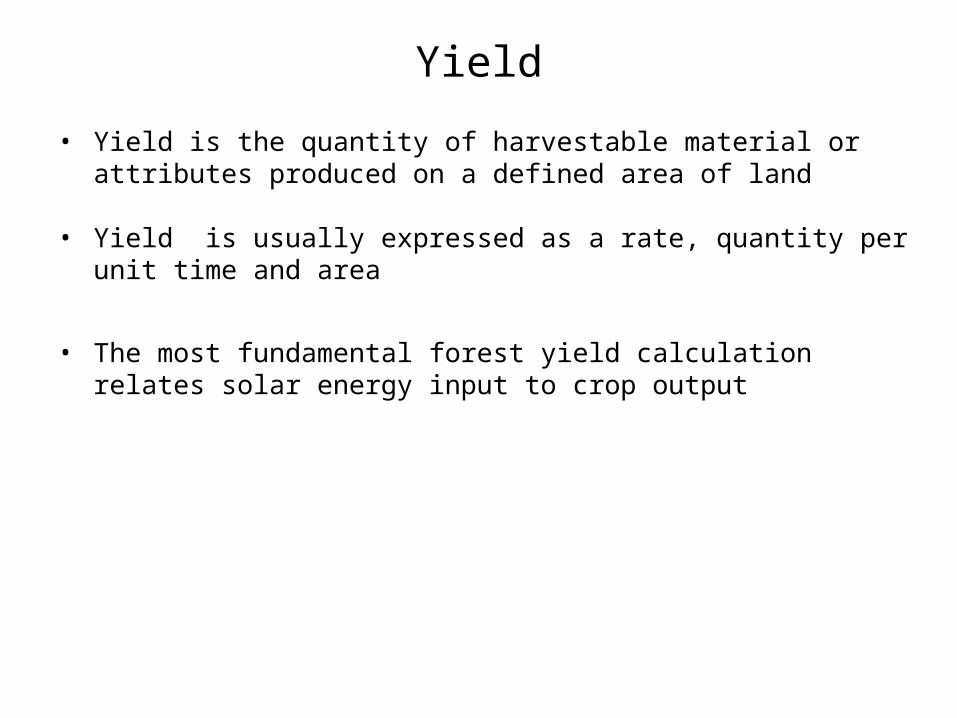
• Yield is the quantity of harvestable material or attributes produced on a defined area of land
• Yield is usually expressed as a rate, quantity per unit time and area
• The most fundamental forest yield calculation relates solar energy input to crop output
Gross versus Net Yield
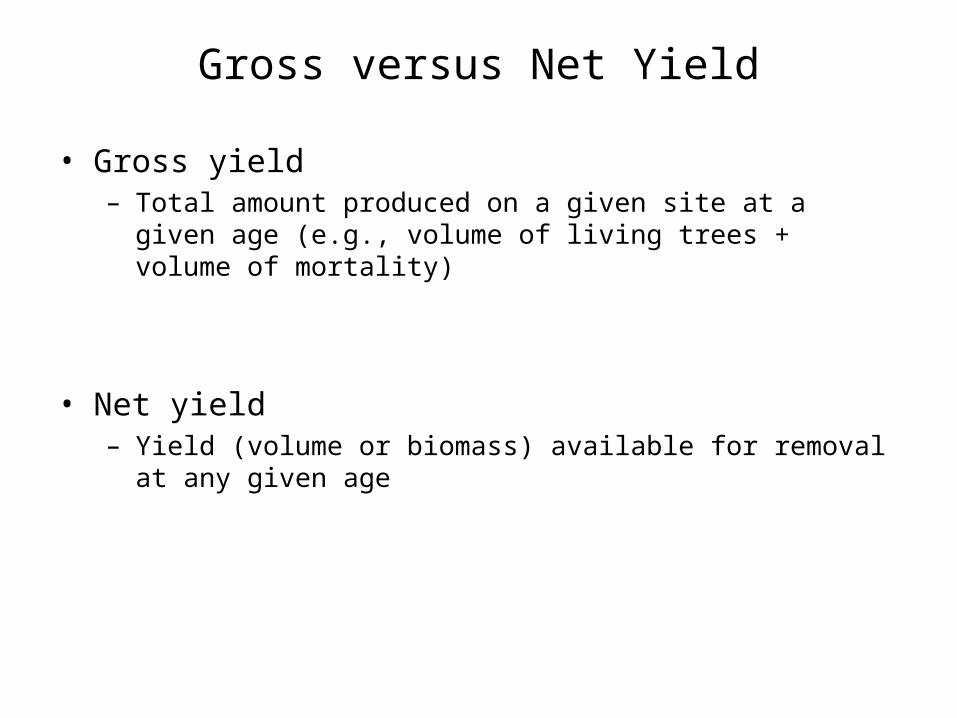
• Gross yield – Total amount produced on a given site at a given age (e.g.,
volume of living trees + volume of mortality)
• Net yield– Yield (volume or biomass) available for removal at any given age

Growth Patterns of Even-Aged Stands
• Tree Density
Schnur, G.L. 1937. Yield, stand, and volume tables for even-aged upland oak forests. US Department of Agriculture, Technical Bulletin No. 560. 87 p.
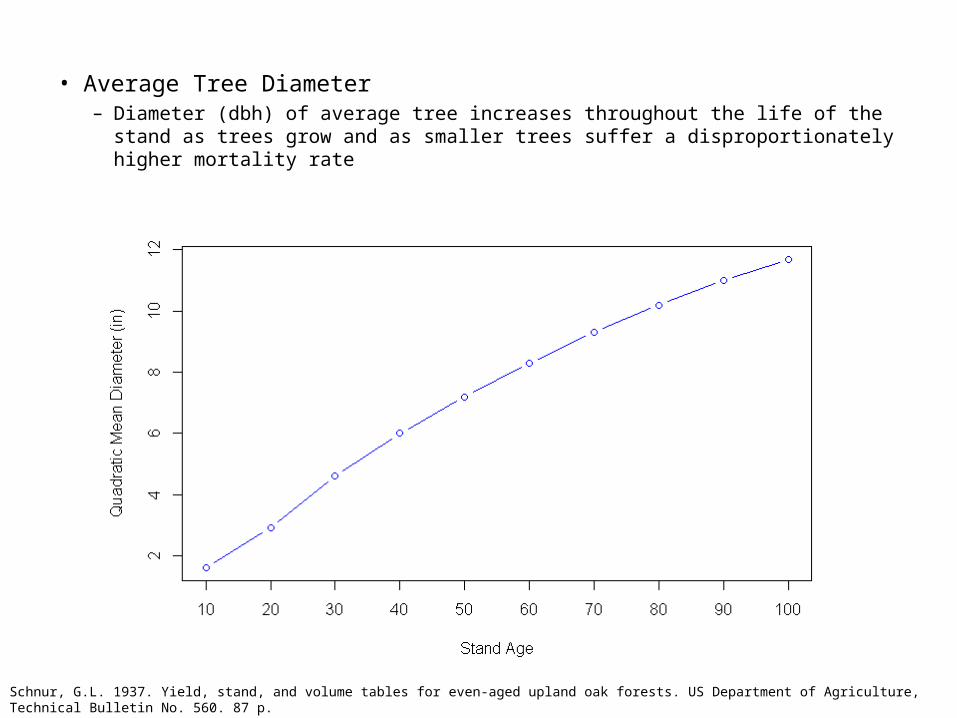
• Average Tree Diameter– Diameter (dbh) of average tree increases throughout the life of the stand as trees
grow and as smaller trees suffer a disproportionately higher mortality rate
Schnur, G.L. 1937. Yield, stand, and volume tables for even-aged upland oak forests. US Department of Agriculture, Technical Bulletin No. 560. 87 p.

• Basal Area– Basal area increase throughout the life of a stand.
Schnur, G.L. 1937. Yield, stand, and volume tables for even-aged upland oak forests. US Department of Agriculture, Technical Bulletin No. 560. 87 p.
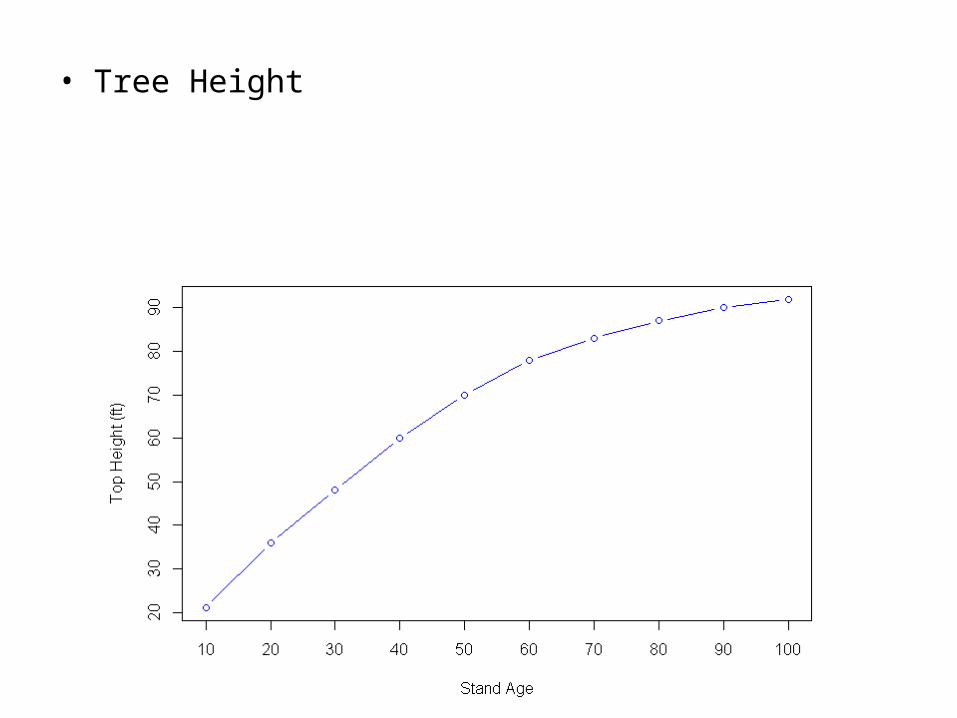
• Tree Height

Influence of Site Quality
– Average height growth of canopy trees is primarily dependent on site quality except at extremely low or high densities
Site Quality and Stand Growth
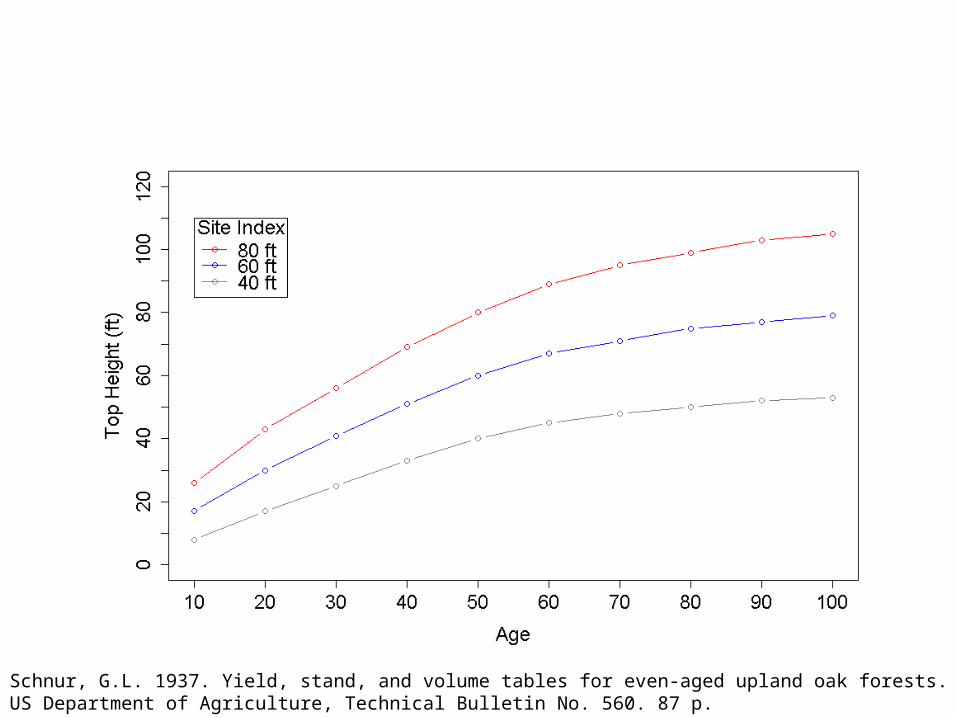
Schnur, G.L. 1937. Yield, stand, and volume tables for even-aged upland oak forests. US Department of Agriculture, Technical Bulletin No. 560. 87 p.

*Assuming stands have similar species composition, disturbance histories, and initial stand conditions.
*Assuming stands have similar species composition, disturbance histories, and initial stand conditions.
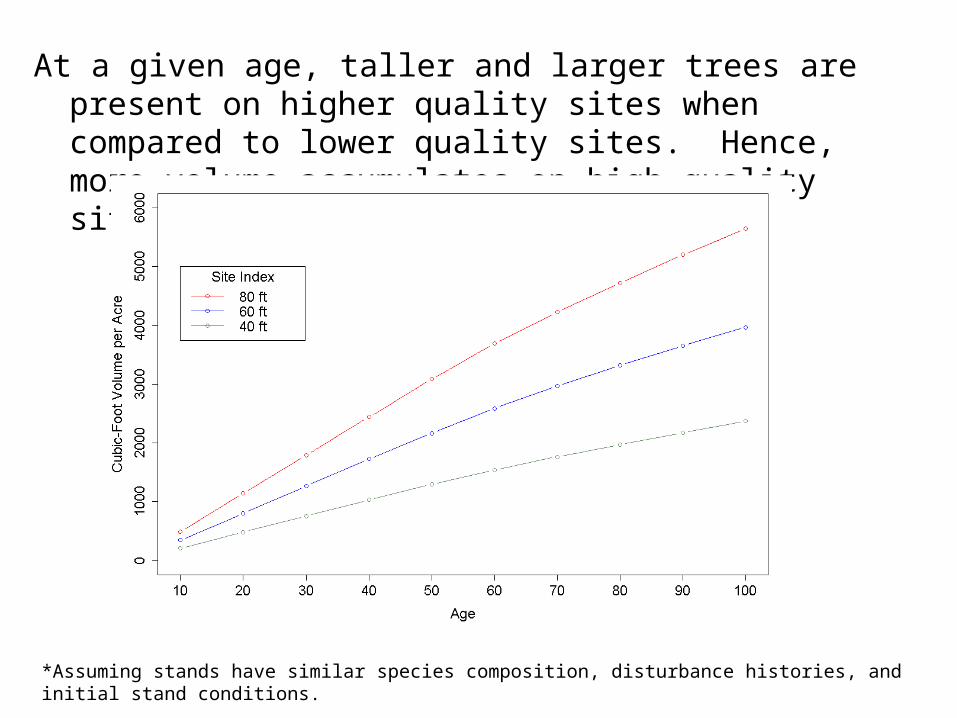
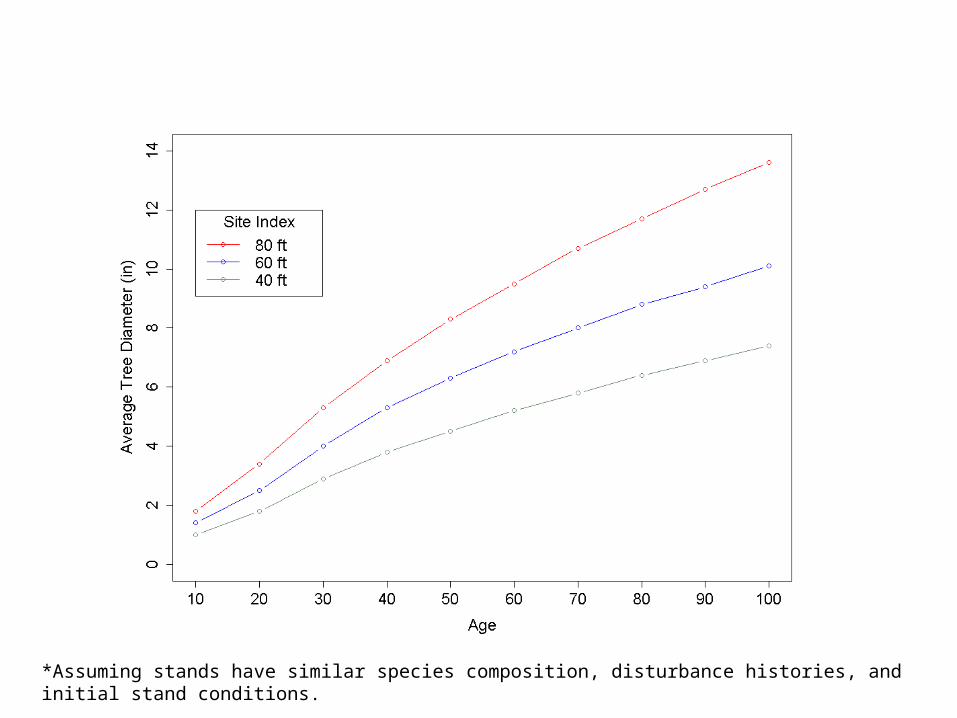
At a given age, taller and larger trees are present on higher quality sites when compared to lower quality sites. Hence, more volume accumulates on high quality sites.*
*Assuming stands have similar species composition, disturbance histories, and initial stand conditions.
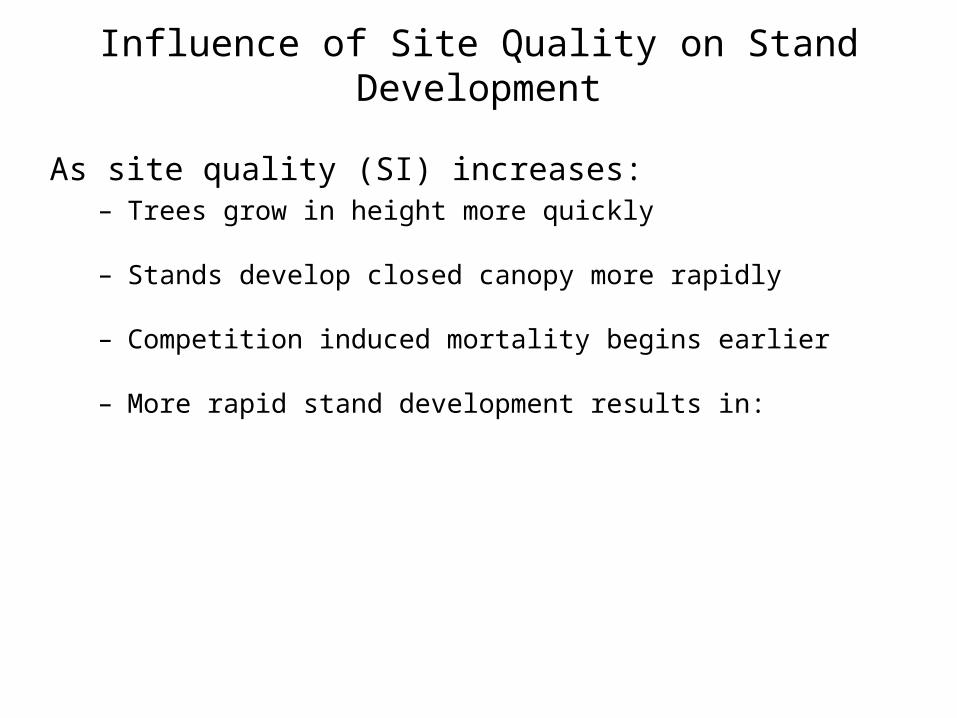
Influence of Site Quality on Stand Development
As site quality (SI) increases:– Trees grow in height more quickly
– Stands develop closed canopy more rapidly
– Competition induced mortality begins earlier
– More rapid stand development results in:

Influence of Species on Growth
Source: Assmann 1970

Influence of Species on Height Growth

Influence of Species on Diameter Growth

Influence of Stand Density on Height Growth
Height growth of overstory trees is only effected by extreme stand densities
• Open-grown trees and overstory trees growing in extremely high densities will generally have reduced heights when compared to other trees growing on a similar quality site
• Height growth of intermediate and overtopped crown class trees is reduced by shading effects of the overstory
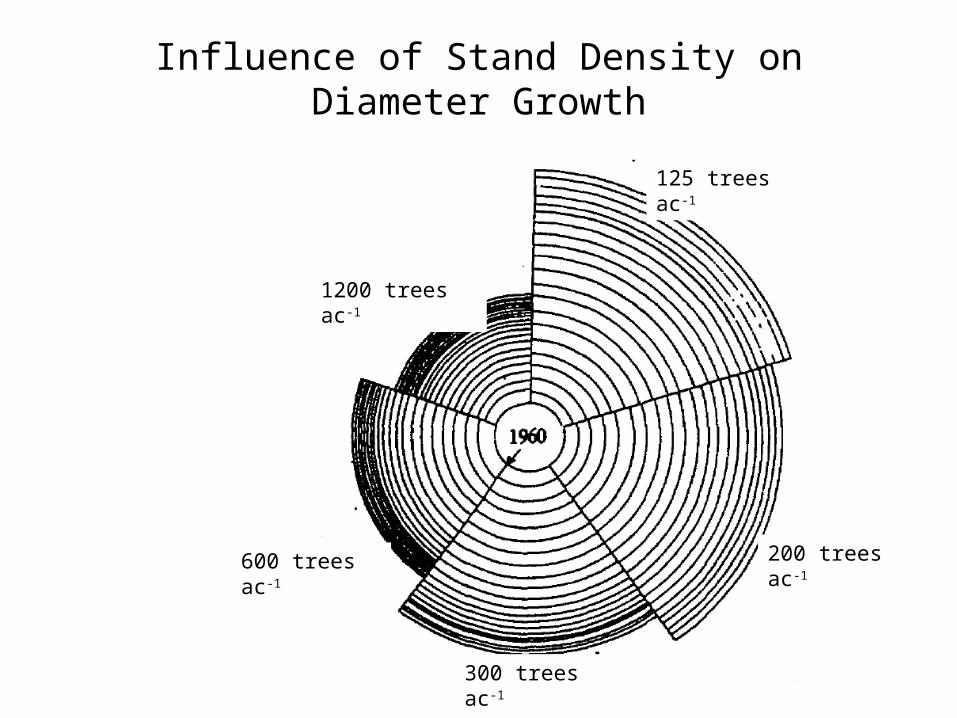
Influence of Stand Density on Diameter Growth
1200 trees ac-1
125 trees ac-1
200 trees ac-1600 trees ac-1
300 trees ac-1

Influence of Stand Density on Diameter Growth
• Stand density is a primary driver of tree diameter growth
• However, at a given stand density, diameter growth is generally higher on better quality sites

Relationship between planting spacing and stand density over time
Tre
es p
er H
ecta
re
Influence of Stand Density on Mortality

Relationship Between Density and Tree Volume Growth
CrowdedIsolated
Trees per Acre
Wide Spaced
Well Spaced
Vol
ume
per
Tre
e
Patterns in volume per tree mirrors amount of growing space available per tree.
Adapted from: Daniel et al. 1979, Smith et al. 1997
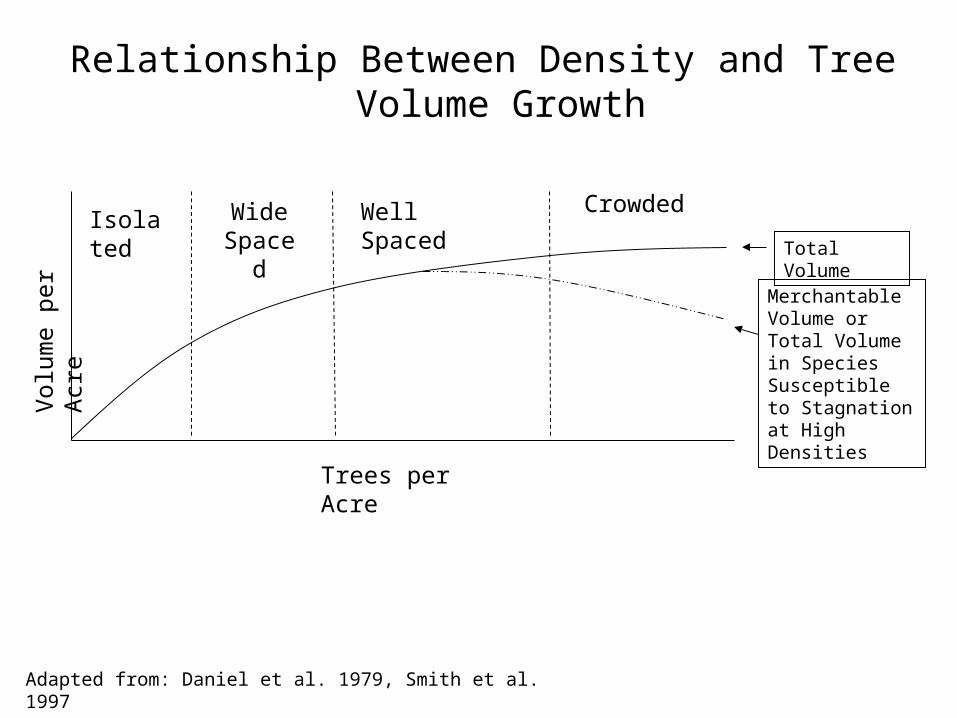
CrowdedIsolated
Trees per Acre
Wide Spaced
Well Spaced
Vol
ume
per
Acr
e Total Volume
Merchantable Volume or Total Volume in Species Susceptible to Stagnation at High Densities
Adapted from: Daniel et al. 1979, Smith et al. 1997
Relationship Between Density and Tree Volume Growth

Relationship Between Density and Tree/Stand Volume Growth
CrowdedIsolated
Trees per Acre
Wide Spaced
Well Spaced
Vol
ume
per
Tre
eV
olum
e pe
r A
cre Total Volume
Merchantable Volume or Total Volume in Species Susceptible to Stagnation at High Densities
Patterns in volume per tree mirrors amount of growing space available per tree.
Adapted from: Daniel et al. 1979, Smith et al. 1997