Embed Size (px)
Citation preview

Forest Edge Development
Management and Design of Forest Edges in
Infrastructure and Urban environments
Björn Wiström Faculty of Landscape Architecture, Horticulture and Crop Production Science
Department of Landscape Architecture, Planning and Management Alnarp
Doctoral Thesis Swedish University of Agricultural Sciences
Alnarp 2015

Acta Universitatis agriculturae Sueciae
2015:129
ISSN 1652-6880 ISBN (print version) 978-91-576-8456-1 ISBN (electronic version) 978-91-576-8457-8 © 2015 Björn Wiström, Alnarp Print: SLU Service/Repro, Alnarp 2015
Cover: The resulting forest edge after the first full scale use of Functional Species Control along the Southern Main Line in the autumn of 2015.
All photographs and figures in this thesis are produced by the author unless otherwise stated

Forest Edge Development - Management and Design of Forest Edges in Infrastructure and Urban environments
Abstract This thesis investigates design guidelines and management systems for the development of stationary forest edges with a graded profile in infrastructure and urban environments. The spatial restriction for the edge to move forward caused by human land use counteracts the natural dynamics and development patterns of graded forest edges. However graded forest edges with successively increasing height from the periphery to the interior of the forest edge are often seen as ideal as they supports important multiple functions while at the same time keeping hazardous trees away from tracks, roads, power lines and houses. This calls for suitable management systems and design guidelines. This thesis focuses on the woody species assemblies and vegetation structures. Two starting points of forest edge development was investigated in Southern Sweden; 1) Planted designed forest edges in the Landscape Laboratory of Alnarp, and 2) Natural regenerated forest edges, after clearing along a 610 km railway line between Malmö and Stockholm. Based on the studies it is proposed that the planning of active forest edge development should depart from basic abiotic gradients and it is important to incorporate vegetation structure at site and landscape level into the long-term planning. The management and design actions taken in relation to this should acknowledge the importance of controlling tree dominance. Traits and species strategies relating to tolerance of shade, drought, waterlogging, browsing as well as dispersal mode and growth form can be used as interpretive framework for forest edges assembly and to guide management actions. When assembling species in relation to these traits, placement along the cross section of the forest edge should be a central aspect of the planting design. Based on the findings two management systems were conceptualized; Zoned Selective Coppice that departs from threshold heights and spatial zonation, respectively Functional Species Control that focus on control of dominating tree species. Further a guideline for planting principle was conceptualized. Three long term experimental trials have been developed and established to enable controlled evaluation of these management systems and design guidelines.
Keywords: assembly, environmental gradient, forest edge, management, planting design, infrastructure, urban, woody vegetation, trial, selective systems, biodiversity experiment, species traits, coppice
Author’s address: Björn Wiström, SLU, Department of Landscape Architecture, Planning and Management P.O. Box 66, 230 53 Alnarp, Sweden E-mail: bjorn.wistrom@ slu.se

”Skovbrynet är förutom horisonten och himlen det enda landskapselement, som i skala svarar till stor nutidig bebyggelse, till trafikanläggningar och till de stadsenheter jag drömmer om. Skogsbrynen är för Danmark vad sjöarna är för Finland, bergryggarna för Italien och floderna för Frankrike. Men framför de geologiska landskapselementen har skogsbrynen den fördelen att de kan skapas av oss inom överskådlig tid.”
“Apart from the horizon and the sky, the forest edge is the only landscape element corresponding in scale to the great modern buildings, traffic environments and cities of which I now dream. Forest edges are for Denmark what lakes are for Finland, mountains ridges are for Italy and rivers are for France. But unlike geological landscape elements, forest edges have the advantage that they can be created by man within a manageable time.” (Freely translated) Sven-Ingvar Andersson (1966). Söndagslandskap och måndagsstäder (Sunday Landscapes
and Monday Cities). page 126 , Havekunst 7/1966, pp. 121-128.

Contents
List of Publications 8
Terminology and definitions 10
1 Introduction 11
2 Objectives 19 2.1 Scope 20
3 State of the art for management and design of forest edges 21 3.1 Forest edges and landscape architecture 22 3.2 Forest edges and silviculture 23 3.3 Forest edges and vegetation ecology 24
3.3.1 Assembly of forest edges 24 3.4 Forest edges – a transition zone in research and in the landscape 26 3.5 Forest edge management approaches 27
3.5.1 Zone cutting with different intervals 27 3.5.2 Non-selective coppice of forest edges 28 3.5.3 Selective approaches and additional planting 29 3.5.4 Rights of way and scrub management 29
3.6 Planting design of forest edges 30 3.6.1 Full-scale planting of forest edges 30 3.6.2 Selection of species and how much of each? 31 3.6.3 Plant spacing – controlling horizontal heterogeneity at
establishment 31 3.6.4 Edge aspect and planting 32 3.6.5 Spatial composition of species mixtures 32
4 Research design 35 4.1 Aristotle’s four causes as a framework for forest edge development 35
5 Starting points, field studies and conceptualisation 39 5.1 Alnarps Västerskog - Starting point for ecological reconstruction through
planting 41 5.1.1 Objectives for studies in Alnarps Västerskog 43 5.1.2 Summary of data collection in Alnarps Västerskog 43
5.2 Overview of data analysis for Alnarps Västerskog 44
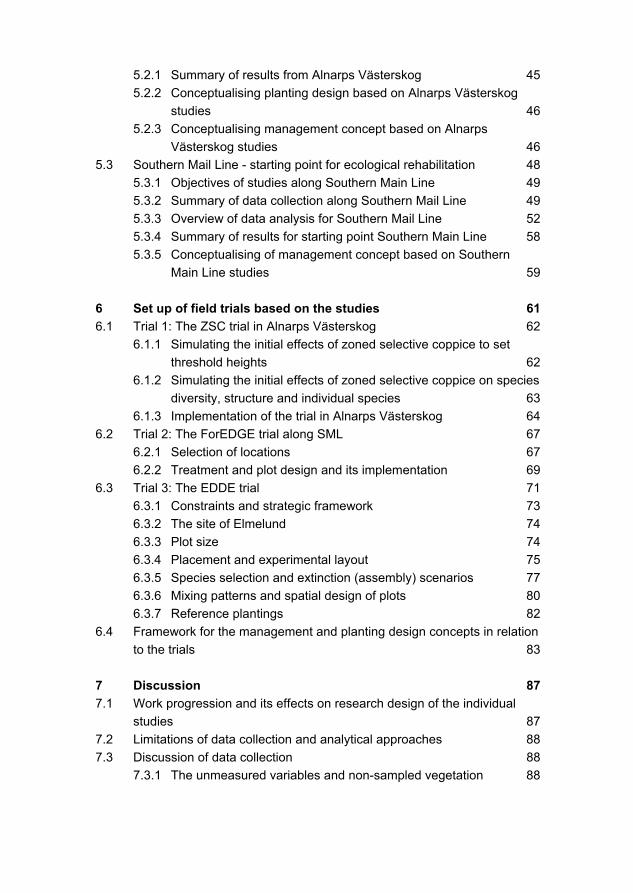
5.2.1 Summary of results from Alnarps Västerskog 45 5.2.2 Conceptualising planting design based on Alnarps Västerskog
studies 46 5.2.3 Conceptualising management concept based on Alnarps
Västerskog studies 46 5.3 Southern Mail Line - starting point for ecological rehabilitation 48
5.3.1 Objectives of studies along Southern Main Line 49 5.3.2 Summary of data collection along Southern Mail Line 49 5.3.3 Overview of data analysis for Southern Mail Line 52 5.3.4 Summary of results for starting point Southern Main Line 58 5.3.5 Conceptualising of management concept based on Southern
Main Line studies 59
6 Set up of field trials based on the studies 61 6.1 Trial 1: The ZSC trial in Alnarps Västerskog 62
6.1.1 Simulating the initial effects of zoned selective coppice to set
threshold heights 62 6.1.2 Simulating the initial effects of zoned selective coppice on species
diversity, structure and individual species 63 6.1.3 Implementation of the trial in Alnarps Västerskog 64
6.2 Trial 2: The ForEDGE trial along SML 67 6.2.1 Selection of locations 67 6.2.2 Treatment and plot design and its implementation 69
6.3 Trial 3: The EDDE trial 71 6.3.1 Constraints and strategic framework 73 6.3.2 The site of Elmelund 74 6.3.3 Plot size 74 6.3.4 Placement and experimental layout 75 6.3.5 Species selection and extinction (assembly) scenarios 77 6.3.6 Mixing patterns and spatial design of plots 80 6.3.7 Reference plantings 82
6.4 Framework for the management and planting design concepts in relation
to the trials 83
7 Discussion 87 7.1 Work progression and its effects on research design of the individual
studies 87 7.2 Limitations of data collection and analytical approaches 88 7.3 Discussion of data collection 88
7.3.1 The unmeasured variables and non-sampled vegetation 88

7.3.2 What came first, the seedling or stem measured? 89 7.3.3 Sampling approaches 90
7.4 Discussion of analytical approaches 90 7.4.1 Overall analytical approach 90 7.4.2 Inheriting a trial for bad and good 91 7.4.3 Alternative methods of analysis 91
7.5 Aspects beyond the scope of the thesis 92 7.5.1 Other aspects of urban and infrastructure environments 92 7.5.2 Ecological traps 93 7.5.3 One among many forest edge types 93 7.5.4 Direct seeding 94 7.5.5 Gradient turnover and edge effects 94 7.5.6 Browsing dynamics 95 7.5.7 The ‘uncertainty’ of history 96
8 Outlook 99
9 References 103
Appendix A: Terminology and definitions 123
Acknowledgements 127
8
List of Publications
This thesis is based on the work contained in the following papers/studies, referred to by Roman numerals in the text:
I Wiström, B. & Nielsen, A.B. (2014). Effects of planting design on planted seedlings and spontaneous vegetation 16 years after establishment of forest edges. New Forests, 45(1), pp. 97-117.
II Wiström, B. & Nielsen, A.B. Decisive environmental characteristics for woody regrowth in forest edges – patterns along complex environmental gradients in Southern Sweden. (Revised Manuscript resubmitted to Forest Ecology and Management)
III Wiström, B., Nielsen, A.B., Klobučar, B. & Klepec, U. (2015). Zoned selective coppice – A management system for graded forest edges. Urban Forestry & Urban Greening, 14(1), pp. 156-162.
IV Wiström, B. & Nielsen, A.B. Forest edge regrowth typologies in southern Sweden - Relationship to environmental characteristics and implications for management (Manuscript submitted to Environmental Management)
Paper I is reproduced with the permission of Springer. Paper III is reproduced with permission of Elsevier.

9
The contribution of Björn Wiström to the papers/studies included in this thesis was as follows:
I Planned the study with assistance from the co-author. Conducted the field inventory and analysed the data. Wrote the article with feedback and co-writing from the co-author.
II Planned the study with assistance from the co-author. Conducted all field inventories with some assistance from the co-author. Performed the data analyses. Wrote the article with feedback and co-writing from the co-author.
III Developed the idea for the management concept. Planned the study together with the co-authors. Implemented the trial in practice together with the co-authors. Conducted half the data collection. Performed the data analysis with assistance from the co-authors. Wrote the article with feedback and co-writing from the co-authors.
IV Planned the study with assistance from the co-author. Conducted all field inventory with some assistance from the co-author. Developed the idea for the management concept. Performed the data analyses. Wrote the article with feedback and co-writing from the co-author. Planned and implemented the resulting management trial.
10
Terminology and definitions
In this thesis, concepts mainly derived from vegetation
ecology, forestry and landscape architecture are defined if not in the text using footnotes. All main concept definitions are also collected in Appendix A. “Nothing new can ever be learned by analyzing definitions. Nevertheless, our existing beliefs can be set in order by this process, and order is an essential element of intellectual economy, as of every other.” Peirce, C.S. (1878). How to make our ideas clear. Popular Science Monthly, 12, pp. 286-302.

11
1 Introduction
This thesis is about development, through management and design, of forest edges. The context is infrastructure and urban environments where human land use leads to stationary 1 forest edges and how the woody component of such edges can be actively designed and managed. Forest edges are the physical vegetation structures2 forming the transition zone between forest and open land cover in various patterns and distributions between the two land uses. Thus they modify and affect multiple processes and organisms in the landscape as they can work as filters, barriers, corridors and habitats (Sarlöv-Herlin, 2001; Cadenasso et al., 2003; Ries et al., 2004). This is strongly related to the vegetation structure and species composition of the forest edge itself (Didham & Lawton, 1999; Mourelle et al., 2001; Hamberg et al., 2009a; Wuyts et al., 2009). Knowledge about these relations enables identification of the forest edge type most suitable to perform specific functions in different contexts, and thereby provision of desired ecosystem services3. However, the managers of forests must then make assumptions and introduce measures to achieve the forest edge type deemed most suitable for a certain context.
Forest edges are dynamic and often change in position and structure over time (Sarlöv-Herlin, 2001; Essen et al., 2006). The forest edge is the result of a
1. Stationary forest edge: If the forest edge is restricted from moving forward and its horizontal
position is hence permanent for a given period, it is termed stationary. 2. Vegetation structure: Structure refers to “the way the individual parts of something are
made, built, or organized into a whole” (Treffry, 1999) and as such is scale-dependent. The spatial scale considered for vegetation structure in this thesis follows Gustavsson (1986) and is at the level of a forest stand. As such, the individual parts can be considered to be the individual species.
3. Ecosystem services: The benefits human populations derive, directly or indirectly, from ecosystem functions (Costanza et al., 1997).

12
stress4 or disturbance5 regime in proximity to a forest system that upholds the succession of the forest and thereby creates a transition between forest and non-forested land. This can be either natural or man-made and more or less stable in space. Based on the origin and upholding of the forest edge, Jansson et al. (2011), based on Strayer et al. (2003) and Harper et al. (2005), define three classes of forest edges; natural, maintained and regenerating. Continuous stress regimes, such as extreme drought in the form of exposed bedrock or extreme wet conditions, i.e. water bodies, create forest edges that are considered natural. Maintained edges depart from land uses that keep the land cover type open through recurring disturbance (e.g. grazing, farming or repeated clearing) or alternation of growth substrates and hence a resources6 and stress regime (e.g. roads and railways). Regenerating edges are the product of disturbances within the forest matrix through natural and human disturbance (clear-cutting) that over time are assimilated back into the forest matrix through succession; also defined as embedded edges according to Matlack & Liviatis (1999).
If the disturbance or stress regime that upholds the forest edge is removed or weakened, the forest edge will advance forward and reclaim the non-forested land, a phenomenon sometimes referred to as advancing edge (Ranney et al., 1981), but also as natural regeneration or old-field succession (e.g. Egler, 1954). Depending on the fluxes of disturbance and stress, the horizontal position of the edge can be more or less stationary (also referred to as permanent or fixed edges) within a specific time scale. The woody species interaction that drives the species composition and structure of the forest edge will be affected by the degree of stationarity, since it modulates the resource utilisation (‘mapping’ sensu Ries et al., 2004) of the different species.
4. Stress: External constraints which limit the rate of ‘plant growth’ (dry matter production)
(according to Grime, 2001). 5. Disturbance: Mechanisms such as browsing, fire and wind, which lead to plant biomass loss
(according to Grime, 2001). 6. Resources: Given the definition of competition (Grime 2001), light, nutrients, water and
space.
13
There is a growing amount of research on how forest edges and other
ecotones7 affect different organisms and processes (e.g. Devlaeminck et al., 2005; Ries & Sisk, 2010; Batáry et al., 2014). In comparison, research examining how to actively develop the forest edge itself through management and design, especially over long periods, is rather limited. Classically, forest and vegetation ecology research has applied long-term management trials and vegetation studies across long complex environmental gradients8 9 in order to obtain a scientifically substantiated understanding of how to develop forest types and structures (Whittaker, 1956; Puettmann et al., 2008; Pretzsch, 2009). However, corresponding studies on forest edges are rare.
Urban 10 and infrastructure 11 environments are characterised by a high degree of human influence and built permanent structures such as houses, roads, railways and power lines, leading to the corresponding forest edges becoming stationary in their position. These environments can span a continuum from lower to higher amount of human influence and built structures. As the urban and infrastructure continuum increases, the amount of indigenous vegetation commonly decreases (Breuste, 2004; Sukopp, 2004).
7. Ecotone: Ecotone is used here as in most general textbooks (e.g. Odum, 1971) as a transition
zone between two communities. As such, an ecotone can be relatively narrow or wide depending on its context. However, it is argued by van der Maarel (1990) in accordance with van Leeuwen’s (1966) “limes converge” that an ecotone is a stress zone with large fluctuations giving rise to a fast and rapid change in species composition. Van der Maarel (1990) argues, in accordance with van Leeuwen’s (1966) “limes diverge”, that a relatively heterogonous and stable gradient zone instead should be referred to as an ecocline. The definition of ecotone and ecocline is hence also a question of the spatial and temporal scale used for the classification. Although van der Maarel’s (1990) arguments are in many ways compelling, the clear (over)use of the ‘textbook’ definition justifies its use, as this avoids misunderstandings and separates its definition from ‘environmental gradient’, which is sometimes referred to as an ecocline or coecocline.
8. Environmental gradient: The abstract dimensions of an ecological space where the relative position of ‘sites’ reflects similarity/dissimilarity of an environmental variable. Samples of sites spanning a large set of the theoretical range of an environmental variable could hence be considered as representing a long environmental gradient (adapted from Austin (1980, 1985) and Oksanen & Tonteri (1995)).
9. Complex environmental gradient: The abstract dimensions of an ecological space where the relative position of ‘sites’ reflects similarity/dissimilarity of an environmental variable that is a representation of several environmental characteristics (adapted from Austin (1980, 1985), Diaz et al. (2008) and Jansen & Oksanen (2013)).
10. Urban environment: An area where population density leads to land use that is substantially related to, or affected by, residential buildings, public services and facilities, commercial land, industrial land, transport and communication facilities.
11. Infrastructure environment: An area consisting of, or strongly affected by, roads, railways, airports, power lines and other infrastructure. Given the definition, infrastructure environment does not have to be urban, but there can be infrastructure environments within an urban area.

14
Furthermore, urban and infrastructure environments often have an increased amount of forest edges, since existing forest is more likely to be fragmented into more and smaller patches (e.g. Corona et al., 2012; Larsen & Nielsen, 2012; Nielsen et al., 2013). Moreover, the high amount of human interference, such as construction work, in this kind of landscape often leads to situations where young successional stages of the forest edges have to be managed. In addition, a significant part of the urban forest in Europe is young plantation/regeneration (Gundersen et al., 2005; Nielsen & Jensen, 2007). The high political priority of new afforestation projects in urban contexts in many countries such as Denmark and the United Kingdom indicates that young forests, and accordingly young forest edges in the urban fabric, will persist and increase (Nielsen & Jensen, 2007). Even young forest edges are of crucial importance in providing multiple ecosystem services in urban contexts, since constraints on land use foster a need for improving the output of all elements of the landscape (Bolund & Hunhammar, 1999; Palmer et al., 2004; Sarr & Puettmann, 2008). All these edges need to be designed 12 and developed adequately if they are to support multifunctional landscapes, but knowledge of how to do this is limited. This is partly due to a lack of experimental trials and studies over long complex environmental gradients and environmental characteristics13 that address woody species composition and structure of forest edges.
12. Planting design: The process of selecting and spatially combining different plant species
through planting. As such, it regulates the initial species interactions and appearance through the decision of e.g. placement, spacing, plant qualities, planting patterns and establishment management.
13 . Environmental characteristics: Umbrella term for spatially varying abiotic and biotic variables of the environment, operating at varying scale from site level to overall landscape composition and configuration (adapted from Diaz et al., 2008).
15
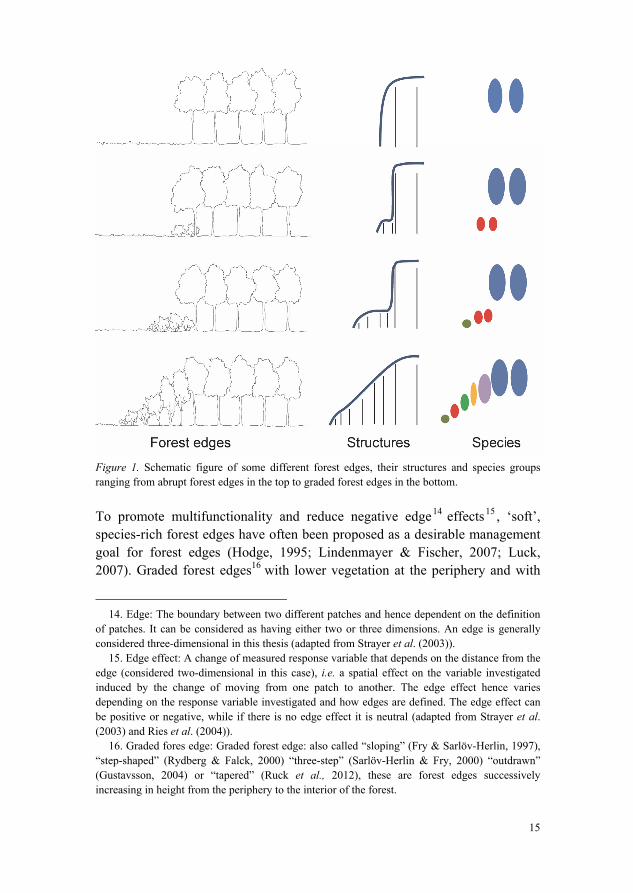
Figure 1. Schematic figure of some different forest edges, their structures and species groups ranging from abrupt forest edges in the top to graded forest edges in the bottom.
To promote multifunctionality and reduce negative edge14 effects15 , ‘soft’, species-rich forest edges have often been proposed as a desirable management goal for forest edges (Hodge, 1995; Lindenmayer & Fischer, 2007; Luck, 2007). Graded forest edges16 with lower vegetation at the periphery and with
14. Edge: The boundary between two different patches and hence dependent on the definition
of patches. It can be considered as having either two or three dimensions. An edge is generally considered three-dimensional in this thesis (adapted from Strayer et al. (2003)).
15. Edge effect: A change of measured response variable that depends on the distance from the edge (considered two-dimensional in this case), i.e. a spatial effect on the variable investigated induced by the change of moving from one patch to another. The edge effect hence varies depending on the response variable investigated and how edges are defined. The edge effect can be positive or negative, while if there is no edge effect it is neutral (adapted from Strayer et al. (2003) and Ries et al. (2004)).
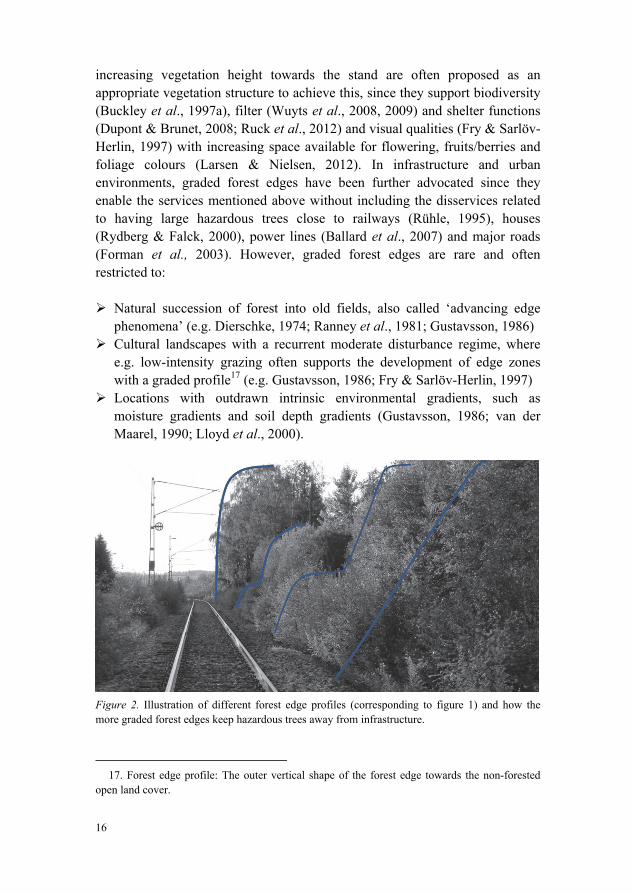
16. Graded fores edge: Graded forest edge: also called “sloping” (Fry & Sarlöv-Herlin, 1997), “step-shaped” (Rydberg & Falck, 2000) “three-step” (Sarlöv-Herlin & Fry, 2000) “outdrawn” (Gustavsson, 2004) or “tapered” (Ruck et al., 2012), these are forest edges successively increasing in height from the periphery to the interior of the forest.
16
increasing vegetation height towards the stand are often proposed as an appropriate vegetation structure to achieve this, since they support biodiversity (Buckley et al., 1997a), filter (Wuyts et al., 2008, 2009) and shelter functions (Dupont & Brunet, 2008; Ruck et al., 2012) and visual qualities (Fry & Sarlöv-Herlin, 1997) with increasing space available for flowering, fruits/berries and foliage colours (Larsen & Nielsen, 2012). In infrastructure and urban environments, graded forest edges have been further advocated since they enable the services mentioned above without including the disservices related to having large hazardous trees close to railways (Rühle, 1995), houses (Rydberg & Falck, 2000), power lines (Ballard et al., 2007) and major roads (Forman et al., 2003). However, graded forest edges are rare and often restricted to:
Natural succession of forest into old fields, also called ‘advancing edge
phenomena’ (e.g. Dierschke, 1974; Ranney et al., 1981; Gustavsson, 1986) Cultural landscapes with a recurrent moderate disturbance regime, where
e.g. low-intensity grazing often supports the development of edge zones with a graded profile17 (e.g. Gustavsson, 1986; Fry & Sarlöv-Herlin, 1997)
Locations with outdrawn intrinsic environmental gradients, such as moisture gradients and soil depth gradients (Gustavsson, 1986; van der Maarel, 1990; Lloyd et al., 2000).
Figure 2. Illustration of different forest edge profiles (corresponding to figure 1) and how the more graded forest edges keep hazardous trees away from infrastructure.
17. Forest edge profile: The outer vertical shape of the forest edge towards the non-forested
open land cover.

17
Using inventory data for Sweden, Essen et al. (2004) estimated that only 20% of forest edges in the Swedish landscape are shrub-dominated and only 2% have a graded profile. Lack of appropriate management and homogenisation of land use are probable causes (Ihse, 1995; Sarlöv-Herlin, 2001; Gustavsson, 2004; Gustavsson et al., 2005; Emanuelsson, 2009; Larsen & Nielsen, 2012). Consequently, the Swedish Environmental Protection Agency has raised several concerns about the loss of well-developed forest edge habitats (Naturvårdsverket, 2012). In urban and infrastructure contexts, environmental gradients are often neutralised and management concepts relying on advancing edges or grazing are seldom applicable. This contradiction between desirable edge function, structure and species composition and lack of options to achieve this is problematic for the practitioner and interesting for the researcher. Therefore graded forest edges were selected as the focus of the research reported in this thesis.
There is great social interest in controlling the spatial position of vegetation in order to decrease the risk of ecosystem disservices (e.g. Fankhauser et al., 1999; Delshammar et al., 2015). One example of this is the Swedish railway system. During two severe storms, in 2005 and 2007, trees falling on railways and power lines caused severe damage. As a response, the Swedish Transport Administration obtained legislation in 2008 to expand the railway corridor from 10 m to 20 m from the rail banks and to clear away forest in the new part of the corridor. This resulted in over 3000 km of forest edge regrowth to be managed along Swedish railways. This management has traditionally been conducted with non-selective18 systems, but this often increases the negative edge effects on the surrounding forest landscape (Didhamn & Lawton, 1999; Rydberg, 2000; Hamberg et al., 2009a). Furthermore, non-selective methods of vegetation control are strongly discouraged in the literature on similar environments in North America (e.g. Luken et al., 1991; Meilleur et al., 1994; Hill et al., 1995; Mercier, 2001; Nowak & Ballard, 2005) and on urban environments (Ribe, 1989; Rydberg, 2000). The Swedish Transport Administration therefore initiated an applied research and development project to investigate selective management methods19 for the development of graded forest edges. This thesis is a result of that initiative.
18. Non-selective management methods: Management is applied equally over the management area without individually targeting certain species, groups, sizes or forms.
19. Selective management methods: Management that individually targets certain species, groups, sizes or forms within the management area. Note that within silviculture and forestry, selection and selective are sometimes used with slightly different meanings. Within other environmental management areas such as vegetation management of power lines, selective is the common term for such management methods.

18

19
2 Objectives
The overall aims of this thesis were to provide empirically substantiated information on how stationary graded forest edges in infrastructure and urban environments can be developed concerning woody species composition and vegetation structure through design and management. This was researched in three steps, which in relation to the aims can be summarised as follows:
1. Empirical field studies of the relationships between woody species
composition, forest edge structure and environmental characteristics in the early successional development of designed and naturally regenerated forest edges, in order to develop an empirically substantiated knowledge base for:
2. Conceptualising planting design principles and selective management systems for graded forest edges (i.e. theory development), and
3. Planning and establishment of field trials for controlled, long-term testing and evaluation of the conceptualised planting design principles and management systems for graded forest edges.
Specific objectives were to: A. Assess the effect of planting design on forest edge concerning structure,
species composition and spontaneous woody vegetation. B. Identify the environmental characteristics at site and landscape levels that
are most influential for the woody species assembly of forest edges C. Develop management and design concepts for establishment and
maintenance of stationary graded forest edges D. Establish controlled management trials with graded forest edges for long-
term testing and further development of the design and management concepts developed.

20
2.1 Scope
The scope of this thesis was the nemoral and hemiboreal vegetation zone and the analysis was limited to the woody component of stationary forest edges. Field studies are restricted to these vegetation zones within Sweden. The review of management and design considerations concentrated on practice in European countries, described in literature published in either a Scandinavian language or English. Design considerations in relation to new forest edge establishments were restricted to planting.
21
3 State of the art for management and design of forest edges
Today most forest edges in Sweden (and elsewhere) are the product of human activities, but the activity to manage them seems either self-evident or underexplored. Only very few forest edge management trials/experiments exist (e.g. Ferris-Kaan, 1989; Buckley et al., 1997a). Fragmentation trials (e.g. Bierregaard et al., 1992; Essen, 1994; Yao et al., 1999; Laurance et al., 2006; Santos et al., 2014) are not considered here, since they do not aim to manipulate the forest edge per se, but the amount and configuration of forest edges in the landscape. As a result, guidelines for forest edge management and design seldom clarify to what extend they are scientifically substantiated. This could either be explained by forest edges being too complex to generalise concerning management strategies and only being manageable in a site-specific perspective, or a lack of actual application of scientific studies of forest edges to a clear practical management realm. For example, most forest edge studies to date have addressed the response of different variables or organisms in relation to the forest edge (i.e. forest edge effect) and not the response of the forest edge structure and species composition itself in relation to management/design actions and environmental characteristics.
Forest edges are a transition zone in research and in the landscape. Accordingly, this thesis has a cross disciplinary approach, drawing on and combining theories, methods and related knowledge from landscape architecture, silviculture and vegetation ecology.

22
3.1 Forest edges and landscape architecture
Landscape architecture is a relatively young academic discipline, but has a substantially longer history as a practical discipline. One way of defining landscape architecture could therefore be to depart from the practice of the profession. As such, landscape architecture can be simplified as the art of solving problems/task concerning the spatial composition and structure of a given landscape and its elements using multiple analytical and communication tools and approaches. In this, involvement of other professions and knowledge cultures spanning natural, social and humanistic disciplines is essential.
Architecture is substantially about creating and defining rooms and spaces using mainly built materials. Correspondingly, landscape architecture is to a large extent about creating and defining rooms using vegetation and other elements of the landscape. To define and articulate different outdoor spaces different types of vegetation edges have been conceptualised; e.g. hedges, shrub plantings and forest edges (Olsen, 1999).
Being a strongly context-driven profession various design practices and styles have been developed reflecting the time period and geographical scope. During the past century this has been particular evident in a Scandinavian context. In the forest-poor landscapes of the nemoral zone of southern Sweden and Denmark, the focus was on the design of new vegetation volumes focusing on boundaries (sometimes referred to as the ‘Danish school’) (Bucht, 2002). In contrast, in the more forested and mosaic landscape of e.g. the Stockholm region, the approach was more on working with the existing vegetation, smoother transition zones and a naturalistic appearance (often referred to as the ‘Stockholm school’) (Bucht, 2002). Although both of these and other landscape architecture approaches develop a large amount of vegetation edges, systematic evaluation and monitoring of different approaches has not been given much attention within the knowledge field (however, see Florgård (2000) and Gustavsson (2004) for exceptions). The focus has instead been largely on either stylising or borrowing inspiration from different vegetation elements found in the landscape (e.g. Rizell & Gustavsson, 1998; Olsen, 1999; Diekelmann & Schuster, 2002). Realising these ideas has then largely depended on the skills of the park/landscape manager (Bucht, 1997; Andersson, 2000).
The design approach often applied within the landscape profession can be described in simplified terms as follows: Through explorative and often multiple approaches, the given problem/task is analysed. Based on this, a ‘design’ concept is derived. This concept is then used as the guide against which subsequent practical decisions are weighted in the process of realising the final design solution. This of course is a coarse and partly crude way of
23
describing the profession and its practice. Nevertheless, it gives an idea of one of the backgrounds from which this thesis departs. Other knowledge fields that are particularly essential for the design and management of forest edges are vegetation ecology and silviculture. In the following section, the inputs and approach of these knowledge fields are briefly reviewed and discussed. Following this, the literature on the resulting planting design approaches and management approaches is reviewed.
3.2 Forest edges and silviculture
Within forestry, silvicultural systems have been developed to regulate stand structure and species composition to fulfil the needs of society in tandem with environmental and technical/practical constraints (Puettmann et al., 2008). This is achieved through different regeneration methods that can be classified according to Mayer (1984) and Puettmann et al. (2008) based on:
Strength (amount of overstorey left) Spatial arrangement Influence of edge/neighbouring stand (context)
Silviculture - just as landscape architecture - is an art and a science, and most silvicultural systems have been developed by refining local practices and experiences (Nielsen, 2006; Puettmann et al., 2008). This, together with the need to work with systems with an extremely long time horizon, has promoted strong traditional thinking (Puettmann et al., 2008). Implementation of new concepts and ideas, both in landscape architecture and silviculture, often benefits from relating to existing practice and knowledge cultures (Argyris, 1993; Persson, 1997; Nielsen, 2006). The scientific testing and development of silvicultural systems to date has had a strong connection to classic agricultural research approaches, where homogeneous test conditions and classical null hypothesis testing for optimisation of crop production (trees) have been the norm. The scientific desire for homogeneous trial plots and the strong focus on yield and timber quality have meant that other important parts of the landscape, such as stand edges, have been avoided in forest management experiments (Puettmann et al., 2008).
24
3.3 Forest edges and vegetation ecology
In contrast to silvicultural research, the science of ecology did not originally evolve to solve specific problems, but to understand the patterns and mechanisms that determine how species are distributed and co-exist. How to actually approach the statistical testing and modelling of such complex and noisy systems is still the subject of debate (Austin, 1980; Hobbs & Hilborn, 2006; Jansen & Oksanen, 2013). From the pioneering work of e.g. Whittaker (1956, 1967) and the following breakthrough in providing suitable analytical tools (e.g. ter Braak 1987) to the inclusion of species traits20 (e.g. Garnier et al., 2007; Kleyer et al., 2008, 2012), this field of study has helped build an understanding of how vegetation assembles and varies over longer environmental gradients. Generally ‘well-defined’ communities of plants, such as meadows and their composition, have been studied over large gradients (e.g. Whittaker, 1956; Lepš & Šmilauer, 2007). In other studies, the response of species or environmental variables across the gradient from open to closed forest, i.e. the gradient of the forest edge itself, has been examined (Marozas et al., 2005; Hamberg et al., 2010a).
3.3.1 Assembly of forest edges
Many forest edge studies have contributed new information on how the forest edge species composition changes from open land to closed forest, i.e. the gradient of the forest edge itself (e.g. Kubíková, 1971; Wales, 1972; Dierschke, 1974; Chen et al., 1992; Hansson, 2000; Euskirchen et al., 2001; Harper et al., 2005; Alignier & Deconchat, 2013). However, forest edges are also located on a continuum of larger environmental gradients than the edge itself. Work in central Europe (e.g. Ellenberg, 1988; Coch, 1995; and references therein) using a phytosociological approach clearly points to the existence of different forest edge communities. However, one might expect that such communities overlap each other as different species map onto different parts of environmental gradients (Whittaker, 1967; Ries et al., 2004).
20. Trait: A trait is a surrogate of organismal performance (Violle et al., 2007) and is a defined
property of organisms used comparatively across species or communities (adapted from McGill et al. (2006) and Garnier et al. (2007)). As multiple traits often relate, or are included in, a specific plant strategy, e.g. stress tolerance to drought (Stahl et al., 2013), this thesis adopts a wide and inclusive approach to the trait terminology. This means that proxies for complex suites of traits for a certain strategy are employed as interpretation instruments.

25
In their review, Götzenberger et al. (2012) conclude that plant community21 assembly rules 22 depend on filters constituted by ecological filters 23 of dispersal, abiotic environments and biotic interactions, while some authors (e.g. Keddy 1992) add disturbance regime as a separate class. Departing from this, the assembly of species in a forest edge can be believed to relate to some of the processes described below.
Abiotic gradients provide the underlying resources which species, depending on their traits, have to survive and utilise, which drive biotic interactions through competition24 and facilitation25 (Connell & Slatyer, 1977; Callaway & Walker, 1997; Grime, 2001). Woody species have adapted to this through handling stresses of shade, drought and waterlogging (Niinemets & Valladares, 2006). However, edge effects may modify these abiotic amplitudes through higher temperatures (Geiger, 1965; Matlack, 1993a), nutrient deposition (Weathers et al., 2001) and available light compared with inside the forest (Matlack & Litvaitis, 1999). Forest edges also affect the movement and abundance of different animal species, which can give rise to biotic regulations through changes in herbivore disturbance (Wirth et al., 2008), as well as propagule predation (Kollmann & Buschor, 2003; Guzmán-Guzmán & Williams-Linera, 2006). Furthermore, the structure of the forest edge affects these biotic and abiotic relations. Through changes in seed dispersal (Cadenasso & Pickett, 2001; Devlaeminck et al., 2005) and changes in edge penetration of abiotic variables such as wind and light (Williams-Linera, 1990; Didham & Lawton, 1999; Hamberg et al., 2009a; Ruck et al., 2012), these abiotic and abiotic assembly rules may also be related to the spatial landscape structure26 (Sarlöv-Herlin & Fry, 2000; Götzenberger et al., 2012; Schindler et
21. Community: A collection of species occurring in the same place at the same time (Fauth et
al., 1996). 22. Assembly rules: Following the reasoning of Götzenberger et al. (2012), assembly rules are
any constraint on species co-existence, as seen as restrictions on the observed data pattern. As such, assembly rules represent constraints on community composition and structure due to ecological filters of dispersal, abiotic environments, biotic interactions (Götzenberger et al., 2012) and disturbance regime (Keddy, 1992).
23. Ecological filter: The concept that different aspects of the environment act as filters or sieves to remove (filter away) species that are not adapted to the given environmental characteristics (adapted from Keddy (1992) and Diaz et al. (1998)).
24. Competition: The tendency of neighbouring plants to utilize the same quantum of light, nutrients, water, and space (according to Grime (2001)
25. Facilitation: Interaction between organisms that benefit at least one of the participants and cause harm to neither (Stachowicz, 2001).
26. Landscape structure: The spatial pattern of the entire landscape mosaic (at a given scale). It can be quantified (or at least approximated) with landscape-level metrics and includes aspects of both landscape composition and configuration (adapted from Turner et al. (2001) and McGarigal et al. (2012)).

26
al., 2013), both for the dispersal of the species (Grashof-Bokdam, 1997; Cain et al., 2000) and for the controlling effects of herbivory (Kie et al., 2002; Wirth et al., 2008; Månsson et al., 2012).
These layers of the selection process from regional via local to the actual community have been conceptualised as hierarchical filters27 acting at different scales to set the rules for assembly (de Bello et al., 2013). However, there are other definitions of assembly apart from this broad form, which is adapted from Götezenberg (2012). For example, Hubbel (2001) distinguishes between niche assembly and dispersal assembly and proposes that biodiversity patterns of trees in forest are largely explained by dispersal processes. An important aspect of assembly in relation to management and restoration efforts is the idea of dynamic filter28 models, where the influence of different filters changes over the course of succession (Temperton et al., 2004).
However, studies of woody species composition in forest edges (i.e. the main component to be managed) in relation to longer complex environment gradients and multiple scales are rare (for exceptions see Trammell et al., 2011a; Arenas et al, 2015).
3.4 Forest edges – a transition zone in research and in the landscape
In short, landscape architecture, silviculture and ecology provide important, but also very different, research perspectives and supplementary methodological approaches for advancing knowledge about forest edge development. Landscape architecture has through its practice emphasised the need for working with both existing vegetation and planting in the development of suitable forest edges and how different structures can support different functions and design aspects. Ecological studies have conceptualised how communities assemble and contribute knowledge about the effects of forest edges on a range of organisms and, based on this, have given advice on how forest edges ‘should’ look. Silvicultural research has provided frameworks and systems for manipulating woody species structure and species composition to meet different objectives identified by society, owners and/or stakeholders, but mainly for forest stands, while there is a lack of studies directly addressing forest edge management and design.
27. Hierarchical filtering: The concept that filtering of species in the assembly of communities is hierarchical where global, regional and local species are related and filtered at different scales (adapted from Temperton et al. (2004) and de Bello et al. (2013).
28. Dynamic filtering: The concept that ecological filters change in relation to each other and these effects change over time in relation to succession and disturbances (adapted from Temperton et al., 2004).

27
3.5 Forest edge management approaches
Edge strip cutting systems (e.g. Wagner’s (1912) ‘Blendersaumschlag’ approach and its predecessors originating in Germany) can be regarded as one of the oldest silvicultural systems relating to forest edge contexts. However, these systems were developed to minimise windfelling and to moderate microclimate in order to support regeneration as part of successive stand replacement (Troup, 1928). As such, they do not concern the management of more or less stationary forest edges to promote specific forest edge structure and functions.
The largest number of studies of forest edges in relation to environmental conditions can probably be found within a German context. For example, Coch (1995) summarises the faunistic and floristic relations in forest edges for a German context. As in many other management recommendations for forest edges, the use of grazing as a suitable management strategy is elaborated upon, but the applicability of this for urban and especially infrastructure environments is limited. The mechanical management options available are of more relevance in an urban and infrastructure context.
Based on a study of four different forest edges in Germany, Pietzarka & Roloff (1993) conceptualised a dynamic forest edge management model with four phases. In the first phase, the forest edge is located away (approximately 30 m) from the land use that restricts its horizontal advance in space (i.e. the ‘border’). During the second phase, the forest edge advances towards the border, leading to a graded forest edge profile. During the third phase, before the forest edge has reached the border, the interior part of forest edge is thinned to support the development of an “interior new edge”. In phase four, this “interior new edge” becomes the new starting point for the forest edge advance as the vegetation in front is cut down and the situation is more or less back to phase one and restarts from there. However, the structure of the forest edge profile advance is conceptualised in different ways between the strip cutting proposed by Wagner (1912) and the model of Pietzarka & Roloff (1993).
3.5.1 Zone cutting with different intervals
One of the more articulated forest edge management guidelines, which summarises knowledge from England, has been produced by Ferris and Carter (2000). It is based, among other sources, on the seminal work edited by Ferris-Kaan (1989) in which Anderson & Buckley (1989) address the imbalance of

28
forest edge studies on single animal species, and not the edge as such, and state the need for selective forest edge management approaches. The resulting recommendation in Ferris & Carter (2000) is a zone cutting method that can be applied intensively or extensively. The extensive application divides the forest edge into two zones, where the outer is cut in cycles of 1-3 years and the inner every 4-7 years. This approach is generally recommended for rides29 with a width of up to 20 m, i.e. an edge cross-section 30<10 m. For forest edges with an edge cross-section wider than 10 m, those authors recommend a more intensive application that divides the edge cross-section into three zones, where the outer is cut at intervals of 2-4 years, the middle zone every 4-8 years and the inner zone every 8-20 years. While intensive application of the zoned cutting method is argued to be beneficial for the wildlife, both management intensities should ideally be applied to different compartments over a long time, i.e. each zone should be cut into sections/compartments of 50-100 m edge in different years. This means that there will be different stages of the forest edge succession available at all times within a certain area. The challenge for managers is the logistical constraints that such different time intervals impose, especially in infrastructure environments.
3.5.2 Non-selective coppice of forest edges
Parts of the experimental set-ups reported in Ferris-Kaan (1989) were later evaluated by the benchmark papers of Buckley et al. (1997a, 1997b). The work by Buckley et al. was novel since prior to that study, forest edge management and its effects over time had seldom been reported in scientific articles. The management option they tested was total clearance of parts of the forest edge in different forms, such as strips, scallops or large “bays”, and the following early succession of the vascular vegetation. Total cutting of certain parts of forest edges is common practice in the British Isles. It is also mentioned in Germany by Coch (1995) as cutting of “saum und mantel”, although Coch questions its long-term economic suitability on fertile sites. In 2007, the Dutch Ministry of Agriculture, Nature and Food Quality introduced subsidies for either strip cutting of forest edges or letting the forest advance forward to create a more graded forest edge profile (Non & de Vries, 2013). All subsidy claimants chose the strip cutting option (Non & de Vries, 2013), manifesting the practical problems of relying on advancing forest edges as a management strategy.
29. Ride: A linear open space through a forest established through a need for access. A path or
track becomes a ride when it is wide enough for there to be a distinct continuous gap in the tree canopy above the ride (adapted from Ferris & Carter (2000) and Stephens (2005)).
30 . Forest edge cross-section: The width of the forest edge perpendicular to the main elongation of the forest edge.

29
Nevertheless, evaluations in 2012 showed that the strip cutting had a positive effect on butterfly abundance and richness, probably due to the increased nectar availability identified (Non & de Vries, 2013).
3.5.3 Selective approaches and additional planting
In Sweden, Rydberg (2000) and others have pointed out the problem of non-selective coppice operations in urban contexts and advocate selective coppicing methods such as a maximum height model for low stands, where only species over a threshold height are coppiced. Based on observational studies of existing forest edges (i.e. not the management of edges per se) in Denmark (Andersen & Hübertz, 1994), the general advice is also to apply selective cutting of at least 15-20 m of the outer forest edge, preferably together with the planting of shrub species in front of and inside the forest. This Danish report also states that forest edges are beneficial both for timber production in the stand and biodiversity when they are developed and managed as forest edges and not as conventional forest stands (Andersen & Hübertz, 1994). Planting of shrubs in front of the existing forest edge to promote a more graded forest edge is also advocated by Wuyts et al. (2009) to increase the filtering capacity. Planting in relation to existing forest edges has attracted more scientific attention than other development strains for forest edges, but often as a way to create ‘experimental’ field gradients of shade and/or exposures to wind, light and seed predation, and not as a way of actively supporting a given forest edge type or structure (Meiners et al., 2002; Lopez-Barrera et al., 2006; Fajardo & McIntire, 2011; van Zonneveld et al., 2012).
3.5.4 Rights of way and scrub management
Rights of way management (ROW) and management of scrub vegetation are areas with clear connections to forest edge management. In the United Kingdom, a major review was carried out on scrub management by Day et al. (2003). Acknowledging the small amount of research in the area, the review was largely based on sources spanning from single observations to expert judgments and technical reports. The main advice given in the review concerns how to achieve a management goal, e.g. to increase, enhance, maintain, reduce or eliminate scrub vegetation, and it provides an overview of the management options that can be used for this, e.g. planting, grazing/ browsing control, coppicing, controlled burning, grubbing and herbicide application. However, the focus is on the management option to use for each aim, not how the different management options can be adapted in different ways to support a certain structure or species composition through e.g. coppicing or selective thinning. In contrast, ROW management research has focused mainly on the

30
enhancement of scrub and herbaceous vegetation to slow down succession and tree dominance31 as a more sustainable risk management in e.g. power-line corridors than traditional non-selective management (e.g. Bramble & Byrnes, 1983; Nowak & Ballard, 2005). This research has its main origins in North America and much departs from the use of different herbicides as part of selective management aiming to enhance shrubs and reduce trees (e.g. Dreyer & Niering, 1986; Luken et al., 1994) and evaluate the effect on wildlife and flora (e.g. Bramble et al., 1997; Yahner et al., 2001; Yahner & Yahner, 2007; Yahner et al., 2008). A feature in common to both scrub and ROW management is general support for active selective management approaches to support more low-growing woody communities and a belief that such habitats can make an important contribution to species diversity in the landscape.
In short, although diverse, graded forest edges are often put forward as a desirable management aim, documented management concepts for forest edges in terms of content and scope is lacking. The number of management concepts that have actually been scientifically evaluated is even fewer. Existing in the transition between high forest and coppice systems, scrub management and vegetation control in ROW environments do not seem to have given rise to many hybrid or crossover approaches to management concepts. Accordingly, the Swedish Environmental Protection Agency has raised concerns that forest edges are not sufficiently targeted by environmental subsidy schemes, which promote more easily managed nature types, and that there is lack of tools for recreation-based management that maintains and develops recreational nature and heritage values simultaneously, especially in urban areas (Naturvårdsverket, 2012).
3.6 Planting design of forest edges
3.6.1 Full-scale planting of forest edges
In afforestation projects, Blakesley (2006) suggests planting a minimum of three rows of shrub-dominated species mixtures along the borders of forest stands as a way of increasing diversity and multifunctionality. Similarly, Blakesley et al. (2010) emphasise that the development of forest edges is one of the most important actions for wildlife in species-poor farm woods in the UK. In Denmark, a scheme providing subsidies for afforestation demands specific forest edge plantings with widths of either 10 or 20 m depending on
31. Dominance: The advantage over other species gained in acquiring resources through large (total) size. Dominance often changes in plant communities through succession. At an early stage, a surplus of individual plants or stems often leads to dominance. In later successional stages, growing tall and wide often leads to dominance (Grime, 2001).

31
the compass aspect (Naturstyrelsen, 2013a, 2013b). In contrast, the standard Danish planting design handbook for landscape architects “Planter i miljøet” by Olsen (1999) states that only one to two rows of specific edge planting are needed and natural processes will do the rest of the work in creating more graded, species-rich forest edges.
3.6.2 Selection of species and how much of each?
Blakesley (2006) suggests that the planting design should be drawn up using species and their relative abundance, as identified in regional scrub vegetation types (Rodwell, 1991). However there is strong reason to believe that species composition and proportions at an initial stage of afforestation are not directly comparable to those in later stages of the vegetation (Stanturf et al., 2001; Andel & Grootjans, 2006; Richnau et al., 2012). Studies exploring how species composition changes over time in forest edge plantings are rare, however. The same appears to be true for more natural forest edges. Longitudinal studies of forest edges have instead employed quasi time series where younger edges are compared with older (e.g. Chabrerie et al., 2013). Such information could help inform planners and managers on how to calibrate the relative dominance and abundance of the species over time. This is important, since assembling all species at once does not take into account the fact that species composition and structure in mature edges is probably the product of competition, facilitation, stress and disturbances fluxes over time. For example, trees in a mosaic forest edge might be the product of initial32 or relay 33floristics (Egler, 1954), so including all desired tree species at the initial planting may have different effects.
3.6.3 Plant spacing – controlling horizontal heterogeneity at establishment
In afforestation projects, plant spacing (range 1-3 m) similar to those applied in forest stand has often been utilised for forest edges (Gustavsson & Ingelög, 1994; Hodge, 1995). To promote structural diversity, some authors discuss the option of using random plant spacing within rows (Blakesley, 2006; Nielsen & Jensen, 2007). Some guidelines instead suggest the higher stem density often found in the outer part of the edge (Ranney et al., 1981; Williams-Linera, 1990) and propose denser plant spacing distance in the outer rows as an alternative (Rizell & Gustavsson, 1998). Similar effects to using random plant
32. Initial floristics: All species establish approximately at the same time after disturbance but
assert dominance at different times (Egler 1954; Oliver & Larson 1996). 33 . Relay floristics: A group of species establish after disturbance and are with time
successively replaced by other species groups i.e., the successive appearance and disappearance of groups of species in the development of vegetation (Egler 1954; Oliver & Larson 1996).
32
spacing could be to include non-planted areas within the forest edge (Rizell & Gustavsson 1998). However, for practical reasons and subsidy requirements (e.g. in Denmark) regular spacing at planting through the whole edge section is often employed. Although this approach often supports a high survival rate, it might conflict with ambitions of higher structural complexity (Gunnarson & Gustavsson, 1989).
3.6.4 Edge aspect and planting
Forest edges facing south-east, south, south-west and west (in the northern hemisphere) are relatively more exposed to solar radiation than other compass aspects (Geiger, 1965; Chen et al., 1993; Matlack & Litvaitis 1999). For brevity, these are referred to hereafter as ‘exposed’. They are therefore generally warmer and drier (lower levels of air and soil humidity) due to higher evaporation than in east- and north-facing edges (referred to hereafter as ‘unexposed’) (Geiger, 1965; Matlack, 1993a). This implies less stress from shading but higher drought stress in exposed edges compared with unexposed. However, the main wind direction during the vegetation period should also be considered, since it will increase evaporation. To complicate matters further, the structure of the forest edge will influence the amount of radiation and wind penetrating into the edge (Didhamn & Lawton, 1999; Hamberg et al., 2009a; Ruck et al., 2012).
3.6.5 Spatial composition of species mixtures
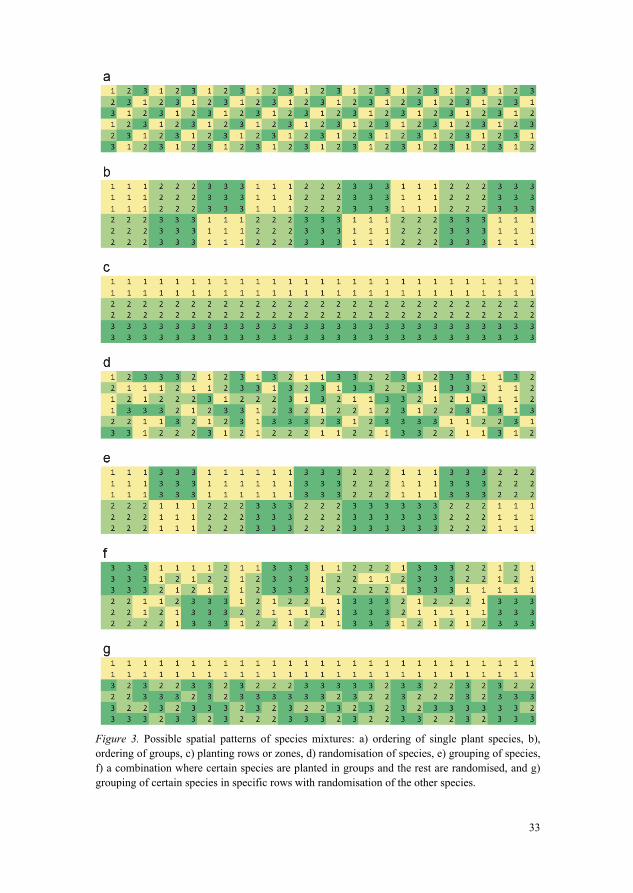
At planting, species mixtures can be composed spatially in many different ways (Hodge, 1995) (Figure 3). First, the species or group of species can be planted in a specific order (referred to as designed by Stanturf et al. (2014a)). This can be done either on a single plant level (Figure 3a), group level (Figure 3b) or for certain planting rows or zones (Figure 3c). The opposite to this is randomisation of the species (also called “intimate mixtures” by Hodge (1995) (Figure 3d) or the groups (Figure 3e). They can also be used in combination (Figure 3f), where certain species are planted in groups and the rest are randomised (sensu Hodge, 1995). Similar to this is the grouping of certain species in specific rows with randomisation of the other species (Figure 3g).
33
Figure 3. Possible spatial patterns of species mixtures: a) ordering of single plant species, b), ordering of groups, c) planting rows or zones, d) randomisation of species, e) grouping of species, f) a combination where certain species are planted in groups and the rest are randomised, and g) grouping of certain species in specific rows with randomisation of the other species.

34
Different views concerning forest edge planting design are represented in the literature, for example Blakesley (2006) advocates randomised mixtures for the creation of graded edges with a naturalistic appearance, while Gustavsson & Ingelög (1994) and Dunnet (2004) give examples of single species group mixtures to achieve the same appearance.
In summary, most of the planting and design guidelines are interpretations of knowledge derived from studies of more ‘natural’ forest edges that have more or less merged with different existing afforestation and landscaping practices. However, mimicking certain patterns found in existing forest edges might not always lead to the desired structure and species composition. Accordingly, the evident divergence in guidelines on forest edges planting design can be regarded as a reflection of the lack of empirical evaluations of trade-offs between different planting designs.
35
4 Research design
Integration of forest structures into urban and infrastructure development can be simplified as departing from two main starting points: Either the built environment is integrated into the existing forest structure, or the forest structure is added through planting on non-forested land. In forest-dominated landscapes, the frame for forest edge development often departs from existing vegetation or regrowth, whereas in forest-poor landscapes the woody vegetation is often installed through active planting. Based on these options, two main starting points for design and management of graded forest edge are developed in the thesis. Viewed from the perspective of forest landscape restoration, these two starting points can be described as ‘ecological reconstruction’, where land use is changed to forest, in this case through planting, and ‘ecological rehabilitation’, where the restoration efforts are intended to guide natural regeneration through management interventions to promote desired species, composition, processes and structures (Hahn et al., 2005; Stanturf et al., 2012, 2014a, 2014b).
4.1 Aristotle’s four causes as a framework for forest edge development
Aristotle (350a;b BC) described four types of causes which have long been influential on the scientific discourse, but also debated and criticised (as is basically all philosophy and science), often for their “shortcomings” concerning “the final cause” (Falcon, 2015). However, when viewed as four ways of interpretation (Falcon, 2015), the four causes can be used as a framework for understanding and explaining forest edge development, since they touch on both natural explanations and human action/artistic production (here perceived in its widest sense). A classic example is the production of a

36
bronze statue, which is comparable to the active development of a forest edge in terms of: The material cause: the bronze of the statue or the species growing in the
forest edge The formal cause: the shape of the statue or the form/structure of the forest
edge The efficient cause: the art of casting the statue or assembly and succession
of the forest edge (in relation to design and management) The final cause: portraying the subject of the statue and of the forest edge…
From a ‘pure’ positivistic perspective, the forest edge has no final cause and the species in the forest edges have no wish or will to promote certain ecosystem functions or services. These are causes that we seek as humans, or models for understanding and explaining how to achieve this. Interpreting forest edge development therefore has to be viewed in light of the end goal, whether it being nature conservation, aesthetics or supporting pollination.
Assuming that functions (i.e. final cause) of the forest edge are given by its species composition (material cause) and structure (formal cause), the art of developing forest edges is hence about ‘mastering’ assembly and succession in relation to species, structures and management goals. At planting, one of the major filters for the initial species composition is the actual designer. Based on different criteria, suitable species are chosen and spatially assembled. Such design decisions are preferably informed by knowledge concerning natural filtering processes in the assembly of vegetation. When working with ‘ecological rehabilitation’, understanding the filters for species assembly is equally important for managerial decision making. The development of the species composition and vegetation structure starts from its initial stage and can be steered by manipulating the interactions between different species. For this, managers need suitable management systems. In Papers I and II in this thesis, the emphasis is therefore on understanding assembly and dynamics in the early succession of planted and naturally regenerated forest edges to provide an empirically substantiated base for conceptualisation of design and management concepts for graded forest edges (Papers III and IV).
The first starting point for the research was the experimental forest called Alnarps Västerskog, in southern Sweden, which was established through planting on former agricultural land in 1994. The second starting point was a situation where the forest edge had been newly cleared and the regrowth had to be managed. This work focused on the railway line Södra stambanan (hereafter Southern Main Line) between Stockholm and Malmö, which widened its management corridor on a single occasion in 2008. Besides

37
exemplifying two different starting points, each of the selected settings provided additional aspects of methodological relevance. Alnarps Västerskog provided the possibility to explore the vegetation dynamics over time (up to 20 years), together with different aspects of planting design. Southern Main Line, on the other hand, provided possibilities to assess the influence of long complex environmental gradients and landscape context. As a commonality, both starting points addressed the development of forest edges in an early succession stage with a stationary (fixed) position in the landscape. Both starting points were studied in the field to provide an empirically substantiated base (Papers I and II) for conceptualisation of management systems (Papers III and IV), which were then implemented in three full-scale field trials to enable future empirical evaluation. Following the reasoning of Peirce (1868a, 1868b, 1869, 1877) and the interpretation of this by Douven (2011), in simplified terms abduction was used for selecting starting points. An inductive approach was used in Papers I and II, followed by abductive conceptualisation of the management concept and induction of its properties in Papers III and IV. Finally, establishment of controlled field trials allow for future more deductive, hypothesis-testing research.

38

39
5 Starting points, field studies and conceptualisation
A schematic overview of the relations between objectives, data collection and analytical approaches is provided in Table 1. The effect of planting design on forest edge structure, species composition and spontaneous woody vegetation (Objective A) was assessed in Alnarps Västerskog using different univariate analysis of field inventory data from 2010 together with background data from 1994 (Paper I). The results from these analysis informed the conceptualization and evaluation of the initial effects of a management system (objective C) termed Zoned Selective Coppice (ZSC) using simulations of the field inventory data from 2010 and data from an additional field inventory in 2013 (Paper III). These are presented as one of the trials established within the thesis work (Chapter 6). Decisive environmental characteristic at different spatial scales for woody species assembly of forest edges (objective B) were identified from field inventory data along SML in 2011 using multivariate statistics (Paper II). The decisive environmental characteristics were then used to support the clustering of the SML data from 2011, and subsequently conceptualization of Functional Species Control (FSC) as a management system (objective C) and its relations to the different regrowth types identified (Paper IV). In the following an extensive description of the individual papers and their interrelationships is provided.

40
Table 1. Overview of how the studies are related concerning objectives, data and methods
Paper I III II IV
Starting point Alnarps Västerskog
Southern Main Line
Type of starting point planted/designed natural regeneration
Main Empirical background study X X (x)
Main Conceptualization of management concept
ZSC FSC
Simulations of management concept
X
Conceptualization of planting design concept
X
Data
AVS planting data 1994 x x
AVS edge section inventories 2010 x x
AVS edge section inventories 2013 x
AVS transect inventories 2010 x
SML Presence-Absence x
SML Subplot level 1 (NMC) x x
SML Subplot level 2 (NMC) x x
SML Subplot level 3 (NMC/Stand) x
SML Data Subplot level 4 (Stand) x x
SML Data Subplot level 5 (Stand) x x
Main responses
Species composition x x
Individual species x x x
Vegetation structure x x x
Explanatory Environmental characteristics
Only as background information x x
Soil characteristics x Selected
Stand structure characteristics x Selected
Climate characteristics x Selected
Landscape characteristics x Selected
Main Statistical Methods
GLMM related to edge effects x x
GLMM of individual species x
Paired tests x

41
Paper I III II IV Regression x
Ripley´s point pattern x
3D graphs x
Diversity curves x
Ordination x
Variation partioning x
Clustering x
Heatmaps x
Multivariate regression Tree x
Interpretational ´Trait` data
Dispersal type x x
Seed weight x x
Insect pollination x
Growth-form x x
Height x x
Shade tolerance x x
Drought tolerance x
Waterlogging tolerance x
Thorns x x
Sprouting x
5.1 Alnarps Västerskog - Starting point for ecological reconstruction through planting
Alnarps Västerskog (AVS), where the research described in Papers I and III was conducted, is part of the Alnarp Landscape Laboratory. The AVS is a 9-ha rectangular experimental forest surrounding a north-south watercourse of 1 km with three ponds. Towards the east, it borders directly on the Swedish University of Agriculture Alnarp campus, on the west coast of southern Sweden, with its nineteenth century campus and park containing extensive dendrology collections. Arable fields separate AVS from the coastline vegetation to the west, while ornamental tree rows, green spaces and shelterbelt plantations in urban areas border it to the south and north. The local climate is sub-oceanic, with prevailing winds from the coast in the west. Mean annual precipitation is 535 mm and mean annual temperature 7.7 °C. The soil belongs to the Cambisols, with a loamy glacial till overlaid by fine sand deposits, and

42
has a long record of agricultural use prior to afforestation. The average pH (7.1) and average soil nitrogen concentration (0.005 mg g-1 dry weight) are homogeneous across the study site (Bubi, 2009).
In 1993, afforestation of AVS was initiated to create a multidisciplinary research, demonstration and teaching platform by piping the watercourse and constructing the three ponds. In spring 1994, the forest and edges were planted with 1- to 2-year-old seedlings and cuttings (e.g. Salix caprea) at a spacing of 1.5 m x 1.5 m. To reduce competition from weeds, the stand and edge plantings were mechanically weeded during the three first growing seasons. The whole AVS areas was fenced off for its first five seasons to reduce wildlife browsing. In 1998, the open areas bordering the forest edges were sown with a meadow mixture.
Alnarps Västerskog contains 32 different stand types and 32 edge sections of at least 45 m length. The edge sections represent three overall typologies, referred to here as:
1. Shrub edge: i.e. edge plantings only containing shrub and shrub-tree species, all of which are deciduous in this case.
2. Mosaic edge: i.e. edge plantings containing a mixture of deciduous tree and shrub species.
3. Tree edges: i.e. no edge planting along the perimeter of the stands, resulting in very abrupt edges.
The edge typologies of shrub edges and mosaic edges were replicated with the following design elements: (i) narrow (three planting rows) and wide (six planting rows) edge sections; (ii) intimate species mixtures and single species groups of light-demanding, lower-growing shrubs in the two outermost planting rows; and (iii) an orientation facing a ‘warm’ exposed aspect (west and south) and ‘cool’ unexposed aspects (east and north). The tree edges (i.e. no edge planting) were implemented as borders of stands with different stand mixtures. No thinning or other management of the edges had taken place before the inventories for the present thesis in autumn 2010 and 2013, but the meadows had received one annual cut and the adjacent stands had been thinned once or twice, depending on the species.
43
5.1.1 Objectives for studies in Alnarps Västerskog
The objectives were to evaluate how time and the design elements of width, mixture, exposure, edge typology and planting row had affected:
Vertical and horizontal edge structure (I) Growth patterns and survival of individual species and species groups (I) Abundance, composition and spatial distribution of spontaneous woody
vegetation (I)
And based on this conceptualize: Planting design guidelines for species rich, graded forest edges (I) Management system for the development and upholding of species rich
graded forest edges (III)
5.1.2 Summary of data collection in Alnarps Västerskog
In 2010, all planted species in the shrub and mosaic forest edge sections, as well as all spontaneous seedlings of a size where the crown interacted with the crown of planted specimens, were measured to determine height, crown width, crown depth and position in the edge. In the tree, mosaic and shrub edges, the spontaneous vegetation was sampled using three randomly stratified transects per edge section. Each section was 16.5 m long and perpendicular to the edge, consisting of 11 adjoining cells of 1.5 m x 1.0 m. Three cells were located in the meadow, meaning that the outer planting row was always at the intersection between cells 3 and 4. For each cell, the numbers of seedlings and suckers per species were counted.
In 2013, all the shrub and mosaic edge sections were re-inventoried except for one section that had undergone management. Height, survival and circumference at the root neck were measured for all planted species and all spontaneous seedlings of a size where the crown interacted with the planted specimens. For single-stemmed individuals, branching above 1.3 m diameter at breast height (DBH) was also measured. The decision to change measurement of the horizontal aspect from crown area in 2010 to root neck in 2013 was because the dense and thorny vegetation made crown diameter measurements hazardous and extremely time-consuming. Pearson correlation coefficient (Pearson’s r) calculations showed that the two measurements of the horizontal aspects were strongly interlinked.
44
5.2 Overview of data analysis for Alnarps Västerskog
Overall, the aim of the studies in AVS was to investigate how the planted forest edges and their woody species had developed in relation to time (succession) and the different design elements of planting row, exposure, width, mixture and typology. The time aspects were analysed as the change from what was planted in 1994 to the observations from the inventories of 2010. These observations were dependent on what was planted in 1994, so the comparisons were performed pair-wise using blocking, both for the edge sections as a whole (i.e. edge section 20 in 1994 against edge section 20 in 2010) and for individual species (i.e. Corylus avellana in edge section 20 in 1994 against Corylus avellana in edge section 20 in 2010). Because of the limited number and loss of replicates of the design elements, the different edges were compared in pairs where only one design element differed between the two edges in a pair, i.e. a type of blocking was used. For this, a separate blocking strategy was established for each design element, where each block was intended to capture most of the variation created by the other design elements.
Owing to lack of suitable volume and biomass equations for shrub species, the comparisons for the individual species were performed using crown area for the horizontal aspect, height for the vertical aspect and the number of individuals for survival. To compare the edges as a whole within the blocking strategy, Shannon evenness index (adopted from Shannon & Weaver, 1962) normalised in relation to total species number was used as the univariate response, since it is not affected by some edges being wider and having more species planted. To get a simple indication of how prone the different edges are to developing a graded profile, a mixed general linear model with height as response and design elements and row placement as explanatory variables was used together with the blocking strategy.
The planting design can influence the planted species but also the spontaneous vegetation; an important aspect in development of forest edges in relation to eventual management actions. Knowledge of the initial species composition and regular planting in rows made it possible to identify all larger spontaneous species (i.e. those large enough to compete for crown space with the planted species). Identifying all spontaneous small seedlings and root suckers for the whole edge section was not practically possible and therefore transects were used instead for this. To obtain an overview of which species arrive early or late in the succession of the planted forest edge, the large spontaneous species were compared with the smaller spontaneous species from the transects. To take into account the different sampling methods, the relative

45
proportions of different dispersal groups were compared using multiple Chi-square independence tests.
Earlier studies have found that edge exposure and edge typology can change recruitment and dispersal patterns (e.g. Brothers & Springarn, 1992; Sarlöv-Herlin & Fry, 2000). Therefore a comparison of the spontaneous vegetation divided into dispersal groups across the edge sections was performed using a split-plot model to avoid pseudo replicates, as transects are nested within the edge section (Quinn & Keough, 2002). An expanded blocking strategy was also used, to make it possible to explore the differences between planted and non-planted edges, i.e. tree edges.
To aid the interpretation and presentation of the results, post hoc grouping of the results was performed in relation to the species strategies34 and/or traits of growth form, shade tolerance and dispersal.
In summary, the analysis compared the change over time in planted species and the whole edge at AVS using non-parametric tests. To explore the effect of different design elements, an explorative blocking strategy was established to minimise the effect of the other design elements, which was deemed necessary due to the skewed original trial design and lack of replicates. The individual species development and edge profile were analysed using mixed general linear models. Species strategy concerning growth form, shade tolerance and dispersal strategy was employed as a way of grouping spontaneous vegetation for comparisons, and as a post hoc analysis tool to reveal patterns between different species groups/strategies. Differences in large established spontaneous seedlings for species groups were compared by Chi-square independence test. The spontaneous vegetation group (wind/endochory) in relation to the design elements and spatial edge position (edge effect) was analysed using general linear split-plot models.
5.2.1 Summary of results from Alnarps Västerskog
Single species grouping, with low-growing, light-demanding shrub species in the outer rows and hence more high-growing and shade-tolerant species further into the edge, gave a more graded edge profile. The greatest changes in evenness occurred at the horizontal aspect, i.e. competition in the horizontal aspect, gave rise to the largest change in dominance among species. The only design aspect that displayed a trend for influencing evenness was exposure of the edges, with a trend for less dominance shifts among the planted species. Among the individual species, the more light-demanding shrub species showed
34. Plant strategy: The adaptation of species to cope more or less with stress, disturbance and
competition in their established and regenerative phases. In accordance with Grime et al. (2007), in this thesis plant/species strategy is considered to be synonymous with functional type.
46
poor development and the shade-tolerant shrub species had developed well. In contrast, the light-demanding tree species seemed to develop better than the more shade-tolerance tree species. The most influence design element for the individual species was the planting row, especially for species with ‘thorns’ (i.e. thorns, prickles and spines). The most common spontaneous seedlings were those whose main dispersal mechanism was by birds (endochory). There was a greater amount of larger pioneer wind-dispersed species and a very low amount of seedlings for this dispersal group, indicating that the window for this species group establishing closes as the forest edge matures. Furthermore, the amount of wind-dispersed seedlings was clearly lower in the shrub edges without larger trees. The number of bird-dispersed seedlings was supported by the plantation of specific edge mixtures compared with simple tree edges, and this effect was larger in the wider forest edge plantings with six rows.
5.2.2 Conceptualising planting design based on Alnarps Västerskog studies
The design element with the greatest impact on most species was the location along the edge cross-section (i.e. in which planting row). Therefore focusing the planting design towards this is key, since it also relates to amount of available light and space, which is closely related to growth form and shade tolerance. Concentration of low-growing shrubs in the front part of the edges also gave a more graded forest edge profile. The diverging development patterns of trees and shrubs in relation to shade tolerance shows that the possibility to affect their interactions is another key aspect of planting design. The finding that the greatest dominance change was the horizontal aspects reinforced the importance of controlling deliberate placement of species across the planting rows. Therefore, to achieve species-rich, graded forest edges, assembly of species should preferably be done by creating specific mixtures for different rows or cohorts of rows along the edge cross-section based on growth form and shade tolerance.
5.2.3 Conceptualising management concept based on Alnarps Västerskog studies
Since the distribution of species across the forest edge section in relation to growth form and shade tolerance is a central aspect for the development of a graded forest edge profile, a management system that supports and upholds such a distribution is vital. In the long run, the management concept should therefore promote a gradient of more low-growing, light-demanding shrubs in the outer parts to more high-growing and shade-tolerant species in the interior. As pointed out earlier, such gradients of different growth forms and species are normally found in relation to changes in environmental gradients (Gustavsson,

47
1986; Lloyd et al., 2000), repeated low-intensity disturbance such as light grazing (Gustavsson, 1986; Fry & Sarlöv-Herlin, 1997) or advance of the edge (Dierschke, 1974; Ranney et al., 1981). Therefore incorporating a gradient aspect within the management system is central. Zoned cutting at different intervals (Ferris & Carter, 2000) supports a gradient of successional stages along the edge cross-section, but as all species are cut there is no possibility to promote different species groups more actively.
Furthermore, full clearing and non-selective coppicing are often perceived as visually negative, especially in urban contexts (Ribe, 1989; Rydberg, 2000) and can be expected to increase the edge effect into the stand. Rydberg (2000) devised a selective coppicing system especially for urban areas using a threshold height to avoid full clearing and trees growing too large. Supported by his results and theories on stand structure and disturbance presented by Oliver & Larson (1996), Rydberg (2000) concluded that repeated selective coppicing favours more shade-tolerant species over time. This also corresponds to the historic diameter at breast height based (DBH-based) selective coppicing system in Italy (Coppini & Hermanin, 2007), which utilises the shade-tolerant tree Fagus sylvatica. Depending on the threshold height, it is possible to control the amount of residual individuals left and hence also whether more shade-tolerant or more light-demanding species are favoured. Using a threshold height during repeated cycles also promotes more low-growing species, since they are generally below the threshold height. When repeatedly applying a threshold height that increases when moving inwards through the edge a gradient of height and shade tolerance will be developed. Since the change in threshold height would also create an initial gradient in thinning strength, this would promote more light-demanding species in the outer parts and more shade-tolerant species in the interior zone. Through repeated cuttings, fast-growing tree species can also be generally disadvantaged, since they will reach the threshold height faster than other growth types.
This management approach is conceptualized as Zoned Selective Coppice (ZSC). Such zones should preferably correspond to a given number of planting rows, or the width of the cuttings strips used for motorised brush-saws in pre-commercial thinning. The ‘selective coppicing’ part refers to selective cutting based on a threshold height and acknowledges the approach of Rydberg (2000), as well as the important aspect that the sprouting capacity of the species cut is essential and will affect the behaviour of the system (e.g. Giovannini et al., 1992), and should be utilised to support consistent upkeep of a forest edge structure and the functions to which it gives rise.
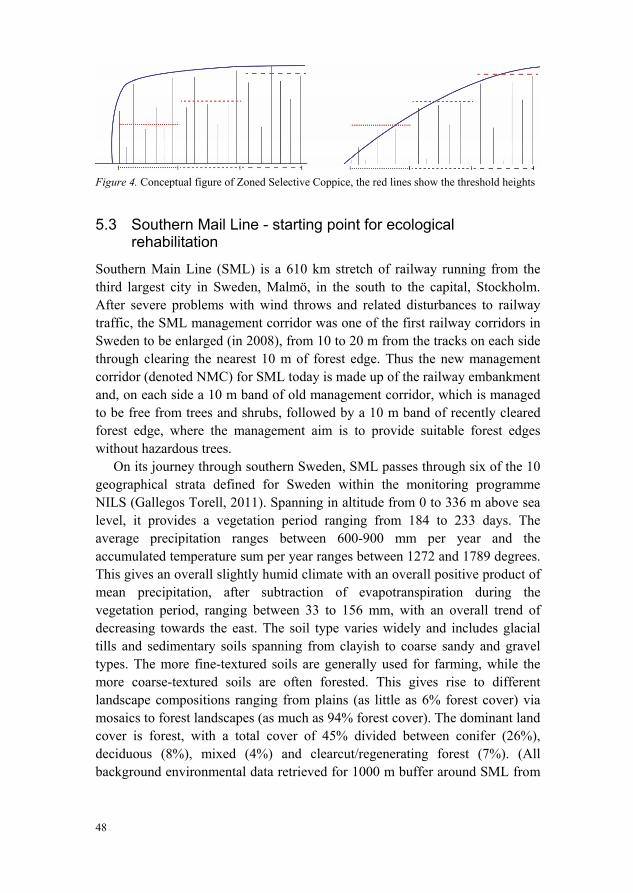
48
Figure 4. Conceptual figure of Zoned Selective Coppice, the red lines show the threshold heights
5.3 Southern Mail Line - starting point for ecological rehabilitation
Southern Main Line (SML) is a 610 km stretch of railway running from the third largest city in Sweden, Malmö, in the south to the capital, Stockholm. After severe problems with wind throws and related disturbances to railway traffic, the SML management corridor was one of the first railway corridors in Sweden to be enlarged (in 2008), from 10 to 20 m from the tracks on each side through clearing the nearest 10 m of forest edge. Thus the new management corridor (denoted NMC) for SML today is made up of the railway embankment and, on each side a 10 m band of old management corridor, which is managed to be free from trees and shrubs, followed by a 10 m band of recently cleared forest edge, where the management aim is to provide suitable forest edges without hazardous trees.
On its journey through southern Sweden, SML passes through six of the 10 geographical strata defined for Sweden within the monitoring programme NILS (Gallegos Torell, 2011). Spanning in altitude from 0 to 336 m above sea level, it provides a vegetation period ranging from 184 to 233 days. The average precipitation ranges between 600-900 mm per year and the accumulated temperature sum per year ranges between 1272 and 1789 degrees. This gives an overall slightly humid climate with an overall positive product of mean precipitation, after subtraction of evapotranspiration during the vegetation period, ranging between 33 to 156 mm, with an overall trend of decreasing towards the east. The soil type varies widely and includes glacial tills and sedimentary soils spanning from clayish to coarse sandy and gravel types. The more fine-textured soils are generally used for farming, while the more coarse-textured soils are often forested. This gives rise to different landscape compositions ranging from plains (as little as 6% forest cover) via mosaics to forest landscapes (as much as 94% forest cover). The dominant land cover is forest, with a total cover of 45% divided between conifer (26%), deciduous (8%), mixed (4%) and clearcut/regenerating forest (7%). (All background environmental data retrieved for 1000 m buffer around SML from

49
national GIS data (© Lantmäteriet i2014/00764, ©Naturvårdsverket, i2014/764; © SMHI i2014/00764)
5.3.1 Objectives of studies along Southern Main Line
To identify environmental variables that are decisive for the composition of woody species of forest edges along Southern Main Line (II)
To assess the relative importance of soil, climate, vegetation and landscape structure characteristics for the woody species composition of forest edges along Southern Main Line (II)
To identify associations between the environmental characteristics identified and traits of woody species in forest edges along Southern Main Line (II)
To classify the regrowth with respect to woody species composition (IV) To identify the most influential environmental characteristics for classifying
and predicting the woody species composition into regrowth types (IV) To identify ‘indicator’ species for the different regrowth types (IV) To compare vegetation structure between regrowth types (IV) To assess management possibilities to promote and control the species
composition of the new management corridor in a direction promoting the development of graded forest edge profiles (IV)
5.3.2 Summary of data collection along Southern Mail Line
The field inventory of SML was conducted in autumn 2011, when 78 sites located through spatial stratified random sampling (i.e. sampling from subsets of 7 stands at a time) were inventoried. At each site, a plot of 35 m x 20 m was established so that half of it covered the new management corridor (‘NMC zone’, 10 x 35 m) and the other half the bordering forest stand (‘Stand zone’, 10 m x 35 m). For each zone, the presence or absence of all woody species was recorded. Within the plot, four transects 10 m apart were located perpendicular to the railway. In each transect, five circular subplots were placed with their centres 4.5 m apart. Subplot levels 1 and 2 were hence in the NMC zone, 4 and 5 in the Stand zone, and subplot 3 on the border between the two zones. This gave a total of 20 subplots per site. In each subplot, vegetation was sampled at three levels: a) within a 0.5 m radius, species and number of woody plants <1 m height were counted; b) within a 1 m radius species, height and number of woody plants ≥1 but ≤5 m height were counted; and c) within a radius of 2 m, circumference at breast height (CBH) was measured for all specimens >5 m. In practice, this meant that level (c) was only measured in subplots 3-5. Furthermore, for level (b) the mean field layer height was measured and field
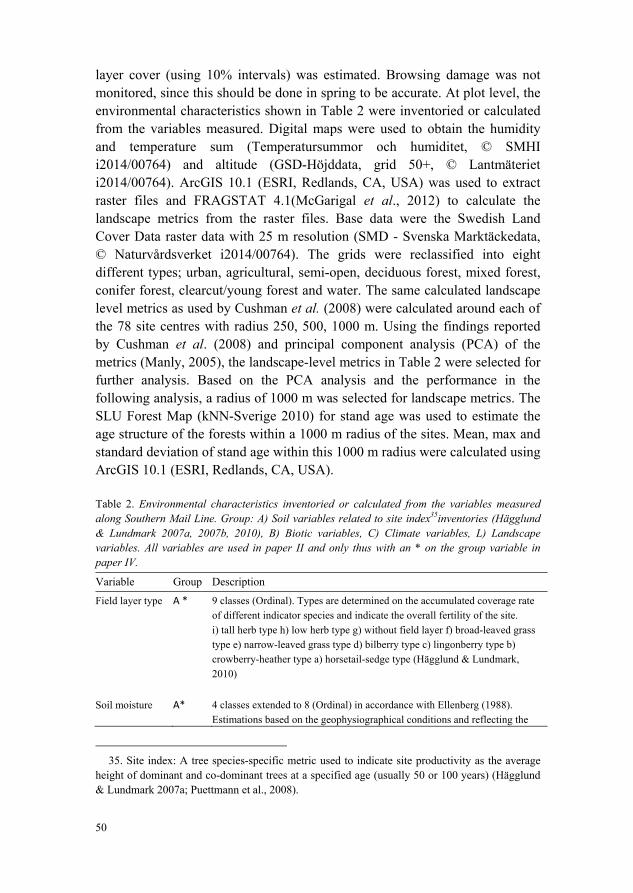
50
layer cover (using 10% intervals) was estimated. Browsing damage was not monitored, since this should be done in spring to be accurate. At plot level, the environmental characteristics shown in Table 2 were inventoried or calculated from the variables measured. Digital maps were used to obtain the humidity and temperature sum (Temperatursummor och humiditet, © SMHI i2014/00764) and altitude (GSD-Höjddata, grid 50+, © Lantmäteriet i2014/00764). ArcGIS 10.1 (ESRI, Redlands, CA, USA) was used to extract raster files and FRAGSTAT 4.1(McGarigal et al., 2012) to calculate the landscape metrics from the raster files. Base data were the Swedish Land Cover Data raster data with 25 m resolution (SMD - Svenska Marktäckedata, © Naturvårdsverket i2014/00764). The grids were reclassified into eight different types; urban, agricultural, semi-open, deciduous forest, mixed forest, conifer forest, clearcut/young forest and water. The same calculated landscape level metrics as used by Cushman et al. (2008) were calculated around each of the 78 site centres with radius 250, 500, 1000 m. Using the findings reported by Cushman et al. (2008) and principal component analysis (PCA) of the metrics (Manly, 2005), the landscape-level metrics in Table 2 were selected for further analysis. Based on the PCA analysis and the performance in the following analysis, a radius of 1000 m was selected for landscape metrics. The SLU Forest Map (kNN-Sverige 2010) for stand age was used to estimate the age structure of the forests within a 1000 m radius of the sites. Mean, max and standard deviation of stand age within this 1000 m radius were calculated using ArcGIS 10.1 (ESRI, Redlands, CA, USA).
Table 2. Environmental characteristics inventoried or calculated from the variables measured along Southern Mail Line. Group: A) Soil variables related to site index35inventories (Hägglund & Lundmark 2007a, 2007b, 2010), B) Biotic variables, C) Climate variables, L) Landscape variables. All variables are used in paper II and only thus with an * on the group variable in paper IV.
Variable Group Description
Field layer type A * 9 classes (Ordinal). Types are determined on the accumulated coverage rate of different indicator species and indicate the overall fertility of the site. i) tall herb type h) low herb type g) without field layer f) broad-leaved grass type e) narrow-leaved grass type d) bilberry type c) lingonberry type b) crowberry-heather type a) horsetail-sedge type (Hägglund & Lundmark, 2010)
Soil moisture A* 4 classes extended to 8 (Ordinal) in accordance with Ellenberg (1988).
Estimations based on the geophysiographical conditions and reflecting the
35. Site index: A tree species-specific metric used to indicate site productivity as the average
height of dominant and co-dominant trees at a specified age (usually 50 or 100 years) (Hägglund & Lundmark 2007a; Puettmann et al., 2008).

51
Variable Group Description
average distance from the groundwater to the ground surface during the growing season. a)dry b) slightly dry c) damp d) slightly moist e) moist f) slightly wet g) wet h) very wet
Organic soil type
A 2 classes: If 30 cm or deeper peat layer
Soil depth A 2 classes (Ordinal). Extensive >70 cm or Rather shallow 70-20 cm
Subsurface water
A 3 classes (Ordinal). Probability of subsurface water flow based on estimations from topography and slope length:
a) Missing/rare b) Shorter periods, c) Longer periods
Spaghnum locality
A (Binary) No organic soil types with a greater cover than 1/8 of Sphagnum and Polytrichum commune Hedw. mosses.
Soil texture A 7 classes (Ordinal). Textural conditions were determined from a central plot sample from the mineral soil (50 cm depth) using standard field methods from Lundin et al. (2002). a) Gravel/gravelly till b) coarse sand/sandy till c) sand/sandy silty till d) fine sand/silty sandy till e) coarse silt/coarse silty till f) fine silt/fine silty till g) clay/clayish till
Canopy Cover B* Estimated canopy cover within the stand plot, intervals of 5%.
Edge Height B Average height of the new forest edge.
Dripline B* Average canopy dripline of the new forest edge
CBH_Mean B Mean circumference at breast height
CBH_SEM B Standard error of mean circumference at breast height
CBH_StDev B Standard deviation for circumference at breast height
CBH_Var B Variance for circumference at breast height
CBH_CV B* Coefficient of variance for circumference at breast height
CBH_Max B Maximum value of circumference at breast height
CBH_Nr B Numbers of trunks
Slope C Average slope of the location measured perpendicular to the new forest edge
Humidity C* Product of mean precipitation less evapotranspiration during the growing season.
Tempsum C Sum of all daily mean temperatures above 5 degrees Celsius during the growing season
Altitude C* Metres above sea level
Exposed C 2 classes. ‘Warm’ edges with a south or west aspect are ‘exposed’, while ‘cooler’ edges with a north or east aspect are ‘unexposed’
Age_Max L Maximum forest age in the landscape based on the SLU Forest Map
Age_Mean L Mean age of the forest age in the landscape based on the SLU Forest Map
AgeStDev L* Standard deviation of the forest age in the landscape based on the SLU Forest Map
LPI L Largest patch index
AREA_CV L Patch size coefficient of variation

52
Variable Group Description
GYRATE_MN L Mean radius of gyration
SHAPE_MN L* Mean shape index
SHAPE_CV L Shape index coefficient of variation
PARA_MN L Mean perimeter-area ratio
PARA_CV L Perimeter-area ratio coefficient of variation
CAI_MN L Mean core area index
PROX_MN L Mean proximity index
PROX_AM L Area–weighted mean proximity index
ENN_MN L Mean nearest neighbour distance
ENN_AM L Area–weighted mean nearest neighbour distance
ENN_CV L Nearest neighbour distance coefficient of variation
TECI L* Total edge contrast index
PLADJ L Proportion of like adjacencies
IJI L Interspersion/juxtaposition index
PRD L Patch richness density
SIEI L Simpson’s patch evenness
5.3.3 Overview of data analysis for Southern Mail Line
Paper II explored environmental characteristics at site and landscape level influence on the woody community species composition (i.e. the collection of species together in the forest edge that should be managed). As management and wildlife will also affect the species present, it is of interest to compare different aspects of species composition. Thus it is not only the dominant36 species that is of interest in all management objectives, although they might all be related to the same environmental gradients. For managers and planners, these gradients should preferably be represented/indicated by some easily obtained environmental characteristics that can be grouped to main aspects, such as soil conditions, vegetation structure, climate or surrounding landscape. Understanding the relative importance of such environmental groups (i.e. soil variables in relation to landscape structure) can guide management and planning actions. Following this reasoning, the environmental characteristics were grouped into four environmental groups: soil, vegetation structure, climate and landscape structure.
For future prediction and recommendations on vegetation development, it is also useful to understand how the overall species strategies related to the environmental gradients. Species composition changes with succession and
36. Dominants: Species with a high dominance (major status) in the community at a given time (Grime, 2001).

53
therefore the young successional stage of regrowth in the new management corridor and the older stage of the stand were analysed separately. Following this reasoning, different ways of weighting the species in the community for the two different successional stages were applied
Relations between communities and gradients for noisy vegetation data can be explored using unconstrained and constrained ordination (e.g. ter Braak 1987). Simplified unconstrained ordination only tries to order the sites in as few dimensions as possible (axis), so that those sites with similar species composition are close to each other and those that are dissimilar are far apart. After ordination, it is possible to correlate different environmental variables to the ‘pattern of the ordination’ (Leps & Šmilauer, 2003). To test specific environmental variables, constrained ordination is preferable (Leps & Šmilauer, 2007; ter Braak & Šmilauer, 2015). In simplified terms, the ordination, i.e. ordering, of sites is constrained along the gradients (axis) of the environmental variables using a multiple regression approach. The more variables included, the less constrained the ordination becomes (Palmer, 2015). Including more than a handful of environmental variables essentially gives a type of unconstrained ordination. It is also possible to include co-variables to remove the influence of an aspect of interest (e.g. to control if some variables are strongly correlated) in constrained ordination (Borcard et al., 2011). This is referred to as partial constrained ordination. Using multiple partial constrained ordination, it is possible to divide, i.e. partition out, the explained variation of single constrained ordinations, so-called variation partioning (Økland & Eilertsen, 1994; Peres-Neto et al., 2006). This is usually illustrated by a Venn diagram where explained variation is represented by individual and shared areas in the diagram. As an interpretation and control tool, the environmental gradients defined can then be explored in relation to the average trait composition of each site using constrained ordination, e.g. to see if the ratio of zoochory (animal-dispersed species) is related to altitude or another environmental variable (Kleyer et al., 2012).
Commonly used unconstrained ordination methods for species data are correspondence analysis (CA), detrended correspondence analysis (DCA) and non-metric multidimensional scaling (NMDS) (von Wehrden et al., 2009). Some authors state that NMDS should be the shotgun option (e.g. Minchin, 1987), but others point out that it might have problems with long gradients (Hirst & Jackson, 2007) and that it misses well-developed constrained and partially constrained options (ter Braak & Šmilauer, 2015). Correspondence analysis can suffer from what is termed an ‘arch’ effect, which led to the development of DCA to resolve this, but in a rather coarse way (Borcard et al., 2011). However, Jackson (1993) argues that CA is a robust method for field

54
data and in relation to data standardisations. Testing both can therefore be wise. Compared with DCA and NMDS, CA has a well-developed and tested constrained and partial constrained option, CCA, which also to a large extent resolves the arch effect problem with CA (Palmer, 1993, 2015). However, some others (not ter Braak and Šmilauer, 2015) claim that redundancy analysis (RDA) with suitable transformation (Legendre & Gallagher, 2001) is a better option than CCA for constrained ordination, partly because variance partitioning with CCA is troublesome (Peres-Neto et al., 2006). Given these diverging opinions, reflecting the complexity of multivariate data (Manly, 2005), applying the different methods in parallel and comparing whether they give similar results has been deemed preferable and such an approach is advocated for multivariate analysis and its results by e.g. Austin (1985) and Dufrene & Legendre (1997).
Based on this, determining and exploring the relationship between species composition and environmental gradients was carried out in Paper II using multiple ordination methods to ensure that each method’s possible pitfalls did not dominate. This led to the following analytical approach (as illustrated in Figure 5): 1) Species matrixes representing different succession stages with different weights in relation to measurement of dominant, subordinate37 and rare species were assembled. 2) The environmental characteristics of interest were divided into groups reflecting certain aspects of forest edge assembly (e.g. climate and landscape structure). 3) Unconstrained ordination was used to find a handful of environmental variables for each group that could be tested in constrained ordination. 4) Based on constrained ordination, together with partial constrained ordination to explore correlations between environmental variables, the ‘most parsimonious’ constrained ordination for each group was derived from the variables selected in step 3. 5) The relative importance of each group’s constrained ordination was then compared in relation to each other using variation partitioning, graphically illustrated by Venn diagrams. 6) Finally, as an interpretation and control, each environmental group’s gradients were compared with the average species traits of the sites using constrained ordination.
37. Subordinates: Species with a minor status in the community, i.e. they are subordinate to the
dominant species that constitute the majority of the biomass. Subordinate although not quite dominant can have widespread occurrence (Grime, 2001).

55
Figure 5. Analytical approach for Paper II
In summary, for the NMC zone and Stand zone, respectively three different species matrices were assembled giving more weight to rare species and transient species (denoted binary), subordinate species (denoted 1 to 8) and

56
dominant species denoted (stems/CBH). For the binary matrix, this was done using the presence/absence for the zones. Matrices 1 to 8 were based on number of presences/absences in subplots 1-2 (NMC zone) and 4-5 (stand zone). The matrix giving most weight to dominance was calculated for the NMC zone based on the number of stems in subplots 1-2 and for the Stand zone on the CBH in subplots 4-5. Each species matrix was analysed separately in multiple steps using different methods of unconstrained, constrained and partial constrained ordination to select the ‘best set’ of environmental characteristics for four variable groups: soil variables, vegetation structure, climate and landscape structure. Variation explained by these four groups in relation to each other was extracted and visualised using Venn diagrams. To provide verification and a better understanding of the environmental characteristics selected, they were analysed using constrained ordination in relation to the community-weighted means of the traits matrix calculated for each species matrix.
Having a better overview of the relationship between species composition and their traits and environmental characteristics from paper (II), the next step was to operationalise this further towards management practice and specific management goals in Paper IV. Although the concept of gradients is sound for explaining species composition, planners, managers and decision makers often prefer clearly defined groups and management alternatives. In relation to this, there is a need for defined management concepts that can be assessed for these groups. This management concept has to have an appropriate information level, i.e. it has to be easy to apply in the practical situation and still target the process and elements of interest for the management aims. Papers I and II showed that dominance of tree species is problematic for the development of graded forest edges. By grouping (clustering) the sites along Southern Main Line and graphically displaying their relation to the species, it was possible to identify whether some few tree species are dominating the different clusters. In the same way, the subordinate species with the potential to become the building block species for more graded forest edge structures in the future were analysed.
The species matrices used for that analysis were weighted to dominance of species at the site level. The grouping/clustering of sites was performed using hierarchical clustering, since it relates more to the concept of gradients than non-hierarchical clustering. This gives a dendrogram representing a hierarchy of how similar/dissimilar the different sites are to each other. As with the different ordination methods and their pros and cons in Paper II, there are also different methods of clustering (El-Hamdouchi & Willet, 1989; Borcard et al.,
57
2011). Therefore different hierarchical clustering methods were applied in Paper IV to gain insights into the data and also to assess which method gave the ‘best fit’ clustering. Taking any two sites and then moving up the branch of the clustering dendrogram from one of the sites to the first node branching down to the second site, the level of that node along the distance scale of the clustering is the cophentic distance. A matrix representing the cophentic distances among all pairs of objects can be created and its correlation compared with the original dissimilarity matrix, giving the cophentic correlation coefficient, where a higher correlation is preferred. It was used in this thesis work to compare the different clustering methods. One key question when using hierarchical clustering is how many clusters should be interpreted in the dendrogram. To assess this, silhouette widths were used (Rousseeuw, 1987).
Following clustering, it is possible to test the difference of the environmental variables related to the clustering, but this could be considered to violate some important independence assumptions (Borcard et al., 2011). Therefore, the clustering was guided by the environmental variables of interest in a multivariate regression tree. This is sometimes referred to as constrained clustering (Borcard et al., 2011). In contrast to the previously mentioned constrained ordination methods (Paper II) that focus on explanatory power, regression trees focus on prediction, which is often useful from a management and planning perspective (De´ath & Fabricius, 2000). In fact, a regression tree can rather easily be operationalised into a decision tree for management. In simplified terms, a multivariate regression tree can be seen as an iterative process that repeatedly split the sites into as homogeneous groups as possible, based on their values for the environmental variables included. This is repeated multiple times to find the best solution and then the regression tree is trimmed down to the number of branches that give the optimal trade-off between number of nodes, prediction and simplicity (De'ath, 2002; Borcard et al., 2011). Furthermore, the multivariate regression tree is a robust model for handling non-linear relationships or high-order interactions between the explanatory variables (De'ath, 2002).
Although using environmental characteristics to guide clustering might give less comprehensive clusters than ‘unconstrained clustering’ and the prediction power for noisy vegetation data is often low, it has the advantages of incorporating important information about the processes affecting the regrowth of the forest edge, e.g. important structural aspects of the regrowth. This was investigated and tested using the derived clusters from the multivariate regression tree as explanatory variables in modelling how structural aspects

58
change over the gradient of the forest edge regrowth (i.e. by using the different subplot levels as an extra explanatory variable).
In summary, the following analyses were performed in Paper IV: A species matrix giving weight to dominance was extracted separately for the NMC zone using subplots 1-3 and the number of stems, and for the Stand zone using subplots 3-5 and CBH measurements. To focus dominance to the individual site and not total site productivity over all sites, a Chord transformation (Borcard et al., 2011) was performed on both species matrices. To capture both early and late successional stages, the species matrices were analysed separately using four common hierarchical clustering methods, one more suitable for detecting gradients, one efficient in finding distinct groups, one intermediate between distinct groups and gradient detection, and one for creating very tightly bound clusters (El-Hamdouchi & Willet, 1989; Borcard et al., 2011). The most coherent of these four methods were selected based on cophentic correlation coefficient and the number of clusters was decided using silhouette widths.
To give a better overview, the clustering was combined with graphical representation through heat maps (R Core Team, 2013; Oksanen et al., 2013) and analysed concerning dominant tree species in the early successional stage of the NMC zone and later successional phase of the Stand zone. Six tree species were identified and simulated as cut with selective cuttings to evaluate the species composition without the dominant tree species using hierarchical clustering. Multivariate regression trees together with species indicator value calculations (Dufrene & Legendre, 1997) for the NMC zone were performed with the 10 environmental characteristics identified in the ordinations from Paper II as guiding variables. The groups from the regression tree were then used as explanatory variables together with the subplot levels (i.e. distance from the forest edge) in the modelling of structural aspects of the forest edges using mixed general linear models with a first order autoregressive (AR1) covariance structure. Mixed models were used since the subplots are nested within the site level and the AR1 covariance structure was used due to the spatial dependences between the subplot levels (Zuur et al., 2009).
5.3.4 Summary of results for starting point Southern Main Line
In total, 10 environmental characteristics from the four environmental groups were found in Paper II to influence the species composition of the NMC zone and the later successional stage of the Stand zone. It was possible to relate the different environmental characteristics post hoc to overall community traits, conforming their relevance and the interpretation of what ecological aspects they indicate. It was found that the aspects of site fertility (as indicated by field

59
layer type), soil moisture, forest edge profile, canopy stratification/complexity, and canopy cover were important at site level, while humidity, altitude, forest age continuity and shape and contrast of the edges were important at the landscape level. The relative importance of the different environmental aspects changed from the early successional stage of the new management corridor to the later stage in the stand. In the NMC zone, soil moisture, together with soil fertility as indicated by field layer type and the macro climate, played the most important role. In the older vegetation stage of the forest edge (i.e. the stand zone), however, the influence of stand structure and landscape structure increased. This indicates that forest edge assembly can be explained by dynamic hierarchical filtering with a change of influence over time from the site and abiotic aspects towards more biotic aspects and the landscape structure.
However in Paper IV, the community assembly could not be best represented by either a continuum or grouping approach when trying to define regrowth typologies for the management decisions, and therefore the regrowth typologies were determined in a crossover approach where the clustering was guided by the 10 environmental characteristics identified through the earlier ordinations in Paper II. A regrowth typology of five clusters was derived from the multivariate regression tree. The first split was based on soil moisture, dividing the regression tree into one moist-wet and one damp-dry branch. Soil fertility, as indicated by field layer type, gave the next branching, separating fertile and poorer field layer types. Last, within the drier-richer sites there was a further branching based on altitude. This confirms the results from the variation partitioning that these environmental characteristics are the most important in the early regrowth stage. The regrowth typology was also successfully related to the amplitude of a number of key structural characteristics (number of stems per subplot, maximum height of stems, number of seedlings, field layer cover and average field layer height) for the different sites, i.e. the regrowth typology captured aspects concerning the species composition and the structure to be managed.
5.3.5 Conceptualising of management concept based on Southern Main Line studies
In mature forests, selecting individual trees based on species, size and position for cutting is a task for the skilled woodsman or forester (Rackham, 2006). Moreover, individual selection among dense masses of hundreds of new stems in the regeneration of forests, as done in pre-commercial thinning, is not an easy task. In classical commercial forestry, this task is largely bypassed through focusing on favouring only a handful of commercial species and their

60
spacing. Everything else is removed. If the other shrubs and small tree species usually cleared away, i.e. the species that are the building blocks for a graded forest edge, are of interest, then forest workers would need to recognise at least 10 times more species. This would have to be done in sometimes harsh field conditions often without leaves and while operating a motorised brush-saw. Therefore there is a need to depart from the knowledge culture that already exists, i.e. targeting commercial common tree species, but from the opposite direction, so that they become the species that should all be removed, while everything else stays. The clustering analyses together with species heat maps showed that this was possible, since the dominant tree species could be targeted by focusing on only six tree species: Betula pendula, Betula pubescens, Populus tremula, Alnus glutinosa, Pinus sylvestris, Picea abies and Alnus glutinosa. The remaining tree species only occurred as subordinate or minority species, which indicates that overall, their crowns will be liberated if the dominant tree species are removed, which will support their wind stability (Mason, 2002). The complexity of the forest edges may also be increased, since the spatial cutting pattern in many cases will resemble variable density thinning (Puettmann & Tappeiner, 2014).
From the heat maps, it was also clear that there are generally other low-growing species present at most sites. However, the site specific amount of these building block species needed to develop graded forest edges, remains a question for the future. Nevertheless, the reduction of the dominant tree species will support “life-boating” (e.g. Puettmann & Tappeiner, 2014) of rare and minority species, which over time can have a positive effect on the dispersal of new building block species into the forest edges (Sarlöv-Herlin & Fry, 2000). This management concept developed in this thesis is called Functional Species Control. It is functional since it focuses on certain species and their functional aspects, i.e. growing tall and dominance, but also since it is functionally viable to apply in the field. The term ‘control’ is included since it is not likely that the targeted tree species will disappear or be eliminated from the system. Rather, in most cases they will prevail but the important aspect is to control them from dominating in order to promote more graded and diverse forest edges.
Figure 6. Conceptual figure of Functional Species Control, the red species are those that are cut.
61
6 Set up of field trials based on the studies
This chapter presents, describes and discusses the three field trials that have been developed and implemented for controlled, long-term testing of the planting design concepts and management systems developed during the course of the PhD research. This thesis examined the problem of how to create and maintain graded forest edges that are stationary. In doing so, it attempted to describe and identify the relations concerning the problem. Thus it did not try to falsify any hypothesis or theories, but rather construct them in the form of management/design concepts. These design and management concepts were then used as the basis for development of three controlled long-term trials enabling testing and further development. As such, the research described in the thesis does not draw a sharp line between theoretical and practical development (Dewey, 1938; Hookway, 2005).
As a part of this PhD-project three manipulated forest edge (development) trials were established. Although the vegetation dynamics of forest edges (which in many ways could be seen as a seral stage of forest succession) could be considered as having a shorter time frame than forests, they are still far beyond the scope of a PhD project and perhaps also the scope of a whole academic carrier. Faced with such limitations, the creation of controlled long-term experimental design and management trials that could provide the platform for future research was regarded as an important contribution. Not through published papers today but as the investment in research possibilities in the future. Other interesting approaches would be to utilize modelling, as advocated for forest management by Pretzsch (2009), but background data in the form of long time series measures, as well as equations and competition indices for shrub and shrub tree species, are lacking.
The common denominator for almost all silvicultural systems is that they use management operations to affect vegetation structure and species

62
composition. In general, more diverse and complex systems have proven to be more resilient 38 to novel environmental conditions and to have a higher adaptive capacity39 (Messier et al., 2015). However, it is not known what kind of diversity is desirable for specific functions in forest edges and how much is enough in relation to its resistance 40 and resilience. Management systems, on the other hand, are often more easily applied in practice if they are simple. The main idea behind the forest edge management and design concepts proposed in this thesis is therefore not to control all aspects of the system, since this could easily lead to the “pathology of command and control management in the natural resources” (Holling & Meffe, 1996). Manipulation was instead performed as separate entity of the main components, i.e. the structure or the species composition (based on the species strategy). As all trials have their strengths and weaknesses (Baeten et al., 2013), different main approaches were used in different trials to obtain a more overall perspective.
6.1 Trial 1: The ZSC trial in Alnarps Västerskog
Paper III focused on conceptualising Zoned Selective Coppice (ZSC) and its implementation in Alnarps Västerskog. The specific objectives of Paper III were to make general assessments of the initial effects of ZSC on the profile and woody species diversity of planted forest edges of varying width and species composition based on simulations. The long-term objectives for the trial is to demonstrate and test the effect of ZSC on the forest edge profile, vascular species diversity and visual appearance in relation to species mixture, edge typology and edge width.
6.1.1 Simulating the initial effects of zoned selective coppice to set threshold heights
Zoned selective coppice is based on threshold height increasing when moving inward through the edge cross-section. This creates a gradient in height and initially also in thinning intensity. Departing from this, three different zones
38. Resilience: Resilience in ecological systems is the amount of disturbance that a system can
absorb without changing stability domains (Gunderson, 2000). Based on this, it can be seen as the potential of a system to recover its structure and functions after a disturbance (Filotas et al., 2014).
39. Adaptive capacity: Adaptive capacity is described as system robustness to changes in resilience (Gunderson, 2000). Based on this, it can be seen as the ability of a system to modify its structure and composition so it can sustain major functions or develop new functions (Filotas et al., 2014).
40. Resistance: Staying essentially unchanged despite the presence of disturbances (Grimm & Wissel, 1997).

63
were established based on a fixed thinning strength corresponding to 66% for the outer zone, 50% for the middle and 33% for the inner zone. Two different threshold heights, reducing either crown area or woody base area to this specific percentage, were calculated. Differences in simulated impact between the two different sets of threshold height were compared using Shannon diversity index (adapted from Shannon & Weaver, 1962) and paired t-tests and differences in edge profile using ordinary linear regression and its adjusted R-square values (i.e. how well the increase in height correlated with the distance into the edge through its cross-section). Shannon diversity was chosen since comparisons were made only within the individual edge sections, i.e. the species number base was the same. Threshold height based on crown area was chosen for further simulation, since overall it gave a more graded forest edge profile and higher Shannon diversity values than the woody base area threshold heights.
6.1.2 Simulating the initial effects of zoned selective coppice on species diversity, structure and individual species
To give a more detailed view of how zoned selective coppice affected species diversity, structure and individual species, the following section describes the comparison made between the unmanaged field data from 2010, 2013 and after simulated cutting with zoned selective coppicing.
Investigating the change in diversity using diversity indices is affected by the number of species and the role of rare and dominant species can change depending on how the index is scaled. Therefore a robust measure of diversity was used in the form of diversity curves that plot the index using multiple scales (Tóthmérész, 1995). One suitable index, irrespective of the species number for this, is the Renyi index family (Tóthmérész, 1995). If the specific diversity curve for a site is above that for another site without intersecting it, then it is truly more diverse, while it is truly less diverse if it is below the other curve. Therefore Renyi's diversity curves were used to compare the changes in diversity over time and in relation to the simulated management. To better understand the individual species input, the relative amount of the species before and after the simulated management were also compared. A strong regularity or clustering of the residual species after management might be perceived as a clear sign of management interventions and a less natural expression of the edge, which can be perceived as negative (Ode et al., 2009). Therefore it is interesting to assess the initial spatial impact. This was done by visual interpretation of three-dimensional graphs with the height and position of the species before and after the simulated management. To verify the optical interpretation, an additional test where the pattern of residual species was

64
tested to determine whether they were completely spatially random, regular or grouped was performed using Ripley’s K point pattern analysis (Ripley, 1979; Hammer et al., 2001). To allow the simulated management actions to be easily translated into simple hands-on measures, descriptive statistics on edge slope and number of species removed were also calculated.
In general the simulations showed that, ZSC was able to support more graded forest edges without negatively affecting species diversity and introducing a spatially clustered point pattern. In doing so, on average 53% specimens were cut in the outer zone, 38% in the middle zone and 25% in the inner zone. The diversity trend was positive at the shrub edges in particular, whereas the diversity in the mosaic edges was not supported to the same amount, largely due to some tree species being totally removed. Overall, simulated ZSC was able to reverse the negative trend for the low light-demanding shrub species that had escalated from 2010 to 2013. The higher turnover to more abrupt edge profiles for the narrower edges from 2010 to 2013, together with the generally steeper slope after simulated ZSC compared with the wider edge sections, indicates that an edge width of six planting rows is more realistic for maintaining a graded forest edge profile than the narrower three planting row edges. Two operational ways of calculating threshold heights in the field for the type of edges used in this thesis were derived post hoc from the descriptive statistics. These involved either equating the outer zone to the median of a sample of heights and the inner zone to the third quartile, or setting the heights in accordance with the allocated edge zone width of the wide edge section.
6.1.3 Implementation of the trial in Alnarps Västerskog
After the evaluation of the simulations, a management trial using ZSC to manipulate the forest edge profile was implemented during winter 2013/2014. Ten edge sections were used in a controlled BACI (before, after, control, impact) trial (Lepš & Šmilauer, 2003). Each edge section was divided and one randomised half was treated using the ZSC, while the other half was left as an unmanaged control. All woody material was extracted from the edge. The BACI design enables long-term assessment of the effect of ZSC on edge profile (univariate) and species composition (multivariate). Ideally, non-selective management should have been included as an additional treatment, but the limited size of the individual edge sections made this impossible. As total none-selective management is deemed as less common then free development (management neglect) in planted contexts it was chosen as the control treatment. From a pedagogic and demonstration point of view, it is also more illustrative to be able to show a totally untreated control.
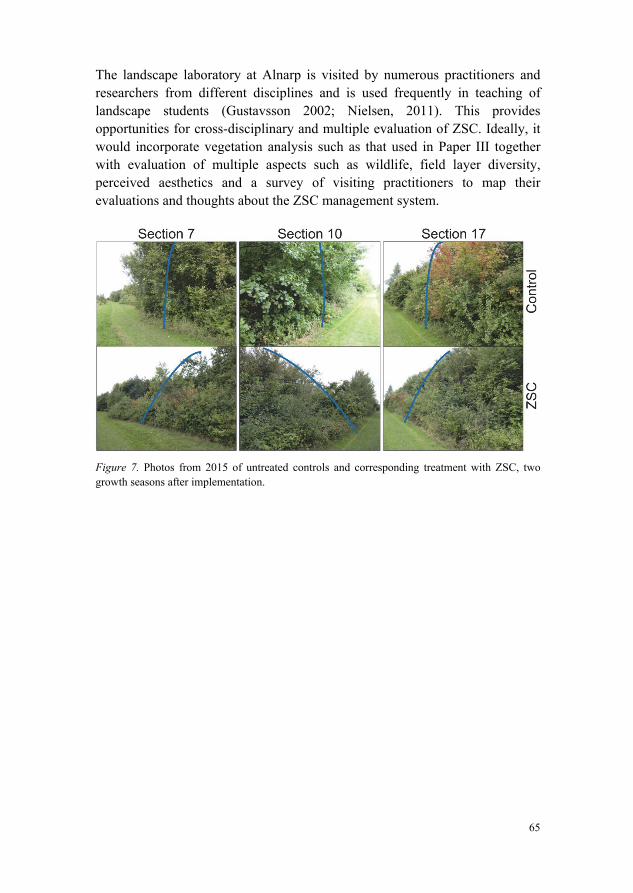
65
The landscape laboratory at Alnarp is visited by numerous practitioners and researchers from different disciplines and is used frequently in teaching of landscape students (Gustavsson 2002; Nielsen, 2011). This provides opportunities for cross-disciplinary and multiple evaluation of ZSC. Ideally, it would incorporate vegetation analysis such as that used in Paper III together with evaluation of multiple aspects such as wildlife, field layer diversity, perceived aesthetics and a survey of visiting practitioners to map their evaluations and thoughts about the ZSC management system.
Figure 7. Photos from 2015 of untreated controls and corresponding treatment with ZSC, two growth seasons after implementation.
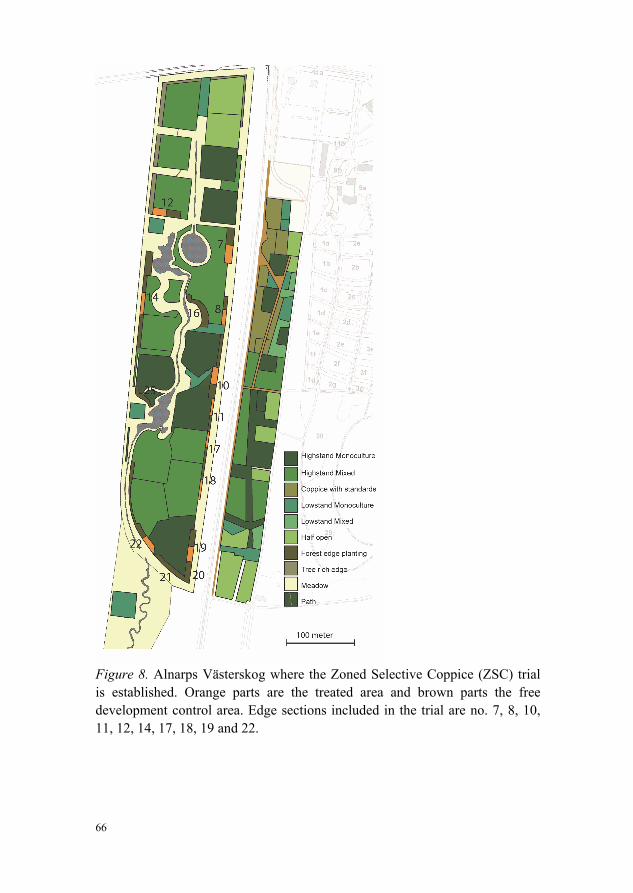
66
Figure 8. Alnarps Västerskog where the Zoned Selective Coppice (ZSC) trial is established. Orange parts are the treated area and brown parts the free development control area. Edge sections included in the trial are no. 7, 8, 10, 11, 12, 14, 17, 18, 19 and 22.

67
6.2 Trial 2: The ForEDGE trial along SML
The objectives of the ForEDGE project were to test and compare the impact of Functional Species Control, Zoned Selective Coppice, non-selective clearing and free development on woody species composition and forest edge structure across long environmental gradients. Departing from the findings of paper II and IV, the aim of the ForEDGE trial is to manipulate species composition and structure in relation to long complex ecological gradients, hence the name ForEDGE - Forest Edge Development Gradient Experiment. The gradient aspect was employed through strategic selection of locations from the multivariate regression tree grouping in Paper IV. This approach was chosen since it enables a smoother transition towards common practice within forest management, as the groups created are easily understod by managers and workers. At the same time, it was grounded on robust statistical procedures based on stratified random sampling along the whole of Southern Main Line.
6.2.1 Selection of locations
Based on the five groups from the multivariate regression tree (Paper IV), selection of possible locations for the trial was performed on a base set of criteria. First, the location had to be spatially homogeneous concerning vegetation and topography for a stretch of approximately 100 m. This was investigated through aerial photo interpretation, together with the field notes and field photos. For the northern aspect of the railway stretch studied, i.e. from Norrköping to Stockholm, the number of suitable locations was limited, since the rolling, small-scale topography made it difficult to find plots that did not have large within-plot variation. This gave a slightly skewed spatial distribution of suitable locations. Five locations for each multivariate regression tree group were selected, together with standby sites. Since Paper II concluded that other environmental characteristics such as landscape structure will increase in importance over time for the assembly of forest edges, the selected locations were scatter-plotted against the decisive environmental characteristics identified in Paper II. Inspecting these revealed no selection bias for these variables. Although edge orientation, i.e. exposed/unexposed, did not correlate with species composition in the ordination analysis (Paper II), the large amount of literature concerning this aspect meant that it was also analysed in the selection of locations. The analysis showed that there was no clear selection bias, with a total of 14 exposed sites and with a range of 2-3 exposed sites within all clusters except cluster B, which had four exposed sites but was allowed since other site selection criteria would have affected other aspects more than this single one.

68
Figure 9. Scatterplots of selected locations for the ForEDGE trial (red squares) in relation to the decisive environmental characteristic from Paper II that were not the main predictors (except altitude) in the multivariate regression tree classification in Paper IV.

69
6.2.2 Treatment and plot design and its implementation
At each location, the following four treatments were applied during autumn 2014:
Functional Species Control (Paper IV), which manipulates the species
composition through reduction of dominant tree species Zoned Selective Coppice (Paper III), which manipulates forest edge
structure Non-selective clearing of all woody vegetation Control treatment, i.e. free development of vegetation.
Non-replication at location level was used, since the main focus was the difference between and not within locations, following the reasoning of Binkley (2008). Treatment area was set to 20 m along the stand and 10 m perpendicular to it, covering the whole width of the NMC. The size was set in accordance with Scherer-Lorenzen et al. (2005) so that it corresponded to twice the restricted maximum height in the NMC, i.e. 2 x10 m. This also corresponds to the minimum length for treatments in the other trials within this thesis. Longer plots would decrease the risk of internal edge effects from the treatments, but also increase the
risk of high within-plot variation (Baeten et al., 2013). Treatments were randomly assigned to the
plots, but in a few extreme cases where the plot species composition meant that Functional Species Control approached non-selective total clearing, re-randomisation was conducted on-site. Each treatment plot was inventoried with nine stratified subplots of 1 m radius (Figure 11). Within these, all woody stems (dwarf or half shrubs excluded) higher than 0.5 m were measured at species level for height. Field layer height was estimated as the average
Figure 10. Examples of the four applied treatments

70
maximum height within the subplot together with its cover in intervals of 10%. After trial layout and measurements, the stems in the whole treatment plot that were to be removed were marked. Removal was performed by expert workers using motorised brush-saws. Before this work started in the field, an information meeting was held with the workers. Communication and reporting of the work was maintained continually with the management workers during cutting of the sites. The heights for performing the ZSC were based on calculating quartiles of the maximum heights in the subplots. First, in an approach based on the results from Paper (III), i.e. using the median and third quartile as outer and inner threshold heights, trees were test-marked and evaluated in the field on four different sites. Due to the early successional stage of the regrowth, this did not give a very evident gradient of thinning strength. Therefore a modified version was evaluated and compared in the field at the four different sites. This modification, with threshold height in the outer zone closest to the railway equalling the first quartile, the middle zone the second quartile (median) and the inner zone the third quartile, was deemed more suitable and was used for all sites. Width of zones was set to 3 m corresponding to the regular width of a brush-saw working strip with 0.5 extra buffers for the outer and inner zone (Figure 11).
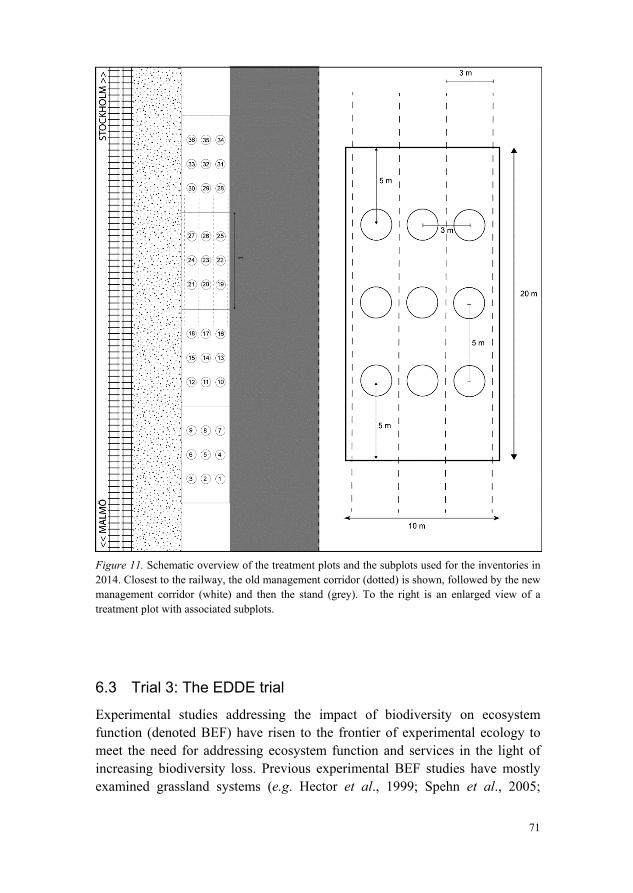
71
Figure 11. Schematic overview of the treatment plots and the subplots used for the inventories in 2014. Closest to the railway, the old management corridor (dotted) is shown, followed by the new management corridor (white) and then the stand (grey). To the right is an enlarged view of a treatment plot with associated subplots.
6.3 Trial 3: The EDDE trial
Experimental studies addressing the impact of biodiversity on ecosystem function (denoted BEF) have risen to the frontier of experimental ecology to meet the need for addressing ecosystem function and services in the light of increasing biodiversity loss. Previous experimental BEF studies have mostly examined grassland systems (e.g. Hector et al., 1999; Spehn et al., 2005;
72
Ebeling et al., 2008) and tree species in stand conditions (Scherer-Lorenzen et al., 2005, 2007; Verheyen et al., 2013; Tobner et al., 2014). However, a large amount of ecosystem functions, services and ecological processes needs to be addressed in relation to ecotones such as forest edges and its biodiversity (Sarlöv-Herlin, 1999; Chacoff & Aizen, 2006; Lindenmayer & Hobbs, 2007; Naturvårdsverket, 2012; Bailey et al., 2014).
Falling as it does between the territory of forest field trials and ecological open land experiments, little research has addressed the relationship between forest edge diversity and ecosystem function, e.g. whether there is a trade-off between the range of the edge effect into the stand and the woody species diversity of the edge itself. Theoretically, higher diversity of woody species would enable more complex structures, which would provide e.g. better filtering of wind and pollution. However, it remains unclear whether such structural diversity is related to the species diversity or functional diversity, i.e. “the value and range of the species traits that influence the forest edge ecosystem functioning” (Tilman, 2001). For example, in nemoral and hemi-boreal vegetation systems, light-demanding early flowering shrubs and shrub-trees are keystones of species-rich edges and pollination services (Ward & Spalding, 1993; Blakesley, 2006; Svensson, 2002; Bailey et al., 2014). At the same time, recommendations for management in studies by Mourelle et al. (2001) and, indirectly, Hamberg et al. (2009a) include maintaining a higher density of shade-tolerant and shade-giving species to reduce the edge effect on the interior stand. Including more shade-tolerant species might thus reduce the edge effect on interior stand conditions, but in parallel reduce other desired ecosystem services. This is in line with the conclusion by Perring et al. (2012) that there is a need for experimental studies on ecosystem system trade-offs.
To bring more light to these matters, a BEF trial addressing the impact of biodiversity on forest edges function was established as part of the Elmelund afforestation at the fringe of Odense city, Denmark; EDDE - Edge Development Diversity Experiment. The trial aims to create an open platform for biodiversity questions in relation to forest edge design and management. More specifically, the EDDE trial primarily aims to investigate: The basic research question: Does woody diversity (species and/or
functional) in forest edges influence edge effects on the interior stand and the ecosystem services provided by the ecotone itself?
The applied research question: How does woody diversity at the initial planting affect edge profile, species coverage and development of individual species?

73
6.3.1 Constraints and strategic framework
The long-term and large-scale trials that are needed in BEF research on woody species face many difficulties. First, the resources needed to establish such projects are significant and the time scale is beyond regular research funding. However, as stated by Scherer-Lorenzen et al. (2005), innovative alliances with uncommon partners can be a solution. This is exactly what gave rise to the Elmelund project in Odense. In that case, the Danish Nature Agency (Naturstyrelsen) offered the possibility to establish an experimental trial of forest edges as an integral part of a large multifunctional afforestation project in an area covering 305 hectares. However, the nature of such a project, with multifunctional aims and regulations, introduces constraints into the experimental setup. Therefore, an important focus for planning of the trial was to adapt the experimental setup in relation to the demands made by Naturstyrelsen. However, such practical constraints are not necessarily a disadvantage, but rather help transfer knowledge gained into practical situations more easily.
Baeten et al. (2013) and Verheyen et al. (2013) describe the need for BEF studies and other experimental studies to address the aspects of representativity (real world connection), orthorgonality (minimisation of cofounding variables and hidden treatments) and comprehensiveness (the spectrum of the phenomena studied). There should preferably be an optimisation of all three aspects within research. However, the use of three different research platforms in the FunDivEurope project (Baeten et al., 2013) to achieve triangulation of all three aspects clearly exemplifies that an individual trial or study can never cover all of them in full. Therefore within the Elmelund project, an order of priority for the different aspects was set to facilitate the many design decisions and to increase the transparency of the project. The priority order started with representativity, followed by orthogonality and lastly comprehensiveness. As an example, this meant a first-hand aim was to provide as close to natural structures and composition as possible, but also to standard practices of forest edge afforestation, i.e. strong representativity. Following that, the design layout was carefully pre-evaluated concerning environmental conditions for the locations of the different edge sections, which supported orthogonality. Comprehensiveness was prioritised lowest, as fulfilling this condition would need multiple sites and probably multiple random extinction scenarios (see e.g. Bruelheide et al., 2014). Following Paper (I), however, it seems realistic that some species are more prone than others to disappear from forest edges, indicating that random extinction scenarios may not reflect real world processes (Lepš, 2004), i.e. representativity would be lost. In the following
74
section, the research design and the background to the approaches used in the EDDE trial are briefly described.
6.3.2 The site of Elmelund
The Elmelund afforestation project (55.3821N; 10.3047E) is located at the south-west urban fringe of the city of Odense on Fyn. The area belongs to group 4 of Denmark’s phytogeographical regions (Lawesson & Skov, 2002) and is the eastern, nemoral sub-Atlantic region with warm summers, chilly winters and a humid climate. The project is situated on old agricultural land consisting mostly of glacial till with an average clay content of 15-20%. In the northern parts of the study area the till shows signs of pseudogley, indicating temporarily high watertable. In some small depressions peaty soil is found, indicating wet conditions before the land was drained for agriculture. The area was cropped in 2013 but not fertilised and in spring 2014 the fields were ploughed and repeatedly harrowed before the planting started in early March. The forest edge trial was planted with supervision during two periods, starting 19 March and 16 April respectively, with a plant spacing of 1.6 m x 1.6 m to comply comfortably with subsidy regulations concerning number of plants per hectare (minimum 3500 plants over 1 m height six years after planting).
6.3.3 Plot size
Any BEF trial for forest systems requires large plot size, e.g. according to Scherer-Lorenzon et al. (2005) plot size should be twice the width of the final tree height, while Potvin & Gotelli (2008) mention a size above 20 m x 20 m for trees. Examples in the literature of sizes for shrub-based communities are rare, however. Bruelheide et al. (2014) uses 12.91 m x 12.91 m for monocultures of shrubs and Perring et al. (2012) 23 m x 23 m for all shrub plantings. Based on this, in the EDDE trial it was concluded that the length of one commercial plant bundle of 25 species (planted with 1.6 m spacing, and thus amounting to 40 m) would be sufficient as minimum length. This also simplified the planting and mixing procedure and provided the possibility to split the plots in half in later stages. If management treatments are to be added in the future, this split plot size will still allow all species to be present in the most species-rich mixture. Subsidy practice demands either 10 or 20 m wide edge plantings as the minimum, depending on compass aspect. This was taken advantage of as it made it possible to replicate the diversity gradient as wide and narrow and henceforth relate the importance of edge width to edge effects and species diversity.

75
Figure 12. a) On site planning and analysis in 2013, b) the cropped fields in 2013, the path follows the forthcoming forest road and edge, c) indoor site analysis and location of the different treatments, d) same view as picture b in 2014 with constructed road and soil cultivated for planting, e) on site mixing of species for the different treatments in early spring 2014, f) labelling of the mixed species bundles and packing for transportation to the planting site, g) instruction to the planters and loading of the species bundles, h) plantation of the forest edges, i) one of the planted forest edge sections in 2014, j) inauguration of the Elmelund afforestation project to the public in early summer of 2014, k) mechanical weed control between the plantings rows, l) status inventory of the plantings in the spring of 2015 with overall good survival and development of the planted species.
6.3.4 Placement and experimental layout
One aspect that can make the layout of experimental edge trials more challenging than standard trial is the compass aspect. Edges with a south and west (in the northern hemisphere) aspect will receive more radiation from the sun than those with an east and north aspect (Geiger, 1965; Matlack & Litvaitis, 1999). To maximise the exposure of the edge, and hence probably
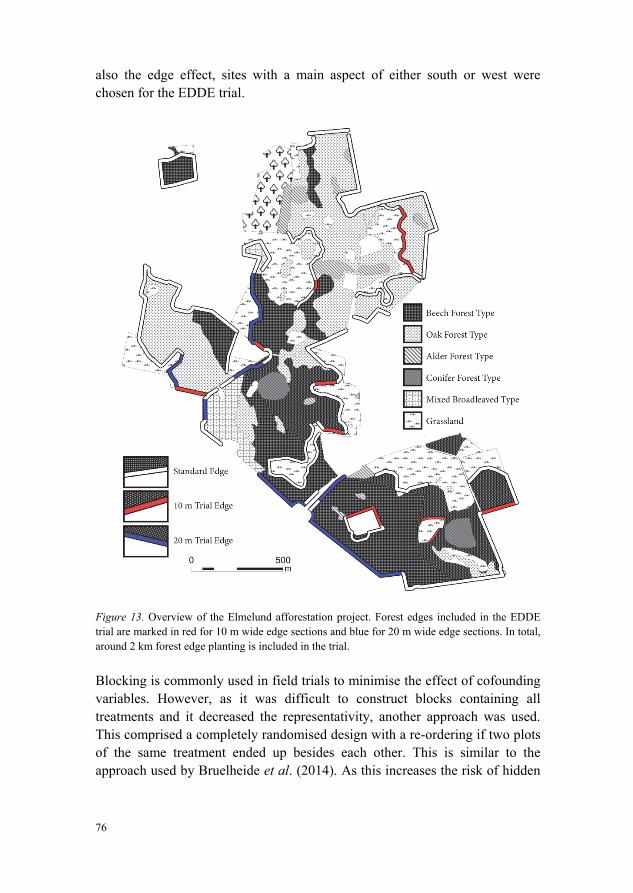
76
also the edge effect, sites with a main aspect of either south or west were chosen for the EDDE trial.
Figure 13. Overview of the Elmelund afforestation project. Forest edges included in the EDDE trial are marked in red for 10 m wide edge sections and blue for 20 m wide edge sections. In total, around 2 km forest edge planting is included in the trial.
Blocking is commonly used in field trials to minimise the effect of cofounding variables. However, as it was difficult to construct blocks containing all treatments and it decreased the representativity, another approach was used. This comprised a completely randomised design with a re-ordering if two plots of the same treatment ended up besides each other. This is similar to the approach used by Bruelheide et al. (2014). As this increases the risk of hidden

77
treatments, the selection of sites before randomisation was carefully evaluated concerning soil conditions. The whole EDDE study area is located on nutrient-rich former agricultural land, which makes the main factor of concern the overall soil moisture (Papers II and IV).
When selecting sites, wet parts were avoided using the soil data and a hydrology pre-investigation of the whole Elmelund afforestation area (Naturstyrelsen, 2013c). Nevertheless, analyses in the future have to take into account the effects of heterogeneity in abiotic conditions, as exemplified by e.g. Healy et al. (2008). To obtain a balanced design, it was necessary to allocate edges bordering different stand types. To minimise the resulting skewedness and to create a common base to assess edge effects, a standard buffer tree mixture of 10 m was established behind all experimental edges. The buffer mixture was composed so that none of the tree species occurred in the edge plantings and so that different dispersal traits were represented (wind and animal). This resulted in the following mixture: 75% Quercus robur, 15% Acer platanoides, 4% Prunus avium, 3% Tilia cordata and 3% Carpinus betulus. This separation between buffer and edge plantings makes it easier to evaluate the dispersal of tree species into the edge and dispersal of shrub species into the buffer and the forest stand.
6.3.5 Species selection and extinction (assembly) scenarios
Using the internet-based services www.plantevalg.dk for practitioners concerning plant choices, all woody species that met the criteria of being adapted to the climate, the soil conditions at the site, being native to Denmark and fulfilling the requirement for subsidies when planting forest edges in Denmark were retained. This partly reduced the problem of creating “unrealistic” assemblies discussed by Lepš (2004).
Due to the problem of measuring extremely clonal species, those were omitted from the design. General species trait data were taken from Pinborg et al. (1989), Fitter & Peat (1994) and Gustavsson & Ingelög (1994) and early height development data from Olrik et al. (2002) and Paper I. Based on data from Paper II, an inventory study of Danish forest edges (Andersen et al., 1994) and normal practice for forest edge planting in the area, the species diversity was set to 4, 8 and 16 species, reflecting low, intermediate and high species diversity of shrubs and small tree species.
As shade tolerance and final height/growth form were key aspects in understanding graded edge development in Paper I, the focus was on these two fundamental ecological strategies. This is also supported by the findings for trees species reported by Loehle (2000), Morin et al. (2011) and Stahl et al. (2013). Examination of these key aspects was achieved by splitting the species

78
into four main growth form groups; low shrubs, high shrubs, shrub trees and small trees. Four species for each of these groups were selected with the criterion of obtaining a pair of two more shade-tolerant and two more light-demanding species within each growth-form group (Table 3). For the low and intermediate diversity mixtures, a set of light-demanding and more shade-tolerant mixtures, together with a mixture of the two, were assembled (Table 4). Altogether, this gave four replicates of each shade tolerance level, nested within the two different diversity levels. This gave a main diversity gradient accompanied by a shade tolerance spectrum, whereas the main growth form selection was kept as stable as possible to ensure similar main structure of the edge and at the same time reduce the problem of one or a few larger species creating hidden treatments (Huston, 1997). This could be seen as a way of promoting comparisons of competitive exclusion and the more commonly addressed species pool limitation (Lepš, 2004). The diversity gradient was then planted as both narrow and wide. However, as the nature of species and their reactions to gradients and anomalies differ; perfect species matching isolating only shade tolerance is impossible. Therefore post hoc functional diversity calculations based on site measurement as an analytical tool would be valuable, as they would also enable the intraspecific trait variability to be quantified (Lepš et al., 2006; de Bello et al., 2011).
Table 3. Species included in the EDDE trial and their growth forms
Growth form Less shade-tolerant More shade-tolerant
Low shrub species
Rosa rubiginosa L. Rosa canina L.
Ribes alpinum L. Lonicera xylosteum L.
High shrub species
Shrub trees
Rhamnus cathartica L. Sambucus nigra L. Salix pentandra L.
Eounymus europeaus L. Viburnum opulus L. Crataegus monogyna Jacq.
Small trees
Sorbus aucuparia L. Malus silvestris (L.) Mill. Salix caprea L.
Corylus avellana L. Prunus padus L. Acer campestre L.

79
Table 4. Different species compositions and numbers of individual replicates used in the EDDE trial. L=less shade tolerant (light demanding), S= more shade-tolerant, M = mixed, i.e. L4A = Light-demanding four-species mixture A.
4 species – 12 x 2 sections (narrow & wide)
L4A (x2) M4A M4B S4A (x2)
Rosa rubignosa Ribes alpinum Rosa rubignosa Ribes alpinum
Rhamnus cathartica Rhamnus cat. Viburnum opul. Vibrunum opulus
Salix pentandra Corylus avellana Salix pentandra Corylus avellana
Malus sylvestris Malus sylvestris Acer campestre Acer campestre
L4B (x2) M4C M4D S4B (x2)
Rosa canina Rosa canina Lonicera xylo. Lonicera xylosteum
Sambucus nigra Euonymus euro. Sambucus nigra Eounymus europ
Sorbus aucuparia Sorbus aucuparia Crataegus mon. Crataegus mon.
Salix caprea Prunus padus Salix caprea Prunus padus
8 species – 12 x 2 sections (narrow & wide)
L8 (x4) M8A M8B S8 (x4)
Rosa canina Ribes alpinum Rosa canina Ribes alpinum
Rosa rubiginosa Rosa rubignosa Lonciera xylo. Lonicera xylosteum
Rhamnus cathartica Rhamnus cat. Sambucus nigra Eounymus euro.
Sambucus nigra Viburnum opul. Euonymus euro. Viburnum opulus
Salix pentandra Corylus avellana Sorbus auc. Crataegus mon.
Sorbus aucuparia Salix pentandra Crataegus mon. Corylus avellana
Malus sylvestris Acer campestre Prunus padus Acer campestre
Salix caprea Malus sylvestris Salix caprea Prunus padus
M8C M8D
Ribes alpinum Rosa rubignosa
Rosa canina Lonicera xylo.
Euonymus euro. Sambucus nigra
Rhamnus cat. Viburnum opul.
Corylus avellana Salix pentandra
Sorbus aucuparia Crataegus mon.
Prunus padus Salix caprea
Malus sylvestris Acer campestre
16 species – 4 x 2 sections (narrow & wide) M16 (x4)
Ribes alpinum Rosa rubignosa Rosa canina Lonicera xylo.
Rhamnus cat. Viburnum opul. Euonymus euro. Sambucus nigra
Corylus avellana Salix pentandra Sorbus auc. Crataegus mon.
Malus sylvestris Acer campestre Prunus padus Salix caprea

80
6.3.6 Mixing patterns and spatial design of plots
A great advantage of woody species, as long as extreme clonal species are avoided, is that they can be monitored on an individual level, unlike e.g. grasses (Scherer-Lorenzen et al., 2005; Potvin & Gotelli, 2008). However, when approaching mixture effects, group planting is used in the experiments to secure species survival in the long run, i.e. species interactions are controlled to the scale of the group for a long period. As forest edges are related to earlier forest successional paths, there is a need to focus especially on the initial mixing effects and therefore an intimate random mixture approach was used in the EDDE trial, as seen in e.g. Bruelheide et al. (2014). This also maximises the possible number of different combinations of interactions compared with no random intimate mixtures (Bruelheide et al., 2014). Moreover, it is easier to plant in a rational way, since all that is needed is pre-randomisation of species into bundles.
An important question differing between classical BEF trials is that of zonation of species. The results from Paper I and practical experience from Denmark (A.H. Pedersen, pers. comm. 2013) clearly indicate that zonation is crucial for the development of graded forest edges and for upkeep of the initial species pool planted. Therefore a clear distinction has to be made between main edge structure and diversity gradient concerning what is to be experimentally tested. As graded edges are often seen as ideal types and were strongly supported by Naturstyrelsen in the EDDE case, it was decided that edge structure should be held as constant as possible through zonation of the species based on growth form and the diversity of species altered within this. This meant having smaller species in front and gradually increasing in height on moving inward through the edge section for all sections, but with different numbers of species in the different zones. This was achieved by zoning the edges into an outer, middle and inner edge zone. However, to promote representativity, i.e. as close to ‘real world’ forest edge structures as possible (see e.g. Gustavsson, 1986; Anderssen et al., 1994; Rizell & Gustavsson, 1998), higher shrubs were allowed to jump forward into the outer zone and shrub trees to jump back to the inner zone according to a set percentage of 25% (see Figures 14 and 15). In other words, the main design concept from Paper I was applied as the base for the layout of the edges.
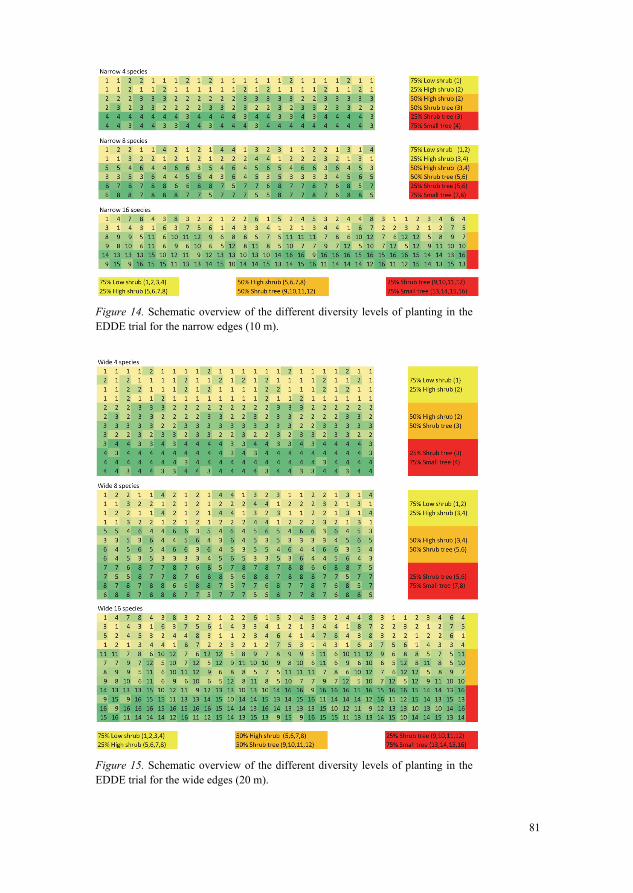
81
Figure 14. Schematic overview of the different diversity levels of planting in the EDDE trial for the narrow edges (10 m).
Figure 15. Schematic overview of the different diversity levels of planting in the EDDE trial for the wide edges (20 m).

82
6.3.7 Reference plantings
In forestry, most mixtures used in experiments have low diversity of species, often lacking intermediate and high diversity components (Scherer-Lorenzen et al. 2005). In contrast, designated forest edge plantings in practical afforestation quite often consist of species-rich edge mixtures, but intermediate and low diversity mixtures are lacking. However, as noted by Loreau and Hector (2001), in order to assess species-specific contributions to functions of mixtures, all species should be studied in monoculture. As the interactions between woody species can be measured and studied on individual level (Potvin & Gotelli, 2008; Nadrowski et al., 2010), reference plantings where each species was grouped so inner species of the groups only faced intraspecific competition during the first stages of development was established (see Figures 16 and 17). In total, four reference sections for each of the narrow and wide edges sections were planted. The reference plantings provide the opportunity to compare the long-debated differences between intimate or grouped mixtures in BEF experiments and afforestation (Scherer-Lorenzon et al., 2005; Bruelheide et al., 2014). In other words, it also enables testing of whether the conclusion that graded forest edges benefit from grouping of low-growing species is correct (Paper I) or if this is caused by the resulting zonation of the species.
Figure 16. Schematic overview of the narrow (10 m) reference planting species-rich mixture with grouping of the individual species in the EDDE trial.
Figure 17. Schematic overview of the wide (20 m) reference planting of species-rich mixture with grouping of the individual species in the EDDE trial.

83
6.4 Framework for the management and planting design concepts in relation to the trials
Zoned Selective Coppice might support already established pioneer broadleaved tree species if the abundance of replacement species is too low to suppress them. The results from paper IV suggest that this effect is most likely in forest edges growing on poor sites. Acknowledging this, the ZSC will still maintain the profile, although most likely shifting towards a graded forest edge dominated by e.g. Picea abies in different age cohorts through the edge section. This will still be able to support some important functions and services.
Functional Species Control do not possess this flexibility since it is dependent on there being some suitable species left in certain amounts to take over if the dominant trees are repeatedly disfavoured. The original Rydberg (2000) height-based selective system and adaption of DBH-based selective coppice system (Coppini & Hermanin, 2007) should not be forgotten, and should be a part of the management toolbox as they too can promote simpler types of
Figure 19. Conceptual illustration how a graded edge could develop without shrub speciesusing zoned selective coppice.
Figure 18. Example of graded forest edgedominated by spruce Picea abies.

84
graded forest edge. This basically applies for all management approaches presented in the state of art section of this thesis. However, one could question the applicability of the Pietzarka & Roloff (1993) four phased dynamic model (see section 3.5), since the regrowth structure consistently seen in Paper IV was in clear disagreement with that described by those authors. In simplified terms, maintaining more or less graded edges can hence theoretically employ:
Full clearing (e.g. Buckley, 1997) Zoned full clearing (Ferris & Carter, 2000) Height-based selective coppice/thinning (Rydberg, 2000) Adaption of DBH-based selective coppice/thinning (Coppini & Hermanin,
2007) Zoned height-based coppicing/thinning (Paper III) Selective coppice/thinning focused on dominance reduction (e.g. Paper IV). These types of treatment and their areas of application in the trials are depicted in Figure 20.
Figure 20. Overview of management options for more or less graded forest edges.
The DBH/height-based selective coppice, Zoned Selective Coppice and Functional Species Control systems all aim at controlling ‘enough’ rather than ‘everything‘ and thus can be regarded as adaptive management approaches
Type of treatment
Sp
atia
lar
ran
gem
ent
of
trea
tmen
t
Non-selective ‐‐‐‐‐‐‐‐‐‐‐‐‐‐‐‐‐‐‐‐‐ ‐ Selective ‐‐‐‐‐‐‐‐‐‐‐‐‐‐‐‐‐‐‐‐ ‐
Structure Species strategy
Eve
n
Buckley et al. (1997) Height based:
Rydberg (2000)
Functional species
control FSC (IV)
Non & de Vries, 2013 DBH Based: Coppini &
Hermanin (2007)
Trial 2 (ForEDGE)
Trial 2 (ForEDGE)
‘Zo
ned
’ Zoned selective
coppice ZSC (III)
Ferris & Carter (2000) Trial 1 (Alnarp) “Trial 3 (EDDE)”
Trial 2 (ForEDGE)

85
adaptable to site-specific variability (Puettmann & Tappeiner, 2014; Messier et al 2015). However, depending on the given site and practical constraints, different methods should be used individually or in combination. Identification of suitable combination and further method development is needed e.g. combining the functional species control system with a maximum height to prevent subordinate trees from becoming a hazard over time. Another example of such combinations is the main planting design of the EDDE trial in Elmelund where zoning of different species mixtures in relation to main species strategies have been used.

86

87
7 Discussion
7.1 Work progression and its effects on research design of the individual studies
Paper I identified zonation of species at plating in relation to their shade tolerance and growth form as favourable for development of graded forest edges. However, the trial was confined to on location and thus reservations for generalisations to forest edges along complex environmental gradients should be taken. While focusing on natural regrowth, rather than designed forest edge plantings, Paper II assessed the impact of environmental gradients on forest edge species composition and vegetation structure. Furthermore, Paper I revealed the importance of focusing on structural aspect and species strategies and traits for management to be able to maintain graded forest edges and their species diversity. Therefore, the Zoned Selective Coppice management system departed from controlling the vegetation structure (Paper III) while the Functional Species Control management system departed from control of species strategies and traits (Paper IV). Both management systems were conceptualised so they meet the practical realm of Paper II and IV. Throughout the process, there was an increasing insight that there is a general lack of studies, especially experimental, addressing the management and design of forest edges, i.e. how to actually achieve the structure and species assembly wanted at a given place. Therefore, the planning and establishment of long-term experimental trials with the planting design guideline and the two management systems was regarded as an important contribution to the research field, despite ‘true’ evaluation of these trials is many years ahead, and thus beyond the scope as well as the duration of this thesis.

88
7.2 Limitations of data collection and analytical approaches
Research takes place within a practical framework, constrained by e.g. time, financial resources and existing knowledge and experience. This thesis is certainly no exception and it is important in this regard to discuss things that perhaps could or should have been done in a different way and what effects this might have had. However, following the reasoning by Peirce (1868a, 1868b, 1869), that the decisions taken were the best (pragmatic) solution at that time, only by actually taking decisions it is possible to gain insights about the effects of these decisions.
7.3 Discussion of data collection
7.3.1 The unmeasured variables and non-sampled vegetation
In Paper II, numerous variables were measured to capture different environmental characteristics at different scales. However, this does not ensure that the most determining variable was actually included (if such exists). Instead it can be said, based on the context (practical, time, financial) in which the work was performed, that the variables considered important were included. Measuring pH and other soil chemistry variables would likely have enabled distinguishing more direct causes of the species composition in relation to site productivity. Calculations of site index based on measured variables in the field were used in the first preliminary analysis. However, it did not perform as well as field layer type and soil moisture and was not included in further analysis due to its strong collinearity with multiple variables. This is probably because forest site index’s do not distinguishing between dry and wet sites, both of which generate lower site index values. However, as many species are not adapted to cope with both drought and waterlogging (Niinemets & Valladares, 2006), species composition is largely influenced by soil moisture variation. Detailed studies of browsing together with agent-based wildlife models (or similar) would probably also have given further insights. However, one could argue that the complexity of the systems and processes investigated make it less likely that a single variable would distort the main results. This argument is supported by the fact that none of the different factors tested cancelled out the importance of all the other factors (Paper II).
In Papers II and IV, different ways of assembling species matrices were used. Based on the sampling design, the sublevel plot 3 could then not be utilised for the approaches used in Paper II. For Paper IV, where the dominance of species was the focus, it was possible to incorporate subplot
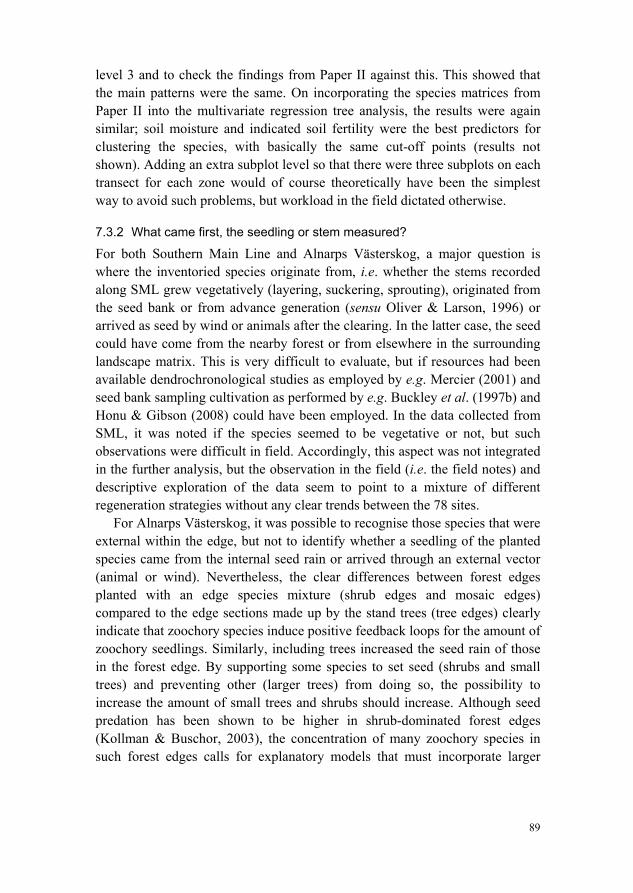
89
level 3 and to check the findings from Paper II against this. This showed that the main patterns were the same. On incorporating the species matrices from Paper II into the multivariate regression tree analysis, the results were again similar; soil moisture and indicated soil fertility were the best predictors for clustering the species, with basically the same cut-off points (results not shown). Adding an extra subplot level so that there were three subplots on each transect for each zone would of course theoretically have been the simplest way to avoid such problems, but workload in the field dictated otherwise.
7.3.2 What came first, the seedling or stem measured?
For both Southern Main Line and Alnarps Västerskog, a major question is where the inventoried species originate from, i.e. whether the stems recorded along SML grew vegetatively (layering, suckering, sprouting), originated from the seed bank or from advance generation (sensu Oliver & Larson, 1996) or arrived as seed by wind or animals after the clearing. In the latter case, the seed could have come from the nearby forest or from elsewhere in the surrounding landscape matrix. This is very difficult to evaluate, but if resources had been available dendrochronological studies as employed by e.g. Mercier (2001) and seed bank sampling cultivation as performed by e.g. Buckley et al. (1997b) and Honu & Gibson (2008) could have been employed. In the data collected from SML, it was noted if the species seemed to be vegetative or not, but such observations were difficult in field. Accordingly, this aspect was not integrated in the further analysis, but the observation in the field (i.e. the field notes) and descriptive exploration of the data seem to point to a mixture of different regeneration strategies without any clear trends between the 78 sites.
For Alnarps Västerskog, it was possible to recognise those species that were external within the edge, but not to identify whether a seedling of the planted species came from the internal seed rain or arrived through an external vector (animal or wind). Nevertheless, the clear differences between forest edges planted with an edge species mixture (shrub edges and mosaic edges) compared to the edge sections made up by the stand trees (tree edges) clearly indicate that zoochory species induce positive feedback loops for the amount of zoochory seedlings. Similarly, including trees increased the seed rain of those in the forest edge. By supporting some species to set seed (shrubs and small trees) and preventing other (larger trees) from doing so, the possibility to increase the amount of small trees and shrubs should increase. Although seed predation has been shown to be higher in shrub-dominated forest edges (Kollman & Buschor, 2003), the concentration of many zoochory species in such forest edges calls for explanatory models that must incorporate larger

90
amounts of propagules arriving, as well as fluxes in the amount of seed predators over time.
7.3.3 Sampling approaches
In this thesis, what could be regarded as ‘poor man’s’ stratified random sampling was used. In Alnarps Västerskog, the edge sections were divided into three equal parts and randomised within each part for the spontaneous vegetation transects. Similarly, for Southern Main Line the randomisation was done in subsequent groupings of seven forest stands along the line. However, in contrast to Alnarps Västerskog, the transect at each site in SML was systematically randomly sampled, i.e. the starting point was random in the form of the conductor post of the railway matching the randomly selected stand (this is similar to the approach used by Wagner et al. (2014) in transmission-line ROW studies). This was employed since it was easier to apply in the field and is most likely more ‘efficient’ than full randomised sampling (Cochran, 1946; Stevens & Olsen, 2004). One danger with such an approach is if the systematic distance ‘jump’ conceals a pattern (e.g. Sutherland, 1996; Aune-Lundberg & Strand, 2014). In the present thesis it was assumed that this would be in relation to forest edge cross-section and hence the sampling was denser in that direction. Although this makes it harder to establish good (unbiased) variance estimators, it is done for example in most national inventories using systematic sampling, since the variance is usually overestimated using estimation methods from full randomised sampling (e.g. Aune-Lundberg & Strand, 2014). The stratified random sampling applied within this thesis uses only spatial location as auxiliary information, i.e. it only aims to get samples that are representative in location. In hindsight, a more efficient design for sampling could have been to incorporate important auxiliary variables using for example the local pivotal method (Grafström et al., 2012). It enables different sites to ‘compete against each other’ to create balanced sampling both spatially as well as for other auxiliary variables included, e.g. altitude or other GIS-based quantities.
7.4 Discussion of analytical approaches
7.4.1 Overall analytical approach
When dealing with complex systems, it is often difficult to establish direct cause relations and in a world of noisy biological data, the reliability and suitability of different methods are still debated. Such problems often confuse the work of doing a PhD and during the journey of learning and working with different methods, it becomes apparent that the old saying by Box (1979) that

91
“All models are wrong but some are useful” is indeed true; although statistical modelling has greatly advanced over the years as computational power has increased. Therefore, as a way of endorsing and deepening statistical analysis, a sort of reversed data fishing approach was adopted in this thesis i.e. using multiple statistical approaches, not for the sake of finding publishable significant results, but to identify similar behaviour and patterns of the data across different approaches. The assumption was that this would provide more robust and reliable results as well as deeper insights into the different methods. This of course means that the analyses are explanatory and their interpretation and generalisation should take this into consideration. In such cases, p-values become “rough guides” (Palmer, 2015) that safeguard against over-interpretation (Lepš & Šmilauer, 2007) and not mainly the probability of obtaining a result equal to or more extreme than that observed under the assumption of the constructed statistical null hypothesis. This conflicts with some classical positivistic approaches to statistical testing, but such approaches require a strong experimental base, which today is generally not available within the field of forest edge research. Following the same reasoning, three new controlled, experimental trials have been planned and established to provide an experimental base for further advancing the knowledge within the research field.
7.4.2 Inheriting a trial for bad and good
The trial of forest edge design parameters in Alnarps Västerskog, could be seen as a kind of Latin Square without replicates (Quinn & Keough, 2002). However, for pedagogic and logistical reasons, the design was not strictly spatially randomised. The Latin Square is problematic concerning interaction effects and is an extremely vulnerable design in relation to loss of replicates, as has been the case in Alnarps Västerskog (Quinn & Keough, 2002). Based on this, the statistical analysis of the design elements in Paper I was adapted to more explorative approaches of multiple univariate models. In hindsight, an alternative analytical approach could have been to use multivariate analysis of the species composition change and some average community traits. That said, it should be emphasised that in the absence of long-term forest edge experiments in afforestation, Alnarps Västerskog provides a valuable resource, especially since its development over a relatively long period can be analysed.
7.4.3 Alternative methods of analysis
There certainly exist a plethora of statistical approaches for modelling the data in Papers I-IV in this thesis. Some of the models presented could have been

92
more advanced and in other cases less advanced, following the reasoning of Murtaugh (2007). This is explained by my growing knowledge of statistics during the course of the work, but also because the main approach for the statistical modelling was to start with a basic simple approach and if this did not work concerning model and test assumptions, then move on to more advanced statistical approaches. This is the main reason why no generalised linear modelling or generalized additive models (GAM-models) (e.g. Zuur et al., 2009) were used, although they clearly lay within the range of possible methods for the univariate models employed. The continuous response functions approach of Ewers & Didham (2006) provides and interesting alternative to modelling if the edge effects had been the main focus of the research. This approach has clear similarities to the Huisman-Olff-Fresco (HOF) models of Huisman et al. (1993), which have been extended by bimodal response curves and some other interesting functionalities by Jansen & Oksanen (2013). However, there might still be concerns about spatial dependence between the different sampling distances that have to be incorporated in the modelling. To deal with such spatial dependence within a mixed model framework, it can often be sufficient to include a suitable covariance structure for random effects (Zuur et al., 2009), as was done in Paper IV but not in Paper I for the split-plot modelling. Spatial modelling and non-linear approaches to forest edge effects would clearly be interesting subjects for further research.
7.5 Aspects beyond the scope of the thesis
7.5.1 Other aspects of urban and infrastructure environments
This thesis departs from the standpoint that forest edges, as part of urban and infrastructure environments, benefit from design and management approaches adapted to the specific constraints imposed by the surrounding land use. However, many important aspects of urban forest edges and infrastructure environments have been beyond the scope of this thesis, such as increased trampling (Florgård, 2000; Lehvävirta & Rita, 2002; Hamberg et al., 2008, 2010b; Lehvävirta et al., 2014) and other socioecological edge effects (Matlack, 1993b), urban heat island effects (Oke, 1973), increased pollution and nutrient deposition (Hamberg et al., 2009b; Vallet et al., 2010; Trammel et al., 2011a), landfills from construction work (Trammel et al., 2011b) and changes in propagule dispersal (Westermann, 2001; Levey et al., 2005; Penone et al., 2012; Concepción et al., 2015) and browsing patterns (Forman & Alexander, 1998; Seiler, 2005).

93
7.5.2 Ecological traps
One concern regarding forest edges and other habitats in infrastructure environments are that they might work as ecological traps for animals through traffic collisions (e.g. Gilroy & Sutherland, 2007; Helldin et al., 2015). Such effects were beyond the scope of this thesis, but should be considered in the management planning of forest edges in infrastructure environments. Helldin et al. (2015) suggest that such hazards can be minimised by directing the habitat improvement to the parts of the infrastructure corridor most distant from traffic. Therefore preferable a section of grassland/meadow vegetation should be maintained closest to infrastructure with a high amount of vehicles. Although flower-rich verges might induce mortality in insects though traffic collisions, Munguira & Thomas (1992), Hopwood (2008) and Skórka et al. (2013) point out that this is outweighed by the benefits of the infrastructure habitat. Such an approach would also support better lines of sight, reduce the collision risk and improve the overall forest edge habitat (Munguira & Thomas, 1992; Seiler et al., 2011).
7.5.3 One among many forest edge types
The focus of this thesis was on graded forest edge and related, more complex forest edge structures. As underlined by e.g. Andersen & Hübertz (1994), the goal in a landscape context should be to support as high diversity of different forest edge structures and species compositions as possible, rather than the same high diversity within each single forest edge. The same notion is raised by Larsen & Nielsen (2012), following Tregay (1986), that experienced based values are largely a product of the variation and assembly of different forest edge types in the landscape. This emphasise that the graded forest edge profiles research in this thesis should be seen as part of a wide variety of different forest edge types that can and should be used in different settings. As an example, in many settings the functions of a graded forest edge have to be weighed against the fact that it gives rise to lower visual penetration and physical access between forest interior and its surroundings. Depending on the spatial configuration of the forest edges, this can be considered a major disservice, since it often decreases the perceived personal safety (Jorgensen et al., 2002, Jansson et al., 2013). In such situations a visually open forest edge is more suitable. One important question to address in relation to this is how to obtain more visually open forest edges with high species diversity and complex structures. Resources needed to achieve different forest edge types must be included in such decisions, since species composition, spatial configuration and environmental characteristics will influence the management input needed to

94
guide the system towards wanted functions. Frameworks and knowledge on how to achieve this need further research and practical testing.
7.5.4 Direct seeding
Forest edges established by planting seedlings of desired shrub and tree species as researched in Alnarps Västerskog has parallels to direct seeding. Not only lower establishment costs of seeding might be considered interesting but also the spatial extinction patterns that often follow seeding, since this can be expected to give rise to more heterogeneous structures. Direct seeding for the establishment of trees has been investigated in several studies (e.g. Löf et al., 2004; Madsen & Löf, 2005), but the same cannot be said for shrub species. Although a few practical examples exist (Anon, 2004), to my knowledge research and practical experience of establishing forest edges through direct seeding is sparse. By using existing knowledge of seeding of trees together with horticultural information about shrub propagation from seeds of indigenous shrubs (Kopp, 1987; Schon & Schmalen, 1992) and knowledge of rodent predation on shrub species seeds (Kollmann et al., 1998; Jinks et al., 2012), the possibility of direct seeding for establishment of forest edges is an interesting prospect for future investigation.
7.5.5 Gradient turnover and edge effects
Species turnover and compositional change are often used as ways of detecting ecotones. However, as heterogeneity and complexity are key features of forest systems (Levin, 2005; Kuuluvainen, 2009; Messier et al., 2015), distinguishing actual edge effects from the product of ‘natural’ turnover inside the forest may be problematic. One important aspect that was not examined in depth in this thesis was that the magnitude of ‘edge effects’ on structural attributes was closely related to intrinsic gradients in soil moisture and indicated site fertility. However, this is generally not discussed in relation to differences in reported edge effects in the literature. Although the distinction between mesic and xeric forest when selecting forest for investigation clearly implies that the aspect was taken into consideration by e.g. Hamberg (2009), it is seldom explicitly discussed. This type of discussion would probably also provide an interesting framework for interpreting the differences reported concerning site orientation aspects. For example, wet and fertile forest edge types could be assumed to be more resistant to edge effects across a south-facing edge than poor mesic forest edge types. However, higher productivity might influence structural composition and leaf area, inducing feedback mechanisms that influence the results (Murcia, 1995). The ability of species to handle the stress of shade compared with e.g. water stress will also affect such aspects.
95
7.5.6 Browsing dynamics
Species dominance and community composition are greatly affected by browsing patterns (Gill & Beardall, 2001). Most species can be subject to browsing, but some are more frequently browsed than others and this may depend on season as well as the overall species composition in the landscape (Kalén, 2004). Browsing dynamics in the landscape are complex (Månsson et al., 2012) and are determined by e.g. population size of browsers, snow depth, season and number of disturbing vehicles. Moreover, landscape configuration and human density can affect the movements of large ungulates in relation to urban and infrastructure environments (Seiler, 2005; Olsson et al., 2011). Neumann et al. (2013) and Bartzke et al. (2015) have shown that human-induced disturbance such as traffic decreases the number of large ungulates in relation to roads and the same is believed to apply to railways (Seiler et al., 2011). A high urban density or a large amount of vehicles will hence probably affect the browsing patterns on vegetation. For example, Hamberg (2009) mentions this as a “hidden” reason for the higher abundance of Sorbus aucuparia in Finnish urban forest edges. In Papers I and III, the browsing was reduced by the initial fencing and field observation concluded that it was less important than crown competition. However, future evaluation of the ZSC trial (simulated in Paper III) will have to take the browsing aspect into consideration. For Papers II and IV, it is not possible to entangle browsing as an individual environmental characteristic, and instead it has to be interpreted as partly contained within the landscape structure. The large amount of rail traffic reported on Southern Main Line according to (Seiler et al., 2015) clearly indicates that it creates a barrier that hinders and frightens some animals from crossing it. How this affects the browsing pattern in the management corridor needs further investigation, including the trade-offs between the forage resources of the regrowth in the new management corridor in relation to the large food resources of power lines and clearcuts in surrounding landscapes. The ‘relocation’ of the forest edge away from railroads, as done by the Swedish Transport Administration through the extension of the management corridor to 20 m, most likely will help to decrease the amount of collisions. Continuous non-selective full clearing will result in a large amount of stems in the range 0.3 to 3 m, which is considered the general browsing height of larger ungulates in the Swedish landscape (Kalén, 2004). However, Götmark et al. (2005) and Leonardsson et al. (2015) report limited browsing for oaks (Quercus spp.) under 0.5 m height. Steering the regrowth past this release height from browsing in the new management corridor and keeping the

96
vegetation height in the old management corridor as low as possible is hence critical in the creation of graded forest edges and decreasing wildlife collisions. How different forest edge management systems and structures are affected by and affect browsing is an important research topic for the future. One important aspect is how much browsing different species can sustain in relation to its recruitment, for example Edenius & Ericsson (2014) have shown that although Sorbus aucuparia is more prone to be browsed than Populus tremula, it is also able to sustain higher levels of browsing. Edenius & Ericsson (2014) also found that the recruitment capacity of these two species is related to site productivity. Some species that are more prone to browsing can be facilitated by protection from other vegetation (e.g. Jensen et al., 2012). An important management aspect to consider is hence how different species react to being liberated from crown competition but also browsing protection.
In a 10-year fenced trial with conservation thinning to promote oak regeneration in 13 mixed oak forests in Southern Sweden, Leonardsson et al. (2015) found that Sorbus aucuparia, Quercus species and Populus tremula were favoured by fencing but that the dominating shrub species, Corylus avellana and Frangula alnus, were more or less unaffected. The shrub species as a group also had a higher annual height increment above 130 cm than the broadleaved tree species in both fenced and unfenced areas. Although that trial was not conducted in a forest edge situation, it indicates that selective cutting giving rise to intermediate light regimes might be beneficial for shrub species and that they are not browsed away per se. Another aspect worth considering is that slash material left behind from cuttings has been reported to have a reducing effect (Grisez, 1960; Putman, 1994) or no effect (Fredericksen et al., 1998; Edenius et al., 2014) on the browsing of seedlings and sprouts of coppiced trees.
7.5.7 The ‘uncertainty’ of history
Woody composition and structure is to large extent a product of earlier land use and history spanning back several hundred years (e.g. Rackham, 2006; Emanuelsson, 2009). This aspect was not evaluated in detail in the thesis. Detailed explorations including historical records and/or dendrochronological studies are interesting possibilities for further research concerning forest edges. Due to incomplete information and time constrains the former management of the forests bordering SML was not included in the analysis. In general, management intensity has been lower in the forest edge towards SML than in the surrounding landscape, as many landowners avoid felling direct alongside railway lines (Trafikverket, pers. comm. 2015). However, the high dominance of the two main commercial species Picea abies and Pinus sylvestris clearly

97
suggest influence of forest management. One could also argue that on many sites these species ‘naturally’ dominate in later successional stages (Sjörs, 1967; Lindbladh et al., 2014), although forestry practices often speed up the process and enforce their dominance. Despite the magnitude of management effects on species composition in the stand, one can expect that the factual abundance recorded will lead to a high propagule pressure from the stand on the new management corridor established around SML. Therefore the eventual possibility of Picea abies and Pinus sylvestris dominance over time is high, although the appearance today might be a ‘commercial exaggeration’ of what would otherwise be a more ‘natural’ composition.

98

99
8 Outlook
This thesis has contributed empirically substantiated information on how stationary graded forest edges in infrastructure and urban environments developed concerning woody species composition and vegetation structure. Based on the empirical findings, design and management concepts have been conceptualised and implemented in the establishment of three controlled experimental forest edge trials. The research has prompted the following topics and ideas for further research:
Defining suitable crown and growth models for shrub and shrub-tree species to support modelling approaches of forest edge development
Applying spatial modelling and indices in forest edge studies Inclusion of land use history and agent-based modelling of herbivores
in studies of forest edge along long complex environmental gradients Establishment of management trials of forest edges including the
browsing component Trials where different management and design concepts are tested
parallel Utility analysis of different management options in urban and
infrastructure environments combining empirical data and expert judgments of costs, biodiversity and other benefits.
Upscaling of the impact of different management options to landscape level using trial data, expert judgments, uncertainty analysis and spatial modelling.
Conceptualisation of design and management approaches for other edge types than stationary graded forest edges
Re-inventories of existing forest edge surveys to promote temporal datasets and long-term evaluation
Dendrochronological studies of forest edges in relation to land use history and environmental gradients

100
Preference studies of different management alternatives and different planting design strategies.
Studies of browsing behaviour in relation to infrastructure, landscape structure and forest edge species composition and structure
Meta-analysis of forest edge effects studies, including covariates of basic soil and climate aspects.
101
”Ett ej litet antal av stockholmstraktens träd och framför allt buskar har här
stämt möte. Det är alm, ask, rönn oxel, hägg, getapel, brakved, olvon, måbär,
hallon, try, Rosa-arter – såväl de kroktaggiga lianerna som de låga raktaggia
buskarna – samt rund – och spetshagtorn. Det är en fröjd att i den ljuva
årstiden Pomona se snåren lysa vita av häggens, slånens och hagtornens fina
blommor, vilka fylla luften med sina mättade amin-dofter. Rosornas skära
blomsterprakt behärskar högsommaren, berberisbärens scharlakan och
spetshagtornens korall hösten och vintern. Snåren ge skydd och hägn åt ett rikt
småfågelliv.”
“No small number of Stockholm’s trees and particularly shrubs meet here.
There is elm, ash, rowan, whitebeam, birdcherry, buckthorn, alder buckthorn,
guilder-rose, mountain currant, raspberry, honeysuckle, roses, both climbing
and shrub, and common and midland hawthorn. It’s a delight in the season of
Pomona to see the thickets and scrub shine white with the blossom of
birdcherry, blackthorn and hawthorn that saturates the air with its heady
aroma. The pink of roses dominates the high summer, the scarlet of berberis and
the red of hawthorns the winter. The scrub provides shelter and protection for a
wealth of small birds.” (Freely translated)
Quote from Rutger Serander’s (1926) book Stockholms Natur (page 176-177)
describing the setting for Ålstensparken, one of the first nature parks in Stockholm
that marked the change from garden-like parks to integrating and developing
existing vegetation into that era’s ‘green infrastructure’ of nature parks in Stockholm
(Andersson, 2000).

102

103
9 References
Alignier, A. & Deconchat, M. (2013). Patterns of forest vegetation responses to edge effect as
revealed by a continuous approach. Annals of Forest Science, 70(6), pp. 601-609.
Andel, v.J. & Grootjans, A.P. (2006). Concepts in restoration ecology. In: Andel, v.J. &
Aronsson, J. (eds) Restoration ecology. Blackwell science, pp. 16-28.
Andersen, S.S. & Hübertz, H. (1994). Anvisninger til anlœg, drift og pleje af skovbryn. Dansk
Skovbrugs Tidskrift, 79(1), pp. 101-128.
Andersen, S.S., Hübertz, H. & Nielsen, T.S. (1994). Trœer og buske i skovbryn –
artsammensœtning og struktur. Dansk Skovbrugs Tidskrift, 79(1), pp. 18-36.
Anderson, M.A. & Buckley, G.P. (1989). Managing edge vegetation. In: Ferris-Kaan, R. (ed.)
Edge management in woodlands Occasional Paper 28. Farnham: Forestry Commission, pp. 5-
10.
Andersson, T. (2000). Utanför staden - Parker i Stockholms förorter. Stockholm: Stockholmia
förlag
Anon (2004). Woodland Edge Enhancement. Habitat Management Fact Sheet. Indiana: Division
of Fish & Wildlife.
Arenas, J.M., Escudero, A., Magro, S., Balaguer, L. & Casado, M.A. (2015). Woody colonization
of road embankments: A large spatial scale survey in central Spain. Landscape and Urban
Planning, 141, pp. 52-58.
Aristotle (350a, BC). Physics II. Translated by R. P. Hardie and R. K. Gaye. Retrieved 20150910
from: http:// classics.mit.edu/Aristotle/physics.2.ii.html
Aristotle (350b, BC). Metaphysics V. Translated by W. D. Ross. Retrieved 20150910 from:
http:// classics.mit.edu/Aristotle/metaphysics.5.v.html
Argyris, C. (1993). Knowledge for action. A guide to overcomming barriers to organizational
change. San Fransisco: Jossey-Bass.
Aune-Lundberg, L. & Strand, G.-H. (2014). Comparison of variance estimation methods for use
with two-dimensional systematic sampling of land use/land cover data. Environmental
Modelling & Software, 61, pp. 87-97.
Austin, M.P. (1980). Searching for a model for use in vegetation analysis. Vegetatio, 42(1-3), pp.
11-21.
Austin, M.P. (1985). Continuum concept, ordination methods, and niche theory. Annual Review
of Ecology and Systematics, 16, pp. 39-61.
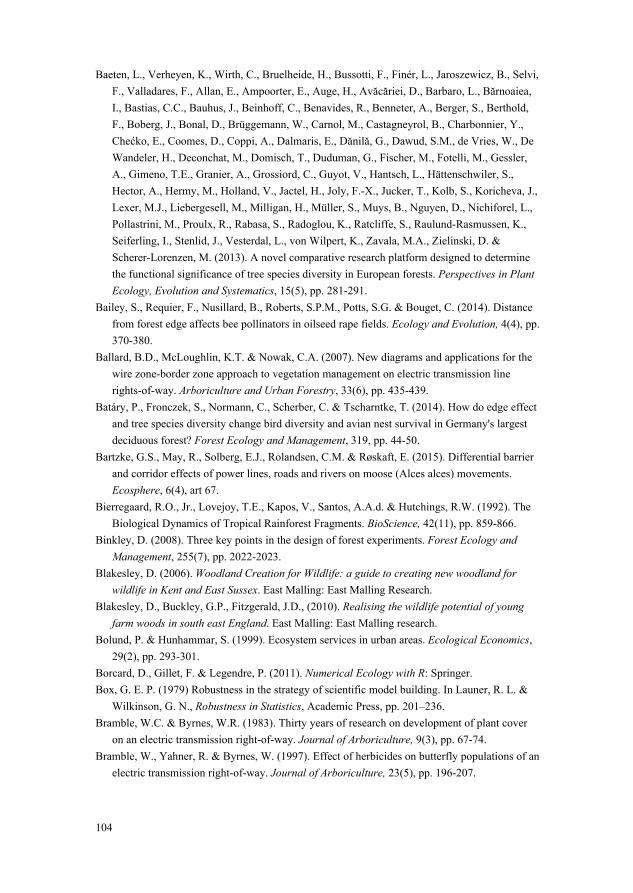
104
Baeten, L., Verheyen, K., Wirth, C., Bruelheide, H., Bussotti, F., Finér, L., Jaroszewicz, B., Selvi,
F., Valladares, F., Allan, E., Ampoorter, E., Auge, H., Avăcăriei, D., Barbaro, L., Bărnoaiea,
I., Bastias, C.C., Bauhus, J., Beinhoff, C., Benavides, R., Benneter, A., Berger, S., Berthold,
F., Boberg, J., Bonal, D., Brüggemann, W., Carnol, M., Castagneyrol, B., Charbonnier, Y.,
Chećko, E., Coomes, D., Coppi, A., Dalmaris, E., Dănilă, G., Dawud, S.M., de Vries, W., De
Wandeler, H., Deconchat, M., Domisch, T., Duduman, G., Fischer, M., Fotelli, M., Gessler,
A., Gimeno, T.E., Granier, A., Grossiord, C., Guyot, V., Hantsch, L., Hättenschwiler, S.,
Hector, A., Hermy, M., Holland, V., Jactel, H., Joly, F.-X., Jucker, T., Kolb, S., Koricheva, J.,
Lexer, M.J., Liebergesell, M., Milligan, H., Müller, S., Muys, B., Nguyen, D., Nichiforel, L.,
Pollastrini, M., Proulx, R., Rabasa, S., Radoglou, K., Ratcliffe, S., Raulund-Rasmussen, K.,
Seiferling, I., Stenlid, J., Vesterdal, L., von Wilpert, K., Zavala, M.A., Zielinski, D. &
Scherer-Lorenzen, M. (2013). A novel comparative research platform designed to determine
the functional significance of tree species diversity in European forests. Perspectives in Plant
Ecology, Evolution and Systematics, 15(5), pp. 281-291.
Bailey, S., Requier, F., Nusillard, B., Roberts, S.P.M., Potts, S.G. & Bouget, C. (2014). Distance
from forest edge affects bee pollinators in oilseed rape fields. Ecology and Evolution, 4(4), pp.
370-380.
Ballard, B.D., McLoughlin, K.T. & Nowak, C.A. (2007). New diagrams and applications for the
wire zone-border zone approach to vegetation management on electric transmission line
rights-of-way. Arboriculture and Urban Forestry, 33(6), pp. 435-439.
Batáry, P., Fronczek, S., Normann, C., Scherber, C. & Tscharntke, T. (2014). How do edge effect
and tree species diversity change bird diversity and avian nest survival in Germany's largest
deciduous forest? Forest Ecology and Management, 319, pp. 44-50.
Bartzke, G.S., May, R., Solberg, E.J., Rolandsen, C.M. & Røskaft, E. (2015). Differential barrier
and corridor effects of power lines, roads and rivers on moose (Alces alces) movements.
Ecosphere, 6(4), art 67.
Bierregaard, R.O., Jr., Lovejoy, T.E., Kapos, V., Santos, A.A.d. & Hutchings, R.W. (1992). The
Biological Dynamics of Tropical Rainforest Fragments. BioScience, 42(11), pp. 859-866.
Binkley, D. (2008). Three key points in the design of forest experiments. Forest Ecology and
Management, 255(7), pp. 2022-2023.
Blakesley, D. (2006). Woodland Creation for Wildlife: a guide to creating new woodland for
wildlife in Kent and East Sussex. East Malling: East Malling Research.
Blakesley, D., Buckley, G.P., Fitzgerald, J.D., (2010). Realising the wildlife potential of young
farm woods in south east England. East Malling: East Malling research.
Bolund, P. & Hunhammar, S. (1999). Ecosystem services in urban areas. Ecological Economics,
29(2), pp. 293-301.
Borcard, D., Gillet, F. & Legendre, P. (2011). Numerical Ecology with R: Springer.
Box, G. E. P. (1979) Robustness in the strategy of scientific model building. In Launer, R. L. &
Wilkinson, G. N., Robustness in Statistics, Academic Press, pp. 201–236.
Bramble, W.C. & Byrnes, W.R. (1983). Thirty years of research on development of plant cover
on an electric transmission right-of-way. Journal of Arboriculture, 9(3), pp. 67-74.
Bramble, W., Yahner, R. & Byrnes, W. (1997). Effect of herbicides on butterfly populations of an
electric transmission right-of-way. Journal of Arboriculture, 23(5), pp. 196-207.

105
Breuste, J.H. (2004). Decision making, planning and design for the conservation of indigenous
vegetation within urban development. Landscape and Urban Planning, 68(4), pp. 439-452.
Brothers, T.S. & Spingarn, A. (1992). Forest Fragmentation and Alien Plant Invasion of Central
Indiana Old-Growth Forests. Conservation Biology, 6(1), pp. 91-100.
Bruelheide, H., Nadrowski, K., Assmann, T., Bauhus, J., Both, S., Buscot, F., Chen, X.-Y., Ding,
B., Durka, W., Erfmeier, A., Gutknecht, J.L.M., Guo, D., Guo, L.-D., Härdtle, W., He, J.-S.,
Klein, A.-M., Kühn, P., Liang, Y., Liu, X., Michalski, S., Niklaus, P.A., Pei, K., Scherer-
Lorenzen, M., Scholten, T., Schuldt, A., Seidler, G., Trogisch, S., von Oheimb, G., Welk, E.,
Wirth, C., Wubet, T., Yang, X., Yu, M., Zhang, S., Zhou, H., Fischer, M., Ma, K. & Schmid,
B. (2014). Designing forest biodiversity experiments: general considerations illustrated by a
new large experiment in subtropical China. Methods in Ecology and Evolution, 5(1), pp. 74-
89.
Bubi, J.W. (2009). Created grassland diversity after 12 years of moving in southern Sweden. MSc
Thesis in Biology of conservation. University of Nairobi.
Bucht, E. (1997). Public parks in Sweden 1860-1960. Diss. Alnarp: Swedish University of
Agricultural Sciences.
Bucht, E. (2002). Traditions in urban park planning and management in Sweden and other
european countries. In: Randrup, T.B. (ed). Urban forest and tress; Proceedings No 1. Cost
Action E12. Directorate-General for research, EUR 19861. Brussels, pp. 215-227.
Buckley, G.P., Howell, R., Watt, T.A., Ferris-Kaan, R. & Anderson, M.A. (1997a). Vegetation
succession following ride edge management in lowland plantations and woods. 1. The
influence of site factors and management practices. Biological Conservation, 82(3), pp. 289-
304.
Buckley, G.P., Howell, R. & Anderson, M.A. (1997b). Vegetation succession following ride edge
management in lowland plantations and woods. 2. The seed bank resource. Biological
Conservation, 82(3), pp. 305-316.
Cadenasso, M.L. & Pickett, S.T.A. (2001). Effect of edge structure on the flux of species into
forest interiors. Conservation Biology, 15(1), pp. 91-97.
Cadenasso, M.L., Pickett, S.T.A., Weathers, K.C., Bell, S.S., Benning, T.L., Carreiro, M.M. &
Dawson, T.E. (2003). An Interdisciplinary and Synthetic Approach to Ecological Boundaries.
BioScience, 53(8), pp. 717-722.
Cain, M.L., Milligan, B.G. & Strand, A.E. (2000). Long-distance seed dispersal in plant
populations. American Journal of Botany, 87(9), pp. 1217-1227.
Callaway, R.M. & Walker, L.R. (1997). Competition and facilitation: A synthetic approach to
interactions in plant communities. Ecology, 78(7), pp. 1958-1965.
Chabrerie, O., Jamoneau, A., Gallet-Moron, E. & Decocq, G. (2013). Maturation of forest edges
is constrained by neighbouring agricultural land management. Journal of Vegetation Science,
24(1), pp. 58-69.
Chen, J., Franklin, J.F. & Spies, T.A. (1992). Vegetation Responses to Edge Environments in
Old-Growth Douglas-Fir Forests. Ecological Applications, 2(4), pp. 387-396.
Chen, J., Franklin, J.F. & Spies, T.A. (1993). Contrasting microclimates among clearcut, edge,
and interior of old-growth Douglas-fir forest. Agricultural and Forest Meteorology, 63(3–4),
pp. 219-237.
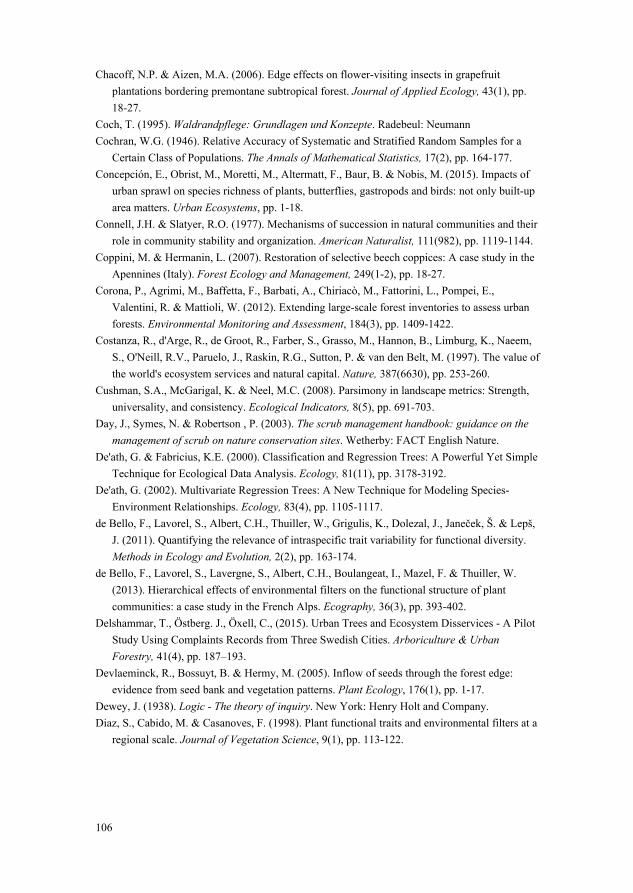
106
Chacoff, N.P. & Aizen, M.A. (2006). Edge effects on flower-visiting insects in grapefruit
plantations bordering premontane subtropical forest. Journal of Applied Ecology, 43(1), pp.
18-27.
Coch, T. (1995). Waldrandpflege: Grundlagen und Konzepte. Radebeul: Neumann
Cochran, W.G. (1946). Relative Accuracy of Systematic and Stratified Random Samples for a
Certain Class of Populations. The Annals of Mathematical Statistics, 17(2), pp. 164-177.
Concepción, E., Obrist, M., Moretti, M., Altermatt, F., Baur, B. & Nobis, M. (2015). Impacts of
urban sprawl on species richness of plants, butterflies, gastropods and birds: not only built-up
area matters. Urban Ecosystems, pp. 1-18.
Connell, J.H. & Slatyer, R.O. (1977). Mechanisms of succession in natural communities and their
role in community stability and organization. American Naturalist, 111(982), pp. 1119-1144.
Coppini, M. & Hermanin, L. (2007). Restoration of selective beech coppices: A case study in the
Apennines (Italy). Forest Ecology and Management, 249(1-2), pp. 18-27.
Corona, P., Agrimi, M., Baffetta, F., Barbati, A., Chiriacò, M., Fattorini, L., Pompei, E.,
Valentini, R. & Mattioli, W. (2012). Extending large-scale forest inventories to assess urban
forests. Environmental Monitoring and Assessment, 184(3), pp. 1409-1422.
Costanza, R., d'Arge, R., de Groot, R., Farber, S., Grasso, M., Hannon, B., Limburg, K., Naeem,
S., O'Neill, R.V., Paruelo, J., Raskin, R.G., Sutton, P. & van den Belt, M. (1997). The value of
the world's ecosystem services and natural capital. Nature, 387(6630), pp. 253-260.
Cushman, S.A., McGarigal, K. & Neel, M.C. (2008). Parsimony in landscape metrics: Strength,
universality, and consistency. Ecological Indicators, 8(5), pp. 691-703.
Day, J., Symes, N. & Robertson , P. (2003). The scrub management handbook: guidance on the
management of scrub on nature conservation sites. Wetherby: FACT English Nature.
De'ath, G. & Fabricius, K.E. (2000). Classification and Regression Trees: A Powerful Yet Simple
Technique for Ecological Data Analysis. Ecology, 81(11), pp. 3178-3192.
De'ath, G. (2002). Multivariate Regression Trees: A New Technique for Modeling Species-
Environment Relationships. Ecology, 83(4), pp. 1105-1117.
de Bello, F., Lavorel, S., Albert, C.H., Thuiller, W., Grigulis, K., Dolezal, J., Janeček, Š. & Lepš,
J. (2011). Quantifying the relevance of intraspecific trait variability for functional diversity.
Methods in Ecology and Evolution, 2(2), pp. 163-174.
de Bello, F., Lavorel, S., Lavergne, S., Albert, C.H., Boulangeat, I., Mazel, F. & Thuiller, W.
(2013). Hierarchical effects of environmental filters on the functional structure of plant
communities: a case study in the French Alps. Ecography, 36(3), pp. 393-402.
Delshammar, T., Östberg. J., Öxell, C., (2015). Urban Trees and Ecosystem Disservices - A Pilot
Study Using Complaints Records from Three Swedish Cities. Arboriculture & Urban
Forestry, 41(4), pp. 187–193.
Devlaeminck, R., Bossuyt, B. & Hermy, M. (2005). Inflow of seeds through the forest edge:
evidence from seed bank and vegetation patterns. Plant Ecology, 176(1), pp. 1-17.
Dewey, J. (1938). Logic - The theory of inquiry. New York: Henry Holt and Company.
Diaz, S., Cabido, M. & Casanoves, F. (1998). Plant functional traits and environmental filters at a
regional scale. Journal of Vegetation Science, 9(1), pp. 113-122.

107
Diaz, A.M., Alonso, M.L.S. & Gutiérrez, M.R.V.-A. (2008). Biological traits of stream
macroinvertebrates from a semi-arid catchment: patterns along complex environmental
gradients. Freshwater Biology, 53(1), pp. 1-21.
Didham, R.K. & Lawton, J.H. (1999). Edge structure determines the magnitude of changes in
microclimate and vegetation structure in tropical forest fragments. Biotropica, 31(1), pp. 17-
30.
Dierschke, H. (1974). Saumgesellschaften im vegetations- und standortgefälle and waldrändern.
Scripta Geobotanica, Band 6. Göttingen: Verlag Erich Goltze KG.
Diekelmann, J. & Schuster, R. (2002). Edges: transitional landscapes. In: Diekelmann, J. &
Schuster, R. (eds) Natural landscaping: designing with native plant communities. 2nd edition.
ed. Madison: The university of Wisconsin press, pp. 187-199.
Douven, I. (2011). Abduction. The Stanford Encyclopedia of Philosophy (Spring 2011 Edition),
Zalta E.N. (ed.), stable URL = http://plato.stanford.edu/archives/spr2011/entries/abduction/
Dreyer, G.D. & Niering, W.A. (1986). Evaluation of two herbicide techniques on electric
transmission rights-of-way: development of relatively stable shrublands. Environmental
Management, 10(1), pp. 113-118.
Dufrene, M. & Legendre, P. (1997). Species Assemblages and Indicator Species: The Need for a
Flexible Asymmetrical Approach. Ecological Monographs, 67(3), pp. 345-366.
Dunnet, N. (2004). Shrub mosaics and woodland edge. `Natural´ models for shrub planting. In:
Hitchmough, J. & Fileldhouse, K. (eds) Plant user handbook. Oxford: Blackwell Publishing,
pp. 167-174.
Dupont, S. & Brunet, Y. (2008). Impact of forest edge shape on tree stability: A large-eddy
simulation study. Forestry, 81(3), pp. 299-315.
Ebeling, A., Klein, A.M., Schumacher, J., Weisser, W.W. & Tscharntke, T. (2008). How does
plant richness affect pollinator richness and temporal stability of flower visits? Oikos,
117(12), pp. 1808-1815.
Edenius, L., Roberge, J.-M., Månsson, J. & Ericsson, G. (2014). Ungulate-adapted forest
management: effects of slash treatment at harvest on forage availability and use. European
Journal of Forest Research, 133(1), pp. 191-198.
Edenius, L. & Ericsson, G. (2014). Effects of ungulate browsing on recruitment of aspen and
rowan: a demographic approach. Scandinavian Journal of Forest Research, 30(4), pp. 283-
288.
Egler, F. (1954). Vegetation science concepts I. Initial floristic composition, a factor in old-field
vegetation development. Vegetatio, 4(6), pp. 412-417.
El-Hamdouchi, A. & Willett, P. (1989). Comparison of Hierarchic Agglomerative Clustering
Methods for Document Retrieval. The Computer Journal, 32(3), pp. 220-227.
Ellenberg, H. (1988). Vegetation Ecology of Central Europe. Cambridge: Cambridge University
Press.
Emanuelsson, U. (2009). The rural landscapes of Europe: how man has shaped European nature.
Stockholm: Swedish Research Council Formas.
Esseen, P.A. (1994). Tree mortality patterns after experimental fragmentation of an old- growth
conifer forest. Biological Conservation, 68(1), pp. 19-28.
108
Esseen, P.A., Glimskär. A. & Ståhl, G. (2004). Linjära landskapselement i Sverige: skattningar
från 2003 års NILS-data. Umeå: Swedish University of Agricultural Sciences.
Esseen, P.A., Jansson, K.U. & Nilsson, M. (2006). Forest edge quantification by line intersect
sampling in aerial photographs. Forest Ecology and Management, 230(1-3), pp. 32-42.
Euskirchen, E.S., Chen, J. & Bi, R. (2001). Effects of edges on plant communities in a managed
landscape in northern Wisconsin. Forest Ecology and Management, 148(1-3), pp. 93-108.
Ewers, R.M. & Didham, R.K. (2006). Continuous response functions for quantifying the strength
of edge effects. Journal of Applied Ecology, 43(3), pp. 527-536.
Fajardo, A. & McIntire, E.J.B. (2011). Under strong niche overlap conspecifics do not compete
but help each other to survive: Facilitation at the intraspecific level. Journal of Ecology, 99(2),
pp. 642-650.
Falcon, A. (2015). Aristotle on Causality, The Stanford Encyclopedia of Philosophy (Spring 2015
Edition) Zalta, E.N. (ed.), stable URL:
http://plato.stanford.edu/archives/spr2015/entries/aristotle-causality/
Fankhauser, S., Smith, J.B. & Tol, R.S.J. (1999). Weathering climate change: some simple rules
to guide adaptation decisions. Ecological Economics, 30(1), pp. 67-78.
Fauth, J.E., Bernardo, J., Camara, M., Resetarits, W.J., Jr., Buskirk, J.V. & McCollum, S.A.
(1996). Simplifying the Jargon of Community Ecology: A Conceptual Approach. The
American Naturalist, 147(2), pp. 282-286.
Ferris-Kaan, R. (ed.) (1989). Edge Management in Woodlands. Farnham: Forestry Commission.
Ferris, R.& Carter, C. (2000). Managing rides, roadsides and edge habitats in lowland forests.
Forestry commission bulletin 123. Edinburgh: Forestry commission.
Filotas, E., Parrott, L., Burton, P.J., Chazdon, R.L., Coates, K.D., Coll, L., Haeussler, S., Martin,
K., Nocentini, S., Puettmann, K.J., Putz, F.E., Simard, S.W. & Messier, C. (2014). Viewing
forests through the lens of complex systems science. Ecosphere, 5(1), art 1.
Fitter, A. & Peat, H. (1994). The Ecological Flora Database. Journal of Ecology, 82(2), pp. 415-
425.
Florgård, C. (2000). Long-term changes in indigenous vegetation preserved in urban areas.
Landscape and Urban Planning, 52(2-3), pp. 101-116.
Forman, R.T.T. & Alexander, L.E. (1998). Roads and their major ecological effects Annual
Review of Ecology and Systematics, 29(1), pp. 207-231.
Forman, R.T.T., Sperling, D., Bissonette, J. A., Clevenger, A. P., Cutshall, C. D., Dale, V. H.,
Fahrig, L., France, R., Goldman, C. R., Heanue, K., Jones, J. A., Swanson, F. J., Turrentine,
T., Winter, T. C., (2003). Road Ecology: Science and Solutions. Washington, D.C.: Island
Press.
Fredericksen, T.S., Ross, B., Hoffman, W., Lester, M., Beyea, J., Morrison, M.L. & Johnson,
B.N. (1998). Adequacy of natural hardwood regeneration on forestlands in northeastern
Pennsylvania. Northern Journal of Applied Forestry, 15(3), pp. 130-134.
Fry, G. & Sarlöv-Herlin, I. (1997). The ecological and amenity functions of woodland edges in
the agricultural landscape, a basis for design and management. Landscape and Urban
Planning, 37(1-2), pp. 45-55.
109
Gallegos Torell. Å. (ed) (2011). Fältinstruktion för Nationell Inventering av Landskapet i Sverige,
NILS 2011. Institutionen för skoglig resurshushållning. Umeå: Swedish University of
Agricultural Sciences.
Garnier, E., Lavorel, S., Ansquer, P., Castro, H., Cruz, P., Dolezal, J., Eriksson, O., Fortunel, C.,
Freitas, H., Golodets, C., Grigulis, K., Jouany, C., Kazakou, E., Kigel, J., Kleyer, M., Lehsten,
V., Lepš, J., Meier, T., Pakeman, R., Papadimitriou, M., Papanastasis, V.P., Quested, H.,
Quétier, F., Robson, M., Roumet, C., Rusch, G., Skarpe, C., Sternberg, M., Theau, J.-P.,
Thébault, A., Vile, D. & Zarovali, M.P. (2007). Assessing the Effects of Land-use Change on
Plant Traits, Communities and Ecosystem Functioning in Grasslands: A Standardized
Methodology and Lessons from an Application to 11 European Sites. Annals of Botany, 99(5),
pp. 967-985.
Geiger, R. (1965). The climate near the ground. Cambridge, Massahusetts: Harvard University
Press.
Gill, R.M.A. & Beardall, V. (2001). The impact of deer on woodlands: the effects of browsing
and seed dispersal on vegetation structure and composition. Forestry, 74(3), pp. 209-218.
Gilroy, J.J. & Sutherland, W.J. (2007). Beyond ecological traps: perceptual errors and
undervalued resources. Trends in Ecology & Evolution, 22(7), pp. 351-356.
Giovannini, G., Perulli, D., Piussi, P. & Salbitano, F. (1992). Ecology of vegetative regeneration
after coppicing in macchia stands in central Italy. Vegetatio, 99-100(1), pp. 331-343
Grafström, A., Lundström, N.L.P. & Schelin, L. (2012). Spatially Balanced Sampling through the
Pivotal Method. Biometrics, 68(2), pp. 514-520.
Grashof-Bokdam, C. (1997). Forest species in an agricultural landscape in the Netherlands:
Effects of habitat fragmentation. Journal of Vegetation Science, 8(1), pp. 21-28.
Grime, J.P. (2001). Plant Strategies, Vegetation Processes, and Ecosystem Properties.
Chichester: Wiley.
Grime, J.P., Hodgson, J.G. & Hunt, R. (2007). Comparative Plant Ecology: A Functional
Approach to Common British Species. Dordrecht: Springer.
Grimm, V. & Wissel, C. (1997). Babel, or the ecological stability discussions: an inventory and
analysis of terminology and a guide for avoiding confusion. Oecologia, 109(3), pp. 323-334.
Grisez, T.J. (1960). Slash helps protect seedlings from deer browse. Journal of Forestry, 58(5),
pp. 385-7.
Gundersen, V., Frivold, L.H., Löfström, I., Jørgensen, B.B., Falck, J. & Øyen, B.-H. (2005).
Urban woodland management – The case of 13 major Nordic cities. Urban Forestry & Urban
Greening, 3(3–4), pp. 189-202.
Gunderson, L.H. (2000). Ecological Resilience - In Theory and Application. Annual Review of
Ecology and Systematics, 31, pp. 425-439.
Gunnarsson, A. & Gustavsson, R. (1989). Etablering av lövträdsplantor. (Establishment of
deciduous trees). (Stad & Land, 71). Alnarp: Swedish University of Agricultural Sciences.
Gustavsson, R. (1986). Struktur i lövskogslandskap (Structure in the broadleaved landscape).
Diss. Alnarp: Swedish University of Agricultural Sciences.
Gustavsson, R. & Ingelög, T. (1994). Det nya landskapet - kunskaper och idéer om naturvård,
skogsodling och planering i kulturbygd. Jönköping: Skogsstyrelsen.

110
Gustavsson, R. (2002). Afforestation in and near urban areas. In: Randrup, T.B. (ed). Urban
forest and tress; Proceedings No 1. Cost Action E12. Directorate-General for research, EUR
19861. Brussels, pp. 286-314.
Gustavsson, R. (2004). Exploring woodland design: designing with complexity and dynamics -
woodland types, their dynamic architecture and establishment. In: Dunnet, N. & Hitchmough,
J. (eds) The dynamic landscape. London: Taylor&Francis, pp. 184-214.
Gustavsson, R., Hermy, M., Konijnendijk, C.C. & Steidle-Schwahn, A. (2005). Management of
urban woodland and parks - Searching for creative and sustainable concepts. In: Konijnendijk,
C.C., Nilsson, K., Randrup, T.B. & Schipperijn, J. (eds) Urban forest and trees. Berlin:
Springer-Verlag, pp. 370-396.
Guzmán-Guzmán, J. & Williams-Linera, G. (2006). Edge Effect on Acorn Removal and Oak
Seedling Survival in Mexican Lower Montane Forest Fragments. New Forests, 31(3), pp. 487-
495.
Götmark, F., Berglund, Å. & Wiklander, K. (2005). Browsing damage on broadleaved trees in
semi-natural temperate forest in Sweden, with a focus on oak regeneration. Scandinavian
Journal of Forest Research, 20(3), pp. 223-234.
Götzenberger, L., de Bello, F., Bråthen, K.A., Davison, J., Dubuis, A., Guisan, A., Lepš, J.,
Lindborg, R., Moora, M., Pärtel, M., Pellissier, L., Pottier, J., Vittoz, P., Zobel, K. & Zobel,
M. (2012). Ecological assembly rules in plant communities—approaches, patterns and
prospects. Biological Reviews, 87(1), pp. 111-127.
Hahn, K., Emborg, J., Larsen, J.B., Madsen, P. (2005). Forest rehabilitation in Denmark using
nature-based forestry. In: Stanturf, J., Madsen, P. (ed.) Restoration of boreal and temperate
forests. London: CRC Press, pp. 299-317.
Hamberg, L., Lehvävirta, S., Malmivaara-Lämsä, M., Rita, H. & Kotze, D.J. (2008). The effects
of habitat edges and trampling on understorey vegetation in urban forests in Helsinki, Finland.
Applied Vegetation Science, 11(1), pp. 83-98.
Hamberg, L. (2009). The effects of habitat edges and trampling intensity on vegetation in urban
forests. Diss. Helsinki: University of Helsinki.
Hamberg, L., Lehvävirta, S. & Kotze, D.J. (2009a). Forest edge structure as a shaping factor of
understorey vegetation in urban forests in Finland. Forest Ecology and Management, 257(2),
pp. 712-722.
Hamberg, L., Malmivaara-Lämsä, M., Lehvävirta, S. & Kotze, D.J. (2009b). The effects of soil
fertility on the abundance of rowan (Sorbus aucuparia L.) in urban forests. Plant Ecology,
204(1), pp. 21-32.
Hamberg, L., Fedrowitz, K., Lehvävirta, S. & Kotze, D.J. (2010a). Vegetation changes at sub-
xeric urban forest edges in Finland - the effects of edge aspect and trampling. Urban
Ecosystems, 13(4), pp. 583-603.
Hamberg, L., Malmivaara-Lämsä, M., Lehvävirta, S., O'Hara, R.B. & Kotze, D.J. (2010b).
Quantifying the effects of trampling and habitat edges on forest understory vegetation - A
field experiment. Journal of Environmental Management, 91(9), pp. 1811-1820.
Hammer, Ø., Harper, D.A.T. & Ryan, P.D. (2001). PAST: paleontological statistics soft-ware
package for education and data analysis. Palaeontologia Electronica, 4, pp. 1-9.

111
Hansson, L. (2000). Edge structures and edge effects on plants and birds in ancient oak-hazel
woodlands. Landscape and Urban Planning, 46(4), pp. 203-207.
Harper, K.A., Macdonald, S.E., Burton, P.J., Chen, J., Brosofske, K.D., Saunders, S.C.,
Euskirchen, E.S., Roberts, D., Jaiteh, M.S. & Esseen, P.A. (2005). Edge influence on forest
structure and composition in fragmented landscapes. Conservation Biology, 19(3), pp. 768-
782.
Healy, C., Gotelli, N.J. & Potvin, C. (2008). Partitioning the effects of biodiversity and
environmental heterogeneity for productivity and mortality in a tropical tree plantation.
Journal of Ecology, 96(5), pp. 903-913.
Hector, A., Schmid, B., Beierkuhnlein, C., Caldeira, M.C., Diemer, M., Dimitrakopoulos, P.G.,
Finn, J.A., Freitas, H., Giller, P.S., Good, J., Harris, R., Högberg, P., Huss-Danell, K., Joshi,
J., Jumpponen, A., Körner, C., Leadley, P.W., Loreau, M., Minns, A., Mulder, C.P.H.,
O'Donovan, G., Otway, S.J., Pereira, J.S., Prinz, A., Read, D.J., Scherer-Lorenzen, M.,
Schulze, E.D., Siamantziouras, A.S.D., Spehn, E.M., Terry, A.C., Troumbis, A.Y.,
Woodward, F.I., Yachi, S. & Lawton, J.H. (1999). Plant diversity and productivity
experiments in European grasslands. Science, 286(5442), pp. 1123-1127.
Helldin, J.O., Wissman, J. & Lennartsson, T. (2015) Abundance of red-listed species in
infrastructure habitats – ”responsibility species” as a priority-setting tool for transportation
agencies´ conservation action. Nature Conservation, 11, pp. 143–158.
Hill, J.D., Canham, C.D. & Wood, D.M. (1995). Patterns and causes of resistance to tree invasion
in rights-of-way. Ecological Applications, 5(2), pp. 459-470.
Hirst, C.N. & Jackson, D.A. (2007). Reconstructing community relationships: the impact of
sampling error, ordination approach, and gradient length. Diversity and Distributions, 13(4),
pp. 361-371.
Hobbs, N.T. & Hilborn, R. (2006). Alternatives To Statistical Hypothesis Testing In Ecology: A
Guide To Self Teaching. Ecological Applications, 16(1), pp. 5-19.
Hodge, S.J. (1995). Creating and Managing Woodlands Around Towns Handbook 11. London:
HMSO Publications Center, Forestry Commission.
Holling, C.S. & Meffe, G.K. (1996). Command and Control and the Pathology of Natural
Resource Management. Conservation Biology, 10(2), pp. 328-337.
Honu, Y.A.K. & Gibson, D.J. (2008). Patterns of invasion: Trends in abundance of understory
vegetation, seed rain, and seed bank from forest edge to interior. Natural Areas Journal,
28(3), pp. 228-239.
Hookway, C. (2005). Pragmatism. The Stanford Encyclopedia of Philosophy (Spring 2015
Edition) Zalta, E.N. (ed.), stable URL:
http://plato.stanford.edu/archives/spr2015/entries/pragmatism/
Hopwood, J.L. (2008). The contribution of roadside grassland restorations to native bee
conservation. Biological Conservation, 141(10), pp. 2632-2640.
Hubbell, S.P. (2001). The Unified Neutral Theory of Biodiversity and Biogeography. Princeton:
Princeton University Press.
Huisman, J., Olff, H. & Fresco, L.F.M. (1993). A Hierarchical Set of Models for Species
Response Analysis. Journal of Vegetation Science, 4(1), pp. 37-46.

112
Huston, M.A. (1997). Hidden treatments in ecological experiments: re-evaluating the ecosystem
function of biodiversity. Oecologia, 110(4), pp. 449-460.
Hägglund, B. & Lundmark, J.E. (2007a). Handledning i bonitering Del 1 Definitioner och
anvisningar. Jönköping: Skogstyrelsen.
Hägglund, B. & Lundmark, J.E. (2007b). Handledning i bonitering Del 2 Diagram och tabeller.
Jönköping: Skogstyrelsen.
Hägglund, B. & Lundmark, J.E. (2010). Handledning i bonitering Del 3 Markvegetationstyper.
Jönköping: Skogstyrelsen.
Ihse, M. (1995). Swedish agricultural landscapes — patterns and changes during the last 50 years,
studied by aerial photos. Landscape and Urban Planning, 31(1–3), pp. 21-37.
Jackson, D.A. (1993). Multivariate analysis of benthic invertebrate communities: the implication
of choosing particular data standardizations, measures of association, and ordination methods.
Hydrobiologia, 268(1), pp. 9-26.
Jansen, F. & Oksanen, J. (2013). How to model species responses along ecological gradients –
Huisman–Olff–Fresco models revisited. Journal of Vegetation Science, 24(6), pp. 1108-1117.
Jansson, K.U., Nilsson, M. & Esseen, P.-A. (2011). Length and classification of natural and
created forest edges in boreal landscapes throughout northern Sweden. Forest Ecology and
Management, 262(3), pp. 461-469.
Jansson, M., Fors, H., Lindgren, T. & Wiström, B. (2013). Perceived personal safety in relation to
urban woodland vegetation - A review. Urban Forestry and Urban Greening, 12(2), pp. 127–
133.
Jensen, A.M., Götmark, F. & Löf, M. (2012). Shrubs protect oak seedlings against ungulate
browsing in temperate broadleaved forests of conservation interest: A field experiment. Forest
Ecology and Management, 266, pp. 187-193.
Jinks, R.L., Parratt, M. & Morgan, G. (2012). Preference of granivorous rodents for seeds of 12
temperate tree and shrub species used in direct sowing. Forest Ecology and Management, 278,
pp. 71-79.
Jorgensen, A., Hitchmough, J. & Calvert, T. (2002). Woodland spaces and edges: Their impact on
perception of safety and preference. Landscape and Urban Planning, 60(3), pp. 135-150.
Kalén, C. (2004). Forest development and interactions with large herbivores. Diss.Lund: Lund
University.
Keddy, P.A. (1992). Assembly and Response Rules: Two Goals for Predictive Community
Ecology. Journal of Vegetation Science, 3(2), pp. 157-164.
Kie, J.G., Terry Bowyer, R., Nicholson, M.C., Boroski, B.B. & Loft, E.R. (2002). Landscape
heterogeneity at differing scales: Effects on spatial distribution of mule deer. Ecology, 83(2),
pp. 530-544.
Kleyer, M., Bekker, R.M., Knevel, I.C., Bakker, J.P., Thompson, K., Sonnenschein, M.,
Poschlod, P., Van Groenendael, J.M., Klimeš, L., Klimešová, J., Klotz, S., Rusch, G.M.,
Hermy, M., Adriaens, D., Boedeltje, G., Bossuyt, B., Dannemann, A., Endels, P.,
Götzenberger, L., Hodgson, J.G., Jackel, A.K., Kühn, I., Kunzmann, D., Ozinga, W.A.,
Römermann, C., Stadler, M., Schlegelmilch, J., Steendam, H.J., Tackenberg, O., Wilmann, B.,
Cornelissen, J.H.C., Eriksson, O., Garnier, E. & Peco, B. (2008). The LEDA Traitbase: a

113
database of life-history traits of the Northwest European flora. Journal of Ecology, 96(6), pp.
1266-1274.
Kleyer, M., Dray, S., Bello, F., Lepš, J., Pakeman, R.J., Strauss, B., Thuiller, W. & Lavorel, S.
(2012). Assessing species and community functional responses to environmental gradients:
which multivariate methods? Journal of Vegetation Science, 23(5), pp. 805-821.
kNN-Sverige (2010) SLU Forest Map. Umeå: Institutionen för skoglig resurshushållning, SLU.
Kollmann, J., Coomes, D.A. & White, S.M. (1998). Consistencies in post-dispersal seed predation
of temperate fleshy-fruited species among seasons, years and sites. Functional Ecology, 12(4),
pp. 683-690
Kollmann, J. & Buschor, M. (2003). Edges effects on seed predation by rodents in deciduous
forests of northern Switzerland. Plant Ecology, 164(2), pp. 249-261.
Kopp, R. (1987). Experience in the propagation and cultivation of indigenous shrub species.
Forst- und Holzwirt, 42(10), pp. 269-274.
Kubíková, J. (1971). Ecological Gradients on the Contact of Xerothermic Grassland and
Woodland in the Bohemian Karst. Folia Geobotanica & Phytotaxonomica, 6(4), pp. 389-405.
Kuuluvainen, T. (2009). Forest management and biodiversity conservation based on natural
ecosystem dynamics in Northern Europe: The complexity challenge. AMBIO, 38(6), pp. 309-
315.
Larsen, J.B. & Nielsen, A. (2012). Urban Forest Landscape Restoration – Applying Forest
Development Types in Design and Planning. In: Stanturf, J., Lamb, D. & Madsen, P. (eds)
Forest Landscape Restoration. (World Forests, 15) Springer Netherlands, pp. 177-199.
Laurance, W.F., Nascimento, H.E.M., Laurance, S.G., Andrade, A.C., Fearnside, P.M., Ribeiro,
J.E.L. & Capretz, R.L. (2006). Rain forest fragmentation and the proliferation of successional
trees. Ecology, 87(2), pp. 469-482.
Lawesson, J. & Skov, F. (2002). The phytogeography of Denmark revisited. Plant Ecology,
158(1), pp. 113-122.
Legendre, P. & Gallagher, E.D. (2001). Ecologically Meaningful Transformations for Ordination
of Species Data. Oecologia, 129(2), pp. 271-280.
Lepš, J. & Šmilauer, P., (2003) Multivariate Analysis of Ecological Data Using CANOCO.
Cambridge: Cambridge University Press.
Lepš, J. (2004). What do the biodiversity experiments tell us about consequences of plant species
loss in the real world? Basic and Applied Ecology, 5(6), pp. 529-534.
Lepš, J., De Bello, F., Lavorel, S. & Berman, S. (2006). Quantifying and interpreting functional
diversity of natural communities: practical considerations matter. Preslia, 78(4), pp. 481-501.
Lepš, J. & Šmilauer, P. (2007). Subjectively sampled vegetation data: Don’t throw out the baby
with the bath water. Folia Geobotanica, 42(2), pp. 169-178.
Lehvävirta, S. & Rita, H. (2002). Natural regeneration of trees in urban woodlands. Journal of
Vegetation Science, 13(1), pp. 57-66.
Lehvävirta, S., Vilisics, F., Hamberg, L., Malmivaara-Lämsä, M. & Kotze, D.J. (2014).
Fragmentation and recreational use affect tree regeneration in urban forests. Urban Forestry
& Urban Greening, 13(4), pp. 869-877.

114
Leonardsson, J., Löf, M. & Götmark, F. (2015). Exclosures can favour natural regeneration of oak
after conservation-oriented thinning in mixed forests in Sweden: A 10-year study. Forest
Ecology and Management, 354, pp. 1-9.
Levey, D.J., Bolker, B.M., Tewksbury, J.J., Sargent, S. & Haddad, N.M. (2005). Ecology: Effects
of landscape corridors on seed dispersal by birds. Science, 309(5731), pp. 146-148.
Levin, S.A. (2005). Self-organization and the Emergence of Complexity in Ecological Systems.
BioScience, 55(12), pp. 1075-1079.
Lindbladh, M., Axelsson, A.-L., Hultberg, T., Brunet, J. & Felton, A. (2014). From broadleaves
to spruce – the borealization of southern Sweden. Scandinavian Journal of Forest Research,
29(7), pp. 686-696.
Lindenmayer, D.B. & Fischer, J. (2007). Edge effects. In: Lindenmayer, D.B. & Hobbs, R.J. (eds)
Managing and designing landscapes for conservation: moving from perspectives to
principles. Oxford: Blackwell publishing, pp. 165-178.
Lindenmayer, D.B. & Hobbs, R.J. (2007). Synthesis: Structure, degradation and condition. In:
Lindenmayer, D.B. & Hobbs, R.J. (eds) Managing and designing landscapes for
conservation: moving from perspectives to principles. Oxford: Blackwell publishing, pp. 146-
147.
Lloyd, K.M., McQueen, A.A.M., Lee, B.J., Wilson, R.C.B., Walker, S. & Wilson, J.B. (2000).
Evidence on ecotone concepts from switch, environmental and anthropogenic ecotones.
Journal of Vegetation Science, 11(6), pp. 903-910.
Loehle, C. (2000). Strategy Space and the Disturbance Spectrum: A Life‐History Model for Tree
Species Coexistence. The American Naturalist, 156(1), pp. 14-33.
Lopez-Barrera, F., Manson, R.H., Gonzalez-Espinosa, M. & Newton, A.C. (2006). Effects of the
type of montane forest edge on oak seedling establishment along forest-edge-exterior
gradients. Forest Ecology and Management, 225(1-3), pp. 234-244.
Loreau, M. & Hector, A. (2001). Partitioning selection and complementarity in biodiversity
experiments. Nature, 412(6842), pp. 72-76.
Luck, G.W. (2007). Edges: where landscape elements meet In: Lindenmayer, D.B. & Hobbs, R.J.
(eds) Managing and designing landscapes for conservation: moving from perspectives to
principles Oxford: Blackwell publishing, pp. 179-194.
Luken, J.O., Hinton, A.C. & Baker, D.G. (1991). Assessment of frequent cutting as a plant-
community management technique in power-line corridors. Environmental Management,
15(3), pp. 381-388.
Luken, J.O., Beiting, S.W., Kareth, S.K., Kumler, R.L., Liu, J.H. & Seither, C.A. (1994). Target
and nontarget discrimination of herbicides applied to vegetation in a power-line corridor.
Environmental Management, 18(2), pp. 251-255.
Lundin, L., Karltun, E., Odell, G. & Löfgren, O., (2002). Fältinstruktion för ståndortskartering av
permanenta provytor vid riksskogstaxeringen. SK 2002, Institutionen för skoglig marklära.
Swedish University of Agricultural Sciences.
Löf, M., Thomsen, A. & Madsen, P. (2004). Sowing and transplanting of broadleaves (Fagus
sylvatica L., Quercus robur L., Prunus avium L. and Crataegus monogyna Jacq.) for
afforestation of farmland. Forest Ecology and Management, 188(1-3), pp. 113-123.

115
Madsen, P. & Löf, M. (2005). Reforestation in southern Scandinavia using direct seeding of oak
(Quercus robur L.). Forestry, 78(1), pp. 55-64.
Manly, B.F.J. (2005). Multivaraite statistical methods: a primer. 3rd edition. New York:
Chapman & Hall.
Matlack, G.R. (1993a). Microenvironment variation within and among forest edge sites in the
eastern United States. Biological Conservation, 66(3), pp. 185-194.
Matlack, G.R. (1993b). Sociological edge effects – spatial-distribution of human impact in
suburban forest fragments. Environmental Management, 17(6), pp. 829-835.
Matlack, G.R. & Litvaitis, J. (1999). Forest edges. In: Malcom, L.H.J. (ed.) Maintaining
biodiversity in forest ecosystems. Cambridge: Cambridge university press, pp. 210-233.
Mayer, H. (1984). Waldbau. Stuggart: Guastav Fischer Verlag.
Marozas, V., Grigaitis, V. & Brazaitis, G. (2005). Edge effect on ground vegetation in clear-cut
edges of pine-dominated forests. Scandinavian Journal of Forest Research, Supplement,
20(6), pp. 43-48.
Mason, W.L. (2002). Are irregular stands more windfirm? Forestry, 75(4), pp. 347-355.
McGill, B.J., Enquist, B.J., Weiher, E. & Westoby, M. (2006). Rebuilding community ecology
from functional traits. Trends in Ecology & Evolution, 21(4), pp. 178-185.
McGarigal, K., Cushman, S.A. & Ene, E. (2012). FRAGSTATS v4: Spatial Pattern Analysis
Program for Categorical and Continuous Maps. Computer software program produced by the
authors at the University of Massachusetts, Amherst. Available at the following web site:
http:// www.umass.edu/landeco/research/fragstats/fragstats.html
Meilleur, A., Veronneau, H. & Bouchard, A. (1994). Shrub communities as inhibitors of plant
succession in Southern Quebec. Environmental Management, 18(6), pp. 907-921.
Meiners, S.J., Pickett, S.T.A. & Handel, S.N. (2002). Probability of tree seedling establishment
changes across a forest-old field edge gradient. American Journal of Botany, 89(3), pp. 466-
471.
Mercier, C., Brison, J. & Bouchard, A. (2001). Demographic Analysis of Tree Colonization in a
20-Year-Old Right-of-Way. Environmental Management, 28(6), pp. 777-787.
Messier, C., Puettmann, K., Chazdon, R., Andersson, K.P., Angers, V.A., Brotons, L., Filotas, E.,
Tittler, R., Parrott, L. & Levin, S.A. (2015). From Management to Stewardship: Viewing
Forests As Complex Adaptive Systems in an Uncertain World. Conservation Letters, 8(5), pp.
368-377.
Minchin, P. (1987). An evaluation of the relative robustness of techniques for ecological
ordination. Vegetatio, 69(1-3), pp. 89-107.
Morin, X., Fahse, L., Scherer-Lorenzen, M. & Bugmann, H. (2011). Tree species richness
promotes productivity in temperate forests through strong complementarity between species.
Ecology Letters, 14(12), pp. 1211-1219.
Munguira, M.L. & Thomas, J.A. (1992). Use of Road Verges by Butterfly and Burnet
Populations, and the Effect of Roads on Adult Dispersal and Mortality. Journal of Applied
Ecology, 29(2), pp. 316-329.
Murcia, C. (1995). Edge effects in fragmented forests: implications for conservation. Trends in
Ecology and Evolution, 10(2), pp. 58-62.

116
Murtaugh, P.A. (2007). Simplicity and complexity in ecological data analysis. Ecology, 88(1), pp.
56-62.
Mourelle, C., Kellman, M. & Kwon, L. (2001). Light occlusion at forest edges: an analysis of tree
architectural characteristics. Forest Ecology and Management, 154(1-2), pp. 179-192.
Månsson, J., Bunnefeld, N., Andrén, H. & Ericsson, G. (2012). Spatial and temporal predictions
of moose winter distribution. Oecologia, 170(2), pp. 411-419.
Nadrowski, K., Wirth, C. & Scherer-Lorenzen, M. (2010). Is forest diversity driving ecosystem
function and service? Current Opinion in Environmental Sustainability, 2(1–2), pp. 75-79.
Naturstyrelsen. (2013a). Offentlig skovrejsning Vejledning om tilskud 2012 og 2013 - Version 18.
Oktober 2013. Copenhagen: Miljøministeriet Naturstyrelsen.
Naturstyrelsen. (2013b). Vejledning i god statslig skovrejsning - til Naturstyrelsens
naturforvaltningsenheder. Copenhagen: Miljøministeriet Naturstyrelsen.
Naturstyrelsen. (2013c). Elmelund Skov Naturstyrelsens tilplantningsplan. Copenhagen:
Miljøministeriet Naturstyrelsen.
Naturvårdsverket (2012). Steg på vägen - Fördjupad utvärdering av miljömålen 2012. Bromma:
Naturvårdsverket (Swedish Enviromental Protection Agency).
Neumann, W., Ericsson, G., Dettki, H. & Radeloff, V.C. (2013). Behavioural response to
infrastructure of wildlife adapted to natural disturbances. Landscape and Urban Planning,
114, pp. 9-27.
Nielsen, A.B. (2006). Understanding and communicating forest stand structures Lifting barriers
for nature-based forest management. Diss. Hörsholm: Danish Centre for Forest, Landscape
and Planning.
Nielsen, A.B. (2011). Landscape laboratories 2008-10. Guided and supervised activities &
publications. Rapportserie Landskap Trädgård Jordbruk. Alnarp: Swedish University of
Agricultural Sciences.
Nielsen, A.B. & Jensen, R.B. (2007). Some visual aspects of planting design and silviculture
across contemporary forest management paradigms – perspectives for urban afforestation.
Urban Forestry and Urban Greening, 6, pp. 143-158.
Nielsen, A.B., Konijnendijk, C.C., Wiström, B. & Jensen, R.B. (2013). Municipal woodland in
Denmark: Resources, governance and management. Scandinavian Journal of Forest
Research, 28(1), pp. 49-63.
Niinemets, Ü. & Valladares, F. (2006). Tolerance to shade, drought, and waterlogging of
temperate northern hemisphere trees and shrubs. Ecological Monographs, 76(4), pp. 521-547.
Non,W.C. & de Vries, H.H., (2013) Succesful forest edge management for butterflies
(Lepidoptera). Proceedings of the Netherlands Entomological Society Meeting, 24, pp. 35-44.
Nowak, C.A. & Ballard, B.D. (2005). A framework for applying integrated vegetation
management on rights-of-way. Journal of Arboriculture, 31(1), pp. 28-37.
Ode, A., Fry, G., Tveit, M.S., Messager, P. & Miller, D. (2009). Indicators of perceived
naturalness as drivers of landscape preference. Journal of Environmental Management, 90(1),
pp. 375-383.
Odum, E.P. (1971). Fundamentals of Ecology Third Edition. London: W.B. Saunders Company.
Oke, T.R. (1973). City size and the urban heat island. Atmospheric Environment, 7(8), pp. 769-
779.

117
Økland, R.H. & Eilertsen, O. (1994). Canonical Correspondence Analysis with Variation
Partitioning: Some Comments and an Application. Journal of Vegetation Science, 5(1), pp.
117-126.
Oksanen, J. & Tonteri, T. (1995). Rate of compositional turnover along gradients and total
gradient length. Journal of Vegetation Science, 6(6), pp. 815-824.
Oksanen, J., Guillaume, B.F., Kindt, R., Legendre, P., Minchin, P.R., O’Hara, R.B.,Simpson,
G.L., Solymos, P., Stevens, M.H.H. & Wagner, H. (2013). vegan: Community Ecology
Package. R Package Version 2.0-9. http:// CRAN.R-project.org/package=vegan
Oliver, C.D. & Larson, B.C. (1996). Forest stand dynamics. Update edition. New York: John
Wiley & Sons.
Olrik, D.C., Westergaard, L.H., Jensen, J.S. & Norrie, J.E. (2002). Design og plantevalg i bredere
løvtræslæhegn. Park- og Landskabsserien nr. 35-2002. Hørsholm: Skov & Landskab.
Olsen, I.A. (1999). Planter i miløet: lærebog i planteanvendelse (Plants in the environment: hand-
book in planting design) Vanløse: Førlaget grønt miljø.
Olsson, M., Cox, J., Larkin, J., Widén, P. & Olovsson, A. (2011). Space and habitat use of moose
in southwestern Sweden. European Journal of Wildlife Research, 57(2), pp. 241-249.
Palmer, M., Bernhardt, E., Chornesky, E., Collins, S., Dobson, A., Duke, C., Gold, B., Jacobson,
R., Kingsland, S., Kranz, R., Mappin, M., Martinez, M.L., Micheli, F., Morse, J., Pace, M.,
Pascual, M., Palumbi, S., Reichman, O.J., Simons, A., Townsend, A. & Turner, M. (2004).
Ecology for a Crowded Planet. Science, 304(5675), pp. 1251-1252.
Palmer, M.W. (1993). Putting Things in Even Better Order: The Advantages of Canonical
Correspondence Analysis. Ecology, 74(8), pp. 2215-2230.
Palmer, M.W. (2015) The ordination homepage at Oklahoma State University.
http://ordination.okstate.edu/motivate.htm Retrived 2015-07-31
Peirce, C.S. (1868a). Questions concerning certain faculties claimed for man. Journal of
Speculative Philosophy, 2, pp. 103-114.
Peirce, C.S. (1868b). Some consequences of four incapacities. Journal of Speculative Philosophy,
2, pp. 140-157.
Peirce, C.S. (1869). Grounds of Validity of the Laws of Logic: Further Consequences of Four
Incapacities. Journal of Speculative Philosophy, 2, pp. 193-208.
Peirce, C.S. (1877). The fixation of belief. Popular Science Monthly, 12, pp. 1-15.
Peirce, C.S. (1878). How to make our ideas clear. Popular Science Monthly, 12, pp. 286-302.
Penone, C., Machon, N., Julliard, R. & Le Viol, I. (2012). Do railway edges provide functional
connectivity for plant communities in an urban context? Biological Conservation, 148(1), pp.
126-133.
Peres-Neto, P.R., Legendre, P., Dray, S. & Borcard, D. (2006). Variation Partitioning of Species
Data Matrices: Estimation and Comparison of Fractions. Ecology, 87(10), pp. 2614-2625.
Perring, M.P., Standish, R.J., Hulvey, K.B., Lach, L., Morald, T.K., Parsons, R., Didham, R.K. &
Hobbs, R.J. (2012). The Ridgefield Multiple Ecosystem Services Experiment: Can restoration
of former agricultural land achieve multiple outcomes? Agriculture, Ecosystems &
Environment, 163(0), pp. 14-27.
Persson, B. (1997). Kunskapsöverföring till yrkesverksamma inom landskapsarkitektens
arbetsfält. Diss. Alnarp: Swedish University of Agricultural Science.

118
Pietzarka, U., Roloff, A. (1993). Waldrandgestaltung unter Berücksichtigung der natürlichen
Vegetationsdynamik. Forstarchiv, 64, pp. 107-113.
Pinborg, U., Krabbe, E. & Fruervang, L.E. (1989). 40 Danske trær og buske. Copenhagen:
Miljøministeriet, Skog- og Naturstyrelsen.
Potvin, C. & Gotelli, N.J. (2008). Biodiversity enhances individual performance but does not
affect survivorship in tropical trees. Ecology Letters, 11(3), pp. 217-223.
Pretzsch, H. (2009). Forest Dynamics, Growth and Yield: From Measurement to Model. Berlin:
Springer.
Puettmann, K.J., Coates, K.D. & Messier, C.C. (2008). A Critique of Silviculture: Managing for
Complexity. Washington D.C.: Island Press.
Puettmann, K.J. & Tappeiner, J.C. (2014). Multi-scale assessments highlight silvicultural
opportunities to increase species diversity and spatial variability in forests. Forestry, 87(1),
pp. 1-10.
Putman, R.J. (1994). Deer damage in coppice woodlands: An analysis of factors affecting the
severity of damage and options for management. Quarterly Journal of Forestry, 88(1), pp. 45-
54.
Quinn, G.P. & Keough, M.J. (2002). Experimental Design and Data Analysis for Biologists.
Cambridge: Cambridge University Press.
Rackham, O. (2006). Woodlands. London: HarperCollins Publishers.
Ranney, J.W., Bruner, M.C. & Levenson, J.B. (1981). The importance of edge in the structure and
and dynamics of forest islands. In: Burgess, R.L. & Sharpe, D.M. (eds) Forest islands
dynamics in man-dominated landscapes. New York: Springer Verlag, pp. 67-96.
R Core Team. (2013). R: A Language and Environment for Statistical Computing. R Foundation
for Statistical Computing, Vienna, Austria http:// www. R-project.org
Ribe, R. (1989). The aesthetics of forestry: What has empirical preference research taught us?
Environmental Management, 13(1), pp. 55-74.
Richnau, G., Wiström, B., Nielsen, A.B. & Löf, M. (2012). Creation of multi-layered canopy
structures in young oak-dominated urban woodlands - The 'ecological approach' revisited.
Urban Forestry and Urban Greening, 11(2), pp. 147-158.
Ries, L., Fletcher, R.J., Battin, J. & Sisk, T.D. (2004). Ecological responses to habitat edges:
Mechanisms, models, and variability explained. Annual Review of Ecology Evolution and
Systematics, 35, pp. 491-522.
Ries, L. & Sisk, T.D. (2010). What is an edge species? The implications of sensitivity to habitat
edges. Oikos, 119(10), pp. 1636-1642.
Ripley, B.D. (1979). Tests of `Randomness' for Spatial Point Patterns. Journal of the Royal
Statistical Society. Series B (Methodological), 41(3), pp. 368-374.
Rizell, M. & Gustavsson, R. (1998). Att anlägga skogsbryn. Modeller och referenser för
anläggning och rekonstruktion (To construct forest edges. Models and references for
construction and reconstruction). Alnarp: Stad & Land 160, Movium.
Rodwell, J.S. (ed.) (1991). British Plant Communities Volume 1. Woodlands and Scrub.
Cambridge: Cambridge University Press.
Rousseeuw, P.J. (1987). Silhouettes: A graphical aid to the interpretation and validation of cluster
analysis. Journal of Computational and Applied Mathematics, 20(0), pp. 53-65.

119
Ruck, B., Frank, C. & Tischmacher, M. (2012). On the influence of windward edge structure and
stand density on the flow characteristics at forest edges. European Journal of Forest
Research, 131(1), pp. 177-189.
Rühle, G. ( 1995). Innovative Prozesse bei der Indstandhaltung des Grüns an der Bahn.
Eisenbahningenieur, 46, pp. 588-593.
Rydberg, D. (2000). Initial sprouting, growth and mortality of European aspen and birch after
selective coppicing in central Sweden. Forest Ecology and Management, 130, pp. 27-35
Rydberg, D. & Falck, J. (2000). Urban forestry in Sweden from a silvicultural perspective: a
review. Landscape and Urban Planning, 47(1–2), pp. 1-18.
Santos, B.A., Tabarelli, M., Melo, F.P.L., Camargo, J.L.C., Andrade, A., Laurance, S.G. &
Laurance, W.F. (2014). Phylogenetic impoverishment of Amazonian tree communities in an
experimentally fragmented forest landscape. Plos One, 9(11).
Sarlöv-Herlin, I. (1999). Edge habitats in agricultural landscapes: woody species, landscape
ecology and implications for planning. Diss. Alnarp: Swedish University of Agricultural
Sciences.
Sarlöv-Herlin, I. & Fry, G.L.A. (2000). Dispersal of woody plants in forest edges and hedgerows
in a Southern Swedish agricultural area: the role of site and landscape structure. Landscape
Ecology, 15(3), pp. 229-242.
Sarlöv-Herlin, I. (2001). Approaches to Forest Edges as Dynamic Structures and Functional
Concepts. Landscape Research, 26(1), pp. 27-43.
Sarr, D.A. & Puettmann, K.J. (2008). Forest management, restoration, and designer ecosystems:
Integrating strategies for a crowded planet. Ecoscience, 15(1), pp. 17-26.
Scherer-Lorenzen, M., Potvin, C., Koricheva, J., Schmid, B., Hector, A., Bornik, Z., Reynolds, G.
& Schulze, E.D. (2005). The Design of Experimental Tree Plantations for Functional
Biodiversity Research. In: Scherer-Lorenzen, M., Körner, C. & Schulze, E.-D. (eds) Forest
Diversity and Function. (Ecological Studies, 176) Springer Berlin Heidelberg, pp. 347-376.
Scherer-Lorenzen, M., Schulze, E.D., Don, A., Schumacher, J. & Weller, E. (2007). Exploring the
functional significance of forest diversity: A new long-term experiment with temperate tree
species (BIOTREE). Perspectives in Plant Ecology, Evolution and Systematics, 9(2), pp. 53-
70.
Schindler, S., von Wehrden, H., Poirazidis, K., Wrbka, T. & Kati, V. (2013). Multiscale
performance of landscape metrics as indicators of species richness of plants, insects and
vertebrates. Ecological Indicators, 31(0), pp. 41-48.
Schon, P. & Schmalen, W. (1992). Obtaining seed and growing shrub species. Allgemeine Forst
Zeitschrift, 47(19), pp. 1010-1012.
Seiler, A. (2005). Predicting locations of moose–vehicle collisions in Sweden. Journal of Applied
Ecology, 42(2), pp. 371-382.
Seiler, A.H., J.O., Olsson. M., Norin, H. (2011). Klövviltolyckor på järnväg: kunskapsläge,
problemanalys och åtgärdsförslag. Trafikverket 2011:058. Borlänge: Trafikverket.
Seiler, A., Olsson,M., Lindqvist, M. (2015). Analys av infrastrukturens permeabilitet för klövdjur
– en metodrapport. CBMs skriftserie 88. Uppsala: CBM.
Shannon, C.E. & Weaver, W. (1962). The Mathematical Theory of Communication. Urbana:
University of Illinois Press.

120
Sjörs, H. (1967). Nordisk växtgeografi. (Nordic plant geography) 2. ed. Scandinavian university
books. Stockholm: Bonnier
Skórka, P., Lenda, M., Moroń, D., Kalarus, K. & Tryjanowski, P. (2013). Factors affecting road
mortality and the suitability of road verges for butterflies. Biological Conservation, 159, pp.
148-157.
Spehn, E.M., Hector, A., Joshi, J., Scherer-Lorenzen, M., Schmid, B., Bazeley-White, E.,
Beierkuhnlein, C., Caldeira, M.C., Diemer, M., Dimitrakopoulos, P.G., Finn, J.A., Freitas, H.,
Giller, P.S., Good, J., Harris, R., Högberg, P., Huss-Danell, K., Jumpponen, A., Koricheva, J.,
Leadley, P.W., Loreau, M., Minns, A., Mulder, C.P.H., O'Donovan, G., Otway, S.J.,
Palmborg, C., Pereira, J.S., Pfisterer, A.B., Prinz, A., Read, D.J., Schulze, E.D.,
Siamantziouras, A.S.D., Terry, A.C., Troumbis, A.Y., Woodward, F.I., Yachi, S. & Lawton,
J.H. (2005). Ecosystem effects of biodiversity manipulations in european grasslands.
Ecological Monographs, 75(1), pp. 37-63.
Stachowicz, J.J. (2001). Mutualism, Facilitation, and the Structure of Ecological Communities.
BioScience, 51(3), pp. 235-246.
Stahl, U., Kattge, J., Reu, B., Voigt, W., Ogle, K., Dickie, J. & Wirth, C. (2013). Whole-plant
trait spectra of North American woody plant species reflect fundamental ecological strategies.
Ecosphere, 4(10), art 128.
Stanturf, J.A., Schoenholtz, S.H., Schweitzer, C.J. & Shepard, J.P. (2001). Achieving Restoration
Success: Myths in Bottomland Hardwood Forests. Restoration Ecology, 9(2), pp. 189-200.
Stanturf, J., Lamb, D. & Madsen, P. (2012). Forest Landscape Restoration: Integrating Natural
and Social Sciences: Springer Netherlands.
Stanturf, J.A., Palik, B.J. & Dumroese, R.K. (2014a). Contemporary forest restoration: A review
emphasizing function. Forest Ecology and Management, 331(0), pp. 292-323.
Stanturf, J.A., Palik, B.J., Williams, M.I., Dumroese, R.K. & Madsen, P. (2014b). Forest
Restoration Paradigms. Journal of Sustainable Forestry, 33(sup1), pp. S161-S194.
Stephens, P.C. (2005). Managing woodland open space for wildlife. English Woodland Grant
Scheme Operations Note 011. Wetherby: Forestry Commision.
Stevens, D.L. & Olsen, A.R. (2004). Spatially Balanced Sampling of Natural Resources. Journal
of the American Statistical Association, 99(465), pp. 262-278.
Strayer, D.L., Power, M.E., Fagan, W.F., Pickett, S.T.A. & Belnap, J. (2003). A Classification of
Ecological Boundaries. BioScience, 53(8), pp. 723-729.
Sukopp, H. (2004). Human-caused impact on preserved vegetation. Landscape and Urban
Planning, 68(4), pp. 347-355.
Sutherland, W.J. (1996). Ecological Census Techniques: A Handbook. Cambridge: Cambridge
University Press.
Svensson, B. (2002). Foraging and nesting ecology of bumblebees (Bombus spp.) in agricultural
landscapes in Sweden. Diss: Uppsala: Swedish University of Agricultural Sciences.
ter Braak, C.J.F.,(1987). Unimodal models to relate species to environment. Diss. Wageningen:
Wageningen UR.
ter Braak, C.F. & Šmilauer, P. (2015). Topics in constrained and unconstrained ordination. Plant
Ecology, 216(5), pp. 683-696.
121
Temperton, V.M., Hobbs, R. J., Nuttle,T., Halle, S., (Eds)., (2004). Assembly Rules and
Restoration Ecology: Bridging the Gap Between Theory and Practice: Island Press.
Tilman, D. (2001). Functional Diversity. In: Levin, S.A. (ed.) Encyclopedia of Biodiversity. New
York: Elsevier, pp. 109-120.
Tobner, C., Paquette, A., Reich, P., Gravel, D. & Messier, C. (2014). Advancing biodiversity–
ecosystem functioning science using high-density tree-based experiments over functional
diversity gradients. Oecologia, 174(3), pp. 609-621.
Tóthmérész, B. (1995). Comparison of different methods for diversity ordering. Journal of
Vegetation Science, 6(2), pp. 283-290.
Trammell, T.L.E. & Carreiro, M.M. (2011a). Vegetation composition and structure of woody
plant communities along urban interstate corridors in Louisville, KY, U.S.A. Urban
Ecosystems, 14(4), pp. 501-524.
Trammell, T.L.E., Schneid, B.P. & Carreiro, M.M. (2011b). Forest soils adjacent to urban
interstates: Soil physical and chemical properties, heavy metals, disturbance legacies, and
relationships with woody vegetation. Urban Ecosystems, 14(4), pp. 525-552.
Treffry, D., (ed) (1999). Collins English dictionary, fourth edition. Kent: Harper Collins
Publishers.
Tregay, R. (1986). Design revisted. Stencil 86:11. Alnarp: Swedish University of Agricultural
Sciences.
Troup, R.S. (1928). Silvicultural Systems. Oxford: Oxford University Press.
Turner, M.G., Gardner, R.H. & O´Neill, R.V. (2001). Landscape ecology in theory and practice.
New York: Springer Science.
Vallet, J., Beaujouan, V., Pithon, J., Rozé, F. & Daniel, H. (2010). The effects of urban or rural
landscape context and distance from the edge on native woodland plant communities.
Biodiversity and Conservation, 19(12), pp. 3375-3392.
van der Maarel, E. (1990). Ecotones and ecoclines are different. Journal of Vegetation Science,
1(1), pp. 135-138.
van Leeuwen, C. G. 1966. A relation-theoretical approach to pattern and process in vegetation.
Wentia 15: 25-41.
van Zonneveld, M.J., Gutiérrez, J.R. & Holmgren, M. (2012). Shrub facilitation increases plant
diversity along an arid scrubland-temperate rain forest boundary in South America. Journal of
Vegetation Science, 23(3), pp. 541-551.
Verheyen, K., Ceunen, K., Ampoorter, E., Baeten, L., Bosman, B., Branquart, E., Carnol, M., De
Wandeler, H., Grégoire, J.-C., Lhoir, P., Muys, B., Setiawan, N.N., Vanhellemont, M. &
Ponette, Q. (2013). Assessment of the functional role of tree diversity: the multi-site FORBIO
experiment. Plant Ecology and Evolution, 146(1), pp. 26-35.
Violle, C., Navas, M.-L., Vile, D., Kazakou, E., Fortunel, C., Hummel, I. & Garnier, E. (2007).
Let the concept of trait be functional! Oikos, 116(5), pp. 882-892.
von Wehrden, H., Hanspach, J., Bruelheide, H. & Wesche, K. (2009). Pluralism and diversity:
trends in the use and application of ordination methods 1990-2007. Journal of Vegetation
Science, 20(4), pp. 695-705.
Wagner, C. (1912). Der blendersaumschlag und sein system. Tubingen: Laub Verlag

122
Wagner, D.L., Metzler, K.J., Leicht-Young, S.A. & Motzkin, G. (2014). Vegetation composition
along a New England transmission line corridor and its implications for other trophic levels.
Forest Ecology and Management, 327, pp. 231-239.
Wales, B.A. (1972). Vegetation Analysis of North and South Edges in a Mature Oak-Hickory
Forest. Ecological Monographs, 42(4), pp. 451-471.
Ward, L.K. & Spalding, D.F. (1993). Phytophagous British insects and mites and their food-plant
families: total numbers and polyphagy. Biological Journal of the Linnean Society, 49(3), pp.
257-276.
Weathers, K.C., Cadenasso, M.L. & Pickett, S.T.A. (2001). Forest edges as nutrient and pollutant
concentrators: Potential synergisms between fragmentation, forest canopies, and the
atmosphere. Conservation Biology, 15(6), pp. 1506-1514.
Westermann, J.R., von der Lippe, M. & Kowarik, I. (2011). Seed traits, landscape and
environmental parameters as predictors of species occurrence in fragmented urban railway
habitats. Basic and Applied Ecology, 12(1), pp. 29-37.
Whittaker, R.H. (1956). Vegetation of the Great Smoky Mountains. Ecological Monographs,
26(1), pp. 1-80.
Whittaker, R.H. (1967). Gradient analysis of vegetation. Biological Reviews, 42(2), pp. 207-264.
Williams-Linera, G. (1990). Vegetation Structure and Environmental Conditions of Forest Edges
in Panama. Journal of Ecology, 78(2), pp. 356-373.
Wirth, R., Meyer, S., Leal, I. & Tabarelli, M. (2008). Plant Herbivore Interactions at the Forest
Edge. In: Lüttge, U., Beyschlag, W. & Murata, J. (eds) Progress in Botany. (Progress in
Botany, 69) Springer Berlin Heidelberg, pp. 423-448.
Wuyts, K., Verheyen, K., De Schrijver, A., Cornelis, W.M. & Gabriels, D. (2008). The impact of
forest edge structure on longitudinal patterns of deposition, wind speed, and turbulence.
Atmospheric Environment, 42(37), pp. 8651-8660.
Wuyts, K., De Schrijver, A., Vermeiren, F. & Verheyen, K. (2009). Gradual forest edges can
mitigate edge effects on throughfall deposition if their size and shape are well considered.
Forest Ecology and Management, 257(2), pp. 679-687.
Yahner, R.H., Bramble, W.C. & Byrnes, W.R. (2001). Effect of vegetation maintenance of an
electric transmission right-of-way on reptile and amphibian populations. Journal of
Arboriculture, 27(1), pp. 24-28.
Yahner, R.H. & Yahner, R.T. (2007). Populations of small mammals on an electric transmission
line area in southeastern Pennsylvania, U.S. Arboriculture and Urban Forestry, 33(6), pp.
433-434
Yahner, R.H., Yahner, R.T. & Ross, B.D. (2008). Plant species richness on a transmission right-
of way in southeastern Pennsylvania, U.S. integrated vegetation management. Arboriculture
and Urban Forestry, 34(4), pp. 238-244.
Yao, J., Holt, R.D., Rich, P.M. & Marshall, W.S. (1999). Woody Plant Colonization in an
Experimentally Fragmented Landscape. Ecography, 22(6), pp. 715-728.
Zuur, A., Ieno, E.N., Walker, N., Saveliev, A.A. & Smith, G.M. (2009). Mixed Effects Models
and Extensions in Ecology with R: Springer New York.

123
Appendix A: Terminology and definitions
Adaptive capacity: Adaptive capacity is described as system robustness to changes in resilience
(Gunderson, 2000). Based on this, it can be seen as the ability of a system to modify its
structure and composition so it can sustain major functions or develop new functions (Filotas
et al., 2014).
Advancing edge phenomena: If the disturbance or stress regime that maintains the forest edge is
removed or weakened, the forest edge will normally advance forward and reclaim the non-
forested land cover (Ranney et al., 1981).
Assembly rules: Following the reasoning of Götzenberger et al. (2012), assembly rules are any
constraint on species co-existence, as seen as restrictions on the observed data pattern. As
such, assembly rules represent constraints on community composition and structure due to
ecological filters of dispersal, abiotic environments, biotic interactions (Götzenberger et al.,
2012) and disturbance regime (Keddy, 1992).
Community: A collection of species occurring in the same place at the same time (Fauth et al.,
1996).
Competition: The tendency of neighbouring plants to utilize the same quantum of light, nutrients,
water and space (according to Grime (2001)).
Complex environmental gradient: The abstract dimensions of an ecological space where the
relative position of ‘sites’ reflects similarity/dissimilarity of an environmental variable that is
a representation of several environmental characteristics (adapted from Austin (1980, 1985),
Diaz et al. (2008) and Jansen & Oksanen (2013)).
Disturbance: Mechanisms such as browsing, fire and wind, which lead to plant biomass loss
(according to Grime, 2001).
Dominance: The advantage over other species gained in acquiring resources through large (total)
size. Dominance often changes in plant communities through succession. At an early stage, a
surplus of individual plants or stems often leads to dominance. In later successional stages,
growing tall and wide often leads to dominance (Grime, 2001).
Dominants: Species with a high dominance (major status) in the community at a given time
(Grime, 2001).
Dynamic filtering: The concept that ecological filters change in relation to each other and these
effects change over time in relation to succession and disturbances (adapted from Temperton
et al., 2004).

124
Ecological filter: The concept that different aspects of the environment act as filters or sieves to
remove (filter away) species that are not adapted to the given environmental characteristics
(adapted from Keddy (1992) and Diaz et al. (1998)).
Ecosystem services: The benefits human populations derive, directly or indirectly, from
ecosystem functions (Costanza et al., 1997).
Ecotone: Ecotone is used here as in most general textbooks (e.g. Odum, 1971) as a transition zone
between two communities. As such, an ecotone can be relatively narrow or wide depending on
its context. However, it is argued by van der Maarel (1990) in accordance with van Leeuwen’s
(1966) “limes converge” that an ecotone is a stress zone with large fluctuations giving rise to a
fast and rapid change in species composition. Van der Maarel (1990) argues, in accordance
with van Leeuwen’s (1966) “limes diverge”, that a relatively heterogonous and stable gradient
zone instead should be referred to as an ecocline. The definition of ecotone and ecocline is
hence also a question of the spatial and temporal scale used for the classification. Although
van der Maarel’s (1990) arguments are in many ways compelling, the clear (over)use of the
‘textbook’ definition justifies its use, as this avoids misunderstandings and separates its
definition from ‘environmental gradient’, which is sometimes referred to as an ecocline or
coecocline.
Edge effect: A change of measured response variable that depends on the distance from the edge
(considered two-dimensional in this case), i.e. a spatial effect on the variable investigated
induced by the change of moving from one patch to another. The edge effect hence varies
depending on the response variable investigated and how edges are defined. The edge effect
can be positive or negative, while if there is no edge effect it is neutral (adapted from Strayer
et al. (2003) and Ries et al. (2004)).
Edge: The boundary between two different patches and hence dependent on the definition of
patches. It can be considered as having either two or three dimensions. An edge is generally
considered three-dimensional in this thesis (adapted from Strayer et al., 2003).
Environmental characteristics: Umbrella term for spatially varying abiotic and biotic variables of
the environment, operating at varying scale from site level to overall landscape composition
and configuration (adapted from Diaz et al. (2008)).
Environmental gradient: The abstract dimensions of an ecological space where the relative
position of ‘sites’ reflects similarity/dissimilarity of an environmental variable. Samples of
sites spanning a large set of the theoretical range of an environmental variable could hence be
considered as representing a long environmental gradient (adapted from Austin (1980, 1985)
and Oksanen & Tonteri (1995)).
Facilitation: Interaction between organisms that benefit at least one of the participants and cause
harm to neither (Stachowicz, 2001).
Forest edge cross-section: The width of the forest edge perpendicular to the main elongation of
the forest edge.
Forest edge profile: The outer vertical shape of the forest edge towards the non-forested open land
cover.
Forest edge: Forest edges in this thesis are considered to be the physical vegetation structure
forming the transition zone between forest and open land cover in various patterns and
distributions between the two land uses.

125
Functional diversity: The value and range of those species and organism traits that influence
ecosystem functioning (Tilman, 2001).
Functional trait: A functional trait is one that strongly influences organism performance (McGill
et al., 2006).
Graded forest edge: also called “sloping” (Fry & Sarlöv-Herlin, 1997), “step-shaped” (Rydberg &
Falck, 2000) “three-step” (Sarlöv-Herlin & Fry, 2000) “outdrawn” (Gustavsson, 2004) or
“tapered” (Ruck et al., 2012), these are forest edges successively increasing in height from the
periphery to the interior of the forest.
Hierarchical filtering: The concept that filtering of species in the assembly of communities is
hierarchical where global, regional and local species are related and filtered at different scales
(adapted from Temperton et al. (2004) and de Bello et al. (2013)).
Infrastructure environment: An area consisting of, or strongly affected by, roads, railways,
airports, power lines and other infrastructure. Given the definition above, infrastructure
environment does not have to be urban, but there can be infrastructure environments within an
urban area.
Initial floristics: All species establish approximately at the same time after disturbance but assert
dominance at different times (Egler 1954; Oliver & Larson 1996).
Landscape structure: The spatial pattern of the entire landscape mosaic (at a given scale). It can be
quantified (or at least approximated) with landscape-level metrics and includes aspects of both
landscape composition and configuration (adapted from Turner et al. (2001) and McGarigal et
al. (2012)).
Non-selective management methods: Management is applied equally over the management area
without individually targeting certain species, groups, sizes or forms.
Plant strategy: The adaptation of species to cope more or less with stress, disturbance and
competition in their established and regenerative phases. In accordance with Grime et al.
(2007), in this thesis plant/species strategy is considered to be synonymous with functional
type.
Planting design: The process of selecting and spatially combining different plant species through
planting. As such, it regulates the initial species interactions and appearance through the
decision of e.g. placement, spacing, plant qualities, planting patterns and establishment
management.
Relay floristics: A group of species establish after disturbance and are with time successively
replaced by other species groups i.e., the successive appearance and disappearance of groups
of species in the development of vegetation (Egler 1954; Oliver & Larson 1996).
Resilience: Resilience in ecological systems is the amount of disturbance that a system can absorb
without changing stability domains (Gunderson, 2000). Based on this, it can be seen as the
potential of a system to recover its structure and functions after a disturbance (Filotas et al.,
2014).
Resistance: Staying essentially unchanged despite the presence of disturbances (Grimm & Wissel,
1997).
Resources: Given the definition of competition (Grime, 2001), light, nutrients, water and space.

126
Ride: A linear open space through a forest established through a need for access. A path or track
becomes a ride when it is wide enough for there to be a distinct continuous gap in the tree
canopy above the ride (adapted from Ferris & Carter (2000) and Stephens (2005)).
Selective management methods: Management that individually targets certain species, groups,
sizes or forms within the management area. Note that within silviculture and forestry,
selection and selective are sometimes used with slightly different meanings. Within other
environmental management areas such as vegetation management of power lines, selective is
the common term for such management methods.
Site index: A tree species-specific metric used to indicate site productivity as the average height
of dominant and co-dominant trees at a specified age (usually 50 or 100 years) (Hägglund &
Lundmark 2007a; Puettmann et al., 2008).
Stationary forest edge: If the forest edge is restricted from moving forward and its horizontal
position is hence permanent for a given period, it is termed stationary.
Stress: External constraints which limit the rate of ‘plant growth’ (dry matter production)
(according to Grime, 2001).
Subordinates: Species with a minor status in the community, i.e. they are subordinate to the
dominant species that constitute the majority of the biomass. Subordinate although not quite
dominant can have widespread occurrence (Grime, 2001).
Trait: A trait is a surrogate of organismal performance (Violle et al., 2007) and is a defined
property of organisms used comparatively across species or communities (adapted from
McGill et al. (2006) and Garnier et al. (2007)). As multiple traits often relate, or are included
in, a specific plant strategy, e.g. stress tolerance to drought (Stahl et al., 2013), this thesis
adopts a wide and inclusive approach to the trait terminology. This means that proxies for
complex suites of traits for a certain strategy are employed as interpretation instruments.
Urban environment: An area where population density leads to land use that is substantially
related to, or affected by, residential buildings, public services and facilities, commercial land,
industrial land, transport and communication facilities.
Vegetation structure: Structure refers to “the way the individual parts of something are made,
built, or organized into a whole“(Treffry, 1999) and as such is scale-dependent. The spatial
scale considered for vegetation structure in this thesis follows Gustavsson (1986) and is at the
level of a forest stand. As such, the individual parts can be considered to be the individual
species.

127
Acknowledgements
I would like to thank:
Mom and dad, for everything.
Brother, sister, friends and relatives for your never-ending mental support.
Trafikverket, for financial support of this PhD project and especially Jan-Erik Lundh, for enthusiasm, support and trust in the project.
Anders Busse Nielsen, for an endless supply of energy and ideas, some more clear than others but certainly always meaning more fun things to do.
Ingrid Sarlöv Herlin, for always caring and endless comments about the importance of landscape.
Barbro, who has been the only supervisor giving short and straightforward directions – “drive 500 metres then take the first exit left” and always directly when straying off the goal – “redo route”.
Åke Wiström, for embodying what it is to be a true person.
Göran Hedén, for embodying what it is to be a true scientist.
Pär Winge, for embodying what it is to be a true practitioner.
Hanna Fors and Johan Östberg, for being fantastic friends and colleagues, but mostly for standing the adventure of sharing the same office as me.

128
Märit Jansson, for your relentless quest to evolve my social communication skills.
Anna Levinsson, for your talent for knowing when to use a kind word and when to ask “What does it mean?”
Johan Pihel, for never being able to discuss something seriously for more than approximately five minutes.
Blaž and Urška, for helping me out when I perhaps needed it the most.
Håkan Schroeder, for administering much of the project as regards Trafikverket.
Kenneth, Ann-Marie, Linda-Maria, Mårten, Karin, Mona, Frida, Julia, Pethra, Anna-Karin, Leif, Eva-Lou, Anders F and Erik S, for discussing different ecological principles, planting design, plants, management, and other fun and important subjects.
Tobias Emilsson, for helpful discussions and encouragement.
Tim, Anders, Caroline and Cecil, for being the boss (that is a good thing) at different stages of my PhD studies.
Wictoria, Ammi, Christel and Agneta, for almost endless patience concerning administrative questions.
Christine Haaland and Palle Madsen for helpful comments at my midway seminars.
Gustav Richnau, for pointing me along the road of statistics and for being my friend.
Jan-Eric Englund and Ulf Grandin, for helping me find my way along the statistical road(s).
Naturstyrelsen at Fyn and especially Anders Hersø Pedersen and Anni Borup, for giving me the opportunity to come to Fyn and Elmelund.

129
Niklas Boman, for always offering the possibility to discuss scientific philosophy for real.
Kjell Lundqvist, for being a role model on working in academia.
Åsa Bensch, when everything else fails you always offer a helping hand with a smile.
Patrick Bellan, for your struggles in trying to increase my street smartness.
Cecilia Öxell, for the cake and the true joy of appreciating plants.
Henrik Sjöman, for always letting your dips in work morale ripple downward in the castle.
Roland Gustavsson, for endless inspiration concerning landscape architecture and vegetation.
Allan Gunnarsson, for offering a truly holistic view on landscape architecture and humour.
Emma Holmström, for discussing field methodology.
Tiina Saarap, for believing in me when I did not.
Dan Pålsson, for helping me during my early adventures in the Landscape Laboratory of Alnarp.
Johanna, Helena, Emma, Gunnar, Tian, Gao, Nathalie and all other fellow PhD students who shared the roller-coaster ride of doing a PhD.
Åsa O, Neil, Anders L, Jennie, Bengt, Nina, Thomas and all other colleagues at the department, who make life at the university what it is.
Elin, Peter, Jonas, Linda, Martin, Sofia, Lars, Sus, Henrik, Marlene and Mikael, for opening up your homes for me during my field work endeavours. It meant more to me than you can ever imagine.

130
Emma, Fredrik, Elise and Boris, for being my extra family in the south.
Maria, Staffan and Axel, for being my extra family in the middle.
Magnus, Åse, Axel and Ellen, for being my extra family in the north.
Olov, Anna, Peter, Maria, Mia, Lars, Rudan, Mikaela, Alexander, Emelie, Maja, Emma, Magnus, Carl, Christine, Matilda and Nina, for reminding me about that there is apparently other important stuff than forest edges. “NULLUS ANXIETAS”