Embed Size (px)
Citation preview
Visualising Forest Edge Effects
Ralph Torr Senior Engineer
25 June 2013
Visualising forest edge effects
Carbon Trust Project
Power From Onshore Wind Farms:
Advanced Measurement and Modelling
(POWFARM)
Acknowledgement of Work Conducted by Roy Spence & Graham More (SgurrEnergy)
Visualising forest edge effects
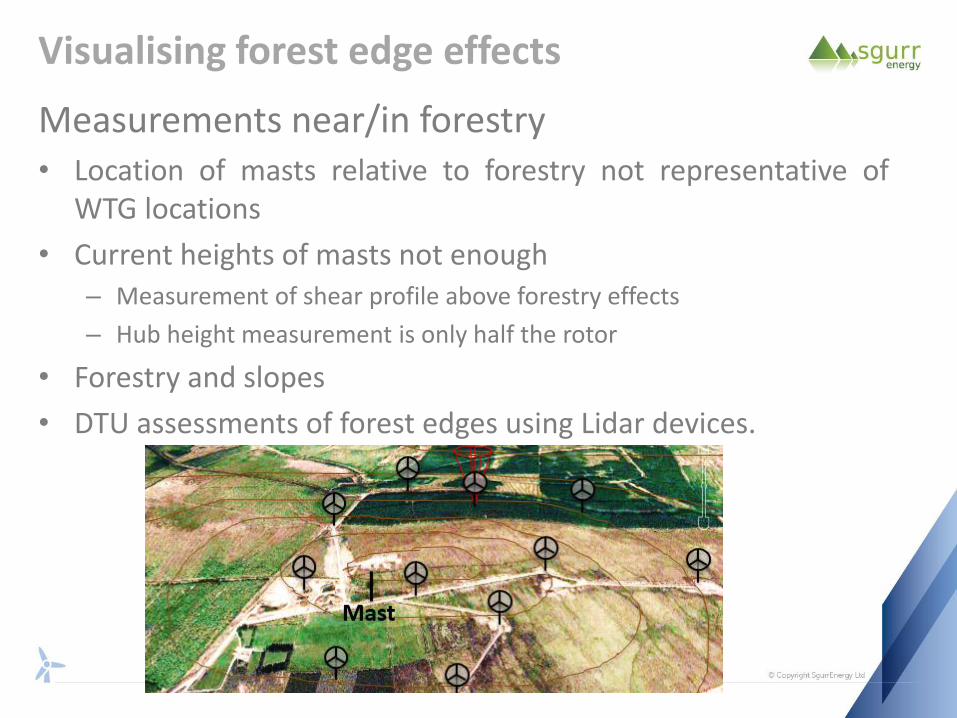
Measurements near/in forestry • Location of masts relative to forestry not representative of
WTG locations
• Current heights of masts not enough – Measurement of shear profile above forestry effects
– Hub height measurement is only half the rotor
• Forestry and slopes
• DTU assessments of forest edges using Lidar devices.
Visualising forest edge effects
Carbon Trust – POWFARM
• Develop improved and validated computational flow models for wind farms in complex terrain
• Gain an enhanced understanding of forestry and topography, influenced wind flow interactions through a combination of advanced measurement and modelling technologies
• Developer focus – forestry
Workstream 1 – advanced measurements
Workstream 2 – advanced modelling
Workstream 3 – existing model assessment
Visualising forest edge effects
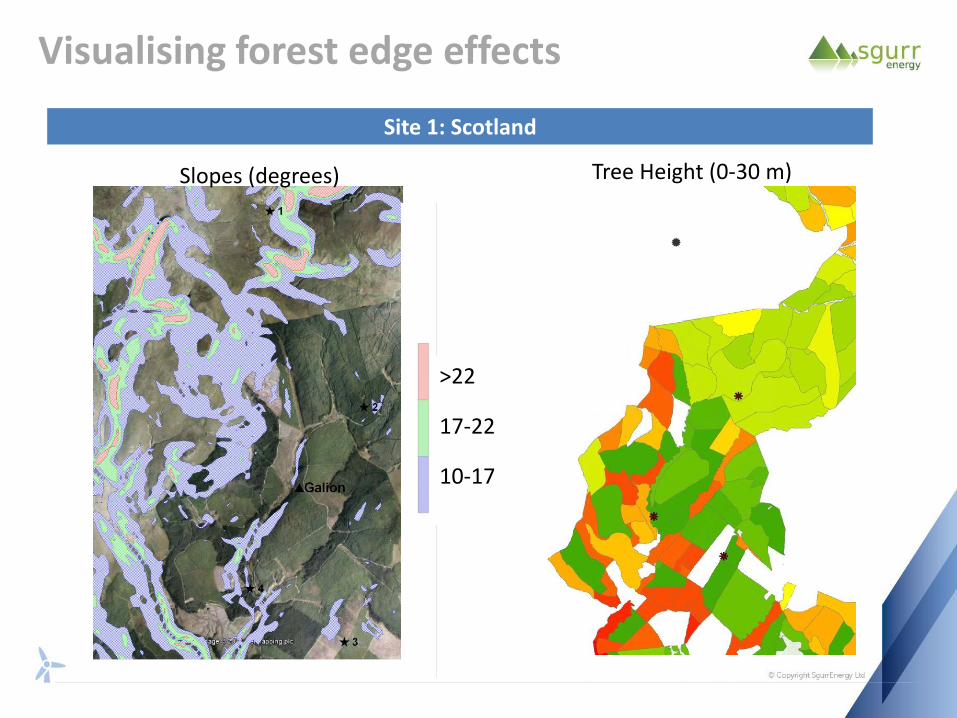
Site 1: Scotland
>22
17-22
10-17
Slopes (degrees)
Tree Height (0-30 m)
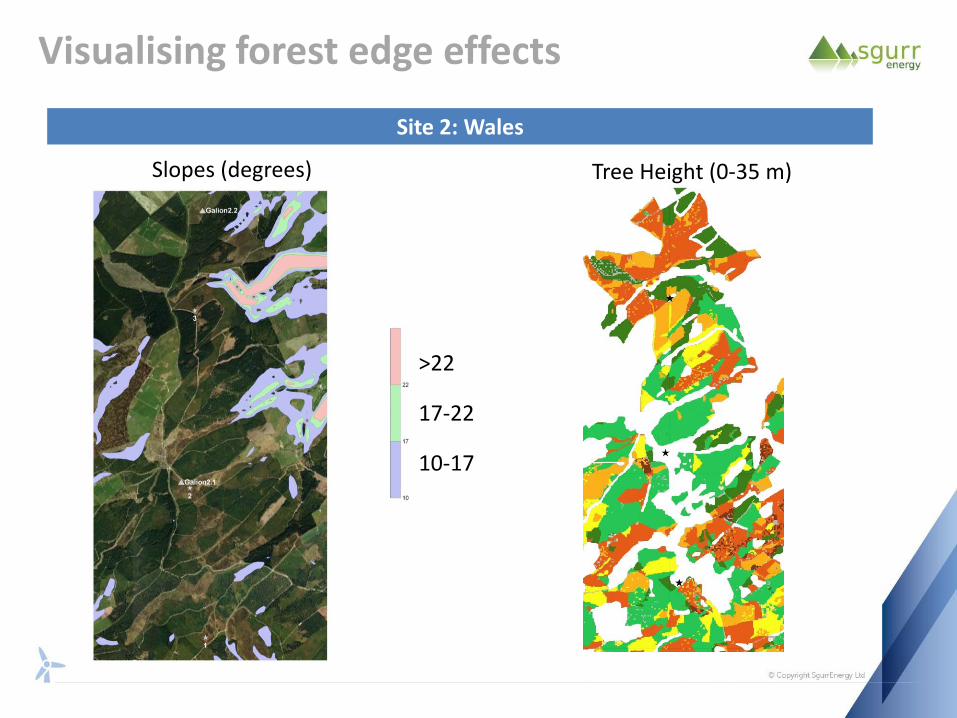
Visualising forest edge effects
Site 2: Wales
Slopes (degrees)
>22
17-22
10-17
Tree Height (0-35 m)

Visualising forest edge effects
• Existing model assessment using site mast datasets – WAsP
– WAsP Engineering – CFD (Meteodyn)
• Both sites had significant measurement campaigns conducted
Site Masts Anemometers Duration
1 4 70 (x2), 60, 50 & 30 m 6+ years, 6 years, 5
years & 3 years
2 2 70 (x2), 55, 40 4.5 years & 1.5 years
1 60 (x2), 50, 40 4.5 years
– All site 1 masts and 1.5 year mast on site 2 have independently calibrated Vector anemometry installed.
– Both 4.5 year site 2 masts have one top Vector anemometer with all others being NRG anemometers for an initial period and later refitted with all Vector anemometry. All Vector anemometers have independent calibrations.
Visualising forest edge effects
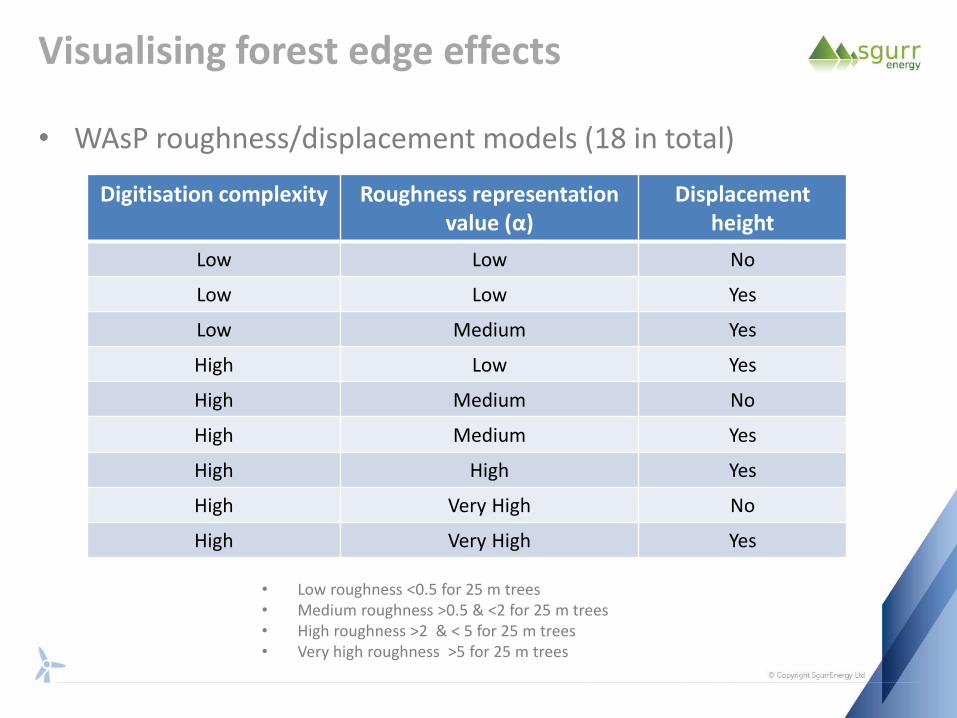
• WAsP roughness/displacement models (18 in total)
Digitisation complexity Roughness representation value (α)
Displacement height
Low Low No
Low Low Yes
Low Medium Yes
High Low Yes
High Medium No
High Medium Yes
High High Yes
High Very High No
High Very High Yes
• Low roughness <0.5 for 25 m trees • Medium roughness >0.5 & <2 for 25 m trees • High roughness >2 & < 5 for 25 m trees • Very high roughness >5 for 25 m trees
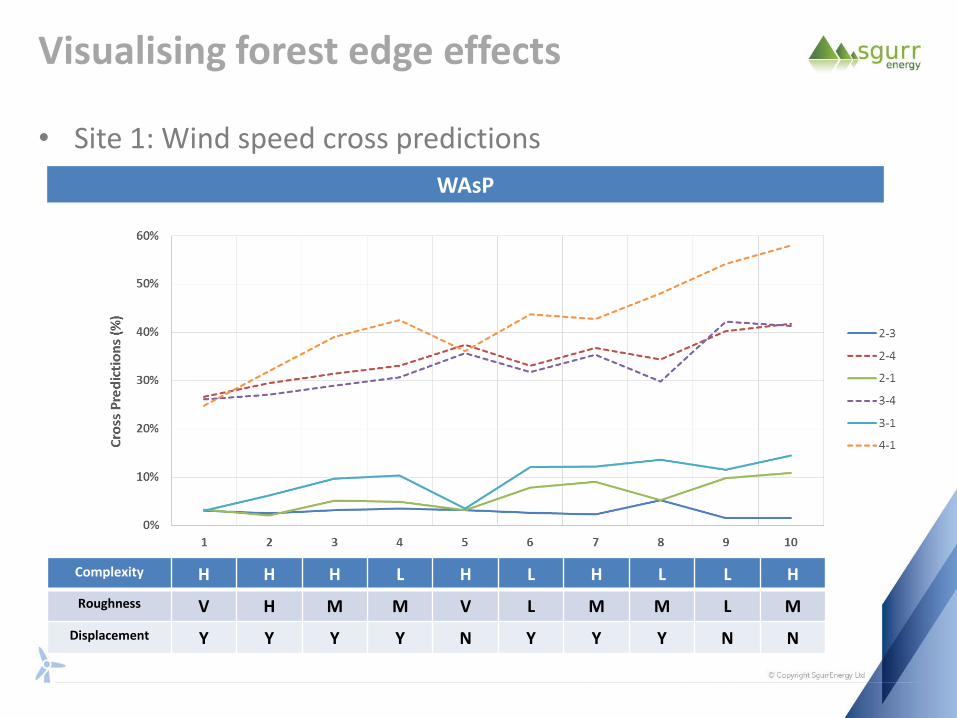
Visualising forest edge effects
• Site 1: Wind speed cross predictions
WAsP
Complexity H H H L H L H L L H
Roughness V H M M V L M M L M
Displacement Y Y Y Y N Y Y Y N N
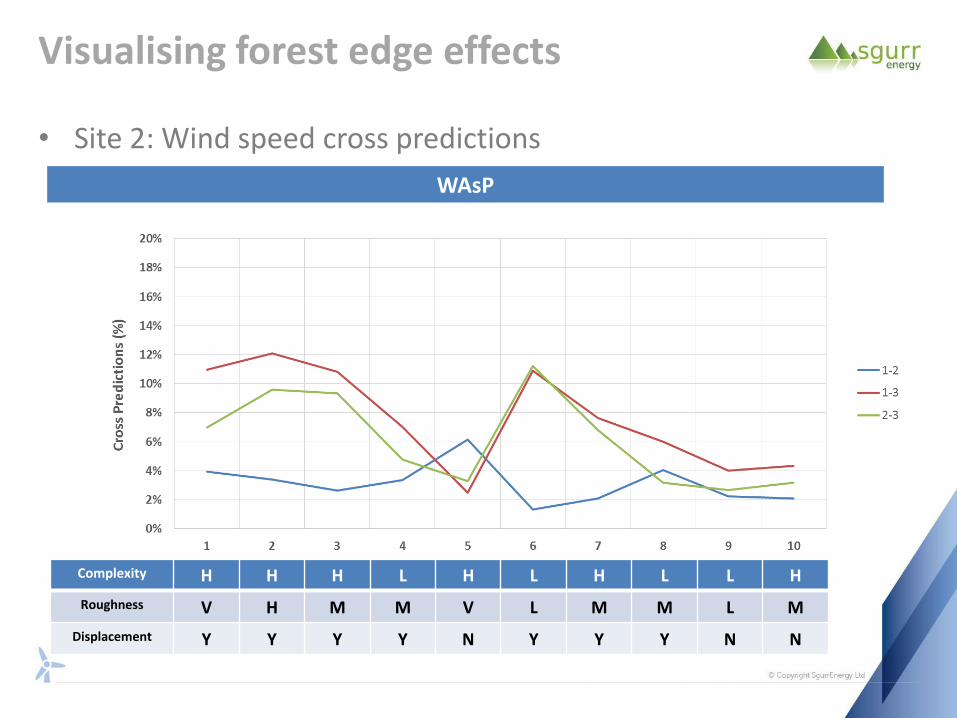
Visualising forest edge effects
• Site 2: Wind speed cross predictions
WAsP
Complexity H H H L H L H L L H
Roughness V H M M V L M M L M
Displacement Y Y Y Y N Y Y Y N N

Visualising forest edge effects
• Intermediate CFD model parameters (approx. 15 models)
Height roughness *
Forest density
Model type
Domain (km)
Sector solution
steps
Horizontal mesh size
Vertical mesh size
H/30 Low Dissipative 30 30 10 2
H/20 Normal Robust 40 10 15 3
H/15 High 18 4
22
25 * H equals tree height
Visualising forest edge effects
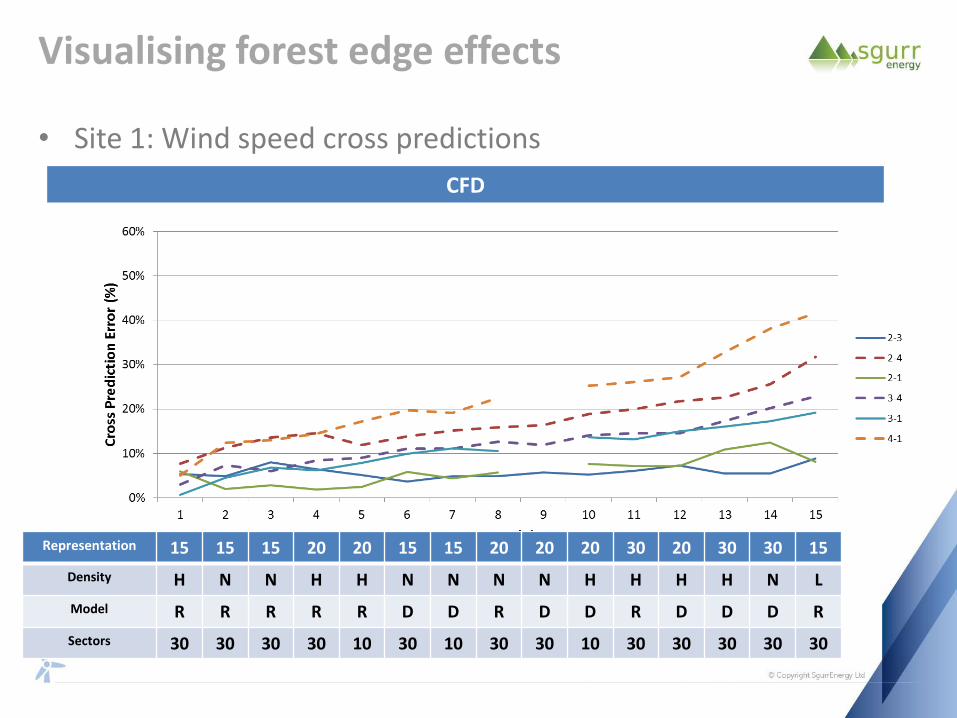
• Site 1: Wind speed cross predictions
CFD
Representation 15 15 15 20 20 15 15 20 20 20 30 20 30 30 15
Density H N N H H N N N N H H H H N L
Model R R R R R D D R D D R D D D R
Sectors 30 30 30 30 10 30 10 30 30 10 30 30 30 30 30
Visualising forest edge effects
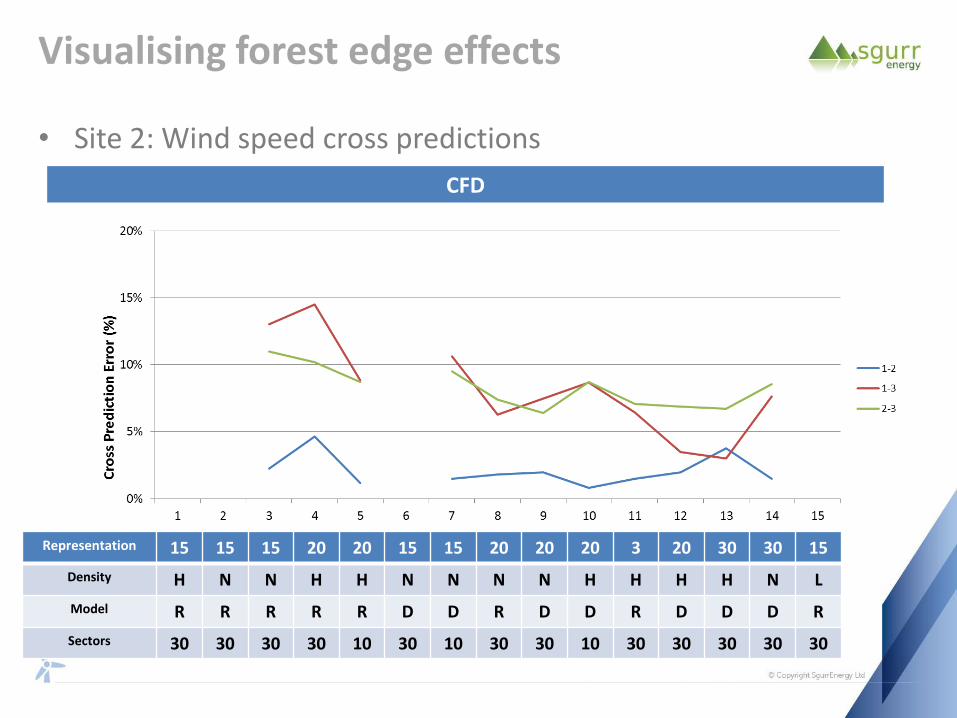
• Site 2: Wind speed cross predictions
CFD
Representation 15 15 15 20 20 15 15 20 20 20 3 20 30 30 15
Density H N N H H N N N N H H H H N L
Model R R R R R D D R D D R D D D R
Sectors 30 30 30 30 10 30 10 30 30 10 30 30 30 30 30
Visualising forest edge effects
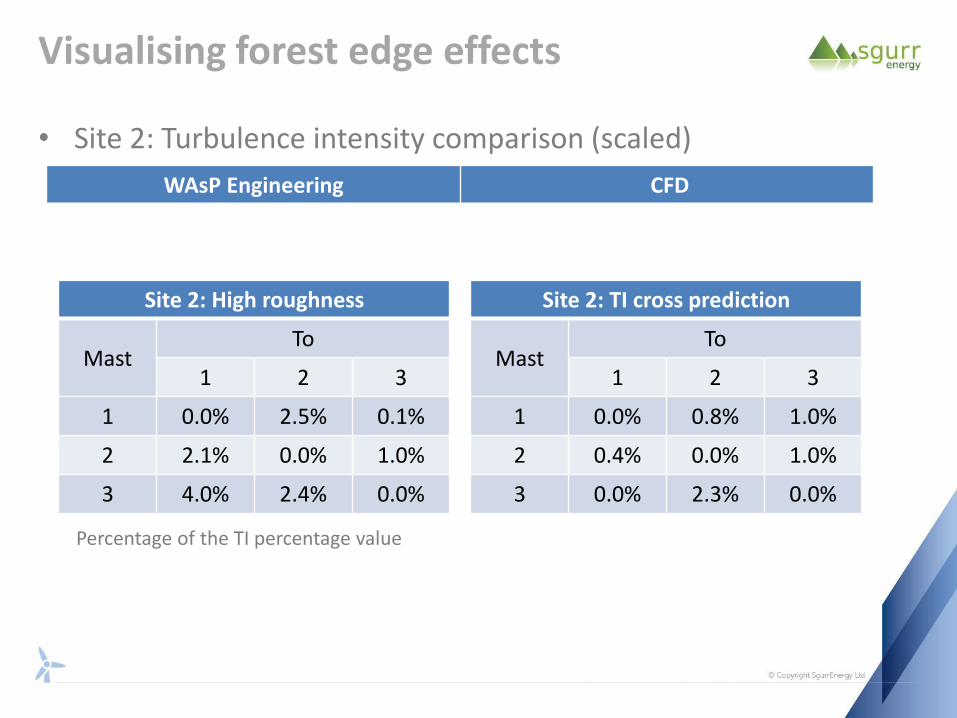
• Site 2: Turbulence intensity comparison (scaled)
Site 2: TI cross prediction
Mast To
1 2 3
1 0.0% 0.8% 1.0%
2 0.4% 0.0% 1.0%
3 0.0% 2.3% 0.0%
WAsP Engineering CFD
Site 2: High roughness
Mast To
1 2 3
1 0.0% 2.5% 0.1%
2 2.1% 0.0% 1.0%
3 4.0% 2.4% 0.0%
Percentage of the TI percentage value
Visualising forest edge effects
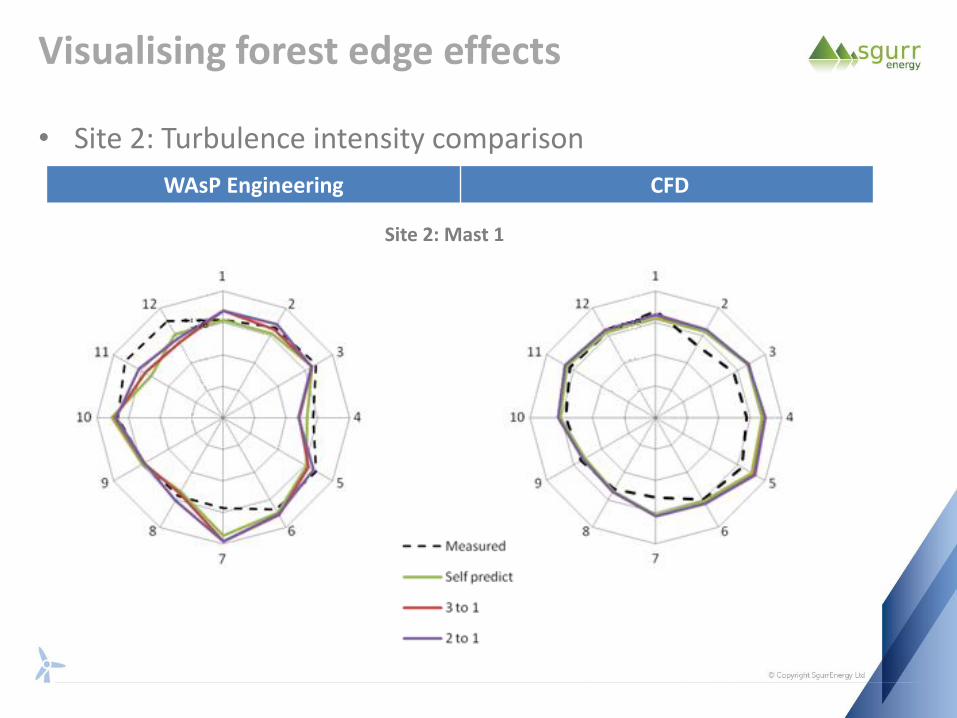
• Site 2: Turbulence intensity comparison
WAsP Engineering CFD
Site 2: Mast 1
Visualising forest edge effects
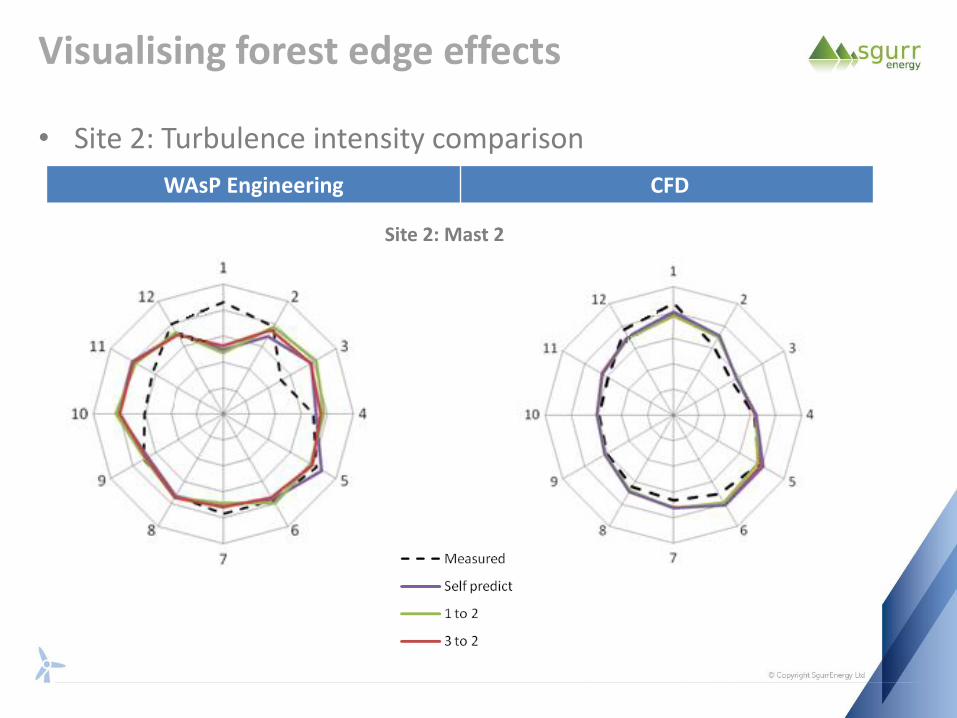
• Site 2: Turbulence intensity comparison
WAsP Engineering CFD
Site 2: Mast 2
Visualising forest edge effects
• Summary – WAsP can perform well in low complexity topography, but
high complexity forestry
– WAsP’s capability deteriorates significantly in moderately complex terrain and complex forestry
– CFD offers significant benefits in moderately complex terrain and complex forestry
BUT
– A single forestry modelling methodology is not optimal for all sites irrespective of WAsP or CFD modelling
Visualising forest edge effects
• Summary Although there is an inherent uncertainty in modelling turbulence intensity due to the difference between modelled and measured turbulence…. – Cross predictions using turbulence intensities from a number of
masts (concurrent datasets) appears to be within the capabilities of CFD wind flow models.
– WAsP Engineering has the capability to cross predict the TI rose from one location to another, but is less capable than CFD in predicting the correct mast TI rose shape.
– CFD provides a greater accuracy in turbulence modelling.
– Measurements are essential – Measurements need to be representative of the site (WTG)
conditions – Models need to be validated
Visualising forest edge effects
• Site measurement status - current – Mast measurements at site
– Fairly representative of the site
– Increasingly supplemented by remote sensing data
– Gain point measurements around a wind farm site
• Site measurement status - ideal – Terrain specific wind flow
• Topographic flow features
• Forestry edge effects
• Measuring across rotor heights
• POWFARM – Advanced measurements using 2nd Generation Galion Lidar
Visualising forest edge effects
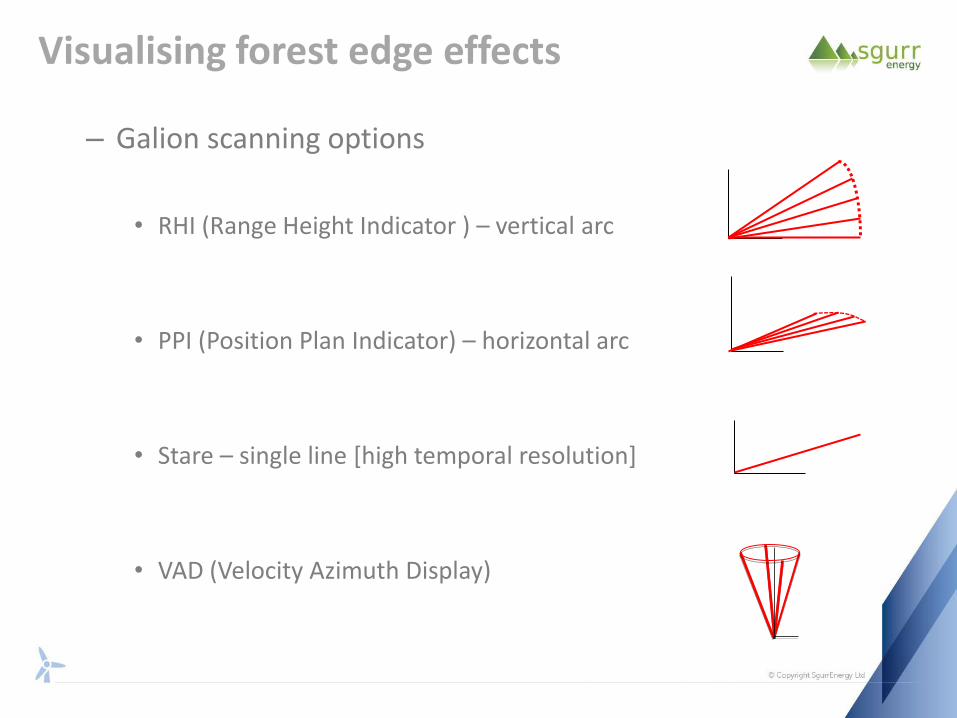
– Galion scanning options
• RHI (Range Height Indicator ) – vertical arc
• PPI (Position Plan Indicator) – horizontal arc
• Stare – single line [high temporal resolution]
• VAD (Velocity Azimuth Display)
Visualising forest edge effects
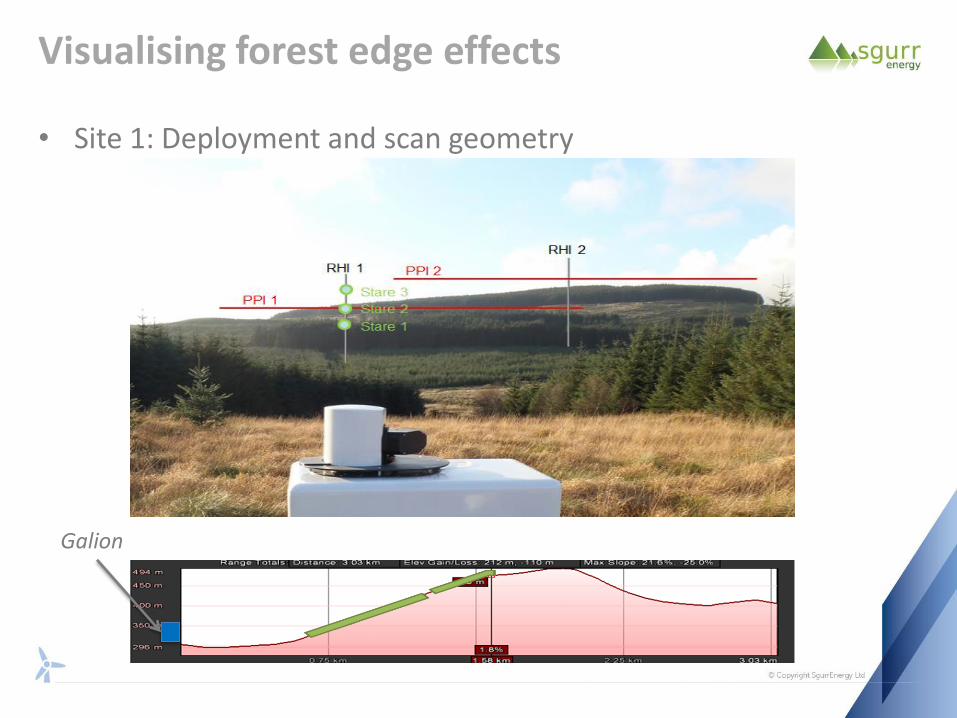
• Site 1: Deployment and scan geometry
Galion
Visualising forest edge effects
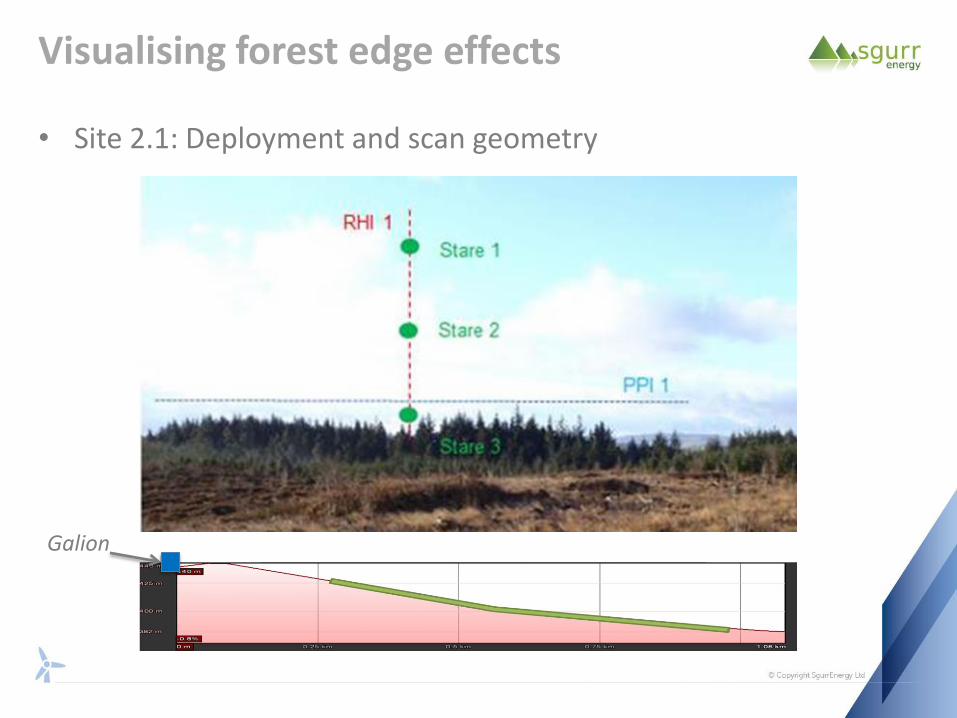
• Site 2.1: Deployment and scan geometry
Galion
Visualising forest edge effects
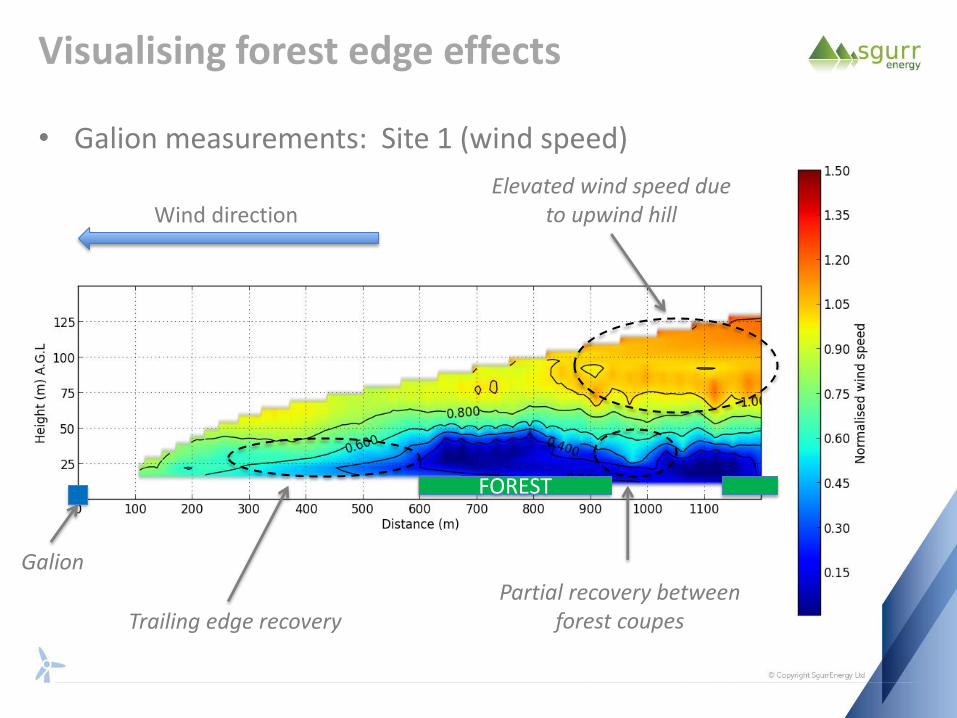
• Galion measurements: Site 1 (wind speed)
Elevated wind speed due to upwind hill
Partial recovery between forest coupes Trailing edge recovery
Wind direction
FOREST
Galion
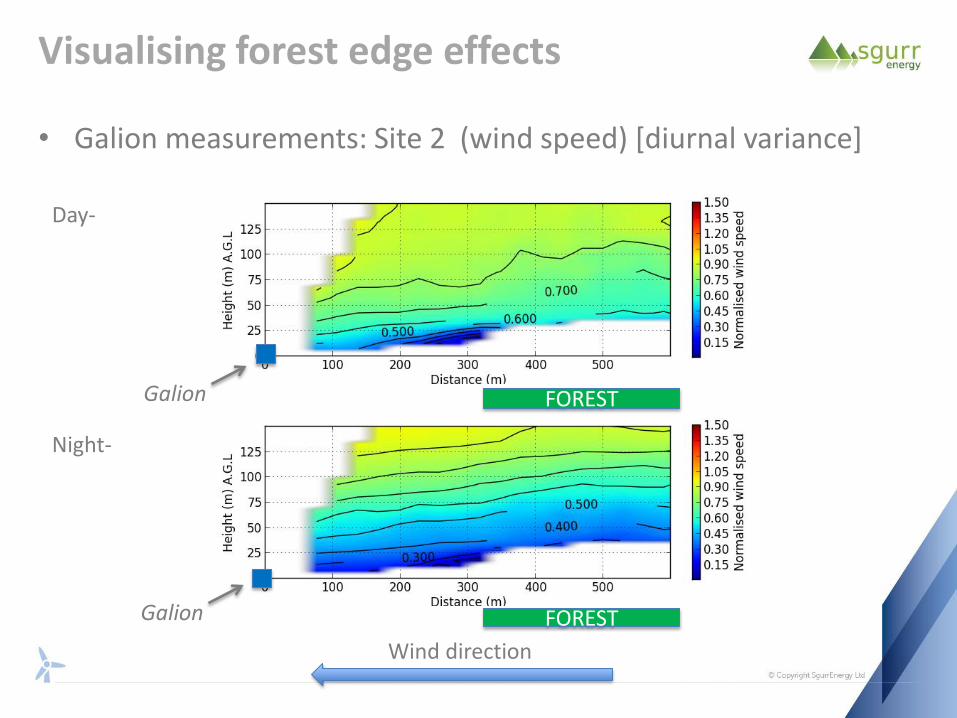
Visualising forest edge effects
• Galion measurements: Site 2 (wind speed) [diurnal variance]
Day- Night-
Wind direction
FOREST
FOREST
Galion
Galion
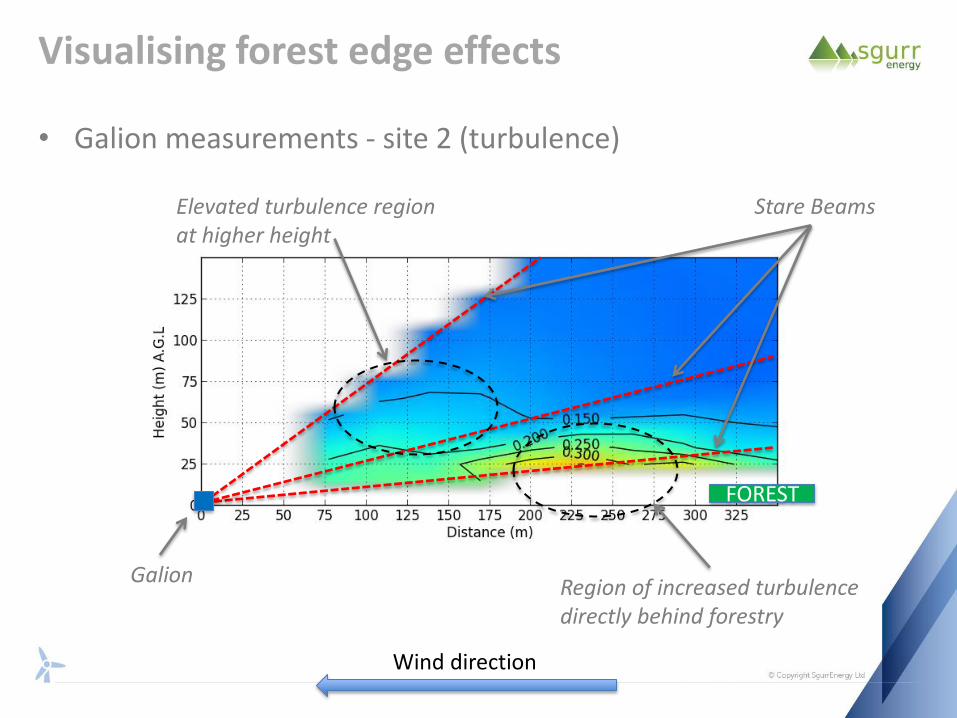
Visualising forest edge effects
• Galion measurements - site 2 (turbulence)
Wind direction
FOREST
Stare Beams
Region of increased turbulence directly behind forestry
Elevated turbulence region at higher height
Galion
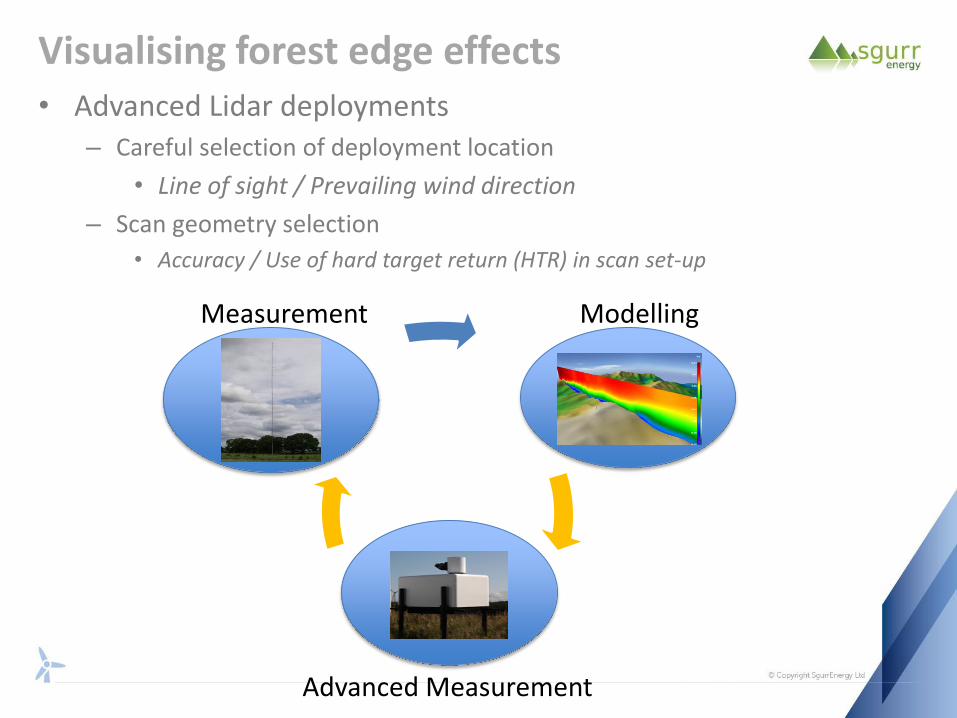
Visualising forest edge effects • Advanced Lidar deployments
– Careful selection of deployment location
• Line of sight / Prevailing wind direction
– Scan geometry selection
• Accuracy / Use of hard target return (HTR) in scan set-up
Measurement Modelling
Advanced Measurement
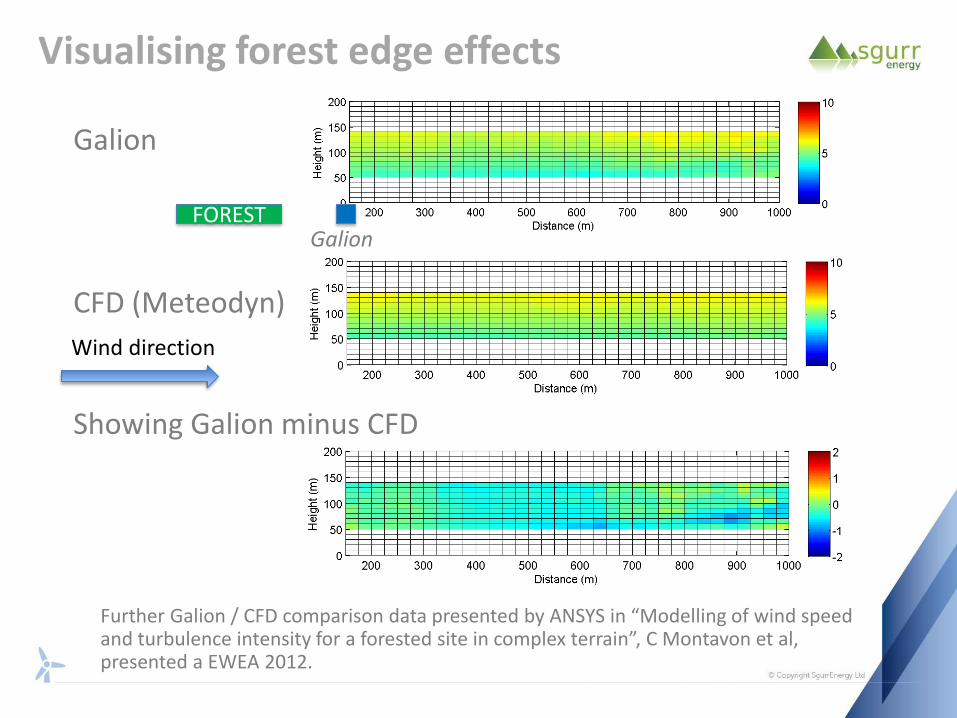
Galion
CFD (Meteodyn)
Showing Galion minus CFD
Visualising forest edge effects
Further Galion / CFD comparison data presented by ANSYS in “Modelling of wind speed and turbulence intensity for a forested site in complex terrain”, C Montavon et al, presented a EWEA 2012.
Wind direction
FOREST Galion
Visualising forest edge effects
• Conclusions
– Advanced modelling and measurement capabilities are available
– Require detailed knowledge of the site and careful model set-up to gain most useful data
– They are able to capture terrain specific flows related to WTG wind regime • Topographic effects
• Forest edge effects
Models can only be as good as the measurements they are validated against
Visualising forest edge effects
• Further work
– Building up database of slope and forestry measurements
– Further validation of CFD wind flow models using the Galion measurements
– Forestry management questions
• Continuous canopy?
• Keyholing – how large?
• Clear-fell - how far?
Visualising forest edge effects
Any questions?
0141 227 1700
www.sgurrenergy.com
225 Bath Street, Glasgow, G2 4GZ
Models can only be as good as the measurements they are validated against