Embed Size (px)
Citation preview
Louisiana State UniversityLSU Digital Commons
LSU Master's Theses Graduate School
2003
Forensic dentistry: dental indicators foridentificationJennifer Gail Hopper McClanahanLouisiana State University and Agricultural and Mechanical College
Follow this and additional works at: https://digitalcommons.lsu.edu/gradschool_theses
Part of the Social and Behavioral Sciences Commons
This Thesis is brought to you for free and open access by the Graduate School at LSU Digital Commons. It has been accepted for inclusion in LSUMaster's Theses by an authorized graduate school editor of LSU Digital Commons. For more information, please contact [email protected].
Recommended CitationMcClanahan, Jennifer Gail Hopper, "Forensic dentistry: dental indicators for identification" (2003). LSU Master's Theses. 2147.https://digitalcommons.lsu.edu/gradschool_theses/2147
FORENSIC DENTISTRY: DENTAL INDICATORS FOR IDENTIFICATION
A Thesis
Submitted to the Graduate Faculty of the Louisiana State University and
Agricultural and Mechanical College in partial fulfillment of the
requirements for the degree of Master of Arts
in
The Department of Geography and Anthropology
by Jennifer Gail Hopper McClanahan B.A., University of Memphis, 1999
May 2003

ACKNOWLEDGMENTS
I would like to thank my graduate committee: Ms. Mary H. Manhein, my advisor, and the
other members of my committee, Drs. Robert Tague and Jill Brody for having patience with this
project and allowing me to complete the work in my own time. Additionally, I wish to thank
Ms. Manhein for allowing me to collect data from the forensic collection.
This thesis was created with the support of my family, without which the completion of
this thesis would not have been possible. I would like to thank my husband for his willingness to
relocate so that I could pursue my education and for providing for me, financially and
emotionally, during my graduate career. I am grateful to my parents for all the love and support
they have given to me. They have always sustained me through the course of my life.
ii
TABLE OF CONTENTS
ACKNOWLEDGMENTS ………………………………………………………………. ii LIST OF TABLES ……………………………………………………………………… iv LIST OF FIGURES ……………………………………………………………………. vii ABSTRACT …………………………………………………………………………... viii CHAPTER
1 INTRODUCTION ………………………………………………………………. 1 2 LITERATURE REVIEW …..…………………………………………………… 4
Tooth Development and Structure …………………………………………….. 5 Tooth Identification …………………………………………………………… 6 Disease, Restoration and Attrition …………………………………………… 11 Sex, Age, Socioeconomic Status, and Race ………………………………….. 16
3 MATERIALS AND METHODS ………………………………………………. 20
4 RESULTS ……………………...………………………………………………. 23 Tooth Wear …………….…………………………………………………….. 24 Staining ………………………………………………………………………. 26 Recovery Method and Postmortem Tooth Loss ……………………………… 29 Antemortem Tooth Loss and False Teeth ..…………………………………... 31 Crowns ……………………………………………………………………….. 34 Abscesses …………………………………………………………………….. 38 Root Canal Therapy ………………………………………………………….. 40 Caries ………………………………………………………………………… 42 Cavity Surfaces ………………………………………………………………. 44 Fillings ……………………………………………………………………….. 45
5 DISCUSSION ………………………………………………………………….. 48 6 CONCLUSIONS ………………………………………………………………. 53
WORKS CITED ……………………………………………………………………….. 54 APPENDIX A DATABASE CODE TABLE ...………………………………………………... 56 B DATABASE FORM ...…………………………………………………………. 58 C DENTAL CHART …..…………………………………………………………. 61 VITA …………………………………………………………………………………… 62
iii
LIST OF TABLES
2.1 Symbol Systems of Permanent Dentition ……………………………………... 8 4.1 Count of Case Types …………………………………………………………. 23
4.2 Tooth Wear Distribution on Tooth Types …...……………………………….. 24
4.3 Tooth Wear Distribution by Sex ……………………………………………... 25
4.4 Tooth Wear Distribution by Socioeconomic Status ………………………….. 25
4.5 Tooth Wear Distribution by Race ……………………………………………. 26
4.6 Tooth Wear Distribution by Age …………………………………………….. 26
4.7 Crown Staining Distribution by Tooth Types ………………………………... 27
4.8 Crown Staining Distribution by Sex. ………………………………………… 27
4.9 Crown Staining Distribution by Socioeconomic Status ...……………………. 28
4.10 Crown Staining Distribution by Race ………………...……………………… 28
4.11 Crown Staining Distribution by Age ………………………………………… 29
4.12 Postmortem Tooth Loss for Each Tooth Type by Recovery Method ………... 30 4.13 Postmortem Tooth Loss by Recovery Method ………………………………. 31 4.14 Postmortem Tooth Loss by Identification ……………………………………. 31 4.15 Antemortem Tooth Loss by Tooth Type …………………………………….. 32 4.16 Antemortem Tooth Loss by Sex ……………………………………………... 32 4.17 Antemortem Tooth Loss by Socioeconomic Status ………………………….. 33 4.18 Antemortem Tooth Loss by Race ……………………………………………. 33 4.19 Antemortem Tooth Loss by Age ……………………………………………... 34 4.20 Crown Type Distribution by Tooth Type ……………………………………. 36 4.21 Crown Type Distribution by Sex …………………………………………….. 36
iv
4.22 Crown Type Distribution by Socioeconomic Status …………………………. 37 4.23 Crown Type Distribution by Race …………………………………………… 37 4.24 Crown Type Distribution by Age ……………………………………………. 38 4.25 Abscess Distribution by Tooth Type ………………………………………… 39 4.26 Abscess Distribution by Sex …………………………………………………. 39 4.27 Abscess Distribution by Socioeconomic Status ……………………………… 39 4.28 Abscess Distribution by Race ………………………………………………... 40 4.29 Abscess Distribution by Age ………………………………………………… 40 4.30 Root Canal Therapy by Tooth Type …………………………………………. 41 4.31 Root Canal Therapy by Sex ………………………………………………….. 41 4.32 Root Canal Therapy by Race ………………………………...………………. 41 4.33 Root Canal Therapy by Age ...……………………………………………….. 42 4.34 Caries Distribution by Tooth Type …………………………………………... 42 4.35 Caries Distribution by Sex …………………………………………………… 43 4.36 Caries Distribution by Socioeconomic Status ………………………………... 43 4.37 Caries Distribution by Race ………………………………………………….. 43 4.38 Caries Distribution by Age …………………………………………………... 44 4.39 Caries Distribution by Quadrant ……………………………………………... 44 4.40 Carious Cavity Surfaces …………………………………………………….... 45 4.41 Filling Type by Tooth Type ………………………………………………….. 46 4.42 Filling Type by Sex …………………………………………………………... 46 4.43 Filling Type by Socioeconomic Status ………………………………………. 46
v

4.44 Filling Type by Race …………………………………………………………. 47 4.45 Filling Type by Age ………………………………………………………….. 47
vi
LIST OF FIGURES
2.1 Tooth Structure in Cross-Section ………………………………………………... 6 2.2 Four Types of Teeth ..……………………………………………………………. 7 2.3 Division of Permanent Dentition into Four Quadrants ………………………….. 7 2.4 Crown Surfaces ………………………………………………………………… 10 2.5 Tooth Decay ……………………………………………………………………. 13 2.6 Cavity Restoration …………..……………………………………….………… 14 2.7 Attrition Stages ………………………………………………………………… 16 2.8 Incisor Variation ……..………………………………………………………… 18 2.9. Enamel Pearl …………………………………………………………………… 19 2.10 Carabelli’s Cusp ………………………………………………………………... 19 4.1 Upper Central Incisors with Engraved Gold Crowns ………………………….. 35
vii
viii
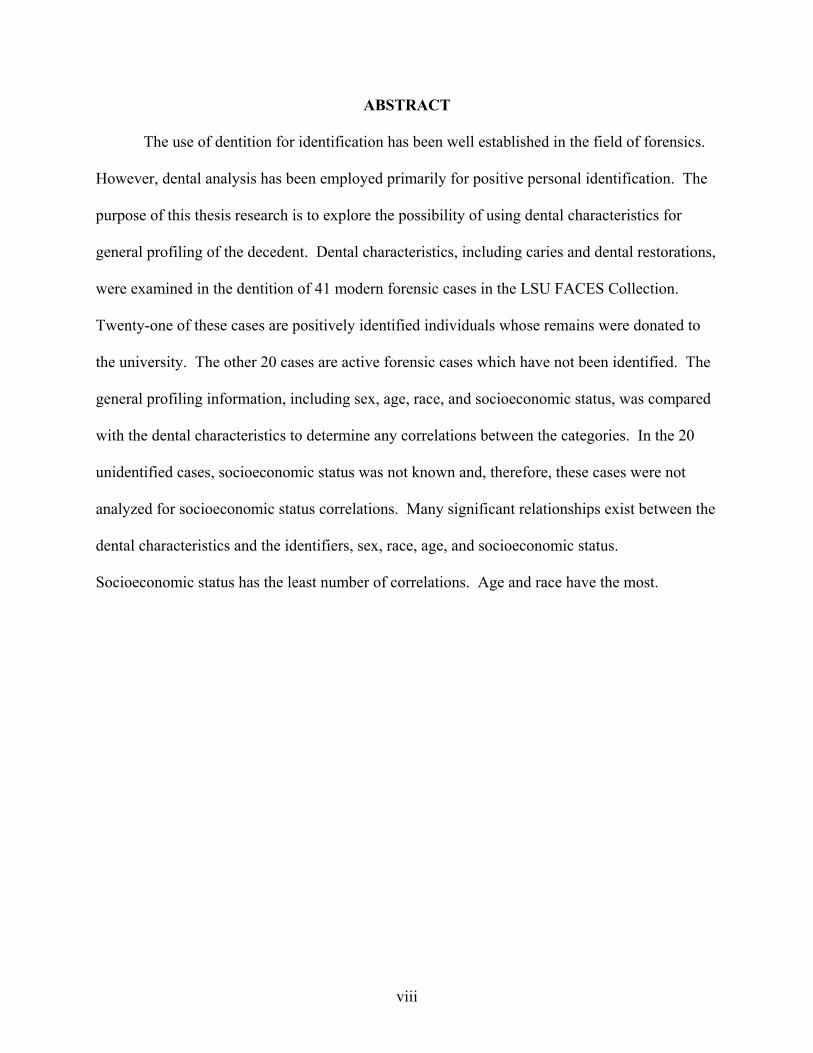
ABSTRACT The use of dentition for identification has been well established in the field of forensics.
However, dental analysis has been employed primarily for positive personal identification. The
purpose of this thesis research is to explore the possibility of using dental characteristics for
general profiling of the decedent. Dental characteristics, including caries and dental restorations,
were examined in the dentition of 41 modern forensic cases in the LSU FACES Collection.
Twenty-one of these cases are positively identified individuals whose remains were donated to
the university. The other 20 cases are active forensic cases which have not been identified. The
general profiling information, including sex, age, race, and socioeconomic status, was compared
with the dental characteristics to determine any correlations between the categories. In the 20
unidentified cases, socioeconomic status was not known and, therefore, these cases were not
analyzed for socioeconomic status correlations. Many significant relationships exist between the
dental characteristics and the identifiers, sex, race, age, and socioeconomic status.
Socioeconomic status has the least number of correlations. Age and race have the most.
CHAPTER 1: INTRODUCTION
When human remains are found, the first priority of investigators is to identify
who the individual was in life. To attain this goal, investigators and researchers use
methods from many fields of science. In cases where the remains are completely or
mostly skeletonized or in which decomposition or deformation of soft tissues has negated
the ability to perform an autopsy or collect fingerprints, identification is determined by
utilizing physical anthropology and odontology.
Anthropologists, especially those trained in forensics, perform an analysis,
whether skeletal remains are complete or incomplete. Many different techniques are used
to gain different types of information. These techniques vary depending upon the part of
the skeleton being examined. For example, age can be estimated from dentition, suture
or epiphyseal closure, changes in the pubic symphysis, changes in the auricular surface of
the ilium, and changes in the sternal end of ribs. (These techniques involve the cranium,
long bones, pelvis, and ribs.) Using these methods in conjunction with each other allows
the anthropologist to reach a more accurate estimation of age, but the completeness of the
skeleton may limit the techniques that can be utilized. (Anthropological analysis
provides an estimation of age, race, and sex. Analysis can also include conclusions about
antemortem, perimortem, and postmortem trauma.)
Most dentists, or odontologists, have the basic knowledge and skills to perform
forensic dental analysis. Analysis of dentition generally includes examination of position
and shape of fillings, presence or absence of teeth, and shape of molar roots. Usually,
this information is gained through the use of radiographs. Forensic odontologists also do
comparative analysis between postmortem information of an unknown individual and
1
antemortem information of a missing person. By comparing these data, an identification
of the unknown individual may be reached.
The process of identification has three types or stages. The first is a general
identification which an anthropologist usually provides when the remains are completely
or mostly skeletonized. This type is a general description of the individual, what the
person’s sex, age, race, and stature were at the time of death. Anthropologists can also
estimate the postmortem interval (PMI), or time since death. The information provided
by anthropologists can lead police investigators to possible identities for the unknown
individual. Comparisons between possible identities and the unknown individual can
direct investigators to a presumptive or positive identification. Presumptive identification
may also be made based on tattoos, circumstantial evidence, personal effects, or facial
reconstruction. This type of identification is not scientifically confirmed, but can be
accepted as final when foul play is not suspected and no other reason for doubt exists.
Positive identification is scientifically proven, usually through dental comparison, DNA
matching, or fingerprinting. A corpus identification, in which a relative or close friend
identifies the individual by viewing the body, is also accepted as positive identification.
However, corpus identification is not beyond human error and is not possible when the
body is in advanced stages of decomposition or severely damaged by trauma such as fire
or mutilation.
This thesis studies the possible use of dentition for determining general profiling
information. Many dental traits that have been used for this purpose in the past, such as
crown size, tooth eruption, incisor shape, and Carabelli’s cusp, are not included in this
research. Instead, dental features that have only been utilized previously for positive
2

3
identification, such as filling shape, are examined in this study for correlations to sex,
race, age, and socioeconomic status.
CHAPTER 2: LITERATURE REVIEW
This thesis research focuses on analysis of dentition in forensic cases, utilizing
many aspects from the field of dental anthropology. In this chapter, the potential of
dental anthropology is examined, the morphology of teeth is explained, and past research
in the field is discussed.
A medical examiner or forensic pathologist should be well aware of the value and
application of forensic dentistry. Although forensic dentistry does not apply to all cases,
the field is extremely important in those cases to which it does apply. Forensic dentistry
is most commonly used for purposes of identification, but is also useful in the evaluation
of bitemark evidence (the latter use will not be addressed in this thesis). The significance
of forensic dentistry was officially recognized in 1969 with the establishment of the
American Society of Forensic Odontology and in 1970 with the formation of an
Odontology Section within the American Academy of Forensic Sciences (Sopher 1976).
Next to fingerprints, teeth are the most useful tool in determining positive
identification of human remains. Teeth are the most durable portion of the body and have
the ability to resist erosion, deterioration, and fire long after death. Teeth must be
exposed to a temperature of over 500°C (932°F) to be reduced to ash. Teeth demonstrate
a variety of form and varied conditions of wear, trauma, disease, and professional
manipulation. Approximate age and useful indications of probable sex, race, occupation,
personal habits, medical history, and environment can often be revealed by analysis of
only teeth (Rogers 1986; 1987; 1988).
4
Tooth Development and Structure
Tooth development begins during the sixth week of embryonic life with the
formation of the primordial tooth buds. Tooth development is slightly, but significantly,
more advanced in girls than in boys, even before puberty (Miles 1963). The deciduous
dentition begins eruption between six to nine months of age, starting with the anterior
teeth and progressing posteriorly. These twenty “baby” teeth are usually completely
erupted by two to two and a half years of age. The permanent dentition begins emerging
at six years of age with the four first molars. Between the ages of six and twelve, the
permanent anterior teeth emerge. Around age twelve, the second molars erupt. The final
four permanent teeth to emerge, out of the total 32, are the third molars, also called
“wisdom” teeth. These teeth are the most unstable. Typically, they erupt around age
eighteen to early twenties. Sometimes these teeth are congenitally absent or are unusual
in appearance (e.g., they may appear as peg teeth).
The completed definitive tooth is naturally divided into two regions: a root and a
crown. “The transition from crown to root takes place at the cervix or neck of the tooth
in a sinuous outline, and is called the cementoenamel junction or the cervical line” (Türp
and Alt 1998: 71-72). Human teeth are composed of four tissues (Figure 2.1): the soft
tissue of the pulp and three calcified tissues called dentin, enamel, and cementum. The
crown consists of an outer layer of enamel and an inner layer of dentin. Dental enamel is
the hardest tissue in the human body. Enamel functions as a resistant outer structure,
allowing the tooth to withstand the abrasive force of mastication (chewing). Dentin is
slightly harder than bone but considerably softer than enamel. Once the enamel is
destroyed, dentin is rapidly penetrated by dental decay. Cementum covers the root and
5
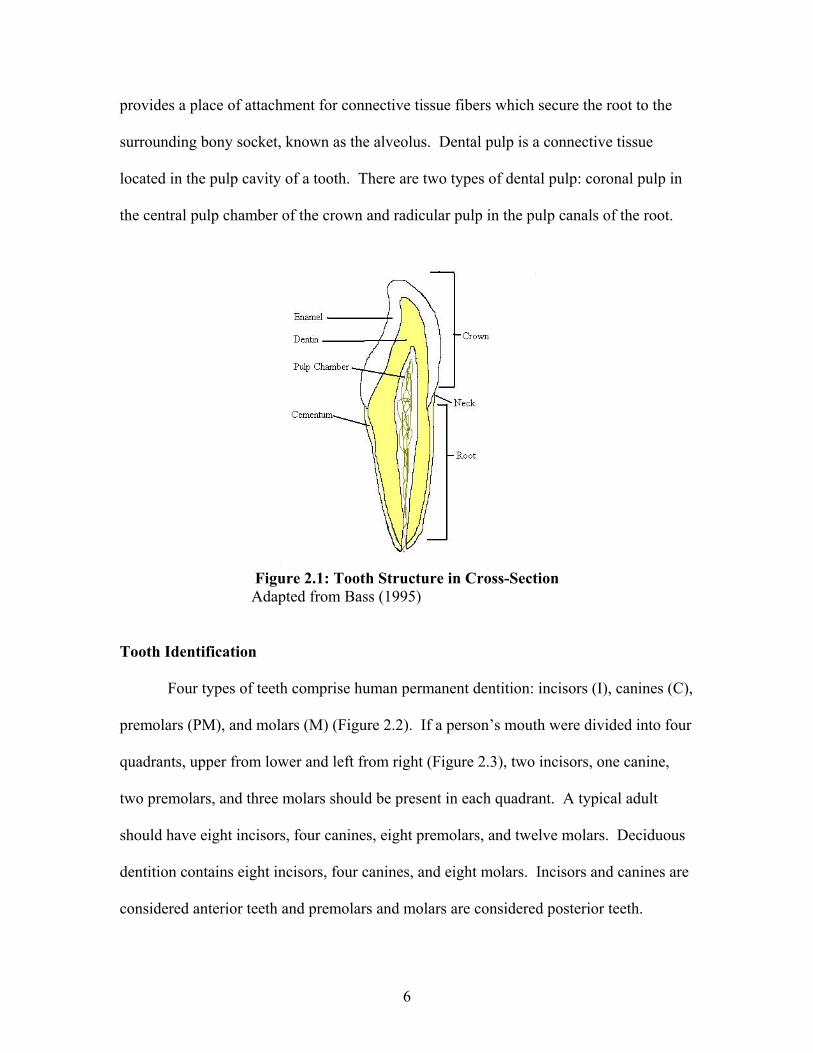
provides a place of attachment for connective tissue fibers which secure the root to the
surrounding bony socket, known as the alveolus. Dental pulp is a connective tissue
located in the pulp cavity of a tooth. There are two types of dental pulp: coronal pulp in
the central pulp chamber of the crown and radicular pulp in the pulp canals of the root.
Figure 2.1: Tooth Structure in Cross-Section Adapted from Bass (1995)
Tooth Identification
Four types of teeth comprise human permanent dentition: incisors (I), canines (C),
premolars (PM), and molars (M) (Figure 2.2). If a person’s mouth were divided into four
quadrants, upper from lower and left from right (Figure 2.3), two incisors, one canine,
two premolars, and three molars should be present in each quadrant. A typical adult
should have eight incisors, four canines, eight premolars, and twelve molars. Deciduous
dentition contains eight incisors, four canines, and eight molars. Incisors and canines are
considered anterior teeth and premolars and molars are considered posterior teeth.
6
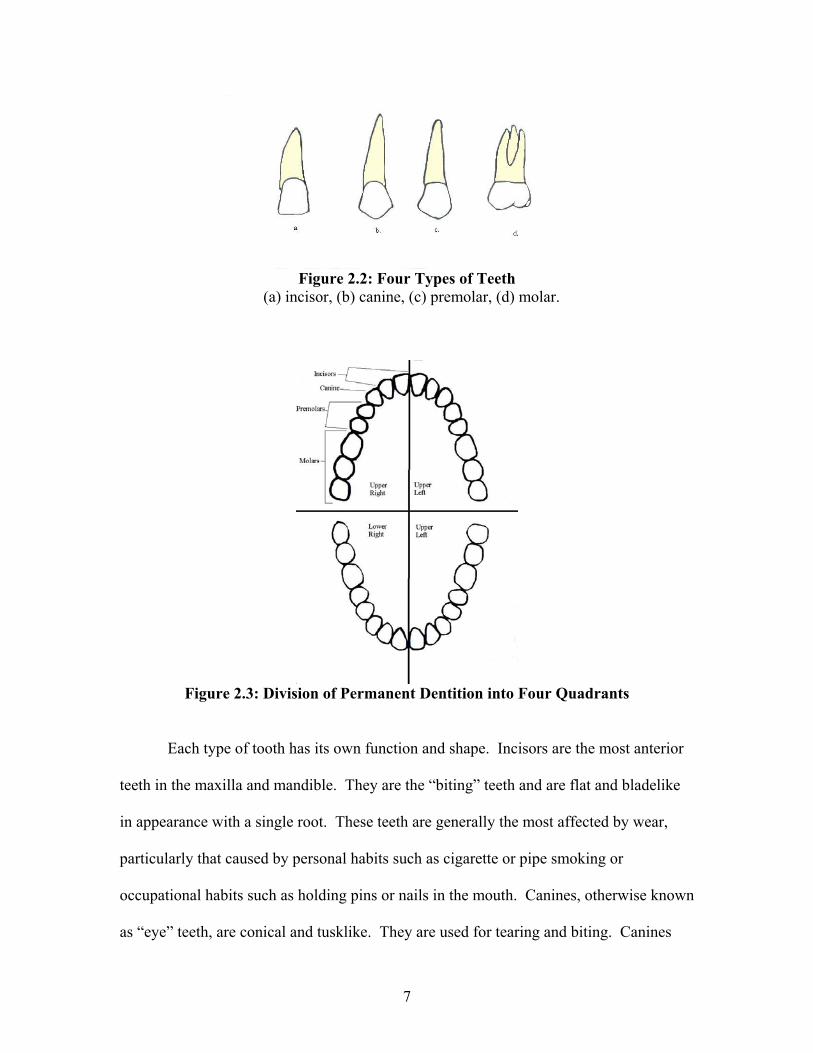
Figure 2.2: Four Types of Teeth
(a) incisor, (b) canine, (c) premolar, (d) molar.
Figure 2.3: Division of Permanent Dentition into Four Quadrants
Each type of tooth has its own function and shape. Incisors are the most anterior
teeth in the maxilla and mandible. They are the “biting” teeth and are flat and bladelike
in appearance with a single root. These teeth are generally the most affected by wear,
particularly that caused by personal habits such as cigarette or pipe smoking or
occupational habits such as holding pins or nails in the mouth. Canines, otherwise known
as “eye” teeth, are conical and tusklike. They are used for tearing and biting. Canines
7
also have a single root, but this root tends to be longer than that of an incisor. Premolars,
also called bicuspids, are usually single rooted. Premolars are used for chewing and are
generally shorter in crown height and root length than a canine. Molars are used for
chewing too. They have two or three roots and four or five cusps. Many subtle
differences exist between individual teeth of the same type. These differences allow for
determining a tooth’s exact position in the dental arch. (These differences will not be
discussed in this thesis. For further information see Bass 1995 and White 2000.)
Dental professionals use several different methods for abbreviating tooth
identification. This variation can lead to difficulties in forensic cases if the examiner is
not familiar with the system being used on an individual’s dental chart. The following is
a brief description of three systems that are common (Table 2.1).
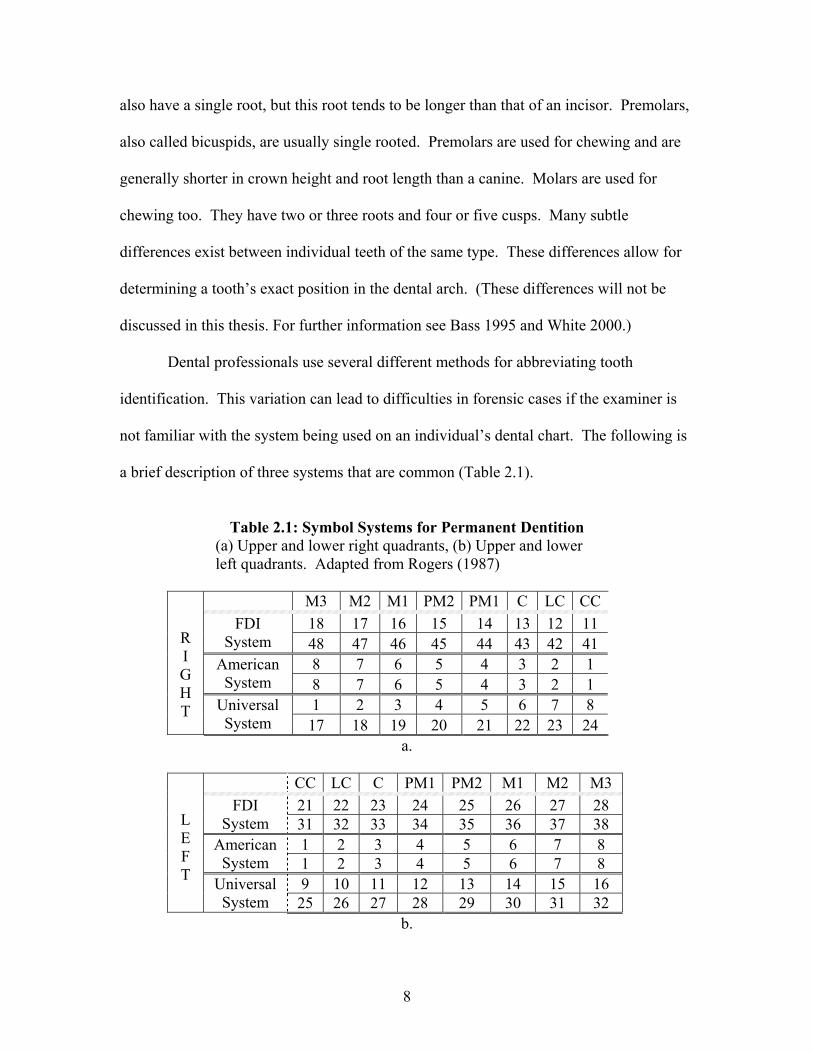
Table 2.1: Symbol Systems for Permanent Dentition
(a) Upper and lower right quadrants, (b) Upper and lower left quadrants. Adapted from Rogers (1987)
M3 M2 M1 PM2 PM1 C LC CC
18 17 16 15 14 13 12 11 FDI System 48 47 46 45 44 43 42 41
8 7 6 5 4 3 2 1 American System 8 7 6 5 4 3 2 1
1 2 3 4 5 6 7 8
R I G H T Universal
System 17 18 19 20 21 22 23 24 a.
CC LC C PM1 PM2 M1 M2 M3 21 22 23 24 25 26 27 28 FDI
System 31 32 33 34 35 36 37 38 1 2 3 4 5 6 7 8 American
System 1 2 3 4 5 6 7 8 9 10 11 12 13 14 15 16
L E F T Universal
System 25 26 27 28 29 30 31 32 b.
8
The Two Digit System or the FDI system (named for the conference where it was
first introduced, the Federation Dentaire Internationale) divides the dental arcade into
four quadrants: upper right, upper left, lower left, and lower right. Prefix numbers are
assigned to each quadrant: 1, 2, 3, and 4 in permanent dentition and 5, 6, 7, and 8 in
deciduous dentition, respectively. Added to this prefix is a number, 1 through 8 for
permanent dentition and 1 through 5 for deciduous for the specific tooth. Each central
incisor is assigned 1 and counting each tooth, moving posteriorly, each third molar is
assigned 8 (Roger 1987). Therefore, in this system, the upper right canine would be
designated as 13.
The American System also separates dentition into four quadrants and numbers
the teeth in each quadrant 1 through 8. The quadrants are not numbered in this system
though. Instead, a written symbol is required for upper right, upper left, lower right, and
lower left. In the Zsigmondy system, a variant of the American system, a right angle is
added to the number. This right angle suggests the quadrant in which the tooth is located
(Rogers 1987).
In the Universal System, dentition is not divided into quadrants. Each tooth has a
unique number. The upper right third molar is designated as number 1, the upper left
third molar as number 16, with the appropriate number assigned to each maxillary tooth.
The lower left third molar is designated as number 17 and the lower right third molar as
number 32, with each mandibular tooth numbered accordingly. This system is the one
utilized in this thesis.
For further accuracy in dental charts, especially when noting dental disease and
restoration, each surface of a tooth should be identifiable. The crown of the tooth
9
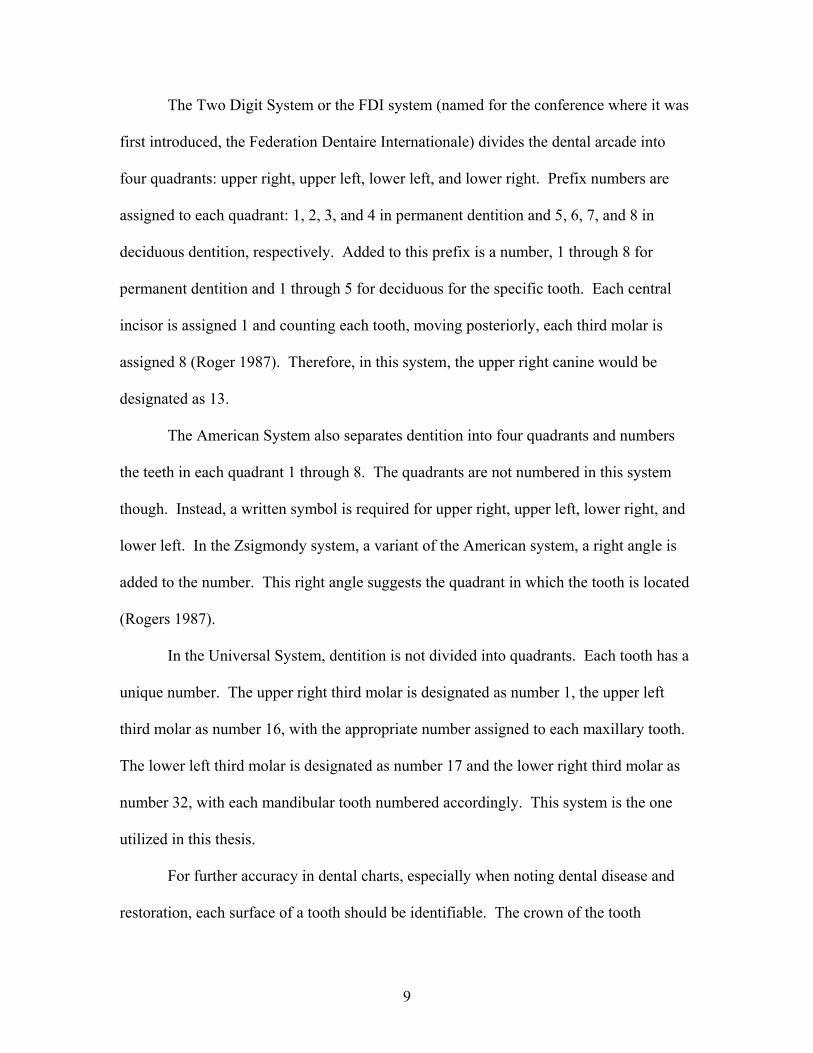
presents five surfaces for visual examination (Figure 2.4). The occlusal surface (O) of
the posterior teeth contacts the opposite tooth when the jaws are closed. For example, the
occlusal surface of the upper right second molar contacts the occlusal surface of the lower
right second molar. The occlusal surface can be regarded as the masticating or chewing
surface of the tooth. On anterior teeth this surface is termed the incisal (I) surface or
edge. For the purpose of this thesis the term occlusal is used for both posterior and
anterior teeth.
Figure 2.4: Crown Surfaces Adapted from Rogers (1988)
The mesial (M) and distal (D) surfaces are in constant direct contact with adjacent
teeth. The mesial surface is directed toward the midline of the dental arch, or anteriorly.
The distal surface is directed away from the midline, or posteriorly. Returning to the
previous example, the mesial surface of the second molar contacts the distal surface of
the first molar; the distal surface of the second molar contacts the mesial surface of the
third molar. This pattern is true for all dentition except the four central incisors. The two
upper central incisors meet mesial surface to mesial surface. The same occurs between
10
the two lower central incisors. The junction between central incisors represents the
midline in the dental arch.
The buccal (B) surface of posterior teeth and the labial (LA) surface of anterior
teeth are directed toward the cheek or lips, respectively. This thesis utilizes only the term
buccal for this surface in both posterior and anterior teeth. The fifth and final tooth
surface is known as the lingual (L) surface. This surface is the inward surface that faces
the tongue.
Disease, Restoration, and Attrition
The mouth is home to a wide variety of microscopic organisms: bacteria, viruses,
yeasts, and protozoa. Many different habitats for these invaders can be found in the
mouth: fissures and pits, surfaces of the cusps and sides of the crown, area between teeth,
and gingival crevice or sulcus around the neck of the tooth. Disease processes of the
jaws and mouth include caries, periodontal disease, periapical osteitis, antemortem tooth
loss, and malocclusion. The last two of these examples are not necessarily caused by
disease due to viral or bacterial infections A structure is described as diseased once it can
no longer operate efficiently. The site at which an abnormality occurs is known as a
lesion. Damage to the structure may be confined to soft tissues or may involve
widespread hard tissue destruction and repair (Hillson 1986). The common causes of
tooth loss are dental caries in the younger population and periodontal disease in the older
population.
Caries, or caries dentium, is the name used for tooth decay. Dental caries
represents progressive destruction of tooth structure due to bacterial acid formation. A
carious lesion is characterized by the demineralization of enamel, dentine, and/or
11
cementum by microorganisms that inhabit the plaque on crown surfaces. Caries start at
the enamel surface of the crown or at exposed parts of the neck, working its way through
the dentine into the pulp cavity. Caries may also start in roots exposed by periodontal
disease. The crown can be totally destroyed and other periodontal difficulties, such as an
abscess, may arise. If left untreated, the affected tooth may fall out and the alveolus will
close in time. However, inflammation can spread into surrounding bone (Caselitz 1998).
A carious lesion on the crown surface is first visible as a microscopic opaque spot
in the enamel. This spot may be white or stained brown. Over time, the spot becomes
large enough to be viewed without a microscope. The enamel surface becomes rough
and, eventually, a small cavity appears. Hillson (1986) notes variability in the results of
different observers when opaque spots are included in a study. For this reason, these
spots were not included in this research, only visible cavities. This cavity will continue
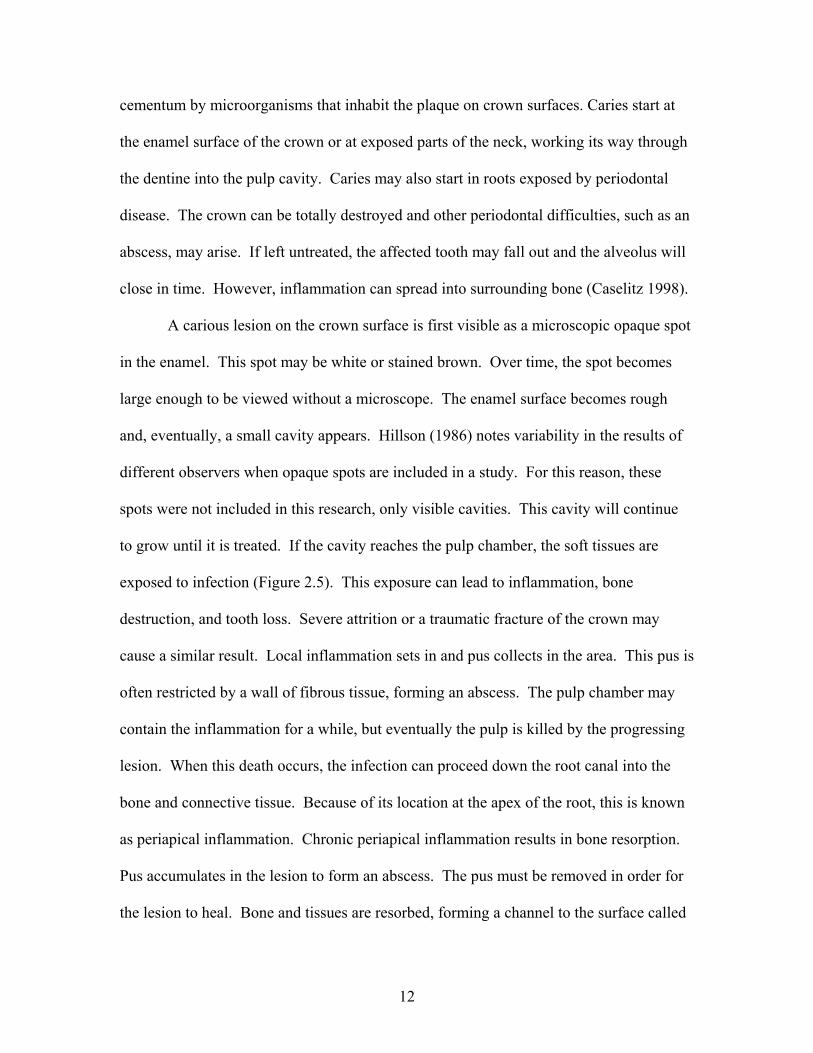
to grow until it is treated. If the cavity reaches the pulp chamber, the soft tissues are
exposed to infection (Figure 2.5). This exposure can lead to inflammation, bone
destruction, and tooth loss. Severe attrition or a traumatic fracture of the crown may
cause a similar result. Local inflammation sets in and pus collects in the area. This pus is
often restricted by a wall of fibrous tissue, forming an abscess. The pulp chamber may
contain the inflammation for a while, but eventually the pulp is killed by the progressing
lesion. When this death occurs, the infection can proceed down the root canal into the
bone and connective tissue. Because of its location at the apex of the root, this is known
as periapical inflammation. Chronic periapical inflammation results in bone resorption.
Pus accumulates in the lesion to form an abscess. The pus must be removed in order for
the lesion to heal. Bone and tissues are resorbed, forming a channel to the surface called
12
a sinus or fistula that usually penetrates the gum on the buccal side of the alveolar process
(Hillson 1986).
Figure 2.5: Tooth Decay
(a) Decay has penetrated the enamel and dentin; restoration should occur at this stage; (b) Decay has reached the pulp; root canal therapy is necessary at this stage. Adapted from Sopher (1976)
One of the purposes of regular dental examination is the detection and arrest of
dental caries in its earliest stages. Once caries is detected, the carious tissue is removed
and the structure and function of the tooth are restored. Most caries restoration involves
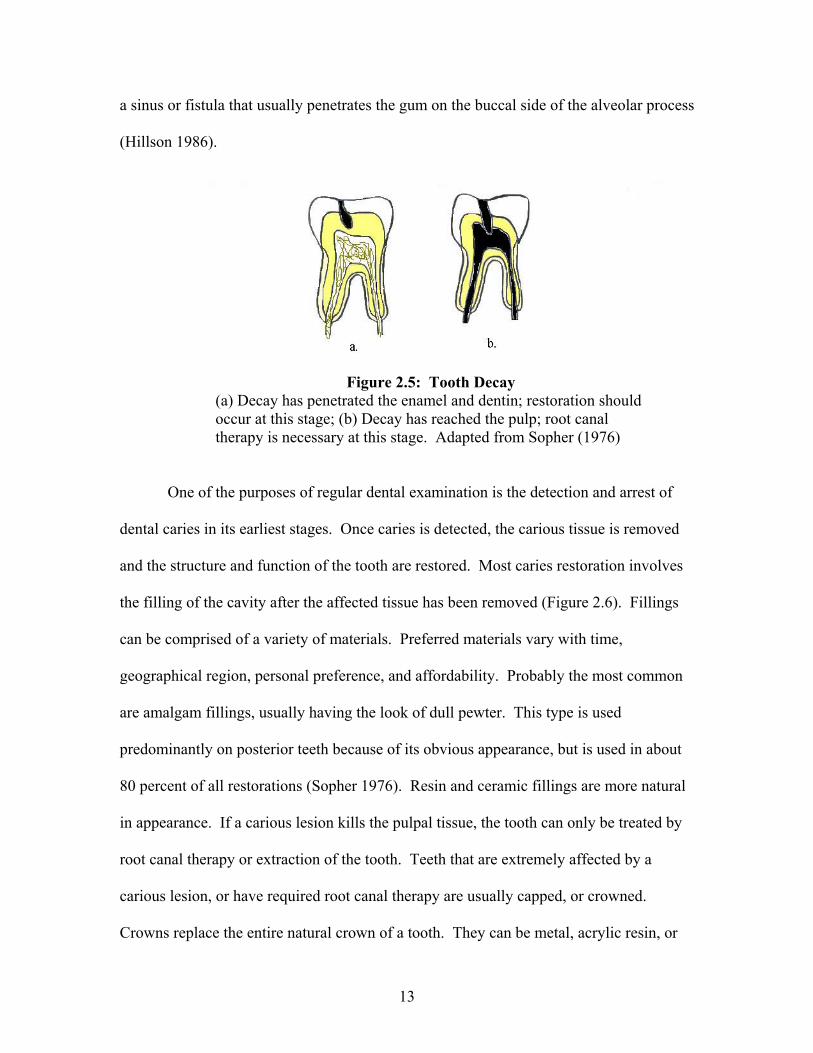
the filling of the cavity after the affected tissue has been removed (Figure 2.6). Fillings
can be comprised of a variety of materials. Preferred materials vary with time,
geographical region, personal preference, and affordability. Probably the most common
are amalgam fillings, usually having the look of dull pewter. This type is used
predominantly on posterior teeth because of its obvious appearance, but is used in about
80 percent of all restorations (Sopher 1976). Resin and ceramic fillings are more natural
in appearance. If a carious lesion kills the pulpal tissue, the tooth can only be treated by
root canal therapy or extraction of the tooth. Teeth that are extremely affected by a
carious lesion, or have required root canal therapy are usually capped, or crowned.
Crowns replace the entire natural crown of a tooth. They can be metal, acrylic resin, or
13
porcelain. The resin or porcelain, again, provides a more attractive or natural look to the
restored tooth.
Figure 2.6: Cavity Restoration
(a) diseased tooth, (b) excavated cavity, (c) cavity restored with filling. Adapted from Sopher (1976)
The host’s resistance and diet affect the extent of dental caries. Morphological
crown complexity, tooth size, trace elements in food and water, developmental defects,
dental wear, and immunologic characteristics of saliva are all factors of host resistance.
Dietary factors that influence caries progression include the types of foods eaten,
methods of food preparation, eating habits, and duration and degree of mastication (Scott
and Turner 1988). Between 1945 and 1951, a series of experiments demonstrated a
correlation between annual sugar consumption and the frequency of carious lesions
(Hillson 1986).
To anthropologists, caries is the most important dental disease because of its
association with the evolution of food production. Caries is an ancient and widely spread
disease that already existed in the australopithecines of South Africa, one of the earliest
known hominids that existed 4.4 to 1.2 million years ago (Klein 1999). Low caries rates
have been observed in Mesolithic and early Neolithic times. The rate of caries remains
relatively constant between the middle of the ninth to the middle of the fifth millennium
14
B.C. Then rates increase dramatically in the span of only one century. “Caries
promoting conditions could be linked to the spreading use of grains. The caries rate then
remains nearly stable up to the Middle Bronze Age and increases continuously from the
middle of the second millennium to late Roman times or the middle of the first
millennium A.D.” (Caselitz 1998: 207). A second increase in the rate, which may be the
result of the introduction of new foodstuffs into Europe from the Americas, begins in the
sixteenth century. Caries rates have continued to climb, reaching a record high at present
(Caselitz 1998).
Studies have revealed many important facts about caries. Parents and offspring
tend to, but do not necessarily, have similar caries experiences. Women are more
affected by the disease than men, but within one individual, left and right sides are
usually affected equally (Hillson 1986). The first molar is generally thought to be the
most affected tooth. However, this opinion has not been supported by any extensive data.
Upper molars are less affected than their lower opponents, and posterior teeth are more
affected than anterior teeth (Caselitz 1998).
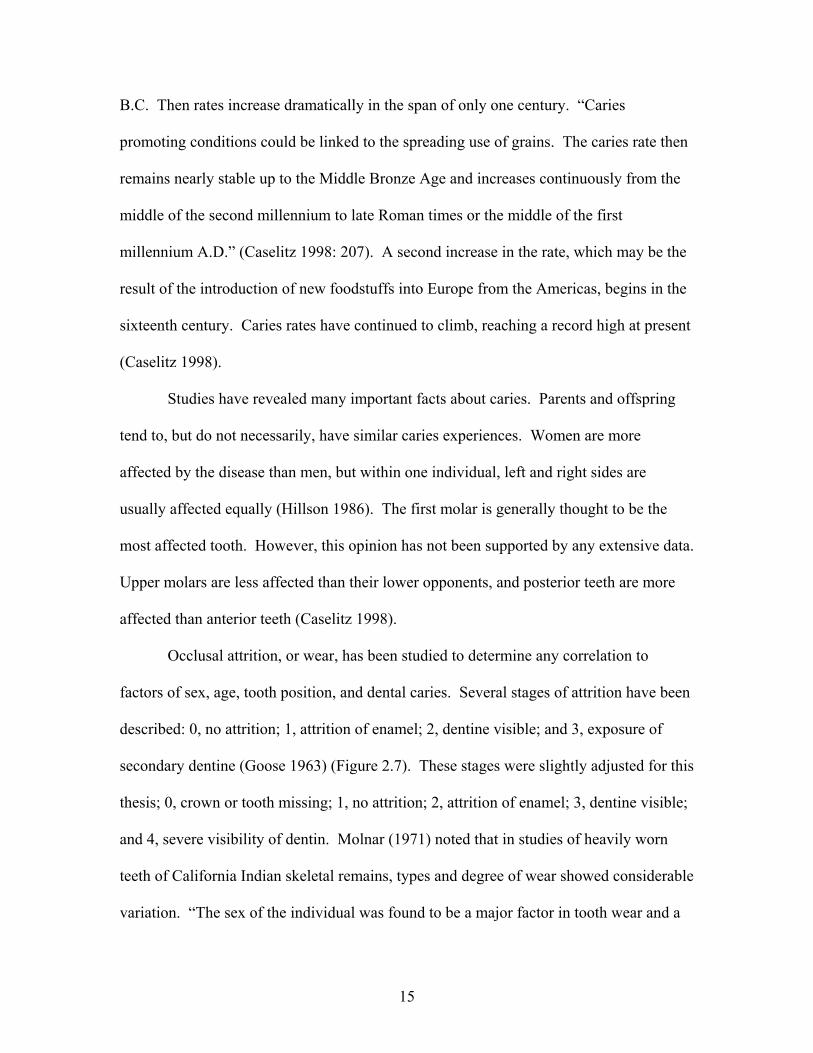
Occlusal attrition, or wear, has been studied to determine any correlation to
factors of sex, age, tooth position, and dental caries. Several stages of attrition have been
described: 0, no attrition; 1, attrition of enamel; 2, dentine visible; and 3, exposure of
secondary dentine (Goose 1963) (Figure 2.7). These stages were slightly adjusted for this
thesis; 0, crown or tooth missing; 1, no attrition; 2, attrition of enamel; 3, dentine visible;
and 4, severe visibility of dentin. Molnar (1971) noted that in studies of heavily worn
teeth of California Indian skeletal remains, types and degree of wear showed considerable
variation. “The sex of the individual was found to be a major factor in tooth wear and a
15
higher degree of attrition was found among females. As would be expected, the older
individuals had the most heavily worn teeth but this relationship was not constant and
some differences were seen. Tooth position was also an important variable in
determining the degree of wear” (Molnar 1971: 182), due to tooth grinding, mastication,
and occupational use.
Figure 2.7: Attrition Stages
(a) 0- no attrition, (b) 1- attrition of enamel, (c) 2- dentine visible, (d) 3- exposure of secondary dentine. Adapted from Rogers (1987)
Sex, Age, Socioeconomic Status, and Race
Few obvious and consistent differences exist between male and female teeth,
according to past studies. These differences include size and rate of dental growth.
Tooth eruption appears to be more affected by sex differences, hormonal disturbances,
and dietary deficiencies than by racial differences (Miles 1963).
Teeth can provide information in several ways as to the age of an individual at the
time of death. Teeth are the most reliable indicator of age if an individual is fourteen
16
years old or younger. This fact is due to the consistent rate with which teeth erupt.
Simple naked-eye observation of emergence and attritional changes can be adequate for
an estimation of age. Radiographic methods or histological techniques supplement these
observations and reveal tooth deterioration more accurately.
Dental restorations may indicate the economic, regional, and racial background of
an individual. Methods of restoration used in certain countries or regions may be rare or
not used in other areas. The amount of expensive restorations found in an individual may
suggest social status (Kieser-Nielsen 1980). Wear patterns and staining can suggest
occupation or personal habits such as smoking.
Attempts have been made to determine the extent to which crown morphology
can be utilized to determine predictable patterns of biological relationships among human
populations.
A biological trait can be useful in historical-evolutionary analyses only if a
significant component of its variation is genetic. Phenotypic differences
between groups through time and space can then be assumed to reflect
temporal gene frequency changes or underlying genetic differences,
respectively. Aspects of the human dentition most likely to have a strong
genetic component-- tooth size, morphology, and number-- have been
analyzed (Scott and Turner 1988: 100).
Early French and German anthropologists and odontologists showed that some
morphological variants, such as cusp number of molars, differed between the major races
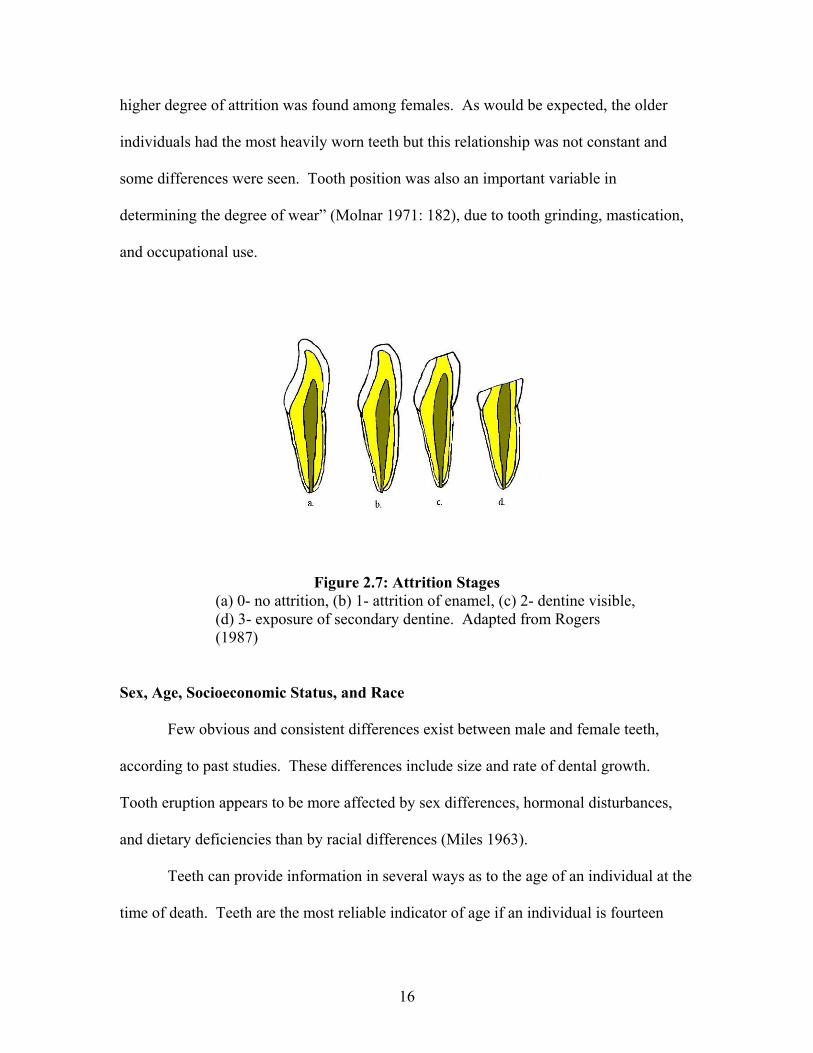
of humankind (Scott and Turner 1997). The classic papers of Hrdlička (1920) and
Hellman (1928) on shovel-shaped incisors (Figure 2.8) and lower molar morphology,
17
respectively, were among the earliest studies of differences in crown trait frequencies
between geographical races. The world population is traditionally divided by physical
anthropologists into three categories: Caucasoid, Mongoloid, and Negroid. Caucasoids
are people of European descent. Mongoloids are people of Asian descent, including
Native and Latin Americans. Negroids are people of African descent. However, recent
trends in physical anthropology have modified these terms to be more specific or
politically correct. Caucasoids and Negroids are now typically referred to as whites and
blacks, respectively. Mongoloids are now usually divided into two groups: Asians and
Southwest Mongoloids. This thesis will use the terms white, black and Mongoloid.
Figure 2.8: Incisor Variation (occlusal view)
(a) normal incisor, (b) shovel-shaped incisor. Adapted from Bass (1995)
Probably the most frequently discussed racial dental trait is shovel-shaped
incisors, most prevalent in Mongoloids. However, this trait is only one of many
morphological characteristics connected to geographic variation. The size and shape of
teeth seem little affected by environmental factors and, therefore, genetic factors must
play a major role in these differences (Goose 1963). Significant correlations between
racial and subracial groups and tooth size have been noted in studies. Enamel pearls
(Figure 2.9) occur more frequently on the premolars of Mongoloids than whites or
blacks. Carabelli’s cusp or tubercle is frequently demonstrated in the negative form with
18
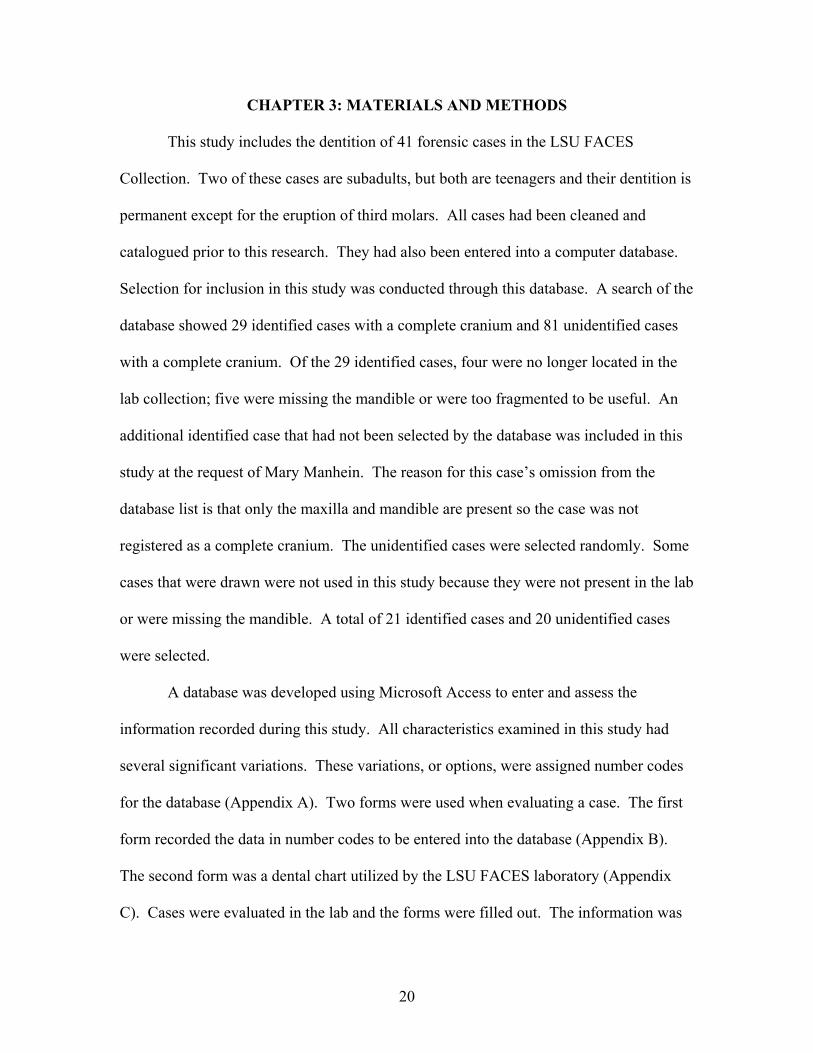
pits and grooves in Mongoloid populations and in the positive form with projections or
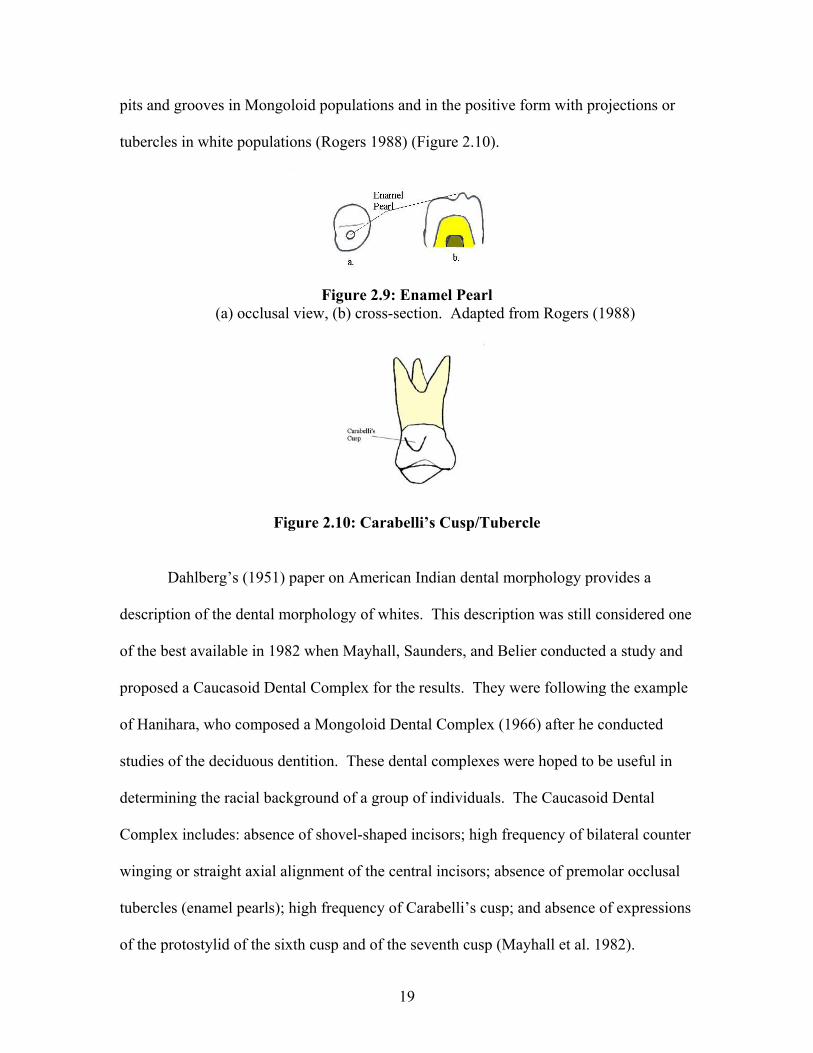
tubercles in white populations (Rogers 1988) (Figure 2.10).
Figure 2.9: Enamel Pearl
(a) occlusal view, (b) cross-section. Adapted from Rogers (1988)
Figure 2.10: Carabelli’s Cusp/Tubercle
Dahlberg’s (1951) paper on American Indian dental morphology provides a
description of the dental morphology of whites. This description was still considered one
of the best available in 1982 when Mayhall, Saunders, and Belier conducted a study and
proposed a Caucasoid Dental Complex for the results. They were following the example
of Hanihara, who composed a Mongoloid Dental Complex (1966) after he conducted
studies of the deciduous dentition. These dental complexes were hoped to be useful in
determining the racial background of a group of individuals. The Caucasoid Dental
Complex includes: absence of shovel-shaped incisors; high frequency of bilateral counter
winging or straight axial alignment of the central incisors; absence of premolar occlusal
tubercles (enamel pearls); high frequency of Carabelli’s cusp; and absence of expressions
of the protostylid of the sixth cusp and of the seventh cusp (Mayhall et al. 1982).
19
CHAPTER 3: MATERIALS AND METHODS This study includes the dentition of 41 forensic cases in the LSU FACES
Collection. Two of these cases are subadults, but both are teenagers and their dentition is
permanent except for the eruption of third molars. All cases had been cleaned and
catalogued prior to this research. They had also been entered into a computer database.
Selection for inclusion in this study was conducted through this database. A search of the
database showed 29 identified cases with a complete cranium and 81 unidentified cases
with a complete cranium. Of the 29 identified cases, four were no longer located in the
lab collection; five were missing the mandible or were too fragmented to be useful. An
additional identified case that had not been selected by the database was included in this
study at the request of Mary Manhein. The reason for this case’s omission from the
database list is that only the maxilla and mandible are present so the case was not
registered as a complete cranium. The unidentified cases were selected randomly. Some
cases that were drawn were not used in this study because they were not present in the lab
or were missing the mandible. A total of 21 identified cases and 20 unidentified cases
were selected.
A database was developed using Microsoft Access to enter and assess the
information recorded during this study. All characteristics examined in this study had
several significant variations. These variations, or options, were assigned number codes
for the database (Appendix A). Two forms were used when evaluating a case. The first
form recorded the data in number codes to be entered into the database (Appendix B).
The second form was a dental chart utilized by the LSU FACES laboratory (Appendix
C). Cases were evaluated in the lab and the forms were filled out. The information was
20
then entered into the database for analysis. Absent third molars with no obvious
corresponding socket were recorded as antemortem loss. No attempt to separate
congenital absence from antemortem loss or extraction was made. For this reason, third
molars were excluded from analysis of antemortem tooth loss. Broken teeth of all
degrees were recorded as partial presence. Further examination of these teeth was done
to whatever extent was allowed by the condition of the tooth. In some of these instances,
only the root was present and, therefore, no analysis of crown characteristics was
possible. These characteristics were recorded as unknown. In other instances, only a
small chip was missing from the crown and all characteristics could be assessed.
For the identified cases, the information provided by the lab database and files for
sex, age, and race was obviously correct and was used for the purpose of this thesis. The
individual’s name was never taken from the files and they are known only by the LSU
case number in all data recorded for this thesis. Socioeconomic status was based upon
the individual’s occupation at the time of death. However, this determination may not be
an accurate portrayal of a person’s economic position. The exact amount of household
income was not known in any case and, therefore, socioeconomic status is not based on
an individual’s level of income. For this reason, the designation of socioeconomic status
is not absolute and analysis involving this identifier is highly questionable. In future
studies, knowledge of income in numerical terms is recommended. For unidentified
cases, previous conclusions about sex, age, and race were accepted as accurate and were
not reassessed for this thesis.
In all cases, the information provided by the database and lab cards was checked
against the files. Radiographs were consulted in all cases for determining the presence of
21
22
root canal therapy, third molars, and for confirming cavity placement. In one case,
fillings were observed during this thesis research which were not noted in the existing
file. Radiographic evidence was inconclusive and a microscope was used to make the
final determination. The teeth in question did have resin fillings and the changes were
made to the file.
Queries were performed through the Microsoft Access database and reports were
generated from these queries. The reports were examined to determine frequencies and
correlations of the traits important to this study. Two-way frequency tables were created
to examine connections between traits. Chi-square tests were used to determine
significant relationships between characteristics. The level of significance in all tests was
0.05.
CHAPTER 4: RESULTS
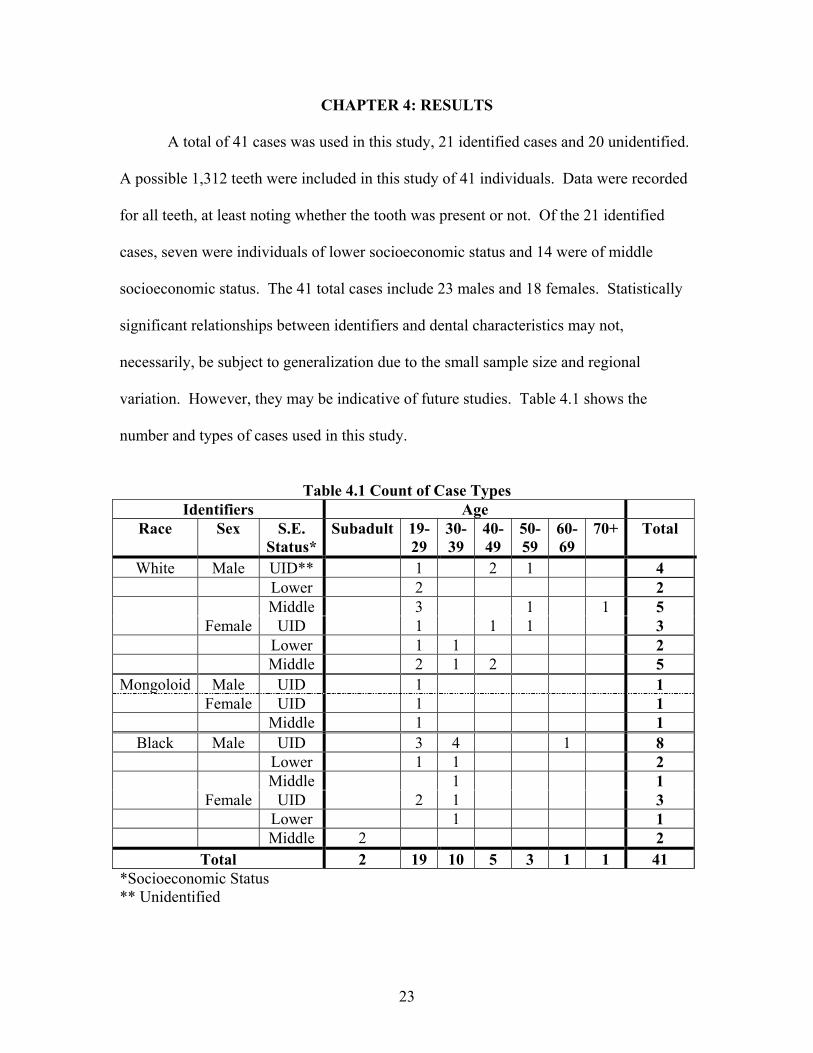
A total of 41 cases was used in this study, 21 identified cases and 20 unidentified.
A possible 1,312 teeth were included in this study of 41 individuals. Data were recorded
for all teeth, at least noting whether the tooth was present or not. Of the 21 identified
cases, seven were individuals of lower socioeconomic status and 14 were of middle
socioeconomic status. The 41 total cases include 23 males and 18 females. Statistically
significant relationships between identifiers and dental characteristics may not,
necessarily, be subject to generalization due to the small sample size and regional
variation. However, they may be indicative of future studies. Table 4.1 shows the
number and types of cases used in this study.
Table 4.1 Count of Case Types
Identifiers Age Race Sex S.E.
Status* Subadult 19-
29 30-39
40-49
50-59
60-69
70+ Total
White Male UID** 1 2 1 4 Lower 2 2 Middle 3 1 1 5 Female UID 1 1 1 3 Lower 1 1 2 Middle 2 1 2 5
Mongoloid Male UID 1 1 Female UID 1 1 Middle 1 1
Black Male UID 3 4 1 8 Lower 1 1 2 Middle 1 1 Female UID 2 1 3 Lower 1 1 Middle 2 2
Total 2 19 10 5 3 1 1 41 *Socioeconomic Status ** Unidentified
23
Tooth Wear
Two of the characteristics examined in this study were tooth wear and staining.
Tooth wear was rated in the degree of severity as described in Chapter 2. Staining was
rated similarly based on coloration and size of stain. A small yellow stain (involving less
than half of a single crown surface) would be given a “2” for slight staining, whereas a
large brown stain (involving nearly a whole surface or more) would be given a “4” for
significant staining.
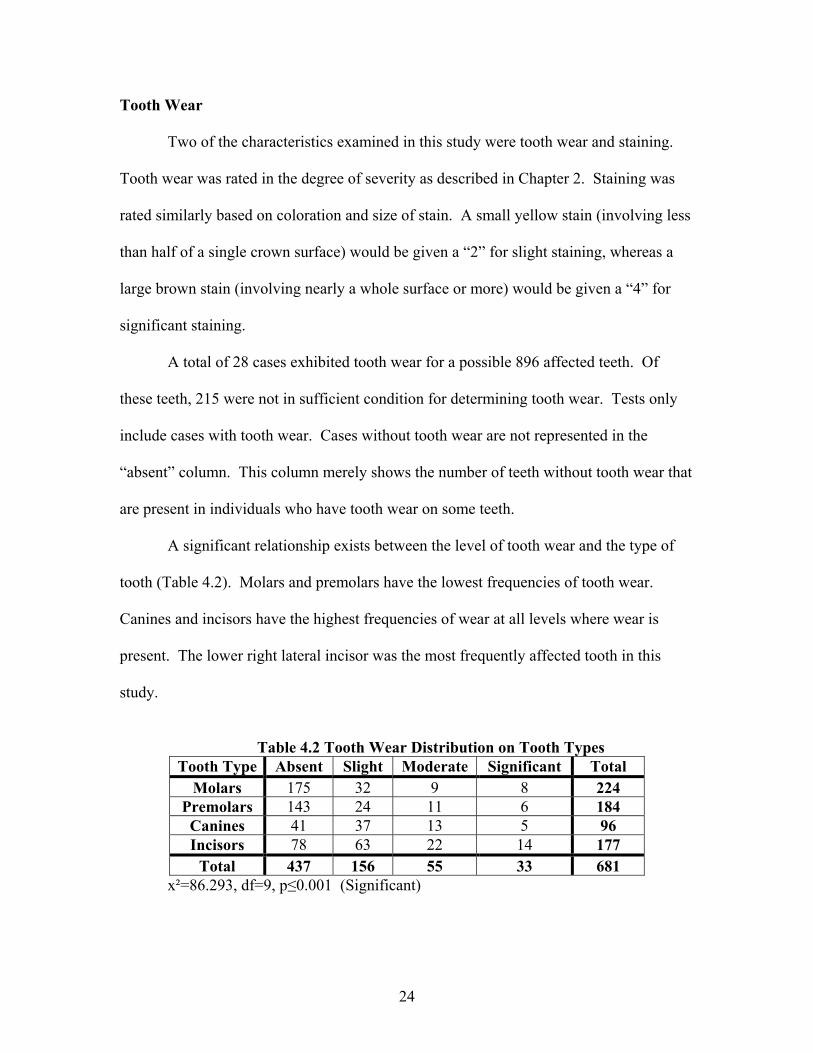
A total of 28 cases exhibited tooth wear for a possible 896 affected teeth. Of
these teeth, 215 were not in sufficient condition for determining tooth wear. Tests only
include cases with tooth wear. Cases without tooth wear are not represented in the
“absent” column. This column merely shows the number of teeth without tooth wear that
are present in individuals who have tooth wear on some teeth.
A significant relationship exists between the level of tooth wear and the type of
tooth (Table 4.2). Molars and premolars have the lowest frequencies of tooth wear.
Canines and incisors have the highest frequencies of wear at all levels where wear is
present. The lower right lateral incisor was the most frequently affected tooth in this
study.
Table 4.2 Tooth Wear Distribution on Tooth Types
Tooth Type Absent Slight Moderate Significant Total Molars 175 32 9 8 224
Premolars 143 24 11 6 184 Canines 41 37 13 5 96 Incisors 78 63 22 14 177
Total 437 156 55 33 681 x²=86.293, df=9, p≤0.001 (Significant)
24
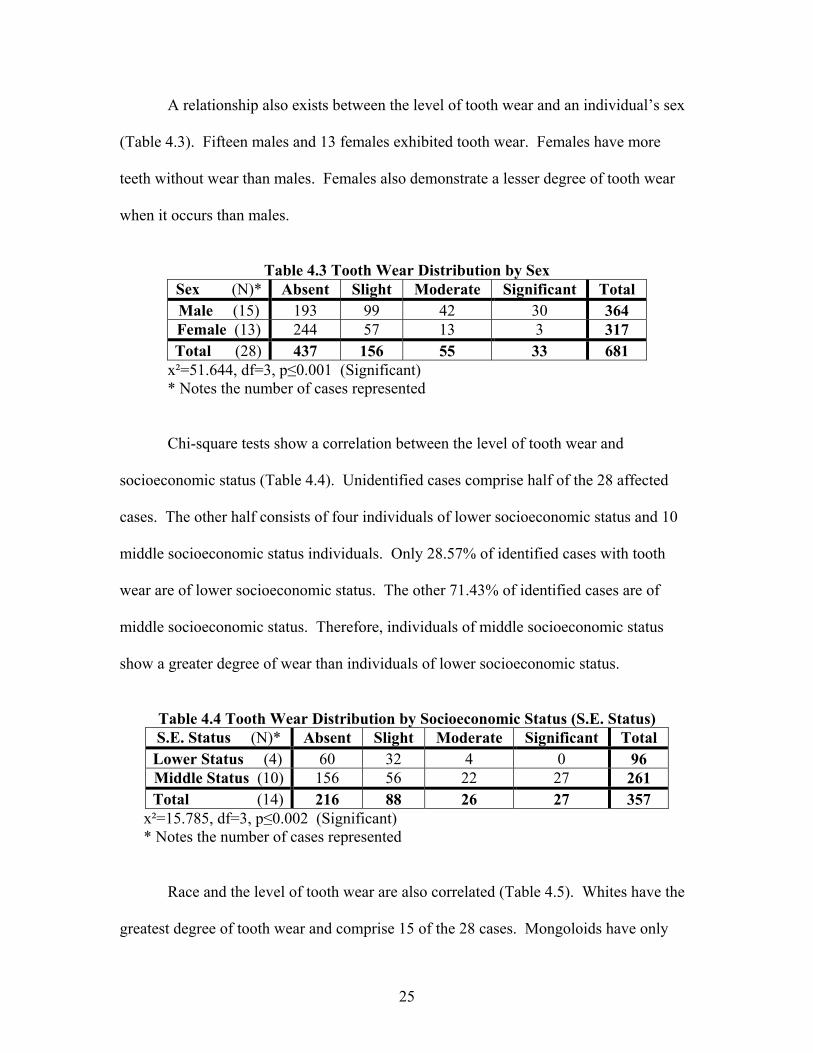
A relationship also exists between the level of tooth wear and an individual’s sex
(Table 4.3). Fifteen males and 13 females exhibited tooth wear. Females have more
teeth without wear than males. Females also demonstrate a lesser degree of tooth wear
when it occurs than males.
Table 4.3 Tooth Wear Distribution by Sex
Sex (N)* Absent Slight Moderate Significant Total Male (15) 193 99 42 30 364 Female (13) 244 57 13 3 317 Total (28) 437 156 55 33 681
x²=51.644, df=3, p≤0.001 (Significant) * Notes the number of cases represented
Chi-square tests show a correlation between the level of tooth wear and
socioeconomic status (Table 4.4). Unidentified cases comprise half of the 28 affected
cases. The other half consists of four individuals of lower socioeconomic status and 10
middle socioeconomic status individuals. Only 28.57% of identified cases with tooth
wear are of lower socioeconomic status. The other 71.43% of identified cases are of
middle socioeconomic status. Therefore, individuals of middle socioeconomic status
show a greater degree of wear than individuals of lower socioeconomic status.
Table 4.4 Tooth Wear Distribution by Socioeconomic Status (S.E. Status) S.E. Status (N)* Absent Slight Moderate Significant Total Lower Status (4) 60 32 4 0 96 Middle Status (10) 156 56 22 27 261 Total (14) 216 88 26 27 357
x²=15.785, df=3, p≤0.002 (Significant) * Notes the number of cases represented
Race and the level of tooth wear are also correlated (Table 4.5). Whites have the
greatest degree of tooth wear and comprise 15 of the 28 cases. Mongoloids have only
25
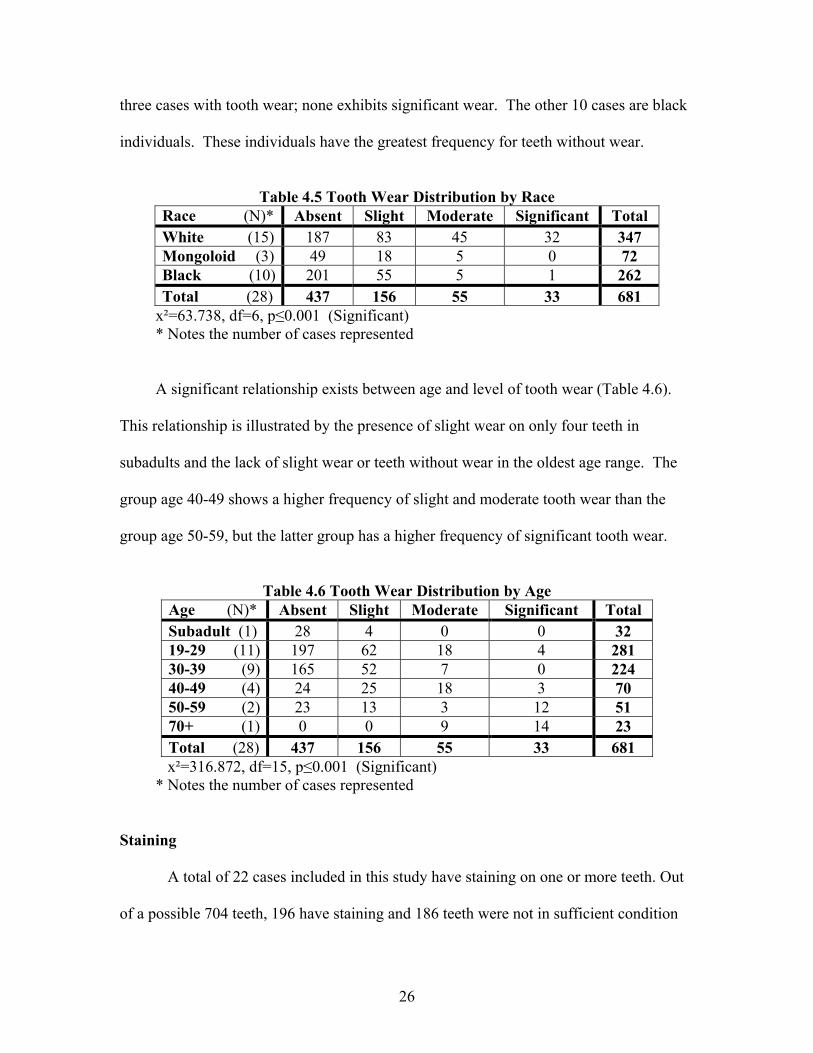
three cases with tooth wear; none exhibits significant wear. The other 10 cases are black
individuals. These individuals have the greatest frequency for teeth without wear.
Table 4.5 Tooth Wear Distribution by Race
Race (N)* Absent Slight Moderate Significant Total White (15) 187 83 45 32 347 Mongoloid (3) 49 18 5 0 72 Black (10) 201 55 5 1 262 Total (28) 437 156 55 33 681
x²=63.738, df=6, p≤0.001 (Significant) * Notes the number of cases represented A significant relationship exists between age and level of tooth wear (Table 4.6).
This relationship is illustrated by the presence of slight wear on only four teeth in
subadults and the lack of slight wear or teeth without wear in the oldest age range. The
group age 40-49 shows a higher frequency of slight and moderate tooth wear than the
group age 50-59, but the latter group has a higher frequency of significant tooth wear.
Table 4.6 Tooth Wear Distribution by Age
Age (N)* Absent Slight Moderate Significant Total Subadult (1) 28 4 0 0 32 19-29 (11) 197 62 18 4 281 30-39 (9) 165 52 7 0 224 40-49 (4) 24 25 18 3 70 50-59 (2) 23 13 3 12 51 70+ (1) 0 0 9 14 23 Total (28) 437 156 55 33 681 x²=316.872, df=15, p≤0.001 (Significant)
* Notes the number of cases represented
Staining
A total of 22 cases included in this study have staining on one or more teeth. Out
of a possible 704 teeth, 196 have staining and 186 teeth were not in sufficient condition
26
for analysis of this trait. As in tooth wear analysis, the “absent” column shows the 322
teeth that were present in these 22 cases, but showed no staining.
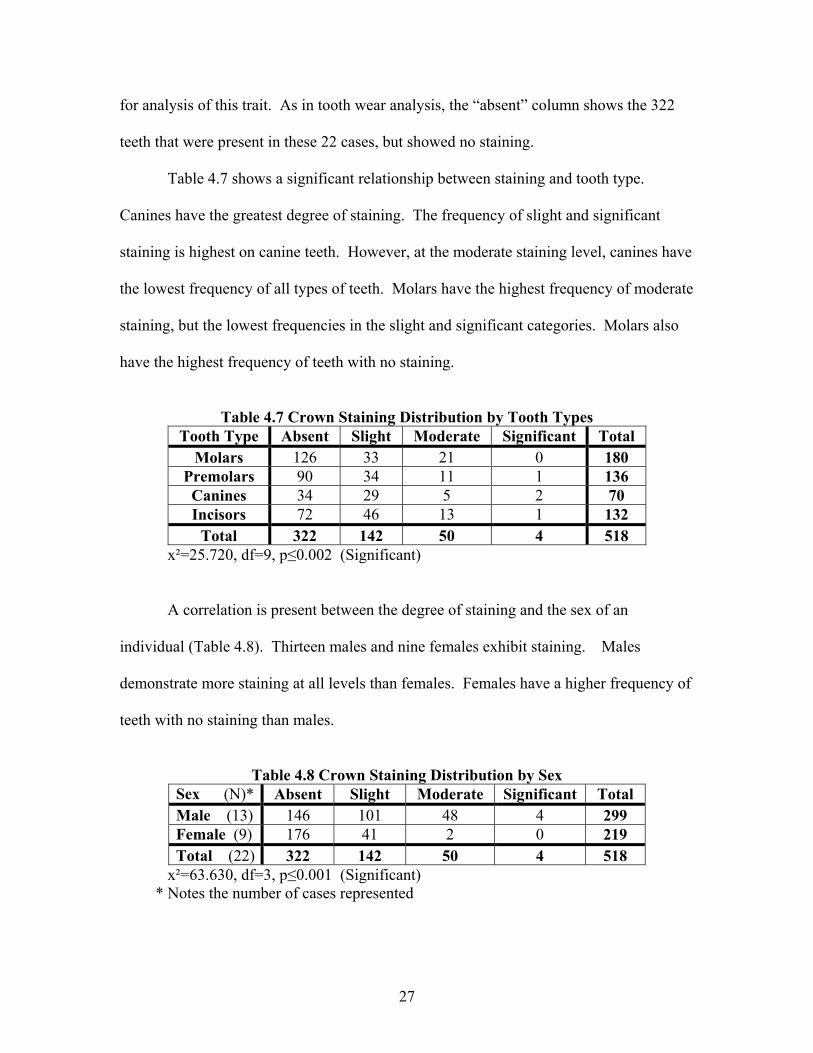
Table 4.7 shows a significant relationship between staining and tooth type.
Canines have the greatest degree of staining. The frequency of slight and significant
staining is highest on canine teeth. However, at the moderate staining level, canines have
the lowest frequency of all types of teeth. Molars have the highest frequency of moderate
staining, but the lowest frequencies in the slight and significant categories. Molars also
have the highest frequency of teeth with no staining.
Table 4.7 Crown Staining Distribution by Tooth Types
Tooth Type Absent Slight Moderate Significant Total Molars 126 33 21 0 180
Premolars 90 34 11 1 136 Canines 34 29 5 2 70 Incisors 72 46 13 1 132
Total 322 142 50 4 518 x²=25.720, df=9, p≤0.002 (Significant)
A correlation is present between the degree of staining and the sex of an
individual (Table 4.8). Thirteen males and nine females exhibit staining. Males
demonstrate more staining at all levels than females. Females have a higher frequency of
teeth with no staining than males.
Table 4.8 Crown Staining Distribution by Sex
Sex (N)* Absent Slight Moderate Significant Total Male (13) 146 101 48 4 299 Female (9) 176 41 2 0 219 Total (22) 322 142 50 4 518
x²=63.630, df=3, p≤0.001 (Significant) * Notes the number of cases represented
27
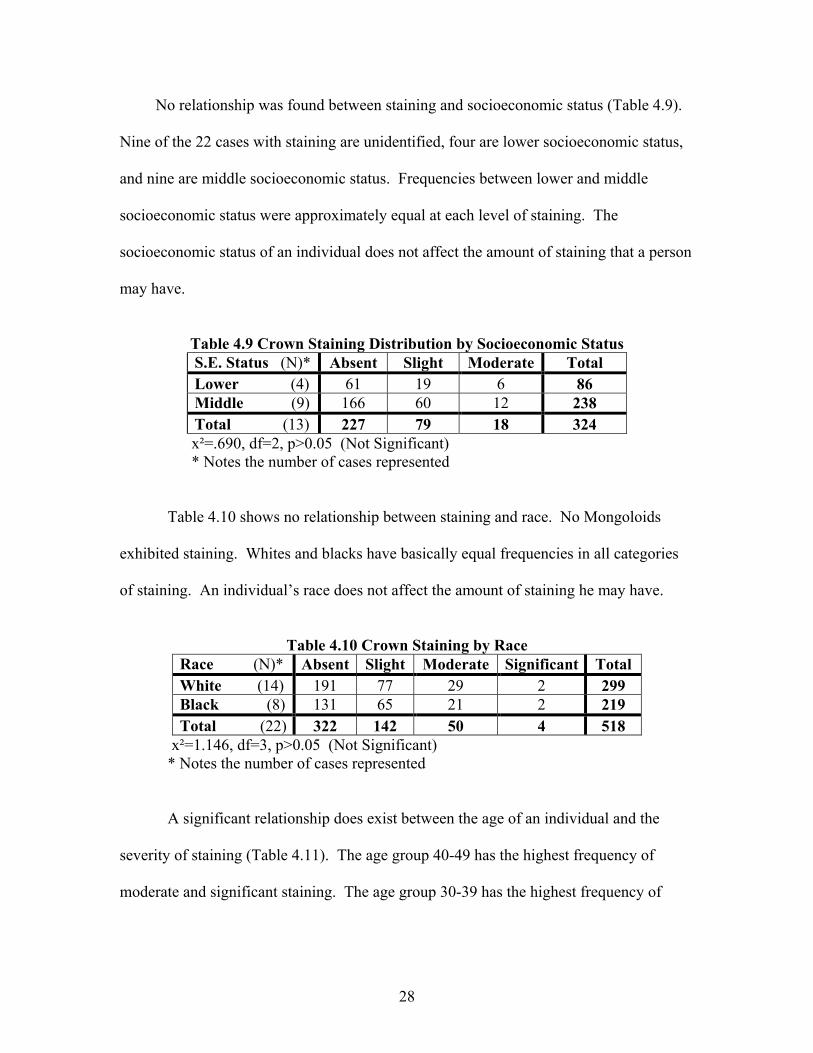
No relationship was found between staining and socioeconomic status (Table 4.9).
Nine of the 22 cases with staining are unidentified, four are lower socioeconomic status,
and nine are middle socioeconomic status. Frequencies between lower and middle
socioeconomic status were approximately equal at each level of staining. The
socioeconomic status of an individual does not affect the amount of staining that a person
may have.
Table 4.9 Crown Staining Distribution by Socioeconomic Status S.E. Status (N)* Absent Slight Moderate Total Lower (4) 61 19 6 86 Middle (9) 166 60 12 238 Total (13) 227 79 18 324 x²=.690, df=2, p>0.05 (Not Significant) * Notes the number of cases represented
Table 4.10 shows no relationship between staining and race. No Mongoloids
exhibited staining. Whites and blacks have basically equal frequencies in all categories
of staining. An individual’s race does not affect the amount of staining he may have.
Table 4.10 Crown Staining by Race
Race (N)* Absent Slight Moderate Significant Total White (14) 191 77 29 2 299 Black (8) 131 65 21 2 219 Total (22) 322 142 50 4 518
x²=1.146, df=3, p>0.05 (Not Significant) * Notes the number of cases represented
A significant relationship does exist between the age of an individual and the
severity of staining (Table 4.11). The age group 40-49 has the highest frequency of
moderate and significant staining. The age group 30-39 has the highest frequency of
28
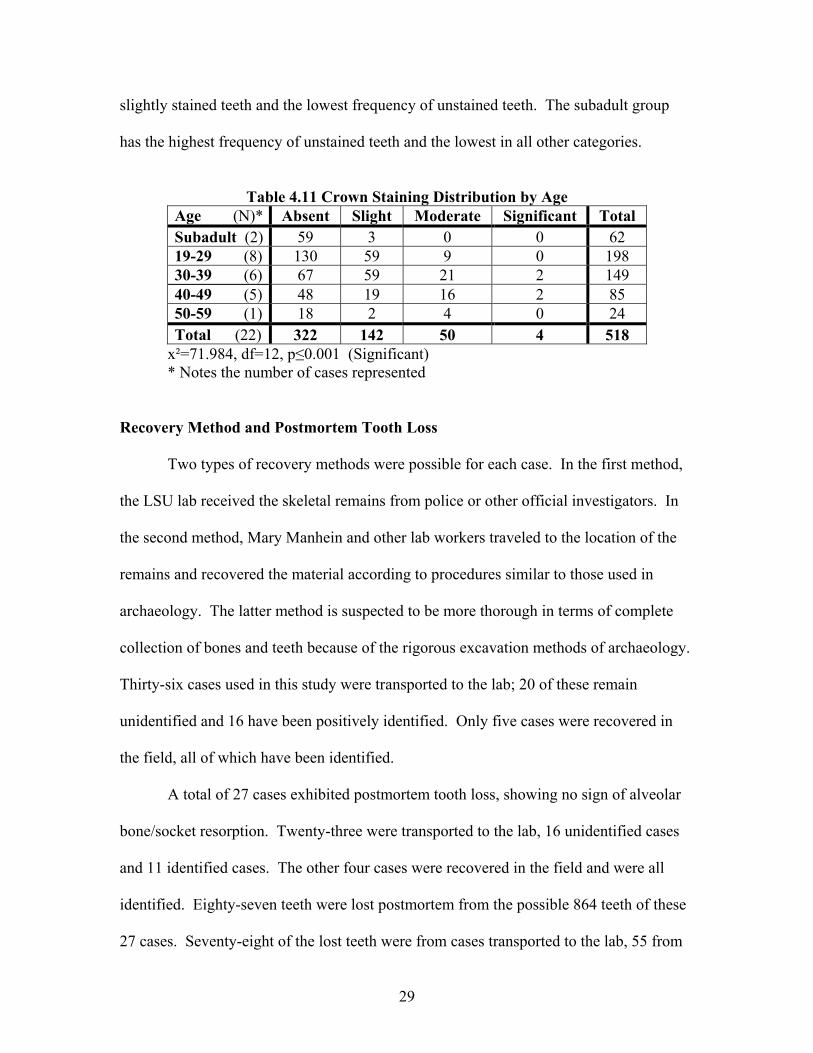
slightly stained teeth and the lowest frequency of unstained teeth. The subadult group
has the highest frequency of unstained teeth and the lowest in all other categories.
Table 4.11 Crown Staining Distribution by Age
Age (N)* Absent Slight Moderate Significant Total Subadult (2) 59 3 0 0 62 19-29 (8) 130 59 9 0 198 30-39 (6) 67 59 21 2 149 40-49 (5) 48 19 16 2 85 50-59 (1) 18 2 4 0 24 Total (22) 322 142 50 4 518
x²=71.984, df=12, p≤0.001 (Significant) * Notes the number of cases represented
Recovery Method and Postmortem Tooth Loss
Two types of recovery methods were possible for each case. In the first method,
the LSU lab received the skeletal remains from police or other official investigators. In
the second method, Mary Manhein and other lab workers traveled to the location of the
remains and recovered the material according to procedures similar to those used in
archaeology. The latter method is suspected to be more thorough in terms of complete
collection of bones and teeth because of the rigorous excavation methods of archaeology.
Thirty-six cases used in this study were transported to the lab; 20 of these remain
unidentified and 16 have been positively identified. Only five cases were recovered in
the field, all of which have been identified.
A total of 27 cases exhibited postmortem tooth loss, showing no sign of alveolar
bone/socket resorption. Twenty-three were transported to the lab, 16 unidentified cases
and 11 identified cases. The other four cases were recovered in the field and were all
identified. Eighty-seven teeth were lost postmortem from the possible 864 teeth of these
27 cases. Seventy-eight of the lost teeth were from cases transported to the lab, 55 from
29
unidentified cases and 23 from identified cases. The other nine lost teeth were from
identified cases recovered in the field. The tooth most frequently lost after death is the
lower right central incisor. In this study, 11.49% of the 87 teeth lost postmortem were
the lower right central incisor. Central incisors were 34.48% of teeth lost postmortem.
Incisors were the most frequently lost type of tooth at 52.87%. In the following tables,
the “not lost postmortem” column includes teeth that were lost antemortem. This column
only contains the remaining teeth of cases that exhibit postmortem loss.
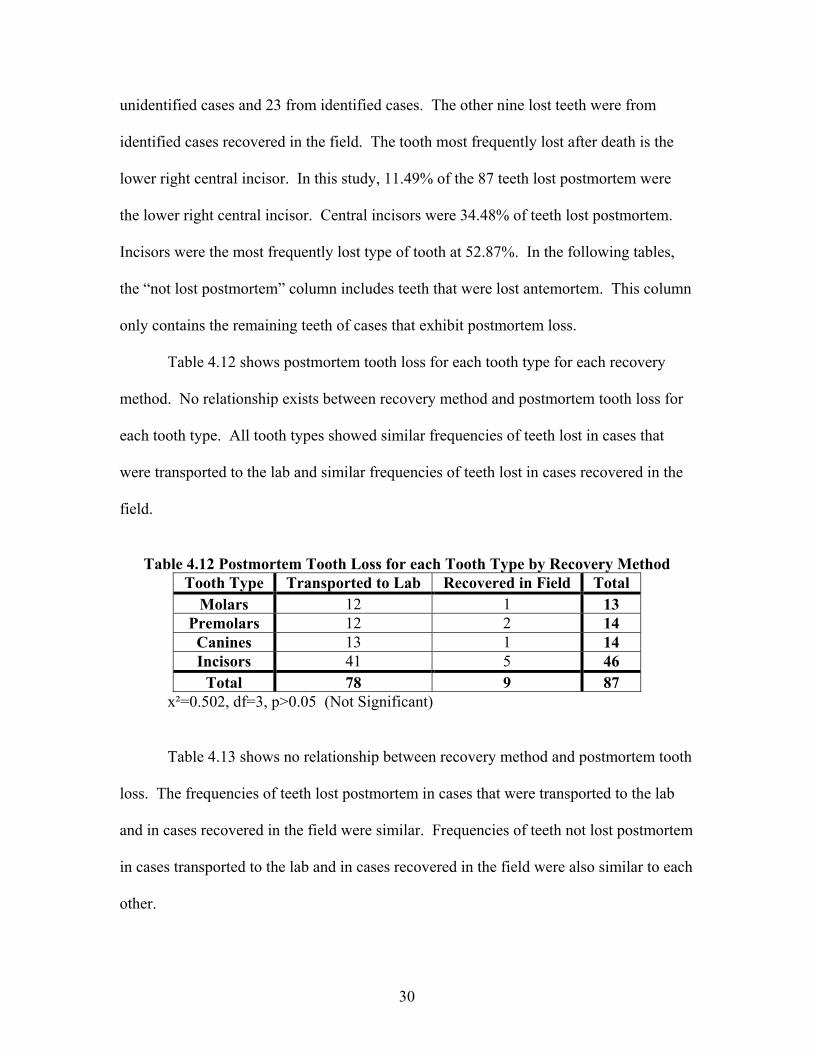
Table 4.12 shows postmortem tooth loss for each tooth type for each recovery
method. No relationship exists between recovery method and postmortem tooth loss for
each tooth type. All tooth types showed similar frequencies of teeth lost in cases that
were transported to the lab and similar frequencies of teeth lost in cases recovered in the
field.
Table 4.12 Postmortem Tooth Loss for each Tooth Type by Recovery Method
Tooth Type Transported to Lab Recovered in Field Total Molars 12 1 13
Premolars 12 2 14 Canines 13 1 14 Incisors 41 5 46
Total 78 9 87 x²=0.502, df=3, p>0.05 (Not Significant)
Table 4.13 shows no relationship between recovery method and postmortem tooth
loss. The frequencies of teeth lost postmortem in cases that were transported to the lab
and in cases recovered in the field were similar. Frequencies of teeth not lost postmortem
in cases transported to the lab and in cases recovered in the field were also similar to each
other.
30
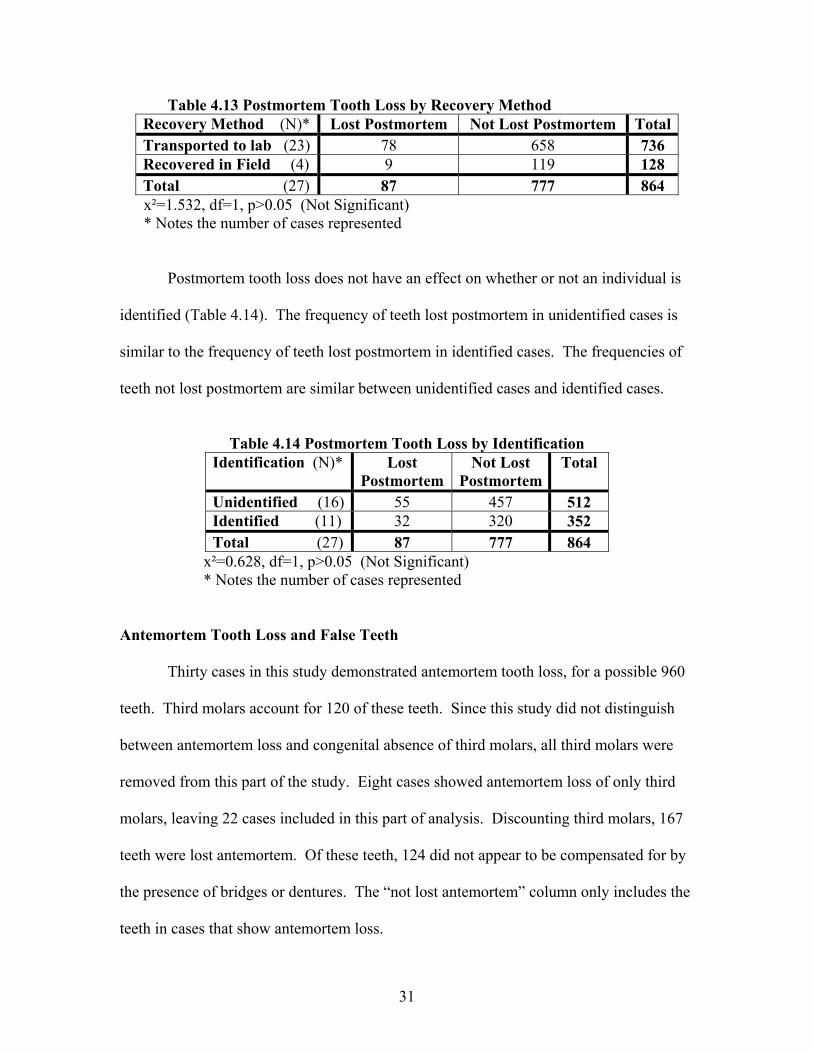
Table 4.13 Postmortem Tooth Loss by Recovery Method Recovery Method (N)* Lost Postmortem Not Lost Postmortem TotalTransported to lab (23) 78 658 736 Recovered in Field (4) 9 119 128 Total (27) 87 777 864 x²=1.532, df=1, p>0.05 (Not Significant) * Notes the number of cases represented
Postmortem tooth loss does not have an effect on whether or not an individual is
identified (Table 4.14). The frequency of teeth lost postmortem in unidentified cases is
similar to the frequency of teeth lost postmortem in identified cases. The frequencies of
teeth not lost postmortem are similar between unidentified cases and identified cases.
Table 4.14 Postmortem Tooth Loss by Identification
Identification (N)* Lost Postmortem
Not Lost Postmortem
Total
Unidentified (16) 55 457 512 Identified (11) 32 320 352 Total (27) 87 777 864
x²=0.628, df=1, p>0.05 (Not Significant) * Notes the number of cases represented
Antemortem Tooth Loss and False Teeth
Thirty cases in this study demonstrated antemortem tooth loss, for a possible 960
teeth. Third molars account for 120 of these teeth. Since this study did not distinguish
between antemortem loss and congenital absence of third molars, all third molars were
removed from this part of the study. Eight cases showed antemortem loss of only third
molars, leaving 22 cases included in this part of analysis. Discounting third molars, 167
teeth were lost antemortem. Of these teeth, 124 did not appear to be compensated for by
the presence of bridges or dentures. The “not lost antemortem” column only includes the
teeth in cases that show antemortem loss.
31
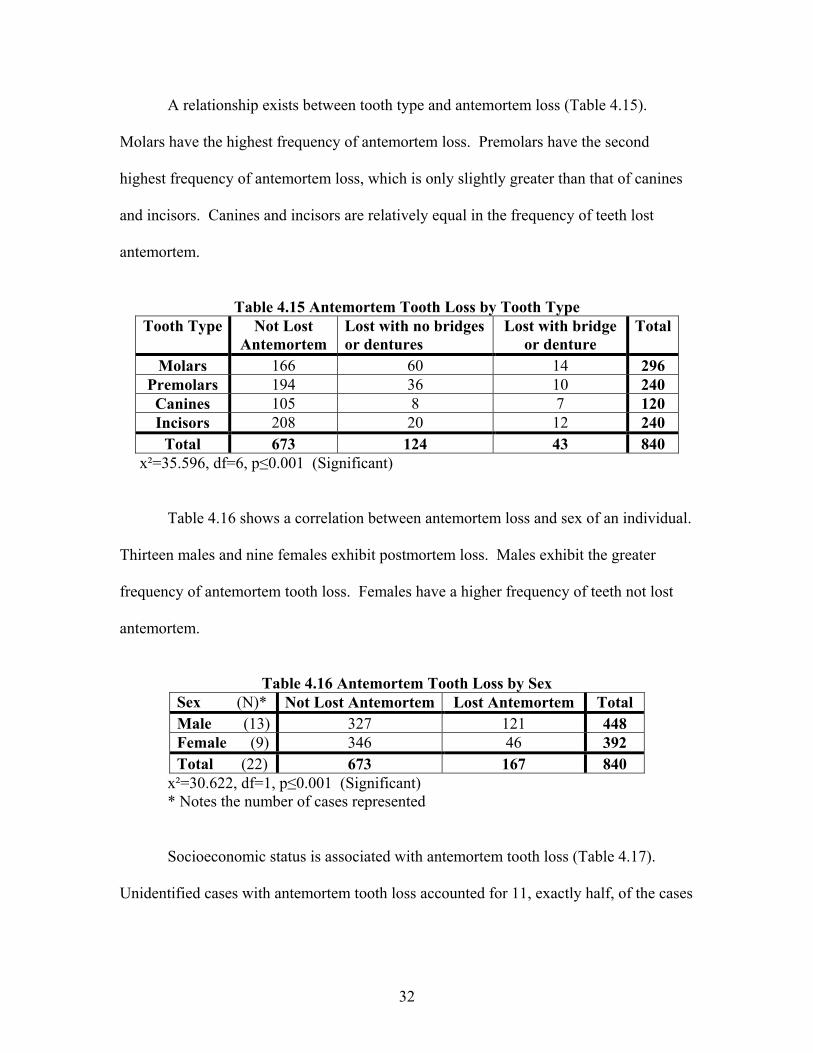
A relationship exists between tooth type and antemortem loss (Table 4.15).
Molars have the highest frequency of antemortem loss. Premolars have the second
highest frequency of antemortem loss, which is only slightly greater than that of canines
and incisors. Canines and incisors are relatively equal in the frequency of teeth lost
antemortem.
Table 4.15 Antemortem Tooth Loss by Tooth Type
Tooth Type Not Lost Antemortem
Lost with no bridges or dentures
Lost with bridge or denture
Total
Molars 166 60 14 296 Premolars 194 36 10 240 Canines 105 8 7 120 Incisors 208 20 12 240
Total 673 124 43 840 x²=35.596, df=6, p≤0.001 (Significant)
Table 4.16 shows a correlation between antemortem loss and sex of an individual.
Thirteen males and nine females exhibit postmortem loss. Males exhibit the greater
frequency of antemortem tooth loss. Females have a higher frequency of teeth not lost
antemortem.
Table 4.16 Antemortem Tooth Loss by Sex
Sex (N)* Not Lost Antemortem Lost Antemortem Total Male (13) 327 121 448 Female (9) 346 46 392 Total (22) 673 167 840
x²=30.622, df=1, p≤0.001 (Significant) * Notes the number of cases represented
Socioeconomic status is associated with antemortem tooth loss (Table 4.17).
Unidentified cases with antemortem tooth loss accounted for 11, exactly half, of the cases
32
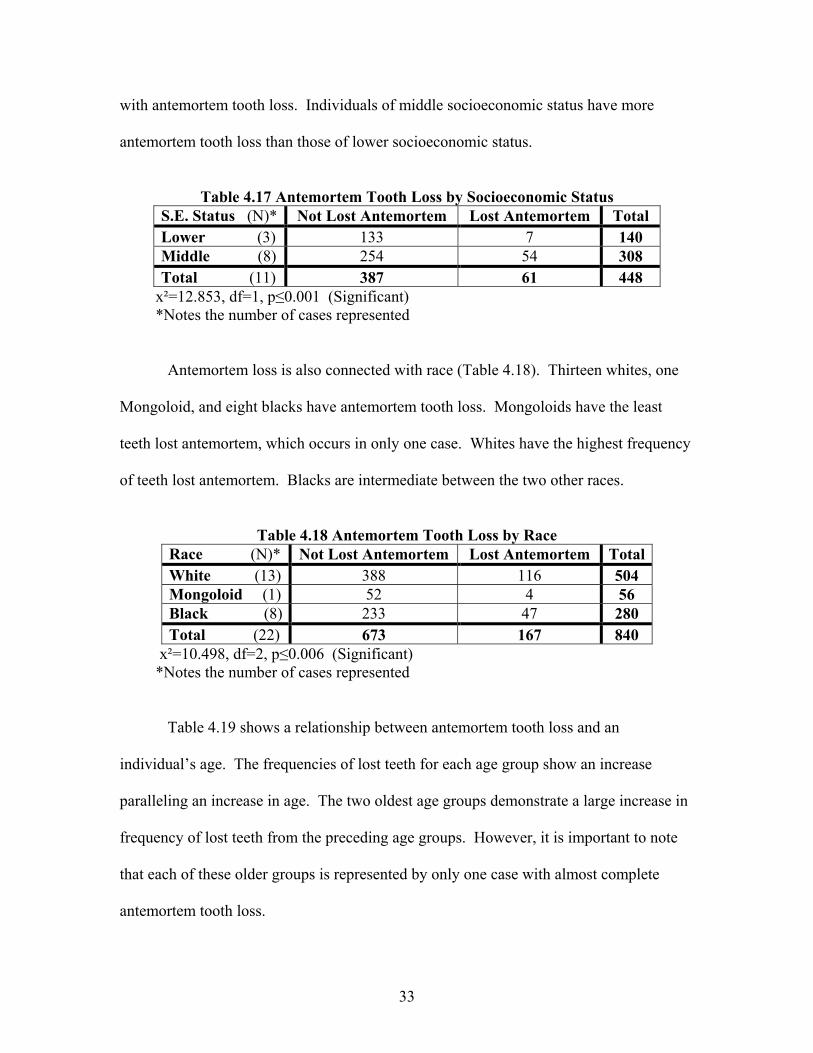
with antemortem tooth loss. Individuals of middle socioeconomic status have more
antemortem tooth loss than those of lower socioeconomic status.
Table 4.17 Antemortem Tooth Loss by Socioeconomic Status
S.E. Status (N)* Not Lost Antemortem Lost Antemortem Total Lower (3) 133 7 140 Middle (8) 254 54 308 Total (11) 387 61 448
x²=12.853, df=1, p≤0.001 (Significant) *Notes the number of cases represented
Antemortem loss is also connected with race (Table 4.18). Thirteen whites, one
Mongoloid, and eight blacks have antemortem tooth loss. Mongoloids have the least
teeth lost antemortem, which occurs in only one case. Whites have the highest frequency
of teeth lost antemortem. Blacks are intermediate between the two other races.
Table 4.18 Antemortem Tooth Loss by Race
Race (N)* Not Lost Antemortem Lost Antemortem Total White (13) 388 116 504 Mongoloid (1) 52 4 56 Black (8) 233 47 280 Total (22) 673 167 840
x²=10.498, df=2, p≤0.006 (Significant) *Notes the number of cases represented
Table 4.19 shows a relationship between antemortem tooth loss and an
individual’s age. The frequencies of lost teeth for each age group show an increase
paralleling an increase in age. The two oldest age groups demonstrate a large increase in
frequency of lost teeth from the preceding age groups. However, it is important to note
that each of these older groups is represented by only one case with almost complete
antemortem tooth loss.
33
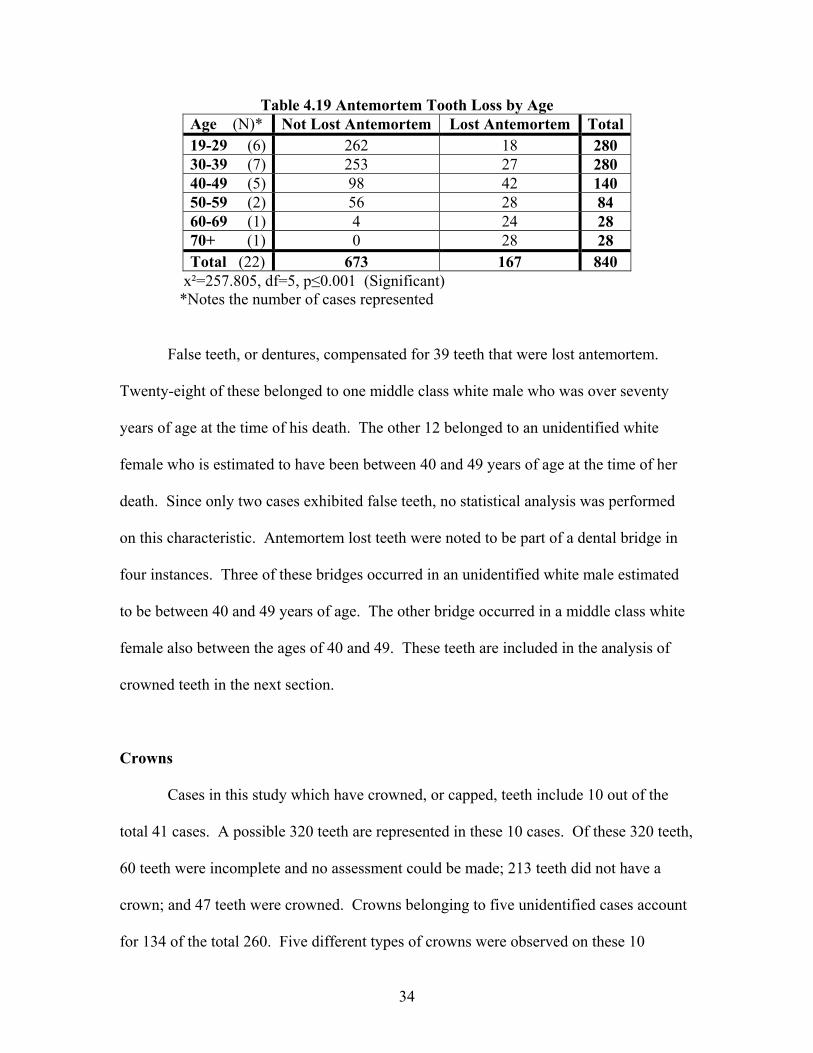
Table 4.19 Antemortem Tooth Loss by Age Age (N)* Not Lost Antemortem Lost Antemortem Total 19-29 (6) 262 18 280 30-39 (7) 253 27 280 40-49 (5) 98 42 140 50-59 (2) 56 28 84 60-69 (1) 4 24 28 70+ (1) 0 28 28 Total (22) 673 167 840
x²=257.805, df=5, p≤0.001 (Significant) *Notes the number of cases represented
False teeth, or dentures, compensated for 39 teeth that were lost antemortem.
Twenty-eight of these belonged to one middle class white male who was over seventy
years of age at the time of his death. The other 12 belonged to an unidentified white
female who is estimated to have been between 40 and 49 years of age at the time of her
death. Since only two cases exhibited false teeth, no statistical analysis was performed
on this characteristic. Antemortem lost teeth were noted to be part of a dental bridge in
four instances. Three of these bridges occurred in an unidentified white male estimated
to be between 40 and 49 years of age. The other bridge occurred in a middle class white
female also between the ages of 40 and 49. These teeth are included in the analysis of
crowned teeth in the next section.
Crowns
Cases in this study which have crowned, or capped, teeth include 10 out of the
total 41 cases. A possible 320 teeth are represented in these 10 cases. Of these 320 teeth,
60 teeth were incomplete and no assessment could be made; 213 teeth did not have a
crown; and 47 teeth were crowned. Crowns belonging to five unidentified cases account
for 134 of the total 260. Five different types of crowns were observed on these 10
34
individuals: porcelain, gold, gold with engraving, porcelain and silver, and porcelain and
gold. The second of these types, gold, does not refer to an actual gold crown, but to a
metal crown covered with a gold plating or polish. This type is the least expensive of all
the ones observed because they are not custom made for a patient but are simply bent into
shape around the tooth. As a result, these crowns are often not tight enough or properly
sealed around the tooth and become loose, requiring further treatment. Crowns of
porcelain are more expensive because they are custom made, fit snugly on a tooth and
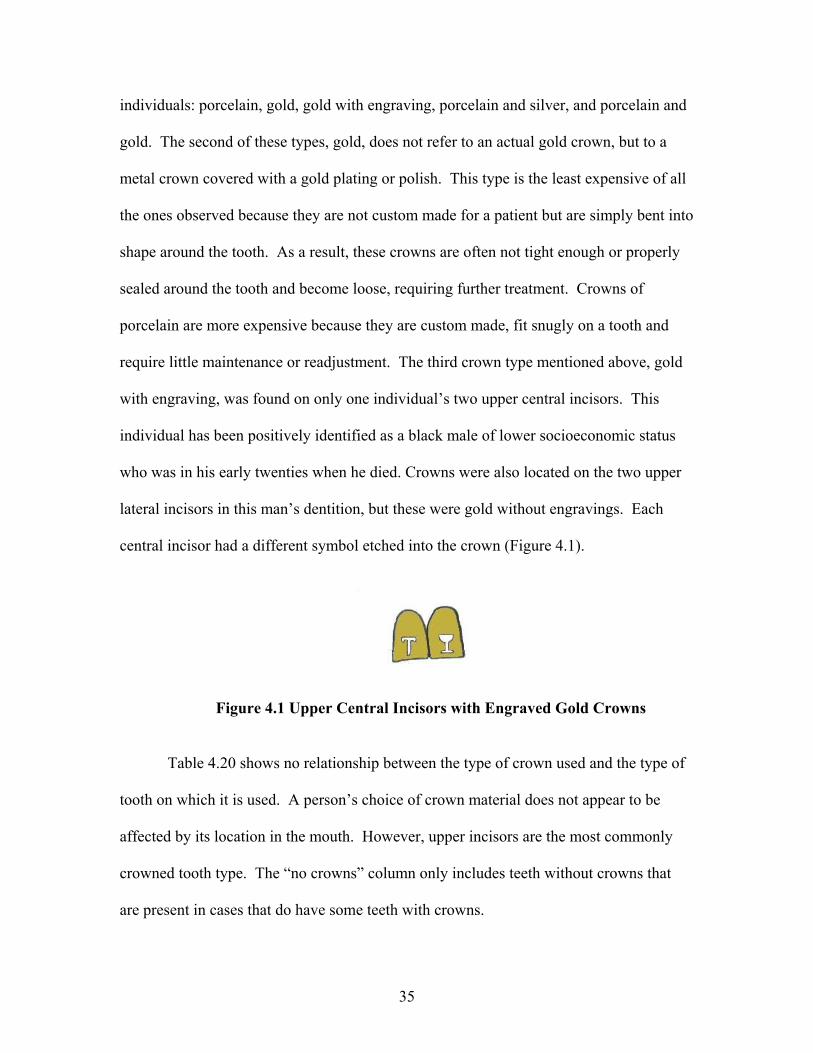
require little maintenance or readjustment. The third crown type mentioned above, gold
with engraving, was found on only one individual’s two upper central incisors. This
individual has been positively identified as a black male of lower socioeconomic status
who was in his early twenties when he died. Crowns were also located on the two upper
lateral incisors in this man’s dentition, but these were gold without engravings. Each
central incisor had a different symbol etched into the crown (Figure 4.1).
Figure 4.1 Upper Central Incisors with Engraved Gold Crowns
Table 4.20 shows no relationship between the type of crown used and the type of
tooth on which it is used. A person’s choice of crown material does not appear to be
affected by its location in the mouth. However, upper incisors are the most commonly
crowned tooth type. The “no crowns” column only includes teeth without crowns that
are present in cases that do have some teeth with crowns.
35
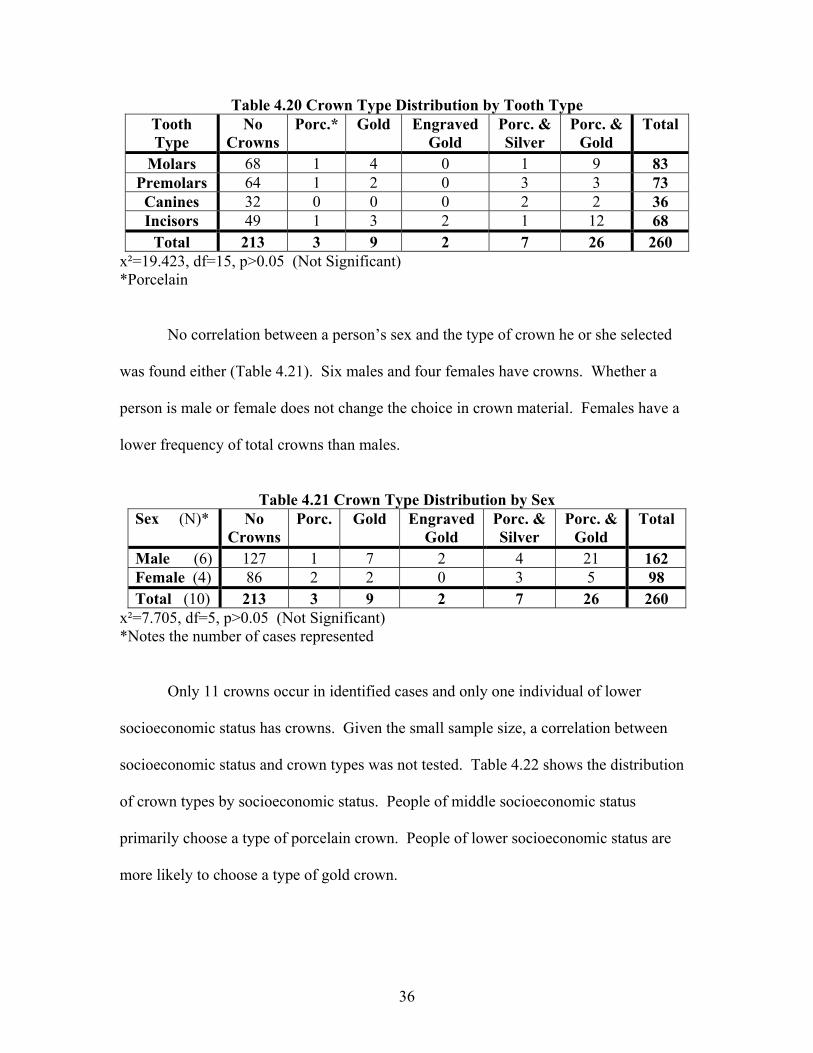
Table 4.20 Crown Type Distribution by Tooth Type Tooth Type
No Crowns
Porc.* Gold Engraved Gold
Porc. & Silver
Porc. & Gold
Total
Molars 68 1 4 0 1 9 83 Premolars 64 1 2 0 3 3 73 Canines 32 0 0 0 2 2 36 Incisors 49 1 3 2 1 12 68
Total 213 3 9 2 7 26 260 x²=19.423, df=15, p>0.05 (Not Significant) *Porcelain
No correlation between a person’s sex and the type of crown he or she selected
was found either (Table 4.21). Six males and four females have crowns. Whether a
person is male or female does not change the choice in crown material. Females have a
lower frequency of total crowns than males.
Table 4.21 Crown Type Distribution by Sex
Sex (N)* No Crowns
Porc. Gold Engraved Gold
Porc. & Silver
Porc. & Gold
Total
Male (6) 127 1 7 2 4 21 162 Female (4) 86 2 2 0 3 5 98 Total (10) 213 3 9 2 7 26 260
x²=7.705, df=5, p>0.05 (Not Significant) *Notes the number of cases represented
Only 11 crowns occur in identified cases and only one individual of lower
socioeconomic status has crowns. Given the small sample size, a correlation between
socioeconomic status and crown types was not tested. Table 4.22 shows the distribution
of crown types by socioeconomic status. People of middle socioeconomic status
primarily choose a type of porcelain crown. People of lower socioeconomic status are
more likely to choose a type of gold crown.
36
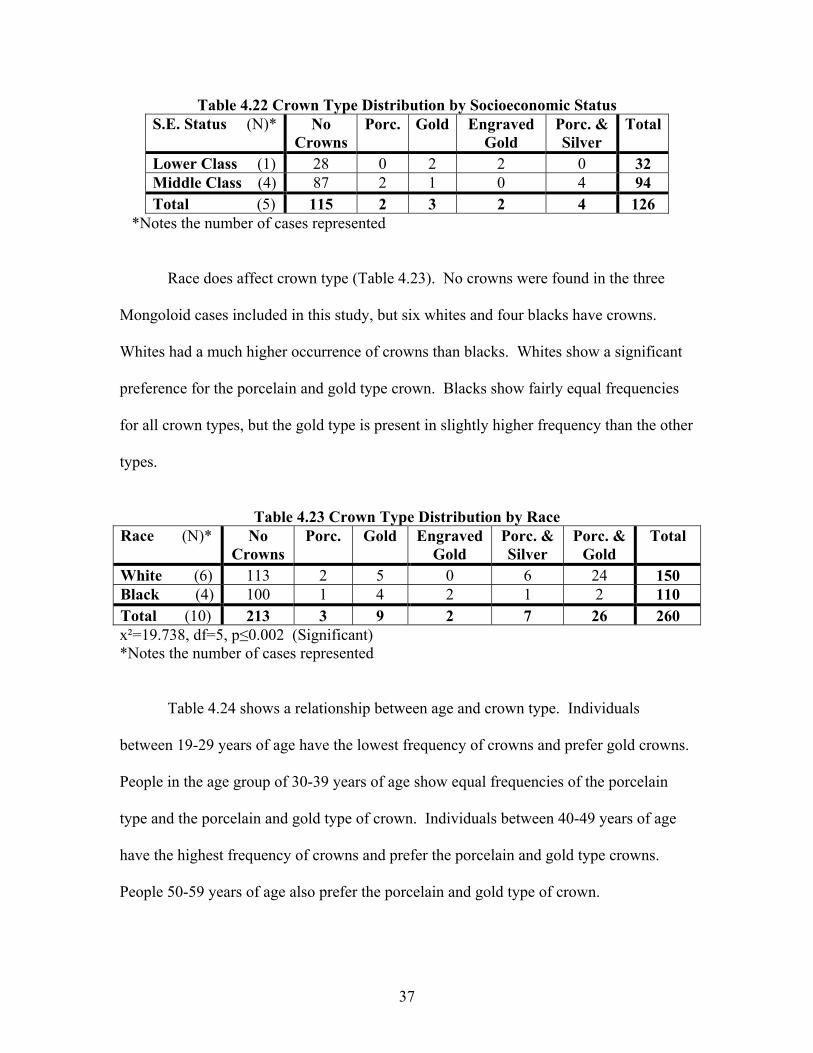
Table 4.22 Crown Type Distribution by Socioeconomic Status S.E. Status (N)* No
Crowns Porc. Gold Engraved
Gold Porc. & Silver
Total
Lower Class (1) 28 0 2 2 0 32 Middle Class (4) 87 2 1 0 4 94 Total (5) 115 2 3 2 4 126
*Notes the number of cases represented
Race does affect crown type (Table 4.23). No crowns were found in the three
Mongoloid cases included in this study, but six whites and four blacks have crowns.
Whites had a much higher occurrence of crowns than blacks. Whites show a significant
preference for the porcelain and gold type crown. Blacks show fairly equal frequencies
for all crown types, but the gold type is present in slightly higher frequency than the other
types.
Table 4.23 Crown Type Distribution by Race
Race (N)* No Crowns
Porc. Gold Engraved Gold
Porc. & Silver
Porc. & Gold
Total
White (6) 113 2 5 0 6 24 150 Black (4) 100 1 4 2 1 2 110 Total (10) 213 3 9 2 7 26 260 x²=19.738, df=5, p≤0.002 (Significant) *Notes the number of cases represented
Table 4.24 shows a relationship between age and crown type. Individuals
between 19-29 years of age have the lowest frequency of crowns and prefer gold crowns.
People in the age group of 30-39 years of age show equal frequencies of the porcelain
type and the porcelain and gold type of crown. Individuals between 40-49 years of age
have the highest frequency of crowns and prefer the porcelain and gold type crowns.
People 50-59 years of age also prefer the porcelain and gold type of crown.
37
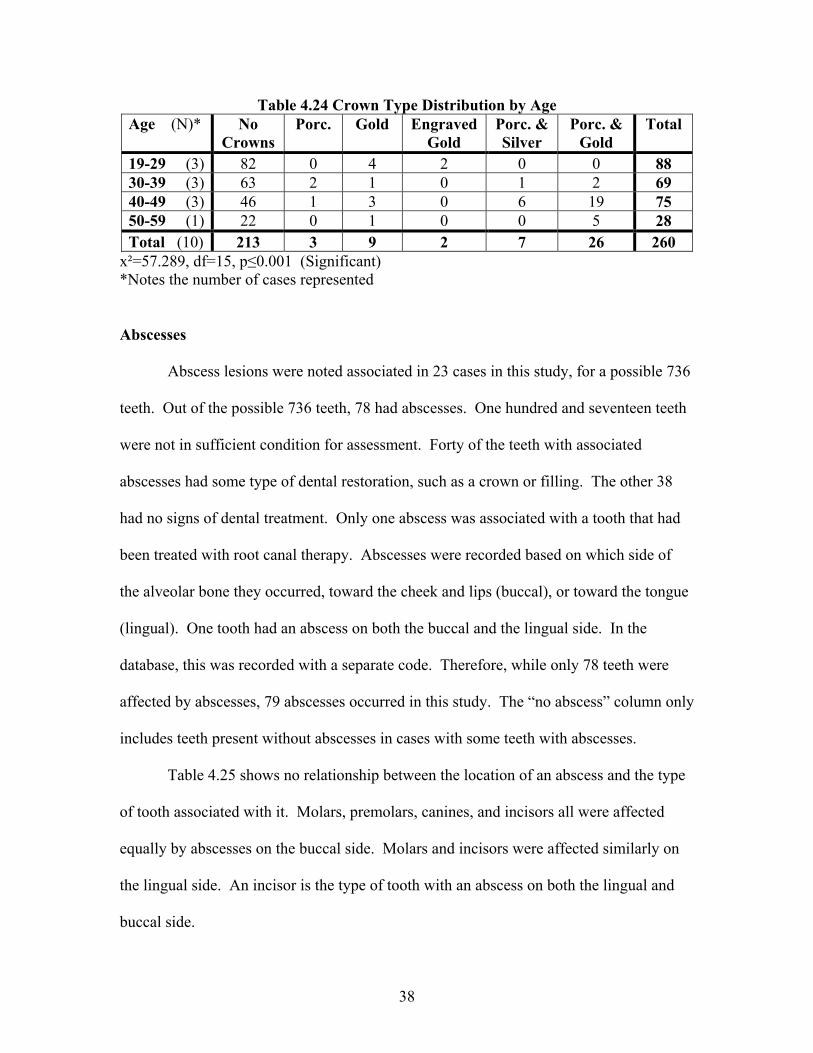
Table 4.24 Crown Type Distribution by Age Age (N)* No
Crowns Porc. Gold Engraved
Gold Porc. & Silver
Porc. & Gold
Total
19-29 (3) 82 0 4 2 0 0 88 30-39 (3) 63 2 1 0 1 2 69 40-49 (3) 46 1 3 0 6 19 75 50-59 (1) 22 0 1 0 0 5 28 Total (10) 213 3 9 2 7 26 260
x²=57.289, df=15, p≤0.001 (Significant) *Notes the number of cases represented Abscesses
Abscess lesions were noted associated in 23 cases in this study, for a possible 736
teeth. Out of the possible 736 teeth, 78 had abscesses. One hundred and seventeen teeth
were not in sufficient condition for assessment. Forty of the teeth with associated
abscesses had some type of dental restoration, such as a crown or filling. The other 38
had no signs of dental treatment. Only one abscess was associated with a tooth that had
been treated with root canal therapy. Abscesses were recorded based on which side of
the alveolar bone they occurred, toward the cheek and lips (buccal), or toward the tongue
(lingual). One tooth had an abscess on both the buccal and the lingual side. In the
database, this was recorded with a separate code. Therefore, while only 78 teeth were
affected by abscesses, 79 abscesses occurred in this study. The “no abscess” column only
includes teeth present without abscesses in cases with some teeth with abscesses.
Table 4.25 shows no relationship between the location of an abscess and the type
of tooth associated with it. Molars, premolars, canines, and incisors all were affected
equally by abscesses on the buccal side. Molars and incisors were affected similarly on
the lingual side. An incisor is the type of tooth with an abscess on both the lingual and
buccal side.
38
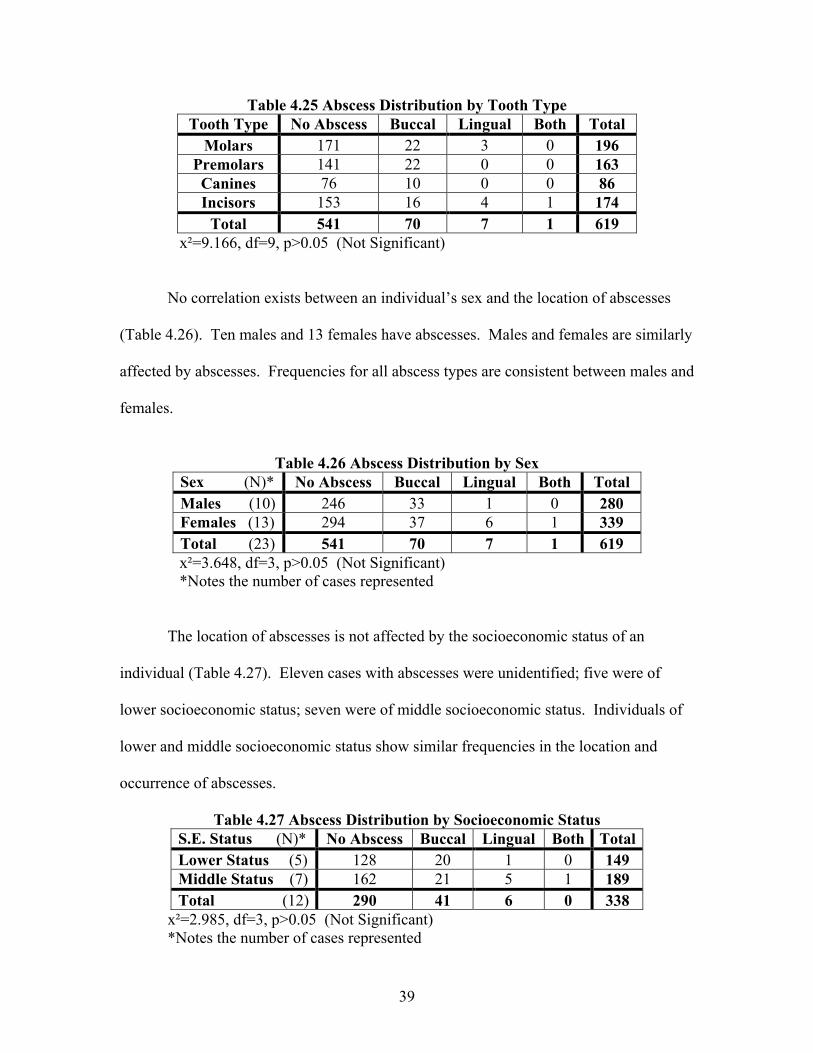
Table 4.25 Abscess Distribution by Tooth Type Tooth Type No Abscess Buccal Lingual Both Total
Molars 171 22 3 0 196 Premolars 141 22 0 0 163 Canines 76 10 0 0 86 Incisors 153 16 4 1 174
Total 541 70 7 1 619 x²=9.166, df=9, p>0.05 (Not Significant)
No correlation exists between an individual’s sex and the location of abscesses
(Table 4.26). Ten males and 13 females have abscesses. Males and females are similarly
affected by abscesses. Frequencies for all abscess types are consistent between males and
females.
Table 4.26 Abscess Distribution by Sex
Sex (N)* No Abscess Buccal Lingual Both Total Males (10) 246 33 1 0 280 Females (13) 294 37 6 1 339 Total (23) 541 70 7 1 619 x²=3.648, df=3, p>0.05 (Not Significant) *Notes the number of cases represented
The location of abscesses is not affected by the socioeconomic status of an
individual (Table 4.27). Eleven cases with abscesses were unidentified; five were of
lower socioeconomic status; seven were of middle socioeconomic status. Individuals of
lower and middle socioeconomic status show similar frequencies in the location and
occurrence of abscesses.
Table 4.27 Abscess Distribution by Socioeconomic Status S.E. Status (N)* No Abscess Buccal Lingual Both Total Lower Status (5) 128 20 1 0 149 Middle Status (7) 162 21 5 1 189 Total (12) 290 41 6 0 338
x²=2.985, df=3, p>0.05 (Not Significant) *Notes the number of cases represented
39
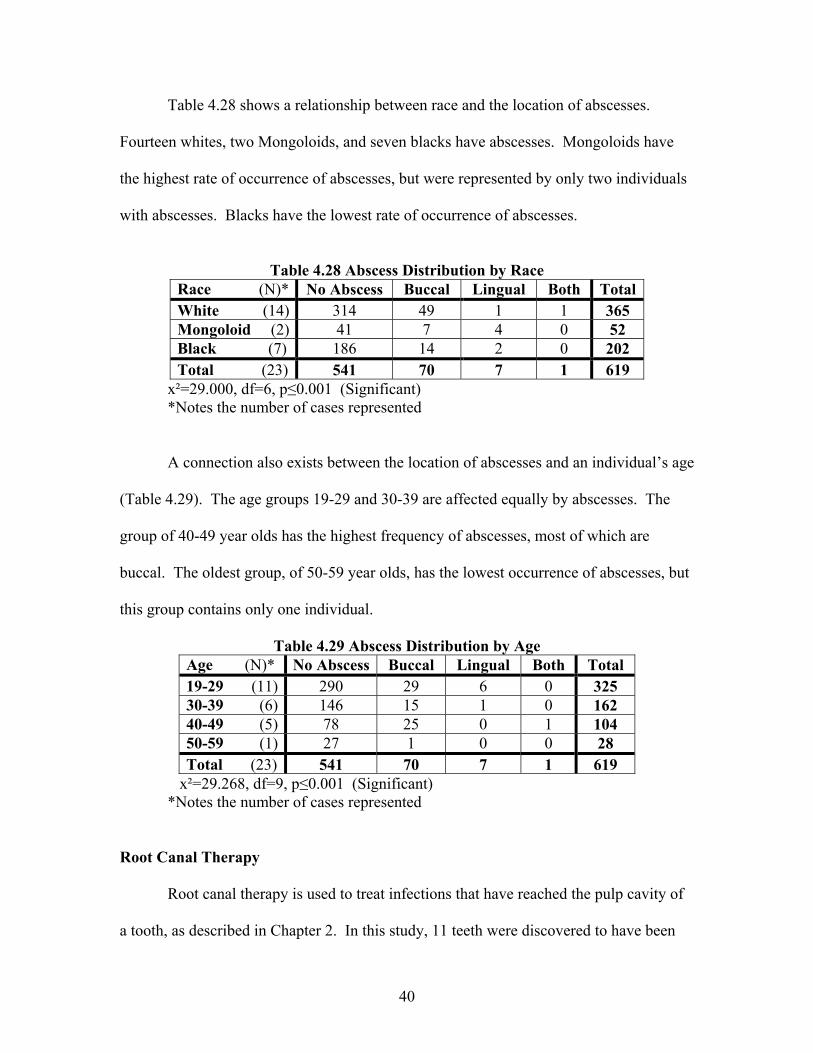
Table 4.28 shows a relationship between race and the location of abscesses.
Fourteen whites, two Mongoloids, and seven blacks have abscesses. Mongoloids have
the highest rate of occurrence of abscesses, but were represented by only two individuals
with abscesses. Blacks have the lowest rate of occurrence of abscesses.
Table 4.28 Abscess Distribution by Race
Race (N)* No Abscess Buccal Lingual Both Total White (14) 314 49 1 1 365 Mongoloid (2) 41 7 4 0 52 Black (7) 186 14 2 0 202 Total (23) 541 70 7 1 619
x²=29.000, df=6, p≤0.001 (Significant) *Notes the number of cases represented
A connection also exists between the location of abscesses and an individual’s age
(Table 4.29). The age groups 19-29 and 30-39 are affected equally by abscesses. The
group of 40-49 year olds has the highest frequency of abscesses, most of which are
buccal. The oldest group, of 50-59 year olds, has the lowest occurrence of abscesses, but
this group contains only one individual.
Table 4.29 Abscess Distribution by Age Age (N)* No Abscess Buccal Lingual Both Total 19-29 (11) 290 29 6 0 325 30-39 (6) 146 15 1 0 162 40-49 (5) 78 25 0 1 104 50-59 (1) 27 1 0 0 28 Total (23) 541 70 7 1 619
x²=29.268, df=9, p≤0.001 (Significant) *Notes the number of cases represented
Root Canal Therapy
Root canal therapy is used to treat infections that have reached the pulp cavity of
a tooth, as described in Chapter 2. In this study, 11 teeth were discovered to have been
40
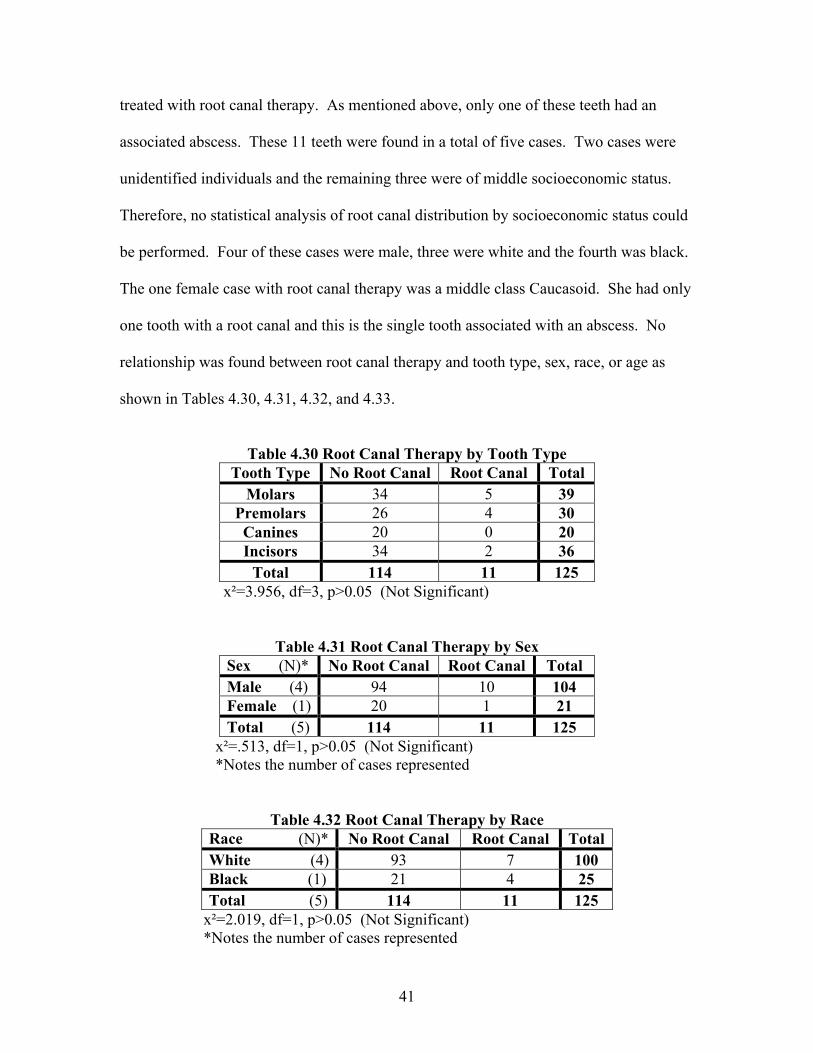
treated with root canal therapy. As mentioned above, only one of these teeth had an
associated abscess. These 11 teeth were found in a total of five cases. Two cases were
unidentified individuals and the remaining three were of middle socioeconomic status.
Therefore, no statistical analysis of root canal distribution by socioeconomic status could
be performed. Four of these cases were male, three were white and the fourth was black.
The one female case with root canal therapy was a middle class Caucasoid. She had only
one tooth with a root canal and this is the single tooth associated with an abscess. No
relationship was found between root canal therapy and tooth type, sex, race, or age as
shown in Tables 4.30, 4.31, 4.32, and 4.33.
Table 4.30 Root Canal Therapy by Tooth Type
Tooth Type No Root Canal Root Canal Total Molars 34 5 39
Premolars 26 4 30 Canines 20 0 20 Incisors 34 2 36
Total 114 11 125 x²=3.956, df=3, p>0.05 (Not Significant)
Table 4.31 Root Canal Therapy by Sex
Sex (N)* No Root Canal Root Canal Total Male (4) 94 10 104 Female (1) 20 1 21 Total (5) 114 11 125
x²=.513, df=1, p>0.05 (Not Significant) *Notes the number of cases represented
Table 4.32 Root Canal Therapy by Race Race (N)* No Root Canal Root Canal Total White (4) 93 7 100 Black (1) 21 4 25 Total (5) 114 11 125
x²=2.019, df=1, p>0.05 (Not Significant) *Notes the number of cases represented
41
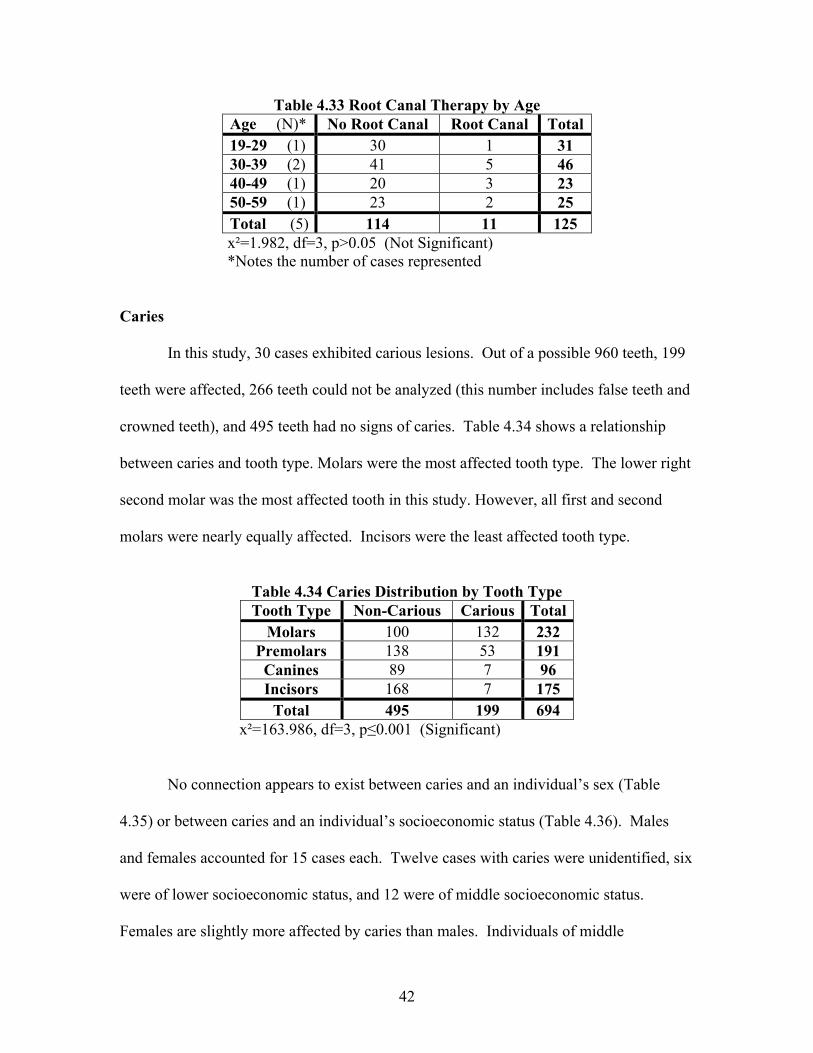
Table 4.33 Root Canal Therapy by Age Age (N)* No Root Canal Root Canal Total 19-29 (1) 30 1 31 30-39 (2) 41 5 46 40-49 (1) 20 3 23 50-59 (1) 23 2 25 Total (5) 114 11 125 x²=1.982, df=3, p>0.05 (Not Significant) *Notes the number of cases represented
Caries
In this study, 30 cases exhibited carious lesions. Out of a possible 960 teeth, 199
teeth were affected, 266 teeth could not be analyzed (this number includes false teeth and
crowned teeth), and 495 teeth had no signs of caries. Table 4.34 shows a relationship
between caries and tooth type. Molars were the most affected tooth type. The lower right
second molar was the most affected tooth in this study. However, all first and second
molars were nearly equally affected. Incisors were the least affected tooth type.
Table 4.34 Caries Distribution by Tooth Type Tooth Type Non-Carious Carious Total
Molars 100 132 232 Premolars 138 53 191 Canines 89 7 96 Incisors 168 7 175
Total 495 199 694 x²=163.986, df=3, p≤0.001 (Significant)
No connection appears to exist between caries and an individual’s sex (Table
4.35) or between caries and an individual’s socioeconomic status (Table 4.36). Males
and females accounted for 15 cases each. Twelve cases with caries were unidentified, six
were of lower socioeconomic status, and 12 were of middle socioeconomic status.
Females are slightly more affected by caries than males. Individuals of middle
42
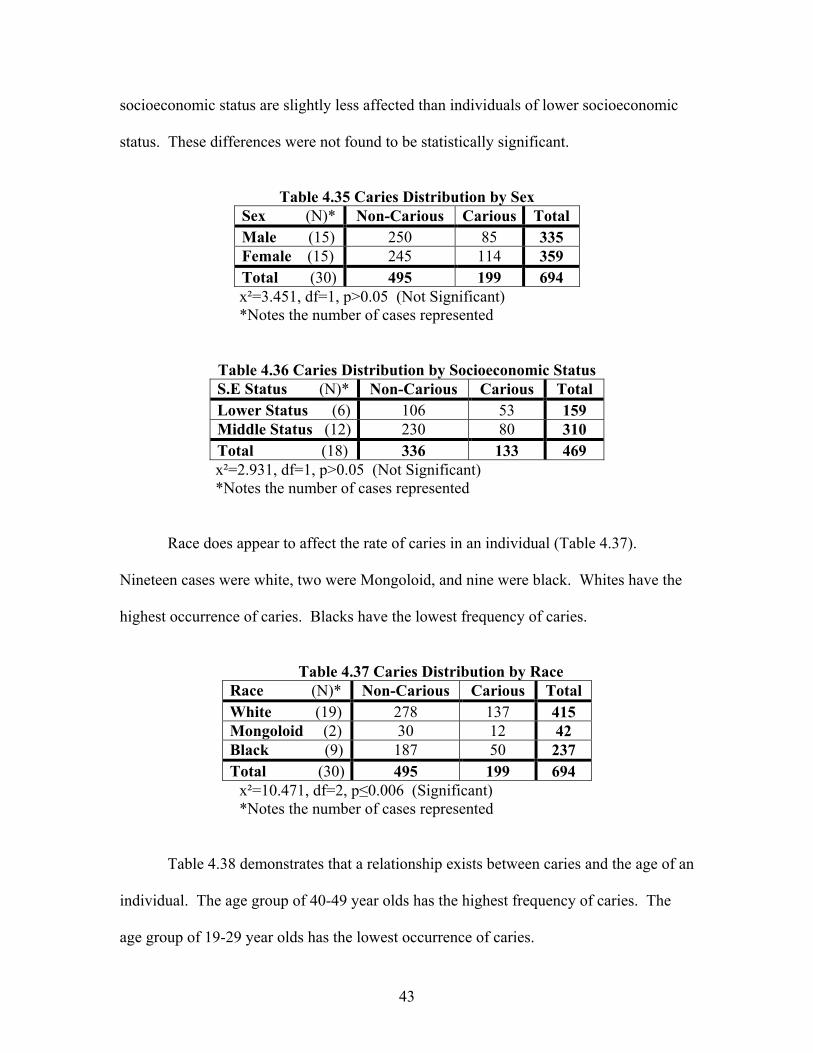
socioeconomic status are slightly less affected than individuals of lower socioeconomic
status. These differences were not found to be statistically significant.
Table 4.35 Caries Distribution by Sex
Sex (N)* Non-Carious Carious Total Male (15) 250 85 335 Female (15) 245 114 359 Total (30) 495 199 694 x²=3.451, df=1, p>0.05 (Not Significant) *Notes the number of cases represented
Table 4.36 Caries Distribution by Socioeconomic Status S.E Status (N)* Non-Carious Carious Total Lower Status (6) 106 53 159 Middle Status (12) 230 80 310 Total (18) 336 133 469 x²=2.931, df=1, p>0.05 (Not Significant) *Notes the number of cases represented
Race does appear to affect the rate of caries in an individual (Table 4.37).
Nineteen cases were white, two were Mongoloid, and nine were black. Whites have the
highest occurrence of caries. Blacks have the lowest frequency of caries.
Table 4.37 Caries Distribution by Race
Race (N)* Non-Carious Carious Total White (19) 278 137 415 Mongoloid (2) 30 12 42 Black (9) 187 50 237 Total (30) 495 199 694
x²=10.471, df=2, p≤0.006 (Significant) *Notes the number of cases represented
Table 4.38 demonstrates that a relationship exists between caries and the age of an
individual. The age group of 40-49 year olds has the highest frequency of caries. The
age group of 19-29 year olds has the lowest occurrence of caries.
43
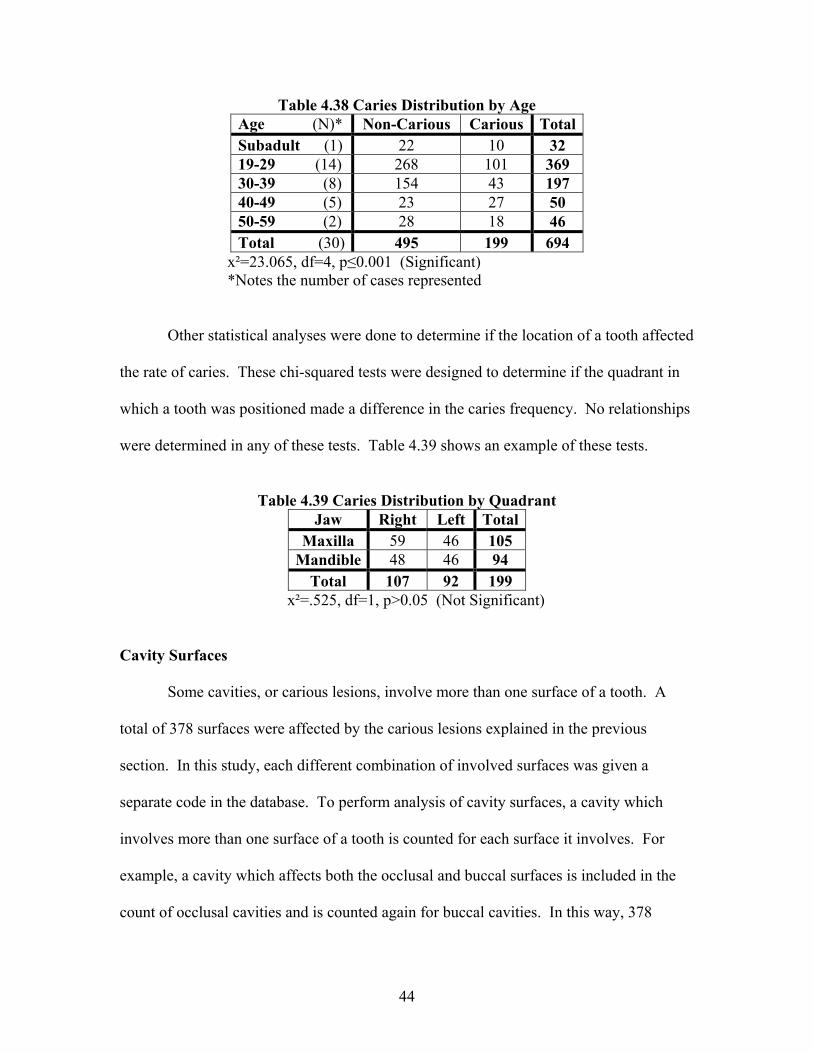
Table 4.38 Caries Distribution by Age Age (N)* Non-Carious Carious Total Subadult (1) 22 10 32 19-29 (14) 268 101 369 30-39 (8) 154 43 197 40-49 (5) 23 27 50 50-59 (2) 28 18 46 Total (30) 495 199 694
x²=23.065, df=4, p≤0.001 (Significant) *Notes the number of cases represented
Other statistical analyses were done to determine if the location of a tooth affected
the rate of caries. These chi-squared tests were designed to determine if the quadrant in
which a tooth was positioned made a difference in the caries frequency. No relationships
were determined in any of these tests. Table 4.39 shows an example of these tests.
Table 4.39 Caries Distribution by Quadrant
Jaw Right Left TotalMaxilla 59 46 105
Mandible 48 46 94 Total 107 92 199
x²=.525, df=1, p>0.05 (Not Significant) Cavity Surfaces
Some cavities, or carious lesions, involve more than one surface of a tooth. A
total of 378 surfaces were affected by the carious lesions explained in the previous
section. In this study, each different combination of involved surfaces was given a
separate code in the database. To perform analysis of cavity surfaces, a cavity which
involves more than one surface of a tooth is counted for each surface it involves. For
example, a cavity which affects both the occlusal and buccal surfaces is included in the
count of occlusal cavities and is counted again for buccal cavities. In this way, 378
44
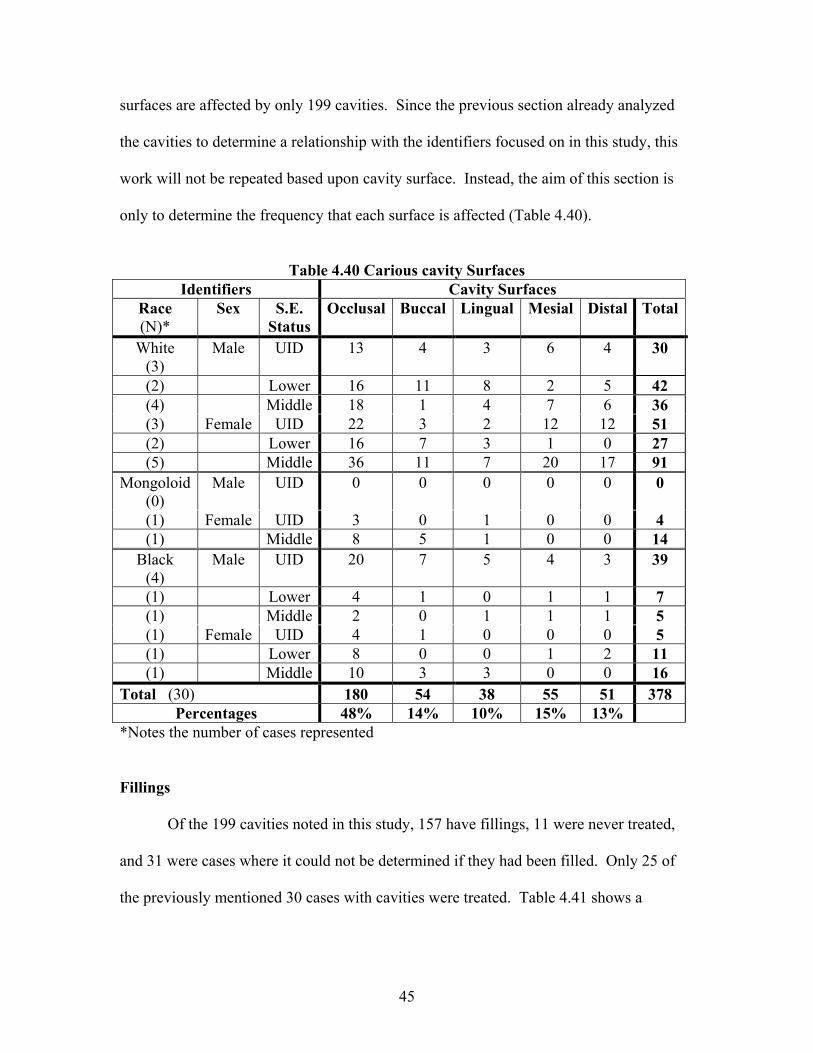
surfaces are affected by only 199 cavities. Since the previous section already analyzed
the cavities to determine a relationship with the identifiers focused on in this study, this
work will not be repeated based upon cavity surface. Instead, the aim of this section is
only to determine the frequency that each surface is affected (Table 4.40).
Table 4.40 Carious cavity Surfaces
Identifiers Cavity Surfaces Race (N)*
Sex S.E. Status
Occlusal Buccal Lingual Mesial Distal Total
White (3)
Male UID 13 4 3 6 4 30
(2) Lower 16 11 8 2 5 42 (4) Middle 18 1 4 7 6 36 (3) Female UID 22 3 2 12 12 51 (2) Lower 16 7 3 1 0 27 (5) Middle 36 11 7 20 17 91
Mongoloid (0)
Male UID 0 0 0 0 0 0
(1) Female UID 3 0 1 0 0 4 (1) Middle 8 5 1 0 0 14
Black (4)
Male UID 20 7 5 4 3 39
(1) Lower 4 1 0 1 1 7 (1) Middle 2 0 1 1 1 5 (1) Female UID 4 1 0 0 0 5 (1) Lower 8 0 0 1 2 11 (1) Middle 10 3 3 0 0 16
Total (30) 180 54 38 55 51 378 Percentages 48% 14% 10% 15% 13%
*Notes the number of cases represented
Fillings
Of the 199 cavities noted in this study, 157 have fillings, 11 were never treated,
and 31 were cases where it could not be determined if they had been filled. Only 25 of
the previously mentioned 30 cases with cavities were treated. Table 4.41 shows a
45
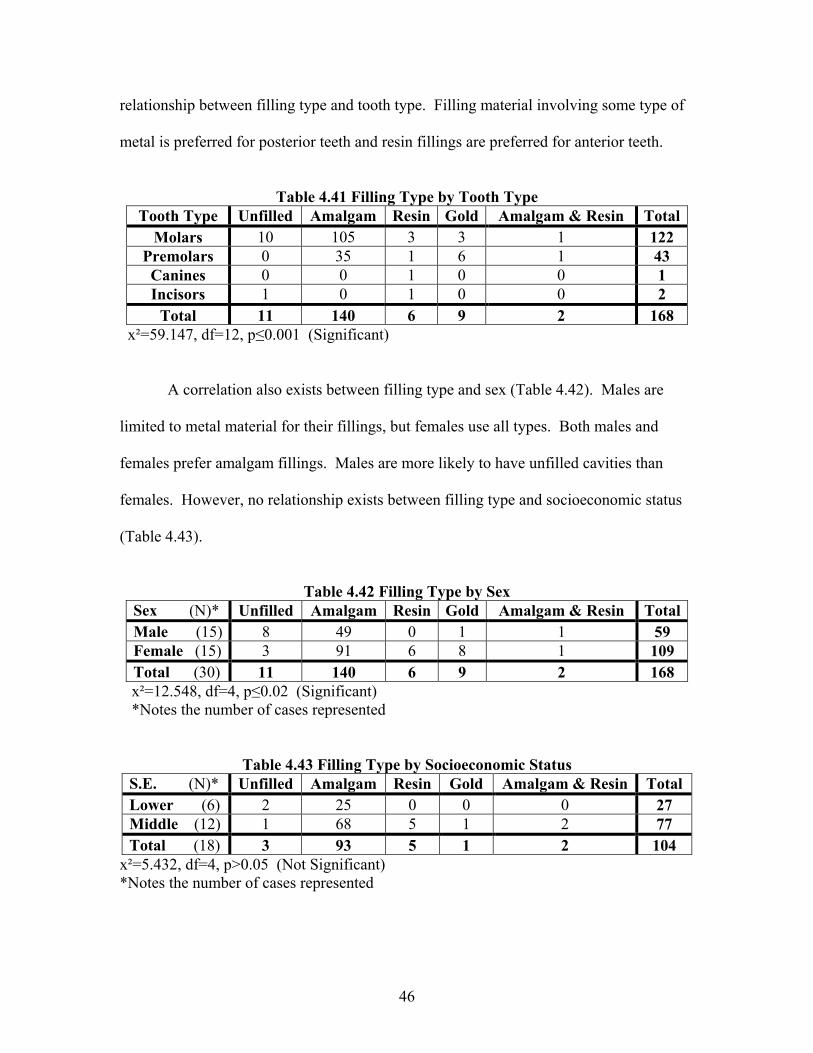
relationship between filling type and tooth type. Filling material involving some type of
metal is preferred for posterior teeth and resin fillings are preferred for anterior teeth.
Table 4.41 Filling Type by Tooth Type
Tooth Type Unfilled Amalgam Resin Gold Amalgam & Resin TotalMolars 10 105 3 3 1 122
Premolars 0 35 1 6 1 43 Canines 0 0 1 0 0 1 Incisors 1 0 1 0 0 2
Total 11 140 6 9 2 168 x²=59.147, df=12, p≤0.001 (Significant)
A correlation also exists between filling type and sex (Table 4.42). Males are
limited to metal material for their fillings, but females use all types. Both males and
females prefer amalgam fillings. Males are more likely to have unfilled cavities than
females. However, no relationship exists between filling type and socioeconomic status
(Table 4.43).
Table 4.42 Filling Type by Sex
Sex (N)* Unfilled Amalgam Resin Gold Amalgam & Resin TotalMale (15) 8 49 0 1 1 59 Female (15) 3 91 6 8 1 109 Total (30) 11 140 6 9 2 168 x²=12.548, df=4, p≤0.02 (Significant) *Notes the number of cases represented
Table 4.43 Filling Type by Socioeconomic Status S.E. (N)* Unfilled Amalgam Resin Gold Amalgam & Resin Total Lower (6) 2 25 0 0 0 27 Middle (12) 1 68 5 1 2 77 Total (18) 3 93 5 1 2 104
x²=5.432, df=4, p>0.05 (Not Significant) *Notes the number of cases represented
46
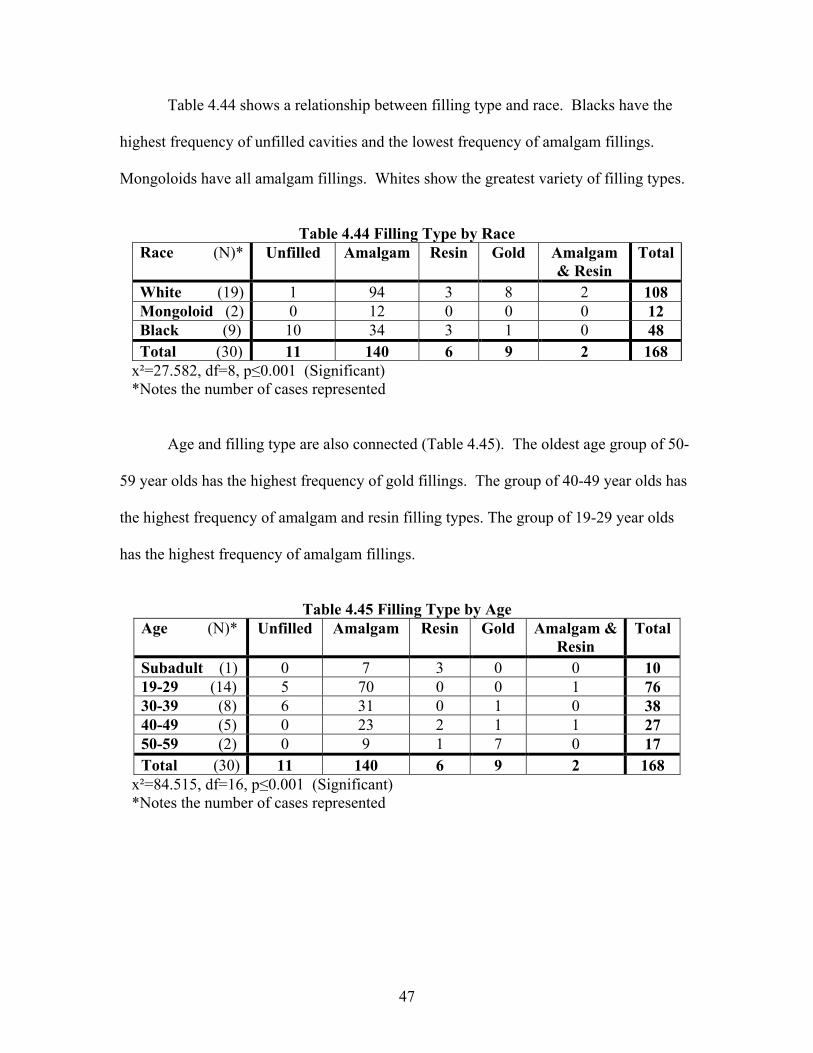
47
Table 4.44 shows a relationship between filling type and race. Blacks have the
highest frequency of unfilled cavities and the lowest frequency of amalgam fillings.
Mongoloids have all amalgam fillings. Whites show the greatest variety of filling types.
Table 4.44 Filling Type by Race
Race (N)* Unfilled Amalgam Resin Gold Amalgam & Resin
Total
White (19) 1 94 3 8 2 108 Mongoloid (2) 0 12 0 0 0 12 Black (9) 10 34 3 1 0 48 Total (30) 11 140 6 9 2 168
x²=27.582, df=8, p≤0.001 (Significant) *Notes the number of cases represented
Age and filling type are also connected (Table 4.45). The oldest age group of 50-
59 year olds has the highest frequency of gold fillings. The group of 40-49 year olds has
the highest frequency of amalgam and resin filling types. The group of 19-29 year olds
has the highest frequency of amalgam fillings.
Table 4.45 Filling Type by Age
Age (N)* Unfilled Amalgam Resin Gold Amalgam & Resin
Total
Subadult (1) 0 7 3 0 0 10 19-29 (14) 5 70 0 0 1 76 30-39 (8) 6 31 0 1 0 38 40-49 (5) 0 23 2 1 1 27 50-59 (2) 0 9 1 7 0 17 Total (30) 11 140 6 9 2 168
x²=84.515, df=16, p≤0.001 (Significant) *Notes the number of cases represented
CHAPTER 5: DISCUSSION
As valuable as researchers and investigators already know dentition is for positive
identification, it may prove just as valuable for general identification. Dental conditions
may help support conclusions about sex, race, and age when more standard methods can
not be performed or can not be performed satisfactorily. This study revealed many
significant relationships between dental conditions and the identifiers, sex, race, age, and
socioeconomic status.
Tooth wear analysis showed a significant relationship with each of the identifiers
tested. Canines and incisors are the most commonly and severely worn teeth, particularly
the lower right lateral incisor. This conclusion was expected because, as the first stage of
the digestion process, these teeth encounter foods in their toughest form. Anterior teeth
are also commonly used for nonmasticatory functions, such as holding nails or pins and
tearing or opening objects. The teeth of males are worn more than those of females. This
result is not consistent with Molnar (1971) or with the idea that females’ teeth may be
more worn due to earlier eruption than males. Perhaps this can be explained by the fact
that men tend to have more manual labor jobs than women and, therefore, are probably
more likely to use their teeth as a tool. Also, women are not usually pipe or cigar
smokers, so they would not have extra wear from such items.
The correlation between socioeconomic status and tooth wear is not what might
be expected. To think that individuals of a lower status would exhibit more tooth wear
because of more manual labor jobs would be reasonable. However, in this study,
individuals of the middle socioeconomic status showed more tooth wear. This
correlation may be due to dietary differences or smoking choices, such as smoking a pipe
48
instead of a cigarette. The connection between race and tooth wear may be due to dietary
or genetic differences. Tooth wear differences according to age are predictable; the older
a person is the more wear his or her teeth will get.
Staining of teeth was only found to be connected to three of the five identifiers.
Incisors were the most frequently stained teeth. This conclusion was a little unexpected
because incisors are the most visible teeth and, therefore, probably the most cared for.
The teeth of males tend to be more commonly and severely stained than those of females.
This outcome is probably the result of hygiene differences, both personal and
professional, between the sexes. Socioeconomic status and race have no effect on
staining. However, the age of an individual does relate to the amount of staining he has.
Much like tooth wear and age, this result is logical in that as age increases so does the
severity of tooth stains.
Postmortem tooth loss was not tested against the five identifiers because what
happens to an individual’s teeth after he is dead should not be affected by his personal
history. The most frequently unrecovered tooth is the lower right central incisor.
Incisors are expected to be lost because they are single root teeth and are exposed easily,
or early, in decomposition. The method of recovery does not affect the collection of
teeth. Also, the fact that these teeth are lost does not hinder positive identification of the
remains.
Antemortem tooth loss showed a correlation with all the identifiers. Molars have
the highest rate of removal. Females would be expected to have a greater rate of
antemortem loss because their smaller dental arcades are potentially more prone to
overcrowding and, therefore, removal of teeth, but this was not the finding of this study.
49
Since the reason teeth were removed cannot be known in forensic cases, no conclusions
about this result can be attempted. Members of the middle class have more teeth lost
antemortem then members of the lower class. Better dental care is the most likely
explanation for this; middle class individuals can afford to have their teeth treated as is
necessary, but lower class people may not be able to pay for a tooth extraction and allow
the tooth to remain. Whites have more antemortem tooth loss than either Mongoloids or
blacks. Like tooth wear and staining, tooth extraction increases with age. This fact is
also understandable.
Race, and age have an effect on crown type, but tooth type and gender do not.
The upper incisors are the most likely to be crowned, but these are the most visible teeth
in the mouth and a crown is certainly more attractive than a filling or diseased tooth.
People of the middle socioeconomic status are able to afford the more expensive and
more attractive porcelain crowns, but people of the lower socioeconomic status may not
be able to do so. This monetary situation may account for the association of crown type
and socioeconomic status. A cultural choice may be the reason for differences in crown
types between races. As a person gets older, he may become wealthier or more willing to
accept the higher expense of a porcelain crown for the benefit of its higher quality.
Porcelain crowns are more expensive, but they are also more durable than metal crowns.
Race and age are the only identifiers that are connected with abscess formation.
All teeth are basically equally affected; canines are slightly less affected than the other
types of teeth. Mongoloids suffer the most from abscesses, followed by whites, and then
blacks. These differences could be dietary or genetic in origin. Also, the small sample of
Mongoloids in this study may present an inaccurate picture of this characteristic in this
50
race. Future studies in this area should include a larger sample of Mongoloids.
Abscesses most affect people 40-49 years of age.
Root canal therapy was not found to be associated with any of the four identifiers
tested. Socioeconomic status could not be tested because no individual of lower
socioeconomic status had a root canal. The only explanation is that when root canal
therapy is required, it is done because the pain can be too severe if it is left untreated.
Caries rates are affected by tooth type, race, and age, but not by socioeconomic
status or sex. Caselitz (1998) suggests that first molars are the most affected by caries,
although he admits that no extensive research has been done. In this study, second
molars were more affected, but only a slight difference separated first and second molars.
This study agrees with Caselitz (1998) that posterior teeth are more affected than anterior
teeth. He also states that upper teeth are less affected than their lower opponents. This
study found that upper teeth were slightly more affected than lower teeth, but not
significantly according to chi-squared testing. This study agrees with Hillson (1986) that
left and right sides are equally affected. Testing showed no significant difference
between the two sides. As stated by Hillson (1986) the teeth of females are more carious
than those of males. However, in this study the difference between male and female
caries rates was not statistically significant. Blacks are least affected by caries; whites
and Mongoloids are relatively equally affected. The occlusal surface is the most affected
crown surface because this is the chewing surface and, in posterior teeth, has cusps and
crenulations that hinder thorough cleanly.
Filling type is related to all identifiers except socioeconomic status. Amalgam is
the most common filling type at 85% of fillings for posterior teeth and 89% of all fillings.
51

52
Males prefer amalgam or gold fillings while females take advantage of resin fillings.
Mongoloids use amalgam, but whites use all types. Blacks have the highest tendency to
leave cavities untreated. Younger people prefer amalgam fillings. Older individuals are
less preferential and use all types.
CHAPTER 6: CONCLUSIONS
The goal of this research was to determine if dental conditions could be
used to establish or help support the sex, race, age, and socioeconomic status of unknown
skeletal remains. This research has not discounted this possibility. Socioeconomic status
has the least amount of effect upon the dental characteristics examined in this study.
However, the possible inaccuracy of the socioeconomic status designation, as mentioned
in Chapter 3, should be kept in mind when discussing analysis involving this identifier.
Age and race have the most connections with the characteristics studied. This study had
a small sample to examine and a wide range of dental characteristics. A narrowed
characteristic list and a broadened sample size could produce a more accurate assessment
of the possibilities of this topic. Tooth wear and antemortem tooth loss hold the most
promise for future study since they correlated with all identifiers. Filling type was
connected to all identifiers except socioeconomic status. Caries only related to three of
the five identifiers, but given the high frequency of occurrence, this would be the most
readily available characteristic to further this study. Out of a possible 42 correlations
between dental characteristics and identifiers, 18 were proven unconnected and 24
showed existing relationships. More research into this area will determine which
relationships are reliable and which are not.
53
WORKS CITED
Bass, William M (1995) Human Osteology: A Laboratory and Field Manual, 4th ed, Special Publication No. 2. Columbia: Missouri Archaeological Society.
Caselitz, Peter (1998) Caries: Ancient Plague of Humankind. In Dental Anthropology:
Fundamentals, Limits, and Prospects, ed. Kurt Alt, Friedrich W. Rösing, Maria Teschler-Nicola, pp 203-225. New York: Springer-Verlag/Wien.
Dahlberg, A. A. (1951) The Dentition of the American Indian. In The Physical
Anthropology of the American Indian, ed. W. S. Laughlin, S. L. Washburn, pp 138-176. New York: Viking Fund.
Goose, Denys H. (1963) Dental Measurements: an Assessment of its Value in
Anthropological Studies. In Dental Anthropology, ed. D. R. Brothwell, pp 125-145, New York: The Macmillan Company.
Hanihara, K. (1966) Mongoloid Dental Complex in the Deciduous Dentition. Journal
of the Anthropological Society of Nippon 74: 61-72. Hellman, M. (1928) Racial Characters in Human Dentition. Proceedings of the
American Philosophical Society 67:157-174. Hillson, Simon (1986) Teeth. New York: Camvridge University Press. Hrdlička, A. (1920) Shovel-Shaped Teeth. American Journal of Physical
Anthropology 3: 429-465. Keiser-Nielsen, S. (1980) Person Identification by Means of the Teeth: a Practical
Guide. Bristol: John Wright & Sons Ltd. Klein, Richard G. (1999) The Human Career: Human Biological and Cultural Origins,
2nd ed. Chicago: University of Chicago Press. Mayhall, John T., Shelley R. Saunders, and Patricia L. Belier (1982) The Dental
Morphology of North American Whites: A Reappraisal. In Teeth: Form, Function, and Evolution, ed. Björn Kurtén, pp 245-258. New York: Columbia University Press.
Miles, A. E. W. (1963) The Dentition in the Assessment of Individual Age in Skeletal
Material. In Dental Anthropology, ed. D. R. Brothwell, pp 191. New York: The Macmillan Company.
Molnar, Stephen (1971) Sex, Age, and Tooth Position as Factors in the Production of
Tooth Wear. American Antiquity 36: 182-187.
54
Rogers, Spencer L. (1986) The Personal Identification of Living Individuals. Springfield: Thomas Books.
Rogers, Spencer L. (1987) Personal Identification from Human Remains. Springfield:
Thomas Books. Rogers, Spencer L. (1988) The Testimony of Teeth: Forensic Aspects of Human
Dentition. Springfield: Thomas Books. Scott, G. Richard and Christy G. Turner II (1988) Dental Anthropology. Annual
Review of Anthropology: 99-120. Scott, G. Richard and Christy G. Turner II (1997) The Anthropology of Modern Human
Teeth. New York: Cambridge University Press. Sopher, Irvin M. (1976) Forensic Dentistry. Springfield: Thomas Books. Türp, Jens C. and Kurt W. Alt (1998) Anatomy and Morphology of Human Teeth. In
Dental Anthropology: Fundamentals, Limits, and Prospects, ed. Kurt W. Alt, Friedrich W. Rösing, and Maria Teschler-Nicola, pp 71-91. New York: Springer-Verlag/Wien
White, Tim D. (2000) Human Osteology, 2nd ed. New York: Academic Press
55
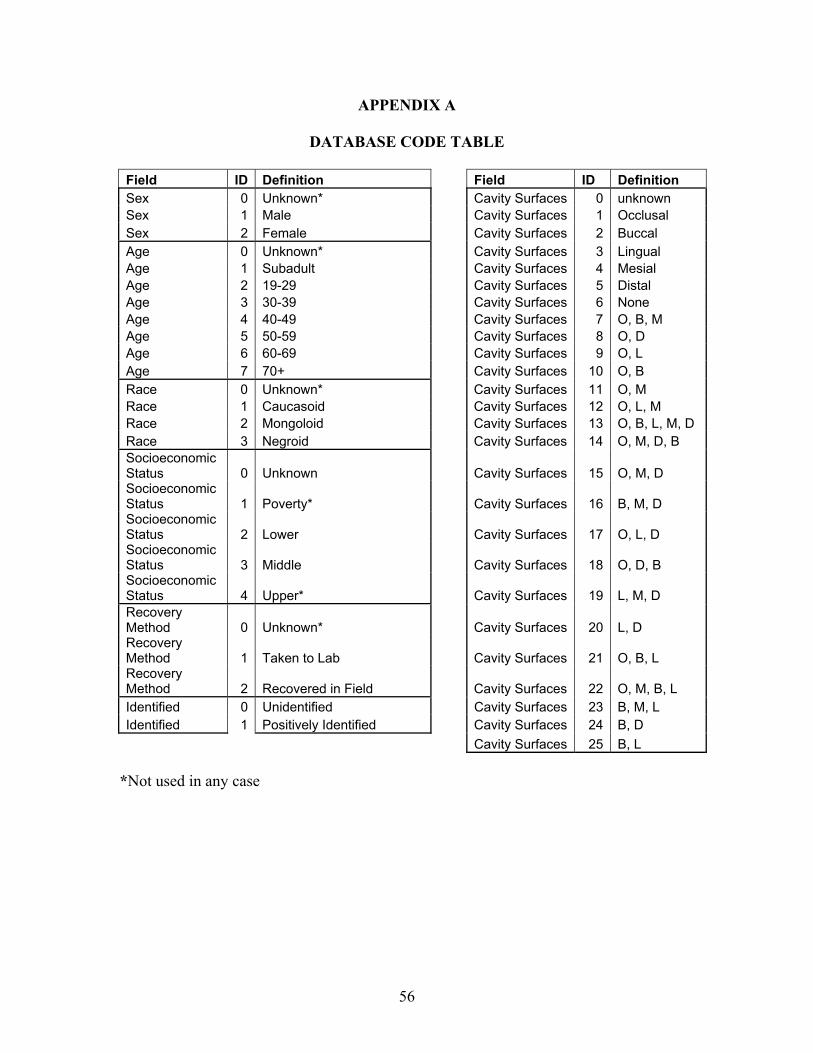
APPENDIX A
DATABASE CODE TABLE
Field ID Definition Field ID Definition Sex 0 Unknown* Cavity Surfaces 0 unknown Sex 1 Male Cavity Surfaces 1 Occlusal Sex 2 Female Cavity Surfaces 2 Buccal Age 0 Unknown* Cavity Surfaces 3 Lingual Age 1 Subadult Cavity Surfaces 4 Mesial Age 2 19-29 Cavity Surfaces 5 Distal Age 3 30-39 Cavity Surfaces 6 None Age 4 40-49 Cavity Surfaces 7 O, B, M Age 5 50-59 Cavity Surfaces 8 O, D Age 6 60-69 Cavity Surfaces 9 O, L Age 7 70+ Cavity Surfaces 10 O, B Race 0 Unknown* Cavity Surfaces 11 O, M Race 1 Caucasoid Cavity Surfaces 12 O, L, M Race 2 Mongoloid Cavity Surfaces 13 O, B, L, M, D Race 3 Negroid Cavity Surfaces 14 O, M, D, B Socioeconomic Status 0 Unknown Cavity Surfaces 15 O, M, D Socioeconomic Status 1 Poverty* Cavity Surfaces 16 B, M, D Socioeconomic Status 2 Lower Cavity Surfaces 17 O, L, D Socioeconomic Status 3 Middle Cavity Surfaces 18 O, D, B Socioeconomic Status 4 Upper* Cavity Surfaces 19 L, M, D Recovery Method 0 Unknown* Cavity Surfaces 20 L, D Recovery Method 1 Taken to Lab Cavity Surfaces 21 O, B, L Recovery Method 2 Recovered in Field Cavity Surfaces 22 O, M, B, L Identified 0 Unidentified Cavity Surfaces 23 B, M, L Identified 1 Positively Identified Cavity Surfaces 24 B, D Cavity Surfaces 25 B, L
*Not used in any case
56
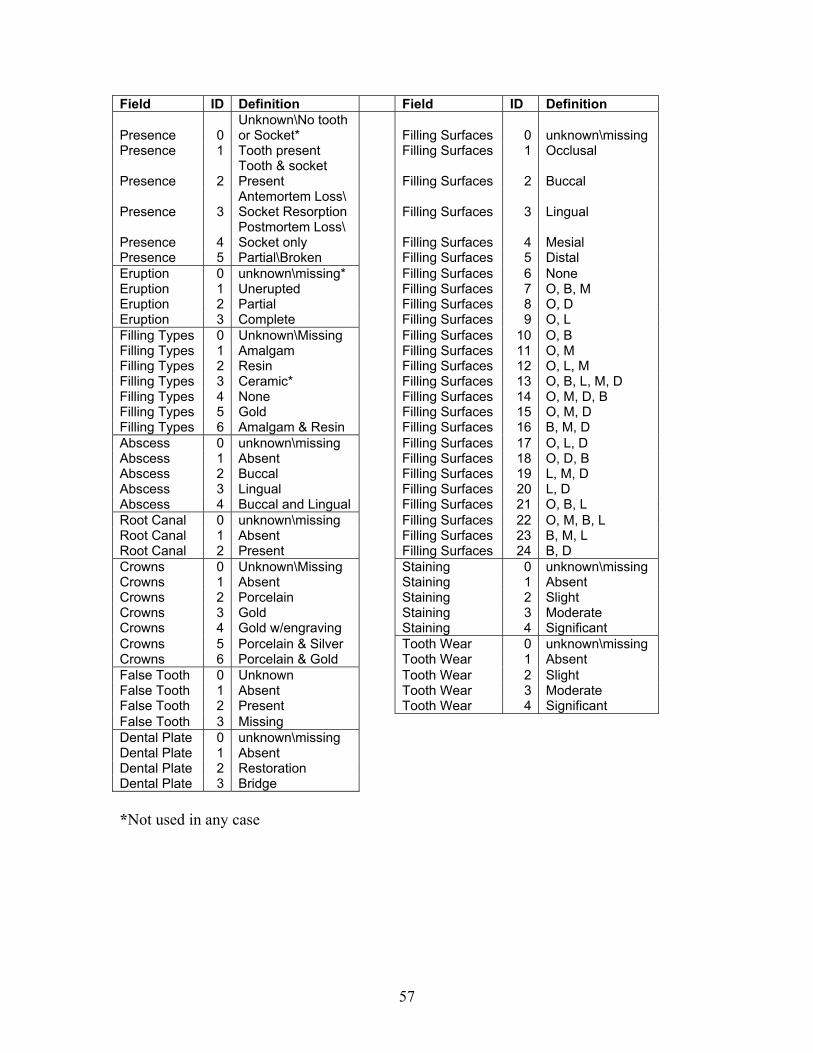
Field ID Definition Field ID Definition
Presence 0 Unknown\No tooth or Socket* Filling Surfaces 0 unknown\missing
Presence 1 Tooth present Filling Surfaces 1 Occlusal
Presence 2 Tooth & socket Present Filling Surfaces 2 Buccal
Presence 3 Antemortem Loss\ Socket Resorption Filling Surfaces 3 Lingual
Presence 4 Postmortem Loss\ Socket only Filling Surfaces 4 Mesial
Presence 5 Partial\Broken Filling Surfaces 5 Distal Eruption 0 unknown\missing* Filling Surfaces 6 None Eruption 1 Unerupted Filling Surfaces 7 O, B, M Eruption 2 Partial Filling Surfaces 8 O, D Eruption 3 Complete Filling Surfaces 9 O, L Filling Types 0 Unknown\Missing Filling Surfaces 10 O, B Filling Types 1 Amalgam Filling Surfaces 11 O, M Filling Types 2 Resin Filling Surfaces 12 O, L, M Filling Types 3 Ceramic* Filling Surfaces 13 O, B, L, M, D Filling Types 4 None Filling Surfaces 14 O, M, D, B Filling Types 5 Gold Filling Surfaces 15 O, M, D Filling Types 6 Amalgam & Resin Filling Surfaces 16 B, M, D Abscess 0 unknown\missing Filling Surfaces 17 O, L, D Abscess 1 Absent Filling Surfaces 18 O, D, B Abscess 2 Buccal Filling Surfaces 19 L, M, D Abscess 3 Lingual Filling Surfaces 20 L, D Abscess 4 Buccal and Lingual Filling Surfaces 21 O, B, L Root Canal 0 unknown\missing Filling Surfaces 22 O, M, B, L Root Canal 1 Absent Filling Surfaces 23 B, M, L Root Canal 2 Present Filling Surfaces 24 B, D Crowns 0 Unknown\Missing Staining 0 unknown\missing Crowns 1 Absent Staining 1 Absent Crowns 2 Porcelain Staining 2 Slight Crowns 3 Gold Staining 3 Moderate Crowns 4 Gold w/engraving Staining 4 Significant Crowns 5 Porcelain & Silver Tooth Wear 0 unknown\missing Crowns 6 Porcelain & Gold Tooth Wear 1 Absent False Tooth 0 Unknown Tooth Wear 2 Slight False Tooth 1 Absent Tooth Wear 3 Moderate False Tooth 2 Present Tooth Wear 4 Significant False Tooth 3 Missing Dental Plate 0 unknown\missing Dental Plate 1 Absent Dental Plate 2 Restoration Dental Plate 3 Bridge *Not used in any case
57

APPENDIX B
DATABASE FORM
Case #
Sex: Socioeconomic Status:
Age: Recovery Method:
Race: Identified:
Tooth 1 2 3 4 Presence Eruption
Cavity Surfaces Filling Surfaces
Filling Type Abscess
Root Canal Crowns
False Teeth Dental Plate
Implants Calcium Buildup
Staining Tooth Wear
Tooth 5 6 7 8
Presence Eruption
Cavity Surfaces Filling Surfaces
Filling Type Abscess
Root Canal Crowns
False Teeth Dental Plate
Implants Calcium Buildup
Staining Tooth Wear
58

Tooth 9 10 11 12 Presence Eruption
Cavity Surfaces Filling Surfaces
Filling Type Abscess
Root Canal Crowns
False Teeth Dental Plate
Implants Calcium Buildup
Staining Tooth Wear
Tooth 13 14 15 16
Presence Eruption
Cavity Surfaces Filling Surfaces
Filling Type Abscess
Root Canal Crowns
False Teeth Dental Plate
Implants Calcium Buildup
Staining Tooth Wear
Tooth 17 18 19 20
Presence Eruption
Cavity Surfaces Filling Surfaces
Filling Type Abscess
Root Canal Crowns
False Teeth Dental Plate
Implants Calcium Buildup
Staining Tooth Wear
59

Tooth 21 22 23 24 Presence Eruption
Cavity Surfaces Filling Surfaces
Filling Type Abscess
Root Canal Crowns
False Teeth Dental Plate
Implants Calcium Buildup
Staining Tooth Wear
Tooth 25 26 27 28
Presence Eruption
Cavity Surfaces Filling Surfaces
Filling Type Abscess
Root Canal Crowns
False Teeth Dental Plate
Implants Calcium Buildup
Staining Tooth Wear
Tooth 29 30 31 32
Presence Eruption
Cavity Surfaces Filling Surfaces
Filling Type Abscess
Root Canal Crowns
False Teeth Dental Plate
Implants Calcium Buildup
Staining Tooth Wear
60
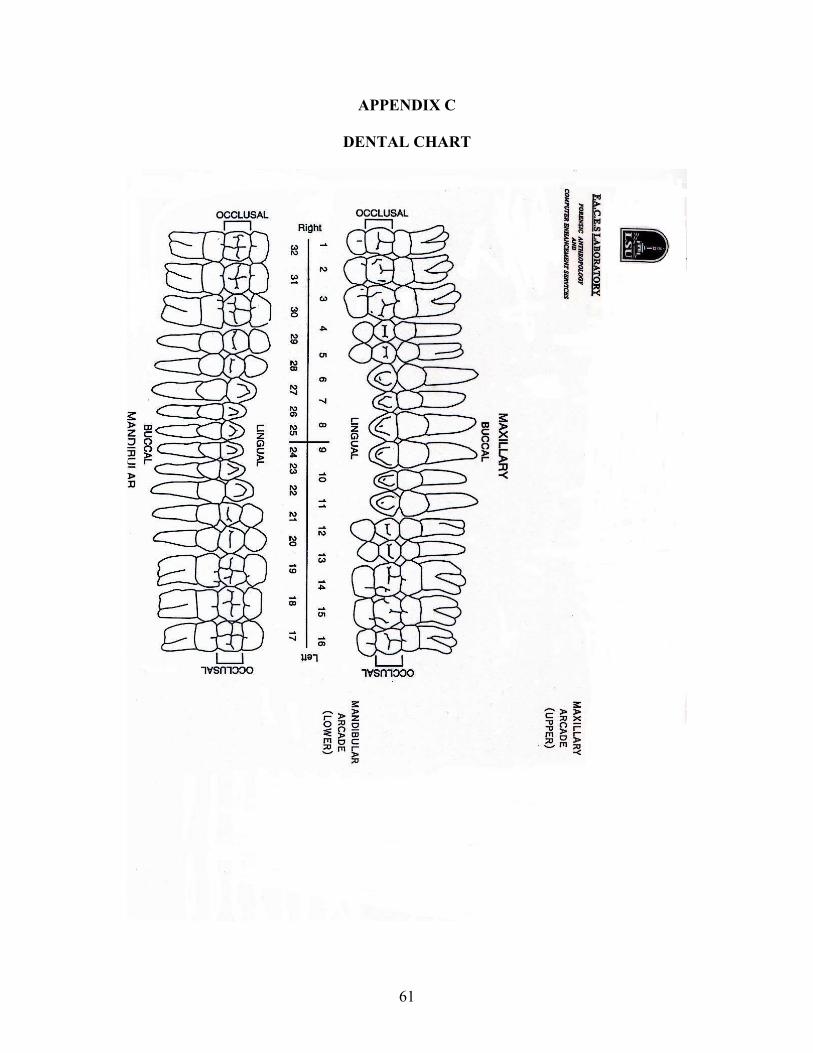
APPENDIX C
DENTAL CHART
61
VITA
Jennifer Gail Hopper McClanahan was born in Memphis, Tennessee. She
graduated from The University of Memphis in May 1999 with a Bachelor of Arts in
anthropology and a minor in geology. In January 2000, she began graduate school at
Louisiana State University. After receiving a Master of Arts degree, she plans on
working in the field of forensic science with law enforcement.
62