Embed Size (px)
Citation preview

FOREIGN DIRECT INVESTMENT
OPPORTUNITIES FOR GEORGIA
Zou, Shanshan
Georgia Tech Enterprise Innovation Institute
AUGUST, 2009

Foreign Direct Investment Opportunities for Georgia
This article is sponsored by the Science, Technology, and Innovation Policy program, a
collaborative program of the Georgia Tech School of Public Policy and the Georgia Tech
Enterprise Innovation Institute.
Acknowledgments
The author wants to thank the sponsors of the STIP program, Georgia Tech School of Public
Policy and Georgia Tech Enterprise Innovation Institute; the program supervisors, Jan Youtie
and Robert Lann; the program coordinator, Hazel Taylor; and the academic advisor, Usha Nair-
Reichert , from Georgia Tech School of Economics.
Georgia Tech Enterprise Innovation Institute Page 2

Foreign Direct Investment Opportunities for Georgia
Table of Contents
Executive Summary ...................................................................................................................................... 4
1 Introduction ........................................................................................................................................... 5
2 FDI in U.S. ............................................................................................................................................ 9
2.1 Country Detail ............................................................................................................................... 9
2.2 Industry Detail ............................................................................................................................ 10
3 FDI in Georgia .................................................................................................................................... 12
3.1 State overview ............................................................................................................................. 12
3.2 Country and Industry Detail ........................................................................................................ 14
3.3 How Does Georgia Perform? ...................................................................................................... 15
3.3.1 Georgia vs. Country’s Average ........................................................................................... 15
3.3.2 Georgia vs. North Carolina ................................................................................................. 17
3.4 Industry Distribution of Foreign Affiliates in Georgia ............................................................... 18
3.5 Example of Recent Foreign Investment ...................................................................................... 19
3.5.1 Example of Foreign Investment in Manufacturing Industry ............................................... 19
3.5.2 Example of Foreign Investment in Service Industry ........................................................... 20
4 Conclusion .......................................................................................................................................... 21
References ................................................................................................................................................... 22
Appendix I. Industry Distribution Maps of Foreign Affiliates in Georgia. ................................................ 23
Appendix II. Industry Classification by U.S. Bureau of Economic Analysis ............................................. 27
Georgia Tech Enterprise Innovation Institute Page 3

Foreign Direct Investment Opportunities for Georgia
Georgia Tech Enterprise Innovation Institute Page 4
Executive Summary
This article focuses on finding out foreign direct investment opportunities for Georgia. The
key research questions are as follows:
• What is the overall picture of foreign investment in U.S. and how does it change over
time?
• What is Georgia’s position in the global trends of FDI?
• What is Georgia’s competitiveness in attracting FDI and what are the opportunities to
increase its competitiveness?
The article addresses these questions within the following framework:
• Assessing recent FDI trends and patterns in the United States, and identifying countries
and industries with FDI potential.
• Analyzing FDI trends and patterns in Georgia, and comparing them with the country’s
average and other competing state.
• Complementary qualitative analysis including industry distribution of foreign affiliates in
Georgia and recent investment examples.
The main findings of this article suggest that Georgia has comparative advantages in
information and high technology industries. In addition, some fast emerging economies have
built strong ties with Georgia, which lays more opportunities to the growth of FDI in Georgia.
Some policy implications are provided at the end of the article, which we hope would expand
the knowledge about FDI’s impacts that we can leverage to further Georgia’s economics
development, and would help economic developers, governments, businesses, and other
stakeholders in Georgia as they consider FDI policies in the futures.

Foreign Direct Investment Opportunities for Georgia
Georgia Tech Enterprise Innovation Institute Page 5
1 Introduction Foreign direct investment id (FDI) is essential to a country’s economic
development. The Bureau of Economic Analysis (BEA) defines FDI as “an
investment in which resident of one country obtains a lasting interest in, and
a degree of influence over the management of, a business enterprise in
another country.” Simply speaking, a FDI is “a company controlled through
ownership by a foreign company or foreign individuals” (Daniels &
Radebaugh, 1998). This kind of control usually can be achieved in two ways:
greenfield investment, which is the creation of new enterprises and the
development or expansion of production facilities; and the mergers and
acquisitions, which involve the purchased of an existing enterprise. This
article will only focus on the foreign direct investment in the United States,
which is also sometimes shorthanded as “inward direct investment’.
U.S. is the world’s largest recipient of FDI. In 2008, U.S. received a total
of $2.3 trillion FDI1, equivalent to16 percent of U.S. total gross domestic
product (GDP)2.
FDI benefits the U.S. economy in many ways. First, it creates new jobs.
In 2006, U.S. affiliates 3 of majority-owned 4 nonbank foreign companies
supported 5.3 million jobs of the country’s employment. Second, it increases
U.S. exports. Exports of goods by U.S. affiliates were $195.3 billion in 2006,
19 percent of the total U.S. exports. Third, it strengthens U.S. manufacturing
and services. Almost 30 percent of the 2006 employment by U.S. affiliates
was in manufacturing industry. Finally, it brings in new research, technology,
and skills. In 2006, expenditures for research and development performed by
1 Measured by the direct investment position on a historical-cost basis. 2 Data Source: Bureau of Economic Analysis 3 U.S. affiliate: A U.S. business enterprise in which there is foreign direct investment – that is, in which a single foreign person owns or controls, directly or indirectly, 10 percent or more of the voting securities or an equivalent interest. 4 Majority-owned U.S. affiliate: A U.S. affiliate that is owned more than 50 percent by foreign direct investors. In this article, the term “U.S. affiliate” referrers to majority-owned nonbank U.S. affiliate.
[Type sidebar conteis
nt. A sidebar a standalone upplement to the
main document. It is ften aligned on the ft or right of the
cated at e top or bottom.
xt Box ools tab to change e formatting of the
sidebar text box.
Type sidebar ontent. A sidebar a standalone
plement to the ain document. It is
.
matting of the sidebar text box.]
s
olepage, or lothUse the TeTth
cissupmoften aligned on the left or right of the page, or located at the top or bottomUse the Text Box Tools tab to change the for
In 2008, U.S. received a total of $2.3 trillion FDI, equivalent to16 percent of U.S. total GDP.

Foreign Direct Investment Opportunities for Georgia
Georgia Tech Enterprise Innovation Institute Page 6
U.S. affiliates totaled $34,3 billion, accounted for 14 percent of the total
R&D performed by all U.S. business.1
Since FDI is such an important factor to the economic growth of U.S., it
has attracted huge amount of studies on the key factors that affect the
location of foreign investment. Many of the past literatures focused on
finding out what kind of characteristics are most attracting to foreign
investors by constructing econometrics models. Friedman, Gerlowski and
Silberman (1992) investigated the location decisions of foreign multinational
plants in U.S. using conditional logit model based on profit maximizing
behavior. The results indicated that the access to market, higher
manufacturing wages, labor productivity, transportation infrastructures, state
promotional activities, state and local personal taxes are significant factors in
the location decisions. Coughlin and Segev (2000) examined the county-
level pattern of new foreign-owned manufacturing plants in U.S. among
BEA regions, from 1898 through 1994. They found that higher levels of
economic size, educational attainment, the existing manufacturing base, and
transportation infrastructure are associated with larger numbers of new
foreign-owned plants. Meanwhile, higher levels of taxes and labor-
intensiveness are found to be associated with smaller numbers of new plants.
They also pointed out that the main advantages of the Southeast region stem
from a relatively high manufacturing base and relatively low taxes.
“A large body of previous literature took partial equilibrium predictions
of multinational enterprises’ (MNE) FDI decisions and examines how
exogenous factors, such as taxes and exchange rates, affect firm-level
decisions. A more recent body of literature has begun to frame MNE
decisions in a general equilibrium framework and generates predictions of
how fundamental country-level factor affect aggregate country-level FDI
behavior.” (Blonigen, 2005) For example, Bolnigen, Ellis and Fausten (2003)
explored worldwide FDI location decisions by Japanese manufacturing firms
1 Data Source: Bureau of Economic Analysis
[Type sidebar content. A sidebar
dalone plement to the
main document. It is d on the
page, or located at tom.
Use the Text Box change
atting of the sidebar text box.
ebar ne
he t. It is
e
at
e
is a stansup
often aligneleft or right of the
the top or bot
Tools tab to the form
Type sidebar content. A sidis a standalosupplement to tmain documenoften aligned on thleft or right of the page, or locatedthe top or bottom. Use the Text Box Tools tab to changthe formatting of the sidebar text box.]
“A large body of previous literature took partial equilibrium predictions of multinational enterprises’ FDI decisions and examines how exogenous factors, while a more recent body of literature has begun to frame MNE decisions in a general equilibrium framework and generates predictions of how fundamental country-level factor affect aggregate country-level FDI behavior.” (Blonigen, 2005)
Foreign Direct Investment Opportunities for Georgia from 1985 through 1991 with a conditional logit model. They found that
Japanese firm’s location decisions are affected by membership in either
vertical or horizontal groups, providing evidence of that business networking
and information externalities that affect the FDI location decisions of partner
firms. Kokko and Blomstrom (2003) suggested that the potential spillover
benefits of foreign investment are realized only if local firms have the ability
and motivation to invest in absorbing foreign technologies and skills. They
argued that good governance in the area of FDI policy is to consider the
investment incentives packages as part of the country’s overall industrial
policy, and make any incentives available on equal terms to all investors.
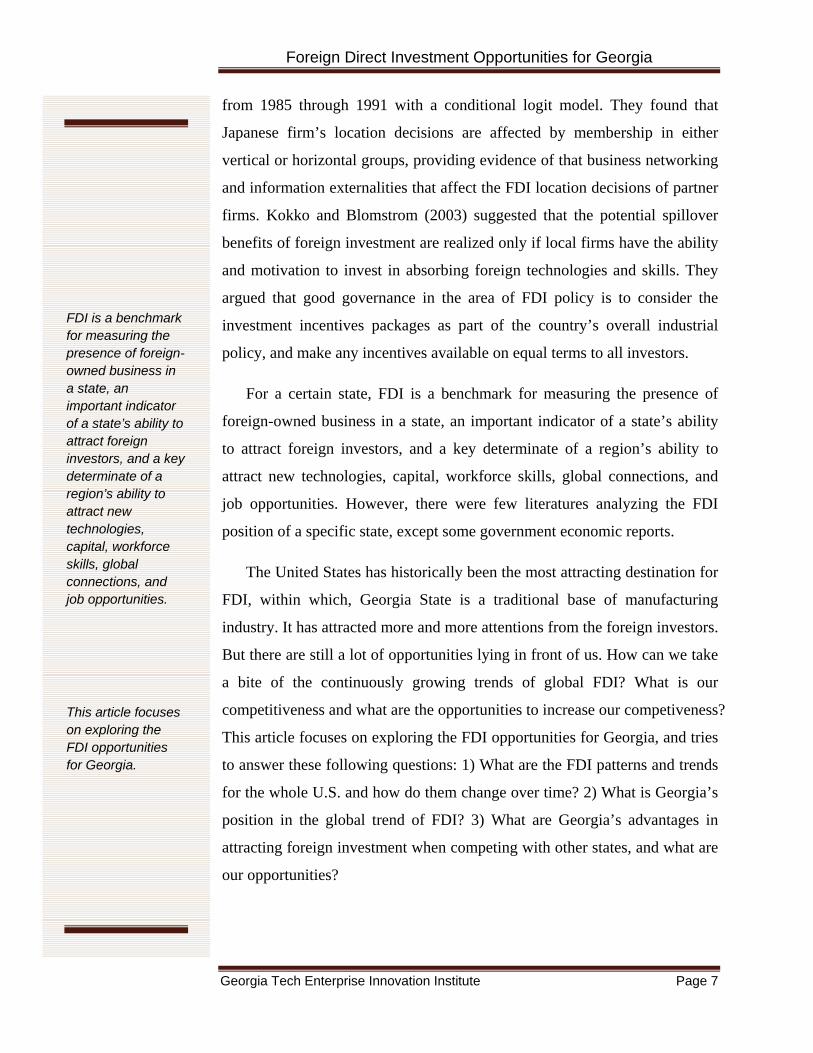
For a certain state, FDI is a benchmark for measuring the presence of
foreign-owned business in a state, an important indicator of a state’s ability
to attract foreign investors, and a key determinate of a region’s ability to
attract new technologies, capital, workforce skills, global connections, and
job opportunities. However, there were few literatures analyzing the FDI
position of a specific state, except some government economic reports.
The United States has historically been the most attracting destination for
FDI, within which, Georgia State is a traditional base of manufacturing
industry. It has attracted more and more attentions from the foreign investors.
But there are still a lot of opportunities lying in front of us. How can we take
a bite of the continuously growing trends of global FDI? What is our
competitiveness and what are the opportunities to increase our competiveness?
This article focuses on exploring the FDI opportunities for Georgia, and tries
to answer these following questions: 1) What are the FDI patterns and trends
for the whole U.S. and how do them change over time? 2) What is Georgia’s
position in the global trend of FDI? 3) What are Georgia’s advantages in
attracting foreign investment when competing with other states, and what are
our opportunities?
FDI is a benchmark for measuring the presence of foreign-owned business in a state, an important indicator of a state’s ability to attract foreign investors, and a key determinate of a region’s ability to attract new technologies, capital, workforce skills, global connections, and job opportunities.
This article focuses on exploring the FDI opportunities for Georgia.
Georgia Tech Enterprise Innovation Institute Page 7
Foreign Direct Investment Opportunities for Georgia
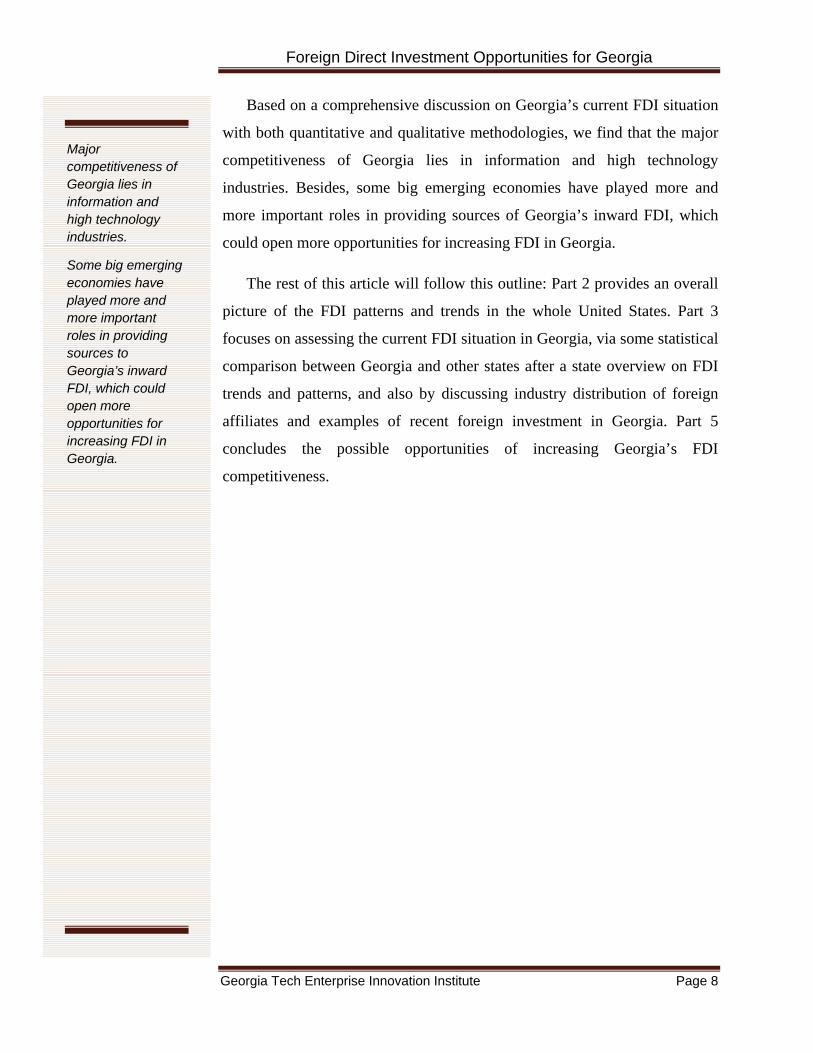
Based on a comprehensive discussion on Georgia’s current FDI situation
with both quantitative and qualitative methodologies, we find that the major
competitiveness of Georgia lies in information and high technology
industries. Besides, some big emerging economies have played more and
more important roles in providing sources of Georgia’s inward FDI, which
could open more opportunities for increasing FDI in Georgia.
The rest of this article will follow this outline: Part 2 provides an overall
picture of the FDI patterns and trends in the whole United States. Part 3
focuses on assessing the current FDI situation in Georgia, via some statistical
comparison between Georgia and other states after a state overview on FDI
trends and patterns, and also by discussing industry distribution of foreign
affiliates and examples of recent foreign investment in Georgia. Part 5
concludes the possible opportunities of increasing Georgia’s FDI
competitiveness.
Major competitiveness of Georgia lies in information and high technology industries.
Some big emerging economies have played more and more important roles in providing sources to Georgia’s inward FDI, which could open more opportunities for increasing FDI in Georgia.
Georgia Tech Enterprise Innovation Institute Page 8

Foreign Direct Investment Opportunities for Georgia
Georgia Tech Enterprise Innovation Institute Page 9
2 FDI in U.S. First, let us take a look at the overall FDI trends and patterns in the whole
United States.
At the end of 2008, the FDI position in U.S. valued at historical cost 1
was $2,278.9 billion, an increase of 72 percent since 2002. The inward direct
investment position increased 9 percent in 2008, down from 14 percent in
2007.2
2.1 Country Detail Europe was the largest
investor in U.S. It provided 71
percent of the total foreign
investment in 2008. Canada,
Asian and Pacific countries also
contributed a lot to the foreign
investment in this country. (Chart
1)
Chart 2 compares the FDI by
investing country between 2008
and 2002, from which we can see that while the investment from Canada
(140%) and Europe (69%) kept growing at a fast rate, Asian and Pacific
countries also showed great potential by increasing 91 percent of the
investment in U.S. since 2002.
Particularly, in 2008, there were eight counties invested more than $100
billion: Canada, France, Germany, the Netherlands, Switzerland,
Luxembourg, the United Kingdom, and Japan, which are all exclusively
OECD countries. Among these major investors, UK had the largest position,
1 The book value of foreign director investors’ equity in, and outstanding loans to, their U.S. affiliates 2 Data Source: U.S. Bureau of Economic Analysis
Canada10%
Europe71%
Latin America
and Other Western
Hemisphere
2%
Africa0%
Middle East1% Asia and
Pacific16%
Cart 1. Share of FDI in U.S. by Continent (2008)
At the end of 2008, FDI in U.S. was $2,278.9 billion, an increase of 72 percent since 2002.
Europe was the largest investor in U.S.
While the investment from Canada and Europe kept growing at a fast rate, Asian and Pacific countries showed great potential by increasing 91 percent of the investment in U.S. since 2002.
Data Source: U.S. Bureau of Economic Analysis

Foreign Direct Investment Opportunities for Georgia
Georgia Tech Enterprise Innovation Institute Page 10
which equals 20 percent of the total FDI. Japan had the next largest position,
which equals 12 percent of the total FDI.
Data Source: U.S. Bureau of Economic Analysis
Besides those developed major investors in U.S., the top developing
economies by growth in FDI include United Arab Emirates, India, China and
Taiwan, which are all big emerging economies during the past decade.
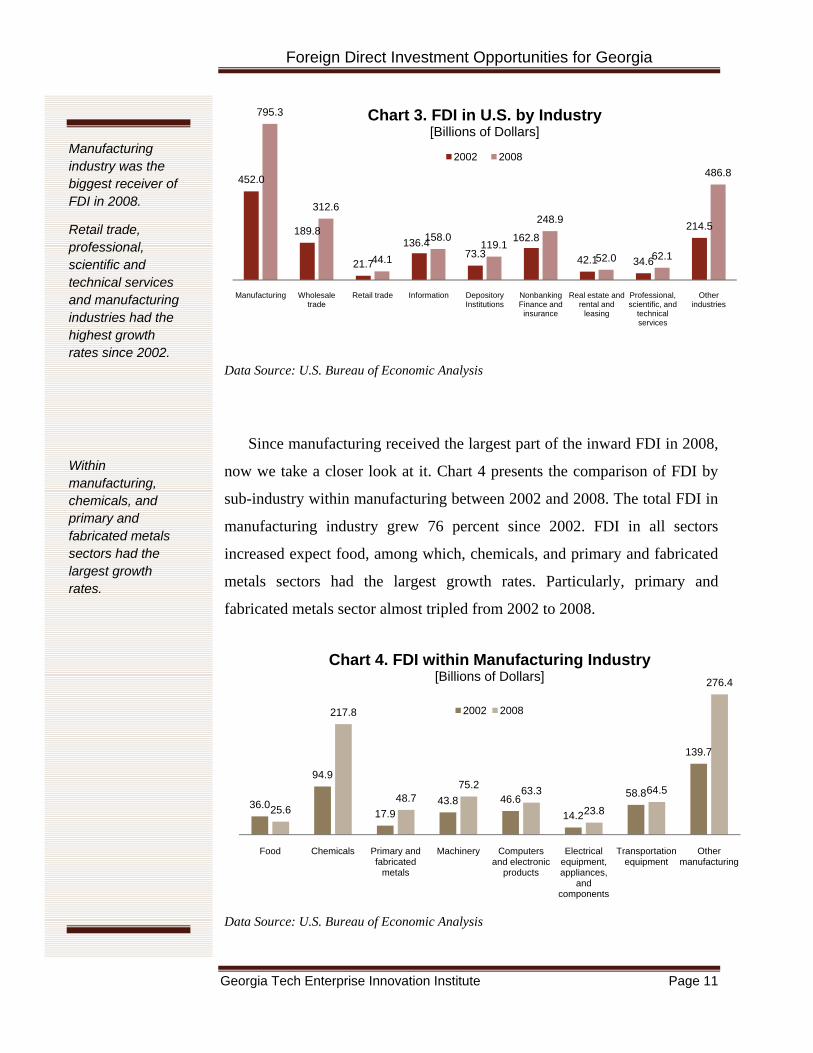
2.2 Industry Detail Manufacturing industry was the biggest recipient of FDI in 2008, which
attracted $795 billion FDI, equivalent to 35 percent of the 2008 total foreign
investment. FDI in all industries increased from 2002 to 2008. Especially,
retail trade (103%), professional, scientific and technical services (79%) and
manufacturing (76%) industries had the highest growth rates. (Chart 3)
92.5
958.3
74.9 2.2 6.8 192.5 221.9
1622.9
49.2 2.0 14.7
368.2
Canada Europe Latin America and Other Western
Hemisphere
Africa Middle East Asia and Pacific
Chart 2. FDI in U.S. by Country[Billions of Dollars]
2002 2008
[Type sidebar conteis
nt. A sidebar a standalone upplement to the
main document. It is ften aligned on the ft or right of the
cated at e top or bottom.
xt Box ools tab to change e formatting of the
sidebar text box.
Type sidebar ontent. A sidebar a standalone
plement to the It is the
he
.
Tools tab to change the formatting of the sidebar text box.]
s
olepage, or lothUse the TeTth
cissupmain document. often aligned onleft or right of tpage, or located at the top or bottomUse the Text Box
Top developing economies by growth in FDI include United Arab Emirates, India, China and Taiwan.
Foreign Direct Investment Opportunities for Georgia
The total FDI in manufacturing industry grew 76 percent since 2002. FDI in all sectors
pect hich
d
ate.
increased exfood, among wchemicals, anprimary and fabricated metals sectors have the largest growth r
Manufacturing industry was the biggest receiver of FDI in 2008.
Retail trade, professional, scientific and technical services and manufacturing industries had the highest growth rates since 2002.
Within manufacturing, chemicals, and primary and fabricated metals sectors had the largest growth rates.
452.0
189.8
21.7
136.4 73.3
162.8
42.1 34.6
214.5
795.3
312.6
44.1
158.0 119.1
248.9
52.0 62.1
486.8
Manufacturing Wholesale trade
Retail trade Information Depository Institutions
Nonbanking Finance and
insurance
Real estate and rental and
leasing
Professional, scientific, and
technical services
Other industries
Chart 3. FDI in U.S. by Industry[Billions of Dollars]
2002 2008
Data Source: U.S. Bureau of Economic Analysis
Since manufacturing received the largest part of the inward FDI in 2008,
now we take a closer look at it. Chart 4 presents the comparison of FDI by
sub-industry within manufacturing between 2002 and 2008. The total FDI in
manufacturing industry grew 76 percent since 2002. FDI in all sectors
increased expect food, among which, chemicals, and primary and fabricated
metals sectors had the largest growth rates. Particularly, primary and
fabricated metals sector almost tripled from 2002 to 2008.
36.0
94.9
17.943.8 46.6
14.2
58.8
139.7
25.6
217.8
48.775.2 63.3
23.8
64.5
276.4
Food Chemicals Primary and fabricated
metals
Machinery Computers and electronic
products
Electrical equipment, appliances,
and components
Transportation equipment
Other manufacturing
Chart 4. FDI within Manufacturing Industry[Billions of Dollars]
2002 2008
Data Source: U.S. Bureau of Economic Analysis
Georgia Tech Enterprise Innovation Institute Page 11
Foreign Direct Investment Opportunities for Georgia
Georgia Tech Enterprise Innovation Institute Page 12
3 FDI in Georgia
3.1 State overview So far, we have discussed the overall FDI trends and patterns in the
whole United States. But where is Georgia’s position in this fast growing
global trend of FDI? Are we leading the FDI in this country, or do we fall
behind? Here are a few factsheets of the recent FDI situation in Georgia:
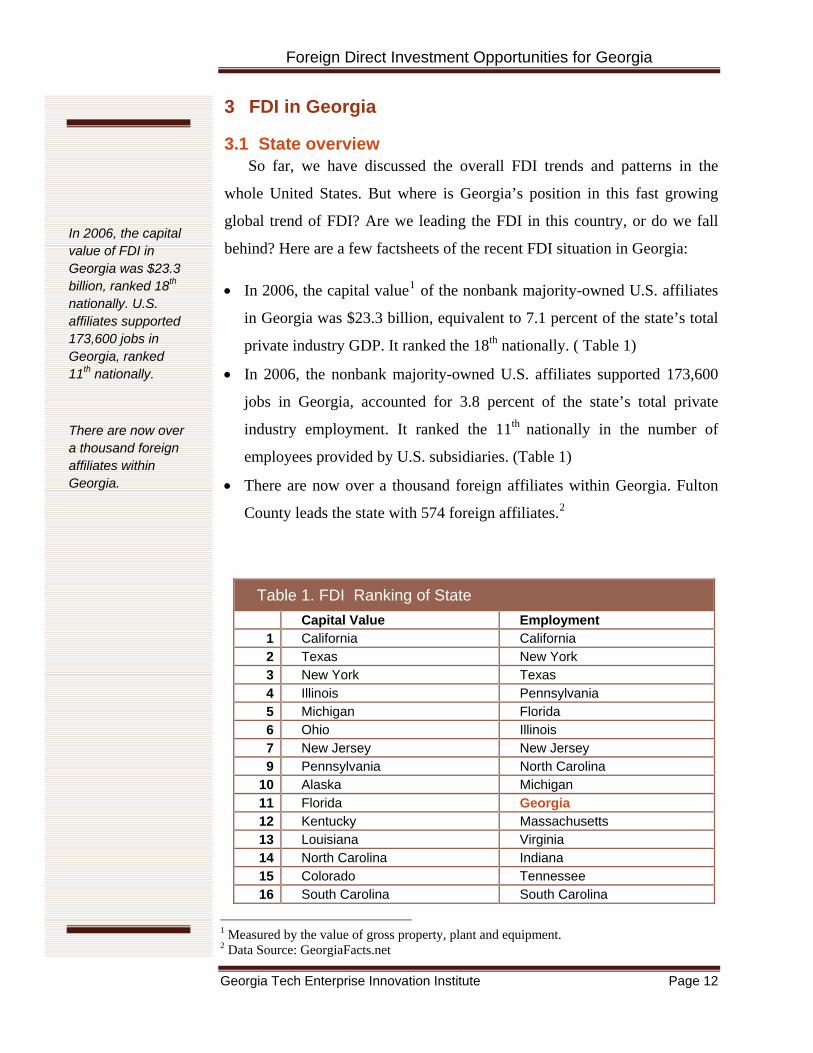
• In 2006, the capital value1 of the nonbank majority-owned U.S. affiliates
in Georgia was $23.3 billion, equivalent to 7.1 percent of the state’s total
private industry GDP. It ranked the 18th nationally. ( Table 1)
• In 2006, the nonbank majority-owned U.S. affiliates supported 173,600
jobs in Georgia, accounted for 3.8 percent of the state’s total private
industry employment. It ranked the 11th nationally in the number of
employees provided by U.S. subsidiaries. (Table 1)
• There are now over a thousand foreign affiliates within Georgia. Fulton
County leads the state with 574 foreign affiliates.2
Table 1. FDI Ranking of State Capital Value Employment
1 California California 2 Texas New York 3 New York Texas 4 Illinois Pennsylvania 5 Michigan Florida 6 Ohio Illinois 7 New Jersey New Jersey 9 Pennsylvania North Carolina
10 Alaska Michigan 11 Florida Georgia 12 Kentucky Massachusetts 13 Louisiana Virginia 14 North Carolina Indiana 15 Colorado Tennessee 16 South Carolina South Carolina
1 Measured by the value of gross property, plant and equipment. 2 Data Source: GeorgiaFacts.net
[Type sidebar conteis
nt. A sidebar a standalone upplement to the
main document. It is
e
x
the
Type sidebar ontent. A sidebar
page, or located at the top or bottom. Use the Text Box Tools tab to change the formatting of the sidebar text box.]
s
often aligned on the left or right of thpage, or located at the top or bottom. Use the Text BoTools tab to change the formatting of sidebar text box.
cis a standalone supplement to the main document. It isoften aligned on the left or right of the
In 2006, the capital value of FDI in Georgia was $23.3 billion, ranked 18th nationally. U.S. affiliates supported 173,600 jobs in Georgia, ranked 11th nationally.
There are now over a thousand foreign affiliates within Georgia.
Foreign Direct Investment Opportunities for Georgia
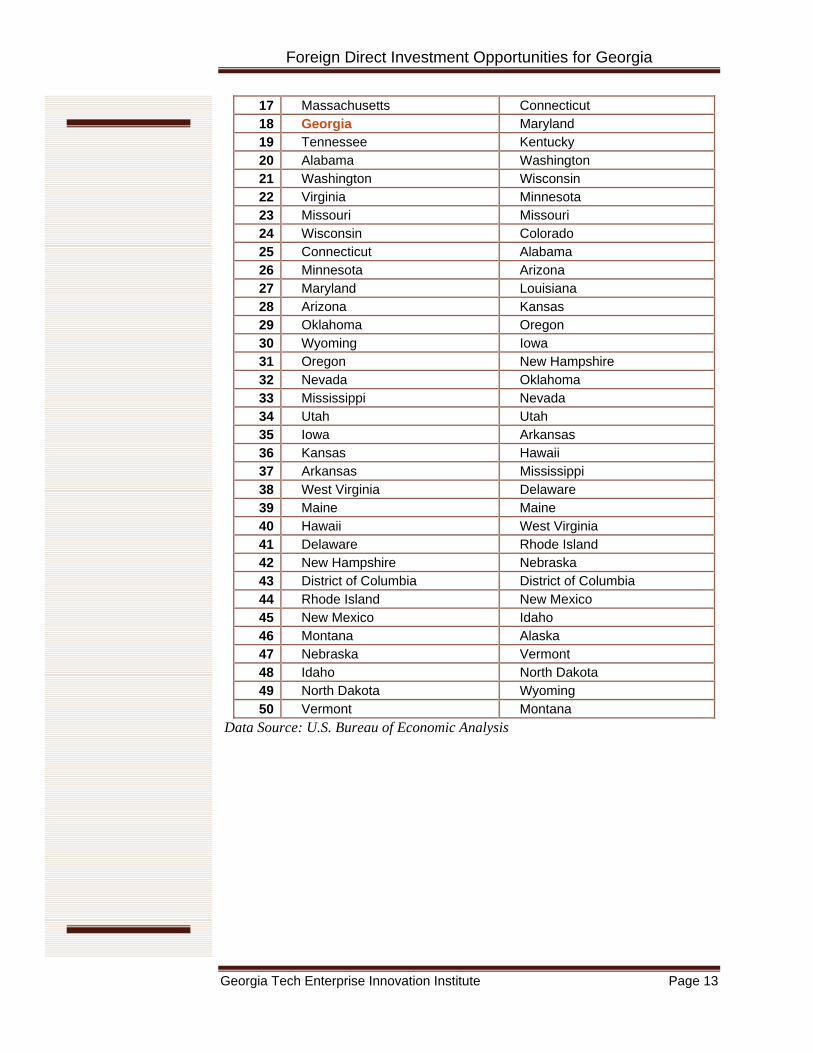
17 Massachusetts Connecticut 18 Georgia Maryland 19 Tennessee Kentucky 20 Alabama Washington 21 Washington Wisconsin 22 Virginia Minnesota 23 Missouri Missouri 24 Wisconsin Colorado 25 Connecticut Alabama 26 Minnesota Arizona 27 Maryland Louisiana 28 Arizona Kansas 29 Oklahoma Oregon 30 Wyoming Iowa 31 Oregon New Hampshire 32 Nevada Oklahoma 33 Mississippi Nevada 34 Utah Utah 35 Iowa Arkansas 36 Kansas Hawaii 37 Arkansas Mississippi 38 West Virginia Delaware 39 Maine Maine 40 Hawaii West Virginia 41 Delaware Rhode Island 42 New Hampshire Nebraska 43 District of Columbia District of Columbia 44 Rhode Island New Mexico 45 New Mexico Idaho 46 Montana Alaska 47 Nebraska Vermont 48 Idaho North Dakota 49 North Dakota Wyoming 50 Vermont Montana
Data Source: U.S. Bureau of Economic Analysis
Georgia Tech Enterprise Innovation Institute Page 13

Foreign Direct Investment Opportunities for Georgia
Georgia Tech Enterprise Innovation Institute Page 14
3.2 Country and Industry Detail Chart 5 and Chart 6 present the FDI percent in Georgia in 2006 by
country and by industry, respectively.
In 2006, the nine
major investors in
Georgia - Canada,
France, Germany, the
Netherlands, Sweden,
Switzerland, the United
Kingdom, Australia, and
Japan - accounted for
almost 80 percent of the
foreign investment in
Georgia.
54 percent of FDI in Georgia ($12.6 billion) came from Europe, among
which European Union countries invested $11.8 billion. Asian and Pacific
countries contributed 26 percent ($6 billion) of the total FDI. Japan was
Georgia’s largest foreign investor with 20 percent ($4.5 billion) of the state’s
total FDI. Germany and Canada were second and third respectively. Among
all these investors,
Canada increased its
FDI in the state by 36
percent, the largest
increase among world
region.
More than half of
FDI ($12 billion) in
Georgia went into
manufacturing
industry. Wholesale
In 2006, 54% of FDI in Georgia came from Europe, 26% from Asia and Pacific.
Japan was Georgia’s largest foreign investor.FDI from Canada increased the most.
Canada10% France
9%
Germany15%
Netherlands7%
Sweden1%Switzerland
3%
United Kingdom
9%
Australia4%
Japan20%
Others22%
Chart 5. FDI Percentage in GA by Country, 2006
Manufacturing52%
Wholesale trade16%
Retail trade3%
Information4%
Nonobank finance and insurance
3%
Real estate and rental
and leasing11%
Professional, scientific,
and technical services
2%Other
industries9%
Chart 6. FDI Percentage in GA by Industry, 2006
Measured by the value of gross property, plant and equipment. Data Source: U.S. Bureau of Economic Analysis
Measured by the value of gross property, plant and equipment. Data Source: U.S. Bureau of Economic Analysis
Foreign Direct Investment Opportunities for Georgia
Georgia Tech Enterprise Innovation Institute Page 15
trade ($3.6 billion) and real estate ($2.7 billion) industries are also big
recipients of the foreign investment in the state. Foreign investment in all
industries increased except manufacturing, among which technical services
and information industries increased the most by 59% and 41% respectively.
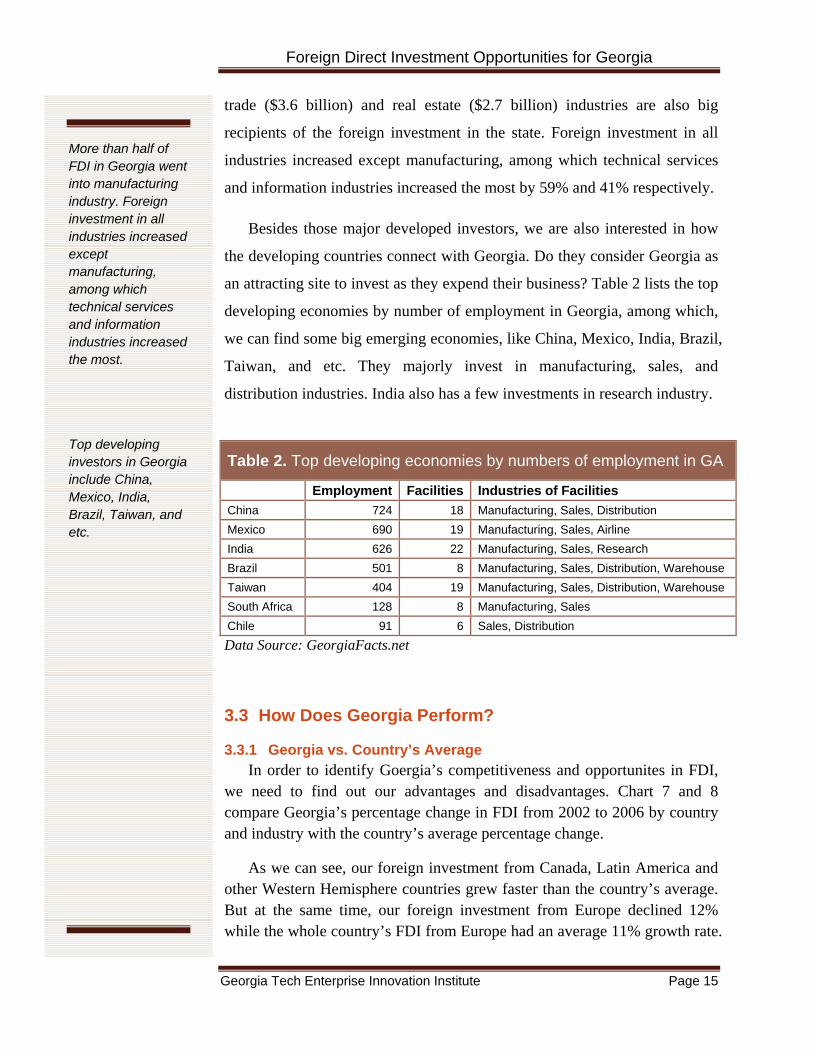
Besides those major developed investors, we are also interested in how
the developing countries connect with Georgia. Do they consider Georgia as
an attracting site to invest as they expend their business? Table 2 lists the top
developing economies by number of employment in Georgia, among which,
we can find some big emerging economies, like China, Mexico, India, Brazil,
Taiwan, and etc. They majorly invest in manufacturing, sales, and
distribution industries. India also has a few investments in research industry.
Data Source: GeorgiaFacts.net
3.3 How Does Georgia Perform?
3.3.1 Georgia vs. Country’s Average In order to identify Goergia’s competitiveness and opportunites in FDI,
we need to find out our advantages and disadvantages. Chart 7 and 8 compare Georgia’s percentage change in FDI from 2002 to 2006 by country and industry with the country’s average percentage change.
As we can see, our foreign investment from Canada, Latin America and other Western Hemisphere countries grew faster than the country’s average. But at the same time, our foreign investment from Europe declined 12% while the whole country’s FDI from Europe had an average 11% growth rate.
Table 2. Top developing economies by numbers of employment in GA
Employment Facilities Industries of Facilities China 724 18 Manufacturing, Sales, Distribution Mexico 690 19 Manufacturing, Sales, Airline India 626 22 Manufacturing, Sales, Research Brazil 501 8 Manufacturing, Sales, Distribution, Warehouse Taiwan 404 19 Manufacturing, Sales, Distribution, Warehouse South Africa 128 8 Manufacturing, Sales Chile 91 6 Sales, Distribution
[Type sidebar content. A sidebar is a standalone supplement to themain document. Ioften aligned on the left or rigpage, or locatedthe top or bottoUse the Text Box Tools tab to chanthe formatting of the sidebar text box.
t is
ht of the at
m.
ge
ype sidebar nt. A sidebar
a standalone e
the e
p or bottom. Use the Text Box
ools tab to change the formatting of the sidebar text box.]
Tconteissupplement to thmain document. It is often aligned onleft or right of thpage, or located at the to
T
More than half of FDI in Georgia went into manufacturing industry. Foreign investment in all industries increased except manufacturing, among which technical services and information industries increased the most.
Top developing investors in Georgia include China, Mexico, India, Brazil, Taiwan, and etc.

Foreign Direct Investment Opportunities for Georgia
By industry, the foreign investment in Georgia’s information, and technical services industries increased much faster than the country’s average. But FDI in our manufacturing industry declined 20% while the FDI of the whole U.S. manufacturing industry had an average growth rate of 6%.
Our foreign investment from Canada, Latin America and other Western Hemisphere countries grew faster than the country’s average.
The foreign investment in Georgia’s information, and technical services industries increased faster than the country’s average.
31%
11%
1%
26%
51%
36%
-12%
12%
3% -47%
Canada Europe Latin America and Other Western Hemisphere
Asia and Pacific Others
Chart 7. Percentage Change in FDI by Country (2002-2006)
U.S. Georgia
(1) Measured by the values of gross property, plant, and equipment of majority-owned nonbank U.S. affiliates (2)Others include Africa and Middle East
Data Source: U.S. Bureau of Economic Analysis
6%
31%
5%-2%
22% 21%29%
33%
-20%
5% 1%
41%
1%
11%
59%
35%
Manufacturing Wholesale trade
Retail trade Information Finance (except
depository institutions)
and insurance
Real estate and rental and
leasing
Professional, scientific, and
technical services
Other industries
Chart 8. Percentage Change in FDI by Industry (2002-2006)
U.S. Georgia
Data Source: U.S. Bureau of Economic Analysis
Georgia Tech Enterprise Innovation Institute Page 16

Foreign Direct Investment Opportunities for Georgia 3.3.2 Georgia vs. North Carolina
In addition to the comparison with the country’s average, how does Georgia perform when competing with other comparative states? Now we take North Carolina as an example.
North Carolina is a traditional competitor of Georgia in economic growth: both in the Southeastern Area, with close population (9.7 million and 9.2 million in 2008) and similar per capita GDP ($33,499 and $33,753 in 2007). Table 3 presents some simple comparison on the FDI situation in 2006 between Georgia and North Carolina.
Table 3. Georgia vs. North Carolina (2006)
FDI capital value1
(billions of dollars)
Ranking
Percentage of total private industry
GDP
Employment2
(thousands
of jobs) Ranking
Percentage of total private industry
employmentGA 23.3 18 7.10% 173.6 11 3.80%NC 26.1 14 7.90% 209.4 9 4.70%
(1) Gross Property, Plant, and Equipment of Majority-Owned Nonbank U.S. Affiliates (2) Employment of Majority-Owned Nonbank U.S. Affiliates
Data Source: U.S. Bureau of Economic Analysis
From this comparison, it is obvious that FDI in Georgia fell behind FDI in North Carolina overall in 2006. But it does not mean that we have no advantages in all industries and all investing areas. Therefore, we make a detailed comparison by country and industry detail to find out our strengths and weakness. (Chart 9-10)
In 2006, North Carolina attracted more FDI from Canada ($0.2 million) and Europe ($5.2 billion). But there were more investment from Asia and Pacific countries ($2 million) went into Georgia than North Carolina.
By industry, there were much more manufacturing FDI ($6.4 billion) came into North Carolina than Georgia in 2006. But we had more strength in wholesale trade, information, finance, real estate and technical services industries.
In 2006, North Carolina performed better in attracting FDI.
Georgia attracted more FDI from Asia and pacific countries than North Carolina.
We had more strength in wholesale trade, information, finance, real estate and technical services industries.
Georgia Tech Enterprise Innovation Institute Page 17

Foreign Direct Investment Opportunities for Georgia
2.2
12.6
1.6
6.0
1.02.4
17.8
1.6
4.0
0.3
Canada Europe Latin America and Other Western Hemisphere
Asia and Pacific Others
Chart 9. GA vs. NC: FDI by Country (2006)[Billions of Dollars]
Georgia North Carolina
Data Source: U.S. Bureau of Economic Analysis
12.0
3.60.6 1.1 0.8
2.70.4
2.2
18.4
2.4 2.40.3 0.1 1.2 0.1 1.2
Manufacturing Wholesale trade
Retail trade Information Finance (except
depository institutions)
and insurance
Real estate and rental and
leasing
Professional, scientific, and
technical services
Other industries
Chart 10. GA vs. NC: FDI by Industry (2006)[Billions of Dollars]
Georgia North Carolina
Data Source: U.S. Bureau of Economic Analysis
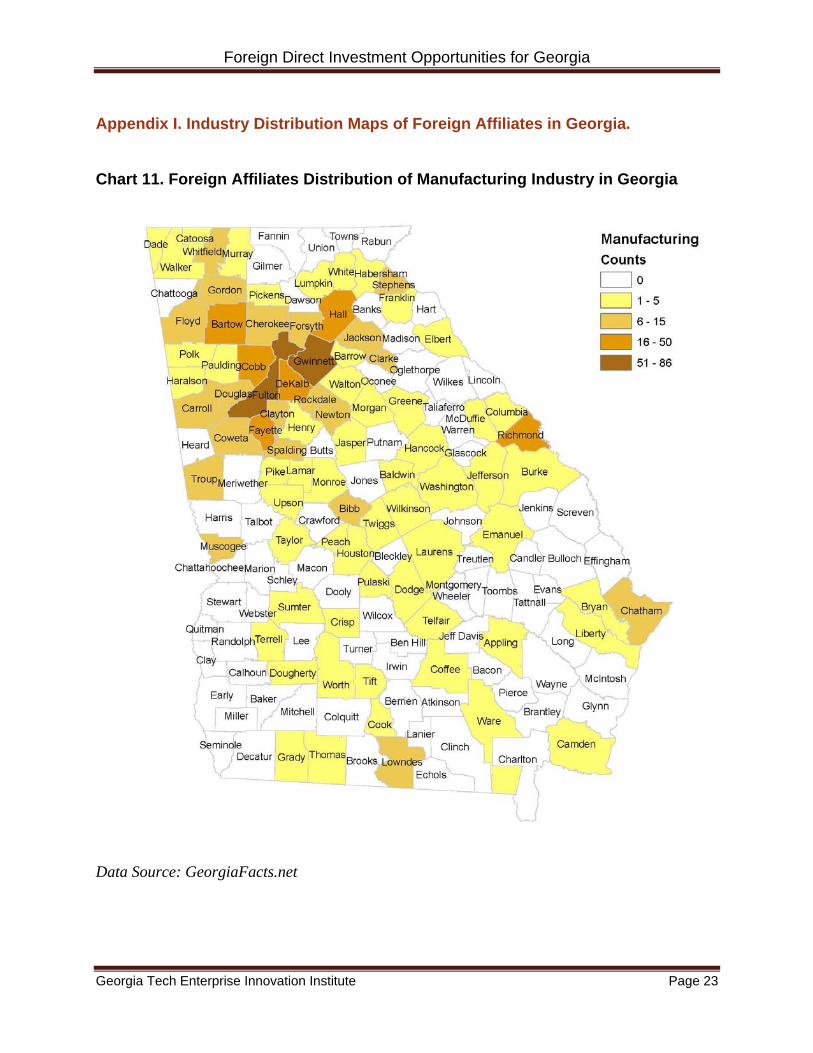
3.4 Industry Distribution of Foreign Affiliates in Georgia In order to compare how different industries spread throughout Georgia,
we plotted the distribution of foreign firms within the state for four different industries: manufacturing, research, service, transportation and distribution. (Appendix I)
These distribution maps are plotted according to the foreign firm density of counties in Georgia. Different colors represent different level of foreign company density in a county. All counties shaded in white color
Georgia Tech Enterprise Innovation Institute Page 18

Foreign Direct Investment Opportunities for Georgia
Georgia Tech Enterprise Innovation Institute Page 19
have no foreign companies. While the more foreign companies a county houses, the darker it is shaded.
As we can see in these maps, Atlanta Metropolitan area has the highest foreign firm density through all these four industries. However, there exist obvious different distribution patterns among different industries: while manufacturing foreign firms trend to spread throughout the whole state (Chart 11), research foreign companies seem to be more concentrated within Metro Atlanta area (Chart 12). For service industry, the location of foreign firms mostly distributed according to the population density (Chart 13). For transportation and distribution industry, outside the Metro Atlanta area, there are also a few counties along the east coast with relative more firm investment, like Chatham County and Glynn County, which are where the Savanna Seaport and Brunswick Seaport located.
3.5 Example of Recent Foreign Investment Finally, we will discuss a couple of recent foreign investment
opportunities in Georgia and try to find out the most attracting incentives of Georgia to foreign investors. One piece of news happened in manufacturing industry. The other is for service industry.1
3.5.1 Example of Foreign Investment in Manufacturing Industry In July 2009, Chemrec AB, a Swedish company, came to seek the
opportunity of turning Georgia mills into biorefineries with their own technologies.
The major interest of Georgia to them is our abundant forest resources and large number of pulp and paper mill. In fact, Georgia’s biggest asset is our forest resources. The state has 24.4 million acres of forest land, second in the U.S. only to Oregon. However, “many of Oregon’s forest are protected land, while most of Georgia’s are private owned and can be used for commercial enterprises” said Jill Stuctkey, the director of alternative fuels at the Georgia Environmental Facilities Authority.
Another big reason attracted them to Georgia is that they hoped our aggressive stance on biofuels would help us to win federal funding for creating biorefineries. In February 2009, there was a package of $787
1 Source: GlobalGoergia.com
There exist obvious different distribution patterns among different industries.
Georgia possesses abundant forest resources and shows potential in biofuels.

Foreign Direct Investment Opportunities for Georgia
Georgia Tech Enterprise Innovation Institute Page 20
million passed by the congress, which allocated $71 million for green incentives and $20 million more for green tax incentives.
3.5.2 Example of Foreign Investment in Service Industry In June 2009, a Chinese business magazine, Chinese Economic Review
chose Atlanta as its headquarter of North America, which would hopefully bring 20-30 new employment to Georgia.
When Mr. Earnshaw, the CEO of the magazine mentioned the reasons
of choosing Atlanta, he said: “Atlanta has always been a regional hub for
business. It is a well-known city with the headquarters of a lot of major companies, good human recourses, low costs of living and a direct flight to Shanghai via Delta.” (However, unfortunately, the flight from Atlanta to Shanghai has recently been suspended by Delta.) These factors are all key determinants to the growth of a business magazine.
They had also considered New York and San Francisco as alternative choices. But they could not compete with Georgia when comparing cost. In addition, "The Southeast already represents a huge market for Chinese goods; the Savannah port and surrounding counties are likely to see increased logistics business with China over the next few years," said Mr. Earnshaw.
[Type sidebar conteis
nt. A sidebar a standalone upplement to the
main document. It is ften aligned on the ft or right of the
cated at
ument. It is often aligned on the left or right of the page, or located at the top or bottom. Use the Text Box Tools tab to change the formatting of the sidebar text box.]
s
olepage, or lothe top or bottom. Use the Text Box Tools tab to changethe formatting of the sidebar text box.
Type sidebar content. A sidebar is a standalone supplement to the main doc
“Atlanta has always been a regional hub for business. It is a well-known city with the headquarters of a lot of major companies, good human recourses, and low costs of living.”
Foreign Direct Investment Opportunities for Georgia
Georgia Tech Enterprise Innovation Institute Page 21
4 Conclusion From the discussion above, we can tell that Georgia is strongly
competitive in attracting foreign investment. It is a traditional site for manufacturing industry with an existing big industry base. The population density here is above the country’s average, which provides plenty work force availability. The state’s transportation infrastructure is highly developed: within Metro Atlanta region, foreign investors are able to reach access to over 80% of the U.S. market within two days via road transportation; and the Atlanta International Airport also provides them a gateway to the global market. In addition, we have a favorable cost environment: both cost-of-living and cost-of-doing-business are lower than many other regions of the country. But there are still a lot of opportunities for Georgia to increase its competitiveness.
First, the previous comparative statistics between Georgia and the country’s average or other competing state show that Georgia has a lot of strengths in information and high technology industries, which could be listed as our target industries and promoted by policy and financial incentives.
Second, since the developing economies are playing more and more important roles in the global economic growth and is becoming more connected with Georgia, we should strengthen our ties with the emerging economies, especially those growth leaders, like the Asian tigers –China and India, and other Latin American countries.
Third, we should increase the international awareness of Georgia’s FDI potential, constructing the perception of Georgia’s openness to foreign investment, to make Georgia a more attracting location of FDI.
Finally, we should focus on activities that create the strongest potential for spillovers, like the linkages between foreign and domestic firms, education and training, and R&D industries, which would also bring benefits to the growth of domestic firms.
We hope the findings of this article would expand the knowledge about
FDI’s impacts that we can leverage to further Georgia’s economics
development, and provide policy implications that will be useful to
economic developers, governments, businesses, and other stakeholders in
Georgia as they consider FDI policies in the futures.
Georgia is strongly competitive in attracting foreign investment. But there are still a lot of opportunities to increase its competitiveness.
Foreign Direct Investment Opportunities for Georgia
References 1. Ari Kokko, Magnus Blomstrom, 1995, Polices to Encourage Inflows of Technology trough
Foreign Multinationals, World Development, Vol. 23, NO. 3
2. Bruce A. Blonigen, and Matthew J. Slaughter, 2001, Foreign-Affiliate Activity and U.S. Skill
Upgrading, The Review of Economics and Statistics, May 2001
3. Bruce A. Blonigen, Christopher J. Ellis, and Dietrich Fausten, 2003, Industrial Groupings
and Foreign Direct Investment, Working paper
4. Bruce A. Blonigen, 2005, The Review of the Empirical Literature on FDI Determinants,
Working paper
5. Cletus C. Coughlin, Joseph V. Terza, and Vachira Arromdee, 1991, State Characteristics and
the Location of Foreign Direct Investment within the United States, The Review of
Economics and Statistics
6. Cletus C. Coughlin, and Eran Segev, 2000, Location Determinants of New Foreign-Owned
Manufacturing Plants, Journal of Regional Science, Vol.40, NO. 2
7. John D. Daniels, and Lee H. Raderaugh, 1998, International Business, 9th edition
8. Joseph Friedman, Daniel Gerlowski, and Johnathan Silberman, 1992, What Attracts Foreign
Multinational Corporations? Evidence from Branch Plant Location in the United States,
Journal of Regional Science, Vol. 32, NO. 4
9. Marilyn Ibarra and Jennifer Koncz, 2008, Direct Investment Positions for 2007: Country and
Industry Detail, Survey of Current Business, July 2008
10. Organization for International Investment, March 2009, The Impact on the U.S. Economy of
Greenfield Projects by U.S. Subsidiaries of Foreign Companies: Top Projects for 2008
11. Thomas Anderson, 2008, U.S. Affiliates of Foreign Companies: Operations in 2006, Survey
of Current Business, August 2008
12. U.S. Department of Commerce, International Trade Administration, July 2008, Assessing
Trends and Policies of Foreign Direct Investment in the United States
13. Y. Louise Ku-Graf, 2008, Foreign Direct Investment in the United States: New Investment in
2007, Survey of Current Business, June 2008
14. Zeile, Shannon and Johnson, 1999, Regional Patterns in the Location of Foreign-Owned U.S.
Manufacturing Establishments, Survey of Current Business, May 1999
Georgia Tech Enterprise Innovation Institute Page 22
Foreign Direct Investment Opportunities for Georgia
Appendix I. Industry Distribution Maps of Foreign Affiliates in Georgia.
Chart 11. Foreign Affiliates Distribution of Manufacturing Industry in Georgia
Data Source: GeorgiaFacts.net
Georgia Tech Enterprise Innovation Institute Page 23

Foreign Direct Investment Opportunities for Georgia Chart 12. Foreign Affiliates Distribution of Research Industry in Georgia
Data Source: GeorgiaFacts.net
Georgia Tech Enterprise Innovation Institute Page 24

Foreign Direct Investment Opportunities for Georgia Chart 13. Foreign Affiliates Distribution of Service Industry in Georgia
Data Source: GeorgiaFacts.net
Georgia Tech Enterprise Innovation Institute Page 25
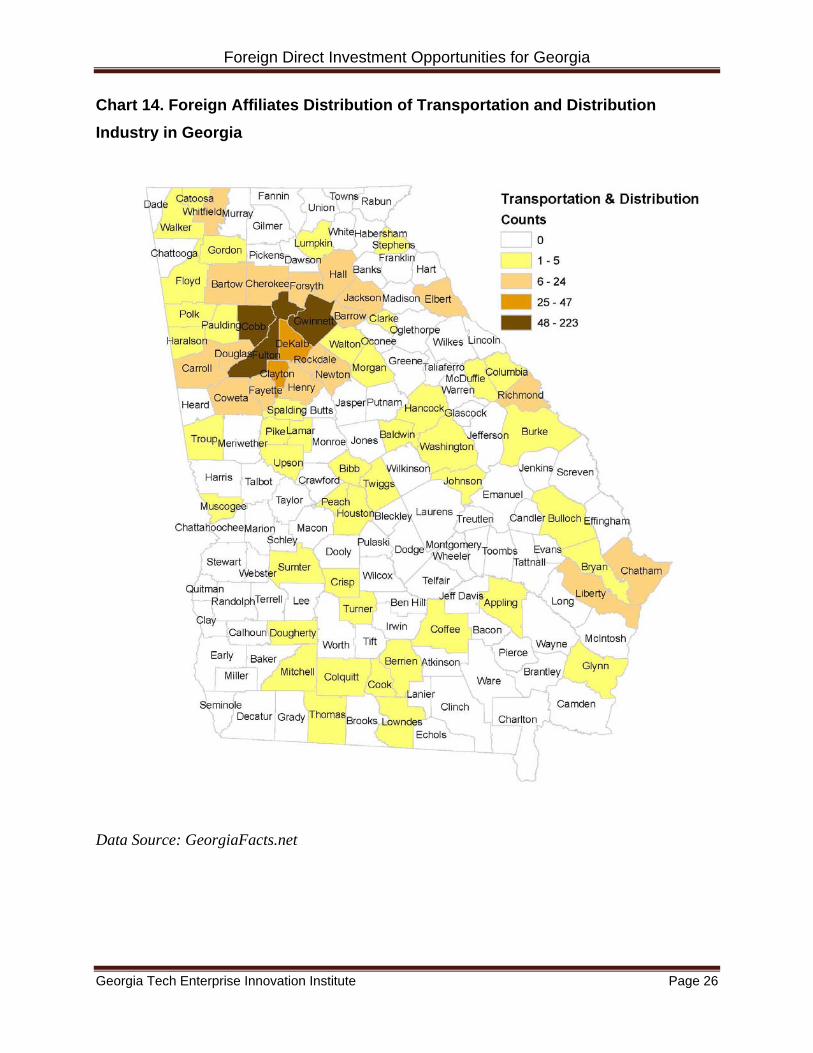
Foreign Direct Investment Opportunities for Georgia Chart 14. Foreign Affiliates Distribution of Transportation and Distribution Industry in Georgia
Data Source: GeorgiaFacts.net
Georgia Tech Enterprise Innovation Institute Page 26

Foreign Direct Investment Opportunities for Georgia Appendix II. Industry Classification by U.S. Bureau of Economic Analysis
1. Manufacturing
Food Animal foods Grain and oilseed milling Sugar and confectionery products Fruit and vegetable preserving and specialty foods Dairy products Meat products Seafood product preparation and packaging Bakeries and tortillas Other food products
Chemicals Basic chemicals Resins and synthetic rubber, fibers, and filaments Pharmaceuticals and medicines Soap, cleaning compounds, and toilet preparations Other
Pesticides, fertilizers, and other agricultural chemicals Paints, coatings, and adhesives Other chemical products and preparations
Primary and fabricated metals Primary metals
Iron and steel mills and ferroalloys Steel products from purchased steel Alumina and aluminum production and processing Nonferrous metal (except aluminum) production and processing Foundries
Fabricated metal products Forging and stamping Cutlery and handtools Architectural and structural metals Boilers, tanks, and shipping containers Hardware Spring and wire products Machine shops, turned products, and screws, nuts, and bolts Coating, engraving, heat treating and allied activities Other fabricated metal products
Machinery Agriculture, construction, and mining machinery Industrial machinery Other
Commercial and service industry machinery
Georgia Tech Enterprise Innovation Institute Page 27

Foreign Direct Investment Opportunities for Georgia
Ventilation, heating, air-conditioning, and commercial refrigeration equipment Metalworking machinery Engines, turbines, and power transmission equipment Other general purpose machinery
Computers and electronic products Computers and peripheral equipment Communications equipment Semiconductors and other electronic components Navigational, measuring, and other instruments Other
Audio and video equipment Magnetic and optical media
Electrical equipment, appliances, and components Electric lighting equipment Household appliances Electrical equipment Other electrical equipment and components
Transportation equipment Motor vehicles, bodies and trailers, and parts
Motor vehicles Motor vehicle bodies and trailers Motor vehicle parts
Other Aerospace products and parts Railroad rolling stock Ship and boat building Other transportation equipment
Other manufacturing Beverages and tobacco products
Beverages Tobacco products
Textiles, apparel, and leather products Textile mills Textile product mills Apparel Leather and allied products
Paper Pulp, paper, and paperboard mills Converted paper products
Printing and related support activities Petroleum and coal products
Integrated petroleum refining and extraction Petroleum refining excluding oil and gas extraction Asphalt and other petroleum and coal products
Plastics and rubber products Plastics products
Georgia Tech Enterprise Innovation Institute Page 28

Foreign Direct Investment Opportunities for Georgia
Rubber products Nonmetallic mineral products
Clay products and refractories Glass and glass products Cement and concrete products Lime and gypsum products Other nonmetallic mineral products Wood products Furniture and related products Miscellaneous manufacturing
Medical equipment and supplies Other miscellaneous manufacturing
2. Wholesale trade Motor vehicles and motor vehicle parts and supplies Electrical goods Petroleum and petroleum products Other
Other durable goods Furniture and home furnishings Lumber and other construction materials Professional and commercial equipment and supplies Metals and minerals (except petroleum) Hardware, and plumbing and heating equipment and supplies Machinery, equipment, and supplies Miscellaneous durable goods
Other nondurable goods Paper and paper products Drugs and druggists' sundries Apparel, piece goods, and notions Groceries and related products Farm product raw materials Chemical and allied products Beer, wine, and distilled alcoholic beverages Miscellaneous nondurable goods
Wholesale electronic markets and agents and brokers
3. Retail trade Food and beverage stores Other
Motor vehicle and parts dealers Furniture and home furnishings stores Electronics and appliance stores Building materials and garden equipment and supplies dealers Health and personal care stores Gasoline stations Clothing and clothing accessories stores Sporting goods, hobby, book, and music stores General merchandise stores Miscellaneous store retailers
Georgia Tech Enterprise Innovation Institute Page 29

Foreign Direct Investment Opportunities for Georgia
Nonstore retailers
4. Information Publishing industries
Newspaper, periodical, book, and database publishers Software publishers
Motion picture and sound recording industries Motion picture and video industries Sound recording industries
Telecommunications Wired telecommunications carriers Wireless telecommunications carriers (except satellite) Telecommunications resellers Satellite telecommunications Cable and other program distribution Other telecommunications
Other Broadcasting (except internet)
Radio and television broadcasting Cable and other subscription programming
Internet publishing and broadcasting Internet service providers, web search portals, and data processing services
Internet service providers and web search portals Data processing, hosting, and related services
Other information services
5. Depository institutions (banking) Banks Branches and agencies
6. Finance (except depository institutions) and insurance Finance, except depository institutions
Nondepository credit intermediation and related services Nondepository credit intermediation Activities related to credit intermediation
Securities, commodity contracts, and other intermediation and related activities Securities and commodity contracts intermediation and brokerage Other financial investment activities and exchanges
Funds, trusts, and other financial vehicles Insurance carriers and related activities
Insurance carriers, except life insurance carriers Life insurance carriers Agencies, brokerages, and other insurance related activities
7. Real estate and rental and leasing Real estate Rental and leasing (except real estate)
Automotive equipment rental and leasing Other rental and leasing services Lessors of nonfinancial intangible assets (except copyrighted works)
Georgia Tech Enterprise Innovation Institute Page 30

Foreign Direct Investment Opportunities for Georgia
8. Professional, scientific, and technical services Architectural, engineering, and related services Computer systems design and related services Management, scientific, and technical consulting Other
Legal services Accounting, tax preparation, bookkeeping, and payroll services Specialized design services Scientific research and development services Advertising and related services Other professional, scientific, and technical services
9. Other industries Agriculture, forestry, fishing, and hunting
Crop production Animal production Forestry and logging Fishing, hunting, and trapping Support activities for agriculture and forestry
Mining Oil and gas extraction Mining (except oil and gas)
Coal mining Metal ore mining
Iron ores Gold and silver ores Copper, nickel, lead, and zinc ores Other metal ores
Nonmetallic mineral mining and quarrying Support activities for mining
Support activities for oil and gas extraction Support activities for mining, except for oil and gas extraction
Utilities Electric power generation, transmission, and distribution Natural gas distribution Water, sewage, and other systems
Construction Construction of buildings Heavy and civil engineering construction Special trade contractors
Transportation and warehousing Air transportation Rail transportation Water transportation
Petroleum tanker operations Other water transportation
Truck transportation Transit and ground passenger transportation Pipeline transportation
Georgia Tech Enterprise Innovation Institute Page 31

Foreign Direct Investment Opportunities for Georgia
Georgia Tech Enterprise Innovation Institute Page 32
Pipeline transportation of crude oil, refined petroleum products, and natural gas Other pipeline transportation
Scenic and sightseeing transportation Support activities for transportation Couriers and messengers Warehousing and storage
Petroleum storage for hire Other warehousing and storage
Holding companies (nonbank) Holding companies (nonbank) excluding management offices Corporate, subsidiary, and regional management offices
Administration, support, and waste management Administrative and support services
Office administrative services Facilities support services Employment services Business support services Travel arrangement and reservation services Investigation and security services Services to buildings and dwellings Other support services
Waste management and remediation services Health care and social assistance
Ambulatory health care services Hospitals Nursing and residential care facilities Social assistance
Accommodation and food services Accommodation Food services and drinking places
Miscellaneous services Educational services Arts, entertainment, and recreation
Performing arts, spectator sports, and related industries Museums, historical sites, and similar institutions Amusement, gambling, and recreation industries
Other services (except public administration and private households) Repair and maintenance Personal and laundry services Religious, grantmaking, civic, professional, and similar organizations