Embed Size (px)
Citation preview
This article was downloaded by: [daniel sotelsek]On: 28 May 2014, At: 01:17Publisher: RoutledgeInforma Ltd Registered in England and Wales Registered Number: 1072954 Registeredoffice: Mortimer House, 37-41 Mortimer Street, London W1T 3JH, UK
Latin American Business ReviewPublication details, including instructions for authors andsubscription information:http://www.tandfonline.com/loi/wlab20
Foreign Direct Investment andProductivity Spillovers: Firm-LevelEvidence From Chilean Industrial SectorLeopoldo Laborda Castillo a , Daniel Sotelsek Salem b & Justo deJorge Moreno ba World Bank and Institute of Latin American Studies , University ofAlcalá, Madrid , Spainb Institute of Latin American Studies, University of Alcalá , Madrid ,SpainPublished online: 21 May 2014.
To cite this article: Leopoldo Laborda Castillo , Daniel Sotelsek Salem & Justo de Jorge Moreno (2014)Foreign Direct Investment and Productivity Spillovers: Firm-Level Evidence From Chilean IndustrialSector, Latin American Business Review, 15:2, 93-122, DOI: 10.1080/10978526.2014.905152
To link to this article: http://dx.doi.org/10.1080/10978526.2014.905152
PLEASE SCROLL DOWN FOR ARTICLE
Taylor & Francis makes every effort to ensure the accuracy of all the information (the“Content”) contained in the publications on our platform. However, Taylor & Francis,our agents, and our licensors make no representations or warranties whatsoever as tothe accuracy, completeness, or suitability for any purpose of the Content. Any opinionsand views expressed in this publication are the opinions and views of the authors,and are not the views of or endorsed by Taylor & Francis. The accuracy of the Contentshould not be relied upon and should be independently verified with primary sourcesof information. Taylor and Francis shall not be liable for any losses, actions, claims,proceedings, demands, costs, expenses, damages, and other liabilities whatsoever orhowsoever caused arising directly or indirectly in connection with, in relation to or arisingout of the use of the Content.
This article may be used for research, teaching, and private study purposes. Anysubstantial or systematic reproduction, redistribution, reselling, loan, sub-licensing,systematic supply, or distribution in any form to anyone is expressly forbidden. Terms &Conditions of access and use can be found at http://www.tandfonline.com/page/terms-and-conditions
Foreign Direct Investment and ProductivitySpillovers: Firm-Level Evidence From
Chilean Industrial Sector
LEOPOLDO LABORDA CASTILLOWorld Bank and Institute of Latin American Studies,
University of Alcala, Madrid, Spain
DANIEL SOTELSEK SALEM and JUSTO DE JORGE MORENOInstitute of Latin American Studies, University of Alcala, Madrid, Spain
ABSTRACT. Using firm-level panel data, this article examineswhether spillovers from foreign direct investment (FDI) make acontribution to productivity growth in Chilean manufacturingfirms. The main contribution of this work is to apply a methodologyto estimate, in a consistent manner, the productivity impactof investment climate variables, such as FDI. With this aim, thespillover effects from FDI are analyzed using a stochastic frontierapproach (SFA). Productivity growth is decomposed using a gener-alized Malmquist output-oriented index. The results show positiveproductivity spillovers from FDI; higher competition is associatedwith larger spillovers; and firms with high R&D effort gain morespillover benefits compared to those with less R&D effort.
RESUMEN. En este trabajo se examina si los ‘‘derrames’’ o extern-alidades positivas derivadas de la Inversion Extranjera Directa(IED) contribuyen al crecimiento de la productividad para unpanel de datos de empresas manufactureras chilenas. La principalcontribucion de este trabajo es la aplicacion de una metodologıapara estimar, de manera consistente, el impacto en la productivi-dad de variables relacionadas con el clima de inversion, comopor ejemplo la IED. Para ello, los derrames de la IED han sidoanalizados mediante un enfoque de frontera estocastica (SFA).
Received August 4, 2012; revised December 5, 2012; accepted November 12, 2013.Address correspondence to Leopoldo Laborda Castillo, Institute of Latin American
Studies, University of Alcala c= Trinidad n� 1, Colegio de Trinitarios, Alcala de Henares,28801 Madrid, Spain. E-mail: [email protected]
Latin American Business Review, 15:93–122, 2014Copyright # Taylor & Francis Group, LLCISSN: 1097-8526 print=1528-6932 onlineDOI: 10.1080/10978526.2014.905152
93
Dow
nloa
ded
by [
dani
el s
otel
sek]
at 0
1:17
28
May
201
4
Adicionalmente, el crecimiento de la productividad es descom-puesto mediante un ındice de produccion de Malmquist orientadoal output. Los resultados muestran la existencia de derrames positi-vos en terminos de productividad debidos a la IED; ası mismo,mayor competencia se asocia con derrames mas grandes, y lasempresas con un esfuerzo elevado en IþD obtienen mayores der-rames en comparacion con aquellas con menor esfuerzo en IþD.
RESUMO. Este trabalho examina se os benefıcios economicosindiretos, ou ‘spillovers,’ de investimento estrangeiro direto (IED)contribuem para o aumento de produtividade nas empresas chile-nas de manufatura que usam dados de empresas em painel. Aprincipal contribuicao deste trabalho e a aplicacao de uma meto-dologia para avaliar de maneira consistente o impacto na produti-vidade de variaveis no ambiente dos investimentos, como o IED.Para isso os efeitos do ‘spillover’ de IED sao analisados usando-seuma abordagem de fronteira estocastica (SFA). O aumento daprodutividade e decomposto usando-se um ındice Malmquist gen-eralizado voltado para o ‘output.’ Os resultados mostram spilloverspositivos de produtividade que resultam do IED; uma maior compe-ticao e associada com maiores ‘spillovers’ e empresas que fazem ummaior esforco em P&D obtem mais benefıcios de ‘spillover’ do que asque fazem menos esforco para desenvolver P&D.
KEYWORDS. foreign direct investment, industrial sector, Malm-quist index, productivity spillovers
INTRODUCTION
Foreign direct investment (FDI) is believed to provide recipient countries withknowledge transfer as well as capital. The expectations to obtain productivityspillovers through knowledge transfers have led to the development ofpolicies oriented toward the generation of favorable framework of FDI innumerous countries. In this situation, it is important to ask ourselves, doesFDI lead to productivity spillovers? In order to answer this question, severalstudies have been conducted in Latin American countries. For example,Kokko, Tansini, and Zejan (2001) examined intra-industry spillovers fromFDI in Uruguayan manufacturing plants in 1988. Chudnovsky, Lopez, andRossi (2008) assessed the amounts of FDI inflows in Argentina during the1990s; Waldkirch (2010) analyzed the FDI in Mexico since the inception ofthe North American Free Trade Agreement; and Fernandes and Paunov(2012) examined the impact of substantial FDI inflows of producer service sec-tors in relation to the total factor productivity of Chilean manufacturing firms.
94 L. Laborda Castillo et al.
Dow
nloa
ded
by [
dani
el s
otel
sek]
at 0
1:17
28
May
201
4
Taking into account these findings and motivated by additional resultsin the extant literature, this article specifies the conditions under whichindustries added efficiency (productivity of the factors) as well as whetherspillovers from FDI contribute to productivity growth. In others words, ouranalysis extends this research and sheds light on the need to distinguish localestablishment characteristics when discussing potential benefits from FDI.
The main contribution of this work is to apply a methodology in order toestimate, in a consistent manner, the productivity impact of investment climatevariables, such as FDI. To do this, we apply the methodology to the data col-lected for investment climate assessments (ICA) surveys at firm level in Chile(focusing on the industrial sector).1 We have panel data (T¼ 3) for 2001, 2002,and 2003 from Chile’s ICA survey. Methodologically, we make use of thestochastic frontier analysis (SFA) as a robust parametric approach to estimateFDI productivity spillovers in Chilean manufacturing firms. To measure Chile’sIT services productivity we apply the method of data envelopment analysisand compute the Malmquist index to decompose the total factor productivity(TFP) growth into technical efficiency change (TEC), technological progress(TP), and scale efficiency change (SEC). The results show positive productivityspillovers from FDI—such that higher competition is associated with largerspillovers, and firms with high research and development (R&D) effort gainmore spillover benefits compared to those with less R&D effort.
This research is organized as follows. First, we present the frameworkproposed to analyze the relationship between technical FDI and productivityspillovers in the context of the Chilean industrial sector. Following is a criticalreview of the theoretical and empirical studies on productivity spillovers.Next, we develop a methodology of analysis: we will discuss estimation tech-niques followed by data sources and variable construction. The followingsection presents the main empirical results obtained. The main conclusionsand a brief discussion end the article, which leads into an explanation ofcertain policy implications.
THEORETICAL BACKGROUND AND HYPOTHESIS
Productivity—understood as the capacity an economy (company or business)has to obtain the greatest advantage of inputs with respect to the generatedoutput—is a long-existing concern. A first approach was to try to understand,in the most thorough way possible, the productivity of production factors,since this allowed us to evaluate the quality of an economy’s growth or theproduction of a company. In this context, the empirical literature studyingthe relationship between FDI, productivity, and growth is voluminous andconstantly expanding. Recent works, such as Contessi and Weinberger(2009) or Wooster and Diebel (2010), reviewed the empirical literatureon technology spillovers from FDI in developing countries. Contessi and
Foreign Direct Investment and Productivity Spillovers 95
Dow
nloa
ded
by [
dani
el s
otel
sek]
at 0
1:17
28
May
201
4
Weinberger reviewed the empirical literature that studies the relationshipbetween FDI, productivity, and growth using aggregate data; they focusedon two main questions: (i) whether there is evidence of a positive relationshipbetween FDI and national growth, and (ii) whether the output of ‘‘multina-tional sectors’’ exhibits higher labor productivity. The authors discussedhow microeconomic evidence and a number of aggregation and compositionproblems might help explain the ambiguous results obtained in this literature.Wooster and Diebel used a sample of 32 studies to determine which aspects ofstudy design and data characteristics explain the magnitude, significance, anddirection of spillovers from FDI. Results suggest (i) that spillover effects aremore pronounced when studies measure the effect of FDI spillovers on out-put, and they are more likely to be significant and positive for Asian countries;(ii) and that the possibility that the documented spillover effects from FDI indeveloping countries may be partly a product of model misspecification.
Most of the previous studies on FDI spillovers treat the specific mechan-isms of productivity spillovers as occurring in a ‘‘black box’’ (Gorg & Strobl,2001). These studies often assume that productivity spillovers from FDI occurautomatically because of foreign firms’ presence in domestic markets. Chan-nels of productivity spillovers are not explicitly taken into account in suchstudies. However, some studies make serious attempts to take into accountthe channels of productivity spillovers from FDI. According to Blomstromand Kokko (1998) and Kokko (1996), four fundamental mechanisms forproductivity spillovers have been derived:
1. Demonstration-imitation effect: Foreign firms in domestic markets cancreate demonstration effects upon domestic firms through direct imitationand reverse engineering (Das, 1987), or by means of innovation arisingfrom R&D (Cheung, 2010). In the words of Ornaghi (2002),demonstration-imitation effects occur if there are arms’ length relation-ships between multinational corporations (MNCs) and domestic firms.Domestic firms absorb more advanced production technologies and otherknowledge from MNCs. Ornaghi pleaded for the differentiation betweenchannels of technology spillovers in the case of process and productinnovations. The most important forms are imitation of managerial andorganizational innovation as well as imitation of technology.
2. Competition effect: The entry of MNCs may lead to greater competition indomestic markets, which then forces domestic firms to use their resourcesand technology in more efficient ways, thus leading to productivitygains (Wang & Blomstrom, 1992). According to Smarzynska (2003), thecompetition effect is when competition from MNCs force domestic rivalsto update production technologies and techniques to become more pro-ductive. The foreign linkage effect relates to export spillovers. Finally,Smarzynska distinguished between knowledge (copying technologiesof foreign affiliates, observation, or hiring workers trained by foreign
96 L. Laborda Castillo et al.
Dow
nloa
ded
by [
dani
el s
otel
sek]
at 0
1:17
28
May
201
4
subsidiaries) and competition spillovers (MNC entry leads to more severecompetition and forces domestic firms to higher efficiency and search fornew technologies).
3. Foreign linkage effect: Foreign firms in domestic markets may also createproductivity spillovers to domestic firms through foreign linkage effects.According to Rodriguez-Clare (1996), foreign linkage effects may occurbecause MNCs give access to new specialized intermediate inputs orbecause domestic firms use local intermediate goods’ suppliers, whoseproductivity has been raised through the expertise of the MNC.
4. Training effect: Knowledge may spillover to domestic firms via labor turn-over; that is, when workers trained by multinational corporations move todomestic firms and bring with them the knowledge and other crucialintangible assets (Fosfuri, Motta, & Rønde, 2001). Gorg and Greenaway(2004) distinguished two mechanisms of the training effect: direct spil-lovers through complementary workers, and indirect mechanism whenworkers move and transfer knowledge between foreign and domesticfirms. According to Gorg and Strobl (2005), training effects take place ifthere are movements of highly skilled personnel from MNCs to domesticfirms. These employees may take with them knowledge that may beusefully applied in the domestic firm.
Heterogeneity of Domestic Firms and Industry Competition: SomeHypotheses
Industry competition and heterogeneity of domestic firms as determinants ofknowledge and FDI spillovers relates primarily to their technological capacity,human capital, and productivity. According to the empirical evidence, thesefactors determine domestic firms’ absorption capacity for knowledge andFDI spillovers. Our hypotheses are:
H1: High levels of competition (in terms of low Herfindahl-Hirschmanindex of industry concentration), positively influences spilloversfrom FDI (measured by the share of foreign firms’ output over totaloutput in the sector of activity).
Our first hypothesis relates to industry competition. According tothis hypothesis, higher competition is associated with larger spilloversfrom foreign presence in the industry; that is, positive productivity throughcompetition.
Competition may result in either positive or negative productivityspillovers for domestic firms. Aitken and Harrison (1999) argued that in theshort-run, the presence of foreign firms in an imperfect competition domesticmarket might raise the average cost of production of domestic firms throughthe ‘‘market stealing’’ phenomenon. Foreign firms with a lower marginal cost
Foreign Direct Investment and Productivity Spillovers 97
Dow
nloa
ded
by [
dani
el s
otel
sek]
at 0
1:17
28
May
201
4
have an incentive to increase production relative to their domestic compet-itors. The productivity of domestic firms will fall, as they have to spread fixedcosts over a smaller amount of output.
However, in the end, when all costs can be treated as variable costs, thereis a possibility for domestic firms to reduce their costs by allocating theirresources more efficiently and imitating foreign firms’ knowledge (Wang &Blomstrom, 1992). If the efficiency effect from foreign presence is larger thanthe competition effect, there can be positive productivity spillovers.
The predominance of liberalization-oriented policies over the past yearsversus policies oriented toward engaging FDI have meant a huge decrease interms of market concentration. However, industry structure remains animportant control variable to be included in this study of FDI and productivityspillovers.
Some studies found country-by-country empirical evidence supportingthis hypothesis in relation with industry competition. For example, in a studyconducted in Morocco, although Haddad and Harrison (1993) found noevidence of technology spillovers, the increased competition by foreigninvestors seemed to push local firms toward the best practice frontier inindustries with a low level of technology. On the other hand, Blomstrom,Kokko, and Zejan (1994), in a study conducted in Mexico, found that localcompetition correlates positively to imports of technology by MNEs.
H2: The level of R&D effort (defined as the total expenditures on R&Ddivided by the total sales) positively influences spillovers from FDI(measured by the share of foreign firms’ output over total outputin the sector of activity).
Our second hypothesis relates to the level of technological devel-opment=technological capacity. According to this hypothesis, firms withR&D expenditure gain more productivity spillovers from FDI than thosewithout R&D expenditure.
The mixed evidence of productivity spillovers leads to the argument thatfirm-specific characteristics (or absorptive capacity) may influence the abilityof domestic firms to gain productivity spillovers from FDI (Findlay, 1978;Glass & Saggi, 1998; Wang & Blomstrom, 1992). The most commonly usedmeasure of absorptive capacity is expenditure on R&D. Kathuria (2000) foundevidence in a study on an Indian manufacturing firm that local firms that investin learning or R&D activities receive high productivity spillovers, whereas thenon-R&D local firms do not gain much from the presence of foreign firms.This result indicates that productivity spillovers are not automatic conse-quences of the presence of foreign firms; rather, they depend on the effortsof local firms investing in R&D activities. Kinoshita (2001) found similar evi-dence in a study on Czech manufacturing firms, during 1995–1998. In a morerecent study of 12 Organisation for Economic Co-operation and Development
98 L. Laborda Castillo et al.
Dow
nloa
ded
by [
dani
el s
otel
sek]
at 0
1:17
28
May
201
4
countries, Griffith, Redding, and Van Reenen (2004) confirmed that R&Dplays an important role in knowledge transfer, besides its role as a meansof innovation.
Some studies found country-by-country empirical evidence of thishypothesis, in relation with the level of technological development=techno-logical capacity. For example, Perez (1998), in a study conducted in the Uni-ted Kingdom and Italy, found that firms with a lower technological gap thantheir competitors experienced positive effects of increased foreign presence.Girma, Gong, and Gorg (2006), in a study conducted in China, found thatfirms that invest in R&D have positive FDI spillovers. Halpern and Murakozy(2007), in a study conducted in Hungary, found that firms with technology orR&D spending that is more advanced are likely to benefit more from the pres-ence of foreign firms. Finally, Abraham, Konings, and Slootmaekers (2010), ina study conducted in China, found that firms far away from the technologicalfrontier do not benefit from the presence of foreign firms, while firms operat-ing close to the frontier enjoy positive spillovers (manufacturing).
H3: The level of human capital (defined as the percentage of theworkforce with some university or higher education level) positivelyinfluences spillovers from FDI (measured by the share of foreignfirms’ output over total output in the sector of activity).
Our third hypothesis relates to the level of human capital. According tothis hypothesis, there is a positive productivity spillover from FDI. Accordingto Caves (1971), when MNCs establish subsidiaries overseas, they experiencedisadvantages in the form of access to resources and domestic demand,when compared to their local counterparts. In order to compete with dom-estic firms, MNCs need to possess superior knowledge. With this superiorknowledge, MNCs are often assumed to have higher performance levels thandomestic firms, in particular being more efficient and productive.
Some studies found country-by-country empirical evidence of thishypothesis, in relation to human capital. For example, Girma and colleagues(2006), in a study conducted in China, found that firms that invest in humancapital experience positive FDI spillovers. Gorodnichenko, Svejnar, andTerrell (2007), in a study conducted in Eastern Europe, found that firms witha higher educated workforce gain from the presence of foreign firms in theirindustry. Finally, Damijan, Rojec, Majcen, and Knell (2008), in a study conduc-ted also in Eastern Europe, found that Spillovers substantially depend on theabsorptive capacity of local firms measured by the level of human capital.
H4: The level of spillovers from FDI (measured by the share of foreignfirms’ output over total output in the sector of activity) positively influ-ences the change in the productivity growth and in their components(technical efficiency, technological progress, and scale efficiency).
Foreign Direct Investment and Productivity Spillovers 99
Dow
nloa
ded
by [
dani
el s
otel
sek]
at 0
1:17
28
May
201
4
Finally, our fourth hypothesis relates to productivity level. According tothis hypothesis, there are positive FDI spillovers to each component of pro-ductivity growth (TEC, TP, and SEC). According to Salim and Bloch (2009),the empirical studies usually assume that productivity advantage from FDIis exclusively contributed by technology transfers, because it is consistent withthe use of a conventional approach of production function. However, techni-cal and scale efficiencies have scarcely been studied in relation to productivitygains from FDI. In this context, Smeets (2008) argued that productivityspillovers from FDI should be defined broadly, as they are the result of newknowledge and not of new technology alone. Smeets defined knowledge asincluding technological managerial and production skills, which may contrib-ute to technical efficiency and the ability to exploit scale efficiency.
Some studies have found country-by-country empirical evidence of thishypothesis in relation to level of productivity. For example, Haskel, Pereira,and Slaughter (2007) in a study conducted in the United Kingdom, found thatless productive (and smaller) plants received, on average, stronger FDI spil-lovers than more productive (and larger) plants. Castellani and Zanfei, (2003)in a study conducted in Southern Europe, found that high productivity gapstended to favor positive effects of FDI. Examining Southern European firms,Damijan and colleagues (2008) found that FDI spillovers depend on theproductivity level of individual firms. Finally, Keller and Yeaple (2009), ina study conducted in the United States, found that relatively high productivityis required for a firm to acquire FDI-related spillovers.
METHOD
Estimation Techniques: Stochastic Frontier Analysis andMalmquist Index
This subsection proposes a brief assessment methodology for productivityspillovers in order to examine when spillovers from FDI contribute to pro-ductivity growth. The spillover effects from FDI will be analyzed using anSFA approach (Kumbhakar & Lovell, 2003). This approach uses the stochasticfrontier production function, following the guidelines set by Battese andCoelli (1988, 1993, 1995), and a generalized Malmquist output-oriented indexto decompose productivity growth (Orea, 2002). For more detailed andformal discussion, see Appendices A and B.
According to a number of authors (Aigner, Lovell, & Schmidt 1977;Meeusen & Van den Broeck, 1977), the production frontier model withouta random component can be written as yi¼ f(xi; b) � TEi, where yi is theobserved scalar output of the producer i, xi is a vector of N inputs used bythe producer i, f(xi; b) is the production frontier, and b is a vector of tech-nology parameters to be estimated. Finally TEi denotes the technical efficiencydefined as the ratio of observed output to maximum feasible output.2
100 L. Laborda Castillo et al.
Dow
nloa
ded
by [
dani
el s
otel
sek]
at 0
1:17
28
May
201
4
A stochastic component that describes random shocks affecting theproduction process is added. These shocks are not directly attributable tothe producer or the underlying technology. These shocks may come fromweather changes, economic adversities, or plain luck. We denote theseeffects with expfvig. Each producer is facing a different shock, but weassume the shocks are random and are described by a common distribution.The stochastic production frontier will become: yi¼ f(xi;b) � TEi � expfvig. Ifwe assume that TEi is also a stochastic variable, with a specific distributionfunction, common to all producers, we can also write it as an exponentialTEi¼ expf�uig, where ui� 0, since we required TEi� 1. As a result, weobtain the equation: yi¼ f(xi; b) � expf�uig � expfvig.
Finally, if we also assume that f(xi;b) takes the log-linear Cobb-Douglasform,3 the model can be written as ln yi¼ b0þ
Pnbn ln xiþ vi�ui, where vi
is the ‘‘noise’’ component, which we will almost always consider as atwo-sided normally distributed variable, and ui is the non-negative technicalinefficiency component. Together they constitute a compound error term,with a specific distribution to be determined, hence the name of ‘‘composederror model’’ to which it is often referred.
On the other hand, the Malmquist Productivity Index (MPI) is a bilateralindex that can be used to compare the production technology of two firms.This index is also based on the concept of production function. In otherworks, the MPI is a function of maximum possible production, with respectto a set of inputs pertaining to capital and labor.
If we define Sa as the set of labor and capital inputs to the productionfunction of firm A, and Q as the production function of firm A, we could writeQ¼ fa(Sa). To calculate the MPI of firm A with respect to firm B, we must sub-stitute the labor and capital inputs of firm A into the production function of B,and vice versa. The expression for MPI is MPI ¼
ffiffiffiffiffiffiffiffiffiffiffiQ1Q2ð ÞQ3Q4ð Þ
q, where Q1¼ fa(Sa),
Q2¼ fa(Sb), Q3¼ fb(Sa), and Q4¼ fb(Sa).
Variables and Instruments
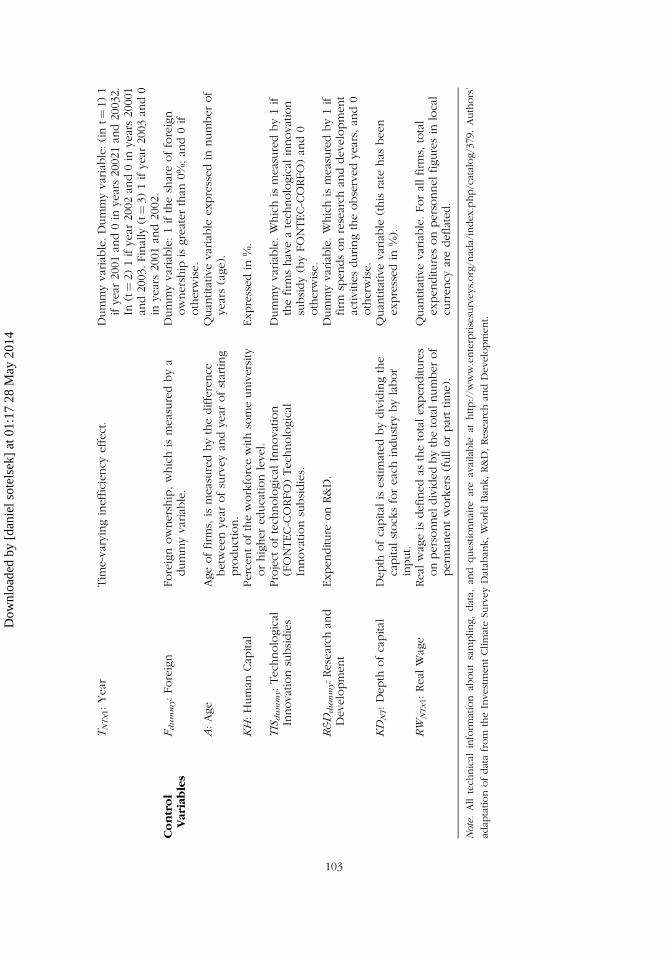
Table 1 presents a summary of the key variables used to empirically validatethe combined stochastic-inefficiency model for Chilean manufacturingindustries. Similar variables have been used by Escribano and Guasch(2005), who compared cross-country performances in Guatemala, Honduras,and Nicaragua. As shown in Table 1, the variables used in this study wereclassified into three groups: (1) variables that define the production frontier,(2) variables that define the term of inefficient production frontier, and (3)control variables for the second stage analysis.
In the first group, value added was collected (in terms of value of grossoutput minus intermediate inputs) as output and as inputs, capital stock (interms of Net book value of Machinery and equipment), and work (in termsof total number of permanent workers). In the second group the existence
Foreign Direct Investment and Productivity Spillovers 101
Dow
nloa
ded
by [
dani
el s
otel
sek]
at 0
1:17
28
May
201
4
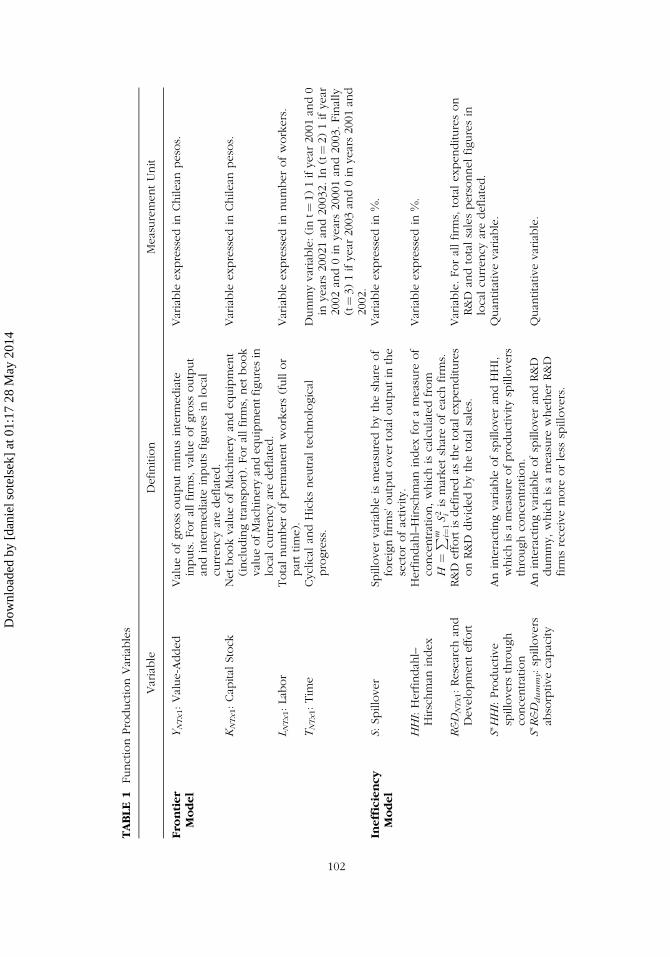
TABLE1
FunctionProductionVariables
Variable
Definition
MeasurementUnit
Fro
ntier
Model
YN
Tx1:Value-Added
Valueofgross
outputminusinterm
ediate
inputs.Forallfirm
s,valueofgross
output
andinterm
ediate
inputs
figuresin
local
currency
aredeflated.
Variable
expressedin
Chilean
pesos.
KN
Tx1:Cap
ital
Stock
NetbookvalueofMachinery
andequipment
(includingtran
sport).Forallfirm
s,netbook
valueofMachinery
andequipmentfiguresin
localcu
rrency
aredeflated.
Variable
expressedin
Chilean
pesos.
L NT
x1:Labor
Totalnumberofperm
anentworkers
(fullor
parttime).
Variable
expressedin
numberofworkers.
TN
Tx1:Tim
eCyclical
andHicksneutral
tech
nological
progress.
Dummyvariable:(int¼
1)1ifyear
2001an
d0
inyears20021an
d20032.In
(t¼2)1ifyear
2002an
d0in
years20001an
d2003.Finally
(t¼3)1ifyear
2003an
d0in
years2001an
d2002.
Inefficiency
Model
S:Sp
illover
Spillovervariable
ismeasuredbytheshareof
foreignfirm
s’outputovertotaloutputin
the
sectorofactivity.
Variable
expressedin
%.
HH
I:Herfindah
l–Hirschman
index
Herfindah
l–Hirschman
indexforameasure
of
concentration,whichiscalculatedfrom
H¼
P m i¼1
S2 iismarketshareofeachfirm
s.
Variable
expressedin
%.
R&
DN
Tx1:Research
and
Developmenteffort
R&D
effortisdefinedas
thetotalexpenditures
onR&D
dividedbythetotalsales.
Variable.Forallfirm
s,totalexpenditureson
R&D
andtotalsalespersonnelfiguresin
localcu
rrency
aredeflated.
S�H
HI:Productive
spillovers
through
concentration
Aninteractingvariable
ofspilloveran
dHHI,
whichisameasure
ofproductivityspillovers
throughco
ncentration.
Quan
titativevariable.
S�R
&D
du
mm
y:spillovers
absorptivecapacity
Aninteractingvariable
ofspilloveran
dR&D
dummy,whichisameasure
whetherR&D
firm
sreceivemore
orless
spillovers.
Quan
titativevariable.
102
Dow
nloa
ded
by [
dani
el s
otel
sek]
at 0
1:17
28
May
201
4
TN
Tx1:Year
Tim
e-varyinginefficiency
effect.
Dummyvariable.Dummyvariable:(int¼
1)1
ifyear
2001an
d0in
years20021an
d20032.
In(t¼2)1ifyear
2002an
d0in
years20001
and2003.Finally
(t¼3)1ifyear
2003an
d0
inyears2001an
d2002.
Control
Variables
Fd
um
my:Foreign
Foreignownership,whichismeasuredbya
dummyvariable.
Dummyvariable:1iftheshareofforeign
ownership
isgreaterthan
0%;an
d0if
otherw
ise.
A:Age
Ageoffirm
s,ismeasuredbythedifference
betw
eenyear
ofsurveyan
dyear
ofstarting
production.
Quan
titativevariable
expressedin
numberof
years(age).
KH:Human
Cap
ital
Percentoftheworkforcewithsomeuniversity
orhighereducationlevel.
Expressedin
%.
TIS
du
mm
y:Tech
nological
Innovationsubsidies
Project
oftech
nological
Innovation
(FONTEC-CORFO)Tech
nological
Innovationsubsidies.
Dummyvariable.Whichismeasuredby1if
thefirm
shaveatech
nological
innovation
subsidy(byFONTEC-CORFO)an
d0
otherw
ise.
R&
Dd
um
my:Research
and
Development
Expenditure
onR&D.
Dummyvariable.Whichismeasuredby1if
firm
spendsonresearch
anddevelopment
activitiesduringtheobservedyears,an
d0
otherw
ise.
KD
NT:Depth
ofcapital
Depth
ofcapital
isestim
atedbydividingthe
capital
stocksforeachindustry
bylabor
input.
Quan
titativevariable
(thisrate
has
been
expressedin
%).
RW
NT
x1:Real
Wage
Real
wageisdefinedas
thetotalexpenditures
onpersonneldividedbythetotalnumberof
perm
anentworkers
(fullorparttime).
Quan
titativevariable.Forallfirm
s,total
expendituresonpersonnelfiguresin
local
currency
aredeflated.
Note
.Alltech
nical
inform
ation
aboutsampling,data,
and
questionnaire
areavailable
athttp://w
ww.enterprisesurveys.org/nad
a/index.php/catalog/379.Authors’
adap
tationofdatafrom
theInvestm
entClimateSu
rveyDatab
ank,WorldBan
k,R&D,Research
andDevelopment.
103
Dow
nloa
ded
by [
dani
el s
otel
sek]
at 0
1:17
28
May
201
4
of spillovers (in terms of share of foreign firms’ output over total output inthe sector of activity), the level of industrial concentration (in terms ofHerfindahl–Hirschman index), effort in R&D (in terms of total expenditureson R&D divided by the total sales), and the temporary effect of these variablesare recorded. Finally, in the last set of control variables, the profile that char-acterizes the companies in terms of Foreign ownership, Age, Human capital,Expenditure on research and development, Depth of capital (estimated by
TABLE 2 Number of Firms and Percentage by Sector (2001–2003)
Sector Number of Firms %
Biotechnology 176 23.44Chemicals 94 12.52Farm and Fishing 96 12.78Food and Beverages 41 5.46IT Services 79 10.52Machinery and Equipment 43 5.73Metal Products 159 21.17Paper Production 15 2Wood and Cork Production 48 6.39Total 751 100.00
Note. Authors’ elaboration from the Investment Climate Survey Databank,
World Bank.
TABLE 3 Descriptive Statistics of Variables: Entire Sample
Variable=Unit Year Obs. Mean Std. Dev. Min Max
Yt (Chilean pesosconstant 2000)
2003 751 5.66Eþ 09 2.73Eþ 10 178476.8 6.24Eþ 112002 751 8.27Eþ 09 4.90Eþ 10 271033.9 9.14Eþ 112001 751 5.83Eþ 09 2.69Eþ 10 232922.5 4.56Eþ 11
Kt (Chilean pesosconstant 2000)
2003 751 2.23Eþ 09 9.23Eþ 09 72.3884 1.25Eþ 112002 751 2.37Eþ 09 1.02Eþ 10 74.42492 1.62Eþ 112001 751 2.31Eþ 09 1.01Eþ 10 76.27749 1.73Eþ 11
Lt (Persons) 2003 751 132.0879 318.5573 1 46462002 751 129.6272 344.2935 1 61462001 751 132.4088 408.3376 1 8485
RWt (Ratio) 2003 751 1.05Eþ 07 9.94Eþ 07 4441.108 2.72Eþ 092002 751 6873523 7567621 2198.118 7.13Eþ 072001 749 1.81Eþ 07 3.09Eþ 08 2805.081 8.47Eþ 09
KDt (Ratio) 2003 751 1.05Eþ 07 9.94Eþ 07 4441.108 2.72Eþ 092002 751 6873523 7567621 2198.118 7.13Eþ 072001 749 1.81Eþ 07 3.09Eþ 08 2805.081 8.47Eþ 09
R&Dt (Ratio) 2003 703 0.007893 0.077297 0 1.8199052002 697 0.00492 0.037606 0 0.488889
S (Ratio) 2003 751 0.233158 0.170991 0 0.889678HHI (Ratio) 2003 751 0.144363 0.224908 0.051607 1A (years) 2003 751 25.98935 23.00997 1 150KH (Percentage) 2003 735 24.34126 28.02445 0 100
Note. Authors’ calculation from the Investment Climate Survey Databank, World Bank.
104 L. Laborda Castillo et al.
Dow
nloa
ded
by [
dani
el s
otel
sek]
at 0
1:17
28
May
201
4
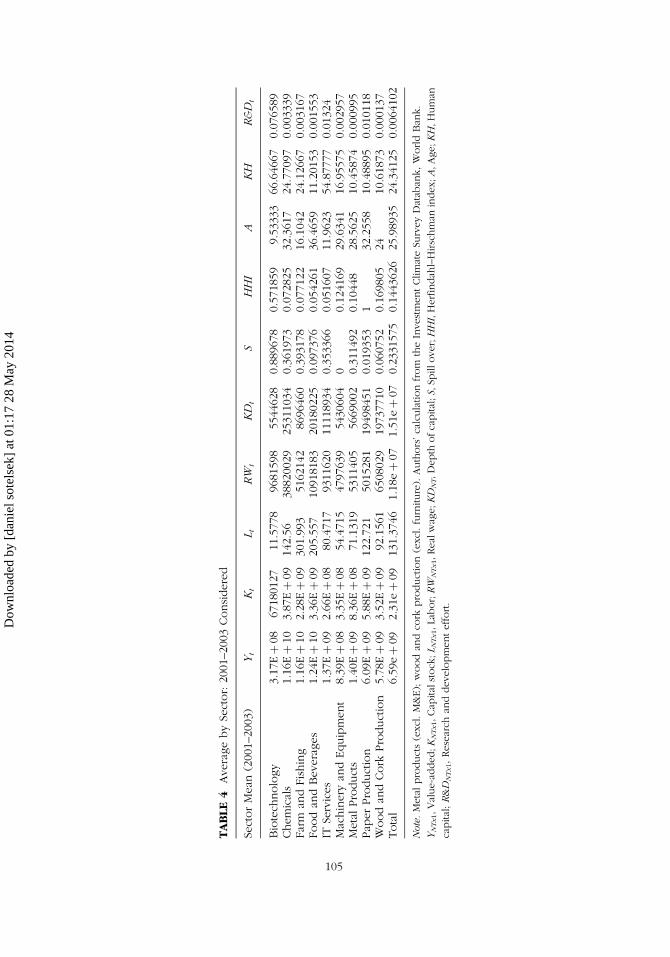
TABLE4
AveragebySector:2001–2003Considered
SectorMean
(2001–2003)
Yt
Kt
L tR
Wt
KD
tS
HH
IA
KH
R&
Dt
Biotech
nology
3.17Eþ08
67180127
11.5778
9681598
5544628
0.889678
0.571859
9.53333
66.64667
0.076589
Chemicals
1.16Eþ10
3.87Eþ09
142.56
38820029
25311034
0.361973
0.072825
32.3617
24.77097
0.003339
Farm
andFishing
1.16Eþ10
2.28Eþ09
301.993
5162142
8696460
0.393178
0.077122
16.1042
24.12667
0.003167
Foodan
dBeverages
1.24Eþ10
3.36Eþ09
205.557
10918183
20180225
0.097376
0.054261
36.4659
11.20153
0.001553
ITServices
1.37Eþ09
2.66Eþ08
80.4717
9311620
11118934
0.353366
0.051607
11.9623
54.87777
0.01324
Machinery
andEquipment
8.39Eþ08
3.35Eþ08
54.4715
4797639
5430604
00.124169
29.6341
16.95575
0.002957
MetalProducts
1.40Eþ09
8.36Eþ08
71.1319
5311405
5669002
0.311492
0.10448
28.5625
10.45874
0.000995
Pap
erProduction
6.09Eþ09
5.88Eþ09
122.721
5015281
19498451
0.019353
132.2558
10.48895
0.010118
Woodan
dCork
Production
5.78Eþ09
3.52Eþ09
92.1561
6508029
19737710
0.060752
0.169805
24
10.61873
0.000137
Total
6.59eþ09
2.31eþ09
131.3746
1.18eþ07
1.51eþ07
0.2331575
0.1443626
25.98935
24.34125
0.0064102
Note
.Metalproducts(excl.M&E);woodan
dco
rkproduction(excl.furniture).Authors’calculationfrom
theInvestm
entClimateSu
rveyDatab
ank,WorldBan
k.
YN
Tx1,Value-added;K
NT
x1,Cap
italstock;L N
Tx1,Labor;
RW
NT
x1,Realwage;K
DN
T,Depth
ofcapital;S,Sp
illover;
HH
I,Herfindah
l–Hirschman
index
;A,Age;K
H,Human
capital;
R&
DN
Tx1,Research
anddevelopmenteffort.
105
Dow
nloa
ded
by [
dani
el s
otel
sek]
at 0
1:17
28
May
201
4
dividing the capital stocks for each industry by labor input), and Real wage(defined as the total expenditures on personnel divided by the total numberof permanent workers) were included.
Statistical Source and Sample
These sections deal with the characteristics of the business and the investmentclimate in which firms operate. The statistical source used for this analysis isthe World Bank’s Enterprise Surveys (WBES). The WBES collects data fromkey manufacturing and service sectors in every region of the world. TheWBES use standardized survey instruments using a uniform sampling meth-odology to minimize measurement error and to yield data that are comparableacross the world’s economies. It is worth noting that the sample covers estab-lishments in nine industries, including six manufacturing sectors, informationtechnology, biotechnology, and fish farming. Furthermore, the sampleincludes firms of all sizes: micro (<16), small (16–49), medium (50–249)and large (250þ workers) firms.
The Core instrument comprises 11 sections. The first eight sectionscontain qualitative questions, which are based on a manager’s opinion onthe business environment and on motivation for business decisions. The nextsection, only included in the Manufacturing Module, contains questionsabout capacity (use of production capacity and hours of operation). The lastthree sections of the questionnaire deal with data specific to the transactionsbusinesses make in order to operate.
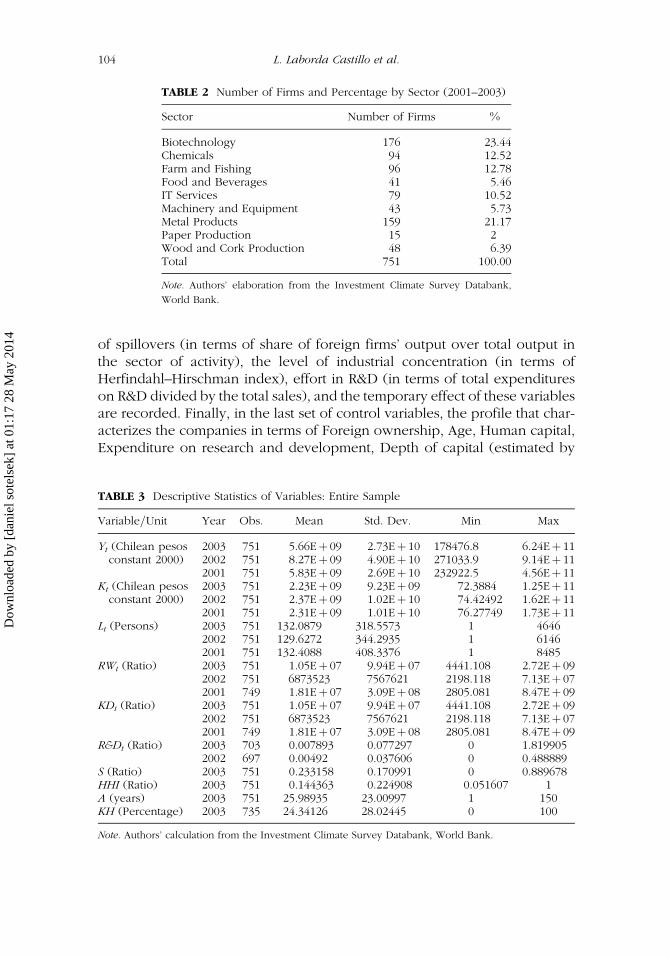
From Chile’s ICA survey we are able to form a balanced data panel (seeTable 2). We have observations for 2001, 2002, and 2003.
Table 3 shows the descriptive statistics of the variables taken intoaccount in order to conduct the empirical analysis for the entire sample.
Table 4 shows the descriptive statistics of the variables considered inorder to conduct the empirical analysis by sectors. It presents importantdifferences in terms of value added during the period considered.
RESULTS
When observing the whole of the Chilean industry (Table 5), we observevery similar values across sectors during the periods studied in terms oftechnical efficiency levels.4 In this context, improvement in the use of theirproductive inputs is close to 53%.
In terms of convergence the dynamic between the years considered isshown in Figure 1, and it illustrates the trends in convergence (divergence)and persistence (mobility) in the level of technical efficiency attained.For Chilean industry technical efficiency over the whole period, we detecta pattern of divergence and mobility.
106 L. Laborda Castillo et al.
Dow
nloa
ded
by [
dani
el s
otel
sek]
at 0
1:17
28
May
201
4
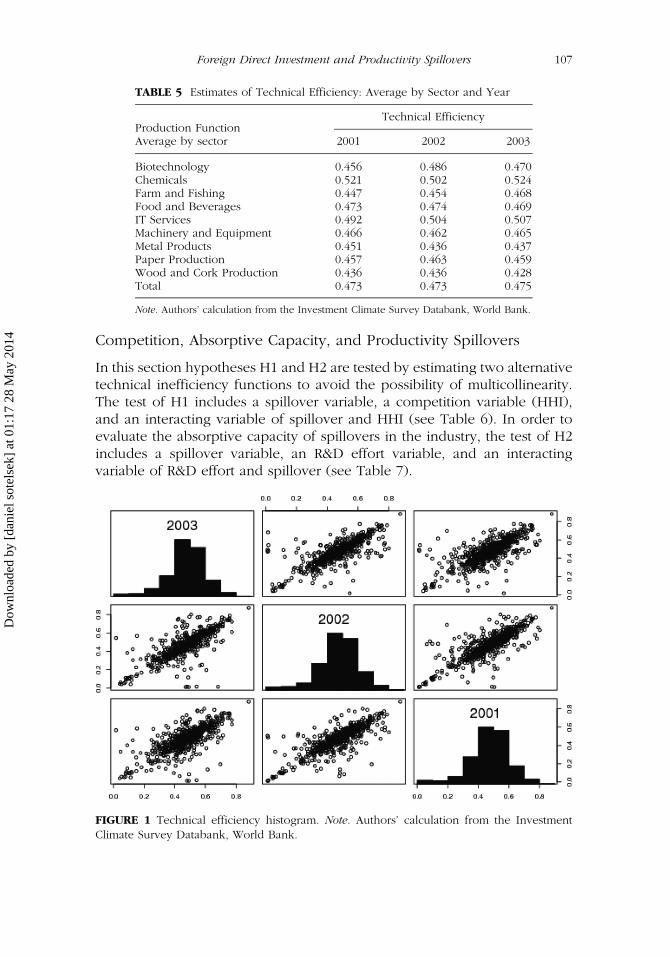
Competition, Absorptive Capacity, and Productivity Spillovers
In this section hypotheses H1 and H2 are tested by estimating two alternativetechnical inefficiency functions to avoid the possibility of multicollinearity.The test of H1 includes a spillover variable, a competition variable (HHI),and an interacting variable of spillover and HHI (see Table 6). In order toevaluate the absorptive capacity of spillovers in the industry, the test of H2includes a spillover variable, an R&D effort variable, and an interactingvariable of R&D effort and spillover (see Table 7).
FIGURE 1 Technical efficiency histogram. Note. Authors’ calculation from the InvestmentClimate Survey Databank, World Bank.
TABLE 5 Estimates of Technical Efficiency: Average by Sector and Year
Production FunctionTechnical Efficiency
Average by sector 2001 2002 2003
Biotechnology 0.456 0.486 0.470Chemicals 0.521 0.502 0.524Farm and Fishing 0.447 0.454 0.468Food and Beverages 0.473 0.474 0.469IT Services 0.492 0.504 0.507Machinery and Equipment 0.466 0.462 0.465Metal Products 0.451 0.436 0.437Paper Production 0.457 0.463 0.459Wood and Cork Production 0.436 0.436 0.428Total 0.473 0.473 0.475
Note. Authors’ calculation from the Investment Climate Survey Databank, World Bank.
Foreign Direct Investment and Productivity Spillovers 107
Dow
nloa
ded
by [
dani
el s
otel
sek]
at 0
1:17
28
May
201
4
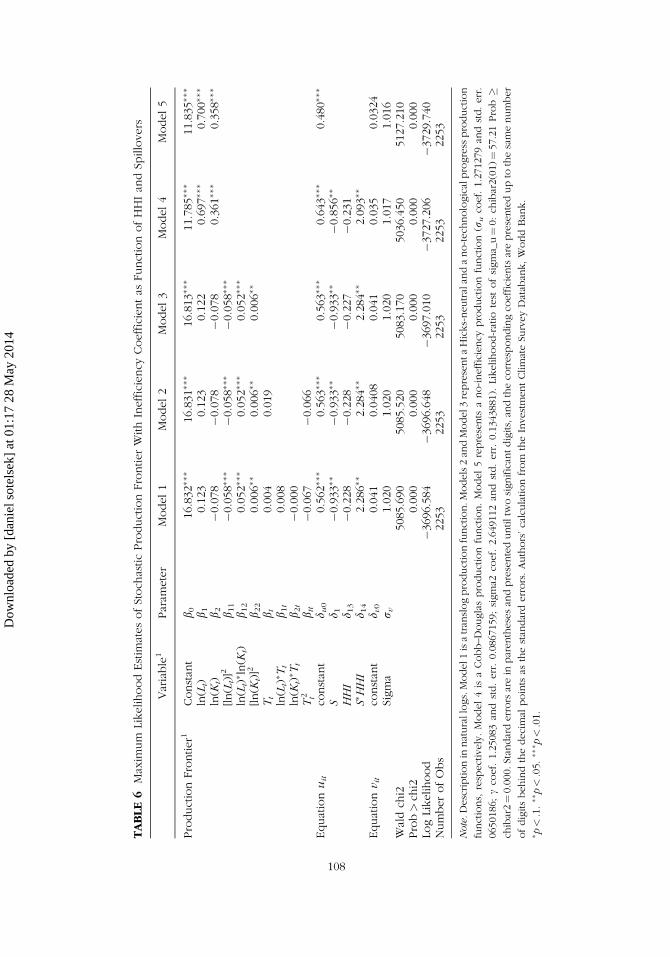
TABLE6
Maxim
um
LikelihoodEstim
atesofStoch
asticProductionFrontierWithInefficiency
Coefficientas
FunctionofHHIan
dSp
illovers
Variable
1Param
eter
Model1
Model2
Model3
Model4
Model5
ProductionFrontier1
Constan
tb 0
16.832��
�16.831��
�16.813��
�11.785��
�11.835��
�
ln(L
t)b 1
0.123
0.123
0.122
0.697��
�0.700��
�
ln(K
t)b 2
�0.078
�0.078
�0.078
0.361��
�0.358��
�
[ln(L
t)]2
b 11
�0.058��
��0.058��
��0.058��
�
ln(L
t)� ln(K
t)b 1
20.052��
�0.052��
�0.052��
�
[ln(K
t)]2
b 22
0.006��
0.006��
0.006��
Tt
b t0.004
0.019
ln(L
t)� T
tb 1
t0.008
ln(K
t)� T
tb 2
t�0.000
T2 t
b tt
�0.067
�0.066
Equation
uit
constan
td u
00.562��
�0.563��
�0.563��
�0.643��
�0.480��
�
Sd 1
�0.933��
�0.933��
�0.933��
�0.856��
HH
Id 1
3�0.228
�0.228
�0.227
�0.231
S�H
HI
d 14
2.286��
2.284��
2.284��
2.093��
Equation
v it
constan
td v
00.041
0.0408
0.041
0.035
0.0324
Sigma
r v1.020
1.020
1.020
1.017
1.016
Waldch
i25085.690
5085.520
5083.170
5036.450
5127.210
Prob>ch
i20.000
0.000
0.000
0.000
0.000
LogLikelihood
�3696.584
�3696.648
�3697.010
�3727.206
�3729.740
NumberofObs
2253
2253
2253
2253
2253
Note
.Descriptionin
naturallogs.Model1
isatran
slogproductionfunction.M
odels2an
dModel3
representaHicks-neutralan
dano-tech
nologicalprogress
production
functions,
respectively.Model
4is
aCobb–Douglasproductionfunction.Model
5represents
ano-inefficiency
productionfunction(r
uco
ef.1.271279an
dstd.err.
0650186;
cco
ef.1.25083
andstd.err.0.0867159;sigma2
coef.2.649112an
dstd.err.0.1343881).
Likelihood-ratio
test
ofsigma_u¼0:ch
ibar2(01)¼57.21Prob�
chibar2¼0.000.Stan
darderrors
arein
parenthesesan
dpresenteduntiltw
osignifican
tdigits,an
dtheco
rrespondingco
efficientsarepresentedupto
thesamenumber
ofdigitsbehindthedecimal
points
asthestan
darderrors.Authors’calculationfrom
theInvestm
entClimateSu
rveyDatab
ank,WorldBan
k.
� p<.1.��
p<.05.
��� p
<.01.
108
Dow
nloa
ded
by [
dani
el s
otel
sek]
at 0
1:17
28
May
201
4
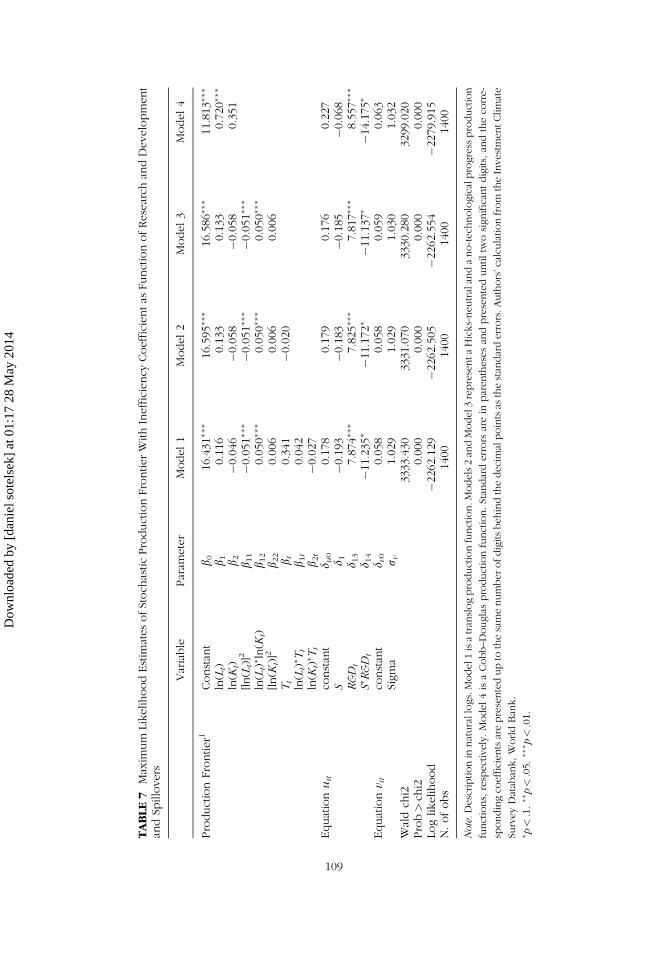
TABLE7
Maxim
um
LikelihoodEstim
atesofStoch
asticProductionFrontierWithInefficiency
Coefficientas
FunctionofResearch
andDevelopment
andSp
illovers
Variable
Param
eter
Model1
Model2
Model3
Model4
ProductionFrontier1
Constan
tb0
16.431��
�16.595��
�16.586��
�11.813��
�
ln(L
t)b1
0.116
0.133
0.133
0.720��
�
ln(K
t)b2
�0.046
�0.058
�0.058
0.351
[ln(L
t)]2
b 11
�0.051��
��0.051��
��0.051��
�
ln(L
t)� ln(K
t)b 1
20.050��
�0.050��
�0.050��
�
[ln(K
t)]2
b 22
0.006
0.006
0.006
Tt
bt
0.341
�0.020
ln(L
t)� T
tb 1
t0.042
ln(K
t)� T
tb 2
t�0.027
Equation
uit
constan
td u
00.178
0.179
0.176
0.227
Sd 1
�0.193
�0.183
�0.185
�0.068
R&
Dt
d 13
7.874��
�7.825��
�7.817��
�8.557��
�
S�R
&D
td 1
4�11.235�
�11.172�
�11.137�
�14.175�
Equation
v it
constan
td v
00.058
0.058
0.059
0.063
Sigma
r v1.029
1.029
1.030
1.032
Waldch
i23333.430
3331.070
3330.280
3299.020
Prob>ch
i20.000
0.000
0.000
0.000
Loglikelihood
�2262.129
�2262.505
�2262.554
�2279.915
N.ofobs
1400
1400
1400
1400
Note
.Descriptionin
naturallogs.Model1
isatran
slogproductionfunction.M
odels2an
dModel3
representaHicks-neutralan
dano-tech
nologicalprogress
production
functions,respectively.Model
4isaCobb–Douglasproductionfunction.Stan
darderrors
arein
parenthesesan
dpresenteduntiltw
osignifican
tdigits,an
dtheco
rre-
spondingco
efficientsarepresentedupto
thesamenumberofdigitsbehindthedecimalpointsas
thestan
darderrors.Authors’calcu
lationfrom
theInvestm
entClimate
SurveyDatab
ank,WorldBan
k.
� p<.1.��
p<.05.
��� p
<.01.
109
Dow
nloa
ded
by [
dani
el s
otel
sek]
at 0
1:17
28
May
201
4
The estimation results of a translog stochastic production frontier (seeTable 6) show that the coefficients of labor and capital are expected to havepositive signs (in models 4 and 5). The positive and highly significant coeffi-cients confirm the expected positive and significant output effects of laborand capital. On the other hand, if we take into account the squared variableof labor [ln(Lt)]
2 in models 1, 2, and 3 we will observe a negative and statisti-cally significant 1% level, which indicated a decrease regarding labor perfor-mance. This cannot be confirmed in the case of the variable squared capital.However, the same is not true for the squared capital. The squared variableof capital [ln(Kt)]
2 in models 1, 2, and 3 is positive and statistically significantat a 5% level, which indicates an increasing return to capital. Furthermore,the estimated coefficient of the interacting variable between labor and capitalln(Lt)
�ln(Kt) in models 1, 2, and 3 is positive and significant at a 1% level, sug-gesting a substitution effect between labor and capital. The last finding isconsistent with classic works from Arrow, Chenery, Minhas and Solow(1961). These authors found empirical evidence that the elasticity of substi-tution between capital and labor in manufacturing may typically be less thanunity. However, these authors also found that there are weaker indicationsthat this conclusion is reversed in primary production.
An interesting result of this study is the estimated coefficients of the inef-ficiency function in the second part of the models in Table 6. The negativeand significant coefficient on the spillover variable (spillover) in Models 1,2, 3, and 4 in Table 6 implies a positive and significant efficiency spilloverin the Chilean industrial sectors. This result suggests that in the Chileanindustrial sectors foreign investments result in domestic firms utilizing theirresources in a more efficient way, which then leads to gains in productivity.
The positive coefficient of the interacting variable between concen-tration and spillovers S�HHI in Models 1, 2, 3, and 4 suggests that a lower con-centration is associated with larger spillovers from foreign presence. Fromthese findings, it may be inferred that domestic firms operating in a non-concentrated subsector of the Chilean industrial sectors may gain spilloverbenefits from foreign firms.
According to Salim and Bloch (2009), higher concentration is an inversemeasure of static competition that can protect inefficient firms. However, ahigher concentration can also be the result of dynamic competition amongfirms of differential efficiency that removes inefficient firms from the industryas argued by Demsetz (1973) and Peltzman (1977). The first argumentsuggests that HHI is associated with greater inefficiency, while the latterargument suggests that HHI is associated with lower inefficiency.
Table 7 presents the estimated parameters of productivity spillovers andabsorptive capacity.
In Table 7, the estimated parameters of production functions have asimilar sign and significance as in the baseline models shown in Table 6.The coefficient of the R&D dummy is positive and significant at the 1% level,
110 L. Laborda Castillo et al.
Dow
nloa
ded
by [
dani
el s
otel
sek]
at 0
1:17
28
May
201
4
suggesting that firms with high R&D effort, on average, have lower efficien-cies compared to those with low R&D effort. The negative coefficient of theinteracting variable between R&D and spillovers (S�R&Dt) suggests that firmswith high R&D efforts gain more spillovers from foreign firms. Given thisresult, it is possible to infer that firms with high R&D effort can reap greaterbenefits from foreign firms’ presence by upgrading their knowledge and cre-ating innovation. This finding confirms that firms’ absorptive capacity (orfirms’ specific characteristic) determines productivity spillovers from FDI,as argued in some previous studies, for example, by Kathuria (2000).
Sources of Productivity Growth and FDI Spillovers
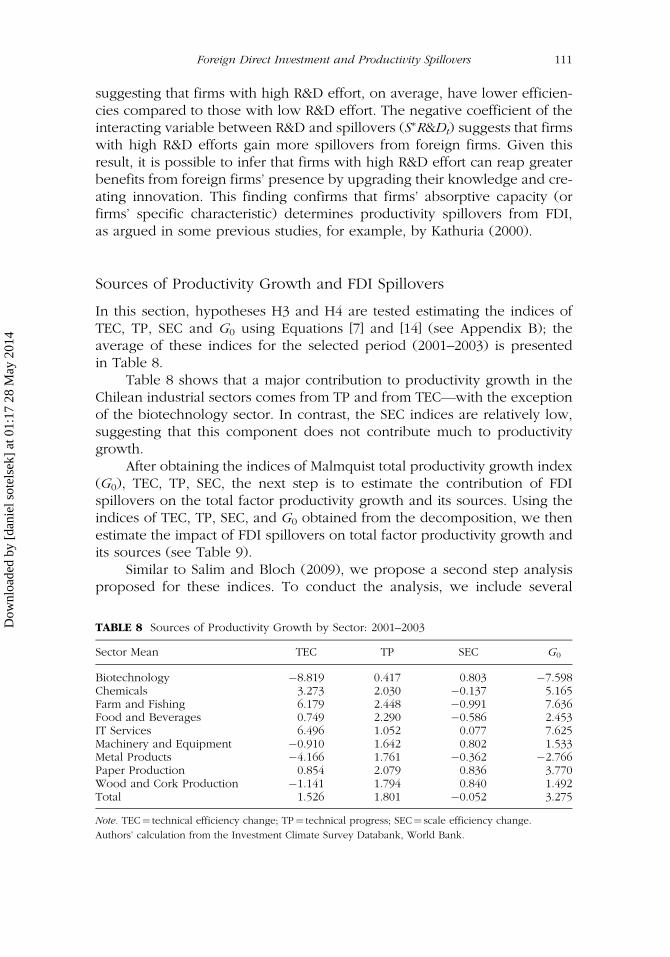
In this section, hypotheses H3 and H4 are tested estimating the indices ofTEC, TP, SEC and G0 using Equations [7] and [14] (see Appendix B); theaverage of these indices for the selected period (2001–2003) is presentedin Table 8.
Table 8 shows that a major contribution to productivity growth in theChilean industrial sectors comes from TP and from TEC—with the exceptionof the biotechnology sector. In contrast, the SEC indices are relatively low,suggesting that this component does not contribute much to productivitygrowth.
After obtaining the indices of Malmquist total productivity growth index(G0), TEC, TP, SEC, the next step is to estimate the contribution of FDIspillovers on the total factor productivity growth and its sources. Using theindices of TEC, TP, SEC, and G0 obtained from the decomposition, we thenestimate the impact of FDI spillovers on total factor productivity growth andits sources (see Table 9).
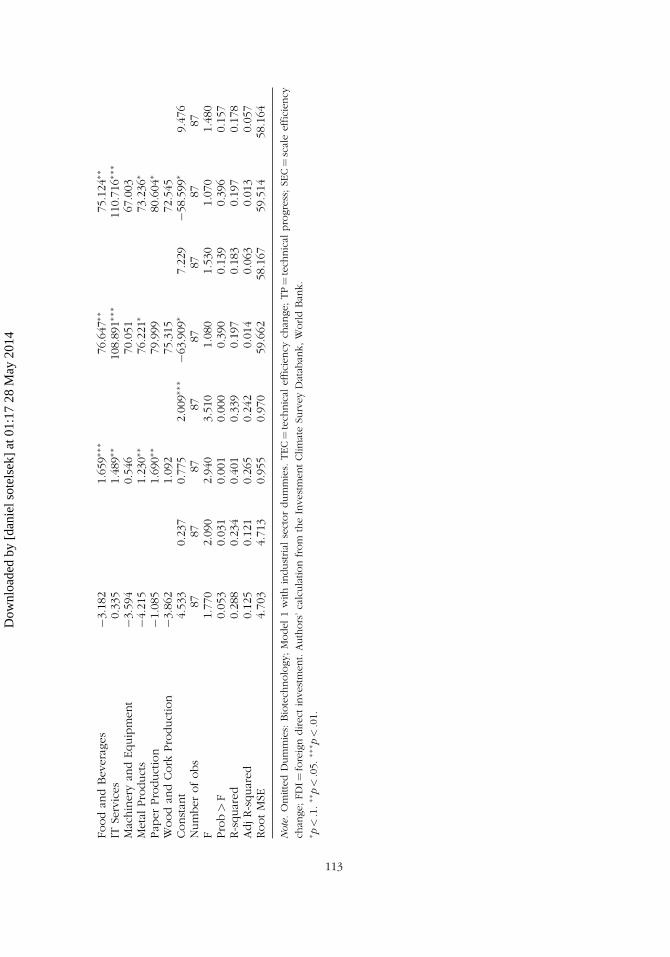
Similar to Salim and Bloch (2009), we propose a second step analysisproposed for these indices. To conduct the analysis, we include several
TABLE 8 Sources of Productivity Growth by Sector: 2001–2003
Sector Mean TEC TP SEC G0
Biotechnology �8.819 0.417 0.803 �7.598Chemicals 3.273 2.030 �0.137 5.165Farm and Fishing 6.179 2.448 �0.991 7.636Food and Beverages 0.749 2.290 �0.586 2.453IT Services 6.496 1.052 0.077 7.625Machinery and Equipment �0.910 1.642 0.802 1.533Metal Products �4.166 1.761 �0.362 �2.766Paper Production 0.854 2.079 0.836 3.770Wood and Cork Production �1.141 1.794 0.840 1.492Total 1.526 1.801 �0.052 3.275
Note. TEC¼ technical efficiency change; TP¼ technical progress; SEC¼ scale efficiency change.
Authors’ calculation from the Investment Climate Survey Databank, World Bank.
Foreign Direct Investment and Productivity Spillovers 111
Dow
nloa
ded
by [
dani
el s
otel
sek]
at 0
1:17
28
May
201
4
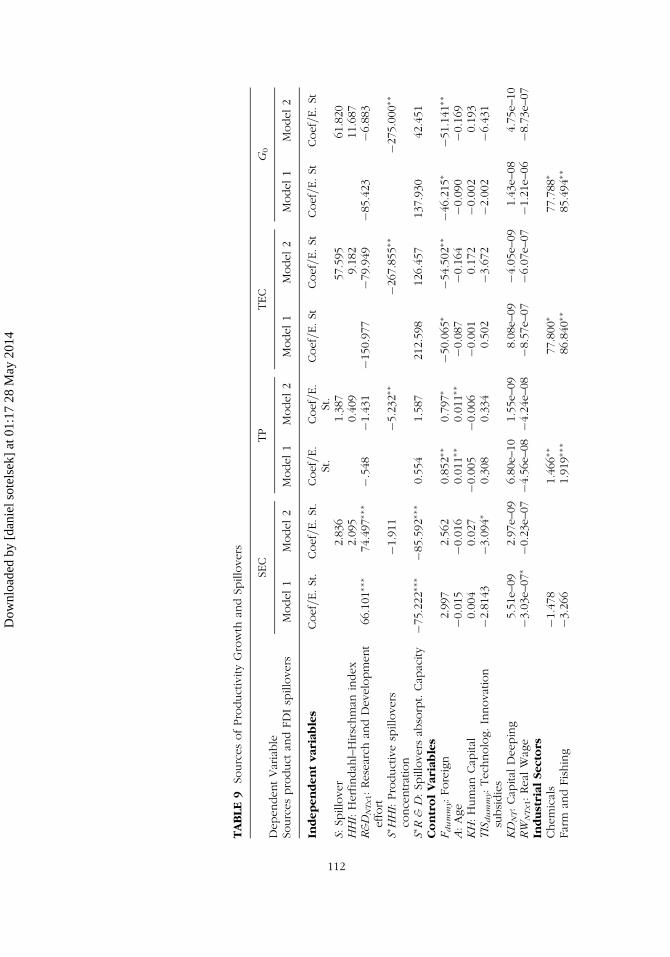
TABLE9
SourcesofProductivityGrowth
andSp
illovers
DependentVariable
SEC
TP
TEC
G0
Sourcesproduct
andFDIspillovers
Model1
Model2
Model1
Model2
Model1
Model2
Model1
Model2
Independentvariables
Coef=E.St.
Coef=E.St.
Coef=E.
St.
Coef=E.
St.
Coef=E.St
Coef=E.St
Coef=E.St
Coef=E.St
S:Sp
illover
2.836
1.387
57.595
61.820
HH
I:Herfindah
l–Hirschman
index
2.095
0.409
9.182
11.687
R&
DN
Tx1:Research
andDevelopment
effort
66.101��
�74.497��
��.548
�1.431
�150.977
�79.949
�85.423
�6.883
S�H
HI:Productivespillovers
concentration
�1.911
�5.232��
�267.855��
�275.000��
S�R
&D:Sp
illovers
absorpt.Cap
acity
�75.222��
��85.592��
�0.554
1.587
212.598
126.457
137.930
42.451
ControlVariables
Fd
um
my:Foreign
2.997
2.562
0.852��
0.797�
�50.065�
�54.502��
�46.215�
�51.141��
A:Age
�0.015
�0.016
0.011��
0.011��
�0.087
�0.164
�0.090
�0.169
KH:Human
Cap
ital
0.004
0.027
�0.005
�0.006
�0.001
0.172
�0.002
0.193
TIS
du
mm
y:Tech
nolog.Innovation
subsidies
�2.8143
�3.094�
0.308
0.334
0.502
�3.672
�2.002
�6.431
KD
NT:Cap
ital
Deeping
5.51e–09
2.97e–09
6.80e–10
1.55e–09
8.08e–09
�4.05e–09
1.43e–08
4.75e–10
RW
NT
x1:Real
Wage
�3.03e–07�
�0.23e–07
�4.56e–08
�4.24e–08
�8.57e–07
�6.07e–07
�1.21e–06
�8.73e–07
IndustrialSectors
Chemicals
�1.478
1.466��
77.800�
77.788�
Farm
andFishing
�3.266
1.919��
�86.840��
85.494��
112
Dow
nloa
ded
by [
dani
el s
otel
sek]
at 0
1:17
28
May
201
4
Foodan
dBeverages
�3.182
1.659��
�76.647��
75.124��
ITServices
0.335
1.489��
108.891��
�110.716��
�
Machinery
andEquipment
�3.594
0.546
70.051
67.003
MetalProducts
�4.215
1.230��
76.221�
73.236�
Pap
erProduction
�1.085
1.690��
79.999
80.604�
Woodan
dCork
Production
�3.862
1.092
75.315
72.545
Constan
t4.533
0.237
0.775
2.009��
��63.909�
7.229
�58.599�
9.476
Numberofobs
87
87
87
87
87
87
87
87
F1.770
2.090
2.940
3.510
1.080
1.530
1.070
1.480
Prob>F
0.053
0.031
0.001
0.000
0.390
0.139
0.396
0.157
R-squared
0.288
0.234
0.401
0.339
0.197
0.183
0.197
0.178
AdjR-squared
0.125
0.121
0.265
0.242
0.014
0.063
0.013
0.057
RootMSE
4.703
4.713
0.955
0.970
59.662
58.167
59.514
58.164
Note
.OmittedDummies:
Biotech
nology;Model
1withindustrial
sectordummies.
TEC¼tech
nical
efficiency
chan
ge;TP¼tech
nical
progress;SE
C¼scaleefficiency
chan
ge;FDI¼
foreigndirect
investm
ent.Authors’calculationfrom
theInvestmentClimateSu
rveyDatab
ank,WorldBan
k.
� p<.1.��
p<.05.
��� p
<.01.
113
Dow
nloa
ded
by [
dani
el s
otel
sek]
at 0
1:17
28
May
201
4
control variables, such as Foreign, Age, Human Capital, TechnologicalInnovation Subsidies, Depth of Capital, Real Wage, and Industrial sectors.
Table 9 reveals the effects of ‘‘spillovers’’ over different productivitycomponents in association with other factors such as market concentrationor R&D. For example, it can be seen how the interaction between marketconcentration and spillovers has a negative and statistically significant effecton TEC and (G0). Along the same lines, the interaction between R&D activityand spillovers has a negative and statistically significant effect on SEC. Thenegative and statistically significant estimate of the interacting variablebetween spillover and R&D effort indicates that firms with high R&D efforttend to gain less technological spillovers on SEC. The estimate for aninteracting variable between spillover and concentration is negative andstatistically significant, suggesting that competition is associated with higherspillovers on TP, TEC, and G0.
DISCUSSION
At least two reasons make Chile an interesting case study: First, because from1994 to 2007 the country’s average rate of economic growth was close to 5%,with most of this growth experienced in the decade before 1994. ExaminingChile is also relevant due to its relative importance in the subcontinent. Infact, most of the economic variables have presented good behavior (inflation,public deficit, external balance, finances, etc.). In this sense, this economyappears to be an excellent candidate to test the hypothesis concerning theexistence of productivity spillovers in the manufacturing sector because ofFDI. This study examines the productivity spillovers from FDI in the Chileanindustrial sector by using unique and extensive firm-level panel data cover-ing 2001–2003. This article uses the stochastic frontier production functionfollowing the technique used by Battese and Coelli (1995) and a generalizedMalmquist output-oriented index to decompose productivity growth.
The intra-industry productivity spillovers are examined through thespillover variable, and the roles of competition and R&D in extending spil-lovers from FDI are evaluated to test a channel of productivity spillovers.The empirical results show that intra-industry productivity spillovers arepresent in the Chilean industrial sector. Firms with R&D expenditure receivemore productivity spillovers than those without R&D expenditure. These find-ings support our second hypothesis H2 and, in line with works by Girma andcolleagues (2006) for the Chinese industry, we can add empirical evidencethat Chilean firms that invest in R&D have positive FDI spillovers. Results alsoshow that technological progress is the major driver of productivity growth inthe Chilean industrial firms. FDI spillovers have been found to be positive butnot significant for scale efficiency change, technological progress change,technical efficiency change, and total productivity growth change.
114 L. Laborda Castillo et al.
Dow
nloa
ded
by [
dani
el s
otel
sek]
at 0
1:17
28
May
201
4
In addition to the empirical evidence found, we think that the maincontribution of our study is to have applied a parametric methodology,which allows performing robust estimates and using the firm as the unit ofanalysis. We believe that the limited empirical literature on this topic in thecontext of Latin America and the Caribbean gives value to this work.
On the other hand, the main limitation of this work stems from restricteddata. This circumstance makes it necessary to be cautious with the results, butalso opens the door to future studies that use other methodologies based ondynamic panel models. (See, for example, Arellano & Bond, 1991; Arellano &Bover, 1995; Bover & Arellano, 1997; Blundell & Bond, 1998.) These meth-odologies allow the use of time series with a number of shorter periods andset multiple lagged endogenous variables among the explanatory variables.Alternatively, albeit less robust, possibly helpful in validating our results isthe use of nonparametric techniques to assess efficiency and productivity.
Policy Implications
Despite the presence of positive spillovers from FDI, the policy implicationsof these findings are not straightforward. However, certain policy reflectionsdo follow from the findings. The findings of positive productivity spillovers atthe aggregated manufacturing level suggest that the government should con-tinue to provide FDI-friendly environment and deregulation policies relatedto FDI. This could include simplifying the administrative processes for FDIinflows, additional incentives for foreign firms that are willing to transfer theirknowledge to domestic firms, and further trade policy reforms to promote amore competitive environment in the manufacturing sector. Outcomes fromthe decomposition analysis suggest that incentives should be provided to FDIthat generate advanced managerial knowledge as well as those that provideup-to-date technology transfer. Results suggest the importance of improvingthe capacity of domestic firms in order to update the spillover benefits fromFDI. For instance, it is worth noting that Salim and Bloch (2009) suggestedthat policies for strengthening the absorptive capacity of domestic firmsthrough investing in knowledge and human capital formation might besuperior to policies that provide concessions for FDI.
Preferential policies that solely consist of opening up some selectedregions are not optimal for Chile. In order to reap more benefits from foreignpresence, coordinated industrial policies that reinforce regional comple-mentarities are needed. In addition, the removal of restrictions to the freemovement of production factors across regional borders appears to becrucial to improve productivity levels.
Such policies also reveal the importance of controlling for those localcapacities related to the macroeconomic and institutional environment. Thus,host country governments should develop a set of policies that are notonly focused on inward FDI promotion but also on the improvement of their
Foreign Direct Investment and Productivity Spillovers 115
Dow
nloa
ded
by [
dani
el s
otel
sek]
at 0
1:17
28
May
201
4
political and economic framework. According to Alguacil, Cuadros, and Orts(2011), more general policies such as building modern infrastructure orincreasing and strengthening the institutions should be pursued, which notonly attract FDI but also benefit domestic firms.
ACKNOWLEDGMENTS
We appreciate the efforts of the two anonymous reviewers and their usefulcomments and suggestions for improving the article. We want to thank thesupport and kindness of the Manager Editor of LABR. Finally, we appreciatethe comments of the colleagues of the Columbia University (SIPA).
NOTES
1. These data have become the standard way for the World Bank to identify key obstacles to country
competitiveness, in order to prioritize policy reforms for enhancing competitiveness.
2. When TEi¼ 1, the i-th firm obtains the maximum feasible output, while when TEih1 we have a
measure of the shortfall of the observed output from maximum feasible output.
3. In Appendix I we also present the more complex translog production function used in the
empirical analysis.
4. The estimated efficiency indices have values between 0 and 1, where the most efficient companies
are those closest to 1.
REFERENCES
Abraham, F., Konings, J., & Slootmaekers, V. (2010). FDI spillovers in the Chinesemanufacturing sector. Economics of Transition, 18(1), 143–182.
Aigner, D., Lovell, C., & Schmidt, P. (1977). Formulation and estimation of stochasticfrontier production function models. Journal of Econometrics, 6(3), 21–37.
Aitken, B. J., & Harrison, A. E. (1999). Do domestic firms benefit from directforeign investment? Evidence from Venezuela. American Economic Review,89(3), 605–618.
Alguacil, M., Cuadros, A., & Orts, V. (2011). Inward FDI and growth: The role ofmacroeconomic and institutional environment. Journal of Policy Modeling,33(3), 481–496.
Arellano, M., & Bond, S. (1991). Some tests of specification for panel data: MonteCarlo evidence and an application to employment equations. The Review ofEconomic Studies, 58(2), 277–297.
Arellano, M., & Bover, O. (1995). Another look at the instrumental variableestimation of error-components models. Journal of Econometrics, 68(1), 29–51.
Arrow, K. J., Chenery, H. B., Minhas, B. S., & Solow, R. M. (1961). Capital-laborsubstitution and economic efficiency. The Review of Economics and Statistics,43(3), 225–250.
Battese, G. E., & Coelli, T. J. (1988). Prediction of firm-level technical efficiencieswith a generalized frontier production function and panel data. Journal ofEconometrics, 38(3), 387–399.
116 L. Laborda Castillo et al.
Dow
nloa
ded
by [
dani
el s
otel
sek]
at 0
1:17
28
May
201
4
Battese, G. E., & Coelli, T. J. (1993). A stochastic frontier production functionincorporating a model for technical inefficiency effects (Working Paper inEconometrics and Applied Statistics No. 69). University of New England,Armidale, Australia.
Battese, G. E., & Coelli, T. J. (1995). A model for technical inefficiency effects in astochastic frontier production function for panel data. Empirical Economics,20(2), 325–332.
Blomstrom, M., & Kokko, A. (1998). Multinational corporations and spillovers.Journal of Economic Surveys, 12(3), 247–277.
Blomstrom, M., Kokko, A., & Zejan, M. (1994). Host country competition, laborskills, and technology transfer by multinationals. Weltwirtschaftliches Archiv,130(3), 521–533.
Blundell, R., & Bond, S. (1998). Initial conditions and moment restrictions indynamic panel data models. Journal of Econometrics, 87, 115–143.
Bover, O., & Arellano, M. (1997). Estimating dynamic limited dependent variablemodels from panel data. Investigaciones Economicas, 21(2), 141–165.
Castellani, D., & Zanfei, A. (2003). Technology gaps, absorptive capacity and theimpact of inward investments on productivity of European firms. Economicsof Innovation and New Technology, 12(6), 555–576.
Caves, R. E. (1971). International corporations: The industrial economics of foreigninvestment. Economica, 38(149), 1–27.
Cheung, K. Y. (2010). Spillover effects of FDI via exports on innovation performanceof China’s high-technology industries. Journal of Contemporary China, 19(65),541–557.
Chudnovsky, D., Lopez, A., & Rossi, G. (2008). Foreign direct investment spilloversand the absorptive capabilities of domestic firms in the Argentine manufacturingsector (1992–2001). The Journal of Development Studies, 44(5), 645–677.
Coelli, T. J., Rao, D. S. P., O’Donnell, C. J., & Battese, G. E. (2005). An introduction toefficiency and productivity analysis. New York, NY: Springer.
Contessi, S., &Weinberger, A. (2009). Foreign direct investment, productivity, and coun-try growth: An overview. Federal Reserve Bank of St. Louis Review, 91(2), 61–78.
Damijan, J. P., Rojec, M., Majcen, B., & Knell, M. (2008). Impact of firm heterogeneityon direct and spillover effects of FDI: Micro evidence from ten transition countries(Discussion Paper No. 218). Katholieke Universiteit Leuven, Leuven, Belgium.
Das, S. (1987). Externalities and technology transfer through multinational corpora-tions. Journal of International Economics, 22(1–2), 171–182.
Demsetz, H. (1973). Industry structure, market rivalry, and public policy. Journal ofLaw and Economics, 16(1), 1–9.
Escribano, A., & Guasch, J. L. (2005). Assessing the impact of the investment climateon productivity using firm-level data: Methodology and the cases of Guatemala,Honduras, and Nicaragua (Working Paper No. 3621). World Bank PolicyResearch, San Diego, CA.
Farrel, M. J. (1957). The measurement of productivity efficiency. Journal of the RoyalStatistical Society, Series A, CXX(3), 253–290.
Fernandes, A. M., & Paunov, C. (2012). Foreign direct investment in services andmanufacturing productivity: Evidence for Chile. Journal of DevelopmentEconomics, 97(2), 305–321.
Foreign Direct Investment and Productivity Spillovers 117
Dow
nloa
ded
by [
dani
el s
otel
sek]
at 0
1:17
28
May
201
4
Findlay, R. (1978). Relative backwardness, direct foreign investment, and the transferof technology: A simple dynamic model. Quarterly Journal of Economics, 92(1),1–16.
Fosfuri, A., Motta, M., & Rønde, T. (2001). Foreign direct investment and spilloversthrough workers’ mobility. Journal of International Economics, 53(1), 205–222.
Girma, S., Gong, Y., & Gorg, H. (2006). Can you teach old dragons new tricks? FDIand innovation activity in Chinese state-owned enterprises. Nottingham,England: University of Nottingham.
Glass, A., & Saggi, K. (1998). International technology transfer and the technologygap. Journal of Development Economics, 55(2), 369–398.
Gorg, H., & Greenaway, D. (2004). Much ado about nothing? Do domestic firmsreally benefit from foreign direct investment? The World Bank ResearchObserver, 19(2), 171–197.
Gorg, H., & Strobl, E. (2001). Multinational companies and productivity spillovers: Ameta-analysis. The Economic Journal, 111(475), 723–739.
Gorg, H., & Strobl, E. (2005). Spillovers from foreign firms through worker mobility: Anempirical investigation. The Scandinavian Journal of Economics, 107(4), 693–709.
Gorodnichenko, Y., Svejnar, J., & Terrell, K. (2007). When does FDI have positivespillovers? Evidence from 17 emerging market economies (No. 3079). IZADiscussion Papers.
Griffith, R., Redding, S., & Van Reenen, J. (2004). Mapping the two faces of R&D:Productivity growth in a panel of OECD industries. Review of Economics andStatistics, 14(5), 922–940.
Haddad, M., & Harrison, A. (1993). Are there positive spillovers from direct foreigninvestment? Evidence from panel data for Morocco. Journal of DevelopmentEconomics, 42(1), 51–74.
Halpern, L., & Murakozy, B. (2007). Does distance matter in spillover? Economics ofTransition, 15(4), 781–805.
Haskel, J. E., Pereira, S. C., & Slaughter, M. J. (2007). Does inward foreign directinvestment boost the productivity of domestic firms? The Review of Economicsand Statistics, 89(3), 482–496.
Kathuria, V. (2000). Productivity spillovers from technology transfer to Indianmanufacturing firms. Journal of International Development, 12(2), 343–369.
Keller, W., & Yeaple, S. R. (2009). Multinational enterprises, international trade, andproductivity growth: Firm-level evidence from the United States. The Review ofEconomics and Statistics, 91(4), 821–831.
Kinoshita, Y. (2001). R&D and technology spillovers through FDI: Innovation andabsorptive capacity (Discussion Paper No. 2775). CEPR, London, England.
Kokko, A. (1996). Productivity spillovers from competition between local firms andforeign affiliates. Journal of International Development, 8(4), 517–530.
Kokko, A., Zejan, M., & Tansini, R. (2001). Trade regimes and spillover effects of FDI:Evidence from Uruguay. Weltwirtschaftliches Archiv, 137(1), 124–149.
Kumbhakar, S. C., & Lovell, C. A. K. (2003). Stochastic frontier analysis. New York,NY: Cambridge University Press.
Meeusen, W., & Van den Broeck, J. (1977). Efficiency estimation from Cobb-Douglasproduction functions with composed error. International Economic Review,18(2), 435–444.
118 L. Laborda Castillo et al.
Dow
nloa
ded
by [
dani
el s
otel
sek]
at 0
1:17
28
May
201
4
Orea, L. (2002). Parametric decomposition of a generalized Malmquist productivityindex. Journal of Productivity Analysis, 18(1), 5–22.
Ornaghi, C. (2002). Spillovers in product and process innovation: evidence frommanufacturing firms (Economics Working Papers No. 023213). UniversidadCarlos III, Madrid, Spain.
Peltzman, S. (1977). The gains and losses from industrial concentration. Journal ofLaw and Economics, 20(2), 229–263.
Perez, T. (1998). Multinational enterprises and technological spillovers. Amsterdam,the Netherlands: Harwood Academic Publishers.
Rodriguez-Clare, A. (1996). Multinationals, linkages, and economic development.American Economic Review, 86(4), 852–873.
Salim, R. A., & Bloch, H. (2009). Does foreign direct investment lead to productivityspillovers? Firm level evidence from Indonesia. World Development, 37(12),1861–1876.
Smarzynska, B. K. (2003). Does foreign direct investment increase the productivity ofdomestic firms? In search of spillovers through backward linkages (WilliamDavidson Working Paper No. 548). University of Michigan Business School,Ann Arbor, MI.
Smeets, R. A. (2008). Collecting the pieces of the FDI knowledge spillovers puzzle.The World Bank Research Observer, 23(2), 107–138.
Solow, R. M. (1957, August). Technical change and the aggregate productionfunction. The Review of Economics and Statistics, 3, 312–320.
Waldkirch, A. (2010). The effects of foreign direct investment in Mexico sinceNAFTA. The World Economy, 33(5), 710–745.
Wang, J. W., & Blomstrom, M. (1992). Foreign investment and technology transfer: Asimple model. European Economic Review, 36(1), 137–155.
Wooster, R. B., & Diebel, D. S. (2010). Productivity spillovers from foreign directinvestment in developing countries: A meta regression analysis. Review ofDevelopment Economics, 14(3), 640–655.
APPENDIX ADETERMINISTIC FRONTIER PRODUCTION FUNCTIONS:THE STOCHASTIC FRONTIER-INEFFICIENCY MODEL
The approaches linked to the analysis of the productivity are well known: onone hand, we have a descendent vision of the analysis of the productivityassociated with the concept of residual factor that this tied to the questionsraised by Solow in his well-known article of 1957. On the other hand, we havean ascending approach that attempts a measurement of the productivity froma heterogeneity that is inherent to the different production units (companies).
This work line finds its basis in the pioneer works of Farrel, whosearched for a measurement of the efficiency through the decompositionof the productivity’s growth. Both approaches have resulted in multipleworks and important technical developments that allow, in one way oranother, one to get to know the bases on which the change in productivityof the factors stand.
Foreign Direct Investment and Productivity Spillovers 119
Dow
nloa
ded
by [
dani
el s
otel
sek]
at 0
1:17
28
May
201
4
Following Battese and Coelli (1995), the stochastic frontier approachis used to estimate a production function and an inefficiency functionsimultaneously. The Battese–Coelli model can be expressed as follows:
yit ¼ f xit; t; bð Þ � exp vit � uitð Þ ð1Þ
where yit implies the production of the ith firm (i¼ 1, 2, . . . , N) in the tthperiod (t¼ 1, 2, . . . , T), xit denotes a (1� k) vector of explanatory variables,and b represents the (k� 1) vector of parameters to be estimated. The errorterm consists of two components: vit and uit, which are independent of eachother. In addition, the vit denotes the time-specific and stochastic part, withidd N 0;r2v
� �, and the uit represents technical inefficiency, which is normal
distribution, but truncated at zero with mean zitd and variance r2u.The technical inefficiency effects, uit, are assumed as a function of a
(1� j) vector of observable nonstochastic explanatory variables, zit, and a(j� 1) vector of unknown parameters to be estimated, d. In a linear equation,the technical inefficiency effects can be specified as follows:
uit ¼ zitdþ wit ð2Þ
where wit is an unobservable random variable, which is defined by thetruncation of the normal distribution with zero mean and variance, r2u, suchthat the point of truncation is �zitd.
Equation (1) shows the stochastic production function in terms of theoriginal production value, and Equation (2) represents the technical inef-ficiency effects. The parameters of both equations can be estimated simul-taneously by the maximum-likelihood method. The likelihood function isexpressed in terms of variance parameters r2s � r2v þ r2u and c � r2u=r
2s e. If
c equals zero, then the model reduces to a traditional mean response functionin which zit can be directly included into the production function.
Based on the theoretical model in Equations (1) and (2), we start with aflexible functional form, namely, a translog production function. By adoptinga flexible functional form, the risk of errors in the model specification can bereduced. Moreover, the translog form is useful for decomposing the totalfactor productivity growth. The functional form of the translog productionfunction is as follows:
ln yit ¼ b0 þXN
n¼1
bn ln xnit þ1
2
XN
n¼1
XN
k¼1
bnk ln xnit ln xkit
þ bt t þ1
2but2 þ
XN
n¼1
bnt ln xnitt þ vit � uit ð3Þ
where y implies output, x represents variables that explain output (labor and
120 L. Laborda Castillo et al.
Dow
nloa
ded
by [
dani
el s
otel
sek]
at 0
1:17
28
May
201
4
capital, so N¼ 2), t is time, i is firm. uit is defined as:
uit ¼ d0 þXJ
j¼1
djzit þ wit ð4Þ
where z is the set of explanatory variables that explain technical inefficiency.Given the specifications in Equations (3) and (4), the technical efficiency ofproduction for the ith firm at the tth year is defined as the ratio of the actualoutput of firm i, ln yit, to its potential output, ln y
pit :
TE ¼ ln yit
ln ypit
¼ E �uit vit � uitð Þj½ ¼ E �zitd� witð Þ vit � uitð Þj½ ð5Þ
where
ln ypit ¼ b0 þ
XN
n¼1
bn ln xnit þ1
2
XN
n¼1
XN
k¼1
bnk ln xnit ln xkit
þ bt t þ1
2but2 þ
XN
n¼1
bnt ln xnit t þ vit ð6Þ
APPENDIX BDECOMPOSING PRODUCTIVITY GROWTH:
A GENERALIZED MALMQUIST INDEX
According to Orea (2002), if firm i’s technology in time t can be representedby a translog output-oriented distance function D0(yit, xit, t) where yit, xit, andt are defined previously, then the logarithm of a generalized output-orientedMalmquist productivity growth index, Gt;tþ1
0i , can be decomposed into TEC,TP, and SEC between time periods t and tþ 1:
Gt;tþ10i ¼ TECt;tþ1
i þ TPt;tþ1i þ SECt;tþ1
i ð7Þ
where
TECt;tþ1i ¼ lnD0 yi;tþ1; xi;tþ1; t þ 1
� �� lnD0 yi;tþ1; xi;tþ1; t
� �ð8Þ
TPt;tþ1i ¼ 1
2
@ lnD0 yi;tþ1; xi;tþ1; t þ 1� �@ t þ 1ð Þ þ
@ lnD0 yi;tþ1; xi;tþ1; t� �
@t
� �ð9Þ
Foreign Direct Investment and Productivity Spillovers 121
Dow
nloa
ded
by [
dani
el s
otel
sek]
at 0
1:17
28
May
201
4
SECt;tþ1i ¼ 1
2
XN
n¼1
ei;tþ1 � 1
ei;tþ1ei;tþ1;n þ eit � 1
eiteitn
� �� ln xi;tþ1;n
xitn
� �ð10Þ
where eit ¼PN
n¼1 eitn is the scale elasticity such that eitn ¼ @ lnD0 yit ;xit ;tð Þ@ ln xitn
.
If the output is only one, then a translog output-oriented distancefunction can be defined as
lnD0 yit; xit ; tð Þ ¼ ln yit � ln ypit � vit ð11Þ
Given the technical efficiency measure in Equation (5), the technicalefficiency change between periods tþ 1 and t can be estimated by followingCoelli and colleagues (2005):
TECt;tþ1i ¼ ln TEi;tþ1 � ln TEit ð8Þ
The technical progress index can be obtained from Equations (6), (9),and (11) as follows:
TPi;tþ1;t
¼ 1
2
XN
n¼1
btn ln xi;tþ1;n þXN
n¼1
btn ln xitn þ 2bt þ 2btt t þ 1ð Þ½ þ t
" #ð13Þ
From Equation (3), the scale elasticity can be written as
enit ¼ bn þ 1
2
XK
k¼1
bnkxnit þ bntt ð14Þ
The index of scale efficiency change then can be calculated by usingEquations (10) and (14).
122 L. Laborda Castillo et al.
Dow
nloa
ded
by [
dani
el s
otel
sek]
at 0
1:17
28
May
201
4