Embed Size (px)
Citation preview
27
ACTA ECONOMICAVolume XV, No. 27 / December 2017ISSN 1512-858X, e‐ISSN 2232‐738X
O R I G I N A L S C I E N T I F I C P A P E R
UDC: 339.727.22:338.22(497) DOI: 10.7251/ACE1727027Z
Vasilj Žarković1 Dragan Gligorić2 Nikola Žarković3
Foreign Direct Investment and Economic Growth of the Central and Southeast European Countries
Стране директне инвестиције и економски раст земаља Централне и Југоисточне Европе
SummaryEconomic theory suggests that free capital flows increase the efficiency of the re-
source allocation and stimulate economic growth. Foreign direct investment (FDI) is seen as a remedy for all economic problems in countries that do not have a sufficient level of accumulation to start economic growth. According to economic criteria of Copenhagen, countries that are in the process of European integration should have a functioning market economy able to cope with competition and market forces within the European Union. The greatest expectations regarding the development of a competitive economy in the Southeast European (SEE) countries are precisely re-lated to attraction and exploitation of the positive effects of FDI. This paper explores the impact of FDI on economic growth of the Central European (CE) countries and the SEE countries. The experience of the CE countries can be beneficial for the SEE countries following them in the process of European integration. The results show that FDI flows to the SEE region are significantly lower than to the CE region. Panel analysis has shown a statistically significant impact of FDI on economic growth in 1 Faculty of Economics, University of Banja Luka, [email protected] Faculty of Economics, University of Banja Luka, [email protected] 3 National Bank of Serbia, [email protected]
28
Acta Economica, Volume XV, No. 27 / December 2017 27 – 57
both regions. However, in absolute terms the impact of FDI on economic growth in the SEE region is almost negligible.
Key words: foreign direct investment, economic growth, the structure of foreign direct investment.
РезимеЕкономска теорија сугерише да слободни токови капитала повећавају
ефикасност алокације рeсурса, те стимулишу економски раст. На стране директне инвестиције (СДИ) се гледа као на врсту лијека за све економске проблеме у земљама које немају довољан ниво акумулације за покретање привредног раста. Земље које се налазе у процесу евроинтеграција, према економском критеријуму из Копенхагена, треба да имају функционалне тр-жишне привреде способне да се носе са конкуренцијом и тржишним снагама унутар Европске уније. Највећа очекивања у погледу развоја конкурентне привреде у земљама Југоисточне Европе односе се управо на привлачење и ис-коришћавање позитивних ефеката СДИ. У овом раду истражује се утицај СДИ на економски раст земаља земаља Централне и Југоисточне Европе. Искуства земаља Централне Европе могу да послуже земљама Југоисточ-не Европе које их временски слиједе у процесу евроинтеграција. Резултати анализе показују да је прилив СДИ у регион Југоисточне Европе значајно мањи у односу на регион Централне Европе. Панел анализа показала је ста-тистички сигнификантан утицај СДИ на економски раст оба региона, али је у апсолутном износу утицај прилива СДИ на економски раст Југоисточ-не Европе скоро занемарив.
Кључне ријечи: стране директне инвестиције, економски раст, струк-тура страних директних инвестиција.
IntroductionForeign direct investment is a form of cross-border investment where a resident of a country has control or significant influence over the management of a com-pany which is a resident of another country. In practice it is possible to have the situation where the influence or control can be achieved with less than 50% or 10% of voting shares (IMF, 2009). There are several ways of investing capital as foreign direct investment: (1) the establishment of completely new economic en-tity on the territory of another country (greenfield); (2) the investment in exist-ing facilities through merger and aqusition; and (3) capital investment as a joint venture with local investors from the host country (Miljković, 2008).
29
Foreign Direct Investment and Economic Growth Vasilj Žarković et al. of the Central and Southeast European Countries
The lack of domestic accumulation to finance investments is a common char-acteristic at the beginning of the transition process for all transition countries. Without the inflow of foreign capital, the development of domestic production capacities was not possible, and the transition countries paid considerable atten-tion to creating an investment environment to attract foreign investors.
In the period that preceded the global economic crisis of 2008, the inflows of foreign investment in the transition countries were largely in the form of foreign direct investment (FDI), stimulated by a deeper institutional integration of the CE countries with the developed countries of the European Union. FDI inflows, as well as other forms of capital funding enabled much higher levels of invest-ment in relation to the level of domestic savings. Investments in the banking sec-tor had a special significance for the host country from two aspects. First, when establishing new banks or acquiring the existing ones in the process of privatiza-tion FDI meant the inflow of foreign reserves. Second, they enabled the transfer of foreign reserves to residents of the host country in the form of bank loans.
The global economic crisis of 2008 reduced the inflow of foreign capital. It is estimated that in the period after the outbreak of the global economic crisis FDI in the transition countries was even lower by 45% than it was expected (EBRD, 2015, p. 23). This caused smaller amount of investments. With a slight increase in savings, the reduction of investments meant an impressive reduction in the deficit of the balance of goods and services. However, a significant reduction of unemployment and stable economic growth require bigger investments, and the priority of a modern economic policy is the internal balance in relation to the external balance. In the aftermath of the global economic crisis, investments in transition countries were about 20% of GDP, which was about 10% lower than investments in fast-growing economies of Asia (EBRD, 2015).
Economic theory suggests that free capital flows increase the efficiency of the resource allocation and accordingly stimulate economic growth. International fi-nancial organisations, economic policy makers and most economists see FDI as a kind of remedy for all economic problems in fast-growing economies, and their positive impact on economic growth is implied. The efforts of many countries to attract more FDI confirm this fact, while many empirical studies have not yet confirmed the existence of a positive relationship between FDI inflows and eco-nomic growth (Mencinger, 2003; Umeora, 2013; Stanišić, 2008).
This paper analyses the impact of FDI inflows on economic growth in the Central European countries (the Czech Republic, Poland, Hungary, Slovakia, Slo-venia, Estonia, Latvia and Lithuania)4 and the Southeast European countries (Al-
4 Although the Baltic countries (Estonia, Latvia and Lithuania) do not belong to the concept of Central Europe, for simplicity, but above all because of the common features of transition process, these three countries will fall into a pattern of Central Europe.
30
Acta Economica, Volume XV, No. 27 / December 2017 27 – 57
bania, Bosnia and Herzegovina, Bulgaria, Romania, Croatia, Serbia, Macedonia and Montenegro).
Respectable economic development achieved by the CE countries is certainly due to FDI, which is the basic assumption tested in this paper. The fact is that the SEE countries have attracted a much smaller amount of FDI compared to what was expected. However, the question is whether the existing scarce inflow has been adequatively utilised, that is, whether it has been in the function of economic growth and development. The hypothesis in this paper is that FDI has not been a significant driver of economic growth in the SEE countries. Proving this hypothesis would send a message to policy makers in the SEE countries that efforts should be directed not only at the creation of policies for attracting for-eign direct investment, but also at policies for their exploitation. Otherwise, they will have to look for opportunities in other areas in order to initiate a significant and sustainable economic growth, increase the competitiveness of the national economy and reduce the potential negative effects of joining the EU at the level that does not allow equal competition with market forces within the EU.
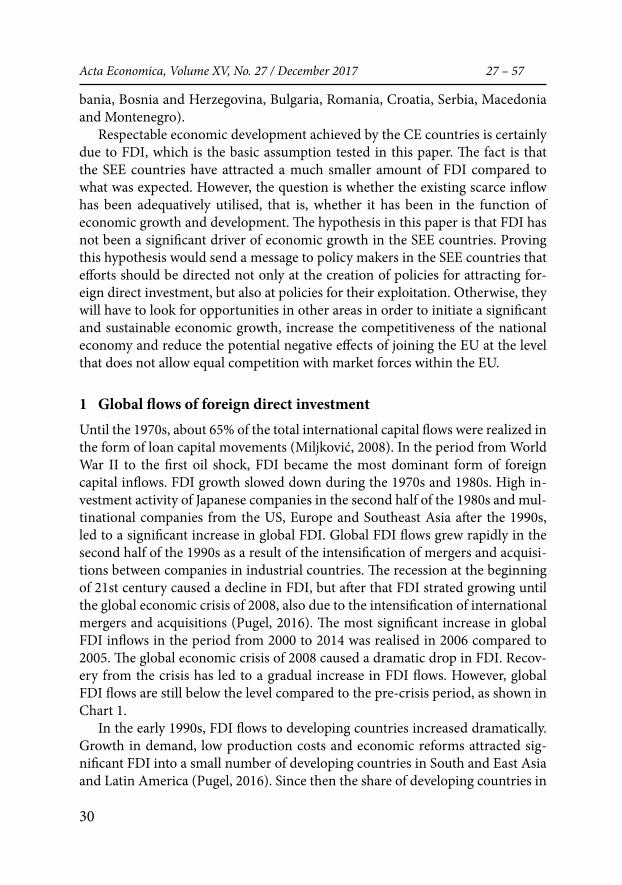
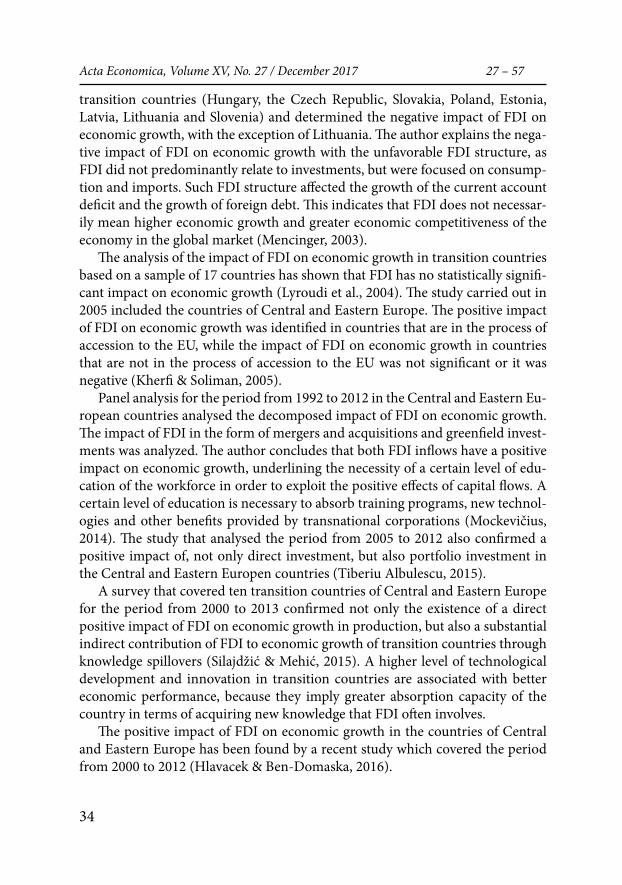
1 Global flows of foreign direct investmentUntil the 1970s, about 65% of the total international capital flows were realized in the form of loan capital movements (Miljković, 2008). In the period from World War II to the first oil shock, FDI became the most dominant form of foreign capital inflows. FDI growth slowed down during the 1970s and 1980s. High in-vestment activity of Japanese companies in the second half of the 1980s and mul-tinational companies from the US, Europe and Southeast Asia after the 1990s, led to a significant increase in global FDI. Global FDI flows grew rapidly in the second half of the 1990s as a result of the intensification of mergers and acquisi-tions between companies in industrial countries. The recession at the beginning of 21st century caused a decline in FDI, but after that FDI strated growing until the global economic crisis of 2008, also due to the intensification of international mergers and acquisitions (Pugel, 2016). The most significant increase in global FDI inflows in the period from 2000 to 2014 was realised in 2006 compared to 2005. The global economic crisis of 2008 caused a dramatic drop in FDI. Recov-ery from the crisis has led to a gradual increase in FDI flows. However, global FDI flows are still below the level compared to the pre-crisis period, as shown in Chart 1.
In the early 1990s, FDI flows to developing countries increased dramatically. Growth in demand, low production costs and economic reforms attracted sig-nificant FDI into a small number of developing countries in South and East Asia and Latin America (Pugel, 2016). Since then the share of developing countries in
31
Foreign Direct Investment and Economic Growth Vasilj Žarković et al. of the Central and Southeast European Countries
total FDI inflows gradually increased, with some fluctuations during the period from 1998 to 2013. In 2014, 55.5% of total FDI inflows were achieved by develop-ing countries, and it was the first time they accounted for over 50% of the total FDI inflow and attracted more FDI than developed countries. However, in 2015 developed countries regained the status of the largest FDI recipient with 54.62% of the total inflow. In 2015 FDI inflow into transition countries reached the low-est level in the period from 2006 to 2015, amounting to only 2% of the global FDI inflow. The reason for this, of course, is a decline in FDI inflows to Russia.
400,0
200,0
0
600,0
800,0
1 000,0
1 200,0
1 400,0
1 600,0
1 800,0
2 000,0
2000
2001
2002
2003
2004
2005
2006
2007
2008
2009
2010
2011
2012
2013
2014
2015
Developed economies Developing economies Transi�on economies
Chart 1: FDI inflows in the period from 2000 to 2015 (in billions of $)
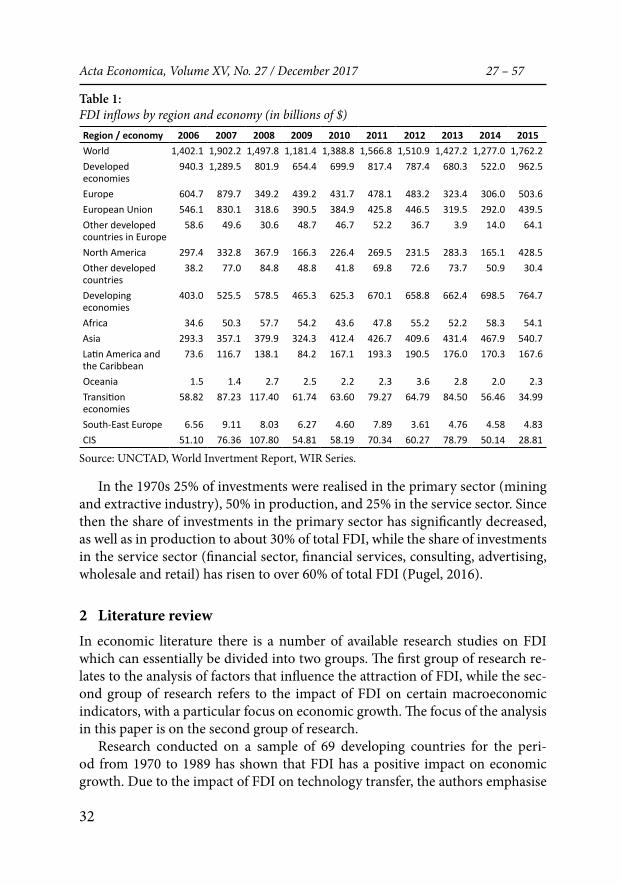
Source: UNCTAD, World Investment Report, WIR Series.Of all regions shown in Table 1 it is evident that the crisis of 2008 reduced
FDI inflows most significantly to the countries that currently have the “status of transition countries”5. In 2009 compared to 2008, FDI inflows to this group of countries decreased from 116.2 to 70.49 billion US dollars, which is about 39.3%.
5 The data of the United Nations Conference on Trade and Development (UNCTAD) relating to transition countries do not include countries that have become members of the European Union, since these countries are classified into a group of developed countries, but the countries that cur-rently have the “status” of the transition countries (Albania, BiH, Kosovo (UMNIK), Montenegro, Serbia and Macedonia).
32
Acta Economica, Volume XV, No. 27 / December 2017 27 – 57
Table 1:FDI inflows by region and economy (in billions of $)Region / economy 2006 2007 2008 2009 2010 2011 2012 2013 2014 2015World 1,402.1 1,902.2 1,497.8 1,181.4 1,388.8 1,566.8 1,510.9 1,427.2 1,277.0 1,762.2Developed economies
940.3 1,289.5 801.9 654.4 699.9 817.4 787.4 680.3 522.0 962.5
Europe 604.7 879.7 349.2 439.2 431.7 478.1 483.2 323.4 306.0 503.6European Union 546.1 830.1 318.6 390.5 384.9 425.8 446.5 319.5 292.0 439.5Other developed countries in Europe
58.6 49.6 30.6 48.7 46.7 52.2 36.7 3.9 14.0 64.1
North America 297.4 332.8 367.9 166.3 226.4 269.5 231.5 283.3 165.1 428.5Other developed countries
38.2 77.0 84.8 48.8 41.8 69.8 72.6 73.7 50.9 30.4
Developing economies
403.0 525.5 578.5 465.3 625.3 670.1 658.8 662.4 698.5 764.7
Africa 34.6 50.3 57.7 54.2 43.6 47.8 55.2 52.2 58.3 54.1Asia 293.3 357.1 379.9 324.3 412.4 426.7 409.6 431.4 467.9 540.7Latin America and the Caribbean
73.6 116.7 138.1 84.2 167.1 193.3 190.5 176.0 170.3 167.6
Oceania 1.5 1.4 2.7 2.5 2.2 2.3 3.6 2.8 2.0 2.3Transition economies
58.82 87.23 117.40 61.74 63.60 79.27 64.79 84.50 56.46 34.99
South-East Europe 6.56 9.11 8.03 6.27 4.60 7.89 3.61 4.76 4.58 4.83 CIS 51.10 76.36 107.80 54.81 58.19 70.34 60.27 78.79 50.14 28.81
Source: UNCTAD, World Invertment Report, WIR Series.
In the 1970s 25% of investments were realised in the primary sector (mining and extractive industry), 50% in production, and 25% in the service sector. Since then the share of investments in the primary sector has significantly decreased, as well as in production to about 30% of total FDI, while the share of investments in the service sector (financial sector, financial services, consulting, advertising, wholesale and retail) has risen to over 60% of total FDI (Pugel, 2016).
2 Literature review In economic literature there is a number of available research studies on FDI which can essentially be divided into two groups. The first group of research re-lates to the analysis of factors that influence the attraction of FDI, while the sec-ond group of research refers to the impact of FDI on certain macroeconomic indicators, with a particular focus on economic growth. The focus of the analysis in this paper is on the second group of research.
Research conducted on a sample of 69 developing countries for the peri-od from 1970 to 1989 has shown that FDI has a positive impact on economic growth. Due to the impact of FDI on technology transfer, the authors emphasise
33
Foreign Direct Investment and Economic Growth Vasilj Žarković et al. of the Central and Southeast European Countries
that FDI has more positive impact on economic growth compared to domestic investments. However, the analysis has shown that exploitation of the positive effects of FDI requires of an adequate level of development of human resources capable of using modern technology (Borensztein et al., 1995).
Research conducted by Laura Alfaro for the period from 1981 to 1999 on a sample of 47 countries showed that investments in different economic sectors in the host country have a different impact on economic growth. FDI directed to the primary sector has a negative impact, while FDI targeted to production has a positive impact on economic growth. The impact of FDI on economic growth in the services sector was ambiguous, and the study did not give a single conclusion on the effect of investments in this sector (Alfaro, 2003).
The survey that covered the period from 1980 to 2003 on a sample of 79 coun-tries, analysed factors that influence the utilization of positive effects of FDI on economic growth. The research has shown that FDI have a stronger positive im-pact on economic growth if the workforce in the country has a higher level of education, if the country is more open, if the financial markets are more devel-oped, if the growth rate of population is lower and if the country is less risky (Vo & Batten, 2006).
The analysis of the impact of FDI on economic growth on a sample of 125 countries for the period from 1980 to 2010 has shown that FDI has a positive impact on economic growth, but the impact varies depending on the level of development of the host country. FDI has a more positive impact on economic growth in developing countries compared to developed and less developed coun-tries. The survey has also shown that a higher degree of economic freedom index means a more positive impact of FDI on economic growth and that direct in-vestment has a more positive impact on economic growth than foreign portfolio investment (Tintin, 2012).
More recently, an increasing number of studies on the impact of FDI on eco-nomic growth have analysed the assumptions about a positive impact of FDI on economic growth that need to be confirmed. FDI will have a positive impact on economic growth in the long term through the transfer of technology and knowl-edge only if there is a sufficient level of education of the domestic workforce, de-veloped financial system, trade openness and institutional quality in the country (political stability, the level of corruption, government efficiency, the rule of law, quality of law, etc.). These factors are often referred to as the “absorptive capacity of countries”.
There are a number of studies on the impact of FDI on macroeconomic per-formance in transition countries which are the subject of the analysis in this pa-per. In the survey conducted in 2003 Jože Menciger analysed the impact of FDI inflows on macroeconomic performance in the period from 1994 to 2001 in eight
34
Acta Economica, Volume XV, No. 27 / December 2017 27 – 57
transition countries (Hungary, the Czech Republic, Slovakia, Poland, Estonia, Latvia, Lithuania and Slovenia) and determined the negative impact of FDI on economic growth, with the exception of Lithuania. The author explains the nega-tive impact of FDI on economic growth with the unfavorable FDI structure, as FDI did not predominantly relate to investments, but were focused on consump-tion and imports. Such FDI structure affected the growth of the current account deficit and the growth of foreign debt. This indicates that FDI does not necessar-ily mean higher economic growth and greater economic competitiveness of the economy in the global market (Mencinger, 2003).
The analysis of the impact of FDI on economic growth in transition countries based on a sample of 17 countries has shown that FDI has no statistically signifi-cant impact on economic growth (Lyroudi et al., 2004). The study carried out in 2005 included the countries of Central and Eastern Europe. The positive impact of FDI on economic growth was identified in countries that are in the process of accession to the EU, while the impact of FDI on economic growth in countries that are not in the process of accession to the EU was not significant or it was negative (Kherfi & Soliman, 2005).
Panel analysis for the period from 1992 to 2012 in the Central and Eastern Eu-ropean countries analysed the decomposed impact of FDI on economic growth. The impact of FDI in the form of mergers and acquisitions and greenfield invest-ments was analyzed. The author concludes that both FDI inflows have a positive impact on economic growth, underlining the necessity of a certain level of edu-cation of the workforce in order to exploit the positive effects of capital flows. A certain level of education is necessary to absorb training programs, new technol-ogies and other benefits provided by transnational corporations (Mockevičius, 2014). The study that analysed the period from 2005 to 2012 also confirmed a positive impact of, not only direct investment, but also portfolio investment in the Central and Eastern Europen countries (Tiberiu Albulescu, 2015).
A survey that covered ten transition countries of Central and Eastern Europe for the period from 2000 to 2013 confirmed not only the existence of a direct positive impact of FDI on economic growth in production, but also a substantial indirect contribution of FDI to economic growth of transition countries through knowledge spillovers (Silajdžić & Mehić, 2015). A higher level of technological development and innovation in transition countries are associated with better economic performance, because they imply greater absorption capacity of the country in terms of acquiring new knowledge that FDI often involves.
The positive impact of FDI on economic growth in the countries of Central and Eastern Europe has been found by a recent study which covered the period from 2000 to 2012 (Hlavacek & Ben-Domaska, 2016).
35
Foreign Direct Investment and Economic Growth Vasilj Žarković et al. of the Central and Southeast European Countries
There are numerous studies aimed at analysing the impact of FDI on eco-nomic growth of the SEE countries. Analysis carried out in 2005 which used correlation analysis for the period from 1997 to 2006 did not confirm the ex-istence of interdependence between these two variables (Stanišić, 2008), while the research by Jurica Šimurina confirmed the positive relationship between FDI and economic growth. However, this relationship was not statistically significant (Bogdan, 2009).
Research conducted in the SEE countries for the period from 1990 to 2011 (Estrin & Uvalic, 2013) determined the positive impact of FDI inflow on gross fixed capital formation and restructuring of firms in the privatization process. The authors also emphasise the shortcomings of the privatization process, given that there was no adequate restructuring of companies due to the small share of FDI that was directed to production sector. FDI dominated in the services sector with 69.8% of the total FDI inflow in 2010. Due to the inadequate structure of investment, companies in the region failed to integrate into the global value chain and exports were insufficiently increased, with an unfavorable structure domi-nated by lower-level processing products. Particularly emphasised is the lagging behind of the transition countries of SEE in relation to the countries of Central and Eastern Europe and the Baltics. Exports, expressed as a percentage of GDP in the SEE countries in 2008 amounted to an average of 33%, while in the countries of Central and Eastern Europe and the Baltics it amounted to 66% of GDP. The unfavorable structure of FDI is the reason for the relatively high unemployment rate and lower rates of economic growth in the SEE countries.
Recent analysis (Popovčić−Avrić et al., 2014) also confirmed the impact of FDI on economic growth for six Western Balkan countries. The research of the impact of FDI on economic growth in the SEE countries, which analysed pre-crisis and post-crisis periods separately, determined the existence of a positive impact, but this relationship is significantly weaker in the post-global economic crisis period of 2008 (Kragulj & Parezanin, 2015). The analysis that included six SEE countries explored the impact of FDI inflows on individual countries as well as the whole region. The results of the analysis show that FDI played a key role in creating a capital base for financing production, and that the results were better in Macedonia, Serbia and Croatia than in Albania and Bosnia and Herzegovina. On the other hand, in Slovenia economic growth is financed primarily by domes-tic investments. The author concludes that considering the whole region, FDI had a positive impact on economic growth. (Apostolov, 2016).
36
Acta Economica, Volume XV, No. 27 / December 2017 27 – 57
3 Research methodsThis paper explores the impact of foreign direct investment on economic growth in the CE and SEE countries. Due to the heterogeneity of these two groups of countries, the analysis is performed separately in order to obtain more relevant conclusions and use the observed experience of the CE countries to understand the possible effects of FDI on economic growth in the SEE countries. The CE countries, which are the subject of the analysis, are: the Czech Republic, Poland, Hungary, Slovakia, Slovenia, Estonia, Latvia and Lithuania, while the SEE coun-tries are: Albania, Bosnia and Herzegovina, Bulgaria, Romania, Croatia, Serbia, Macedonia and Montenegro.
The analysis period is different for these two groups of countries and it is de-termined by the available data for the variables to be analysed. For the CE coun-tries in the relevant databases (World Bank − WB, International Monetary Fund − IMF, the United Nations Conference on Trade and Development − UNCTAD), data enabling the creation of an acceptable database for research are available for the period from 1996 to 2015. Therefore, the research for the CE countries is only done for this period. Data for the SEE countries are only available from 2001, al-though data for Montenegro are not available for this year. Therefore, the analysis period for the SEE countries is the period from 2001 to 2015.
Data for the analysis include data for each country during a certain analysis period. The most reliable analysis which includes data for multiple countries (N cross-sections, i = 1, 2, 3..., N) over several time periods (T periods, t = 1, 2, 3..., T) is a panel analysis. Precisely because of the possibility of including more coun-tries in the analysis, with the possibility of respecting the specificity of the time series of each country individually, this analysis has gained in popularity. The ba-sic classification of the panel model is static and dynamic models. Dynamic panel models, unlike static ones, are characterized by the presence of a lagged depend-ent variable among regressors (Asteriou & Hall, 2016). Within these two groups of panels a number of methods have been developed. Which method is adequate for the analysis depends on both the length of the time series and the number of countries that are the subject of the analysis, their relationship, as well as the re-sults of a series of other tests among which the most significant test is a unit root test. Therefore, the specific method to be used in the analysis will be determined after the analysis of the data for the given group of countries (for more details on panel methods, see Asteriou & Hall, 2016, pp. 439-482).
The analysis of the impact of FDI on economic growth implies an assessment of the regression equation, where independent variable is economic growth and dependent variable is FDI inflow. In order to obtain a reliable estimates of the im-pact of FDI on economic growth, it is necessary to include a number of other in-
37
Foreign Direct Investment and Economic Growth Vasilj Žarković et al. of the Central and Southeast European Countries
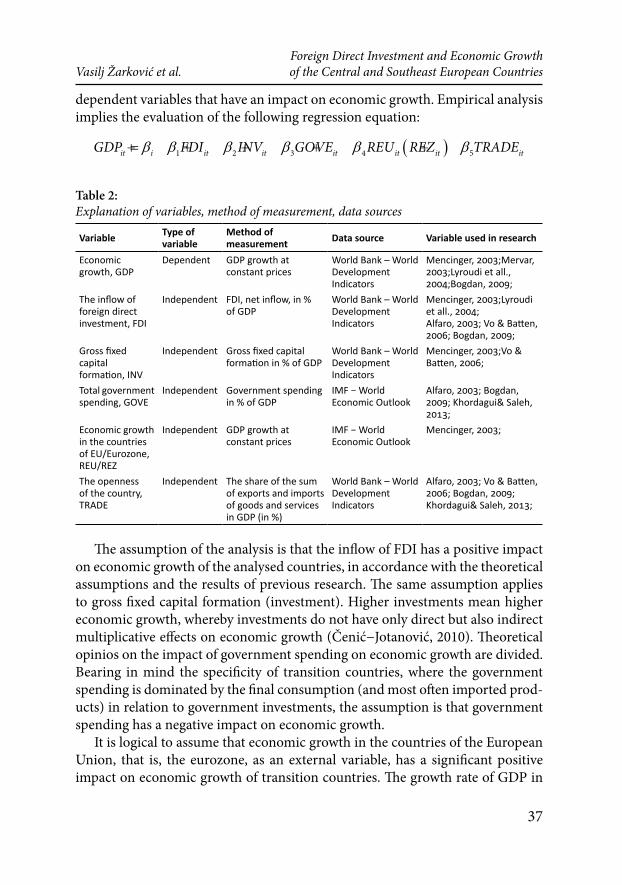
dependent variables that have an impact on economic growth. Empirical analysis implies the evaluation of the following regression equation:
( )1 2 3 4 5it i it it it it it itGDP FDI INV GOVE REU REZ TRADEβ β β β β β= + + + + +
Table 2:Explanation of variables, method of measurement, data sources
Variable Type of variable
Method of measurement Data source Variable used in research
Economic growth, GDP
Dependent GDP growth at constant prices
World Bank – World Development Indicators
Mencinger, 2003;Mervar, 2003;Lyroudi et all., 2004;Bogdan, 2009;
The inflow of foreign direct investment, FDI
Independent FDI, net inflow, in % of GDP
World Bank – World Development Indicators
Mencinger, 2003;Lyroudi et all., 2004;Alfaro, 2003; Vo & Batten, 2006; Bogdan, 2009;
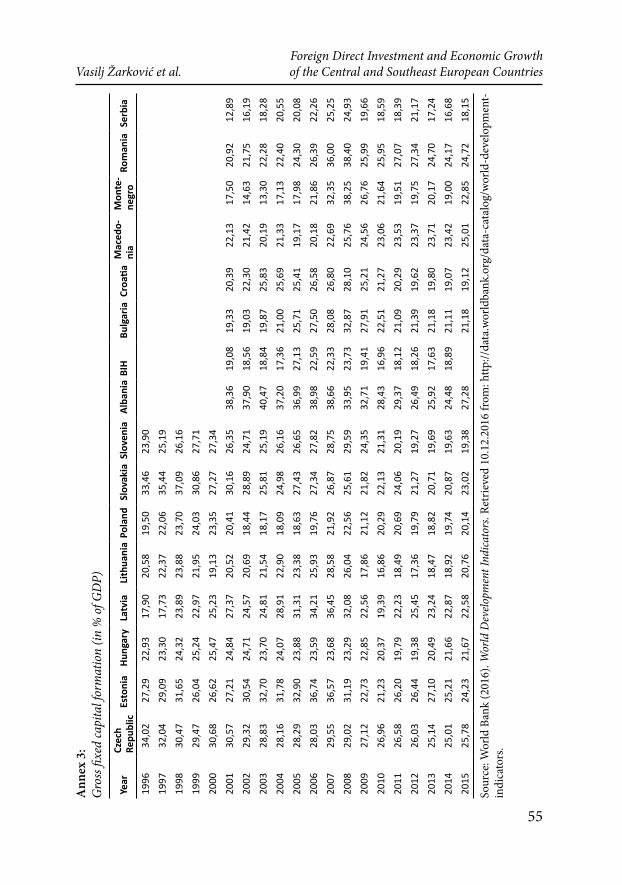
Gross fixed capital formation, INV
Independent Gross fixed capital formation in % of GDP
World Bank – World Development Indicators
Mencinger, 2003;Vo & Batten, 2006;
Total government spending, GOVE
Independent Government spending in % of GDP
IMF − World Economic Outlook
Alfaro, 2003; Bogdan, 2009; Khordagui& Saleh, 2013;
Economic growth in the countries of ЕU/Eurozone, REU/REZ
Independent GDP growth at constant prices
IMF − World Economic Outlook
Mencinger, 2003;
The openness of the country, TRADE
Independent The share of the sum of exports and imports of goods and services in GDP (in %)
World Bank – World Development Indicators
Alfaro, 2003; Vo & Batten, 2006; Bogdan, 2009; Khordagui& Saleh, 2013;
The assumption of the analysis is that the inflow of FDI has a positive impact on economic growth of the analysed countries, in accordance with the theoretical assumptions and the results of previous research. The same assumption applies to gross fixed capital formation (investment). Higher investments mean higher economic growth, whereby investments do not have only direct but also indirect multiplicative effects on economic growth (Čenić−Jotanović, 2010). Theoretical opinios on the impact of government spending on economic growth are divided. Bearing in mind the specificity of transition countries, where the government spending is dominated by the final consumption (and most often imported prod-ucts) in relation to government investments, the assumption is that government spending has a negative impact on economic growth.
It is logical to assume that economic growth in the countries of the European Union, that is, the eurozone, as an external variable, has a significant positive impact on economic growth of transition countries. The growth rate of GDP in
38
Acta Economica, Volume XV, No. 27 / December 2017 27 – 57
the countries of the eurozone was used for the CE countries. Although five CE countries (the members are not only the Czech Republic, Hungary and Poland) have become part of the eurozone, economic growth in the euorozone countries can be considered as an external variable, because they were out of the eurozone during most of the analysis period. Slovenia introduced the euro in 2007, Slova-kia in 2009, Estonia, Latvia and Lithuania in 2011, 2014, and 2015 respectively. For the SEE countries the choice of economic growth in the European Union is a logical choice of variable which would represent the influence of external fac-tors. Romania and Bulgaria have been members of the European Union since 2007, and Croatia since 1 July 2013, and during a substantial part of the analysed period (from 2001 to 2015) they were outside the EU. Also, economies of these countries are too small to affect significantly the economic growth of the EU.
The level of openness of the national economy can have a different impact on economic growth. If the economy is underdeveloped, then in principle, it will achieve foreign trade balance deficit, which in the short term has a negative im-pact on economic growth. For more developed economies, it is logical to assume that a higher level of openness also means greater economic growth. In this pa-per, our assumption is that a higher level of openness of the CE countries has a positive impact on economic growth, and the expected sign of the coefficient wih this variable is positive. The assumption for the SEE countries, which have an insufficiently competitive economy, is the opposite.
4 Results
4.1 Central Europe
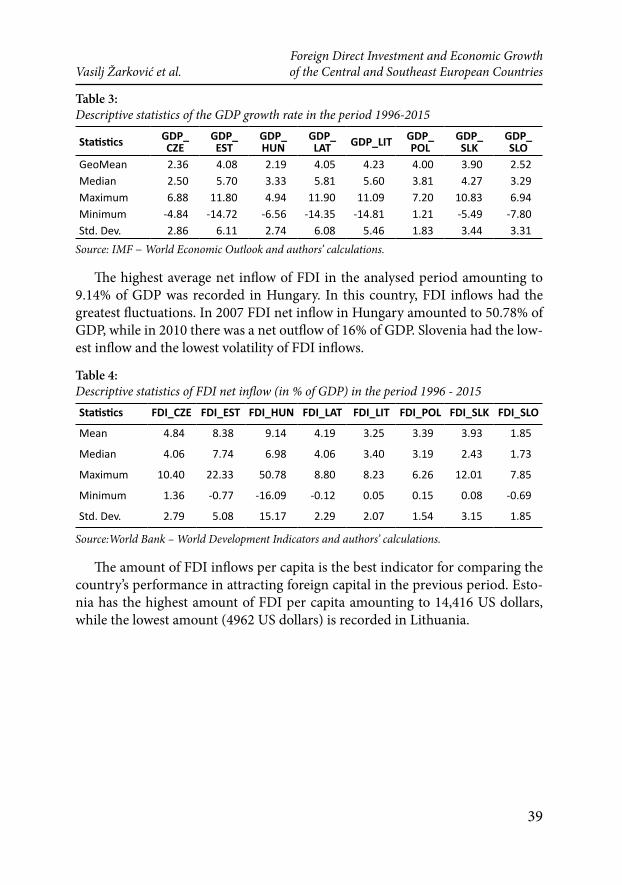
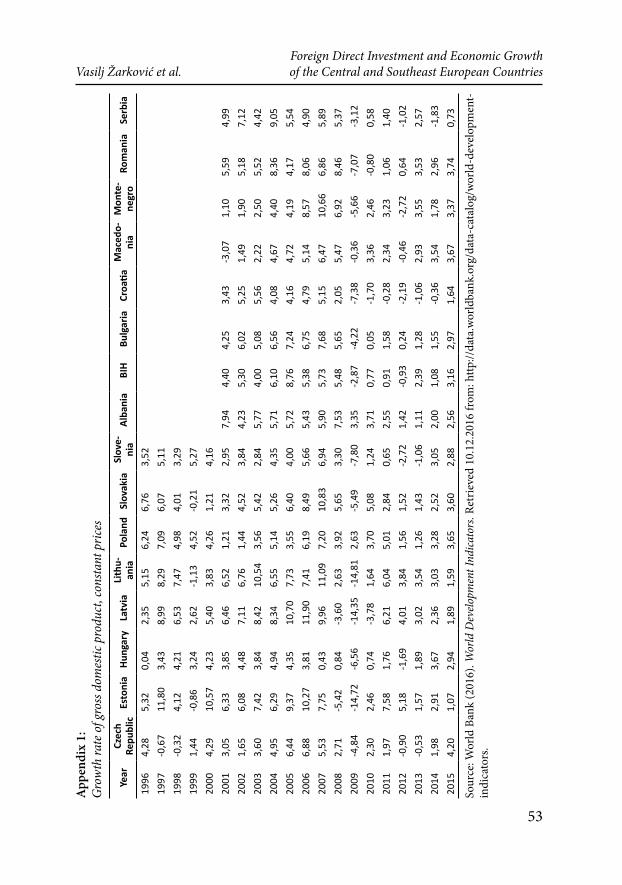
The highest GDP growth rate (geometric rate) in the period from 1996 to 2015 was recorded in Lithuania (4.39%), followed by Estonia (4.25%) and Latvia (4.23%). The lowest GDP growth rate in all countries was achieved in 2009 due to the impact of the global economic crisis, except in Poland where the lowest GDP growth rate of 1.21% was achieved in 2001 and in 2009 it was 2.6%. The highest volatility of GDP, measured by the standard deviation, in the analysed period was in Estonia, where the average deviation from the average GDP growth rate was 6.11, followed by Latvia and Lithuania. Three countries that had the highest growth rate also had the highest volatility of economic growth. The lowest rate of economic growth was recorded in Hungary, while the most stable economic growth was recorded in Poland. In economic literature, volatility of GDP is of-ten considered as a measure of uncertainty and higher volatility of GDP means greater economic uncertainty (Pablo Dapena, 2006, p.4).
39
Foreign Direct Investment and Economic Growth Vasilj Žarković et al. of the Central and Southeast European Countries
Table 3:Descriptive statistics of the GDP growth rate in the period 1996-2015
Statistics GDP_CZE
GDP_EST
GDP_HUN
GDP_LAT GDP_LIT GDP_
POLGDP_SLK
GDP_SLO
GeoMean 2.36 4.08 2.19 4.05 4.23 4.00 3.90 2.52Median 2.50 5.70 3.33 5.81 5.60 3.81 4.27 3.29Maximum 6.88 11.80 4.94 11.90 11.09 7.20 10.83 6.94Minimum -4.84 -14.72 -6.56 -14.35 -14.81 1.21 -5.49 -7.80Std. Dev. 2.86 6.11 2.74 6.08 5.46 1.83 3.44 3.31
Source: IMF − World Economic Outlook and authors’ calculations.
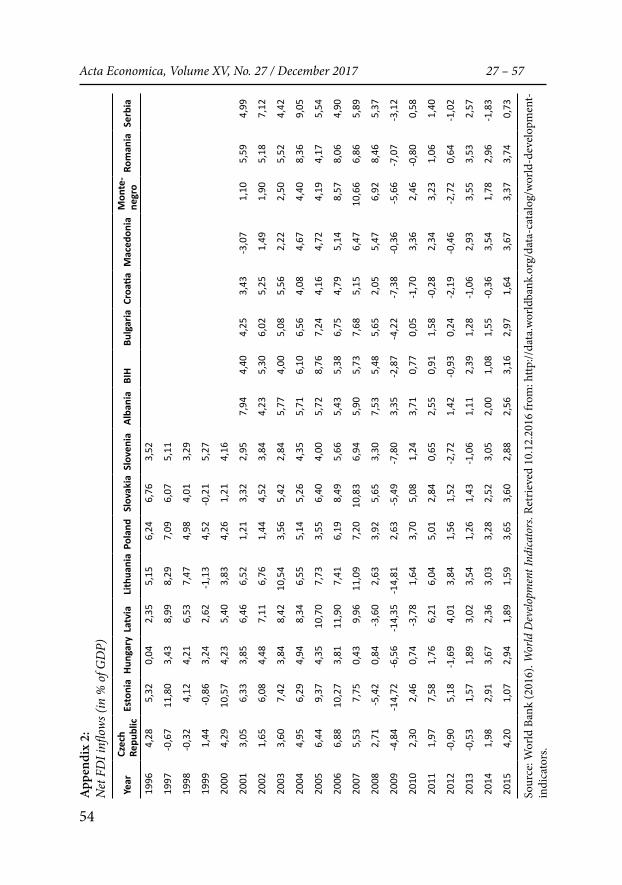
The highest average net inflow of FDI in the analysed period amounting to 9.14% of GDP was recorded in Hungary. In this country, FDI inflows had the greatest fluctuations. In 2007 FDI net inflow in Hungary amounted to 50.78% of GDP, while in 2010 there was a net outflow of 16% of GDP. Slovenia had the low-est inflow and the lowest volatility of FDI inflows.
Table 4: Descriptive statistics of FDI net inflow (in % of GDP) in the period 1996 - 2015Statistics FDI_CZE FDI_EST FDI_HUN FDI_LAT FDI_LIT FDI_POL FDI_SLK FDI_SLO
Mean 4.84 8.38 9.14 4.19 3.25 3.39 3.93 1.85
Median 4.06 7.74 6.98 4.06 3.40 3.19 2.43 1.73
Maximum 10.40 22.33 50.78 8.80 8.23 6.26 12.01 7.85
Minimum 1.36 -0.77 -16.09 -0.12 0.05 0.15 0.08 -0.69
Std. Dev. 2.79 5.08 15.17 2.29 2.07 1.54 3.15 1.85
Source:World Bank – World Development Indicators and authors’ calculations.
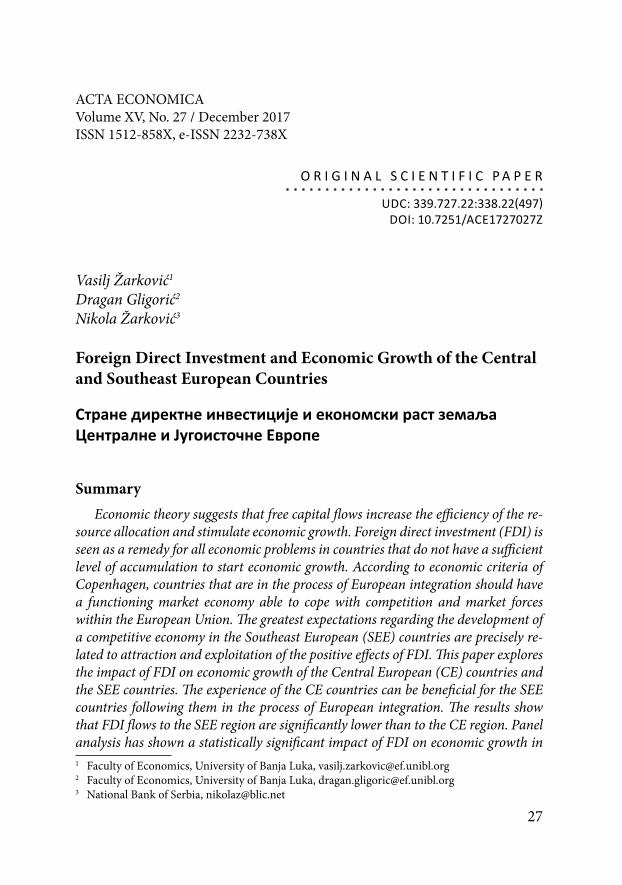
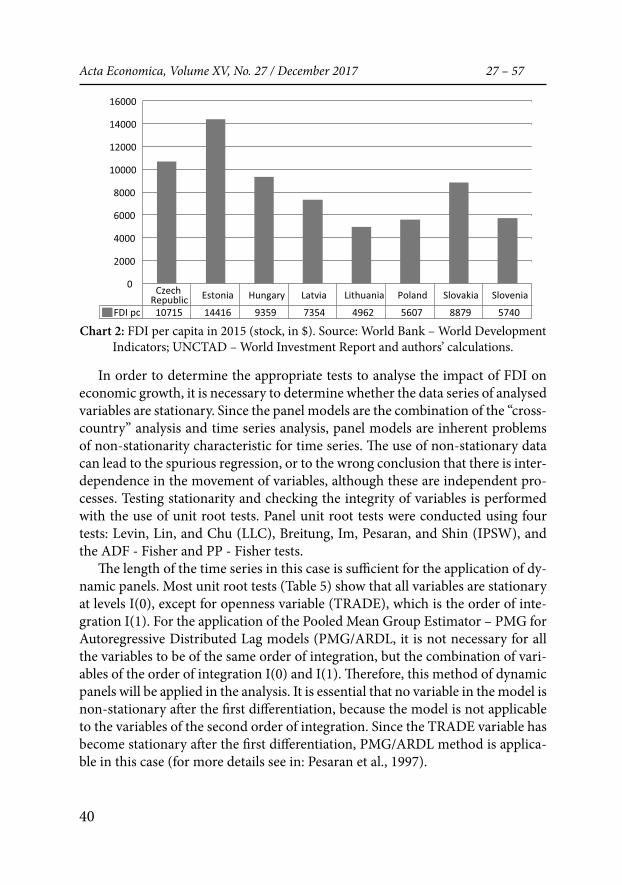
The amount of FDI inflows per capita is the best indicator for comparing the country’s performance in attracting foreign capital in the previous period. Esto-nia has the highest amount of FDI per capita amounting to 14,416 US dollars, while the lowest amount (4962 US dollars) is recorded in Lithuania.
40
Acta Economica, Volume XV, No. 27 / December 2017 27 – 57
Czech Republic Estonia Hungary Latvia Lithuania Poland Slovakia Slovenia
FDI pc 10715 14416 9359 7354 4962 5607 8879 5740
0
2000
4000
6000
8000
10000
12000
14000
16000
Chart 2: FDI per capita in 2015 (stock, in $). Source: World Bank – World Development Indicators; UNCTAD – World Investment Report and authors’ calculations.
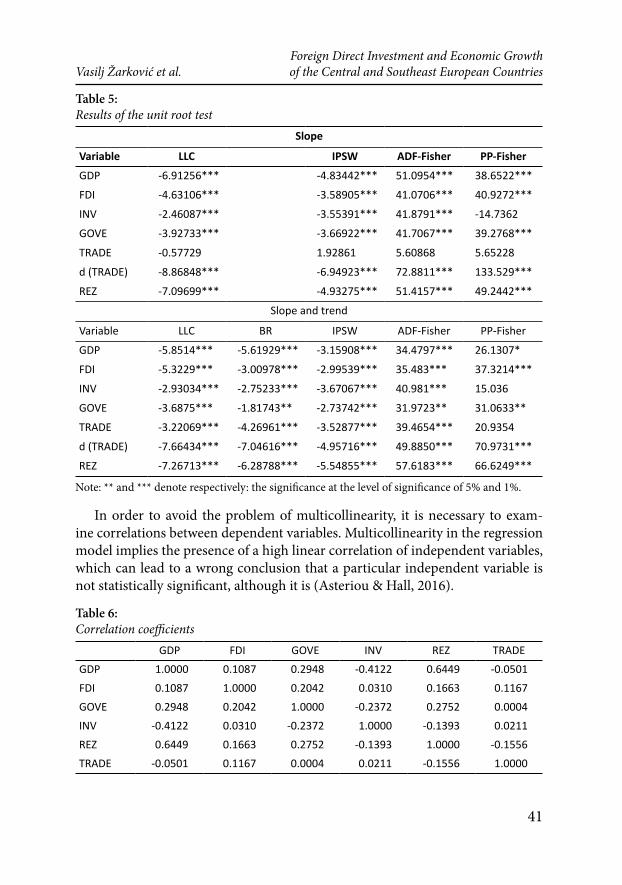
In order to determine the appropriate tests to analyse the impact of FDI on economic growth, it is necessary to determine whether the data series of analysed variables are stationary. Since the panel models are the combination of the “cross-country” analysis and time series analysis, panel models are inherent problems of non-stationarity characteristic for time series. The use of non-stationary data can lead to the spurious regression, or to the wrong conclusion that there is inter-dependence in the movement of variables, although these are independent pro-cesses. Testing stationarity and checking the integrity of variables is performed with the use of unit root tests. Panel unit root tests were conducted using four tests: Levin, Lin, and Chu (LLC), Breitung, Im, Pesaran, and Shin (IPSW), and the ADF - Fisher and PP - Fisher tests.
The length of the time series in this case is sufficient for the application of dy-namic panels. Most unit root tests (Table 5) show that all variables are stationary at levels I(0), except for openness variable (TRADE), which is the order of inte-gration I(1). For the application of the Pooled Mean Group Estimator – PMG for Autoregressive Distributed Lag models (PMG/ARDL, it is not necessary for all the variables to be of the same order of integration, but the combination of vari-ables of the order of integration I(0) and I(1). Therefore, this method of dynamic panels will be applied in the analysis. It is essential that no variable in the model is non-stationary after the first differentiation, because the model is not applicable to the variables of the second order of integration. Since the TRADE variable has become stationary after the first differentiation, PMG/ARDL method is applica-ble in this case (for more details see in: Pesaran et al., 1997).
41
Foreign Direct Investment and Economic Growth Vasilj Žarković et al. of the Central and Southeast European Countries
Table 5: Results of the unit root test
Slope
Variable LLC IPSW ADF-Fisher PP-Fisher
GDP -6.91256*** -4.83442*** 51.0954*** 38.6522***
FDI -4.63106*** -3.58905*** 41.0706*** 40.9272***
INV -2.46087*** -3.55391*** 41.8791*** -14.7362
GOVE -3.92733*** -3.66922*** 41.7067*** 39.2768***
ТRADE -0.57729 1.92861 5.60868 5.65228
d (TRADE) -8.86848*** -6.94923*** 72.8811*** 133.529***
REZ -7.09699*** -4.93275*** 51.4157*** 49.2442***
Slope and trend
Variable LLC BR IPSW ADF-Fisher PP-Fisher
GDP -5.8514*** -5.61929*** -3.15908*** 34.4797*** 26.1307*
FDI -5.3229*** -3.00978*** -2.99539*** 35.483*** 37.3214***
INV -2.93034*** -2.75233*** -3.67067*** 40.981*** 15.036
GOVE -3.6875*** -1.81743** -2.73742*** 31.9723** 31.0633**
TRADE -3.22069*** -4.26961*** -3.52877*** 39.4654*** 20.9354
d (TRADE) -7.66434*** -7.04616*** -4.95716*** 49.8850*** 70.9731***
REZ -7.26713*** -6.28788*** -5.54855*** 57.6183*** 66.6249***
Note: ** and *** denote respectively: the significance at the level of significance of 5% and 1%.
In order to avoid the problem of multicollinearity, it is necessary to exam-ine correlations between dependent variables. Multicollinearity in the regression model implies the presence of a high linear correlation of independent variables, which can lead to a wrong conclusion that a particular independent variable is not statistically significant, although it is (Asteriou & Hall, 2016).
Table 6:Correlation coefficients GDP FDI GOVE INV REZ TRADEGDP 1.0000 0.1087 0.2948 -0.4122 0.6449 -0.0501FDI 0.1087 1.0000 0.2042 0.0310 0.1663 0.1167GOVE 0.2948 0.2042 1.0000 -0.2372 0.2752 0.0004INV -0.4122 0.0310 -0.2372 1.0000 -0.1393 0.0211REZ 0.6449 0.1663 0.2752 -0.1393 1.0000 -0.1556TRADE -0.0501 0.1167 0.0004 0.0211 -0.1556 1.0000
42
Acta Economica, Volume XV, No. 27 / December 2017 27 – 57
The analysis of correlation coefficients between independent variables leads to the conclusion that there is no high level of correlation between these variables. The correlation coefficient between the dependent variable GDP and the inde-pendent variable TRADE is extremely low (−0.05), which indicates that it is nec-essary to examine whether the inclusion of this variable in the model results in a better or worse model, i.e. whether its inclusion is econometrically acceptable. The inclusion of the TRADE variable in the model results in the Schwarz crite-rion of 4.93, while the value of this criterion without this variable in the model is 4.77. Therefore, the model is better without the TRADE variable.
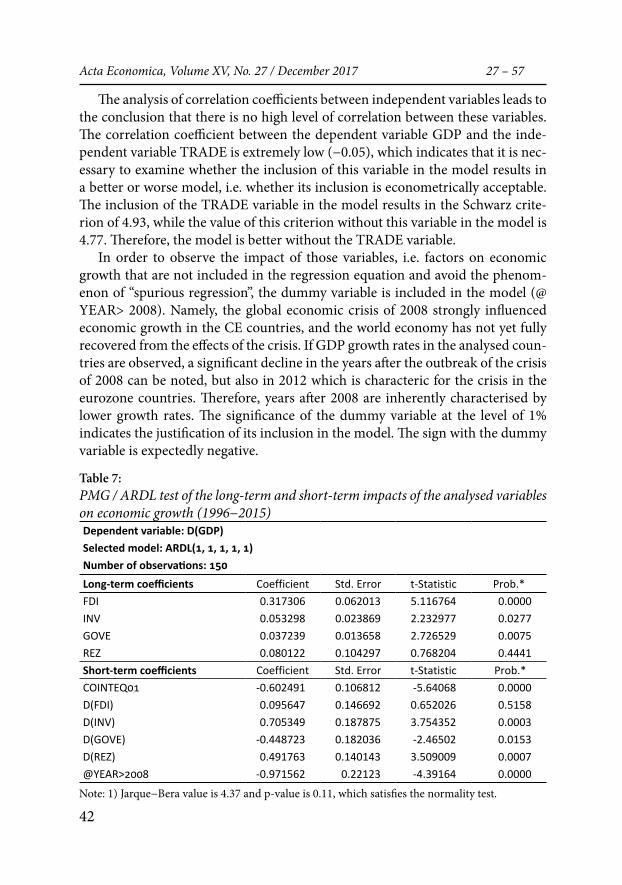
In order to observe the impact of those variables, i.e. factors on economic growth that are not included in the regression equation and avoid the phenom-enon of “spurious regression”, the dummy variable is included in the model (@YEAR> 2008). Namely, the global economic crisis of 2008 strongly influenced economic growth in the CE countries, and the world economy has not yet fully recovered from the effects of the crisis. If GDP growth rates in the analysed coun-tries are observed, a significant decline in the years after the outbreak of the crisis of 2008 can be noted, but also in 2012 which is characteric for the crisis in the eurozone countries. Therefore, years after 2008 are inherently characterised by lower growth rates. The significance of the dummy variable at the level of 1% indicates the justification of its inclusion in the model. The sign with the dummy variable is expectedly negative.
Table 7: PMG / ARDL test of the long-term and short-term impacts of the analysed variables on economic growth (1996−2015)Dependent variable: D(GDP) Selected model: ARDL(1, 1, 1, 1, 1)Number of observations: 150 Long-term coefficients Coefficient Std. Error t-Statistic Prob.* FDI 0.317306 0.062013 5.116764 0.0000INV 0.053298 0.023869 2.232977 0.0277GOVE 0.037239 0.013658 2.726529 0.0075REZ 0.080122 0.104297 0.768204 0.4441Short-term coefficients Coefficient Std. Error t-Statistic Prob.* COINTEQ01 -0.602491 0.106812 -5.64068 0.0000D(FDI) 0.095647 0.146692 0.652026 0.5158D(INV) 0.705349 0.187875 3.754352 0.0003D(GOVE) -0.448723 0.182036 -2.46502 0.0153D(REZ) 0.491763 0.140143 3.509009 0.0007@YEAR>2008 -0.971562 0.22123 -4.39164 0.0000
Note: 1) Jarque−Bera value is 4.37 and p-value is 0.11, which satisfies the normality test.
43
Foreign Direct Investment and Economic Growth Vasilj Žarković et al. of the Central and Southeast European Countries
Results of the PMG/ARDL test indicate that all analysed variables have a long-term impact on economic growth measured by growth rates of gross domestic product (GDP), except REZ variables. The FDI variable is statistically significant at the level of 1% and the sign of the coefficient with an independent variable is in line with expectations and it is positive. Higher net inflows of FDI measured by participation in GDP result in higher economic growth. The INV variable is statistically significant at the level of 5%. Bigger share of gross fixed capital forma-tion in GDP results in a higher rate of economic growth. The GOVE variable is statistically significant at the significance level of 1%. Although we expected that higher government spending in the long term means lower economic growth, the results show that government spending has a positive impact on econom-ic growth. If the government investments are a significant part of government spending and if countries are less import-dependent, government spending will have a positive impact on economic growth in line with Keynesian theory. There-fore, from this aspect and with the above assumptions, the positive impact of government spending on economic growth is logical. The REZ variable in this model does not have a statistically significant impact on economic growth of the CE countries in the long term, although the coefficient is positive, that is, in line with expectations. Additional tests show that the model without dummy vari-ables has resulted in a positive and statistically significant impact of economic growth of the eurozone (REZ) on economic growth of the CE countries. Also, the shortening of the analysis period for the period from 1999 to 2015 has resulted in a statistically significant and positive impact of the REZ variable on the depend-ent GDP variable. Therefore, the insignificance of the variable in this REZ model can be attributed to multicollinearity with the dummy variable, i.e. the degree of integration of the CE countries with the countries of the eurozone.
The error correction factor (COINTEQ01) shows the speed of the process of adjusting variables to a long-term equilibrium. Theoretically, the expected value of this coefficient should be negative if the variables have the tendency to return to a long-term equilibrium (Pesaran et al, 1997). This coefficient is also statisti-cally significant at the level of 1%, has a corresponding negative sign and amounts to −0.60. This means that 60% of the deviation from the equilibrium between the dependent variable and independent variable is adjusted annualy, i.e. the long-term equilibrium state is achieved for less than two years. The value of this coeffi-cient, since it is negative and statistically significant, indicates a long-term causal relationship between GDP and its determinants (Mathur et al., 2016).
Analysis оf the impact of variables on economic growth in the short term shows that there are three independent variables which are statistically signifi-cant: investment, government spending and economic growth in the eurozone, but also the dummy variable. Investment and economic growth in the eurozone
44
Acta Economica, Volume XV, No. 27 / December 2017 27 – 57
have a significant impact on gross domestic product in the short term at the level of significance of 1%, while government spending influences economic growth at the level of significance of 5%. Government spending in the short term has a negative impact on economic growth, which is contrary to the long-term impact of this variable. Foreign direct investment does not have a significant impact on economic growth of the CE countries in the short term, because p - value of the coefficient with the independent variable is 0.61 or greater than 0.05. Therefore, the analysis of the FDI impact on economic growth in the CE countries shows that there is an impact in the long-term, but not in the short-term.
a. Southeast Europe
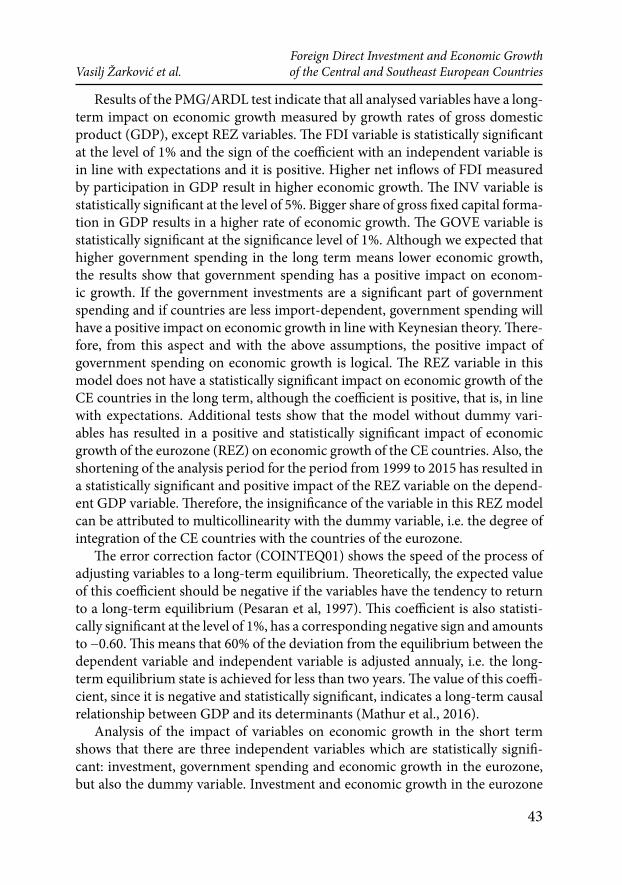
The highest average annual rate of economic growth in the period from 2001 to 2015 in this region was achieved by Albania, where the average annual GDP grew by 4.31%. Albania is followed by Romania and Bulgaria. The lowest growth rates in the analysed period in all countries, except Macedonia, were recorded in 2009. The biggest drop in GDP in 2009 was recorded in Croatia, which also had the lowest average annual growth rate in the region of 1.48%. The highest volatility of GDP was recorded in Romania, where the average deviation from the arithmetic mean was 4.1.
Table 8: Descriptive statistics of the GDP growth rate in the period 2001-2015
Statistics GDP_ALB
GDP_BOS
GDP_BUL
GDP_CRO
GDP_MAC
GDP_MON
GDP_ROM
GDP_SER
GeoMean 4.31 3.27 3.46 1.48 2.78 3.01 3.67 3.05Median 4.23 4.00 4.25 2.05 3.36 3.23 4.17 4.42Maximum 7.94 8.76 7.68 5.56 6.47 10.66 8.46 9.05Minimum 1.11 -2.87 -4.22 -7.38 -3.07 -5.66 -7.07 -3.12Std. Dev. 2.15 3.07 3.38 3.67 2.57 3.99 4.10 3.52
Source: World Bank - World Development Indicators and the authors’ calculations.
The highest average annual net inflow of FDI (in % of GDP) was recorded in Montenegro, Bulgaria, Albania, Serbia. The lowest average annual net inflow of FDI was recorded in Croatia, which at the same time had the lowest average GDP growth rate. The largest fluctuations of net inflows, measured by standard devia-tion, were recorded in Montenegro and Bulgaria, and the lowest in Romania.
45
Foreign Direct Investment and Economic Growth Vasilj Žarković et al. of the Central and Southeast European Countries
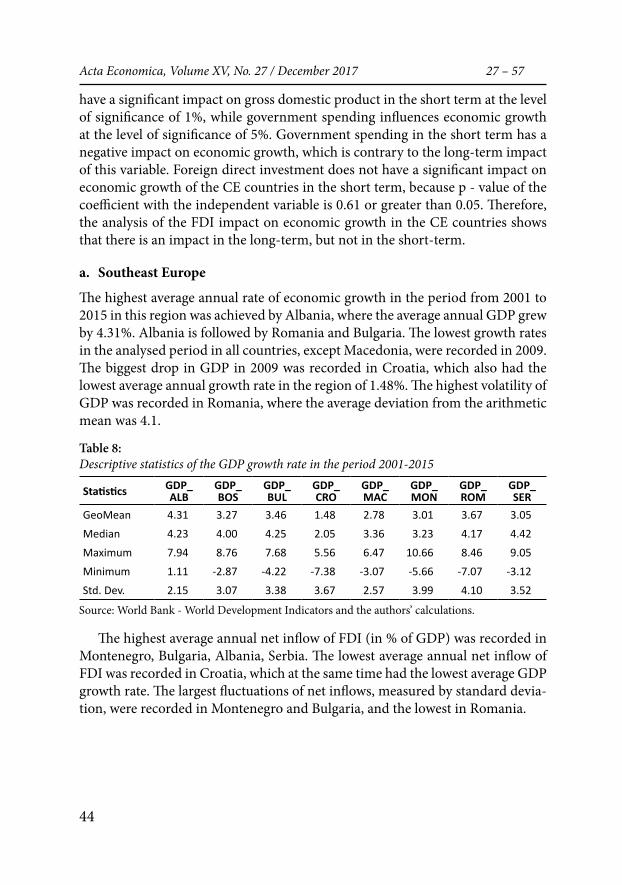
Table 9: Descriptive statistics of net FDI inflows (in % of GDP) in the period 2001-2015
Statistics FDI_ALB FDI_BOS FDI_BUL FDI_CRO FDI_MAC FDI_MON FDI_ROM FDI_SER
Mean 6.76 4.20 9.82 4.19 4.49 16.11 3.91 6.32Median 7.47 2.68 5.75 3.95 3.47 16.33 2.77 6.01Maximum 11.15 11.68 31.00 7.60 12.66 37.41 8.91 13.90Minimum 3.04 0.79 2.49 0.33 0.54 2.89 1.28 1.45Std. Dev. 2.79 3.00 8.51 2.23 3.08 9.60 2.60 3.42
Source: World Bank - World Development Indicators and the authors’ calculations.
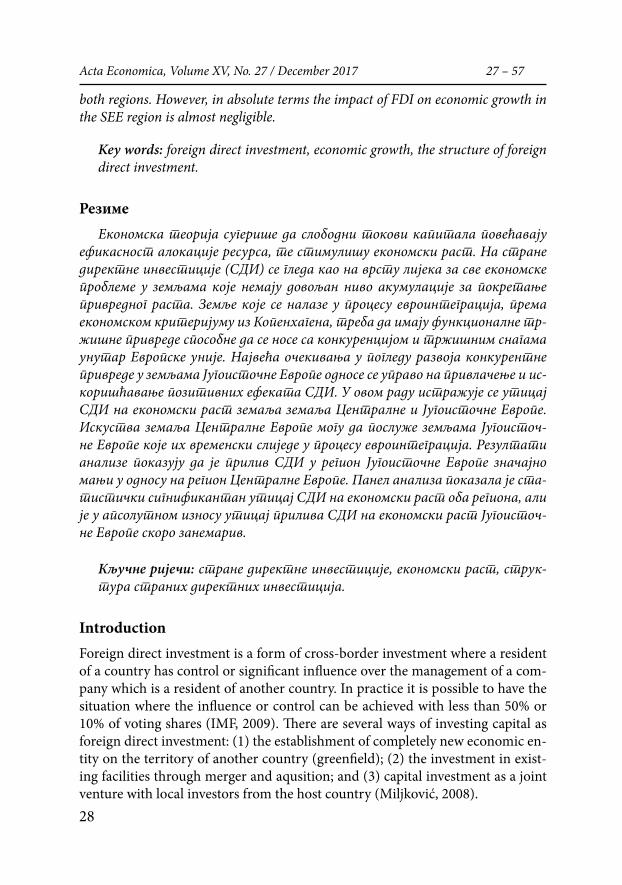
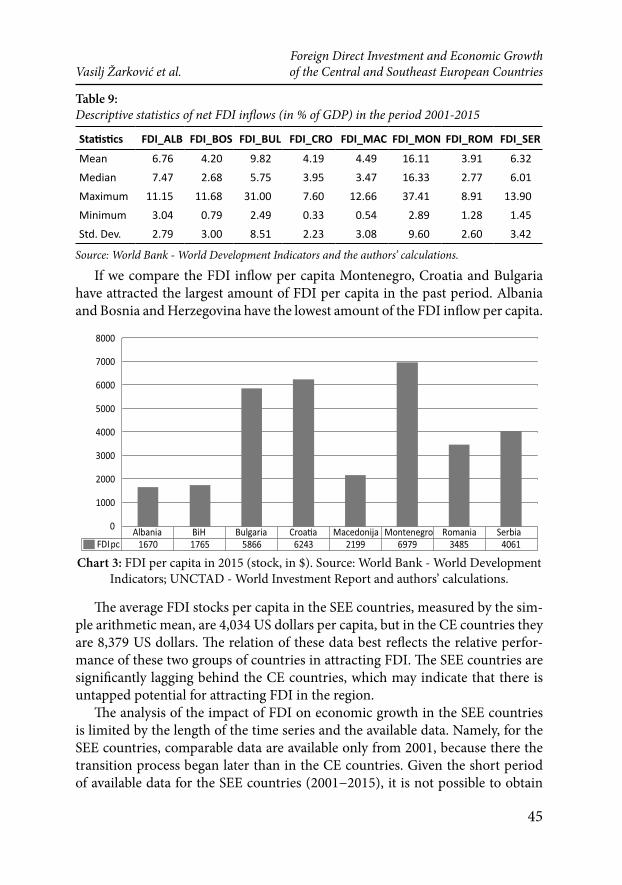
If we compare the FDI inflow per capita Montenegro, Croatia and Bulgaria have attracted the largest amount of FDI per capita in the past period. Albania and Bosnia and Herzegovina have the lowest amount of the FDI inflow per capita.
Albania BiH Bulgaria Croa�a Macedonija Montenegro Romania Serbia FDI pc 1670 1765 5866 6243 2199 6979 3485 4061
0
1000
2000
3000
4000
5000
6000
7000
8000
Chart 3: FDI per capita in 2015 (stock, in $). Source: World Bank - World Development Indicators; UNCTAD - World Investment Report and authors’ calculations.
The average FDI stocks per capita in the SEE countries, measured by the sim-ple arithmetic mean, are 4,034 US dollars per capita, but in the CE countries they are 8,379 US dollars. The relation of these data best reflects the relative perfor-mance of these two groups of countries in attracting FDI. The SEE countries are significantly lagging behind the CE countries, which may indicate that there is untapped potential for attracting FDI in the region.
The analysis of the impact of FDI on economic growth in the SEE countries is limited by the length of the time series and the available data. Namely, for the SEE countries, comparable data are available only from 2001, because there the transition process began later than in the CE countries. Given the short period of available data for the SEE countries (2001−2015), it is not possible to obtain
46
Acta Economica, Volume XV, No. 27 / December 2017 27 – 57
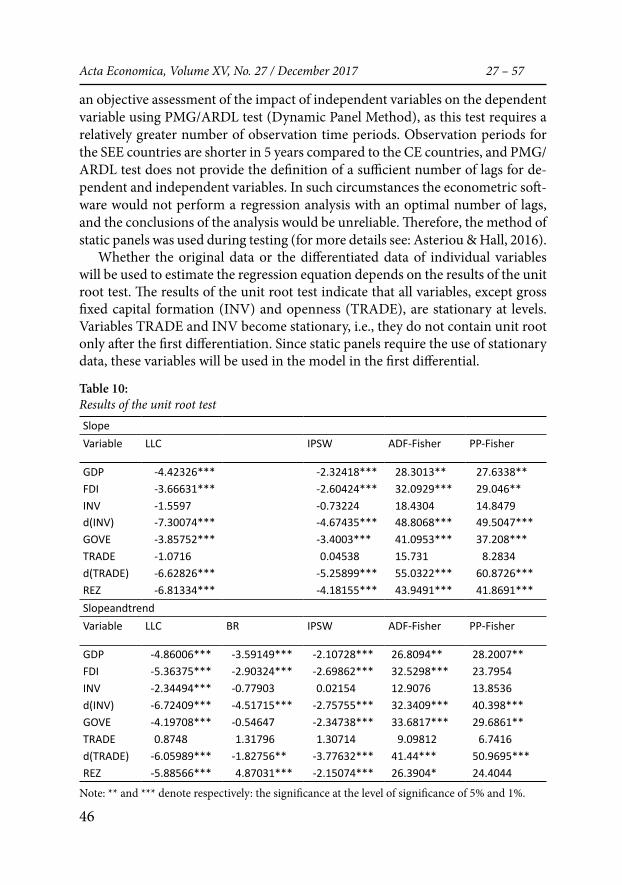
an objective assessment of the impact of independent variables on the dependent variable using PMG/ARDL test (Dynamic Panel Method), as this test requires a relatively greater number of observation time periods. Observation periods for the SEE countries are shorter in 5 years compared to the CE countries, and PMG/ARDL test does not provide the definition of a sufficient number of lags for de-pendent and independent variables. In such circumstances the econometric soft-ware would not perform a regression analysis with an optimal number of lags, and the conclusions of the analysis would be unreliable. Therefore, the method of static panels was used during testing (for more details see: Asteriou & Hall, 2016).
Whether the original data or the differentiated data of individual variables will be used to estimate the regression equation depends on the results of the unit root test. The results of the unit root test indicate that all variables, except gross fixed capital formation (INV) and openness (TRADE), are stationary at levels. Variables TRADE and INV become stationary, i.e., they do not contain unit root only after the first differentiation. Since static panels require the use of stationary data, these variables will be used in the model in the first differential.
Table 10: Results of the unit root testSlopeVariable LLC IPSW ADF-Fisher PP-Fisher
GDP -4.42326*** -2.32418*** 28.3013** 27.6338**FDI -3.66631*** -2.60424*** 32.0929*** 29.046**INV -1.5597 -0.73224 18.4304 14.8479d(INV) -7.30074*** -4.67435*** 48.8068*** 49.5047***GOVE -3.85752*** -3.4003*** 41.0953*** 37.208***TRADE -1.0716 0.04538 15.731 8.2834d(TRADE) -6.62826*** -5.25899*** 55.0322*** 60.8726***REZ -6.81334*** -4.18155*** 43.9491*** 41.8691***SlopeandtrendVariable LLC BR IPSW ADF-Fisher PP-Fisher
GDP -4.86006*** -3.59149*** -2.10728*** 26.8094** 28.2007**FDI -5.36375*** -2.90324*** -2.69862*** 32.5298*** 23.7954INV -2.34494*** -0.77903 0.02154 12.9076 13.8536d(INV) -6.72409*** -4.51715*** -2.75755*** 32.3409*** 40.398***GOVE -4.19708*** -0.54647 -2.34738*** 33.6817*** 29.6861**TRADE 0.8748 1.31796 1.30714 9.09812 6.7416d(TRADE) -6.05989*** -1.82756** -3.77632*** 41.44*** 50.9695***REZ -5.88566*** 4.87031*** -2.15074*** 26.3904* 24.4044
Note: ** and *** denote respectively: the significance at the level of significance of 5% and 1%.
47
Foreign Direct Investment and Economic Growth Vasilj Žarković et al. of the Central and Southeast European Countries
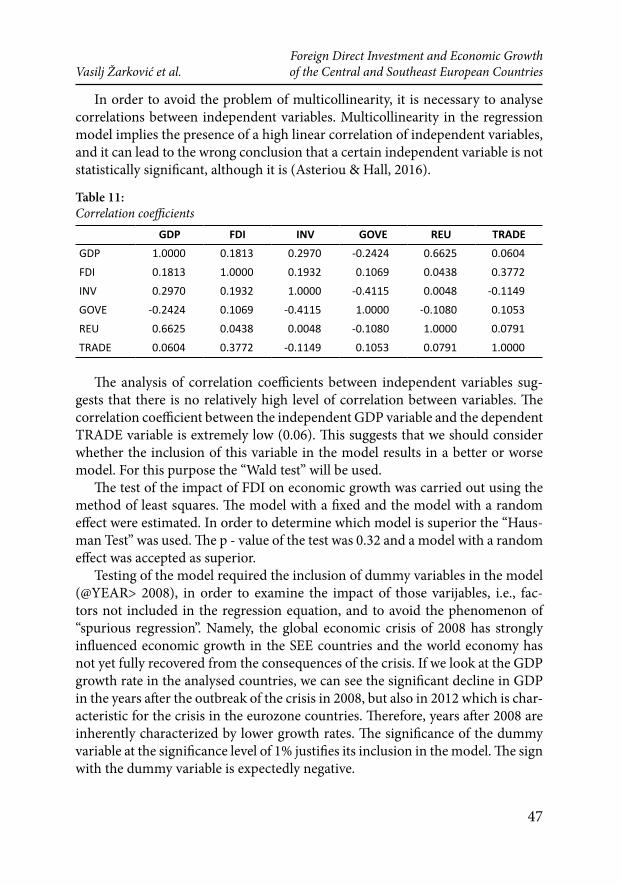
In order to avoid the problem of multicollinearity, it is necessary to analyse correlations between independent variables. Multicollinearity in the regression model implies the presence of a high linear correlation of independent variables, and it can lead to the wrong conclusion that a certain independent variable is not statistically significant, although it is (Asteriou & Hall, 2016).
Table 11: Correlation coefficients
GDP FDI INV GOVE REU TRADEGDP 1.0000 0.1813 0.2970 -0.2424 0.6625 0.0604FDI 0.1813 1.0000 0.1932 0.1069 0.0438 0.3772INV 0.2970 0.1932 1.0000 -0.4115 0.0048 -0.1149GOVE -0.2424 0.1069 -0.4115 1.0000 -0.1080 0.1053REU 0.6625 0.0438 0.0048 -0.1080 1.0000 0.0791TRADE 0.0604 0.3772 -0.1149 0.1053 0.0791 1.0000
The analysis of correlation coefficients between independent variables sug-gests that there is no relatively high level of correlation between variables. The correlation coefficient between the independent GDP variable and the dependent TRADE variable is extremely low (0.06). This suggests that we should consider whether the inclusion of this variable in the model results in a better or worse model. For this purpose the “Wald test” will be used.
The test of the impact of FDI on economic growth was carried out using the method of least squares. The model with a fixed and the model with a random effect were estimated. In order to determine which model is superior the “Haus-man Test” was used. The p - value of the test was 0.32 and a model with a random effect was accepted as superior.
Testing of the model required the inclusion of dummy variables in the model (@YEAR> 2008), in order to examine the impact of those varijables, i.e., fac-tors not included in the regression equation, and to avoid the phenomenon of “spurious regression”. Namely, the global economic crisis of 2008 has strongly influenced economic growth in the SEE countries and the world economy has not yet fully recovered from the consequences of the crisis. If we look at the GDP growth rate in the analysed countries, we can see the significant decline in GDP in the years after the outbreak of the crisis in 2008, but also in 2012 which is char-acteristic for the crisis in the eurozone countries. Therefore, years after 2008 are inherently characterized by lower growth rates. The significance of the dummy variable at the significance level of 1% justifies its inclusion in the model. The sign with the dummy variable is expectedly negative.
48
Acta Economica, Volume XV, No. 27 / December 2017 27 – 57
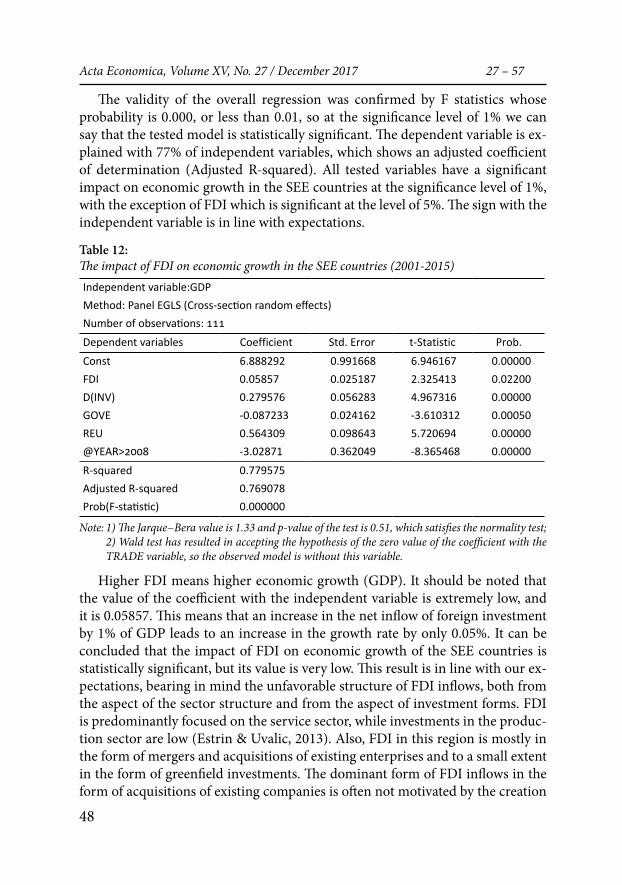
The validity of the overall regression was confirmed by F statistics whose probability is 0.000, or less than 0.01, so at the significance level of 1% we can say that the tested model is statistically significant. The dependent variable is ex-plained with 77% of independent variables, which shows an adjusted coefficient of determination (Adjusted R-squared). All tested variables have a significant impact on economic growth in the SEE countries at the significance level of 1%, with the exception of FDI which is significant at the level of 5%. The sign with the independent variable is in line with expectations.
Table 12:The impact of FDI on economic growth in the SEE countries (2001-2015)Independent variable:GDP Method: Panel EGLS (Cross-section random effects)Number of observations: 111Dependent variables Coefficient Std. Error t-Statistic Prob.Const 6.888292 0.991668 6.946167 0.00000FDI 0.05857 0.025187 2.325413 0.02200D(INV) 0.279576 0.056283 4.967316 0.00000GOVE -0.087233 0.024162 -3.610312 0.00050REU 0.564309 0.098643 5.720694 0.00000@YEAR>2008 -3.02871 0.362049 -8.365468 0.00000R-squared 0.779575Adjusted R-squared 0.769078Prob(F-statistic) 0.000000
Note: 1) The Jarque−Bera value is 1.33 and p-value of the test is 0.51, which satisfies the normality test; 2) Wald test has resulted in accepting the hypothesis of the zero value of the coefficient with the TRADE variable, so the observed model is without this variable.
Higher FDI means higher economic growth (GDP). It should be noted that the value of the coefficient with the independent variable is extremely low, and it is 0.05857. This means that an increase in the net inflow of foreign investment by 1% of GDP leads to an increase in the growth rate by only 0.05%. It can be concluded that the impact of FDI on economic growth of the SEE countries is statistically significant, but its value is very low. This result is in line with our ex-pectations, bearing in mind the unfavorable structure of FDI inflows, both from the aspect of the sector structure and from the aspect of investment forms. FDI is predominantly focused on the service sector, while investments in the produc-tion sector are low (Estrin & Uvalic, 2013). Also, FDI in this region is mostly in the form of mergers and acquisitions of existing enterprises and to a small extent in the form of greenfield investments. The dominant form of FDI inflows in the form of acquisitions of existing companies is often not motivated by the creation
49
Foreign Direct Investment and Economic Growth Vasilj Žarković et al. of the Central and Southeast European Countries
of new jobs and does not result in higher investment and economic growth. The value of the correlation coefficient between variables FDI and INV is 0.19 (Table 11), which confirms low interdependence between the FDI inflow and new in-vestments in fixed assets.
Gross fixed capital formation has a positive impact on economic growth at the level of significance of 1%. The coefficient of the independent variable is relatively high and amounts to 0.2796. The value of this coefficient is in line with expecta-tions and economic logic. Panel analysishas shown a statistically significant and negative impact of total government spending (GOVE) on economic growth. Higher government spending means lower rates of economic growth. This result is also in line with expectations, because the region is characterized by the financ-ing of government spending often with high interest rates, where government spending is mainly focused on consumption, usually of imported goods.
The countries of the European Union have statistically significant and the most influential impact (excluding the dummy variable that was previously ex-plained) of GDP growth rates. Economic growth in the SEE countries is directly proportional to the rates of economic growth in the European Union countries. The results are in line with expectations. The EU countries are the most impor-tant trade partner of the SEE countries and the most significant source of capital. Lower growth rates in the EU countries mean lower exports to these countries, which negatively affects GDP of the SEE countries. The crisis in the EU countries means lower capital inflows to the SEE countries, as well as lower investments and consumption in the SEE countries, not only because of the reduced capital inflow, but also because of pessimistic estimates in terms of expectations regard-ing economic growth in the future.
ConclusionIt is indisputable that FDI represents the most favourable form of financing the domestic economy and that indirect effects in terms of acquiring new technolo-gies, knowledge, experience and access to foreign markets often exceed the direct benefits from the financial aspect. However, there are a number of prerequisites that the country must meet, first to attract a sufficient amount of foreign invest-ments, and second, to take advantage of the positive effects and minimize the negative ones that foreign investments often cause.
The results of the analysis show that FDI inflow to the SEE region is signifi-cantly lower compared to the region of Central Europe, measured by FDI stocks per capita. The analysis of the impact of FDI on economic growth of the CE coun-tries in the period from 1996 to 2015 shows a positive and statistically significant impact of FDI on economic growth in the long term. The impact of FDI on eco-
nomic growth of the SEE countries in the period from 2001 to 2015 is statistically significant, but in absolute terms it is almost negligible. It can be concluded that FDI in the SEE countries did not contribute significantly to economic growth. These results are in line with expectations, as FDI in this region was mostly in the form of acquisition of state-owned enterprises in the privatization process, and less in the form of greenfield investments, with the unfavorable sector structure characterized by a large share of the service sector in the total FDI inflows. FDI in the form of acquisition of state-owned enterprises has a greater impact on con-sumption than on investments, because these funds are usually used to finance government spending. In conditions of high import dependence, higher con-sumption means higher imports and foreign trade deficit, which stimulates eco-nomic growth of the countries in the region rather than the domestic economy.
The analysis results send a clear message to economic policy makers in the SEE countries that their efforts should be focused not only on creating policies to attract FDI, but also on creating the policies for their exploitation. Otherwise, they will have to look for opportunities in other areas in order to initiate more significant and sustainable economic growth, increase the competitiveness of the national economy and reduce the potential negative effects of joining the EU at the level that does not allow equal competition with market forces within the EU.
References Adewumi, S. (2006). The Impact of FDI on Growth in Developing Countries: An Afri-
can Experience. Retrieved 11.05.2016 from: https://www.diva-portal.org/smash/get/diva2:4440/FULLTEXT01.pdf.
Аlfaro, L. (2003). Foreign Direct Investment and Growth: Does the Sector Matter? Re-trieved 12.05.2016 from: https://www.researchgate.net/publication/228966060_For-eign_Direct_Investment_and_Growth_does_the_sector_matter .
Apostolov, M. (2016). Cobb–Douglas production function on FDI in Southeast Europe. Journal of Economic Structures, (2016) 5: 10. doi:10.1186/s40008-016-0043. Re-trieved 12.03.2017 from: https://link.springer.com/article/10.1186/s40008-016-0043-x#Tab6 .
Asteriou, D. & Hall, S. G. (2016). Aplied Econometrics. 3rd Edition. Palgrave MacMilan.Bogdan, Ž. (2009). Utjecaj FDI-ja na gospodarski rast europskih tranzicijskih zemalja.
EFZG working paper series, No. 06. Retrieved 20.10.2016 from: http://hrcak.srce.hr/136975.
Borensztein, E., De Gregorio, J., & Lee, J-W. (1995). How Does Foreign Direct Investment Affect Economic Growth? NBER Working paper, No. 5057. Retrieved 12.05.2016 from: http://www.nber.org/papers/w5057.
EBRD. (2015). Transition Report 2015-16. Retrieved 12.06.2016 from: http://www.ebrd.com/news/publications/transition-report/ebrd-transition-report-201516.html.
Estrin, S. & Uvalic, M. (2015). Foreign Direct Investment in the Western Balkans: What role has it played during transition? London School of Economics and University of Perugia.
51
Foreign Direct Investment and Economic Growth Vasilj Žarković et al. of the Central and Southeast European Countries
Estrin, S., & Uvalic, M. (2013). Foreign direct investment into transition economies: Are the Balkans different? London School of Economic and Political Science, (LEQS Pa-per No. 64/2013).
Hlavacek, P. & Bal-Domanska, B. (2016). Impact of Foreign Direct Investment on Eco-nomic Growth in Central and Eastern European Countries. Inzinerine Ekonomika-Engineering Economics, 2016, 27(3), 294–303. Retrieved 15.08.2016 from: http://www.inzeko.ktu.lt/index.php/EE/article/viewFile/3914/7923.
Iamsiraroj, S. & Doucouliagos, H. (2015). Does Growth Attract FDI? Economics, Discu-sion paper No. 2015-18. Retrieved 12.05.2016 from: http://www.economics-ejour-nal.org/economics/discussionpapers/2015-18/file.
International Monatary Found (IMF). (2009). Balance of payments and international investment position manual. Washington. Retrieved 12.02.2015 from: http://www.imf.org/external/pubs/ft/bop/2007/pdf/bpm6.pdf.
International Monetary Found. (2016). World Economic Outlook Databases, april 2016. Retrieved 14.11.2016 from: https://www.imf.org/external/pubs/ft/weo/2016/01/weodata/index.aspx.
Khaliq, A. & Noy, I. (2007). Foreign Direct Investment and Economic Growth: Empirical Evidence from Sectoral Data in Indonesia. Retrieved 10.05.2016 from: http://www.economics.hawaii.edu/research/workingpapers/WP_07-26.pdf.
Khordagui, N. H.& Saleh, G. (2013). FDI and Absorptive Capacity in Emerging Econo-mies. Topics in Middle Eastern and African Economies Vol. 15, No. 1. Retrieved 12.10.2016 from: http://meea.sites.luc.edu/volume15/pdfs/FDI-Absorptive-Capac-ity.pdf.
Kherfi, S. & Soliman, M. (2005). FDI And Economic Growth In CEE And MENA Coun-tries: A Tale Of Two Regions. International Business & Economics Research Journal, 4 (12).
Kragulj, D. & Parezanin, M. (2015). Foreign Direct Investment and Economic Growth in Times of Economic Crises: Evidence frome Southeast European Countries. European Scientific Journal Vol.1, ISSN: 1857 – 7881. Retrieved 14.10.2016 from: http://eujo-urnal.org/index.php/esj/article/view/6439.
Lyroudi, K., Papanastasiou, J. & Athanasios, V. (2004). Foreign Direct Investment And Economic Growth In Transition Economies. Retrieved 12.05.2016 from: http://www.asecu.gr/Seeje/issue02/lyroudi.pdf.
Marevar, A. (2003). Economic Growth and Countires in Transition. Croatian Economic Surevey. Retrieved 10.01.2017 from: http://hrcak.srce.hr/file/9613.
Mathur S. K. et all. (2016). Does Domestic Energy Consumption Affect GDP of a Country? A Panel Data Study. Global Economy Journal. Retrieved 10.01.2017 from: http://apeaweb.org/confer/kkt16/papers/Mathur_Somesh.pdf.
Mencinger, J. (2003). Does Foreign Direct Investment Always Enhance Economic Growth?” Kyklos, Vol. 56, No. 4.
Mockevičius, P. (2014). The Effect FDI on Economic Growth on Central and Eastern Europe: Merger and Aquistitons and Greenfield Investment. MSc Economics Thesis. Sweden: Lound University. Retrieved 12.08.2016 from: https://lup.lub.lu.se/student-papers/search/publication/4461410.
Pablo Dapena, J. (2006). Volatility of GDP, Macro Applications and Policy Implications of Real Options for Structure of Capital Markets. CEMA Working Papers: Serie Docu-
52
Acta Economica, Volume XV, No. 27 / December 2017 27 – 57
mentos de Trabajo. Retrieved 12.01.2017 from: https://ideas.repec.org/p/cem/doc-tra/320.html.
Pesaran, M. H., Shin, J. & Smith, R. P. (1997). Pooled Estimation of Long-Run Relation-ships in Dynamic Heterogenous Panels. Retrieved 20.11.2016 from: http://www.econ.cam.ac.uk/people/emeritus/mhp1/jasaold.pdf.
Popović-Avrić S., Đenić M., Milenković, M. (2014). Investment policies of the Western Balkans as a factor of economic development in the post-crisis period. Zbornik ra-dova, 10. Međunarodna ASECU. Retrieved 15.08.2016 from: http://www.asecu.gr/files/10th_conf_files/avric-djenic-milenkovic.pdf.
Pugel, A. T. (2016). International Economics. New York: McGraw-Hill Education.Silajdžić, S. & Mehić, E. (2015). Knowledge Spillovers, Absorptive Capacities and the Im-
pact of FDI on Economic Growth: Empirical Evidence from Transition Economies. Pro-cedia - Social and Behavioral Sciences 195 ( 2015 ) 614 – 623. Retrieved 25.11.2016 from: http://www.sciencedirect.com/science/article/pii/S1877042815036216.
Stanišić, N. (2008). Do Foreign Direct Investments Increase The Economic Growth in Southeastern European Transition Economies. South - Eastern Europe Journal of Economics 1, pp. 29-38. Retrieved 20.10.2016 from: http://www.asecu.gr/Seeje/is-sue10/stanisic.pdf.
Tiberiu Albulescu, C. (2015). Do Foreign Direct and Portfolio Investments Affect Long-Term Economic Growth in Central and Eastern Europe? Procedia Economics and Finance 23 (2015), pp. 507–512. Elsevier. Retrieved 12.08.2016 from: http://www.sciencedirect.com/science/article/pii/S2212567115005390.
Tintin, C. (2012). Does Foreign Direct Investment Spur Economic Growth and Devel-opment: A Comparative Study. Retrieved 10.05.2016 from: http://www.etsg.org/ETSG2012/Programme/Papers/73.pdf.
Umeora, C.E. (2013). Effects of Foreign Direct Investment (FDI) on Economic Growth in Nigeria. Retrieved 08.06.2016 from: http://papers.ssrn.com/sol3/papers.cfm?abstract_id=2285329.
UNCTAD. (2015). The World Investment Report, 2015. Retrieved 12.12.2016 from: http://unctad.org/en/pages/DIAE/World%20Investment%20Report/WIR-Series.aspx.
Vo, X-V. & Batten, J.A. (2006). The Importance of Social Factors when assessing the impact of foreign direct investment on economic growth. IIIS Discussion Paper No. 179. Retrieved 12.06.2016 from: http://papers.ssrn.com/sol3/papers.cfm?abstract_id=932182.
World Bank Group. (2016). Doing Business 2016. Retrieved 15.06.2016 from: http://www.doingbusiness.org/rankings.
World Bank. (2016). World Development Indicators. Retrieved 10.12.2016 from: http://data.worldbank.org/data-catalog/world-development-indicators.
World Economic Forum (2015). The Global Competitiveness Report 2015-2016. Re-trieved 15.06.2016 from: http://reports.weforum.org/global-competitiveness-re-port-2015-2016.
Miljković, D. (2008). International finances. Belgrade: Faculty of Economics.Čenić-Jotanović, G. (2010). International economic relations. Laktaši: Grafomark, 2010.
53
Foreign Direct Investment and Economic Growth Vasilj Žarković et al. of the Central and Southeast European Countries
App
endi
x 1:
Gro
wth
rate
of g
ross
dom
estic
pro
duct
, con
stant
pric
es
Year
Czec
h Re
publ
icEs
toni
aHu
ngar
yLa
tvia
Lith
u-an
iaPo
land
Slov
akia
Slov
e-ni
aAl
bani
aBI
HBu
lgar
iaCr
oatia
Mac
edo-
nia
Mon
te-
negr
oRo
man
iaSe
rbia
1996
4,28
5,32
0,04
2,35
5,15
6,24
6,76
3,52
1997
-0,6
711
,80
3,43
8,99
8,29
7,09
6,07
5,11
1998
-0,3
24,
124,
216,
537,
474,
984,
013,
29
19
991,
44-0
,86
3,24
2,62
-1,1
34,
52-0
,21
5,27
2000
4,29
10,5
74,
235,
403,
834,
261,
214,
16
20
013,
056,
333,
856,
466,
521,
213,
322,
957,
944,
404,
253,
43-3
,07
1,10
5,59
4,99
2002
1,65
6,08
4,48
7,11
6,76
1,44
4,52
3,84
4,23
5,30
6,02
5,25
1,49
1,90
5,18
7,12
2003
3,60
7,42
3,84
8,42
10,5
43,
565,
422,
845,
774,
005,
085,
562,
222,
505,
524,
4220
044,
956,
294,
948,
346,
555,
145,
264,
355,
716,
106,
564,
084,
674,
408,
369,
0520
056,
449,
374,
3510
,70
7,73
3,55
6,40
4,00
5,72
8,76
7,24
4,16
4,72
4,19
4,17
5,54
2006
6,88
10,2
73,
8111
,90
7,41
6,19
8,49
5,66
5,43
5,38
6,75
4,79
5,14
8,57
8,06
4,90
2007
5,53
7,75
0,43
9,96
11,0
97,
2010
,83
6,94
5,90
5,73
7,68
5,15
6,47
10,6
66,
865,
8920
082,
71-5
,42
0,84
-3,6
02,
633,
925,
653,
307,
535,
485,
652,
055,
476,
928,
465,
3720
09-4
,84
-14,
72-6
,56
-14,
35-1
4,81
2,63
-5,4
9-7
,80
3,35
-2,8
7-4
,22
-7,3
8-0
,36
-5,6
6-7
,07
-3,1
220
102,
302,
460,
74-3
,78
1,64
3,70
5,08
1,24
3,71
0,77
0,05
-1,7
03,
362,
46-0
,80
0,58
2011
1,97
7,58
1,76
6,21
6,04
5,01
2,84
0,65
2,55
0,91
1,58
-0,2
82,
343,
231,
061,
4020
12-0
,90
5,18
-1,6
94,
013,
841,
561,
52-2
,72
1,42
-0,9
30,
24-2
,19
-0,4
6-2
,72
0,64
-1,0
220
13-0
,53
1,57
1,89
3,02
3,54
1,26
1,43
-1,0
61,
112,
391,
28-1
,06
2,93
3,55
3,53
2,57
2014
1,98
2,91
3,67
2,36
3,03
3,28
2,52
3,05
2,00
1,08
1,55
-0,3
63,
541,
782,
96-1
,83
2015
4,20
1,07
2,94
1,89
1,59
3,65
3,60
2,88
2,56
3,16
2,97
1,64
3,67
3,37
3,74
0,73
Sour
ce: W
orld
Ban
k (2
016)
. Wor
ld D
evelo
pmen
t Ind
icato
rs. R
etrie
ved
10.1
2.20
16 fr
om: h
ttp://
data
.wor
ldba
nk.o
rg/d
ata-
cata
log/
wor
ld-d
evel
opm
ent-
indi
cato
rs.
54
Acta Economica, Volume XV, No. 27 / December 2017 27 – 57A
ppen
dix
2:
Net
FD
I infl
ows (
in %
of G
DP)
Year
Czec
h Re
publ
icEs
toni
aHu
ngar
yLa
tvia
Lith
uani
aPo
land
Slov
akia
Slov
enia
Alba
nia
BIH
Bulg
aria
Croa
tiaM
aced
onia
Mon
te-
negr
oRo
man
iaSe
rbia
1996
4,28
5,32
0,04
2,35
5,15
6,24
6,76
3,52
1997
-0,6
711
,80
3,43
8,99
8,29
7,09
6,07
5,11
1998
-0,3
24,
124,
216,
537,
474,
984,
013,
29
1999
1,44
-0,8
63,
242,
62-1
,13
4,52
-0,2
15,
27
2000
4,29
10,5
74,
235,
403,
834,
261,
214,
16
2001
3,05
6,33
3,85
6,46
6,52
1,21
3,32
2,95
7,94
4,40
4,25
3,43
-3,0
71,
105,
594,
99
2002
1,65
6,08
4,48
7,11
6,76
1,44
4,52
3,84
4,23
5,30
6,02
5,25
1,49
1,90
5,18
7,12
2003
3,60
7,42
3,84
8,42
10,5
43,
565,
422,
845,
774,
005,
085,
562,
222,
505,
524,
42
2004
4,95
6,29
4,94
8,34
6,55
5,14
5,26
4,35
5,71
6,10
6,56
4,08
4,67
4,40
8,36
9,05
2005
6,44
9,37
4,35
10,7
07,
733,
556,
404,
005,
728,
767,
244,
164,
724,
194,
175,
54
2006
6,88
10,2
73,
8111
,90
7,41
6,19
8,49
5,66
5,43
5,38
6,75
4,79
5,14
8,57
8,06
4,90
2007
5,53
7,75
0,43
9,96
11,0
97,
2010
,83
6,94
5,90
5,73
7,68
5,15
6,47
10,6
66,
865,
89
2008
2,71
-5,4
20,
84-3
,60
2,63
3,92
5,65
3,30
7,53
5,48
5,65
2,05
5,47
6,92
8,46
5,37
2009
-4,8
4-1
4,72
-6,5
6-1
4,35
-14,
812,
63-5
,49
-7,8
03,
35-2
,87
-4,2
2-7
,38
-0,3
6-5
,66
-7,0
7-3
,12
2010
2,30
2,46
0,74
-3,7
81,
643,
705,
081,
243,
710,
770,
05-1
,70
3,36
2,46
-0,8
00,
58
2011
1,97
7,58
1,76
6,21
6,04
5,01
2,84
0,65
2,55
0,91
1,58
-0,2
82,
343,
231,
061,
40
2012
-0,9
05,
18-1
,69
4,01
3,84
1,56
1,52
-2,7
21,
42-0
,93
0,24
-2,1
9-0
,46
-2,7
20,
64-1
,02
2013
-0,5
31,
571,
893,
023,
541,
261,
43-1
,06
1,11
2,39
1,28
-1,0
62,
933,
553,
532,
57
2014
1,98
2,91
3,67
2,36
3,03
3,28
2,52
3,05
2,00
1,08
1,55
-0,3
63,
541,
782,
96-1
,83
2015
4,20
1,07
2,94
1,89
1,59
3,65
3,60
2,88
2,56
3,16
2,97
1,64
3,67
3,37
3,74
0,73
Sour
ce: W
orld
Ban
k (2
016)
. Wor
ld D
evelo
pmen
t Ind
icato
rs. R
etrie
ved
10.1
2.20
16 fr
om: h
ttp://
data
.wor
ldba
nk.o
rg/d
ata-
cata
log/
wor
ld-d
evel
opm
ent-
indi
cato
rs.
55
Foreign Direct Investment and Economic Growth Vasilj Žarković et al. of the Central and Southeast European Countries
Ann
ex 3
:G
ross
fixe
d ca
pita
l for
mat
ion
(in %
of G
DP)
Year
Czec
h Re
publ
icEs
toni
aHu
ngar
yLa
tvia
Lith
uani
aPo
land
Slov
akia
Slov
enia
Alba
nia
BIH
Bulg
aria
Croa
tiaM
aced
o-ni
aM
onte
-ne
gro
Rom
ania
Serb
ia
1996
34,0
227
,29
22,9
317
,90
20,5
819
,50
33,4
623
,90
1997
32,0
429
,09
23,3
017
,73
22,3
722
,06
35,4
425
,19
1998
30,4
731
,65
24,3
223
,89
23,8
823
,70
37,0
926
,16
1999
29,4
726
,04
25,2
422
,97
21,9
524
,03
30,8
627
,71
2000
30,6
826
,62
25,4
725
,23
19,1
323
,35
27,2
727
,34
2001
30,5
727
,21
24,8
427
,37
20,5
220
,41
30,1
626
,35
38,3
619
,08
19,3
320
,39
22,1
317
,50
20,9
212
,89
2002
29,3
230
,54
24,7
124
,57
20,6
918
,44
28,8
924
,71
37,9
018
,56
19,0
322
,30
21,4
214
,63
21,7
516
,19
2003
28,8
332
,70
23,7
024
,81
21,5
418
,17
25,8
125
,19
40,4
718
,84
19,8
725
,83
20,1
913
,30
22,2
818
,28
2004
28,1
631
,78
24,0
728
,91
22,9
018
,09
24,9
826
,16
37,2
017
,36
21,0
025
,69
21,3
317
,13
22,4
020
,55
2005
28,2
932
,90
23,8
831
,31
23,3
818
,63
27,4
326
,65
36,9
927
,13
25,7
125
,41
19,1
717
,98
24,3
020
,08
2006
28,0
336
,74
23,5
934
,21
25,9
319
,76
27,3
427
,82
38,9
822
,59
27,5
026
,58
20,1
821
,86
26,3
922
,26
2007
29,5
536
,57
23,6
836
,45
28,5
821
,92
26,8
728
,75
38,6
622
,33
28,0
826
,80
22,6
932
,35
36,0
025
,25
2008
29,0
231
,19
23,2
932
,08
26,0
422
,56
25,6
129
,59
33,9
523
,73
32,8
728
,10
25,7
638
,25
38,4
024
,93
2009
27,1
222
,73
22,8
522
,56
17,8
621
,12
21,8
224
,35
32,7
119
,41
27,9
125
,21
24,5
626
,76
25,9
919
,66
2010
26,9
621
,23
20,3
719
,39
16,8
620
,29
22,1
321
,31
28,4
316
,96
22,5
121
,27
23,0
621
,64
25,9
518
,59
2011
26,5
826
,20
19,7
922
,23
18,4
920
,69
24,0
620
,19
29,3
718
,12
21,0
920
,29
23,5
319
,51
27,0
718
,39
2012
26,0
326
,44
19,3
825
,45
17,3
619
,79
21,2
719
,27
26,4
918
,26
21,3
919
,62
23,3
719
,75
27,3
421
,17
2013
25,1
427
,10
20,4
923
,24
18,4
718
,82
20,7
119
,69
25,9
217
,63
21,1
819
,80
23,7
120
,17
24,7
017
,24
2014
25,0
125
,21
21,6
622
,87
18,9
219
,74
20,8
719
,63
24,4
818
,89
21,1
119
,07
23,4
219
,00
24,1
716
,68
2015
25,7
824
,23
21,6
722
,58
20,7
620
,14
23,0
219
,38
27,2
8
21,1
819
,12
25,0
122
,85
24,7
218
,15
Sour
ce: W
orld
Ban
k (2
016)
. Wor
ld D
evelo
pmen
t Ind
icato
rs. R
etrie
ved
10.1
2.20
16 fr
om: h
ttp://
data
.wor
ldba
nk.o
rg/d
ata-
cata
log/
wor
ld-d
evel
opm
ent-
indi
cato
rs.
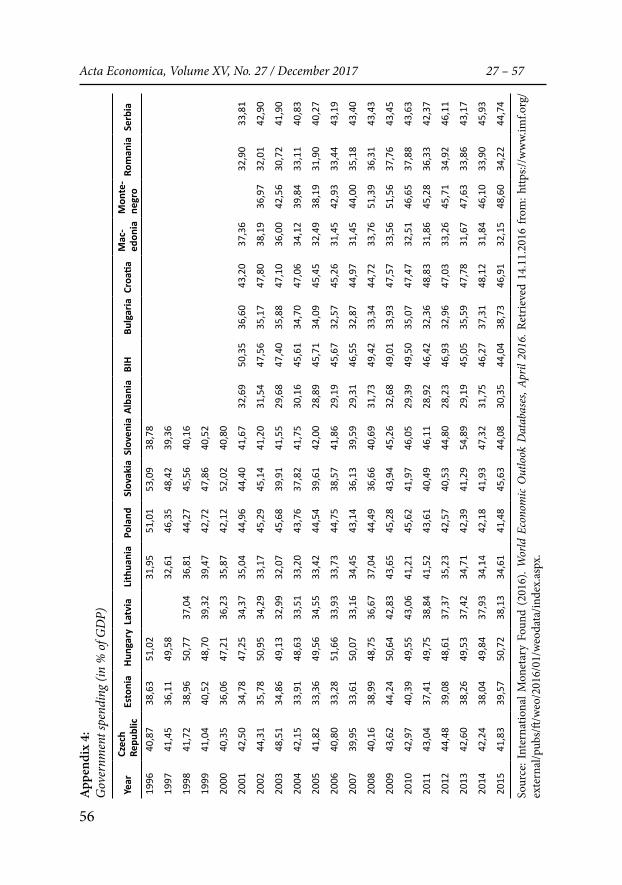
56
Acta Economica, Volume XV, No. 27 / December 2017 27 – 57A
ppen
dix
4:G
over
nmen
t spe
ndin
g (in
% o
f GD
P)
Year
Czec
h Re
publ
icEs
toni
aHu
ngar
yLa
tvia
Lith
uani
aPo
land
Slov
akia
Slov
enia
Alba
nia
BIH
Bulg
aria
Croa
tiaM
ac-
edon
iaM
onte
-ne
gro
Rom
ania
Serb
ia
1996
40,8
738
,63
51,0
2
31,9
551
,01
53,0
938
,78
1997
41,4
536
,11
49,5
8
32,6
146
,35
48,4
239
,36
1998
41,7
238
,96
50,7
737
,04
36,8
144
,27
45,5
640
,16
1999
41,0
440
,52
48,7
039
,32
39,4
742
,72
47,8
640
,52
2000
40,3
536
,06
47,2
136
,23
35,8
742
,12
52,0
240
,80
2001
42,5
034
,78
47,2
534
,37
35,0
444
,96
44,4
041
,67
32,6
950
,35
36,6
043
,20
37,3
6
32,9
033
,81
2002
44,3
135
,78
50,9
534
,29
33,1
745
,29
45,1
441
,20
31,5
447
,56
35,1
747
,80
38,1
936
,97
32,0
142
,90
2003
48,5
134
,86
49,1
332
,99
32,0
745
,68
39,9
141
,55
29,6
847
,40
35,8
847
,10
36,0
042
,56
30,7
241
,90
2004
42,1
533
,91
48,6
333
,51
33,2
043
,76
37,8
241
,75
30,1
645
,61
34,7
047
,06
34,1
239
,84
33,1
140
,83
2005
41,8
233
,36
49,5
634
,55
33,4
244
,54
39,6
142
,00
28,8
945
,71
34,0
945
,45
32,4
938
,19
31,9
040
,27
2006
40,8
033
,28
51,6
633
,93
33,7
344
,75
38,5
741
,86
29,1
945
,67
32,5
745
,26
31,4
542
,93
33,4
443
,19
2007
39,9
533
,61
50,0
733
,16
34,4
543
,14
36,1
339
,59
29,3
146
,55
32,8
744
,97
31,4
544
,00
35,1
843
,40
2008
40,1
638
,99
48,7
536
,67
37,0
444
,49
36,6
640
,69
31,7
349
,42
33,3
444
,72
33,7
651
,39
36,3
143
,43
2009
43,6
244
,24
50,6
442
,83
43,6
545
,28
43,9
445
,26
32,6
849
,01
33,9
347
,57
33,5
651
,56
37,7
643
,45
2010
42,9
740
,39
49,5
543
,06
41,2
145
,62
41,9
746
,05
29,3
949
,50
35,0
747
,47
32,5
146
,65
37,8
843
,63
2011
43,0
437
,41
49,7
538
,84
41,5
243
,61
40,4
946
,11
28,9
246
,42
32,3
648
,83
31,8
645
,28
36,3
342
,37
2012
44,4
839
,08
48,6
137
,37
35,2
342
,57
40,5
344
,80
28,2
346
,93
32,9
647
,03
33,2
645
,71
34,9
246
,11
2013
42,6
038
,26
49,5
337
,42
34,7
142
,39
41,2
954
,89
29,1
945
,05
35,5
947
,78
31,6
747
,63
33,8
643
,17
2014
42,2
438
,04
49,8
437
,93
34,1
442
,18
41,9
347
,32
31,7
546
,27
37,3
148
,12
31,8
446
,10
33,9
045
,93
2015
41,8
339
,57
50,7
238
,13
34,6
141
,48
45,6
344
,08
30,3
544
,04
38,7
346
,91
32,1
548
,60
34,2
244
,74
Sour
ce: I
nter
natio
nal M
onet
ary
Foun
d (2
016)
. Wor
ld E
cono
mic
Out
look
Dat
abas
es, A
pril
2016
. Ret
rieve
d 14
.11.
2016
from
: http
s://w
ww.
imf.o
rg/
exte
rnal
/pub
s/ft/
weo
/201
6/01
/weo
data
/inde
x.as
px.
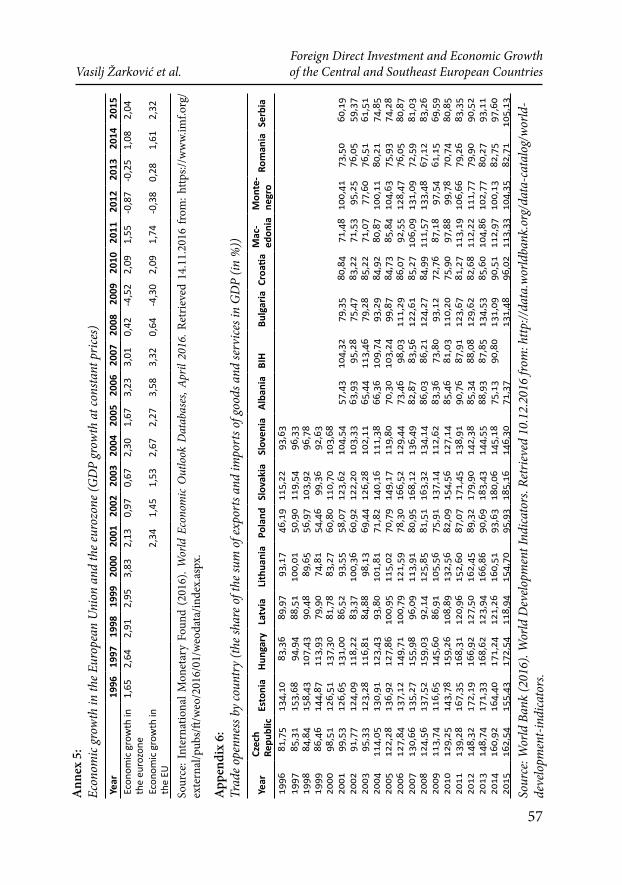
57
Foreign Direct Investment and Economic Growth Vasilj Žarković et al. of the Central and Southeast European Countries
Ann
ex 5
: Ec
onom
ic gr
owth
in th
e Eur
opea
n U
nion
and
the e
uroz
one (
GD
P gr
owth
at c
onsta
nt p
rices
)Ye
ar19
9619
9719
9819
9920
0020
0120
0220
0320
0420
0520
0620
0720
0820
0920
1020
1120
1220
1320
1420
15Ec
onom
ic g
row
th in
th
e eu
rozo
ne1,
652,
642,
912,
953,
832,
130,
970,
672,
301,
673,
233,
010,
42-4
,52
2,09
1,55
-0,8
7-0
,25
1,08
2,04
Econ
omic
gro
wth
in
the
EU
2,34
1,45
1,53
2,67
2,27
3,58
3,32
0,64
-4,3
02,
091,
74-0
,38
0,28
1,61
2,32
Sour
ce: I
nter
natio
nal M
onet
ary
Foun
d (2
016)
. Wor
ld E
cono
mic
Out
look
Dat
abas
es, A
pril
2016
. Ret
rieve
d 14
.11.
2016
from
: http
s://w
ww.
imf.o
rg/
exte
rnal
/pub
s/ft/
weo
/201
6/01
/weo
data
/inde
x.as
px.
App
endi
x 6:
Trad
e ope
nnes
s by
coun
try
(the s
hare
of t
he su
m o
f exp
orts
and
impo
rts o
f goo
ds a
nd se
rvice
s in
GD
P (in
%))
Year
Czec
h Re
publ
icEs
toni
aHu
ngar
yLa
tvia
Lith
uani
aPo
land
Slov
akia
Slov
enia
Alba
nia
BIH
Bulg
aria
Croa
tiaM
ac-
edon
iaM
onte
-ne
gro
Rom
ania
Serb
ia
1996
81,7
513
4,10
83,3
689
,97
93,1
746
,19
115,
2293
,63
1997
85,3
115
3,68
94,9
488
,51
100,
0150
,90
119,
5496
,33
1998
84,8
415
8,43
107,
4390
,48
89,6
556
,97
103,
9296
,78
1999
86,4
614
4,87
113,
9379
,90
74,8
154
,46
99,3
692
,63
2000
98,5
112
6,51
137,
3081
,78
83,2
760
,80
110,
7010
3,68
2001
99,5
312
6,65
131,
0086
,52
93,5
558
,07
123,
6210
4,54
57,4
310
4,32
79,3
580
,84
71,4
810
0,41
73,5
060
,19
2002
91,7
712
4,09
118,
2283
,37
100,
3660
,92
122,
2010
3,33
63,9
395
,28
75,4
783
,22
71,5
395
,25
76,0
559
,37
2003
95,3
312
3,28
116,
8184
,88
98,1
369
,44
126,
2810
2,11
65,4
411
3,46
79,2
885
,22
71,0
777
,60
76,5
161
,51
2004
114,
0513
0,91
123,
4393
,80
101,
8171
,82
140,
1611
1,38
66,3
610
9,74
93,2
984
,92
80,8
710
0,11
80,2
174
,85
2005
122,
2813
6,92
127,
8610
0,95
115,
0270
,79
149,
1711
9,80
70,3
010
3,24
99,8
784
,73
85,8
410
4,63
75,9
374
,28
2006
127,
8413
7,12
149,
7110
0,79
121,
5978
,30
166,
5212
9,44
73,4
698
,03
111,
2986
,07
92,5
512
8,47
76,0
580
,87
2007
130,
6613
5,27
155,
9896
,09
113,
9180
,95
168,
1213
6,49
82,8
783
,56
122,
6185
,27
106,
0913
1,09
72,5
981
,03
2008
124,
5613
7,52
159,
0392
,14
125,
8581
,51
163,
3213
4,14
86,0
386
,21
124,
2784
,99
111,
5713
3,48
67,1
283
,26
2009
113,
7411
6,65
145,
6086
,91
105,
5675
,91
137,
1411
2,62
83,3
673
,80
93,1
272
,76
87,1
897
,54
61,1
569
,59
2010
129,
2514
3,78
159,
2610
8,89
132,
5682
,09
154,
5612
7,14
85,4
681
,03
110,
2075
,90
97,8
899
,78
70,7
480
,85
2011
139,
2816
7,35
168,
3112
0,96
152,
6087
,07
171,
4513
8,91
90,7
687
,91
123,
6781
,27
113,
1910
6,66
79,2
683
,35
2012
148,
3217
2,19
166,
9212
7,50
162,
4589
,32
179,
9014
2,38
85,3
488
,08
129,
6282
,68
112,
2211
1,77
79,9
090
,52
2013
148,
7417
1,33
168,
6212
3,94
166,
8690
,69
183,
4314
4,55
88,9
387
,85
134,
5385
,60
104,
8610
2,77
80,2
793
,11
2014
160,
9216
4,40
171,
2412
1,26
160,
5193
,63
180,
0614
5,18
75,1
390
,80
131,
0990
,51
112,
9710
0,13
82,7
597
,60
2015
162,
5415
5,43
172,
5411
8,94
154,
7095
,93
185,
1614
6,30
71,3
7
131,
4896
,02
113,
3310
4,35
82,7
110
5,13
Sour
ce: W
orld
Ban
k (2
016)
. Wor
ld D
evelo
pmen
t Ind
icato
rs. R
etrie
ved
10.1
2.20
16 fr
om: h
ttp://
data
.wor
ldba
nk.o
rg/d
ata-
cata
log/
wor
ld-
deve
lopm
ent-i
ndica
tors
.
![KONSTANTIN NARKHOV · џ Front-end technologies: adaptive layout Bootstrap 3/4 [23], Material Design Lite [24], React Native; џ Blockchain: Parity/Geth Ethereum, Solidity smart-constracts,](https://img.pdfslide.us/doc/110x75/5f09b6b57e708231d4282981/konstantin-narkhov-front-end-technologies-adaptive-layout-bootstrap-34-23.jpg)