Embed Size (px)
Citation preview
Turkish Journal of Computer and Mathematics Education Vol.12 No.11(2021), 3098-3112
Forecasting of Generation of Electronic Waste on Green Community With Statistical Assessment of Numerical Models
Sujinna Karnasutaa*, Panya Lao-Anantana
b
a Department of Environmental Science, Faculty of Environment, Kasetsart University, Bangkok, Thailand 10900 bDepartment of Electrical Engineering, Faculty of Engineering, Kasetsart University, Bangkok, Thailand 10900
*Corresponding author: [email protected]
Article History: Received: 10 November 2020; Revised 12 January 2021 Accepted: 27 January 2021; Published online: 5
April 2021
_____________________________________________________________________________________________________
Abstract: This research aim on the data collection of electronic waste (e-waste) in case of light bulb and dry battery in 6 building locations on green community of the Kasetsart university from 2016 to 2020 though these 5 years. The statistical assessment from the data collection case to forecasting with numerical modelling of the Moving average, the Weight moving average, the Simple exponential smoothing and the Holt’s exponential smoothing. The correlation between quantity of light bulb and dry batter y in 5 years from year 2016 to 2020, the correlation between the quantity e-waste is 0.1127 which mean weak correlation or almost no correlation. Therefore, both light bulb and dry battery have no correlation between them. The
forecasting for library location in 2021 indicate that the forecasting value rise at the ending of year 2021. The Holt’s Exponential Smoothing technique predict the emerging quantity in September and drop in October. The other techniques lines are moving around 0 to 10 units. The forecasting e- waste for healthcare facility location in 2021 indicate that quantity of light bulb and dry battery are almost equal in healthcare facility location. Both predict of light bulb and dry battery in 2021 are high in July and stay around 10 – 20 units after October. The forecasting e-waste for veterinary faculty location in 2021 indicate that the prediction for light bulb in veterinary faculty location in 2021 is high in January and July then stay around 20 – 70 units
whole year. In the prediction for dry battery in 2021 is high in July and September then stay around 5 – 20 units. The forecasting e-waste for environment faculty location in 2021 indicate that The prediction for light bulb for environment faculty in 2021 stay around 0 – 8 units. And the prediction for dry battery in 2021 stay around 0 – 5 units. The forecasting e-waste for women’s dormitory location in 2021 indicate that Both of prediction for light bulb and dry batter for women’s dormitory location in 2021 are stable, but only the prediction in May and September are high. The prediction in light bulb for research institute in 2021 is high in the last 3 months of 2021, but Holt’s Exponential Smoothing has high prediction’s line in first 4
months then stable until September then the prediction’s line rises around 10 units. The prediction in dry battery in 2021 is high in January and August then stay under 10 units in 2021. The research result can prepare for what will happen in the future, gain the valuable in insight, and thee result from prediction methods could decrease cost for the environmental management on the green community on the electronic waste (e-waste).
Keywords: Forecasting,Electronic waste, Community, Correlation, Statistic, Numerical modelling
___________________________________________________________________________ 1. Introduction
Electronic waste (e-waste) arising from end-of-life electronic products. Lot of the e-waste are computers and
mobile phones that the fastest present growing waste streams in the world. Annual global production of the e-
waste is estimated to surpass 50 million tons in 2020. E-waste contains several precious metals, rare earth metals,
ferrous and non-ferrous metals, plastic, wood and glass. Unscientific practices in the processing of e-waste are
associated with several environmental and health externalities (Rama Mohana R. Turaga, 2019). The e-waste is
unique because of the toxic, hazardousness, and nonbiodegradable nature of its components. The e-waste of the
new environmental threats attributed to technological advancements, urbanization, industrialization, increasing
population, and economic development. e-waste is waste generated from any equipment running on electricity or a
battery including computers, laptops, televisions (TVs), digital video disc (DVD) players, mobile phones, MPEG-
1 audio layer III (MP3) players, and many others which have been disposed by their original users. e-waste also
includes a broad range of electronic devices from large household appliances to personal products such as
handheld cellular phones, personal stereos, consumer electronics, and computers huge numbers of ICT equipment
will eventually become e-waste in the near future hence there is a need for better planning. Furthermore, in an
effort to make ICT affordable, the government of Uganda put tax waivers on importation of computers which
promotes the importation of used and refurbished devices such as computers, laptops, and mobile telephones. e-
waste contains more than 1,000 different substances such as lead, mercury, arsenic, cadmium, selenium,
hexavalent chromium, and flame retardants that create dioxins emissions when burned. Poor handling, recycling,
and disposal of e-waste can cause severe impacts on public health and the environment. Toxins arising from e-
waste have been found to cause brain damage, birth defects, allergic reactions, and cancer. (Zeng Xianlai, 2017).
Research Article
Forecasting of Generation of Electronic Waste on Green Community With Statistical Assessment of Numerical Models
3099
The use and consumption of mobile devices are increasing thanks to easy access to this type of technology, which
inherently increases the generation of electronic waste. Determining the psychometric properties of an instrument
measures adolescent attitudes towards the management of electronic waste. A validation of content and construct
supported by the application of exploratory and confirmatory factorial analysis was performed. This scale could be
applied in high school student populations and could be input for various works of research (Yois Pascuas-
Rengifo et al, 2021). One of the problems facing public education institutions in Brazil is the question of the
correct handling and treatment of waste electrical and electronic equipment (WEEE). Considering the regulations
for disposal of public goods that institutions have no WEEE management model which the lack of such a
management model, the university warehouse is at full capacity and unable to receive additional electronic
equipment. Therefore, creating a management model for WEEE to be used at public education institutions using
the guidelines. Action research is an adequate management tool for public institutions looking to deal with
problems of this nature, being that these institutions are almost always subject to bureaucratic controls with
respect to their public property, and expected to follow rigorous legislation that is often times controversial (Cátia
Paes et al, 2017). The management of used and end-of-life (EOL) electronics for over a decade, promotes the
reuse and recycling of used and EOL electronics through various programs, including Plug-In To eCycling and the
Federal Electronics Challenge. EOL electronics stems from three primary concerns about rapiding growth and
change in this product sector, leading to a constant stream of new product offerings and a wide array of obsolete
products needing appropriate management; the presence of toxic substances in many products which can cause
problematic exposures during recycling or disposal, if these products are not properly managed; and the need for
widespread, convenient and affordable opportunities to reuse/recycle electronics (with initial emphasis on TVs,
PCs and cell phones). Reuse and recovery of electronics conserves energy and materials embodied in used
electronics and reduces the environmental impact of these products (Peyton L. Sawyer, 2010). E-waste
management has become the top global issue in terms of environmental protection and resource recycling.
Although many attempts have been carried out to address the issue, many problems remain. With respect to most
developing countries, legislation improving and collection channel strengthening will significantly contribute to e-
waste recycling. Regarding small countries or regions ratifying the Basel Convention, mobile plants with efficient
amounts of equipment can be promising candidates for e-waste recycling. And for some countries with little e-
waste production, a feasible solution for e-waste recycling is that related countries can unite to establish some
field facilities for a synergic management of their e-waste. This book is dedicated to solve the e-waste problem
with some feasible solutions. It will provide some assistance for many stakeholders in e-waste areas. According to
the obtained results and implications, academic researchers can find the future direction of unsolved subjects, and
governments can make more reasonable decisions. (Sharma Rama Mohana R. Turaga, 2019). With advancements
in the electronic world almost occur on a day-to-day basis and increased availability of products to the public.The
plastic materials from e-waste; challenges and opportunities of e-waste management in developing countries and
to recovery of valuable metals from flat panel displays of spent liquid crystal and plasma televisions (Yuan Chun
Li and Banci Lian Wang, 2012). The recycling and reuse of waste from electrical and electronic equipment
(WEEE) plays a critical role in sustainable urban development. The behavior strategies of the government and
recyclers under WEEE subsidies as the optimal solution to the game for the government. The recycler is the
separating equilibrium (SE) reduce cheating (Jia Fu et al, 2020). e-waste is the fast growing waste streams in the
world increasing concern worldwide, e-waste has not yet been discussed in depth in the Middle East and North
Africa (MENA) region. Giving an estimate of the past and future trends in the generation of obsolete computers in
Algeria. Combining two models: the Carnegie Mellon model and the market supply (distribution delay) model.
The Carnegie Mellon model offers the following options for obsolete computers and monitors: the device could be
reused, stored, or discarded. The amounts of devices falling into each category were determined based on these
options. The outcomes from the market supply (distribution delay) model show that high amounts of computer
and monitor waste were registered for the period from 2014 to 2016 (Karima Hamouda, และ Rachid Adjroudi,
2017). The economic opportunity that e-waste offers, therefore, also brings along with it a gnarly web of
environmental justice and public health challenges that local and global e-waste regulators are grappling with.
However, the bill doesn't extend access to these resources to unaccredited e-waste companies. One of the first
steps towards building a circular economy as e-waste become raw materials rather than waste (Kang-Chun
Cheng, 2021).
The present statistical Analysis from the data collection case to forecasting with statistic numerical modelling.
The analysis have Pearson’s correlation measure correlation between interested data, but not causation and the
forecasting techniques in the present are Moving average, Weight moving average, Simple exponential
smoothing, Holt’s exponential smoothing. The Pearson’s correlation in this research is Technique to measure
correlation between interested data, but not causation. The Purpose of the Correlation used to measure how
linearly related between two random variables or interested data. The result is in range of -1 to 1, -1 mean the
variables have negative relationship and correlation value equal to 1 mean both of variables have position
relationship. The value of correlation equal 0 means both of interested data have no relationship between them.
Generally, if the values of correlation lay on -0.1 to 0.1, the researchers can assume that there is no relationship
Sujinna Karnasuta* , Panya Lao-Anantana
3100
and if the values of correlation have values greater than 0.7 or less than -0.7, the researchers can assume that there
is strong relationship between those interested data. The benefits of Pearson’s correlation are measure the
relationship between interested data, the correlation offers a starting position for research, easy to interpret,the
related data would have relationship, can be applied to several forecasting method, non-relationship could lead to
irrelevant between interested data, ignore these data or manipulate to do the forecasting techniques. The
forecasting technique of the Moving average as one of the simplest forecasting techniques have the benefits on the
prediction values are stable and The simplest forecasting technique. The forecasting technique of the Weight
moving average as more advanced by adding a weight as coefficient in the equation. The set of coefficients that
will be assigned a greater weight to newer data point, while past data points are assigned to be less weight, have
the benefits on adding the Weight parameter though time, the present data has more value than older data,and may
capture present’s event that affect the raw data. The forecasting technique of the Simple exponential smoothing as
one of the techniques in exponential smoothing forecasting. The simple exponential smoothing technique is
weighting between the observed data and the forecasting data, have the benefits on the easiest in exponential
smoothing technique, and weight between past forecasting value and actual value could perform better than
moving average. The forecasting technique of the Holt’s exponential smoothing as the concept is to introduce a
term of capturing the trend from the data. This research has done the exponential smoothing by using Python’s
library called statsmodel, have the benefits on Holt’s exponential smoothing technique can capture trend in raw
data, and more accurate than simple exponential smoothing in general.
This research study on the data collection of e-waste of light bulb and dry battery in 6 building location on
green community of the Kasetsart University from 2016 to 2020 though these 5 years. The statistical analysis
from the data collection case to forecasting with statistic numerical modelling. Pearson’s correlation of this
research is technique to measure correlation between interested data, but not causation. The forecasting techniques
of this research are the Moving average, the Weight moving average, the Simple exponential smoothing, the
Holt’s exponential smoothing.
2.Materials and Methods
The data collection of e-waste of light bulb and dry battery in 6 building locations
on green community of the Kasetsart University from 2016 to 2020 though these 5 years. The locations consist
of Library, Healthcare facility, Veterinary faculty, Environment faculty, Women's dormitory, and Research
institute.
The statistical Analysis from the data collection case to forecasting with statistic
numerical modelling follow as;
1.Pearson’s correlation: Technique to measure correlation between interested
data, but not causation (Kirch, 2008).
∑
√∑ ∑
Parameter:
correlation between x and y
value of x at time t
average of x
value of y at time t
average of y
2.Moving average: This technique is one of the simplest forecasting
techniques. The formula is as follow:
Parameter:
forecasting value at t+1 period
number of time periods
3.Weight moving average: This technique is more advanced by adding a
Forecasting of Generation of Electronic Waste on Green Community With Statistical Assessment of Numerical Models
3101
weight as coefficient in the equation. The set of coefficients that will be assigned a greater weight to newer
data point, while past data points are assigned to be less weight. The formula is as follow:
Parameter:
coefficient value as weight
4.Simple exponential smoothing: This is one of the techniques in exponential smoothing forecasting. The
simple exponential smoothing technique is weighting between the observed data and the forecasting data
(Brown,1963)
Parameter:
forecasting value at t period
actual data at t period
the smoothing factor, 0 < < 1
5.Holt’s exponential smoothing: The concept is to introduce a term of capturing the trend from the data
(Holt,1957).This research has done the exponential smoothing by using Python’s library called statsmodel
(Seabold and Perktold,2010).
Parameter:
the smoothing factor for level, 0 < < 1
the smoothing factor for trend, 0 < < 1
3.Results
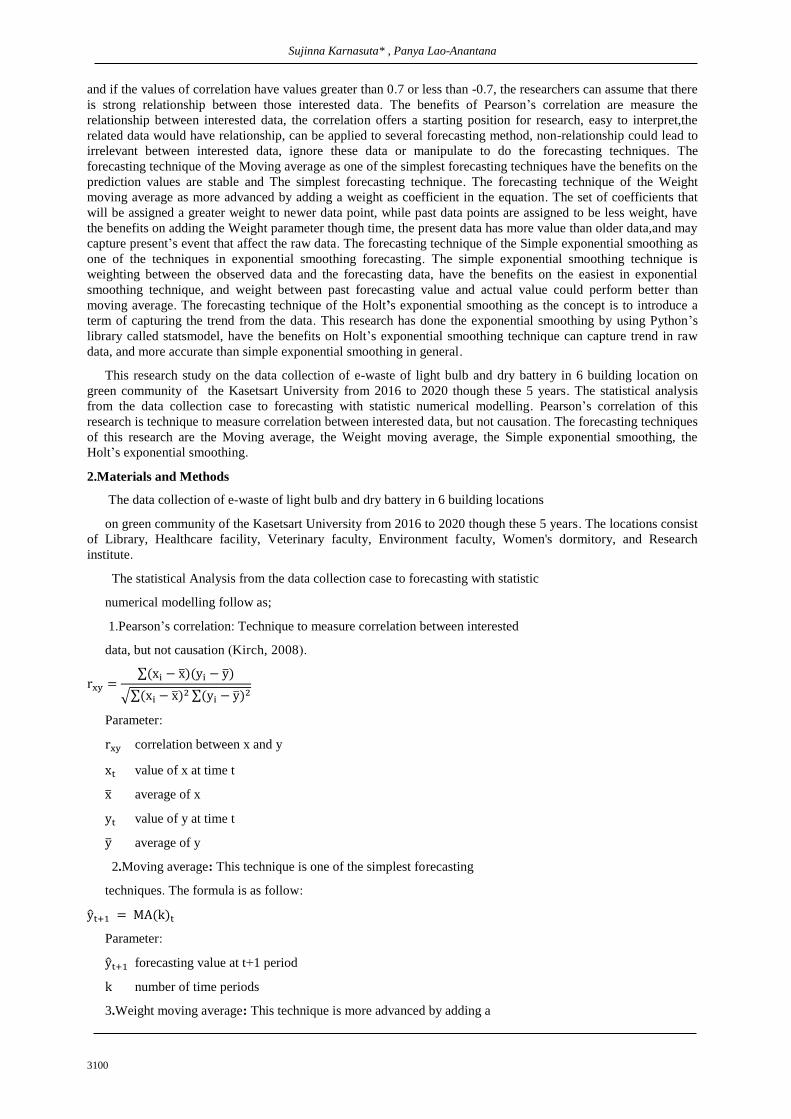
1.The e-waste number comparison of the 6 building locations are library location, Healthcare facility
location, veterinary faculty location, environment faculty location, women's dormitory location from 2016 to 2020
(Table 1). The e-waste in 2 categories, light bulb and dry battery that the light bulb seems to be large in library,
veterinary faculty, and women’s dormitory. The quantity of dry battery is around 100 – 400 units which is a lot
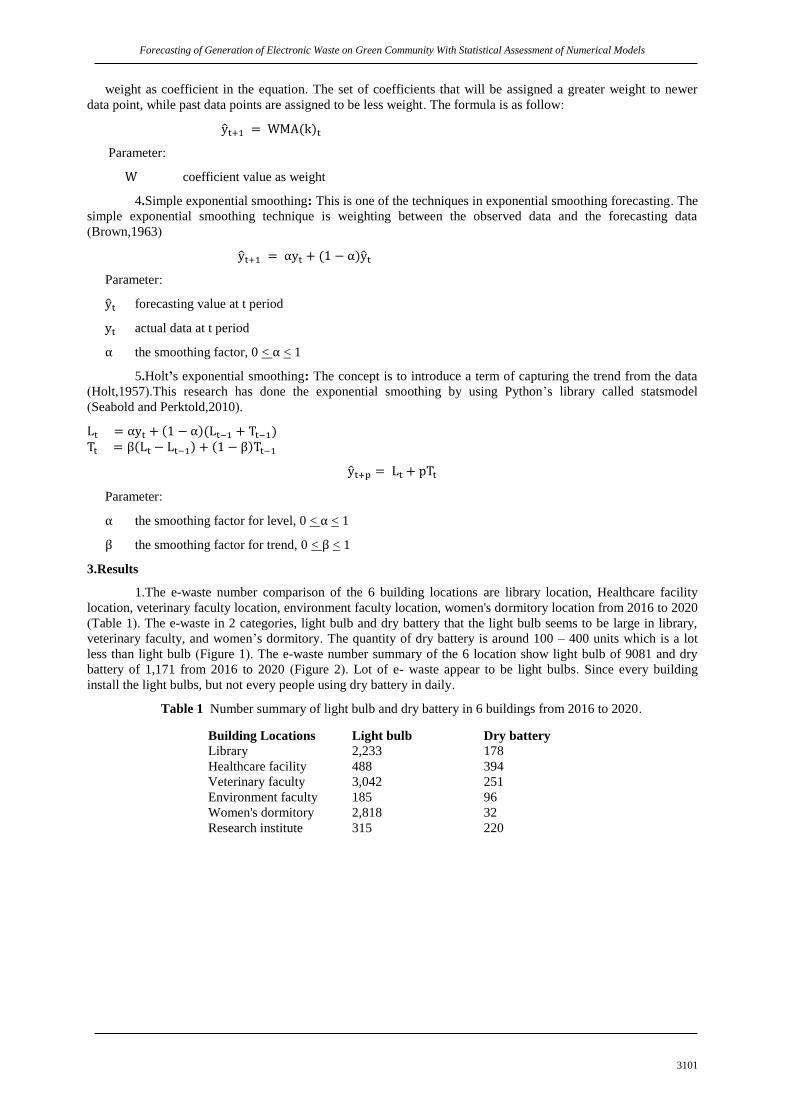
less than light bulb (Figure 1). The e-waste number summary of the 6 location show light bulb of 9081 and dry
battery of 1,171 from 2016 to 2020 (Figure 2). Lot of e- waste appear to be light bulbs. Since every building
install the light bulbs, but not every people using dry battery in daily.
Table 1 Number summary of light bulb and dry battery in 6 buildings from 2016 to 2020.
Building Locations Light bulb Dry battery
Library 2,233 178
Healthcare facility 488 394
Veterinary faculty 3,042 251
Environment faculty 185 96
Women's dormitory 2,818 32
Research institute 315 220
Sujinna Karnasuta* , Panya Lao-Anantana
3102
Figure 1 The light bulb and dry battery from 2016 until 2020.
Figure 2 The quantity of electronic waste from 2016 until 2020.
2.The number comparison of light bulb and dry battery in each year from 2016 to 2020 from the 6
building locations of library location, Healthcare facility location, veterinary faculty location, environment faculty
location, women's dormitory location(Table 2). The light bulb’s line moving around 1,300 – 2,100 units though
these 5 years and dry battery’s line moving around 50 – 400 units in these 5 years (Figure 3).
3.The correlation between quantity of light bulb and dry battery in 5 years from year 2016 to 2020, the
correlation between the quantity e-waste is 0.1127 which mean weak correlation or almost no correlation.
Therefore, both light bulb and dry battery have no correlation between them (Table 3).
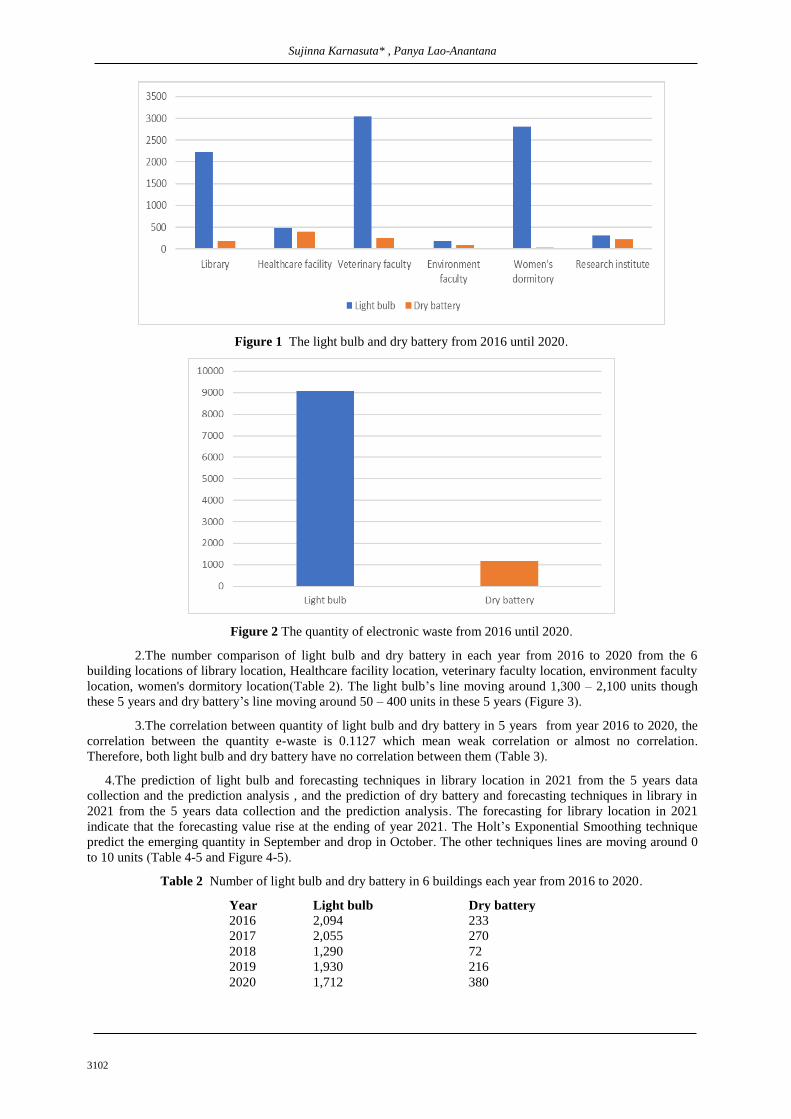
4.The prediction of light bulb and forecasting techniques in library location in 2021 from the 5 years data
collection and the prediction analysis , and the prediction of dry battery and forecasting techniques in library in
2021 from the 5 years data collection and the prediction analysis. The forecasting for library location in 2021
indicate that the forecasting value rise at the ending of year 2021. The Holt’s Exponential Smoothing technique
predict the emerging quantity in September and drop in October. The other techniques lines are moving around 0
to 10 units (Table 4-5 and Figure 4-5).
Table 2 Number of light bulb and dry battery in 6 buildings each year from 2016 to 2020.
Year Light bulb Dry battery
2016 2,094 233
2017 2,055 270
2018 1,290 72
2019 1,930 216
2020 1,712 380

Forecasting of Generation of Electronic Waste on Green Community With Statistical Assessment of Numerical Models
3103
Figure 3 The quantity of light bulb and dry battery from 2016 until 2020 each year.
Table 3 Correlation between light bulb and dry battery in 5 years.
Correlation Light bulb Dry battery
Light bulb 1
Dry battery 0.1127 1
Table 4 The prediction of light bulb in library location in 2021.
Date Moving Average
k=3
Weight Moving
Average k=3
Simple
Exponential
Smoothing
Holt’s
Exponential
Smoothing
Jan 2021 37.67 41.00 41.50 51.99
Feb 2021 24.00 34.83 10.75 0
Mar 2021 11.33 13.83 24.50 11.50
Apr 2021 7.67 10.50 13.00 0
May 2021 26.67 33.17 31.50 12.50
Jun 2021 23.00 18.67 15.00 0
Jul 2021 34.33 31.83 38.75 34.00
Aug 2021 29.33 32.00 12.00 1.50
Sep 2021 35.00 32.50 20.00 10.50
Oct 2021 38.67 40.50 51.75 42.00
Nov 2021 25.67 22.67 49.50 20.50
Dec 2021 46.67 45.83 65.00 69.50
0
50
100
150
20
16
-01
20
16
-04
20
16
-07
20
16
-10
20
17
-01
20
17
-04
20
17
-07
20
17
-10
20
18
-01
20
18
-04
20
18
-07
20
18
-10
20
19
-01
20
19
-04
20
19
-07
20
19
-10
20
20
-01
20
20
-04
20
20
-07
20
20
-10
20
21
-01
20
21
-04
20
21
-07
20
21
-10
Light bulb Moving Average k=3
Weight Moving Average k=3 Simple Exponential Smoothing
Holt's Exponential Smoothing
Sujinna Karnasuta* , Panya Lao-Anantana
3104
Figure 4 Forecasting techniques in light bulb for library location in year 2020.
Table 5 The prediction of dry battery in library location in 2021.
Date Moving Average
k=3
Weight Moving
Average k=3
Simple
Exponential
Smoothing
Holt’s
Exponential
Smoothing
Jan 2021 3.00 3.00 2.25 8.99
Feb 2021 0 0 0 0
Mar 2021 4.00 4.83 4.25 7.00
Apr 2021 0 0 0 0
May 2021 4.67 5.83 3.50 7.00
Jun 2021 4.00 4.33 5.00 2.50
Jul 2021 2.33 3.50 1.00 0
Aug 2021 0 0 5.00 0
Sep 2021 5.00 5.00 5.00 15.00
Oct 2021 4.67 4.67 1.75 3.50
Nov 2021 0 0 0 0
Dec 2021 0 0 0 0
Figure 5 Forecasting techniques in dry battery for library location in year 2021.
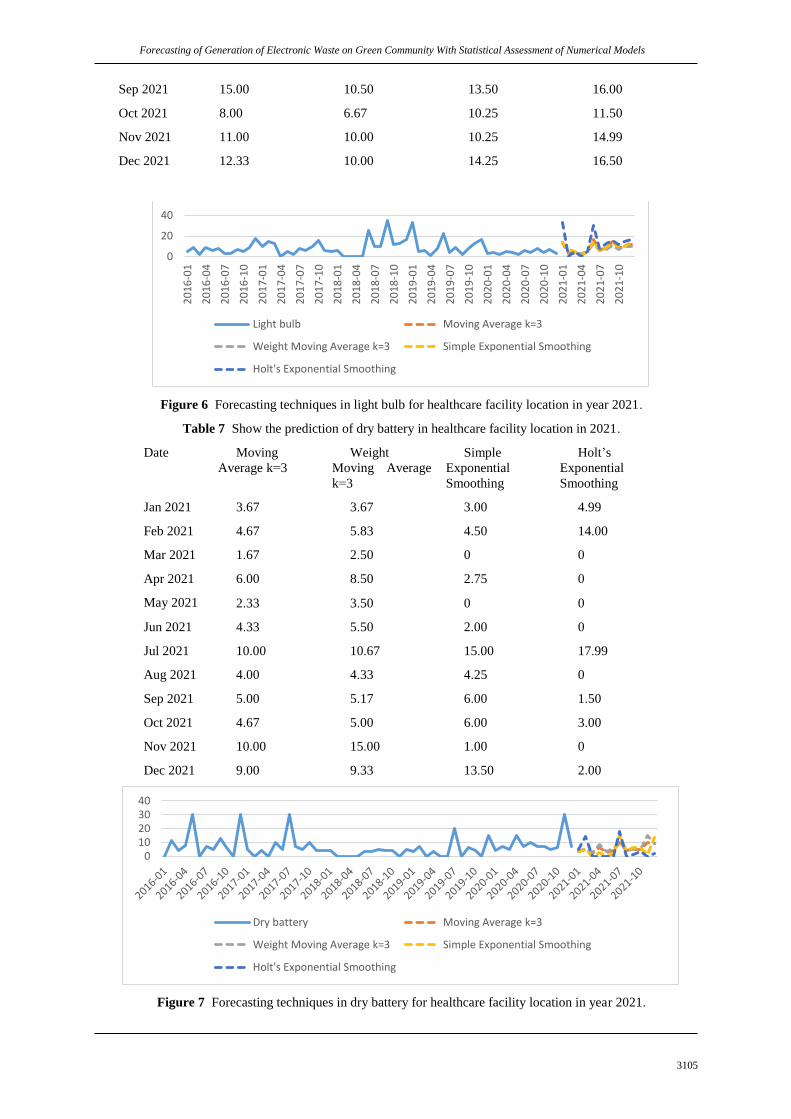
5. The prediction of light bulb and forecasting techniques in healthcare facility location in 2021 from the 5
years data collection and the prediction analysis , and the prediction of dry battery and forecasting techniques in
healthcare facility location in 2021 from the 5 years data collection and the prediction analysis. The forecasting e-
waste for healthcare facility location in 2021 indicate that quantity of light bulb and dry battery are almost equal in
healthcare facility location. Both predict of light bulb and dry battery in 2021 are high in July and stay around 10
– 20 units after October (Table 6-7 and Figure 6-7).
Table 6 The prediction of light bulb in healthcare facility location in 2021
Date Moving Average
k=3
Weight Moving
Average k=3
Simple
Exponential
Smoothing
Holt’s
Exponential
Smoothing
Jan 2021 14.00 13.50 13.50 33.50
Feb 2021 3.00 3.67 7.25 0.50
Mar 2021 2.67 3.00 5.25 5.00
Apr 2021 2.00 2.83 2.50 0
May 2021 4.00 4.67 4.75 4.99
Jun 2021 16.33 12.50 14.25 30.50
Jul 2021 6.67 6.00 6.25 7.49
Aug 2021 7.67 6.67 9.00 12.50
0
10
20
30
20
16
-01
20
16
-04
20
16
-07
20
16
-10
20
17
-01
20
17
-04
20
17
-07
20
17
-10
20
18
-01
20
18
-04
20
18
-07
20
18
-10
20
19
-01
20
19
-04
20
19
-07
20
19
-10
20
20
-01
20
20
-04
20
20
-07
20
20
-10
20
21
-01
20
21
-04
20
21
-07
20
21
-10
Dry battery Moving Average k=3
Weight Moving Average k=3 Simple Exponential Smoothing
Holt's Exponential Smoothing
Forecasting of Generation of Electronic Waste on Green Community With Statistical Assessment of Numerical Models
3105
Sep 2021 15.00 10.50 13.50 16.00
Oct 2021 8.00 6.67 10.25 11.50
Nov 2021 11.00 10.00 10.25 14.99
Dec 2021 12.33 10.00 14.25 16.50
Figure 6 Forecasting techniques in light bulb for healthcare facility location in year 2021.
Table 7 Show the prediction of dry battery in healthcare facility location in 2021.
Date Moving
Average k=3
Weight
Moving Average
k=3
Simple
Exponential
Smoothing
Holt’s
Exponential
Smoothing
Jan 2021 3.67 3.67 3.00 4.99
Feb 2021 4.67 5.83 4.50 14.00
Mar 2021 1.67 2.50 0 0
Apr 2021 6.00 8.50 2.75 0
May 2021 2.33 3.50 0 0
Jun 2021 4.33 5.50 2.00 0
Jul 2021 10.00 10.67 15.00 17.99
Aug 2021 4.00 4.33 4.25 0
Sep 2021 5.00 5.17 6.00 1.50
Oct 2021 4.67 5.00 6.00 3.00
Nov 2021 10.00 15.00 1.00 0
Dec 2021 9.00 9.33 13.50 2.00
Figure 7 Forecasting techniques in dry battery for healthcare facility location in year 2021.
0
20
40
20
16
-01
20
16
-04
20
16
-07
20
16
-10
20
17
-01
20
17
-04
20
17
-07
20
17
-10
20
18
-01
20
18
-04
20
18
-07
20
18
-10
20
19
-01
20
19
-04
20
19
-07
20
19
-10
20
20
-01
20
20
-04
20
20
-07
20
20
-10
20
21
-01
20
21
-04
20
21
-07
20
21
-10
Light bulb Moving Average k=3
Weight Moving Average k=3 Simple Exponential Smoothing
Holt's Exponential Smoothing
010203040
Dry battery Moving Average k=3
Weight Moving Average k=3 Simple Exponential Smoothing
Holt's Exponential Smoothing
Sujinna Karnasuta* , Panya Lao-Anantana
3106
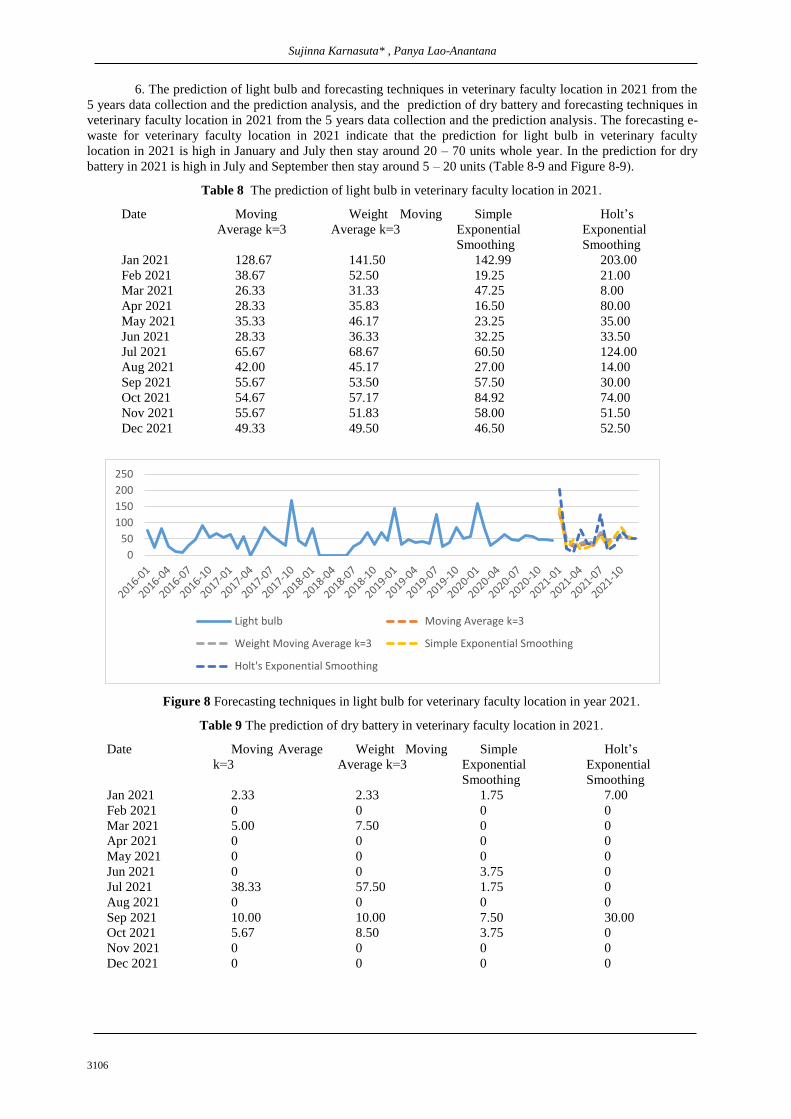
6. The prediction of light bulb and forecasting techniques in veterinary faculty location in 2021 from the
5 years data collection and the prediction analysis, and the prediction of dry battery and forecasting techniques in
veterinary faculty location in 2021 from the 5 years data collection and the prediction analysis. The forecasting e-
waste for veterinary faculty location in 2021 indicate that the prediction for light bulb in veterinary faculty
location in 2021 is high in January and July then stay around 20 – 70 units whole year. In the prediction for dry
battery in 2021 is high in July and September then stay around 5 – 20 units (Table 8-9 and Figure 8-9).
Table 8 The prediction of light bulb in veterinary faculty location in 2021.
Date Moving
Average k=3
Weight Moving
Average k=3
Simple
Exponential
Smoothing
Holt’s
Exponential
Smoothing
Jan 2021 128.67 141.50 142.99 203.00
Feb 2021 38.67 52.50 19.25 21.00
Mar 2021 26.33 31.33 47.25 8.00
Apr 2021 28.33 35.83 16.50 80.00
May 2021 35.33 46.17 23.25 35.00
Jun 2021 28.33 36.33 32.25 33.50
Jul 2021 65.67 68.67 60.50 124.00
Aug 2021 42.00 45.17 27.00 14.00
Sep 2021 55.67 53.50 57.50 30.00
Oct 2021 54.67 57.17 84.92 74.00
Nov 2021 55.67 51.83 58.00 51.50
Dec 2021 49.33 49.50 46.50 52.50
Figure 8 Forecasting techniques in light bulb for veterinary faculty location in year 2021.
Table 9 The prediction of dry battery in veterinary faculty location in 2021.
Date Moving Average
k=3
Weight Moving
Average k=3
Simple
Exponential
Smoothing
Holt’s
Exponential
Smoothing
Jan 2021 2.33 2.33 1.75 7.00
Feb 2021 0 0 0 0
Mar 2021 5.00 7.50 0 0
Apr 2021 0 0 0 0
May 2021 0 0 0 0
Jun 2021 0 0 3.75 0
Jul 2021 38.33 57.50 1.75 0
Aug 2021 0 0 0 0
Sep 2021 10.00 10.00 7.50 30.00
Oct 2021 5.67 8.50 3.75 0
Nov 2021 0 0 0 0
Dec 2021 0 0 0 0
0
50
100
150
200
250
Light bulb Moving Average k=3
Weight Moving Average k=3 Simple Exponential Smoothing
Holt's Exponential Smoothing
Forecasting of Generation of Electronic Waste on Green Community With Statistical Assessment of Numerical Models
3107
Figure 9 Forecasting techniques in dry battery for veterinary faculty location in year 2021.
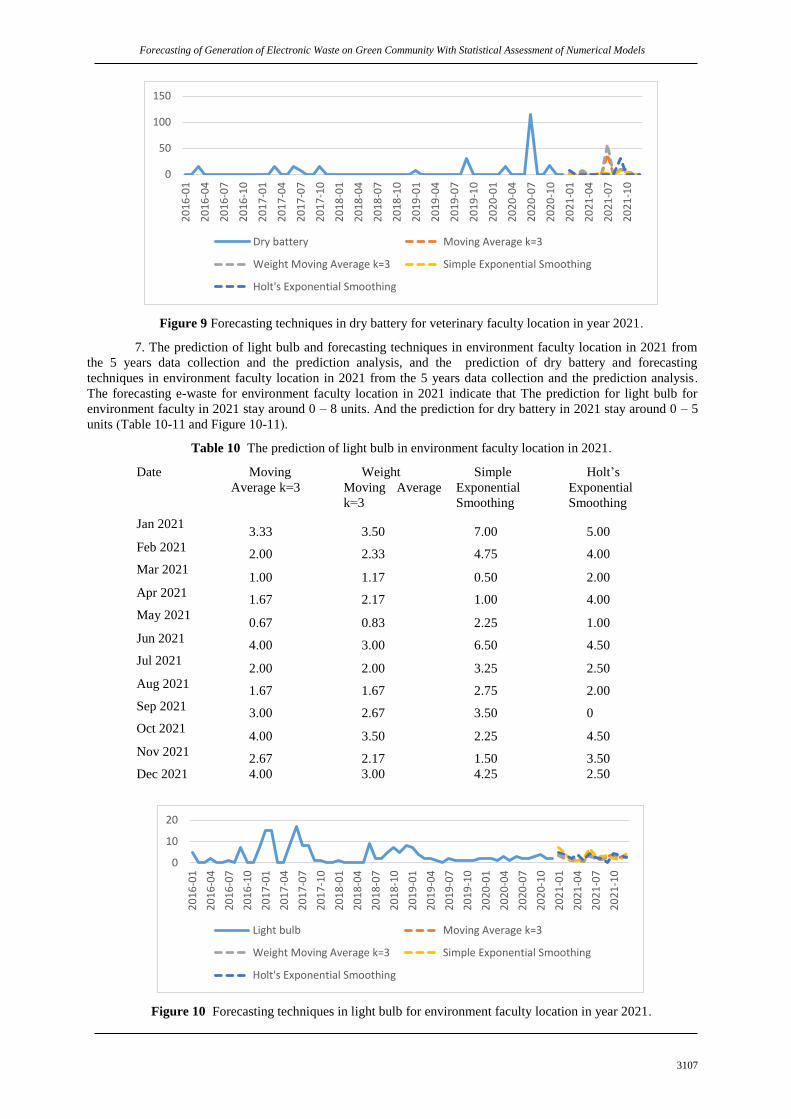
7. The prediction of light bulb and forecasting techniques in environment faculty location in 2021 from
the 5 years data collection and the prediction analysis, and the prediction of dry battery and forecasting
techniques in environment faculty location in 2021 from the 5 years data collection and the prediction analysis.
The forecasting e-waste for environment faculty location in 2021 indicate that The prediction for light bulb for
environment faculty in 2021 stay around 0 – 8 units. And the prediction for dry battery in 2021 stay around 0 – 5
units (Table 10-11 and Figure 10-11).
Table 10 The prediction of light bulb in environment faculty location in 2021.
Date Moving
Average k=3
Weight
Moving Average
k=3
Simple
Exponential
Smoothing
Holt’s
Exponential
Smoothing
Jan 2021 3.33 3.50 7.00 5.00
Feb 2021 2.00 2.33 4.75 4.00
Mar 2021 1.00 1.17 0.50 2.00
Apr 2021 1.67 2.17 1.00 4.00
May 2021 0.67 0.83 2.25 1.00
Jun 2021 4.00 3.00 6.50 4.50
Jul 2021 2.00 2.00 3.25 2.50
Aug 2021 1.67 1.67 2.75 2.00
Sep 2021 3.00 2.67 3.50 0
Oct 2021 4.00 3.50 2.25 4.50
Nov 2021 2.67 2.17 1.50 3.50
Dec 2021 4.00 3.00 4.25 2.50
Figure 10 Forecasting techniques in light bulb for environment faculty location in year 2021.
0
50
100
150
20
16
-01
20
16
-04
20
16
-07
20
16
-10
20
17
-01
20
17
-04
20
17
-07
20
17
-10
20
18
-01
20
18
-04
20
18
-07
20
18
-10
20
19
-01
20
19
-04
20
19
-07
20
19
-10
20
20
-01
20
20
-04
20
20
-07
20
20
-10
20
21
-01
20
21
-04
20
21
-07
20
21
-10
Dry battery Moving Average k=3
Weight Moving Average k=3 Simple Exponential Smoothing
Holt's Exponential Smoothing
0
10
20
20
16
-01
20
16
-04
20
16
-07
20
16
-10
20
17
-01
20
17
-04
20
17
-07
20
17
-10
20
18
-01
20
18
-04
20
18
-07
20
18
-10
20
19
-01
20
19
-04
20
19
-07
20
19
-10
20
20
-01
20
20
-04
20
20
-07
20
20
-10
20
21
-01
20
21
-04
20
21
-07
20
21
-10
Light bulb Moving Average k=3
Weight Moving Average k=3 Simple Exponential Smoothing
Holt's Exponential Smoothing
Sujinna Karnasuta* , Panya Lao-Anantana
3108
Table 11 The prediction of dry battery in environment faculty location in 2021.
Date Moving
Average k=3
Weight
Moving Average
k=3
Simple
Exponential
Smoothing
Holt’s
Exponential
Smoothing
Jan 2021 1.33 0.67 1.00 2.00
Feb 2021 1.67 2.50 0 0
Mar 2021 0.67 1.00 0 0
Apr 2021 0.67 0.67 2.00 0
May 2021 1.67 2.17 0.50 2.00
Jun 2021 1.00 1.00 2.00 3.00
Jul 2021 2.33 3.00 2.00 3.00
Aug 2021 1.67 1.33 2.50 1.50
Sep 2021 1.67 1.33 2.50 1.50
Oct 2021 3.00 4.17 1.50 2.00
Nov 2021 2.33 3.17 1.00 2.00
Dec 2021 0.67 1.00 1.00 0
Figure 11 Forecasting techniques in dry battery for environment faculty location in year 2021.
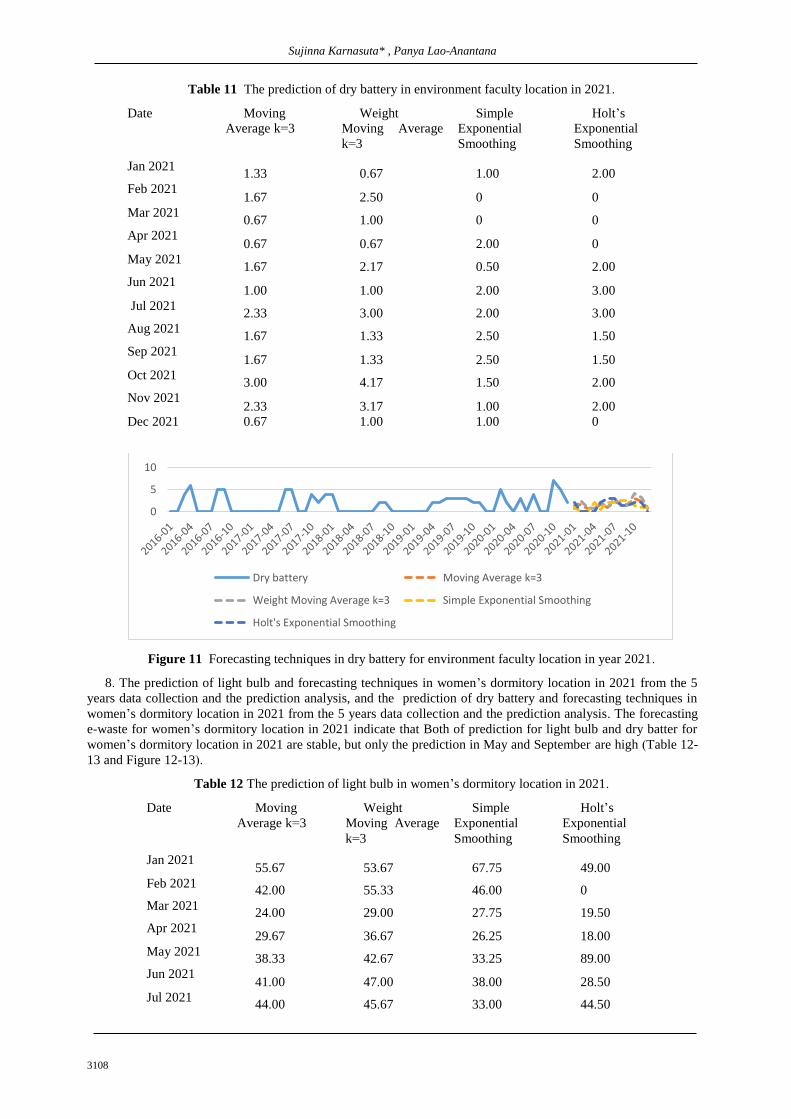
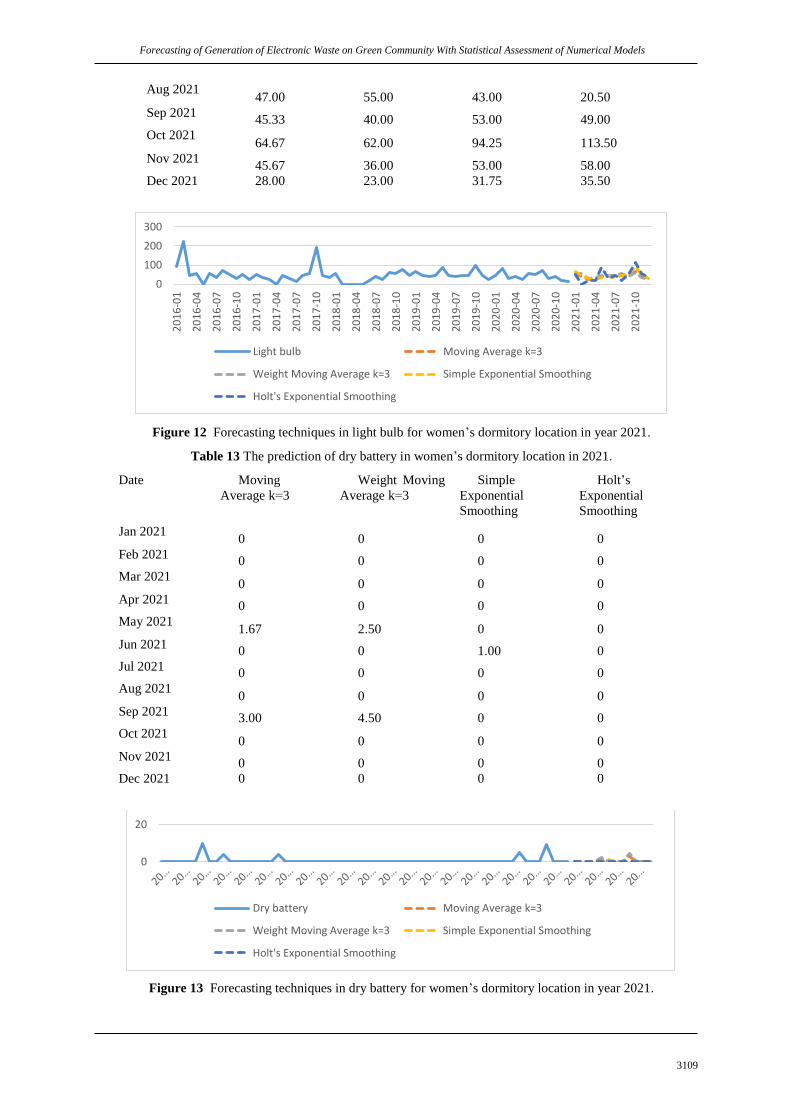
8. The prediction of light bulb and forecasting techniques in women’s dormitory location in 2021 from the 5
years data collection and the prediction analysis, and the prediction of dry battery and forecasting techniques in
women’s dormitory location in 2021 from the 5 years data collection and the prediction analysis. The forecasting
e-waste for women’s dormitory location in 2021 indicate that Both of prediction for light bulb and dry batter for
women’s dormitory location in 2021 are stable, but only the prediction in May and September are high (Table 12-
13 and Figure 12-13).
Table 12 The prediction of light bulb in women’s dormitory location in 2021.
Date Moving
Average k=3
Weight
Moving Average
k=3
Simple
Exponential
Smoothing
Holt’s
Exponential
Smoothing
Jan 2021 55.67 53.67 67.75 49.00
Feb 2021 42.00 55.33 46.00 0
Mar 2021 24.00 29.00 27.75 19.50
Apr 2021 29.67 36.67 26.25 18.00
May 2021 38.33 42.67 33.25 89.00
Jun 2021 41.00 47.00 38.00 28.50
Jul 2021 44.00 45.67 33.00 44.50
0
5
10
Dry battery Moving Average k=3
Weight Moving Average k=3 Simple Exponential Smoothing
Holt's Exponential Smoothing
Forecasting of Generation of Electronic Waste on Green Community With Statistical Assessment of Numerical Models
3109
Aug 2021 47.00 55.00 43.00 20.50
Sep 2021 45.33 40.00 53.00 49.00
Oct 2021 64.67 62.00 94.25 113.50
Nov 2021 45.67 36.00 53.00 58.00
Dec 2021 28.00 23.00 31.75 35.50
Figure 12 Forecasting techniques in light bulb for women’s dormitory location in year 2021.
Table 13 The prediction of dry battery in women’s dormitory location in 2021.
Date Moving
Average k=3
Weight Moving
Average k=3
Simple
Exponential
Smoothing
Holt’s
Exponential
Smoothing
Jan 2021 0 0 0 0
Feb 2021 0 0 0 0
Mar 2021 0 0 0 0
Apr 2021 0 0 0 0
May 2021 1.67 2.50 0 0
Jun 2021 0 0 1.00 0
Jul 2021 0 0 0 0
Aug 2021 0 0 0 0
Sep 2021 3.00 4.50 0 0
Oct 2021 0 0 0 0
Nov 2021 0 0 0 0
Dec 2021 0 0 0 0
Figure 13 Forecasting techniques in dry battery for women’s dormitory location in year 2021.
0
100
200
300
20
16
-01
20
16
-04
20
16
-07
20
16
-10
20
17
-01
20
17
-04
20
17
-07
20
17
-10
20
18
-01
20
18
-04
20
18
-07
20
18
-10
20
19
-01
20
19
-04
20
19
-07
20
19
-10
20
20
-01
20
20
-04
20
20
-07
20
20
-10
20
21
-01
20
21
-04
20
21
-07
20
21
-10
Light bulb Moving Average k=3
Weight Moving Average k=3 Simple Exponential Smoothing
Holt's Exponential Smoothing
0
20
Dry battery Moving Average k=3
Weight Moving Average k=3 Simple Exponential Smoothing
Holt's Exponential Smoothing
Sujinna Karnasuta* , Panya Lao-Anantana
3110
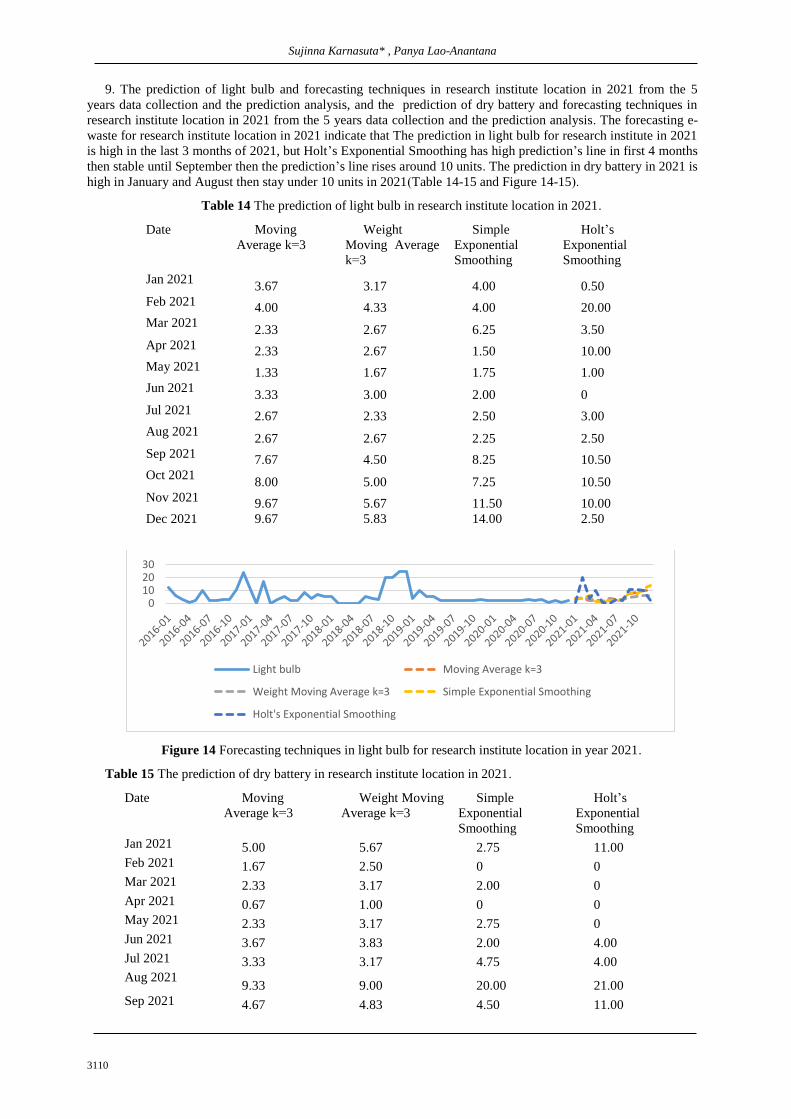
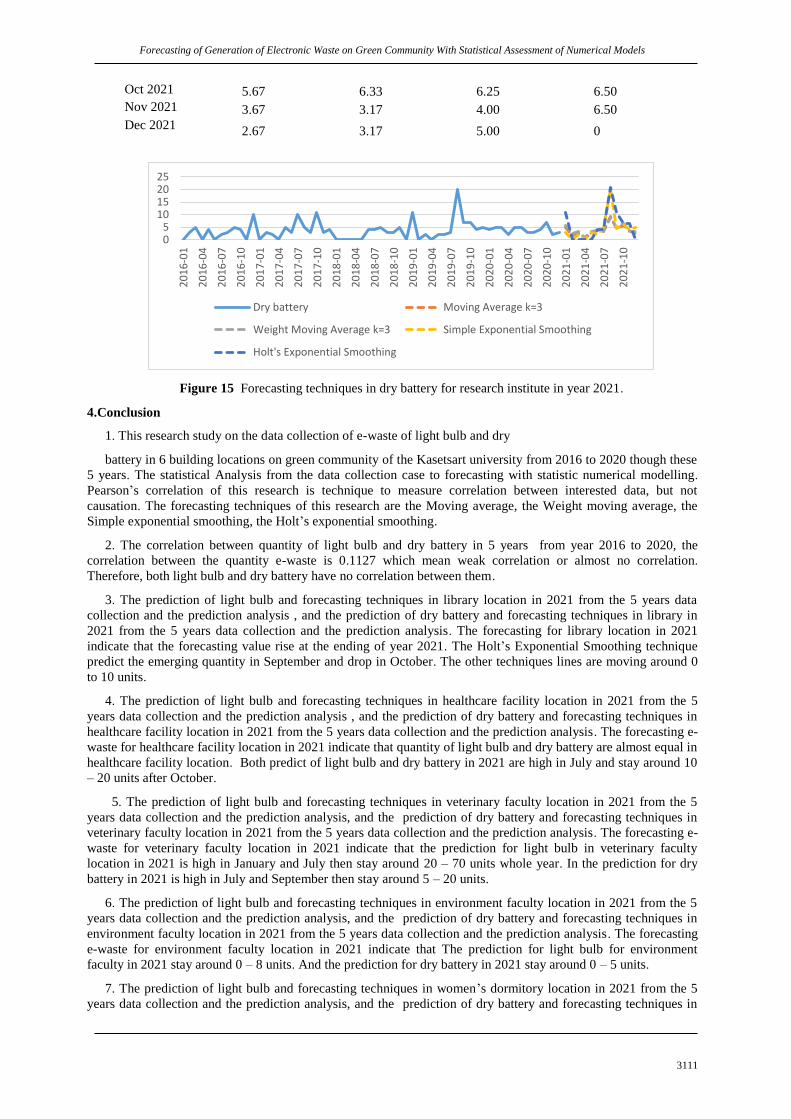
9. The prediction of light bulb and forecasting techniques in research institute location in 2021 from the 5
years data collection and the prediction analysis, and the prediction of dry battery and forecasting techniques in
research institute location in 2021 from the 5 years data collection and the prediction analysis. The forecasting e-
waste for research institute location in 2021 indicate that The prediction in light bulb for research institute in 2021
is high in the last 3 months of 2021, but Holt’s Exponential Smoothing has high prediction’s line in first 4 months
then stable until September then the prediction’s line rises around 10 units. The prediction in dry battery in 2021 is
high in January and August then stay under 10 units in 2021(Table 14-15 and Figure 14-15).
Table 14 The prediction of light bulb in research institute location in 2021.
Date Moving
Average k=3
Weight
Moving Average
k=3
Simple
Exponential
Smoothing
Holt’s
Exponential
Smoothing
Jan 2021 3.67 3.17 4.00 0.50
Feb 2021 4.00 4.33 4.00 20.00
Mar 2021 2.33 2.67 6.25 3.50
Apr 2021 2.33 2.67 1.50 10.00
May 2021 1.33 1.67 1.75 1.00
Jun 2021 3.33 3.00 2.00 0
Jul 2021 2.67 2.33 2.50 3.00
Aug 2021 2.67 2.67 2.25 2.50
Sep 2021 7.67 4.50 8.25 10.50
Oct 2021 8.00 5.00 7.25 10.50
Nov 2021 9.67 5.67 11.50 10.00
Dec 2021 9.67 5.83 14.00 2.50
Figure 14 Forecasting techniques in light bulb for research institute location in year 2021.
Table 15 The prediction of dry battery in research institute location in 2021.
Date Moving
Average k=3
Weight Moving
Average k=3
Simple
Exponential
Smoothing
Holt’s
Exponential
Smoothing
Jan 2021 5.00 5.67 2.75 11.00
Feb 2021 1.67 2.50 0 0
Mar 2021 2.33 3.17 2.00 0
Apr 2021 0.67 1.00 0 0
May 2021 2.33 3.17 2.75 0
Jun 2021 3.67 3.83 2.00 4.00
Jul 2021 3.33 3.17 4.75 4.00
Aug 2021 9.33 9.00 20.00 21.00
Sep 2021 4.67 4.83 4.50 11.00
0102030
Light bulb Moving Average k=3
Weight Moving Average k=3 Simple Exponential Smoothing
Holt's Exponential Smoothing
Forecasting of Generation of Electronic Waste on Green Community With Statistical Assessment of Numerical Models
3111
Oct 2021 5.67 6.33 6.25 6.50
Nov 2021 3.67 3.17 4.00 6.50
Dec 2021 2.67 3.17 5.00 0
Figure 15 Forecasting techniques in dry battery for research institute in year 2021.
4.Conclusion
1. This research study on the data collection of e-waste of light bulb and dry
battery in 6 building locations on green community of the Kasetsart university from 2016 to 2020 though these
5 years. The statistical Analysis from the data collection case to forecasting with statistic numerical modelling.
Pearson’s correlation of this research is technique to measure correlation between interested data, but not
causation. The forecasting techniques of this research are the Moving average, the Weight moving average, the
Simple exponential smoothing, the Holt’s exponential smoothing.
2. The correlation between quantity of light bulb and dry battery in 5 years from year 2016 to 2020, the
correlation between the quantity e-waste is 0.1127 which mean weak correlation or almost no correlation.
Therefore, both light bulb and dry battery have no correlation between them.
3. The prediction of light bulb and forecasting techniques in library location in 2021 from the 5 years data
collection and the prediction analysis , and the prediction of dry battery and forecasting techniques in library in
2021 from the 5 years data collection and the prediction analysis. The forecasting for library location in 2021
indicate that the forecasting value rise at the ending of year 2021. The Holt’s Exponential Smoothing technique
predict the emerging quantity in September and drop in October. The other techniques lines are moving around 0
to 10 units.
4. The prediction of light bulb and forecasting techniques in healthcare facility location in 2021 from the 5
years data collection and the prediction analysis , and the prediction of dry battery and forecasting techniques in
healthcare facility location in 2021 from the 5 years data collection and the prediction analysis. The forecasting e-
waste for healthcare facility location in 2021 indicate that quantity of light bulb and dry battery are almost equal in
healthcare facility location. Both predict of light bulb and dry battery in 2021 are high in July and stay around 10
– 20 units after October.
5. The prediction of light bulb and forecasting techniques in veterinary faculty location in 2021 from the 5
years data collection and the prediction analysis, and the prediction of dry battery and forecasting techniques in
veterinary faculty location in 2021 from the 5 years data collection and the prediction analysis. The forecasting e-
waste for veterinary faculty location in 2021 indicate that the prediction for light bulb in veterinary faculty
location in 2021 is high in January and July then stay around 20 – 70 units whole year. In the prediction for dry
battery in 2021 is high in July and September then stay around 5 – 20 units.
6. The prediction of light bulb and forecasting techniques in environment faculty location in 2021 from the 5
years data collection and the prediction analysis, and the prediction of dry battery and forecasting techniques in
environment faculty location in 2021 from the 5 years data collection and the prediction analysis. The forecasting
e-waste for environment faculty location in 2021 indicate that The prediction for light bulb for environment
faculty in 2021 stay around 0 – 8 units. And the prediction for dry battery in 2021 stay around 0 – 5 units.
7. The prediction of light bulb and forecasting techniques in women’s dormitory location in 2021 from the 5
years data collection and the prediction analysis, and the prediction of dry battery and forecasting techniques in
05
10152025
20
16
-01
20
16
-04
20
16
-07
20
16
-10
20
17
-01
20
17
-04
20
17
-07
20
17
-10
20
18
-01
20
18
-04
20
18
-07
20
18
-10
20
19
-01
20
19
-04
20
19
-07
20
19
-10
20
20
-01
20
20
-04
20
20
-07
20
20
-10
20
21
-01
20
21
-04
20
21
-07
20
21
-10
Dry battery Moving Average k=3
Weight Moving Average k=3 Simple Exponential Smoothing
Holt's Exponential Smoothing

Sujinna Karnasuta* , Panya Lao-Anantana
3112
women’s dormitory location in 2021 from the 5 years data collection and the prediction analysis. The forecasting
e-waste for women’s dormitory location in 2021 indicate that Both of prediction for light bulb and dry batter for
women’s dormitory location in 2021 are stable, but only the prediction in May and September are high.
8. The prediction of light bulb and forecasting techniques in research institute location in 2021 from the 5
years data collection and the prediction analysis, and the prediction of dry battery and forecasting techniques in
research institute location in 2021 from the 5 years data collection and the prediction analysis. The forecasting e-
waste for research institute location in 2021 indicate that The prediction in light bulb for research institute in 2021
is high in the last 3 months of 2021, but Holt’s Exponential Smoothing has high prediction’s line in first 4 months
then stable until September then the prediction’s line rises around 10 units. The prediction in dry battery in 2021 is
high in January and August then stay under 10 units in 2021.
9. The research result benefits from Pearson’s correlation and The forecasting techniques of this research with
the Moving average, the Weight moving average, the Simple exponential smoothing, the Holt’s exponential
smoothing can be used to prepare for what will happen in the future, gain the valuable in insight, and thee result
from prediction methods could decrease cost for the environmental management on the green community on the e-
waste.
5.Acknowledgment
Many Thank for Dr.Songwoot Graipaspong with global environmental policy role for guidance on the data
collection and comments on this research.
References
Kirch W..2008. Pearson’s Correlation Coefficient. (eds) Encyclopedia of Public
Health. Springer, Dordrecht.
Brown R.G..1963. Smoothing, Forecasting and Prediction of Discrete Time Series.
Billah B., King ML., Snyder RD., Koehler AB..1985. Exponential smoothing: The
state of the art, Journal of forecasting.
Holt, C. C.. 1957. Forecasting trends and seasonals by ex-ponentially weighted
averages, O.N.R. Memorandum52/1957, Carnegie Institute of Technology.
Seabold S. and Perktold J.. 2010. statsmodels: Econometric and statistical modeling
with python. In 9th Python in Science Conference.
Cátia Paes, Marcella Bernardo, Renato Lima, และ Fabiano Leal. 2017. Management of Waste Electrical and
Electronic Equipment in Brazilian Public Education Institutions: Implementation Through Action Research
on a University Campus. Systemic Practice & Action Research., 30(4), 377-393.
Frederick Oporia, Juliet Nabirye, Abdullah Ali Halage, David Musoke, and Esther Buregyeya Rebecca
Nuwematsiko. 2021. Knowledge, Perceptions, and Practices of Electronic Waste Management among
Consumers in Kampala, Uganda. Journal of Environmental and Public Health, 1-11.
Jesus Alfonso Beltran-Sanchez, and Bernardo Emilio García-Quiroga Yois Pascuas-Rengifo. 2021. Psychometric
Properties of an Instrument That Measures Adolescent Attitudes Towards Electronic Waste Management.
Revista de Psicología, 39(1), 137-159.
Jia Fu, Jun Zhong, Demin Chen, และ Qiang Liu. 2020. Urban environmental governance, government
intervention, and optimal strategies: A perspective on electronic wastemanagement in China. Elsevier B.V.
Kalyan Bhaskar (Coordinators),Satish Sinha, Daniel Hinchliffe, Morton Hemkhaus, Rachna Arora, Sandip
Chatterjee, Deepali Sinha Khetriwal, Verena Radulovic, Pranshu Singhal, and Hitesh Sharma Rama Mohana
R. Turaga. 2019. E-Waste Management in India: Issues and Strategies. VIKALPA The Journal for Decision
Makers, 44(3), 127-162.
Kang-Chun Cheng. 2021. SCRAPPY Endeavor. Earth Island Journal., 36(1), 31-36.
Karima Hamouda, และ Rachid Adjroudi. (2017). Electronic Waste Generation and Management in the Middle
East and North Africa (MENA) Region: Algeria as a Case Study. Environmental Quality Management.,
26(4), 5-16.
Peyton L. Sawyer. 2010. Electronic Waste Management and Recycling Issues of Old Computers and Electronics.
New York : Nova Science Publishers, Inc. .
Yois Pascuas-Rengifo, Jesus Alfonso Beltran-Sanchez, และ Bernardo Emilio García-Quiroga. 2021.
Psychometric Properties of an Instrument That Measures Adolescent Attitudes Towards Electronic Waste
Management. Pontificia Universidad Católica del Perú, 39(1).
Yuan Chun Li, และ Banci Lian Wang. 2012. E-waste: Management, Types and Challenges. Nova Science
Publishers, Inc.
Zeng Xianlai. 2017. E-waste : Regulations, Management Strategies and Current Issues. New York : Nova
Science Publishers, Inc.