Embed Size (px)
Citation preview
Forecasting of Financial Markets via Neural Network
ROUMEN TRIFONOV
Faculty of Computer Systems and Technology
Technical University of Sofia
8 Kliment Ohridski Bul., Sofia 1000
BULGARIA
Abstract: - Artificial neural network is one of the intelligent methods in Artificial Intelligence. There are many
decisions of different tasks using neural network approach. The forecasting problems are high challenge and
researchers use different methods to solve them. The financial tasks related to forecasting, classification and
management using artificial neural network are considered. The technology and methods for prediction of financial
data as well as the developed system for forecasting of financial markets via neural network are described in the
paper. The designed architecture of a neural network using four different technical indicators is presented. The
developed neural network is used for forecasting movement of stock prices one day ahead and consists of an input
layer, one hidden layer and an output layer. The training method is a training algorithm with back propagation of
the error. The main advantage of the developed system is self-determination of the optimal topology of neural
network, due to which it becomes flexible and more precise. The proposed system with neural network is universal
and can be applied to various financial instruments using only basic technical indicators as input data.
Key-Words: neural networks, forecasting, training algorithm, financial indicators, backpropagation
1 Introduction Artificial neural networks (ANNs) are used to solve
different tasks in many problem domains. Nowadays
accounting and financial classification and prediction
problems are high challenge and researchers use
different methods to solve them. Neural networks
analyze traditional classification and prediction
problems in accounting and finance due to their
capabilities to solve many nonlinear, dynamic and
hard formalized tasks in presence of huge statistical
data. Prediction of financial data is very important
issue and gives opportunity to demonstrate the
features of different techniques of the artificial
intelligence. The methods used for prediction could
be divided into two main categories: fundamental
analysis and technical analysis. The main economic
indicators, which affect the supply and demand, are
monitored in fundamental analysis.
Successful prediction can lead to substantial
material benefits. At the same time financial markets
are affected by a number of economic, political and
other factors that often interact in a very complex
way. Therefore the precise prediction the financial
markets is extremely difficult [1].
The Artificial Neural Networks have the ability to
discover the nonlinear relationship in the input data
set. With the correct topology and appropriate
weights of connections between neurons, neural
networks can be trained to approximate each function
expressing the dependence of the outputs from the
inputs using certain training algorithm. Assuming the
statement of the technical analysis that there are
certain trends in the price data, the neural network
can be used for detection of these trends
automatically and then an estimate of future price
movement should be made [2]. Neural networks are particularly popular because
they do not require a deep understanding of the
interconnection between the source data and results.
Significant advantages of neural networks are that
they are not programmed in the usual sense of the
word, they are trained, as well as their ability to
generalize, i.e. ability to obtain an informed result
based on new data.
Methods and instruments for short time prediction
of financial operations using neural network are
considered in this report. Particular attention is paid
on input data selection of should be made carefully
depending on the type of the prediction. In order to
WSEAS TRANSACTIONS on ADVANCES in ENGINEERING EDUCATION Roumen Trifonov
E-ISSN: 2224-3410 36 Volume 14, 2017
increase the accuracy of the output results and to
facilitate the learning process, the raw data should be
preliminary processed to eligible values for the
neural network.
The proposed system with neural network is
universal and can be applied to various financial
instruments using only basic technical indicators as
input data.
2 Financial tasks solved using neural
networks The main financial tasks related to forecasting,
classification and management than could be solved
using neural networks, are:
Financial time series prediction. The nature
of markets does not allow defining a single accurate
indicator as the market conditions change over time
and tasks are solved by considering a set of
indicators. To this class tasks belong forecasting
currency cross-rates, forecasting quotes and demand
for shares on the stock market (for short-term
investments) and forecasting balances on
correspondent accounts in the bank. Forecasting of
financial time series is in the basis of all investment
activities in industry - all stock and non-stock trading
systems with financial instruments [3];
Insurance activities. Forecasting tasks relate
to risk assessment of insurance investments based on
analysis of the reliability of the project and risk
assessment of insurance on the invested funds [4].
Predicting bankruptcy. Analyzing the
possibility of bankruptcy is particularly important
because the company's management can influence
the potential problems that need to be addressed. In
addition, investors, as well as financial auditors use
the financial ratios when evaluate the companies.
Likelihood Ratio of bankruptcy of the company is
defined on the basis of multi-criteria assessment [5];
Forecasting the results of taking credits. Neural networks are used to determine the
opportunities for lending to enterprises and rarely
when granting loans without pledge. When granting
loans without pledge is important to analyze
additional information about the borrower [6].
Predicting the economic efficiency of the
financing of economic and innovation projects
and Investor’s Behavior. The neural networks based
on time series are used for forecasting by analysis of
previously realized projects. Nonlinear model of the
neural network is used to predict to what extent the
proposed project corresponds to the economic
situation.
Bonds and shares of undertakings to
investment funds. The forecasting system could
consist of several neural networks that are trained by
the connections between the various technical and
economic indicators as well as periods of buying and
selling shares. The purpose of forecasting is to
choose the best time to buy and to sell shares. They
also solve tasks for the formation of a portfolio of
securities and recognition of situations where the
share prices sharply alter as a result of the play on the
exchange, as well as tasks to determine the ratio
between quotations and demand [6]
3 Technology for prediction of financial
markets The tasks of forecasting in the financial area can be
separated two major sub-tasks: building a model of
the neural network, which is convenient for the task
and training of the network. The model is selected
according to subject area and important role have a
set of input variables, the method of formation of
output variables, the method of a learning rule, the
architecture of the neural network and the method of
its training [8].
The methods used for prediction could be divided
into two main categories: fundamental analysis and
technical analysis. The main economic indicators
(political, economical and social), which affect the
supply and demand, are monitored in fundamental
analysis. For example, there are certain economic
news, which significantly influence the movements
of the market. The fundamental analysis is
appropriate for prediction in the long term. Technical
analysis on the other hand is a method of forecasting
through observation and study of historical data,
primarily price movement and volume and is used to
predict stock trends [3].
A typical sequence of actions in solving tasks of
predicting financial indicators via neural networks is
shown in fig. 1.
WSEAS TRANSACTIONS on ADVANCES in ENGINEERING EDUCATION Roumen Trifonov
E-ISSN: 2224-3410 37 Volume 14, 2017
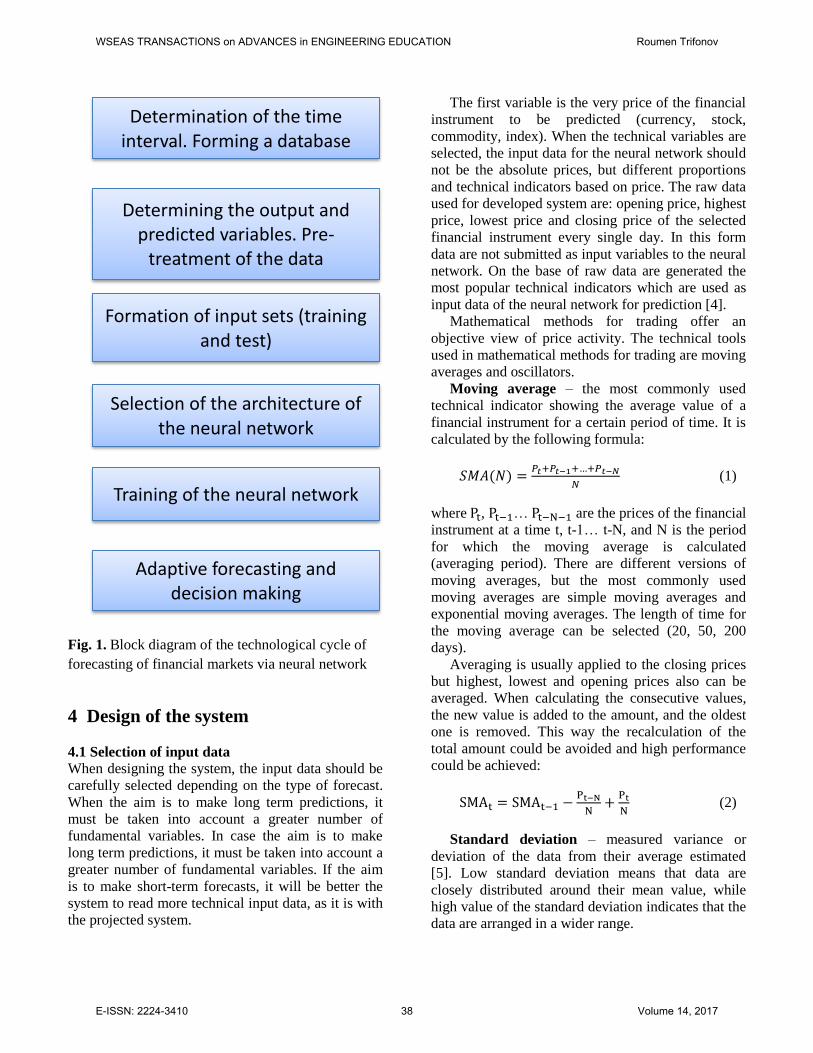
Fig. 1. Block diagram of the technological cycle of
forecasting of financial markets via neural network
4 Design of the system 4.1 Selection of input data
When designing the system, the input data should be
carefully selected depending on the type of forecast.
When the aim is to make long term predictions, it
must be taken into account a greater number of
fundamental variables. In case the aim is to make
long term predictions, it must be taken into account a
greater number of fundamental variables. If the aim
is to make short-term forecasts, it will be better the
system to read more technical input data, as it is with
the projected system.
The first variable is the very price of the financial
instrument to be predicted (currency, stock,
commodity, index). When the technical variables are
selected, the input data for the neural network should
not be the absolute prices, but different proportions
and technical indicators based on price. The raw data
used for developed system are: opening price, highest
price, lowest price and closing price of the selected
financial instrument every single day. In this form
data are not submitted as input variables to the neural
network. On the base of raw data are generated the
most popular technical indicators which are used as
input data of the neural network for prediction [4].
Mathematical methods for trading offer an
objective view of price activity. The technical tools
used in mathematical methods for trading are moving
averages and oscillators.
Moving average – the most commonly used
technical indicator showing the average value of a
financial instrument for a certain period of time. It is
calculated by the following formula:
𝑆𝑀𝐴(𝑁) =𝑃𝑡+𝑃𝑡−1+…+𝑃𝑡−𝑁
𝑁 (1)
where Pt, Pt−1… Pt−N−1 are the prices of the financial
instrument at a time t, t-1… t-N, and N is the period
for which the moving average is calculated
(averaging period). There are different versions of
moving averages, but the most commonly used
moving averages are simple moving averages and
exponential moving averages. The length of time for
the moving average can be selected (20, 50, 200
days).
Averaging is usually applied to the closing prices
but highest, lowest and opening prices also can be
averaged. When calculating the consecutive values,
the new value is added to the amount, and the oldest
one is removed. This way the recalculation of the
total amount could be avoided and high performance
could be achieved:
SMAt = SMAt−1 −Pt−N
N+
Pt
N (2)
Standard deviation – measured variance or
deviation of the data from their average estimated
[5]. Low standard deviation means that data are
closely distributed around their mean value, while
high value of the standard deviation indicates that the
data are arranged in a wider range.
Determination of the time interval. Forming a database
Determining the output and predicted variables. Pre-
treatment of the data
Formation of input sets (training and test)
Selection of the architecture of the neural network
Training of the neural network
Adaptive forecasting and decision making
WSEAS TRANSACTIONS on ADVANCES in ENGINEERING EDUCATION Roumen Trifonov
E-ISSN: 2224-3410 38 Volume 14, 2017
σN = √1
N∑ (xi − x̅)2N
i=1 (3)
where 𝑥1 , 𝑥2 ,..., 𝑥𝑁 are monitored values and �̅� -
their average value.
Stochastic oscillator – shows the whereabouts of
current value in relation to its variation for a given
period of time. This indicator tries to predict where
the price changes its direction of motion. It is
calculated as follows:
%K = 100P−LowN
HighN−LowN (4)
where P is the current price, 𝐻𝑖𝑔ℎ𝑁 is the highest
price for the last N periods and 𝐿𝑜𝑤𝑁 is the lowest
price for the last N periods.
Relative strength index – is another popular
oscillator, which is used to measure speed and
change of price movements. Its value changes from 0
to 100. It is calculated as the ratio between positive
and negative differences of the closing price for a
certain period of time - usually 7 to 14 days:
RSI = 100 −100
1+UN DN⁄ (5)
where 𝑈𝑁 is the average of all positive differences
between the closing prices for the period N, and 𝐷𝑁
is the average of all negative differences between the
closing prices for the same period. If 𝐷𝑁 is 0, the
value of RSI is considered to be 100.
Day of the week - There is no consensus on
which day of the week is most volatile, since
volatility can occur based on investor fears, major
world events and other financial uncertainties, and
even holidays. Ffinancial markets are closed on
weekends, so the daily return for working days could
be calculated using the following expression:
Rn =Cn−Cn−1
Cn−1 (6)
where, 𝑅𝑛 is return of the nth day, Cn is closing price
for n day andCn-1 is closing price for n-1 day of the
week.
A larger number of input variables are selected at
the first stage of system design. In the next phase, on
which an analysis how a variable affects the output
results are conducted, some of the variables may drop
out. It is also possible input data to include raw price
data and ratios of other financial instruments, which
are different from predicted one.
4.2 Preliminary processing of the data
This is a critical stage of system design because
presenting of input data directly affects their
behavior. Before analyzing of the input data by the
neural network, they should be pretreated in order to
increase the accuracy of the output results and to
facilitate the learning process. The most commonly
used techniques for the preprocessing of the data are
transformation and normalization [5]. The
transformation include the modeling of the raw data,
while the normalization is used for is used for even
distribution and scaling of data to eligible values for
the neural network. These methods for selecting the
input data represent the transformations of the raw
values.
The data normalization is the last step of
pretreatment. The purpose of normalization is the
data to be scaled within a specified interval (usually
[-1, 1] or [0, 1]).
Various methods can be used for normalization
depending on what is known about the data.
If the maximum and minimum values of the
modification are available, the following formula can
be used for scaling the data in the interval [0, 1]:
δ =x−Min
Max−Min (7)
where x is the scaled value, Min and Max are
respectively the smallest and largest value in the data
set.
From selected input data, the relative strength
index and stochastic oscillator could be normalized
easier, since they vary in the range [0, 100]. It is
enough from their values to be removed 50 and the
result to divide by 50 to obtain the normalized data in
the interval [-1, 1].
An interesting problem is the presentation of the
day of the week in the range [-1, 1]. As the days of
the week are known in advance (Monday to Friday)
they may accept contingent equidistant values in the
range [-1, 1], i.e. Monday -1 Tuesday -0.5
Wednesday 0 Thursday 0.5 and Friday + 1.
WSEAS TRANSACTIONS on ADVANCES in ENGINEERING EDUCATION Roumen Trifonov
E-ISSN: 2224-3410 39 Volume 14, 2017
4.3 Sensitivity Analysis of developed neural
network
The sensitivity analysis is the process which
determines whether an input variable affects the
output of neural network or not. For this purpose the
neural network is put in operation with or without
specific input and to examine variations in the output.
If no significant changes, it certainly means that this
input variable could be excluded completely. This
usually happens when an input variable is highly
correlated with other one. The removal of interrelated
input variables can significantly improve the
performance of the neural network.
5 Architecture of the neural network The architecture of a neural network used four
different technical indicators, which are based on the
raw data and the current day of the week is presented.
The number of input and output neurons is fixed and
the number of neurons in a single hidden layer is not
fixed and methods for determination of these
numbers are shown. In this way the system becomes
adaptable and its ability could be significantly
improved.
The training algorithm of developed system is
training algorithm with back propagation of the error,
which includes two phases.
The modeling of the neural network needs
significant number of experiments with network
parameters.
The main advantage of the developed system is
self-determination of the optimal topology of neural
network, due to which it becomes flexible and more
precise, as well as significantly reduces the time that
users should devote for multiple experiments in
finding the optimal neural network architecture.
Due to the nature of financial data and their high
degree of non-linearity a fixed architecture of the
neural network is not used for the designed system.
An algorithm for determination of the optimal
number of hidden layers and neurons in them is
presented. In this way the system becomes adaptable
and its ability could be significantly improved. Only
the number of input and output neurons is fixed.
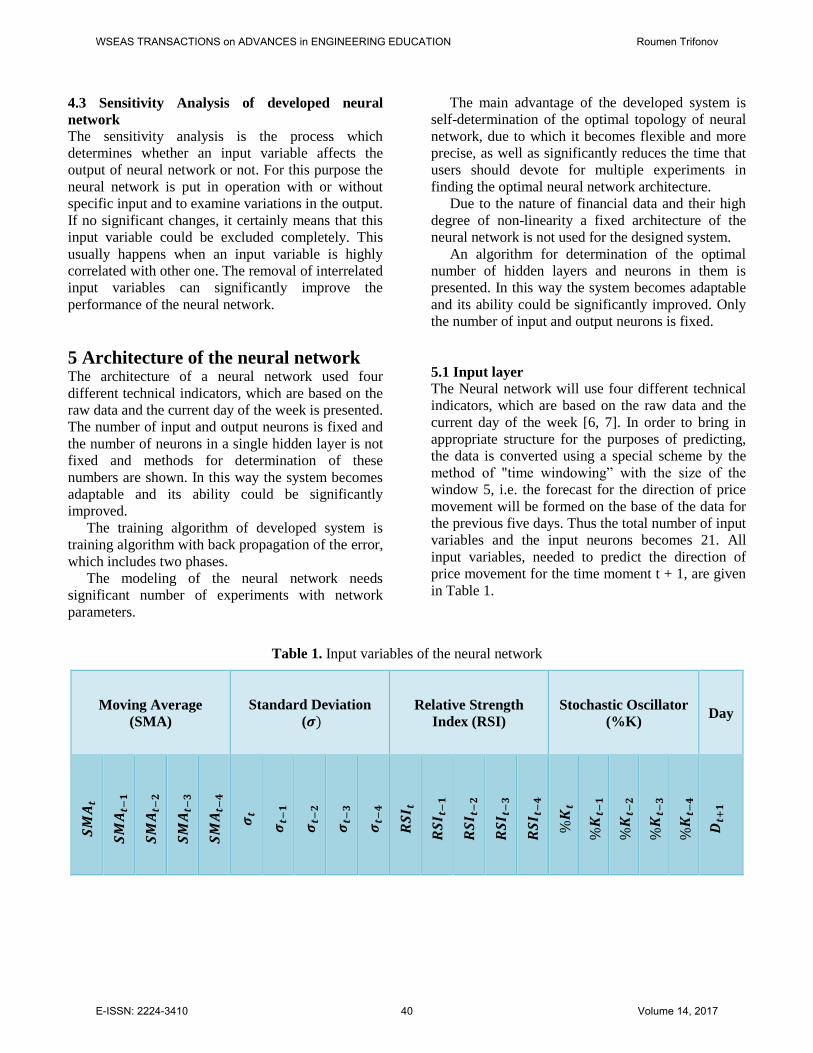
5.1 Input layer
The Neural network will use four different technical
indicators, which are based on the raw data and the
current day of the week [6, 7]. In order to bring in
appropriate structure for the purposes of predicting,
the data is converted using a special scheme by the
method of "time windowing” with the size of the
window 5, i.e. the forecast for the direction of price
movement will be formed on the base of the data for
the previous five days. Thus the total number of input
variables and the input neurons becomes 21. All
input variables, needed to predict the direction of
price movement for the time moment t + 1, are given
in Table 1.
Table 1. Input variables of the neural network
Moving Average
(SMA)
Standard Deviation
(𝝈)
Relative Strength
Index (RSI)
Stochastic Oscillator
(%K) Day
𝑺𝑴
𝑨𝒕
𝑺𝑴
𝑨𝒕−
𝟏
𝑺𝑴
𝑨𝒕−
𝟐
𝑺𝑴
𝑨𝒕−
𝟑
𝑺𝑴
𝑨𝒕−
𝟒
𝝈𝒕
𝝈𝒕−
𝟏
𝝈𝒕−
𝟐
𝝈𝒕−
𝟑
𝝈𝒕−
𝟒
𝑹𝑺
𝑰 𝒕
𝑹𝑺
𝑰 𝒕−
𝟏
𝑹𝑺
𝑰 𝒕−
𝟐
𝑹𝑺
𝑰 𝒕−
𝟑
𝑹𝑺
𝑰 𝒕−
𝟒
%𝑲
𝒕
%𝑲
𝒕−𝟏
%𝑲
𝒕−𝟐
%𝑲
𝒕−𝟑
%𝑲
𝒕−𝟒
𝑫𝒕+
𝟏
WSEAS TRANSACTIONS on ADVANCES in ENGINEERING EDUCATION Roumen Trifonov
E-ISSN: 2224-3410 40 Volume 14, 2017
The neural network has a single output (one
output neuron), resulting in one case the predicted
direction of movement for the next day is up and 0 in
predicted movement of the price is down compared
to today's closing price.
5.2 Hidden Layer
The system of neural network uses a single hidden
layer and the number of neurons in it is not fixed and
is determined so that the success of the neural
network to be maximal.
The algorithm used for determination of optimal
number of neurons in the hidden layer starts with
construction of the neural network with at least N/2
hidden neurons, where N is the number of input
variables. The neural network is trained a certain
number of times and tested for a certain period of
preselected input data. After completing of these
procedures, the percentage of the wrong predictions
is defined and saved. A new neural network, which
has with one more hidden neurons than the previous
is created and again is repeatedly trained and tested
on the same already available input data. The
learning process for the new created neural networks
is repeated many times and every time starts with
different random weights of connections between
neurons.
Applying the algorithm for back propagation of
the error, the weights are reset so that the error of the
network to be minimized. The values of weights, that
gave the best results in the training of the network,
are saved of all the iterations of training. The number
of training iterations for each of the established
networks is a parameter of the algorithm and is
determined experimentally.
Upon completion of the testing of the neural
network on the base of the unknown data during
training is determined whether the newly established
neural network is better than the previous (the
number of false predictions is smaller). The process
of creation of new neuron networks with gradually
increment of the number of hidden neurons finishes
when the new created networks are better than the
previous, i.e. when the first neural network show
worse results (big mistake) or until a predetermined
maximum number of hidden neurons is reached. It is
recommended that the maximum number of hidden
neurons does not exceed N.
5.3 Output layer
Prediction of exact amount of the price of a specific
financial instrument is extremely difficult because of
the nature of price movement. Therefore, it is much
more useful to make a prediction of the direction of
movement, compared to a selected reference point.
This leads to significantly better success rate of the
neural network.
The proposed method is to create an output
variable that effectively measures the direction of the
expected price movement compared to the closing
price of the previous day (8).
V =Closet−Closet−1
Max(Closet−1,Closet) (8)
The activation function is determined
experimentally or depends on the problem presented
to the neural network. The network is trained to
predict deviations from a value and for this purpose
the use of hyperbolic tangent gives the best results.
Therefore, the activation function of all neurons of
the neural network has the form:
tanh(x) = ex−e−x
ex+e−x (9)
and the input data are normalized to the interval
[-1; 1], so as to be suitable for the activation function.
5.4 Training algorithm
Once the number of all layers in the neural network
and the number of neurons in them are determined,
the weights of the connections between neurons
should be set in such a way in order to minimize the
error in the predictions made by the neural network.
This is the role of the training algorithm [8].
The developed system uses a training algorithm
with back propagation of the error, which includes
two phases. In the first phase, the free parameters
(the weights of synapses) of the neural network are
fixed, and the input signal passes through the
network layer-by-layer.
During the second phase, the error is
distributed across the network in reverse – from the
output to the input, hence the name of the algorithm.
In this phase, adjustment of the available parameters
of each neuron is made in order to minimize the error
in statistical terms. The both phases are repeated
until the performance of the neural network becomes
sufficiently good.
WSEAS TRANSACTIONS on ADVANCES in ENGINEERING EDUCATION Roumen Trifonov
E-ISSN: 2224-3410 41 Volume 14, 2017
6 Conclusion Experimental results show, that the system has an
average success rate of 70% in predicting the
direction of movement, which is a good success rate
in predicting the direction of the price movement one
day ahead, considering the complexity of the high
nonlinearity of financial data. The results show also
that the number of hidden neurons is different for
particular financial instruments. This means that the
presented algorithm for the optimal topology
determination of the network significantly improves
the system performance in comparison with using a
fixed neural network. This significantly reduces the
time that users have separated from numerous
attempts at finding the optimal neural network.
Weak link using neural networks in forecasting
financial markets is the high number of possible
outputs that make difficult the training of the system.
Several factors have a significant impact on the
efficiency of neural network: choice of input
variables, pre-processing of data and the architecture
of the neural network. The combination of the
different technical features increases the number of
input variables and the amount of data for learning,
but is the basis for obtaining more accurate forecast
results.
Designed system with neural network is universal
and can be applied to various financial instruments
using only basic technical indicators as input data.
ACKNOWLEDGMENTS
This research is conducted and funded in relation
to the execution of a scientific-research project №
Н07/56 “Increasing the level of network and
information security using intelligent methods” under
the contract with National Science Fund in Bulgaria.
References:
[1] A. V. Devadoss , T. A. A. Ligori., "Stock
Prediction Using Artificial Neural Networks,"
International Journal of Data Mining
Techniques and Applications, Vol 02,
December, pp. 283-291 , 2013.
[2] Jingtao Yao, Chew Lim Tan, "Guidelines for
Financial Forecasting with Neural Networks," in
Neural Information Processing, Shanghai,
2001.
[3] C. Hsieh, "Some Potential Applications of
Artificial Neural Systems in Financial
Management," Journal of Systems Management,
Vol. 44 N 4, p12(4), April 1993.
[4] Fred Kitchens, Thomas Harris, "Genetic
Adaptive Neural Networks for Prediction,"
International Journal of Engineering and
Advanced Research Technology (IJEART), vol.
1 , no. 6, pp. 27-30, December 2015.
[5] Jerzy Balicki, Piotr Przybyłek, Marcin Zadroga,
Marcin Zakidalski, "Methods of Artificial
Intelligence for Prediction and Prevention Crisis
Situations in Banking," Gdansk, Poland, 15-17
May 2014.
[6] Nazari M., Alidadi M., "Measuring credit risk
of bank customers using artificial neural
network," Journal of Management Research,
vol. 5, No. 2, 2013.
[7] C. Gangolf, Models and Methods for
Automated, University of Saarland, 2016.
[8] Fred Kitchens, Thomas Harris, "Genetic
Adaptive Neural Networks for Prediction,"
International Journal of Engineering and
Advanced Research Technology (IJEART), Vol.
1 , № 6, pp. 27-30, December 2015.
[9] O. Coupelon, " Neural Network Modeling for
Stock Movement Prediction a State of the Art,"
2007. [Online]. Available:
http://olivier.coupelon.free.fr/Neural_network_
modeling_for_stock_movemen_prediction.pdf.
[10] Finnie., Bruce J. Vanstone and Gavin, "An
empirical methodology for developing
stockmarket trading systems using artificial
neural networks,," 2009. [Online]. Available:
http://epublications.bond.edu.au/infotech_pubs/
21.
[11] A.H.i Moghaddama, M.H. Moghaddamb, M.
Esfandyari, "Stock market index prediction
using artificial neural network," Journal of
Economics, Finance and Administrative
Science, No. 21, p. 89–93, 2016.
[12] Martin T. Hagan, Howard B. Demuth, Mark
Hudson Beale, Orlando De Jesús, Neural
Network Design, 2 ed., eBook.
WSEAS TRANSACTIONS on ADVANCES in ENGINEERING EDUCATION Roumen Trifonov
E-ISSN: 2224-3410 42 Volume 14, 2017