Embed Size (px)
Citation preview

Forecasting
May 23, 2011

Today:
Forecasting
I Overview
I Forecast combination
I Density forecasts
Based on Stock and Watson (2005) and Gerard and Nimark (2009)

Forecasting
What is it?
Producing a prediction about the value of a random variable y athorizon h conditional on the information set in period t
yt+h|t = f (Ωt)
Sometimes one want to predict the distribution so that the objectof interest is
p(yt+h|t) = f (Ωt)

What are we forecasting?
Generally, the future. But there are variants of what the ”future”means:
I In sample forecasting (forecasts use what they forecast toestimate parameters of model)
I Out of sample forecasting
I Pseudo out-of-sample forecasting
True out-of-sample forecasts have to be collected from somethinglike a public record

Pseudo out-of-sample forecasting
Divide sample into training sample and forecasting sample
I Use training sample to estimate model used to forecast”out-of-sample”
Examples of strategies:
I Expanding window: Estimate model on sample running from1, 2, ..., t and use to produce forecasts of variables at datet + h : h > 0;
I Rolling window: Estimate model on sample running fromt − s, t − s + 1, ...t and use to produce forecasts of variablesat date t + h : h > 0;
Rolling window often used when parameter instability or structuralchange is suspected

Alternative specifications
Iterated one-step-ahead forecasts vs h step ahead forecasts
yt+h = Ahyt + εt
or
yt+h = Ah1yt
yt = A1yt−1 + εt
No clear consensus which approach is better
I With correctly specified model, h iterated 1-step-aheadforecasts should be better since more efficient estimates ofparameters

Producer and consumers of forecasts
Why does it matter what you will do with a forecast?
There may be biased forecasts with small MSE and unbiasedforecasts with large MSE.
I Two different users may disagree which forecast is best forthem
There is a large decision theoretic literature linking utility functionsand optimality of forecast

Forecasting in a data rich environment
Macro economists have a peculiar data situation:
I Many data series, but usually short samples
How can we utilize all this information without running intodegrees of freedom problems?

Pitfalls of OLS when N is large relative to T
Degrees of freedom problems
I You cannot have N larger than T and run a VAR
It can be shown that if N grows proportionally to T , standarderrors of parameter estimates do not shrink with sample size
I Forecast errors can be larger than the unconditional error(!)
So, what can be done?

A general principle: Dimension reduction
Dimension reduction usually improves forecast accuracy
I Simple models often do better. A univariate AR(1) is hard tobeat...
I BVARs (w/Litterman prior): A combination of a univariateunit roots and a VAR
I Factor models
I DSGE models
I Using economic theory to restrict the forecasting model

Forecast combination
How can we deal with model uncertainty?
Forecast combination:
I Can work well and forecast combinations often outperform allindividual forecasts used in pool
What is it?yt+h|t =
∑wiy
it+h|t
The set y it+h|t is also known as the “forecast pool”

Forecast combination
How can we choose the weights wi?
I Weights based on in or out of sample fit measures
I In-sample R2
I Previous out-of-sample fit
In practice, this adds additional free variables which may beundesirable

How can we control for ”similar” models?
If there are many similar models we do not get the full benefit of“model diversification”
I Choose weights minimize Kullback-Leibler distance betweenforecast and ”truth”
I We don’t know the ”true” model, but by definition, outcomesare generated by the ”true” model
For point forecasts, this simply means regressing previous forecastson outcomes to find weights:
yt+h =∑
wiyit+h|t + ut
But simple combinations like equal weights on all models oftenwork better than sophisticated methods (also known as the”forecast combination puzzle”).

Forecast combination
Sometimes the models in a forecast pool that are good at shorthorizons are not so good at long horizon forecasting
I This can be accommodated by choosing horizon specificweights

0.0
0.2
0.4
0.6
0.8
0.0
0.2
0.4
0.6
0.8
1-quarter-ahead horizon 2-quarter-ahead horizon
4-quarter-ahead horizon 8-quarter-ahead horizon
Weight
0.2
0.4
0.6
0.8
0.2
0.4
0.6
0.8
— BVAR2 — FAVAR12 — DSGE20072007 200420042001
Weight
Weight Weight

Forecast combination
Few general lessons:
I Why does combinations work so well?
I Why do simple combinations often do as well as moresophisticated combinations?
Probably it is because none of the models we can think of is reallythe true data generating process.

Other types of forecasts
Density forecasts (also known as fan charts)
I Provides a more complete picture of the distribution of futureevents than a simple point forecast
I Communicates uncertainty around forecasts
Popular with central banks nowadays

Density forecast example
Inflation targeting central bank
I What is the probability that the inflation rate will be outsidethe official target band?
Have become popular tools to communicate interest rateexpectations to the public without appearing to ”commit” to aparticular path

Trimmed mean inflation
2007
2
4
6
2
4
6
1
2
3
4
1
2
3
4
1
2
3
4
1
2
3
4
Cash rateThree-month average
GDP growth
Year-ended
Year-ended
3
4
5
6
7
3
4
5
6
7
2004200119981995
%
%
%
%
%
%
— Median 50 per cent probability intervals Actual outcomes 90 per cent probability intervals

— BVAR2 — FAVAR12 — DSGE— PL — EQUAL
-4 -2 0 2 4 6 8 10 12
Probabilitydensity
Actual outcome
Cash rateThree-month average
Trimmed mean inflationYear-ended
GDP growthYear-ended
-2 -1 0 1 2 3 4 5 6 7
2 3 4 5 6 7 8 9 10 11Per cent
Per cent
Per cent
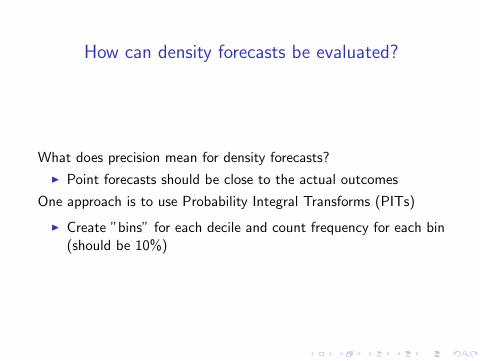
How can density forecasts be evaluated?
What does precision mean for density forecasts?
I Point forecasts should be close to the actual outcomes
One approach is to use Probability Integral Transforms (PITs)
I Create ”bins” for each decile and count frequency for each bin(should be 10%)

GDP growth(LHS)
Uniform
2
4
6
2
4
6
2468
5
10
15
5
10
15
5101520
5101520
Inflation(LHS)
Cash rate(LHS)
BVAR
2FA
VAR1
2DS
GE
Multivariate(RHS)
1.00.5Pit-valuesPit-valuesPit-values Pit-values
NoNo
NoNo
NoNo
1.00.5 1.00.5 1.00.5
2468
02468
5101520
05101520
05101520
PLEQ
UAL
NoNo
NoNo

Forecasting: Summing up
Forecasting is perhaps the most common usage of time seriesmodels in practice
I Which models are good or bad may depend on who will use it
Dimension reduction is often important
I Avoids in-sample over fitting
Point- and density forecast require different evaluation tools
I PITs is one way, but shortness of sample can be real problem