Embed Size (px)
Citation preview
W&M ScholarWorks W&M ScholarWorks
Reports
Summer 2018
Forecasting Coastal Water Levels in Virginia Forecasting Coastal Water Levels in Virginia
Center for Coastal Resources Management, Virginia Institute of Marine Science
Follow this and additional works at: https://scholarworks.wm.edu/reports
Part of the Environmental Sciences Commons
Recommended Citation Recommended Citation Center for Coastal Resources Management, Virginia Institute of Marine Science. (2018) Forecasting Coastal Water Levels in Virginia. Rivers & Coast, Summer 2018, Vol. 13. Virginia Institute of Marine Science, College of William and Mary. https://doi.org/10.25773/v5-8vnk-5f04
This Report is brought to you for free and open access by W&M ScholarWorks. It has been accepted for inclusion in Reports by an authorized administrator of W&M ScholarWorks. For more information, please contact [email protected].
Forecasting Coastal Water Levels in Virginia
Summer 2018, Vol. 13
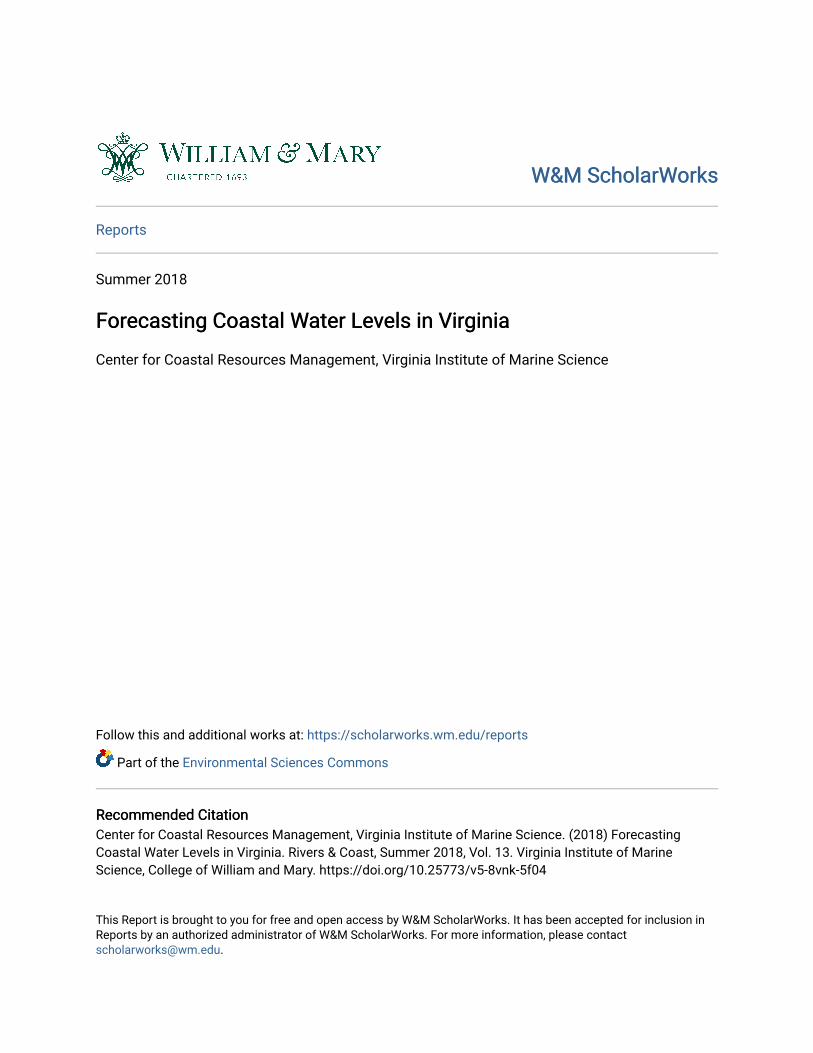
Living in coastal Virginia requires an awareness of water and the constantly
changing levels of the ocean, Bay, and rivers that surround the area. Increases in sea level and intense rainfall events are causing ever more frequent flooding with growing impacts on roads, homes, and businesses. As a result, people are learning to monitor current and future conditions in order to inform decisions about both daily activities and longer term planning.
There are an ever increasing number of resources available to residents and government officials, providing information on projected water levels in the near term (the next several days) and over longer terms (the next several decades to the end of the century). Unfortunately, these sources do not always seem to be saying the same thing. The Virginia Institute of Marine Science (VIMS) is tasked with providing information and advice to the Commonwealth on such matters, and we have developed tools to forecast both short term and longer term water levels in our coastal region. The output of these tools is available on the AdaptVA.org website that we maintain.
Photo 1. Flood waters washed out a road on the Eastern Shore of Virginia.
This issue of Rivers & Coast provides an introduction to two sea level forecast tools located under the Forecasts tab on AdaptVA.org – “VA Sea Level” and “Tidewatch”
Figure 1. ADAPTVA is a gateway to information on climate adaptation. The web portal focuses on the physical and social vulnerabilities by integrating the best available science, legal guidance, and planning strategies. Visitors will find legal and policy resources, stories that explain adaption through maps and pictures, a searchable web catalogue, and mapping tools that address short and long-term predictions for rising water levels.
2 Rivers & Coast
Virginia Sea Level Rise Forecasts
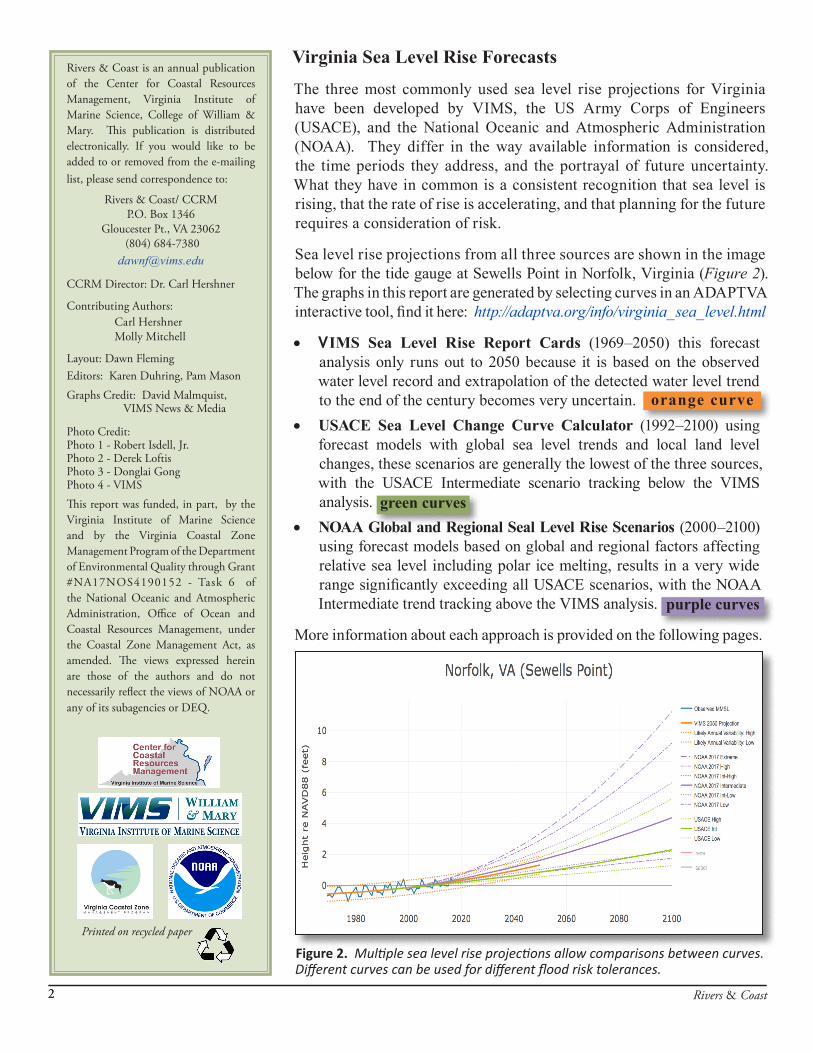
The three most commonly used sea level rise projections for Virginia have been developed by VIMS, the US Army Corps of Engineers (USACE), and the National Oceanic and Atmospheric Administration (NOAA). They differ in the way available information is considered, the time periods they address, and the portrayal of future uncertainty. What they have in common is a consistent recognition that sea level is rising, that the rate of rise is accelerating, and that planning for the future requires a consideration of risk.
Sea level rise projections from all three sources are shown in the image below for the tide gauge at Sewells Point in Norfolk, Virginia (Figure 2). The graphs in this report are generated by selecting curves in an ADAPTVA interactive tool, find it here: http://adaptva.org/info/virginia_sea_level.html
• VIMS Sea Level Rise Report Cards (1969–2050) this forecast analysis only runs out to 2050 because it is based on the observed water level record and extrapolation of the detected water level trend to the end of the century becomes very uncertain.
• USACE Sea Level Change Curve Calculator (1992–2100) using forecast models with global sea level trends and local land level changes, these scenarios are generally the lowest of the three sources, with the USACE Intermediate scenario tracking below the VIMS analysis.
• NOAA Global and Regional Seal Level Rise Scenarios (2000–2100) using forecast models based on global and regional factors affecting relative sea level including polar ice melting, results in a very wide range significantly exceeding all USACE scenarios, with the NOAA Intermediate trend tracking above the VIMS analysis.
More information about each approach is provided on the following pages.
Rivers & Coast is an annual publication of the Center for Coastal Resources Management, Virginia Institute of Marine Science, College of William & Mary. This publication is distributed electronically. If you would like to be added to or removed from the e-mailing list, please send correspondence to:
Rivers & Coast/ CCRM P.O. Box 1346
Gloucester Pt., VA 23062 (804) 684-7380
CCRM Director: Dr. Carl Hershner
Contributing Authors: Carl Hershner Molly Mitchell
Layout: Dawn FlemingEditors: Karen Duhring, Pam Mason
Graphs Credit: David Malmquist, VIMS News & Media
Photo Credit:Photo 1 - Robert Isdell, Jr.Photo 2 - Derek LoftisPhoto 3 - Donglai GongPhoto 4 - VIMS
This report was funded, in part, by the Virginia Institute of Marine Science and by the Virginia Coastal Zone Management Program of the Department of Environmental Quality through Grant #NA17NOS4190152 - Task 6 of the National Oceanic and Atmospheric Administration, Office of Ocean and Coastal Resources Management, under the Coastal Zone Management Act, as amended. The views expressed herein are those of the authors and do not necessarily reflect the views of NOAA or any of its subagencies or DEQ.
Printed on recycled paper
2
Figure 2. Multiple sea level rise projections allow comparisons between curves. Different curves can be used for different flood risk tolerances.
orange curve
purple curves
green curves
3Summer 2018, Vol. 13
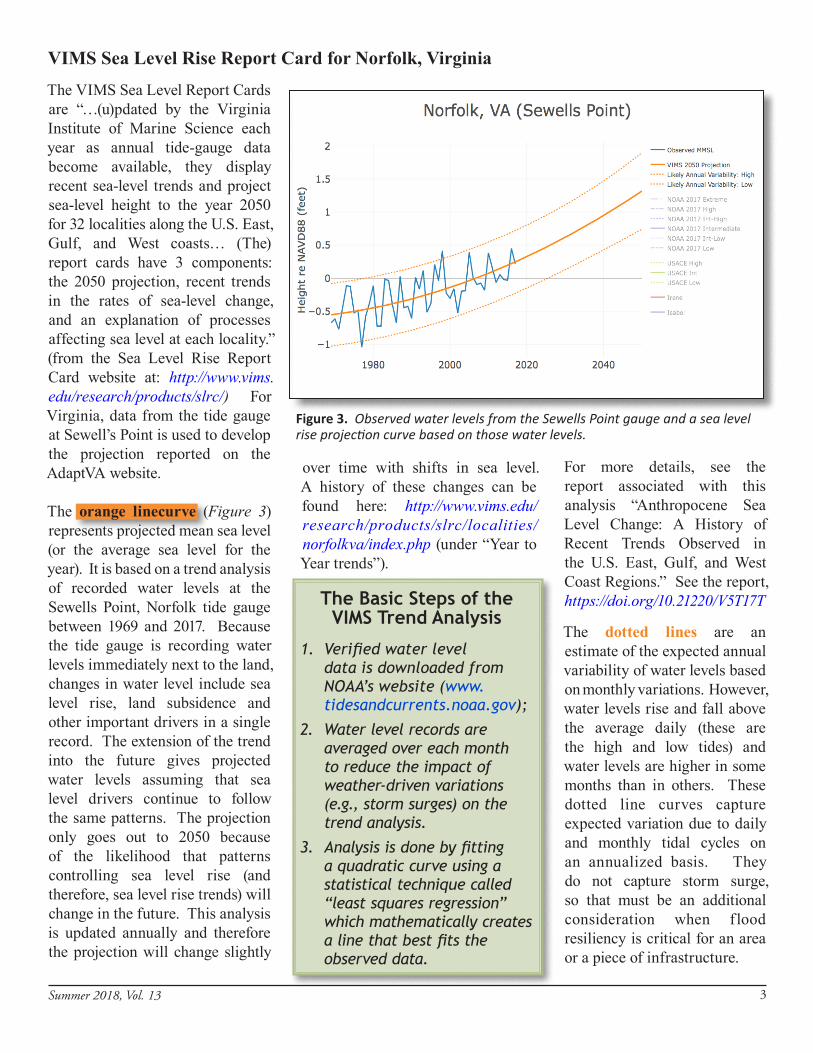
The VIMS Sea Level Report Cards are “…(u)pdated by the Virginia Institute of Marine Science each year as annual tide-gauge data become available, they display recent sea-level trends and project sea-level height to the year 2050 for 32 localities along the U.S. East, Gulf, and West coasts… (The) report cards have 3 components: the 2050 projection, recent trends in the rates of sea-level change, and an explanation of processes affecting sea level at each locality.” (from the Sea Level Rise Report Card website at: http://www.vims.edu/research/products/slrc/) For Virginia, data from the tide gauge at Sewell’s Point is used to develop the projection reported on the AdaptVA website.
The orange linecurve (Figure 3)represents projected mean sea level (or the average sea level for the year). It is based on a trend analysis of recorded water levels at the Sewells Point, Norfolk tide gauge between 1969 and 2017. Because the tide gauge is recording water levels immediately next to the land, changes in water level include sea level rise, land subsidence and other important drivers in a single record. The extension of the trend into the future gives projected water levels assuming that sea level drivers continue to follow the same patterns. The projection only goes out to 2050 because of the likelihood that patterns controlling sea level rise (and therefore, sea level rise trends) will change in the future. This analysis is updated annually and therefore the projection will change slightly
Figure 3. Observed water levels from the Sewells Point gauge and a sea level rise projection curve based on those water levels.
over time with shifts in sea level. A history of these changes can be found here: http://www.vims.edu/research/products/slrc/localities/norfolkva/index.php (under “Year to Year trends”).
For more details, see the report associated with this analysis “Anthropocene Sea Level Change: A History of Recent Trends Observed in the U.S. East, Gulf, and West Coast Regions.” See the report, https://doi.org/10.21220/V5T17T
The dotted lines are an estimate of the expected annual variability of water levels based on monthly variations. However, water levels rise and fall above the average daily (these are the high and low tides) and water levels are higher in some months than in others. These dotted line curves capture expected variation due to daily and monthly tidal cycles on an annualized basis. They do not capture storm surge, so that must be an additional consideration when f lood resiliency is critical for an area or a piece of infrastructure.
VIMS Sea Level Rise Report Card for Norfolk, Virginia
The Basic Steps of the VIMS Trend Analysis
1. Verified water level data is downloaded from NOAA’s website (www.tidesandcurrents.noaa.gov);
2. Water level records are averaged over each month to reduce the impact of weather-driven variations (e.g., storm surges) on the trend analysis.
3. Analysis is done by fitting a quadratic curve using a statistical technique called “least squares regression” which mathematically creates a line that best fits the observed data.
4 Rivers & Coast
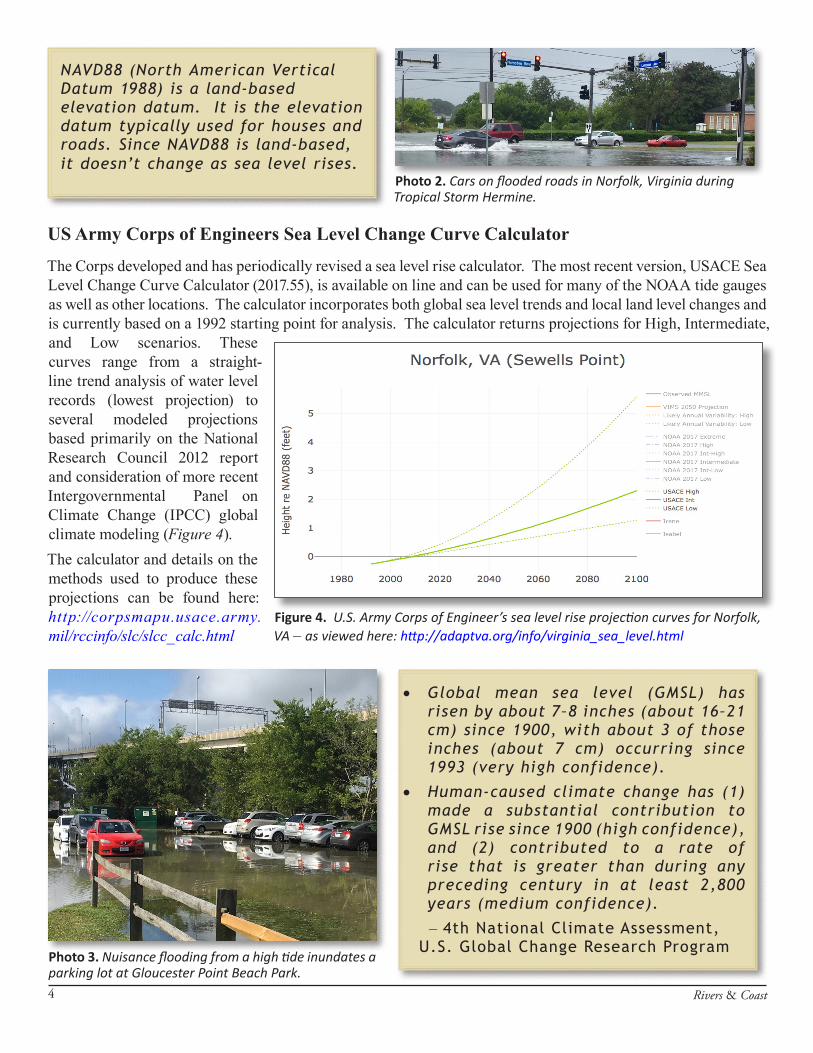
US Army Corps of Engineers Sea Level Change Curve Calculator
The Corps developed and has periodically revised a sea level rise calculator. The most recent version, USACE Sea Level Change Curve Calculator (2017.55), is available on line and can be used for many of the NOAA tide gauges as well as other locations. The calculator incorporates both global sea level trends and local land level changes and is currently based on a 1992 starting point for analysis. The calculator returns projections for High, Intermediate, and Low scenarios. These curves range from a straight-line trend analysis of water level records (lowest projection) to several modeled projections based primarily on the National Research Council 2012 report and consideration of more recent Intergovernmental Panel on Climate Change (IPCC) global climate modeling (Figure 4).The calculator and details on the methods used to produce these projections can be found here: http://corpsmapu.usace.army.mil/rccinfo/slc/slcc_calc.html
Photo 3. Nuisance flooding from a high tide inundates a parking lot at Gloucester Point Beach Park.
• Global mean sea level (GMSL) has risen by about 7–8 inches (about 16–21 cm) since 1900, with about 3 of those inches (about 7 cm) occurring since 1993 (very high confidence).
• Human-caused climate change has (1) made a substantial contribution to GMSL rise since 1900 (high confidence), and (2) contributed to a rate of rise that is greater than during any preceding century in at least 2,800 years (medium confidence).
– 4th National Climate Assessment, U.S. Global Change Research Program
Figure 4. U.S. Army Corps of Engineer’s sea level rise projection curves for Norfolk, VA – as viewed here: http://adaptva.org/info/virginia_sea_level.html
NAVD88 (North American Vertical Datum 1988) is a land-based elevation datum. It is the elevation datum typically used for houses and roads. Since NAVD88 is land-based, it doesn’t change as sea level rises.
Photo 2. Cars on flooded roads in Norfolk, Virginia during Tropical Storm Hermine.
5Summer 2018, Vol. 13
NOAA Global and Regional Sea Level Rise Scenarios for the United States
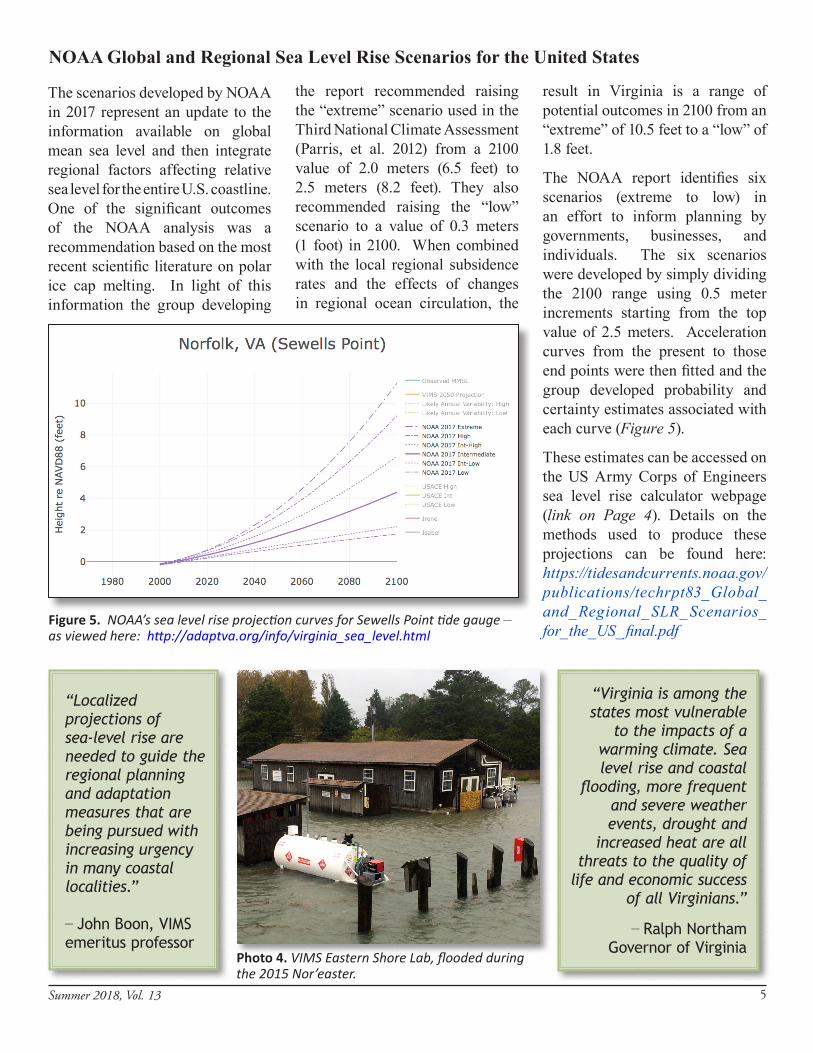
Figure 5. NOAA’s sea level rise projection curves for Sewells Point tide gauge – as viewed here: http://adaptva.org/info/virginia_sea_level.html
Photo 4. VIMS Eastern Shore Lab, flooded during the 2015 Nor’easter.
The scenarios developed by NOAA in 2017 represent an update to the information available on global mean sea level and then integrate regional factors affecting relative sea level for the entire U.S. coastline. One of the significant outcomes of the NOAA analysis was a recommendation based on the most recent scientific literature on polar ice cap melting. In light of this information the group developing
the report recommended raising the “extreme” scenario used in the Third National Climate Assessment (Parris, et al. 2012) from a 2100 value of 2.0 meters (6.5 feet) to 2.5 meters (8.2 feet). They also recommended raising the “low” scenario to a value of 0.3 meters (1 foot) in 2100. When combined with the local regional subsidence rates and the effects of changes in regional ocean circulation, the
result in Virginia is a range of potential outcomes in 2100 from an “extreme” of 10.5 feet to a “low” of 1.8 feet.
The NOAA report identifies six scenarios (extreme to low) in an effort to inform planning by governments, businesses, and individuals. The six scenarios were developed by simply dividing the 2100 range using 0.5 meter increments starting from the top value of 2.5 meters. Acceleration curves from the present to those end points were then fitted and the group developed probability and certainty estimates associated with each curve (Figure 5).
These estimates can be accessed on the US Army Corps of Engineers sea level rise calculator webpage (link on Page 4). Details on the methods used to produce these projections can be found here: https://tidesandcurrents.noaa.gov/publications/techrpt83_Global_and_ Regional_ SLR_ Scenarios_for_the_US_final.pdf
“Localized projections of sea-level rise are needed to guide the regional planning and adaptation measures that are being pursued with increasing urgency in many coastal localities.”
– John Boon, VIMS emeritus professor
“Virginia is among the states most vulnerable
to the impacts of a warming climate. Sea level rise and coastal
flooding, more frequent and severe weather events, drought and
increased heat are all threats to the quality of
life and economic success of all Virginians.”
– Ralph Northam Governor of Virginia
6 Rivers & Coast
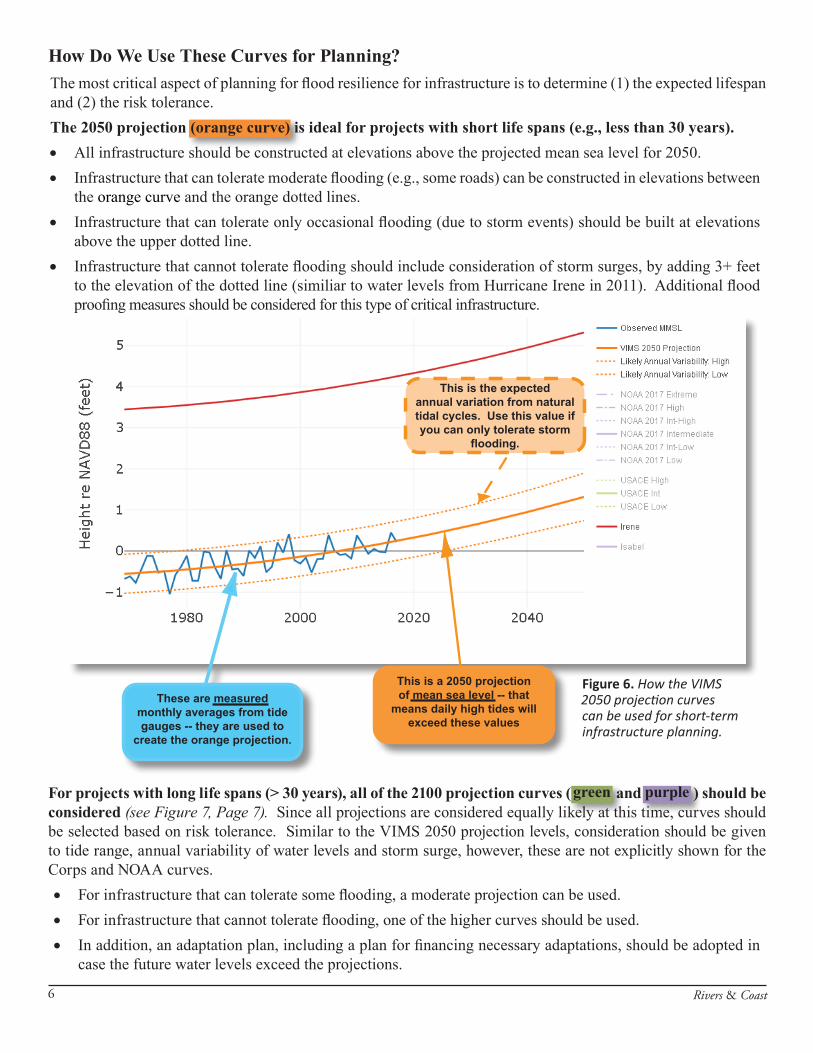
This is the expected annual variation from natural tidal cycles. Use this value if you can only tolerate storm
flooding.
This is a 2050 projection of mean sea level -- that
means daily high tides will exceed these values
These are measured monthly averages from tide gauges -- they are used to
create the orange projection.
Figure 6. How the VIMS 2050 projection curves can be used for short-term infrastructure planning.
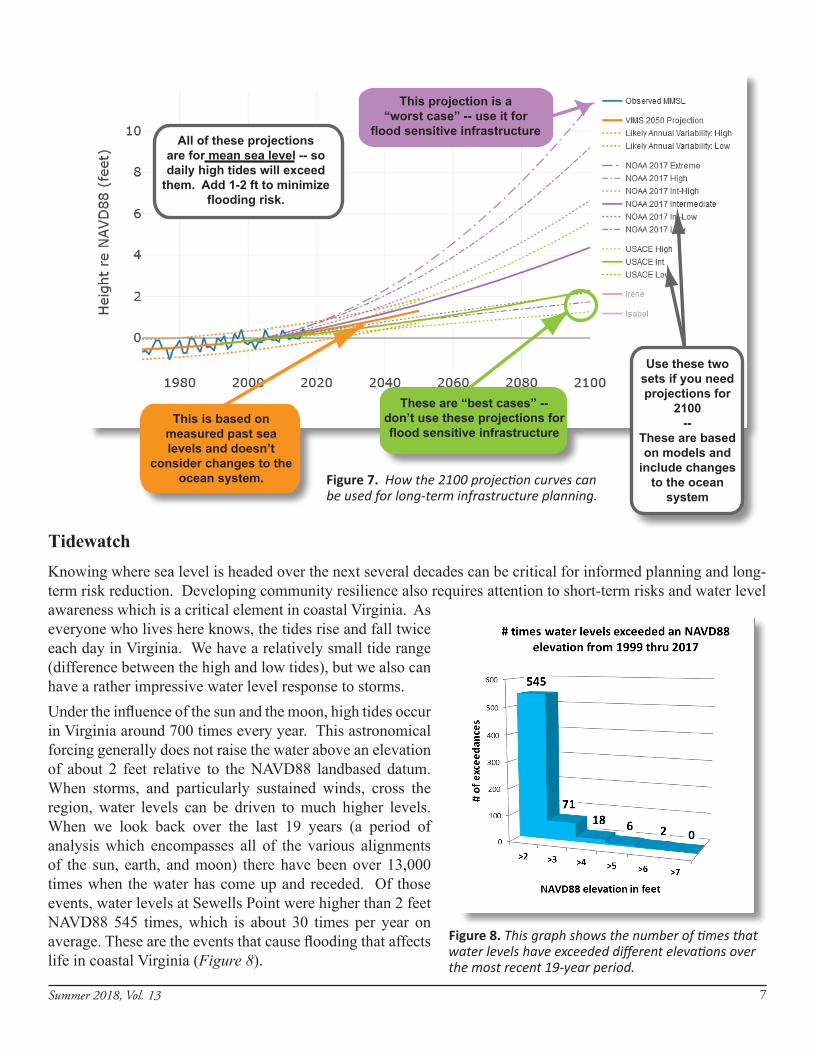
For projects with long life spans (> 30 years), all of the 2100 projection curves ( green and purple ) should be considered (see Figure 7, Page 7). Since all projections are considered equally likely at this time, curves should be selected based on risk tolerance. Similar to the VIMS 2050 projection levels, consideration should be given to tide range, annual variability of water levels and storm surge, however, these are not explicitly shown for the Corps and NOAA curves.
• For infrastructure that can tolerate some flooding, a moderate projection can be used. • For infrastructure that cannot tolerate flooding, one of the higher curves should be used. • In addition, an adaptation plan, including a plan for financing necessary adaptations, should be adopted in
case the future water levels exceed the projections.
How Do We Use These Curves for Planning?
The most critical aspect of planning for flood resilience for infrastructure is to determine (1) the expected lifespan and (2) the risk tolerance. The 2050 projection (orange curve) is ideal for projects with short life spans (e.g., less than 30 years). • All infrastructure should be constructed at elevations above the projected mean sea level for 2050. • Infrastructure that can tolerate moderate flooding (e.g., some roads) can be constructed in elevations between
the orange curve and the orange dotted lines. • Infrastructure that can tolerate only occasional flooding (due to storm events) should be built at elevations
above the upper dotted line. • Infrastructure that cannot tolerate flooding should include consideration of storm surges, by adding 3+ feet
to the elevation of the dotted line (similiar to water levels from Hurricane Irene in 2011). Additional flood proofing measures should be considered for this type of critical infrastructure.
green purple
7Summer 2018, Vol. 13
Figure 8. This graph shows the number of times that water levels have exceeded different elevations over the most recent 19-year period.
This projection is a “worst case” -- use it for
flood sensitive infrastructure
These are “best cases” -- don’t use these projections for flood sensitive infrastructure
This is based on measured past sea levels and doesn’t
consider changes to the ocean system.
All of these projections are for mean sea level -- so daily high tides will exceed
them. Add 1-2 ft to minimize flooding risk.
Use these two sets if you need projections for
2100--
These are based on models and
include changes to the ocean
system
TidewatchKnowing where sea level is headed over the next several decades can be critical for informed planning and long-term risk reduction. Developing community resilience also requires attention to short-term risks and water level awareness which is a critical element in coastal Virginia. As everyone who lives here knows, the tides rise and fall twice each day in Virginia. We have a relatively small tide range (difference between the high and low tides), but we also can have a rather impressive water level response to storms. Under the influence of the sun and the moon, high tides occur in Virginia around 700 times every year. This astronomical forcing generally does not raise the water above an elevation of about 2 feet relative to the NAVD88 landbased datum. When storms, and particularly sustained winds, cross the region, water levels can be driven to much higher levels. When we look back over the last 19 years (a period of analysis which encompasses all of the various alignments of the sun, earth, and moon) there have been over 13,000 times when the water has come up and receded. Of those events, water levels at Sewells Point were higher than 2 feet NAVD88 545 times, which is about 30 times per year on average. These are the events that cause flooding that affects life in coastal Virginia (Figure 8).
Figure 7. How the 2100 projection curves can be used for long-term infrastructure planning.
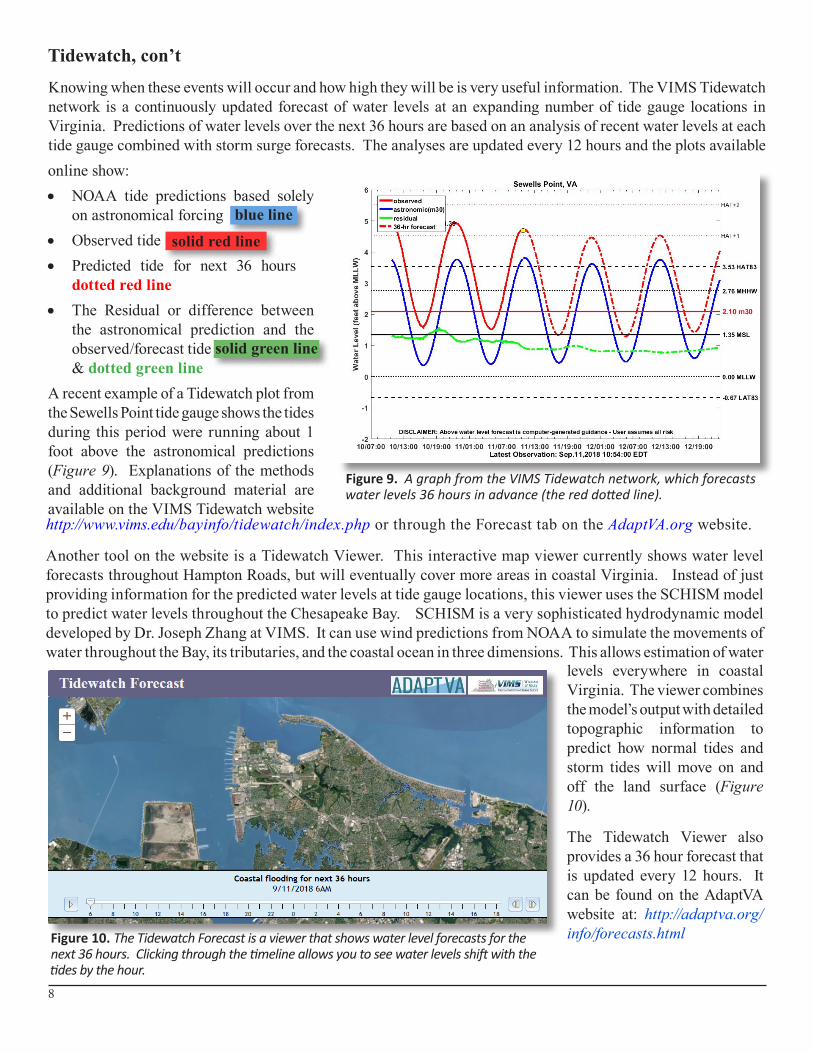
Knowing when these events will occur and how high they will be is very useful information. The VIMS Tidewatch network is a continuously updated forecast of water levels at an expanding number of tide gauge locations in Virginia. Predictions of water levels over the next 36 hours are based on an analysis of recent water levels at each tide gauge combined with storm surge forecasts. The analyses are updated every 12 hours and the plots available
8
Figure 9. A graph from the VIMS Tidewatch network, which forecasts water levels 36 hours in advance (the red dotted line).
http://www.vims.edu/bayinfo/tidewatch/index.php or through the Forecast tab on the AdaptVA.org website.
Another tool on the website is a Tidewatch Viewer. This interactive map viewer currently shows water level forecasts throughout Hampton Roads, but will eventually cover more areas in coastal Virginia. Instead of just providing information for the predicted water levels at tide gauge locations, this viewer uses the SCHISM model to predict water levels throughout the Chesapeake Bay. SCHISM is a very sophisticated hydrodynamic model developed by Dr. Joseph Zhang at VIMS. It can use wind predictions from NOAA to simulate the movements of water throughout the Bay, its tributaries, and the coastal ocean in three dimensions. This allows estimation of water
online show: • NOAA tide predictions based solely
on astronomical forcing • Observed tide • Predicted tide for next 36 hours
dotted red line • The Residual or difference between
the astronomical prediction and the observed/forecast tide (solid green l& & dotted green line
A recent example of a Tidewatch plot from the Sewells Point tide gauge shows the tides during this period were running about 1 foot above the astronomical predictions (Figure 9). Explanations of the methods and additional background material are available on the VIMS Tidewatch website
levels everywhere in coastal Virginia. The viewer combines the model’s output with detailed topographic information to predict how normal tides and storm tides will move on and off the land surface (Figure 10).
The Tidewatch Viewer also provides a 36 hour forecast that is updated every 12 hours. It can be found on the AdaptVA website at: http://adaptva.org/info/forecasts.htmlFigure 10. The Tidewatch Forecast is a viewer that shows water level forecasts for the
next 36 hours. Clicking through the timeline allows you to see water levels shift with the tides by the hour.
blue line
solid red line
solid green line
Tidewatch, con’t