Embed Size (px)
Citation preview

Forecasting Advertising Responsiveness for Short-Lifecycle Products*
Jackie Y. Luan Yale School of Management
135 Prospect St, PO Box 208200 New Haven, CT 06520
Email: [email protected] Phone: 203-432-5661 Fax: 203-432-3003
K. Sudhir
Yale School of Management 135 Prospect St, PO Box 208200
New Haven, CT 06520 Email: [email protected]
Phone: 203-432-3289 Fax: 203-432-3003
December, 2005
* We thank participants at the 2005 Marketing Science Conference at Atlanta and the 2005 AMA-Sheth Doctoral Consortium at the University of Connecticut for their comments.

1
Forecasting Advertising Responsiveness for Short-Lifecycle Products
Abstract
Entertainment products such as movies and DVDs have short life-cycles; their demand is
usually greatest at the time of launch and declines very quickly in subsequent weeks. Hence
marketers have to decide on advertising levels for such products even before the product is
launched. This paper introduces the problem of “forecasting” advertising responsiveness prior to
product launch as a critical ingredient in new product sales forecasting models. The paper also
solves the “slope endogeneity” problem that arises from private information possessed by
managers about the heterogeneous effects of advertising on demand. This endogeneity is
different from the “intercept endogeneity” problem that has been widely recognized in the
literature, which is due to private information about the demand level (regardless of endogenous
variables). We develop a conceptually simple and easy-to-implement control-function approach
to correct for the slope endogeneity bias and apply this procedure to the DVD market. We find
that average advertising elasticity for DVDs would be underestimated by 20% if the slope
endogeneity problem were ignored. As the first empirical study of the determinants of DVD
advertising responsiveness and sales, our analysis yields findings of substantial interest to both
researchers and executives involved in entertainment marketing.

1
1. Introduction
Entertainment products such as movies and DVDs have remarkably short life-cycles:
demand usually peaks upon product launch and the majority of sales occur within a few weeks
following the introduction. As an illustration, Figure 1 and Figure 2 show the sales patterns for
“The In-Laws” in the theatrical market and in the DVD market, respectively. This exponential
sales pattern is typical of over 90% of theatrical movies. Among all movie DVDs released during
2001-2004, sales during the first week (first four weeks) accounts for 32% (65%) of the sales
over the first 26 weeks.1
Given this typical exponentially decaying sales pattern, advertising for short life-cycle
products is also concentrated around the product introduction. Therefore, marketers need to make
their advertising (and other marketing-mix) decisions before the product is launched, and there is
little, if any, room for adjustment afterwards. Figure 3 depicts the average advertising levels, as
measured by TV Gross Rating Points (GRP), across new-release movie DVDs during 2001-2004:
76% of advertising happens on the week of product launch or earlier.
Choosing the right advertising level for such a product is particularly challenging. For
products with longer life-cycles such as most consumer packaged goods and services, marketers
can experiment with different levels of advertising and measure changes in demand to infer
advertising responsiveness. This is infeasible in the context of short life-cycle products such as
movies and DVDs, for which an accurate assessment of advertising responsiveness is needed
before product introduction. Therefore, it is not enough to infer advertising responsiveness from
the sales history of a particular product; rather, we need to forecast advertising responsiveness
for a unique product before it is introduced. This study develops an approach to forecast
advertising responsiveness for such short life-cycle products. It is important to note that while
there is a substantial body of literature on new product sales forecasting, there is no literature to
date on the forecasting of responsiveness to a marketing-mix variable.
We illustrate the approach using data from the U.S. DVD market. So far the DVD market
has received little attention in academic research compared to the attention given to the theatrical
movie market (e.g., Sawhney and Eliashberg 1996; Eliashberg et al. 2005). But DVDs currently
bring far greater revenues to studios than theatrical films do and have been growing much faster
1 The short life cycle of theatrical movies has been well known in the industry; but the short life cycle of DVDs has become evident only recently. Industry observers now note that DVDs are “disappearing from retail outlets almost as quickly as movies burn off at the box office” (Mohr 2005).

2
than box-office revenues. In 2004, DVDs accounted for $15 billion in sales, whereas the box-
office revenue totaled only $ 9 billion. Further, the 2004 sales of DVDs represented a 33%
growth over the 2003 sales, while box-office sales were essentially stable. Thus the DVD market
has become the most important revenue stream for major studios, and a movie’s theatrical run is
virtually “a marketing campaign” for downstream products — particularly the DVD — to come
(Eisinger 2005). Another colorful description of its role as the studios’ cash cow is that DVD
serves as the “corporate ATM machine” for the studios (de Lisle 2005).
The basic idea in generating the forecast is to identify how similar products responded to
advertising historically and use these estimates to make a prediction for a new product. In
general, forecasting can be a particularly difficult task in the context of entertainment products
(such as movies and music) because such products are “unique” by nature. Even if many
quantifiable variables such as genre, star presence, and production costs could be used for
forecasting, there is still substantial variation that is unexplained due to each movie’s
idiosyncrasies. Fortunately, in the context of DVDs, this problem can be partially overcome
since there is considerable information about the DVD in the trajectory of box-office
performance for that movie, and this enables us to better account for the movie’s unique
characteristics when making forecasts about the corresponding DVD sales and advertising
responsiveness.
We will discuss in detail the issue of identifying attributes that will enable us to obtain
advertising responsiveness forecasts in Section 3. Even assuming that we can find a reasonable
set of attributes, a particular methodological difficulty in forecasting advertising responsiveness
is the endogeneity of observed advertising levels. That is, despite controlling for a set of
observable attributes that affect advertising responsiveness, there are still (econometrically)
unobserved attributes that are (partially) observable by the firm, which will affect the choice of
advertising levels for a particular product.
In recent years, there has been considerable interest in accounting for price endogeneity with
both aggregate and individual-level data (e.g., Berry et al. 1995; Villas-Boas and Winer 1999;
Nevo 2001). These papers have convincingly demonstrated that failure to account for price
endogeneity will lead to biased estimates of price elasticity in a demand model. However all
existing advertising response models treat advertising levels as exogenous (e.g., Bass and Clarke
1972; Tellis et al. 2000; Dube et al. 2004; Vakratsas et al. 2004).

3
Endogeneity problems arise in estimating a sales response model when observed levels of
marketing-mix variables are correlated with the unobserved component(s) in the demand model.
Consider a simple linear sales response function: Pα β− where P represents price. Extant
research that corrects for price endogeneity has thus far assumed that unobserved (to researchers)
factors only affect the demand level (i.e., the intercept, α ), but not marketing-mix
responsiveness (i.e., the price coefficient, β ). This assumption is unlikely to be valid in many
marketing settings. An automaker may price a car brand higher (lower) than expected because of
a larger (smaller) intercept related to the brand’s prestige (that is not captured by observed
product attributes in the data) leading to intercept endogeneity. However, it is just as likely that
the automaker has private information that the car has a lower (higher) price coefficient (β ),
which may cause the higher (lower) prices leading to slope endogeneity. Marketing researchers
have typically paid attention only to the intercept endogeneity problem but have neglected the
slope endogeneity problem.
In this paper, we account for the possibility that firms can possess more information than
the researcher not only about the intercept, but also about the marginal effect (i.e. the slope
coefficient) of advertising; and that the private information will affect the level of advertising.
We develop a control-function approach that is based on previous studies in labor economics and
econometrics (e.g., Garen 1984; Wooldridge 1997) to address the slope endogeneity problem and
make it amenable to a context involving multiple endogenous variables. In our application, we
not only seek to estimate advertising responsiveness but also the responsiveness to the theater-to-
DVD release lag.
The “slope endogeneity” problem discussed here is similar to the “non-random marketing-
mix” variables problem discussed in Manchanda, Rossi and Chintagunta (2004). They estimate
the individual physician’s responsiveness to detailing, where the observed level of detailing is
chosen based on the physician’s detailing responsiveness. Similar to Manchanda et al., we also
do not make assumptions that managers set their advertising optimally, but allow for the
possibility that use the private information they have. Unlike their paper which estimates the
detailing responsiveness of different physicians for one product, our focus is on forecasting the
average advertising responsiveness in the market for different products (DVDs). Further, our
approach illustrates how to deal with multiple endogenous variables: advertising and theater-to-
DVD lag, both of which are jointly chosen by managers with private information that the
4
researcher does not have. Finally, Manchanda et al. use a Bayesian estimation approach to solve
the problem. In contrast, our analysis uses a two-step control function approach involving OLS
regression to solve the slope endogeneity bias problem. Since it is intuitive and simple to
implement, we hope that this approach will be widely used in future work.
In summary, this paper makes the following contributions:
(1) It contributes to the entertainment marketing literature by extending the extant focus on the
theatrical film market to the increasingly more profitable market for DVDs. In the process,
we obtain several substantive insights about the determinants of DVD sales and of
advertising responsiveness.
(2) We introduce the problem of advertising responsiveness forecasting. While there has been
great emphasis on new product sales forecasting, these models typically do not take into
account the role of endogenous marketing-mix actions. Our research fills this void by
empirically forecasting responsiveness to advertising, a critical element of the marketing
mix.
(3) We address the issue of “slope endogeneity” and develop a flexible yet easy-to-implement
estimation approach when there are multiple endogenous variables, for which managers
may possess private knowledge about the marginal returns that the researcher does not have.
In the DVD context, two such endogenous variables are advertising and release timing. We
develop a two-step control-function procedure to address this problem.
The rest of the paper is organized as follows. In section 2, we discuss the empirical setting,
data, and generate hypotheses about the predictors of advertising responsiveness. In section 3, we
introduce the problem of slope endogeneity and discuss a bias-correction approach to solve this
problem with both cross-section and panel data. Section 4 discusses the empirical application
and the results. Section 5 concludes and discusses future research directions.
2. Empirical Data and Hypotheses
2.1. Advertising in the DVD category
The DVD (digital versatile or video disc) technology, commercially introduced in 1997, has
created a very profitable hardware and software market in just a few years. DVD players are the
fastest-growing consumer electronic product in history (The Digital Entertainment Group 2005),
5
outpacing even CD players and PCs).2 As DVD players were adopted by 75 million U.S.
households (68% penetration rate) by June 20053, pre-recorded DVD software mushroomed
from 5,000 to over 40,000 titles. Over 3.9 billion pre-recorded DVDs were shipped to retailers
between 1997 and 2004.
The Digital Entertainment Group (DEG) reports that on average, a household that owns a
DVD player buys 16 discs per year; the purchase rate is as high as 24 discs per year for
households owning multiple players. Industry observers report that consumers show “an
insatiable interest in owning DVDs,” especially DVDs of feature movies (Kurt 2004). In 2004,
U.S. box-office gross remained stagnant at about $9 billion, while DVD sales accounted for
$15.5 billion4, a 33% growth from 2003, which far exceeds the theatrical revenue. The enormous
growth of the DVD market has far exceeded the expectations of the movie industry and is
fundamentally reshaping the landscape of the industry.
In a recent paper, Lehmann and Weinberg (2000) model the interaction between the
theatrical and home video (VHS cassette) markets using data from 1996-1997. They do not
consider advertising in the home video market because there was almost no advertising for home
videos in that period. However, advertising has grown dramatically with the advent of DVDs.
Advertising expenditures on new DVD releases have risen at a steep rate of 50-60% annually.
Studios spent $641 million on home video advertising in 2002, up 63% from the previous year,
according to TNS Media Intelligence. Experts in the media and entertainment industry credit the
high DVD advertising expenditures as among the major reasons why TV networks pulled in a
record-setting $9.2 billion in the 2003 upfront commercial buying period (Netherby and Magiera
2003). While marketing expenditure for DVD releases still lags far behind that of advertising for
theatrical releases ($3.3 billion in 2003), the motion picture industry is swiftly adapting itself to
the new revenue structure where DVDs are the major source of revenues by increasing
advertising for many new DVDs (Schiller 2004). For instance, Columbia/TriStar spent a record-
setting $100 million in a marketing campaign to promote the Spider-Man 2 DVD. The release of 2 It took only five years for 30 million DVD players to be sold, compared to about eight years for CD players, and 10 years for PCs to reach the same volume mark. 3 DEG reports that about 47 percent of DVD owners have more than one player, due to the growing popularity of home theater systems, portable DVD players, and DVD recorders. 4 DVD rentals totaled $5.7 billion, up from $4.5 billion in 2003. Couple that with DVD sales of $15.5 billion, the DVD market over twice as large as the theatrical exhibition market. With DVD penetration spiraling, VHS market has been dwindling: VHS sales dropped 42 percent to 240.4 million from 2002, while VHS rentals fell 23 percent to 53.2 million (MPAA 2004). Therefore, the empirical study does not consider the VHS market.

6
Elf on DVD was backed up by a large-scale promotion that far exceeded the theatrical marketing
program. While studio advertising spending grows about 15% annually, DVD advertising
spending grows at a speed of 35% (Netherby and Magiera 2003).
2.2. Data
Our sample includes newly released movie DVDs that were introduced between January
2000 and October 2003.5 The movies in the sample opened in theaters between 1999 and 2003.
We exclude DVD titles with box-office revenues lower than $5 million. 6 For each of the
remaining 526 DVD titles in our sample, we collect data on box-office variables (e.g., box-office
opening date, number of exhibitors’ screens, box office revenues, advertising expenditure for the
theatrical release, competitive set, and seasonality), DVD variables (e.g., DVD release date,
retail price, sales, TV advertising GRPs,7 DVD content enhancements, and distributor label) as
well as movie attributes (such as its production budget, genre, awards and nominations, star
power, MPAA rating, and critical reviews). Table 1 reports the key descriptive statistics of the
sample, while Table 2 summarizes the relevant categorical variables. We also collect monthly
data on DVD player penetration rate in the U.S. to control for the effect of a growing hardware
installation base on the software sales. Figure 4 plots the growth in adoption of DVD players in
the U.S. between 2000 and 2003.
2.3. Predictors of advertising response
The basic idea in forecasting advertising responsiveness is to identify how similar products
introduced previously have responded to varying levels of advertising and use this to make a
prediction. In general, forecasting can be a particularly difficult task in the context of
entertainment products such as movies and music because such products are “unique” by nature.
But as discussed earlier, there is a substantial amount of information in the box-office
5 We do not consider catalog DVDs for three reasons. First, new release DVDs account for a large majority of revenues while catalog DVDs represent a small proportion of total pre-recorded DVD sales. Second, sales for catalog DVDs may be influenced by factors beyond what is considered in this study, such as a director or an actor’s other career achievements. Finally, advertising for catalog DVDs are minimal or non-existent. Note that these movies in the sample were released theatrically between June 1999 and June 2003. 6 We deem $5 million in theatrical revenue as a reasonably low threshold to be included in the sample: those movies under this threshold are typically small-budget movies targeted at a niche market and are marketed differently than the majority of Hollywood feature movies (e.g., independent distributors typically cannot afford any TV advertising at all). In addition, movies that performed poorly in theaters may not be released on DVD, which would give rise to an additional selection bias. 7 TV is the major channel for DVD advertising, representing 60-70% of the industry spending because of TV’s ability to show the DVD trailers.
7
performance that can be used to account for the movie’s idiosyncratic characteristics in making
DVD sales and advertising response forecasts.
Table 3 summarizes a number of variables that we believe may affect how the market
responds to DVD advertising. First, consistent with product life cycle theory, we hypothesize
that advertising elasticity will decline from week to week.
Second, we expect word-of-mouth (WOM) to have a positive effect on advertising
responsiveness, since consumers tend to give greater attention and attach more credibility to ads
for a product that they have received positive word-of-mouth from friends and acquaintances.
Marketing researchers have been paying increased attention to explicitly measuring
consumer word-of-mouth communication and empirically inferring its role in influencing sales
(Chevalier and Mayzlin 2003; Dellarocas et al. 2004; Godes and Mayzlin 2004b; Godes and
Mayzlin 2004a). But these studies of WOM do not examine how word-of-mouth and advertising
interact to influence the consumers’ purchase decisions. Similarly, the current advertising
literature ignores the role of consumer word-of-mouth. Given that consumers receive advertising
and word-of-mouth about a product concurrently, investigating their interaction effects is
managerially relevant. For example, should the firm spend more or less advertising a product if it
knows that the product has received positive (or negative) WOM from consumers? It has been
suggested in a few studies that advertising and word-of-mouth may be substitutable, i.e., firms
should reduce advertising in the presence of good word-of-mouth (e.g., Monahan 1984;
Zufryden 1996; Mayzlin 2001), but such a conjecture does not consider the fact that WOM
communication may affect how consumers respond to advertisements. Since consumers tend to
give more attention and credibility to the ads for a product that they have received good WOM
from friends and acquaintances, WOM can increase the effectiveness of advertising.
Theatrical advertising, on the other hand, may serve as a substitute for DVD advertising, thus
reducing advertising elasticity. We also hypothesize that lower retailer price increases
advertising elasticity, an interaction effect that has been documented for consumer package
goods (Kaul and Wittink 1995).
The DVD is typically released four to seven months after the movie opens at the box office,
and there is usually a hibernation period after the movie exits most theaters and before the DVD
is released. We conjecture that a shorter DVD release delay may mean that the movie might still
be fresh in the consumer’s memory and therefore the marginal effectiveness of DVD advertising

8
might be less than when there is a longer delay. However it might also be reasonable to argue
that DVD advertising may be more effective in rousing interest if the movie is still fairly fresh in
the consumer’s mind.
We hypothesize that box-office sales has a negative effect on advertising elasticity. Since
movies are experience goods, consumers who have viewed the movie in theater would rely more
on their own experience than on new DVD advertising to make their DVD purchase decisions.
Therefore, a higher proportion of experienced consumers in the market would mean a lower
advertising response. Also, we expect the market to be more responsive to DVD advertising
during the holidays (in particular the Christmas-New Year period), when the demand tends to be
more elastic due to gift-buying.
3. The Random-Coefficients Sales Response Model
3.1. The Slope Endogeneity Problem
We first introduce the problem of slope endogeneity in the context of cross-sectional data and
discuss a two-step estimation approach that corrects for the endogeneity bias. The framework
allows for multiple endogenous variables. We then extend the approach to panel data.8
Let Sj be the dependent variable that we seek to explain and x j be the vector of exogenous
explanatory variables. Aj and Lj are the two endogenous variables that affect Sj with potential
endogeneity problems. (We use notation consistent with our empirical application to be detailed
in the next subsection, where Sj would be the logarithm of DVD sales of title j, x j would
consist of exogenous variables affecting DVD sales such as product attributes, Aj would be the
level of advertising goodwill, and Lj would be the delay in DVD release.)
Suppose the sales equation that we seek to estimate take the form:
x A Lj j j j j j jS A Lβ γ γ ε′= + + + (1)
The coefficients Ajγ and L
jγ are specified as random coefficients that are composed of a
systematic observed component (i.e., a function of observed covariates) and an unobserved
component:
, ( ) 0A A A A Aj j j jw Eγ θ φ φ′= + = (2)
8 We take such a two-step description approach for two reasons. First, from an expositional point of view, the intuition behind the approach is more easily seen in a cross-sectional setting. Second, since many applications may use only cross-sectional data, the exposition here can facilitate future research on this issue.

9
' , ( ) 0L L L L Lj j j jw Eγ θ φ φ= + = (3)
where Ajw and L
jw are a vector of observed moderators (including a constant) that impact the
marginal effects of A and L on S. Ajφ and L
jφ are zero-mean econometrically unobserved
components that impact the marginal effects of A and L.
Substituting equations (2) and (3) into (1), equation (1) becomes
'( ) ( )A A L L A Lj j j j j j j j j j jS X w A w L A Lβ θ θ φ φ ε′ ′= + + + + + (4)
In the standard random-coefficients model, Ajφ and L
jφ are assumed to be random draws
from a population with density ( )F φ , which is independent of the observed variables including
jA and jL ; consequently,
(( , ) | , ) 0A Lj j j jE A Lφ φ = (5)
Further, assume that jε is conditionally independent of jA and jL , i.e.,
( | , , ) 0j j j jE A L xε = (6)
Write the econometric error as A Lj j j j j ju A Lφ φ ε≡ + + . Under the assumptions in (5) and (6),
( | , , ) ( | , , ) 0j j j j j j j jE u A L x E A L xε= = (7)
and the sales equation parameters can be estimated consistently with OLS. Problems occur if
these assumptions are violated, a likely scenario if the decision-maker has private information
about the unobserved components, ( , , )A Lj j jφ φ ε , which are not observed by the econometrician,
and uses such information in choosing the levels of endogenous variables, ( , )j jA L . For instance,
an individual tends to know more about the marginal returns of education to his or her earning
potential than the researcher does and therefore may spend more or less on education; marketing
managers may have some knowledge about how the market will respond to the ads for a
particular product, through prior experience or market research, and this will affect the actual
advertising budget. In such cases, the decision-maker’s choice of endogenous variables would be
correlated with the (econometrically) unobserved components.
Note that this problem is different from the standard price endogeneity problem that has been
extensively studied in the economics and marketing literature (e.g., Berry et al. 1995; Villas-
Boas and Winer 1999; Chintagunta 2001). In these studies, the endogenous variable, (usually

10
price but could be any marketing-mix variable), is allowed to be correlated with jε in equation
(4), which captures the unobserved component that influence jS regardless of the endogenous
variable(s), and the instrumental variable (IV) estimator can be used to correct the potential bias.
As discussed earlier, we refer to this type of problem as intercept endogeneity. It does not
consider the potential endogeneity arising from the correlation between the slope coefficients and
endogenous variables, resulting from what Bjorklund and Moffitt (1987) call “heterogeneity of
rewards.” To address the latter case, which we refer to as slope endogeneity, the unobserved
marginal effects ( Ajφ and L
jφ ) should be allowed to influence the endogenous decision variables
( jA and jL ). For instance, if the firm knows that advertising for a given DVD would be highly
effective (i.e. larger Ajφ ), then it will probably spend more on advertising this particular title (i.e.
higher jA ). In this case, not only is the OLS estimator inconsistent, but the standard IV estimator
also is.
3.2. A Control-Function Approach to Endogeneity Correction
The slope endogeneity problem has received some attention in the labor economics literature,
where researchers are interested in estimating the returns to a particular choice, such as education,
employment, or union membership.9 The well-known Heckman-Lee approach can be applied to
solve this self-selection problem when the endogenous variable is binary (Heckman 1976; Lee
1978), such as employment (i.e. entering the labor force or not) and union membership (i.e. join
a union or not).10 However, this procedure cannot be applied to situations where the endogenous
variables are continuous (e.g., level of education chosen by an individual, or the number of
advertising exposures chosen by marketers). Garen (1984) proposes a control-function procedure
to correct for endogeneity bias in continuous variables for cross-sectional data and use it to
estimate the returns to schooling. Other applications include the estimation of wage premium for
risky jobs (Garen 1988) and the impact of union membership on this premium (Sandy and Elliott
1996), among others.
9 It is variably termed as selectivity bias, self-selection bias, or endogenous treatment effects. 10 This correction procedure consists of (1) estimating a probit selection equation by maximum likelihood and (2) using the resulting estimates to form additional explanatory variables in the focal equation to be estimated by least squares. Here we use the term slope endogeneity to reflect the fact that the econometric bias is caused by the individual decision-maker’s interest-maximizing choice, not by non-random missing data, problems involving sample selection (e.g., Verbeek and Nijman 1992; Wooldridge 1995).

11
Below we briefly describe this approach for cross-sectional data. In the next subsection, we
shall explain the method in our empirical context and extend it to accommodate our panel-data
structure.
Suppose there exists a set of exogenous (or predetermined) variables, jz , that influence the
firm’s choice of the endogenous variables and
A Aj j jA z λ η′= + (8)
L Lj j jL z λ η′= + (9)
Write ( , , )A Lj j j jφ φ φ ε ′≡ and ( , )A L
j j jη η η ′≡ . Suppose the following assumptions are valid:
(A1) ( | ) 0j jE zη =
(A2) ( | ) 0j jE zφ =
(A3) ( | , ) ( | )j j j j j jE z Eφ η φ η η= = Γ .
(A1) is satisfied if jz consists of predetermined variables only. (A2) is the key exogeneity
assumption, stating that jφ has mean zero conditional on jz . This implies that jz should be
uncorrelated with the unobserved components, ( , , )A Lj j jφ φ ε . (A3) assumes that jφ is conditional
mean independent of jz given jη , and imposes a linear relationship between ( | )j jE φ η and jη .
Γ is a 3 by 2 matrix of coefficients that characterize the linear mapping from jη to ( | )j jE φ η .
Though a relatively strong assumption, it is not overly restrictive; it only requires that the
conditional expectations of the unobserved heterogeneity are linear in jη . The joint normality
assumption over jη and jφ as imposed in Garen (1984) is a stronger assumption than A3.
This specification allows the random coefficient for jA to be correlated with observed jL and
vice versa, a flexible formulation made desirable by the fact that firms usually design multiple
marketing-mix variables simultaneously rather than separately. Under these assumptions,
( | , , x , ) ( | , , , x , ) ( , ,1)A Lj j j j j j j j j j j j j j j j j jE u A L E A L A L z A Lη φ φ ε η η= + + = Γ (10)
This term is not zero generally, thus the OLS estimator would be inconsistent. However, if we
first obtain consistent estimates for jη from a first-stage estimation of equations (8) and (9) and

12
use the resulting estimates, ˆ jη ’s, in place of jη ’s in the sales equation, then consistent estimates
can be obtained. In the case of two endogenous variables, equation (4) can be re-written as
'
1,1 1,1 1,2
2,1 2,2 3,1 3,2
ˆ ˆ ˆ( ) ( )
ˆ ˆ ˆ ˆ
A A L L A A Lj j j j j j j j j j j j
A L A Lj j j j j j j
S X w A w L g A g A g A
g L g L g g
β θ θ η η η
η η η η ε
′ ′= + + + + +
+ + + + + % (11)
Note that a standard IV approach will not eliminate the endogeneity bias unless
( | ) 0A Lj j j j jE A L zφ φ+ = , which is generally not satisfied.11 Therefore, the standard IV approach is
not adequate to correct for the slope endogeneity (e.g., Verbeek and Nijman 1992; Heckman
1997).12
3.3. The Empirical Specification
In this subsection, we extend the aforementioned method to panel data. The model
development is tailored to our empirical application.
Suppose we have a panel for J DVD titles each with T weeks of sales and advertising data.
The sales equation in (4) can be written as
x ( ) ( )A A L L A Ljt jt jt jt j j jt jt j j jtS w A w L A Lβ θ θ φ φ ε′ ′ ′= + + + + + (12)
where A A Ajt j jtφ φ φ= + ∆ (13)
jt j jtε ε ε= + ∆ (14)
Here jS is the logarithm of DVD unit sales of title j in week t, and x j is the vector of exogenous
explanatory variables affecting weekly sales (such as prices and product attributes). jtA is the
level of advertising goodwill for title j in week t, and jL is the delay in DVD release. Note that
advertising goodwill is time-variant while release delay is not. In equations (13) and (14), Ajtφ∆
and jtε∆ capture the weekly deviations from the title-specific mean levels of Ajtφ and jε .
3.3.1. Endogenous Variables: jtA and jL
11 Wooldridge (1997; 2003) shows that the IV estimator for the slope coefficient can be consistent under further assumptions such as conditional heteroscedasticity (e.g., 2 2( | )j jE z φφ σ= ) or constant conditional covariance (e.g.,
( | )A Aj j jE A zφ α= ). However, such assumptions may be overly restrictive, especially in a panel data context.
12 Heckman (1997) points out that when “individuals possess and act on private information about gains from [a particular choice] that cannot be fully predicted by variables in the outcome equation, instrumental variables methods do not estimate economically interesting evaluation parameters.”

13
Here we focus on two endogenous variables in the DVD sales model: (1) advertising, jtA ,
and (2) DVD release delay, jL . 13 The advertising goodwill stock, jtA , is specified as a
discounted sum of weekly advertising levels:
1
1ln( )t
j jtt
A ADτ
τ δ −
=
= ∑ (15)
where jtAD is the TV advertising GRPs (Gross Rating Points) for DVD title j in week t.14
While the effect of advertising on sales is well-known, the effect of product release timing is
not generally captured in a sales response model. However, incorporating release timing in the
sales function is necessitated by the institutional structure of the motion picture market. A DVD
is typically released four to eight months after the movie opens in theaters; there is usually a
“hibernation” gap, a period of time after the movie is pulled out of most theater chains and
before the DVD is released. Such inter-release delay (part of the windowing strategy adopted in
the movie industry) has evolved as a convention among studios to protect the revenues from the
theatrical window.15 The length of delay ( jL ), may impact the DVD demand, since, as is widely
acknowledged in the industry, the faster the DVD release, the higher the consumers’ awareness
and interest in the DVD. The coefficient of jL is intended to capture the degree to which a
movie’s “buzz” generated by the theatrical opening dissipates when the DVD is released later.
A possible specification for jL would be the theater-to-DVD window, i.e. the number of
days between the theatrical opening and DVD release of a movie. While this would be a good
measure for the nearly 90% of movies with the exponential decay sales pattern16, it is a problem
for the small number of sleeper movies that gradually build up consumer awareness and
therefore may peak later and not decline in sales rapidly (i.e., they have long legs). Therefore, we
formulate an empirical measure for jL that adjusts for the pattern of theatrical runs: the log
13 Price is usually an endogenous variable as well; however, in the DVD market, the studios usually charge a uniform wholesale price to retailers; retailers decide upon the market prices for various DVD titles and often use them as loss leaders to boost store traffic (Kipnis 2005). Since we are focused on the studios’ (especially advertising) decisions in this paper, it seems reasonable to ignore the endogeneity of price. Our modeling framework, however, should be able to handle the price endogeneity problem well if needed. 14 Due to the presence of zero advertising, we add one to all advertising GRPs to ensure this variable is well-defined. 15 The problem of DVD release timing is the focus of Luan (2005), which develops a consumer dynamic choice model to examine the effect of a industry-wide faster DVD release. 16 For 85 % of the movies in our sample, the first four weeks account for more than 75% of overall theatrical revenue.

14
number of days between the time when the theatrical movie gains 75% of its total box office
revenue and the time when the DVD is released. Since the data only contains weekly (i.e.
discrete-time) box-office receipts over the first three months (i.e. right-truncated), we estimate
the 75 percentile thresholds empirically using a two-parameter Weibull density function:
1( | , ) , 0, 0, 0p jq j
jpj tj j j j j
j
pf t p q t e t p q
q− −= ≥ > > (16)
The Weibull parameters p and q are estimated for each movie, and the 75 percentile is computed
using the resulting cumulative distribution function.
3.3.2. First-stage regression
Supposed the distributor’s advertising and timing decisions for DVD j are influenced by a
set of pre-determined variables, jtz :
ln( ) ,A A A A Ajt jt jt jt j jtAD z λ η η η η′= + = + ∆ (17)
ln( ) L Lj j jDELAY z λ η′= + (18)
where jtz includes all the exogenous variables in x jt as well as a set of excluded variables that
are supposed to affect the supply-side (i.e. distributor’s advertising and timing) decisions but not
how consumers respond to advertising and release timing. Note that the advertising decision is
made for each week, t, while the release timing decision is made once for each DVD;
accordingly, jz includes the across-week mean for each element in jtz . Ajη is the disturbance
common to all the observed advertising levels for title j, and Ajtη∆ is the mean-zero week-specific
deviation from the mean. Ljη is the disturbance associated with the release delay for DVD j.
The pre-determined variables, jtz should, in addition to x jt and jtw , include a set of
excluded variables that are supposed to affect the distributor’s advertising and timing decisions
but not how consumers respond these decisions. A natural source of exclusion variables would
be the supply-side factors such as advertising costs and interest rates. For instance, if studio f has
lower advertising costs for DVD j, then its observed advertising level would be higher than
another release of similar characteristics; such supply-side shocks, nevertheless, should not affect
how consumers respond to the ads. We include the following exclusion variables in jtz : (1)
studio dummies; (2) movie production costs; (3) the ratio of production costs and box-office

15
revenue; (4) the half-life of theatrical runs, computed from the fitted Weibull model; (5)
interaction terms of studio dummies with x jt , jtw and production cost. The rationale behind
these exclusion variables is as follows.
The DVD market is an oligopolistic market, dominated by a number of major labels, in
particular Warner Home Videos (Warner Brothers), Buena Vista (Walt Disney), Universal, Fox,
Columbia/TriStar (Sony), Paramount. Table 4 shows various players’ market shares in the DVD
market; the market shares in our sample of DVDs closely resemble those of the entire market.
Different studios are likely to have different cost structure related to DVD advertising production
and placement, since it is noted in the trade literature that DVD advertising is usually created by
the studios’ in-house marketing divisions rather than advertising agencies (Cardona and Fine
2003) and that major studios, mostly part of media conglomerates, leverage their sister TV
networks to get deals on spot commercials (so-called “house ads”) (Adweek 2004). Therefore,
studio fixed effects are likely to explain part of the variation in observed advertising levels but
should not affect how consumers respond, given that consumers are usually unaware of the
identity of the DVD distributor17. Studios may also vary in their financial leverage on the capital
market; therefore, if studio f has higher interest rates on its borrowed investment on producing a
movie, then it is likely to release it faster on DVD to recoup the cost and avoid higher debts. The
ratio of a movie’s production cost to its box-office revenue serves as a measure of the studio’s
financial pressure to recoup the investment from the DVD market. The half-life of the theatrical
run may also affect the studios’ timing decision. Although the majority of box-office receipts
would go to the exhibitors later into the theatrical run, studios typically refrain from releasing the
movie DVD too soon for fear of aggravating the relationship with exhibitors. Since the
advertising and timing decisions can be made simultaneously, the instruments motivated for
advertising can also be used for release timing and vice versa.
Let ( , , )A Lj j j jφ φ φ ε ′≡ , ( , )A
jt jt jtφ φ ε ′∆ ≡ ∆ ∆ , ( , )A Lj j jη η η ′≡ , and A
jt jtη η∆ ≡ ∆ . We assume that
jtz is exogenous to all error components, namely
( , | ) 0j jt jtE zφ φ∆ = (19)
Further, assume
17 This assumption may not hold if the advertising created by different studios vary systematically in quality, but this is unlikely in the market, where TV ads typically consist of a trailer from the movie and do not carry other creative elements.

16
1( | )j j jE φ η η= Γ (20)
2( | )jt jt jtE φ η η∆ ∆ = Γ ∆ (21)
Note that the advertising carryover structure does not affect how the correlated random
coefficients are corrected for: while jtA includes lagged advertising GRPs, the error term in
current-period elasticity, Ajtφ∆ , is assumed to be solely a function of A
jtη∆ (i.e., not a function of
1 2, ,...jt jtη η− −∆ ∆ , conditional on Ajtη∆ ). This assumption should be reasonable, unless firms are
forward-looking so that they adjust advertising levels in advance of a predicted change in
advertising responsiveness in a given week.
For the system of two equations (17) and (18), a pooled OLS estimator can be computed,
which is consistent under the orthogonality assumption on the error terms. Notice that the pooled
OLS estimator does not impose any structure on the second-moments of the errors (except that
they are well-defined) and allows for arbitrary serial correlation, cross-equation correlation as
well as heteroscedasticity. Once we have obtained ˆ Ajtη and ˆL
jη , we can replace Ajη with
1
1 ˆT
Ajt
tTη
=∑ ,
jtη∆ with 1
1ˆ ˆ( )T
A Ajt jt
tTη η
=
− ∑ , Ljη with ˆL
jη , and estimate
1 2ˆ ˆ( ) ( ) ( , ,1) ( ,1)A A A Ajt jt jt jt j j j jt jt jt jt jtS X w A w L A L A vβ θ θ η η′ ′ ′= + + + Γ +Γ ∆ + (22)
The OLS estimator will be consistent. Note that jtv is generally heteroscedastic, so a
heteroscedasticy-robust standard errors and test statistics should be applied (e.g., White 1982).
3.4. Operationalization of Variables
3.4.1. WOM
The consumers’ word-of-mouth about a particular movie is likely to influence the DVD
demand as well as the market responsiveness to DVD advertising. However, unlike advertising
or price, word-of-mouth is difficult to quantify. Recently, marketing researchers have come up
with several innovative approaches to measure consumer word-of-mouth. For instance, Godes
and Mayzlin (2004b) use online newsgroup conversations to measure word-of-mouth about TV
shows; Chevalier and Mayzlin (2003) use online book reviews on Amazon.com and
barnesandnoble.com as measure for word-of-mouth. Dellarocas et al. (2004) use the Internet

17
users’ ratings on Yahoo! Movies and IMDB.com to proxy word-of-mouth for movies. Utilizing
such proxies requires that the online sample be reasonably representative of the target market and
that the online word-of-mouth communication process resembles the offline process.
While these assumptions may hold in certain markets, they may not be valid in general. For
instance, the fact that a viewer gives The Pianist a rating of 10 on IMDB.com does not directly
mean that she would highly recommend the movie to her friends (possibly due to the gravity of
the subject); she might be more likely to discuss Princess Diaries with her friends, although she
gives the movie a mediocre rating of 6.
To overcome such problems, we compute an empirical measure for word-of-mouth rather
than use proxies such as online reviews. It is well acknowledged by practitioners and researchers
that the box-office sales pattern reveals information about the consumers’ word-of-mouth
communication. Studio executives admit that “the movie marker’s job is to open the movie; after
the opening weekend, the success of the motion picture mainly depends on the playability of the
picture.” (Gilbert-Rolfe et al. 2003) Consumers’ word-of-mouth communication is believed to be
responsible for the playability (also called leg or longevity) of a movie (Elberse and Eliashberg
2003). Observing the box-office sales pattern after the opening weekend, therefore, enables us to
infer the nature of word-of-mouth communication for a given movie without resorting to a proxy
source. To construct this measure, we use a regression method similar to Elberse and Eliashberg
(2003):
0 1 2, 1ln( _ ) ln( ) ln( _ ) , 2,3,...jt jt j jt jt jBOX REV SCREENS SCR REV e t Tα α α −= + + + = (23)
where _ jtBOX REV is the box-office revenue for movie j in week t, jtSCREENS is the number
of total screens allocated for movie j in week t, and 1_ jtSCR REV − is the revenue per screen for
movie j in week t-1. The parameter 2, jα captures how the movie’s performance in the previous
week impacts its current performance and thus constitutes an intuitive measure for the word-of-
mouth effect: a very low 2, jα would suggest a poor word-of-mouth while a very high 2, jα would
suggest a very favorable word-of-mouth. Elberse and Eliashberg (2003) estimate this coefficient
by pooling over all movies; instead, we estimate it for each individual movie and use the
resulting estimates, 2,ˆ jα , as the empirical WOM index for that movie.
3.4.2. Competition

18
Previous research has shown the importance of modeling competition between theatrical
movies in studying box-office sales (e.g., Einav 2003; Foutz and Kadiyali 2003; Ainslie et al.
2004). However, no previous research has studied the competition for DVDs. Competition in the
DVD market is more complicated than competition for movies. First, what is the competitive set?
One intuitive answer would be that the set should consist of other DVDs that are released about
the same time as the focal DVD. However, competition may be not only from DVDs, but also
the movies in theaters. Due to the short life-cycle of both DVD and theatrical movie and the
potential substitution between these two forms of entertainment,18 the theatrical opening of a
box-office blockbuster can dampen the consumer interest, consequently the sales, of a DVD
released at the same time.
We construct two variables of competition, one capturing the competition from other new
DVD releases (COMP_DVD) and the other capturing the competition from movies playing at
the box-office (COMP_THEATRICAL). Specifically, COMP_DVD jt is the logarithm of the
sum of theatrical revenues of all DVDs (except for title j) that are released in the t-th week
following DVD j’s release date. This measure is preferred over a simpler measure such as the
number of other DVD releases at a given week because DVD titles can vary substantially in their
appeal and consequently their competitive strength; the weighting by box-office revenues,
therefore, solves this problem. COMP_THEATRICAL jt is the logarithm of the total box-office
revenues (for all movies playing in theaters) in the t-th week following DVD j’s release date.
4. Results
4.1. Determinants of Advertising Intensity and Release Delay
Although our objective is to forecast advertising responsiveness, it would be of descriptive
interest to understand how firms currently set their advertising levels and DVD release delay. We
report the results of our first stage regression of equations (17) and (18) in Table 5.
The first column shows the coefficients associated with the observed weekly advertising
levels. As expected, the advertising level that a studio sets for a DVD title is positively related to
box-office performance; specifically, one percent increase in box-office revenue leads to
approximately 0.7 percent increase in the DVD advertising budget, making the DVD advertising
budget roughly “commensurate with box office” (Netherby and Magiera 2003).
18 Luan (2005) shows that there is considerate overlap between movie-goers and DVD viewers.

19
Further, ln(DVD_BASE) has a significantly positive coefficient, meaning that studios have
increased their DVD advertising budgets substantially as DVD player adoption increased; i.e.,
advertising has increased with increase in potential market size. Movie advertising and DVD
advertising are negatively related. This implies that ceteris paribus, studios use lower DVD
advertising for a movie that has been aggressively marketed through advertising for its theatrical
release. Thus theatrical and DVD advertising campaigns are viewed as substitutes. But such
substitution is less for movies that have received good word-of-mouth from the audience, since
there is a positive interaction between ln(MOVIE_AD) and WOM.
Studios spend less on advertising for R-rated and PG13-rated DVDs, compared to more
family-friendly G- and PG-rated DVDs. This is not surprising since advertising budgets are
smaller for markets with restricted potential. Star rating, critical reviews, and Oscar nominations
have negligible impact on advertising budgets. In terms of genre, DVDs belonging to the action
romance and sci-fi genres are advertised relatively less; animations receive considerably more
advertising.
There are substantial differences between studios in their levels of advertising for DVDs.
Among the seven major labels19, five spend significantly more than non-majors (used as the base
line here), especially Studios 3, 4, and 7. Studios 2 and 5 spend moderately more than non-
majors, while Studio 1’s advertising is about the same as non-majors. Studio 6 has the least
advertising (even relative to non-majors) for its DVDs. Such differences may reflect the supply-
side factors such as advertising production and broadcasting costs, as previously mentioned20.
In terms of weekly trends, advertising is highest during the street week21 (an 89% increase
over the pre-street-week level) and sharply declines from week to week thereafter, reflecting the
pattern depicted in Figure 3.
The second column of Table 5 reports the regression results for ln( )DELAY . Box-office
performance does not seem to have a significant effect on the DVD release delay. Oscar-
nominated movies tend to have a longer delay in DVD release. Action movies are released faster
than movies of other genres, while documentaries are released slower. In terms of studio
19 The seven studio dummies are for Warner Home Video (Warner Brothers), Buena Vista (Disney), Universal, Fox, Sony, Paramount and MGM. Studio identities are disguised in the results for confidentiality. 20 The interaction terms between the studio dummies and other covariates (such as production cost and time trend) are included in the estimation but are suppressed here due to space constraints; these results are available upon request. 21 The pre-street-week dummy is normalized to zero for identification.

20
dummies, Studio 1 seems to have the shortest DVD release schedules (and, as previously shown,
it has low advertising budgets among majors) while Studio 3 the longest (and has among the
highest advertising budgets). DVDs with “making-of” features tend to have a slightly longer
delay, which may be explained by a longer post-production creative period.
4.2. Advertising Responsiveness
We present the estimation results of the sales equation (22) in Table 6 and Table 7. Table 6
presents the estimates related to advertising and timing responsiveness as well as the endogeneity
correction coefficients, while Table 6 reports the remaining coefficients of the sales equation.
The first column shows the results of the full-correction model that corrects for both intercept
and slope endogeneity. To investigate the effects of not accounting for endogeneity, we report
results from two other models. The second column shows the results of a partial correction
model, that accounts for only intercept endogeneity. This is equivalent to the standard IV
approach that does not address the slope endogeneity problem. The third column presents the
estimation results without any endogeneity correction.
First, we discuss the differences in the estimates of advertising elasticity between the
proposed model that fully accounts for endogeneity, and the other models. The release-week
advertising elasticity is estimated to be 0.330 in the full-correction model, while it is estimated to
be 0.265 and 0.263 in the partial- and no-correction model, respectively. Thus we see that in this
empirical setting, correcting for intercept endogeneity does very little to obtain correct estimates
for advertising responsiveness. This implies that the private information that managers have is
not so much in the aggregate level of demand for different DVDs (as is typically assumed in the
standard endogeneity correction literature) as in the advertising responsiveness. Our estimates
show that advertising elasticity is underestimated by about 20% if slope endogeneity bias is not
properly corrected for.
Advertising elasticity exhibits a rather small decline in the weeks following the DVD release
(the decrease is insignificant in the second and third week and becomes statistically significant at

21
-8% in the fourth week). These differences are not significantly different across the three
specifications.22
The results also confirm our hypotheses concerning the moderators of advertising
effectiveness. DVD advertising is more effective on movies that have received a better word-of-
mouth from theatrical viewers. Our estimates indicate about a 6% difference in advertising
elasticities between movies on the 90th percentile of WOM and the 10th percentile of WOM,
reflecting a complementary relationship between word-of-mouth and advertising. To our
knowledge, this is the first time that such complementarity between WOM and advertising has
been reported in the literature.
Advertising for the theatrical release negatively affects DVD advertising elasticity,
reflecting substitutability in advertising between the theatrical channel and the home video
channel.
Retail price reductions significantly increase the effectiveness of advertising. As previously
noted, major retailers (such as Wal-Mart and Best Buy) routinely use new DVD releases as loss
leaders to boost store traffic. Our results show that these retailer discounts substantially enhance
advertising responsiveness; specifically, a 1% price discount increases advertising elasticity by
approximately 0.103%. This is a 31% increase in advertising elasticity, relative to the intercept,
suggesting that studios should coordinate with retailers’ loss leader strategies by increasing
advertising intensity.
Box-office revenue has a negative impact on advertising effectiveness. This is consistent
with the informative effect rather than prestige effect of advertising in this market. If a higher
number of potential consumers have viewed the movie in theater, they are more likely to rely on
their viewing experience rather than advertising to make their purchase decision regarding the
DVD. Ackerberg (2001) found that advertising for a new yogurt brand influences inexperienced
consumers and has little effect on experienced consumers. Our finding here similarly suggests
that the role of DVD advertising is to inform consumers about the characteristic of the product;
therefore, a higher percentage of consumers who have experienced the movie renders DVD
advertising less effective.
22 The carryover coefficient, δ , is estimated using a grid search over the minimized sum of squared residuals. It is estimated to be 0.70 in the best-fit specification. This carry over effect is much larger than the average reported in Assmus, Farley and Lehmann (1984), but it should be remembered that we are estimating the models at the weekly duration level, where the carry over effects would be much larger compared to longer monthly or annual duration data.

22
DVD release delay has a positive influence on advertising effectiveness, as expected. This is
consistent with conventional wisdom that a longer delay induces market forgetfulness and
therefore DVD advertising is more effective as reminder advertising when accompanied with
long delays. The market is 25% more elastic to DVD advertising in the Christmas-New Year
holiday season.
The estimates for the correction terms confirm our conjecture that the marketing-mix
variables such as advertising and release timing are endogenously determined and are thus
correlated with the unobserved marginal effects of these variables. The estimates also provide
insights about how these unobserved advertising responsiveness characteristics affect observed
advertising or delay. The coefficient of ˆ Aj ADη is significantly positive, suggesting a positive
relationship between Ajφ , the unobserved component in advertising elasticity for DVD j, and ˆ A
jη ,
the realized error term in the advertising equation. This implies that firms do have private
knowledge about the product-specific advertising effectiveness and take it into account when
setting advertising levels for a particular DVD title: more advertising is given to titles that have
more advertising sensitivity. ˆ Ajt ADη∆ also has a significantly positive coefficient, implying that
the week-specific variation in advertising responsiveness, Ajtφ∆ , is also partially observed by the
studio and incorporated in setting the weekly advertising levels. The coefficient of ˆ Ajη is positive,
suggesting that DVDs with a larger demand disturbance, jε , is given a higher advertising budget,
consistent with the arguments underlying intercept endogeneity. The estimate for ˆ Ajtη∆ is
positive but not significant, possible because weekly deviations in sales are difficult to predict.
The coefficient of ˆLjη is negative, implying that DVDs with an exceptionally high demand
(i.e., larger ε ’s) are released faster, but the estimate is not significant. The coefficient for ˆLj ADη
is significantly negative, suggesting that DVDs that are more responsive to advertising is
released faster on average; on the other hand, ˆ Aj Lη has a positive coefficient, meaning that DVDs
less susceptible to release delay are advertised more. These interaction terms imply that the
endogeneity biases in multiple marketing-mix variables should be treated simultaneously if
possible. The coefficient for ˆLj Lη is insignificant, which may imply that firms are unable to
adequately assess the delay responsiveness for each particular movie well in advance of its

23
planned DVD release; however, they are capable of adapting their advertising levels immediately
around the release date (when market research information becomes available): allocating
smaller advertising budgets to movies whose attractiveness has diminished substantially (i.e., a
more negative Ljφ ) and bigger advertising budgets to movies whose attractiveness has been less
susceptible to the time elapse.
In summary, our findings indicate the following sources of endogeneity: (1) firms seem to
respond to an unexpectedly high DVD demand with higher advertising; (2) firms (at least
partially) observe advertising responsiveness of a specific DVD and tailor their strategies to such
private knowledge; (3) firms tend to make advertising and timing decisions in an integrated
fashion rather than independently. In addition, we find that firms have better private forecasts of
the individual effects of advertising than the effects of release delay.
4.3. Sales Forecasting
Table 7 presents the rest of the second-stage estimation results with the full (slope and
intercept) endogeneity correction. A movie’s box-office performance is usually used as the most
important predictor for its DVD sales. Figure 5 plots the box-office revenue and DVD sales of
each title in our sample in log-log scales. While there is a strong positive correlation between the
two variables (Pearson correlation coefficient = 0.80), there is considerable variance in DVD
sales that is not explained by box-office revenue, especially for in the low-to-medium range. Our
analysis shows that a one percent increase in box-office gross corresponds to a roughly one
percent increase in DVD sales. DVD player adoption has a significantly positive effect on the
sales of an average DVD. Even with the explosion in number of DVD titles, a 1% increase in the
number of DVD households still leads to an increase of 0.85% in the sales of an average DVD.
Theatrical advertising has no significant effect on DVD sales, while its interaction with the
word-of-mouth variable is significantly positive. This finding has important implications for
firms facing a sequential-channel marketing problem. In a parallel context, Erdem and Sun (2002)
show that advertising has a spillover effect for umbrella brands in frequently purchased packaged
goods category; however, to our knowledge, no empirical study has examined whether
advertising spillover effect exists for products marketed in sequential channels. Our finding
suggests that the vertical advertising spillover effect (or advertising trickle-down effect) only
happens when the product has received good-of-mouth in the upstream channel. For a movie

24
with poor word-of-mouth reviews, theatrical advertising has a primarily substitution effect of
channeling consumers from the home video channel to the theatrical channel.
Price elasticity is estimated to be -1.83 for smaller titles and -1.97 for box-office hits. This
result is quite intuitive: smaller titles are typically targeted at a niche market while bigger titles
are marketed to the mass market, which on average is more price-sensitive. The weekly trend
estimate of sales is -0.47, corresponding to a 37% decline in sales per week.23
DVD content enhancements (“extras”) help expand sales. Documentaries about the movie
production (“making-of”) and other behind-the-scene featurettes (MAKING_OF) increase DVD
sales on average by 13%. The presence of deleted scenes or alternative endings (DEL_SCENES)
increases sales by 9%, and music videos or isolated scores (MUSIC_VIDEOS) by 12%.
Filmmaker commentary (COMMENTARY) and interactive features (INTERACTIVE) do not
increase sales. Children’s games (GAME), such as sing-alongs and word games, increase the
sales (mostly of animation movies) by about almost 50%, reflecting the extreme popularity of
such materials with the target audience.
Star power (STAR) increases DVD sales, even after box-office gross and other variables
have been controlled for. Critical rating, somewhat surprisingly, has a negative effect, implying
that the majority of DVD buyers may have different tastes about movies than film critics. A
similar argument may explain the negative sign of OSCARS. R-rated DVDs seem to sell
significantly better than DVDs of other ratings (G, PG, and PG13) of similar box-office revenues.
Previous studies have found that family-oriented movies perform better in theaters while R-rated
movies, which target a more mature audience, tend to perform worse at the box office (Litman
1983; Ravid and Basuroy 2004; Sorensen and Waguespack 2005). For instance, out of the top 20
grossing theatrical films in 2003, only four of them are R-rated. In comparison, the finding that
R-rated movies tend to fare better in the DVD market relative to the theatrical market may reflect
the fact that the DVD market seems to appeal to a more mature audience. This may also be
partially due to fact that teens have freer access to R-rated DVDs than R-rated movies.
According to a FTC 2003 undercover study, the teen shoppers’ ages were asked by cashiers only
19% of the time for purchasing R-rated movies on DVD, in comparison to 48% of the time for
R-rated movie admissions.24
23 We also estimate the model with week dummies and the results are quite similar to this exponential decay sales pattern. 24 http://www.ftc.gov/opa/2003/10/shopper.htm.

25
Sequels perform worse than non-sequels in the DVD market, indicating that the exceptional
popularity of sequels in the theatrical market does not translate into success in the DVD market.
Among different genres, action, fantasy and war movies perform significantly better on DVDs,
whereas drama and romance DVDs perform significantly worse.
Competition from other DVDs newly released (COMP_DVD) negatively affect (statistically
significant) the DVD sales, but the magnitude of the effect is very small (about 0.02% for an
addition 1% increase in the competition measure), indicating that competition between DVDs
should not be a major concern for studios. A consumer may visit a store to buy the Bringing
Down the House DVD, and end up checking it out together with What a Girl Wants, another new
release title on the shelf. The finding supports the viewpoint of some industry observers that the
DVD market supports more “biodiversity” than the theatrical market (Cellini and Lambertini
2003) because DVDs allow households to inventory and watch multiple DVDs at convenient
times over a week. Hence the extent of substitution among DVDs is limited.
The major competition for a DVD, interestingly, is not what is also released in video stores
but what is playing in theaters. The theatrical releases (COMP_THEATRICAL) turn out to have
a substantial impact on DVD sales (i.e., 1% change in theatrical competition leads to 0.2%
decrease in DVD sales), reflecting consumers’ substitution between theater-going and DVD-
buying. This has important implications for DVD distributors, who should want to avoid
releasing their DVDs at the same week with big-budget box-office openings.
In terms of seasonality, the fall season has significantly lower DVD demand, while the
holiday season has higher demand for an average DVD, presumably due to the fact that
consumers are fond of giving away DVDs as gifts. The high number of releases clustered in the
holiday season may partially lessen this effect, but our finding suggests that DVDs still have
better sales in the high-demand period.
5. Conclusion
This paper introduces the advertising responsiveness forecasting problem to the marketing
literature. The problem is of particular interest in the context of short life-cycle products, because
traditional experimentation-based approaches to infer advertising responsiveness are ineffective
for them. The marketing-mix responsiveness forecasting problem is also of broader interest in
the context of sales forecasting. While there has been considerable research on sales forecasting
for new products, our analysis shows that developing better forecasts of marketing-mix
26
responsiveness can aid not only in the choice of the optimal marketing mix but also improve the
accuracy of sales forecasts for new products.
In solving the advertising responsiveness forecasting problem, we also solve the
methodological problem of “slope endogeneity”. We contrast this with the extant literature that
has focused on “intercept endogeneity.” Our solution is a simple and intuitive control-function
approach that is easy to implement. Effectively, this approach involves introducing additional
variables from the errors of a first-stage OLS regression into a second-stage OLS regression.
We hope the simplicity of this approach would aid in the use of such endogeneity correction
in the marketing literature when it is appropriate. In our application, we indeed find that studios
seem to possess private information (unavailable to the researcher) about sales and advertising
responsiveness of a given DVD and that failure to correct for the resulting endogeneity bias leads
to considerable forecasting error for advertising elasticity (an underestimate of 20%). We also
found that extant approaches that only correct for intercept endogeneity did little to remove the
bias in forecasting advertising responsiveness. Therefore, correcting for advertising
responsiveness endogeneity is critical in helping studio executives choose the right advertising
levels.
Our average estimate of advertising elasticity for DVDs is consistent with the meta-analysis
estimates of Assmus, Farley and Lehmann (1984), who find that the average short-run elasticity
for a wide range of products is roughly 0.3. In a sense, our study can be thought of as a meta-
analysis of the advertising responsiveness for different DVDs. A recent meta-analysis of price
sensitivity (Bijmolt et al. 2005) has shown that not accounting for price endogeneity under-
estimates price elasticity by about 34% (from -3.74 to -2.47). However, as we discussed earlier,
these corrections have only taken into account intercept endogeneity. Our results suggest that it
would be important to check in future research whether the magnitude of the endogeneity bias
would change if we also accounted for slope endogeneity in price responsiveness.
Our analysis yielded a number of empirical insights of substantive interest to studio
executives in the marketing of DVDs. We list a few key managerial takeaways based upon our
empirical findings:
(1) DVD advertising is more effective when the corresponding movie has better word-of-
mouth among consumers. Therefore, contrary to the extant theoretical literature which assumes
that advertising and word-of-mouth are substitutes, we argue that DVD advertising should

27
complement movie word-of-mouth. Thus studios will not find advertising an effective tool in
obtaining high DVD sales if the theatrical movie elicited poor consumer ratings. In short, studios
should not put “good money” after “bad money”.
(2) We find that advertising responsiveness is lower for large box-office movies, implying
that DVD advertising should be a concave function of box office revenues, controlling for other
effects. But since DVD advertising is more effective in high demand periods such as holidays,
greater levels of advertising should be used to promote DVDs released during high demand
holiday seasons.
(3) Spillover effects of advertising have been previously documented in the context of
umbrella branding. We find partial evidence for the advertising spillover effect in the context of
a product released in sequential channels: advertising for the upstream market (theatrical release)
benefits the downstream market (DVD release) only when the product has received good word-
of-mouth in the upstream market. We also find that advertising for the theatrical release serves as
a partial substitute for advertising for the DVD release for a movie with average word-of-mouth,
implying that, controlling for other effects, studios should spend less on DVD advertising if the
theatrical movie has been intensely advertised.
(4) Retailers often use popular DVDs as retail loss-leaders. We find that advertising
responsiveness is greater when accompanied by retailer price cuts, leading to greater sales. Since
DVD advertising tends to be non-price advertising, we obtain the well-known interaction effect
between price and non-price advertising on sales (Kaul and Wittink 1995). Hence studios should
leverage and piggy back on retailer pricing and advertise more if they expect retailers to use the
DVD as a loss-leader. More importantly, this suggests that studios may coordinate with major
retailers such as Wal-Mart and Best Buy on pricing and advertising along the lines of consumer
packaged goods manufacturers.
(5) Competition for a DVD movie is primarily not from other DVDs released at the same
time, but from other movies shown in theaters at the same time. Studios should therefore avoid
releasing a DVD head-to-head with major box-office hits.
Our empirical analysis of forecasting advertising responsiveness and sales of DVDs takes
advantage of the sequential nature of box-office and DVD releases. There are several markets
(e.g., books, music, software versions, video games, product line extensions) where products are
introduced sequentially and would benefit the forecasting approach developed in the paper. For

28
example, when books move from hardcover to paperback, firms have to decide how many copies
to print and how much advertising support to offer. Hardcover sales patterns can offer similar
information such as WOM etc. that we elicited from the movie data. Book publishers can
negotiate with retailers about obtaining potential price discounts in exchange for greater
advertising support for the books.
While we have illustrated how to solve the advertising responsiveness endogeneity problem
in the context of DVDs, the problem of marketing-mix responsiveness endogeneity is widely
relevant. In the context of promotions, firms allocate their consumer and trade promotions based
on what they believe would be most effective in raising sales. Within trade promotions,
managers can use free cases, off-invoices, bill-backs etc. as appropriate in these settings.
Consumer promotions can take forms such as targeted coupons and general price discounts. In
sales force allocation, more salespeople (or more capable salespeople) will be allocated to
markets where managers believe they will obtain greater “bang for the buck.” In allocating shelf
space to various categories in a store, managers will allocate greater shelf space to categories that
are likely to have greater marginal profits; across different stores, space allocations will vary
depending on similar managerial judgment about effectiveness. In general, many marketing
problems involve the “heterogeneity of rewards” and private managerial information; to estimate
unbiased marginal effects in each of these problems, one needs to account for responsiveness (i.e.
slope) endogeneity.
In summary, the marketing-mix responsiveness “forecasting” problem and the
“responsiveness” (slope) endogeneity problem, often tangled in real-world applications, are both
relevant in a wide range of markets. We hope this paper serves as an impetus to address these
two classes of problems in future research.

29
References
Ackerberg, D. A. (2001), "Empirically Distinguishing Informative and Prestige Effects of Advertising," Rand Journal of Economics, 32(2), 316-33. Adweek (2004), "Media & Advertising: Ad Spending," Adweek, 45(40), 1. Ainslie, A., X. Dreze, and F. Zufryden (2004), "Modeling Movie Lifecycles and Market Share," Marketing Science, Forthcoming. Assmus, G., J. U. Farley, and D. R. Lehmann (1984), "How Advertising Affects Sales - Meta-Analysis of Econometric Results," Journal of Marketing Research, 21(1), 65-74. Bass, F. M. and D. G. Clarke (1972), "Testing Distributed Lag Models of Advertising Effect," Journal of Marketing Research, 9(3), 298-308. Berry, S., J. Levinsohn, and A. Pakes (1995), "Automobile Prices in Market Equilibrium," Econometrica, 63(4), 841-90. Bijmolt, T. H. A., H. J. Van Heerde, and R. G. M. Pieters (2005), "New Empirical Generalizations on the Determinants of Price Elasticity," Journal of Marketing Research, 42(2), 141-56. Bjorklund, A. and R. Moffitt (1987), "The Estimation of Wage Gains and Welfare Gains in Self-Selection Models," Review of Economics and Statistics, 69(1), 42-49. Cardona, M. M. and J. Fine (2003), "The Next DTC: DVD Explodes," Advertising Age, 74(35), 1-2. Cellini, R. and L. Lambertini (2003), "Advertising with Spillover Effects in a Differential Oligopoly Game with Differentiated Goods," Central European Journal of Operations Research, 11(4), 409-23. Chevalier, J. and D. Mayzlin (2003), "The Effect of Word of Mouth on Sales: Online Book Reviews," Working paper, Yale University. Chintagunta, P. K. (2001), "Endogeneity and Heterogeneity in a Probit Demand Model: Estimation Using Aggregate Data," Marketing Science, 20(4), 442-56. de Lisle, T. (2005), "Home Box Office: More People Bought DVDs Than Cinema Tickets Last Year - and More Film Flops Are Turning into Hits after Being Released on Disc," The Guardian, 1/14/2005. Dellarocas, C., N. F. Awad, and X. Zhang (2004), "Exploring the Value of Online Reviews to Organizations: Implications for Revenue Forecasting and Planning," Working Paper, MIT Sloan School of Management.

30
Dube, J.-P., G. J. Hitsch, and P. Manchanda (2004), "An Empirical Model of Advertising Dynamics," Working Paper, University of Chicago. Einav, L. (2003), "Not All Rivals Look Alike: Estimating an Equilibrium Model of the Release Date Timing Game," Working Paper, Stanford University. Eisinger, J. (2005), "Long & Short: Weekend Box Office Isn't the Ticket," The Wall Street Journal, 05/25/2005. Elberse, A. and J. Eliashberg (2003), "Demand and Supply Dynamics for Sequentially Released Products in International Markets: The Case of Motion Pictures," Marketing Science, 22(3), 329-54. Eliashberg, J., A. Elberse, and M. A. A. M. Leenders (2005), "The Motion Picture Industry: Critical Issues in Practice, Current Research and New Research Directions," Working Paper. Erdem, T. and B. Sun (2002), "An Empirical Investigation of the Spillover Effects of Advertising and Sales Promotions in Umbrella Branding," Journal of Marketing Research, 39(4), 408-20. Foutz, N. Z. and V. Kadiyali (2003), "Competitive Dynamics in Optimal Release Timing of Motion Pictures," Working Paper, Cornell University. Garen, J. (1988), "Compensating Wage Differentials and the Endogeneity of Job Riskiness," Review of Economics and Statistics, 70(1), 9-16. ---- (1984), "The Returns to Schooling: A Selectivity Bias Approach with a Continuous Choice Variable," Econometrica, 52(5), 1199-218. Gilbert-Rolfe, J., U. Merchant, and V. Moroian (2003), "Drivers of Marketing Spending in Motion Pictures," The Anderson School of Business, UCLA. Godes, D. and D. Mayzlin (2004a), "Firm-Created Word-of-Mouth Communication: A Field-Based Quasi-Experiment," Harvard Business School Working Paper, No. 05-023. ---- (2004b), "Using Online Conversations to Study Word-of-Mouth Communication," Marketing Science, 23(4), 545-60. Heckman, J. (1997), "Instrumental Variables - a Study of Implicit Behavioral Assumptions Used in Making Program Evaluations," Journal of Human Resources, 32(3), 441-62. Heckman, J. J. (1976), "Common Structure of Statistical-Models of Truncation, Sample Selection and Limited Dependent Variables and a Simple Estimator for Such Models," Annals of Economic and Social Measurement, 5(4), 475-92. Kaul, A. and D. R. Wittink (1995), "Empirical Generalizations About the Impact of Advertising on Price Sensitivity and Price," Marketing Science, 14(3), G151-G60.

31
Kipnis, J. (2005), "The Year in Video," Billboard, 117(2), 5-6. Kurt, I. (2004), "Video Industry on the Way to Another Record Year," Video Store Magazine, 26(30), 8. Lee, L. F. (1978), "Unionism and Wage Rates - Simultaneous Equations Model with Qualitative and Limited Dependent Variables," International Economic Review, 19(2), 415-33. Lehmann, D. R. and C. B. Weinberg (2000), "Sales through Sequential Distribution Channels: An Application to Movies and Videos," Journal of Marketing, 64(3), 18-33. Litman, B. R. (1983), "Predicting Success of Theatrical Movies: An Empirical Study," Journal of Popular Culture, 16(4), 159-75. Luan, J. Y. (2005), "Modeling Interactions between Sequential Channels," Working paper, Yale University. Manchanda, P., P. E. Rossi, and P. K. Chintagunta (2004), "Response Modeling with Nonrandom Marketing-Mix Variables," Journal of Marketing Research, 41(4), 467-78. Mayzlin, D. (2001), "Promotional Chat on the Internet," Ph.D. dissertation, Massachusetts Institute of Technology. Mohr, I. (2005), "The Incredible Shrinking Movie Window," Variety.com, 06/27/2005. Monahan, G. E. (1984), "A Pure Birth Model of Optimal Advertising with Word-of-Mouth," Marketing Science, 3(2), 169-78. Netherby, J. and M. Magiera (2003), "See Spots Run: Ads for DVD up 'Drastically'," Video Business, 23(24). Nevo, A. (2001), "Measuring Market Power in the Ready-to-Eat Cereal Industry," Econometrica, 69(2), 307-42. Ravid, S. A. and S. Basuroy (2004), "Managerial Objectives, the R-Rating Puzzle, and the Production of Violent Films," Journal of Business, 77(2), S155-S92. Sandy, R. and R. F. Elliott (1996), "Unions and Risk: Their Impact on the Level of Compensation for Fatal Risk," Economica, 63(250), 291-309. Sawhney, M. S. and J. Eliashberg (1996), "A Parsimonious Model for Forecasting Gross Box-Office Revenues of Motion Pictures," Marketing Science, 15(2), 113-31. Schiller, G. (2004), "News; Marketing," hollywoodreporter.com, November 22, 2004.

32
Sorensen, O. and D. Waguespack (2005), "Social Structure and Exchange: Self-Confirmaing Dynamics in Hollywood," Working Paper, UCLA. Tellis, G. J., R. K. Chandy, and P. Thaivanich (2000), "Which Ad Works, When, Where, and How Often? Modeling the Effects of Direct Television Advertising," Journal of Marketing Research, 37(1), 32-46. The Digital Entertainment Group (2005), "DEG Highlights," http://www.dvdinformation.com/Highlights/index.cfm. Vakratsas, D., F. M. Feinberg, F. M. Bass, and G. Kalyanaram (2004), "The Shape of Advertising Response Functions Revisited: A Model of Dynamic Probabilistic Thresholds," Marketing Science, 23(1), 109-19. Verbeek, M. and T. Nijman (1992), "Testing for Selectivity Bias in Panel Data Models," International Economic Review, 33(3), 681-703. Villas-Boas, J. M. and R. S. Winer (1999), "Endogeneity in Brand Choice Models," Management Science, 45(10), 1324-38. Wooldridge, J. M. (2003), "Further Results on Instrumental Variables Estimation of Average Treatment Effects in the Correlated Random Coefficient Model," Economics Letters, 79(2), 185-91. ---- (1997), "On Two Stage Least Squares Estimation of the Average Treatment Effect in a Random Coefficient Model," Economics Letters, 56(2), 129-33. ---- (1995), "Selection Corrections for Panel-Data Models under Conditional Mean Independence Assumptions," Journal of Econometrics, 68(1), 115-32. Zufryden, F. S. (1996), "Linking Advertising to Box Office Performance of New Film Releases - a Marketing Planning Model," Journal of Advertising Research, 36(4), 29-41.

33
Tables
Table 1: Key Descriptive Statisticsa
Variable Mean Median Std Dev. Maximum MinimumDVD sales, 4 weeks (mils.) 0.72 0.32 1.20 8.97 0.01DVD sales, 6 months (mils.) 0.99 0.50 1.50 11.29 0.01TV GRPs, 2 weeks before street date 7.80 0 37.71 567 0TV GRPs, 1 week before street date 75.18 0 127.66 584 0TV GRPs, Week 1 117.93 41 156.87 690 0TV GRPs, Week 2 46.18 0 94.23 612 0TV GRPs, Week 3 10.75 0 42.56 461 0TV GRPs, Week 4 7.26 0 33.75 522 0Total TV GRPs 265.90 85 400.80 2484 0Theatrical-to-Video Window (Days) 165.37 158.00 41.44 405 88DVD Retail Price ($) 19.84 19.60 1.89 33.98 14.16Box-Office Revenue ($ mils.) 55.05 34.56 58.20 404.76 5.11Production Budget ($ mils.) 41.46 35.00 31.01 200 0.16Theatrical TV Advertising GRPs (000) 1.43 1.34 0.81 5.44 0Star Power Rating (0-100)b 56.52 59.09 27.63 100 0Viewer Rating (0-10)c 6.07 6.10 1.14 8.9 2.4Critical Rating (1-10)d 5.42 5.00 2.14 10 1Oscar Nominationse 0.21 0.00 0.75 6 0 a Sample consists of 526 new DVD titles released between 2000/1-2003/10. b From Hollywood Reporter. c Avergate user rating from the Internet Movie Database (www.imdb.com) d From Metacritic.com. e Only include major categories: Best Picture, Best Director, Best Leading Actor, and Best Leading Actress.

34
Table 2: Categorical Variables
Variable Mean Genres Action 0.23 Adventure 0.13 Animation 0.06 Comedy 0.44 Crime 0.15 Documentary 0.01 Drama 0.42 Fantasy 0.06 Horror 0.10 Music/Musical 0.02 Romance 0.17 Sci-Fi 0.10 Thriller 0.27 War 0.03 MPAA Ratings R 0.43 PG 13 0.41 PG 0.12 G 0.04 DVD extras “Making-of”/Behind-the-Scene 0.69 Filmmaker Commentary 0.74 Deleted Scenes 0.52 Music Video/Isolated Score 0.32 Interactive Features 0.13 Children’s Games 0.03 Sequel Sequel 0.10

35
Table 3: Predictors of advertising responsiveness
Variable Predicted sign Hypothesis for advertising elasticity WOM + Ads are more effective for movies with better word-of-mouth.
MOVIE_AD - Theatrical advertising and DVD advertising may be substitutable. BOX_REV - Ads are less effective if box-office sales is greater.
PRICE - Ads are more effective when combined with lower prices. DELAY - Ads are less effective when DVD release is delayed.
HOLIDAY + Ad response is higher during high-demand holiday seasons. TREND - Ad response is highest upon DVD release and diminishes over time.
Table 4: DVD Market Shares (2003)
Studio Total sales (billions)
Market share
Warner $4.21 20.2% Buena Vista $3.38 16.2%
Universal $3.07 14.7% Fox $2.76 13.2%
Sony $2.63 12.6% Paramount $1.96 9.4%
MGM $1.11 5.3% Lions Gate $0.84 4.0%
Others $0.93 4.5%
C4 64.30% C6 86.30%
Source: Video Business (2004)

36
Table 5: Determinants of Endogenous Variables ln(AD) ln(DELAY) Constant 9.29 ** (1.720) 0.54 ** (0.889) log(BOX_REV) 0.70 ** (0.160) 0.05 (0.048) log(DVD_BASE) 0.49 ** (0.065) 0.16 (0.208) log(MOVIE_AD) -0.24 ** (0.111) -0.02 (0.047) WOM -0.04 (0.063) 0.03 (0.028) log(MOVIE_AD)*WOM 0.20 ** (0.055) -0.05 ** (0.022) STAR 0.01 (0.039) -0.01 (0.015) CRITIC 0.02 (0.111) 0.03 (0.042) R -0.61 ** (0.139) 0.02 (0.053) PG13 -0.66 ** (0.130) 0.06 (0.049) SEQUEL 0.01 (0.132) 0.02 (0.050) OSCARS 0.01 (0.057) 0.09 ** (0.024) MAKING_OF 0.15 * (0.085) 0.06 * (0.032) ACTION -0.23 ** (0.097) -0.10 ** (0.038) ANIMATION 0.90 ** (0.235) 0.03 (0.090) DOCUMENTARY -0.51 (0.443) 0.59 ** (0.210) DRAMA -0.08 (0.084) 0.04 (0.032) FANTASY 0.06 (0.154) 0.04 (0.057) HORROR -0.27 (0.138) 0.00 (0.053) ROMANCE -0.23 ** (0.108) 0.04 (0.042) SCI-FI -0.37 ** (0.131) 0.04 (0.049) THRILLER 0.03 (0.094) 0.01 (0.036) WAR 0.42 * (0.225) 0.03 (0.087) log(PRICE) -2.54 ** (0.445) -0.12 ** (0.053) log(PRICE)*BOX_HIT -0.20 * (0.122) -0.09 (0.057) STUDIO 1a 0.03 (0.160) -0.27 ** (0.093) STUDIO 2 0.33 ** (0.150) -0.05 (0.111) STUDIO 3 0.94 ** (0.171) 0.22 ** (0.081) STUDIO 4 0.90 ** (0.188) 0.09 (0.112) STUDIO 5 0.38 ** (0.155) 0.01 (0.084) STUDIO 6 -0.32 * (0.181) 0.14 (0.104) STUDIO 7 1.15 ** (0.202) -0.11 (0.113) WEEK 1b 0.64 ** (0.092) WEEK 2 -0.42 ** (0.092) WEEK 3 -1.51 ** (0.092) WEEK 4 -1.73 ** (0.092) Seasonal dummies Yes Yes Interaction terms Yes Yes R2 0.50 0.54 * p<.1; ** p<.05. Heteroscedasticity-robust standard errors are in parentheses. a Studio identities are disguised. b The base level is pre-street-week advertising level.

37
Table 6: Estimated elasticities and endogeneity correlations
Intercept and Slope Endogeneity Correction
Intercept Endogeneity Correction
No Endogeneity Correction
Advertising elasticity
Constanta 0.330 ** (0.075)c 0.265 ** (0.072) 0.263 ** (0.073)
WEEK 2b -0.004 (0.006) 0.003 (0.006) -0.005 (0.006)
WEKK 3 -0.011 (0.008) -0.001 (0.007) -0.014 ** (0.006)
WEEK 4 -0.025 ** (0.009) -0.015 * (0.008) -0.027 ** (0.007)
WOM 0.008 ** (0.003) 0.008 ** (0.003) 0.007 ** (0.003)
log(MOVIE_AD) -0.022 ** (0.007) -0.020 ** (0.006) -0.022 ** (0.006)
log(PRICE) -0.103 ** (0.025) -0.085 ** (0.025) -0.076 ** (0.025)
log(BOX_REV) -0.008 * (0.004) -0.009 * (0.004) -0.007 * (0.004)
log(DELAY) 0.015 * (0.009) 0.016 * (0.009) 0.017 ** (0.009)
CHRISTMAS 0.082 ** (0.023) 0.083 ** (0.020) 0.083 ** (0.021)
Release delay elasticity
log(DELAY) -0.078 * (-0.046) -0.014 (0.010) -0.083 ** (0.027)
Selectivity correction terms ˆ A
j ADη 0.010 ** (0.003) ˆ A
jt ADη∆ 0.005 ** (0.002)
ˆLj ADη -0.035 ** (0.013)
ˆLj Lη 0.004 (0.061)
ˆ Aj Lη 0.127 ** (0.053)
ˆ Ajη 0.050 ** (0.019) 0.076 ** (0.012)
ˆ Ajtη∆ 0.015 (0.012) 0.053 ** (0.008)
ˆLjη -0.087 (0.062) -0.090 (0.062)
* p<0.1; ** p<0.05. a This coefficient indicates the average advertising elasticity in the release week. b The three week dummies indicate the change in advertising elasticity relative to the release week. c Heteroscedasticity-robust standard errors are in parentheses.

38
Table 7: Estimates for the Sales Equation General sales predictors Constant 8.358 ** (0.483) log(BOX_REV) 1.045 ** (0.032) log(DVD_BASE) 0.853 ** (0.022) log(MOVIE_AD) -0.007 (0.030) WOM 0.073 ** (0.015) log(MOVIE_AD)*WOM 0.061 ** (0.016) log(PRICE) -1.828 ** (0.127) log(PRICE)*BOX_HIT -0.149 ** (0.033) TREND -0.472 ** (0.011) DVD content enhancements MAKING_OF 0.130 ** (0.023) COMMENTARY 0.026 (0.024) DEL_SCENES 0.089 ** (0.021) MUSIC_VIDEO 0.112 ** (0.021) INTERACTIVE -0.008 (0.033) GAME 0.399 ** (0.088) Movie attributes STAR 0.075 ** (0.010) CRITIC -0.070 ** (0.030) R 0.246 ** (0.041) PG13 0.019 (0.039) Sequel -0.152 ** (0.036) OSCARS -0.081 ** (0.015) ACTION 0.281 ** (0.027) ANIMATION 0.126 * (0.066) DOCUMENTARY 0.157 (0.106) DRAMA -0.055 ** (0.023) FANTASY 0.202 ** (0.041) HORROR 0.143 ** (0.037) ROMANCE -0.169 ** (0.030) SCI-FI 0.087 ** (0.035) THRILLER 0.103 ** (0.025) WAR 0.257 ** (0.061) Environmental and seasonality factors COMP_DVD -0.016 * (0.009) COMP_THEATRICAL -0.203 ** (0.050) SPRING -0.008 (0.037) SUMMER -0.027 (0.032) FALL -0.341 ** (0.036) HOLIDAY 0.080 * (0.042) * p<0.1; **p<0.05. Heteroscedasticity-robust standard errors are in parentheses.

39
Figures
Figure 1
Box-Office Revenue: "The In-Laws" (2003)
0
3
6
9
12
Week 1 Week 2 Week 3 Week 4 Week 5 Week 6
Rev
enue
($ m
il.) s
Figure 2
DVD Sales: "The In-Laws" (2003)
0
40
80
120
160
200
Week 1 Week 2 Week 3 Week 4 Week 5 Week 6
Sale
s (1,
000)

40
Figure 3
DVD Advertising Intensity by Week
0
20
40
60
80
100
120
week -2 week -1 streetweek
week 2 week 3 week 4
Ave
rage
TV
GR
Ps
Figure 4
Diffusion of the DVD hardware in the U.S.
010203040506070
Jan-00
Jul-00
Jan-01
Jul-01
Jan-02
Jul-02
Jan-03
Jul-03
Jan-04N
umbe
r of D
VD h
ouse
hold
s (in
mill
ions
)
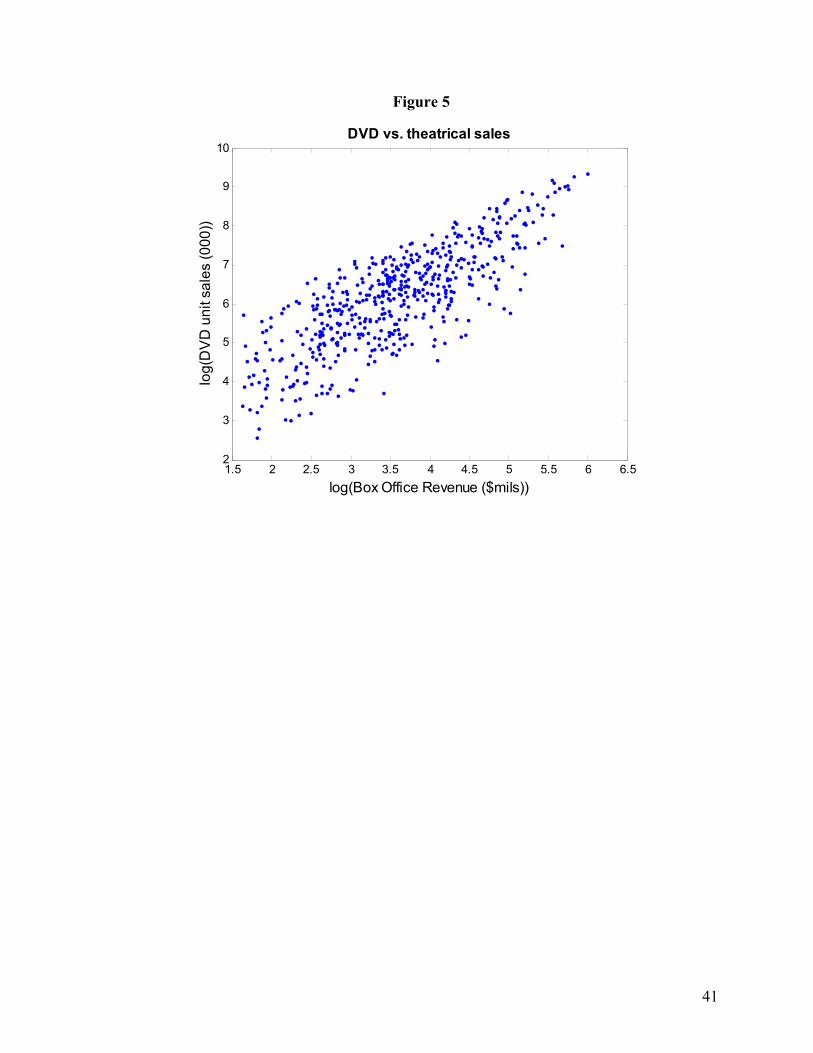
41
Figure 5
1.5 2 2.5 3 3.5 4 4.5 5 5.5 6 6.52
3
4
5
6
7
8
9
10
log(Box Office Revenue ($mils))
log(
DV
D u
nit s
ales
(000
))
DVD vs. theatrical sales