Embed Size (px)
Citation preview

3-1 Forecasting
CHAPTER
7
Forecasting Prepared by :
Arya Wirabhuana, ST, M.Sc

3-2 Forecasting
FORECAST:
A statement about the future value of a variable of interest such as demand.
Forecasts affect decisions and activities throughout an organization
Accounting, finance
Human resources
Marketing
MIS
Operations
Product / service design

3-3 Forecasting
Accounting Cost/profit estimates
Finance Cash flow and funding
Human Resources Hiring/recruiting/training
Marketing Pricing, promotion, strategy
MIS IT/IS systems, services
Operations Schedules, MRP, workloads
Product/service design New products and services
Uses of Forecasts
3-4 Forecasting
Assumes causal system past ==> future
Forecasts rarely perfect because of randomness
Forecasts more accurate for groups vs. individuals
Forecast accuracy decreases as time horizon increases
I see that you will
get an A this semester.

3-5 Forecasting
Elements of a Good Forecast
Timely
Accurate Reliable
Written

3-6 Forecasting
Steps in the Forecasting Process
Step 1 Determine purpose of forecast
Step 2 Establish a time horizon
Step 3 Select a forecasting technique
Step 4 Gather and analyze data
Step 5 Prepare the forecast
Step 6 Monitor the forecast
“The forecast”
3-7 Forecasting
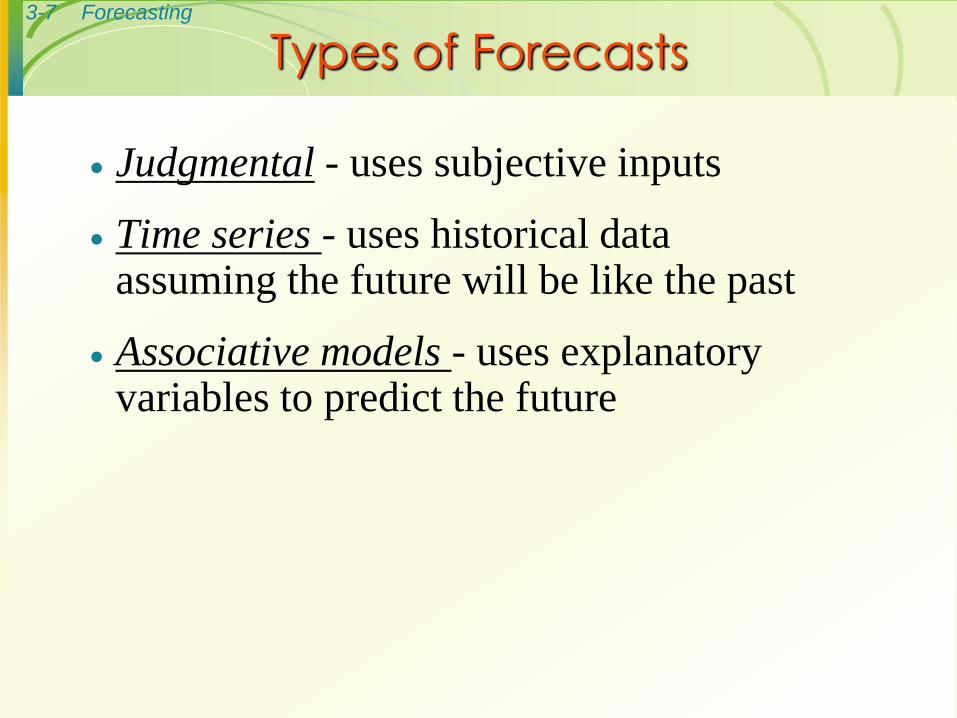
Types of Forecasts
Judgmental - uses subjective inputs
Time series - uses historical data assuming the future will be like the past
Associative models - uses explanatory variables to predict the future
3-8 Forecasting
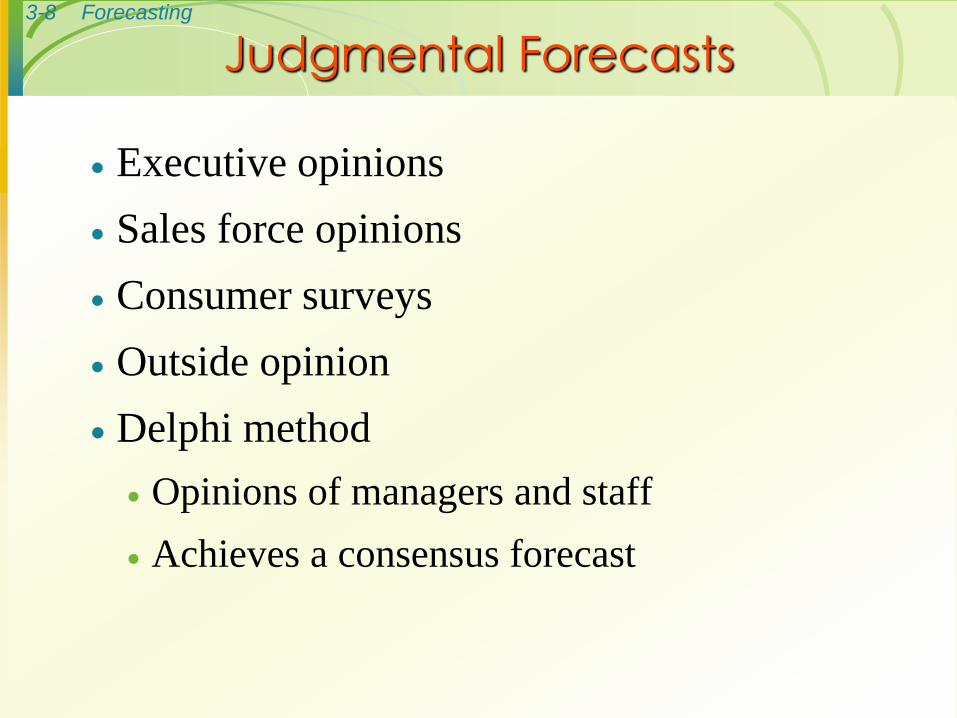
Judgmental Forecasts
Executive opinions
Sales force opinions
Consumer surveys
Outside opinion
Delphi method
Opinions of managers and staff
Achieves a consensus forecast

3-9 Forecasting
Time Series Forecasts
Trend - long-term movement in data
Seasonality - short-term regular variations in
data
Cycle – wavelike variations of more than one
year’s duration
Irregular variations - caused by unusual
circumstances
Random variations - caused by chance

3-10 Forecasting
Forecast Variations
Trend
Irregular
variatio
n
Seasonal variations
90
89
88
Figure 3.1
Cycles

3-11 Forecasting
Naive Forecasts
Uh, give me a minute....
We sold 250 wheels last
week.... Now, next week
we should sell....
The forecast for any period equals
the previous period’s actual value.

3-12 Forecasting
Simple to use
Virtually no cost
Quick and easy to prepare
Data analysis is nonexistent
Easily understandable
Cannot provide high accuracy
Can be a standard for accuracy
Naïve Forecasts

3-13 Forecasting
Stable time series data
F(t) = A(t-1)
Seasonal variations
F(t) = A(t-n)
Data with trends
F(t) = A(t-1) + (A(t-1) – A(t-2))
Uses for Naïve Forecasts
3-14 Forecasting
Techniques for Averaging
Moving average
Weighted moving average
Exponential smoothing

3-15 Forecasting
Moving Averages
Moving average – A technique that averages a
number of recent actual values, updated as new
values become available.
Weighted moving average – More recent values in a
series are given more weight in computing the
forecast.
MAn = n
Ai i = 1
n

3-16 Forecasting
Simple Moving Average
MAn = n
Ai i = 1
n
35
37
39
41
43
45
47
1 2 3 4 5 6 7 8 9 10 11 12
Actual
MA3
MA5

3-17 Forecasting
Exponential Smoothing
• Premise--The most recent observations might have the highest predictive value.
Therefore, we should give more weight to the more recent time periods when forecasting.
Ft = Ft-1 + (At-1 - Ft-1)

3-18 Forecasting
Exponential Smoothing
Weighted averaging method based on previous
forecast plus a percentage of the forecast error
A-F is the error term, is the % feedback
Ft = Ft-1 + (At-1 - Ft-1)

3-19 Forecasting
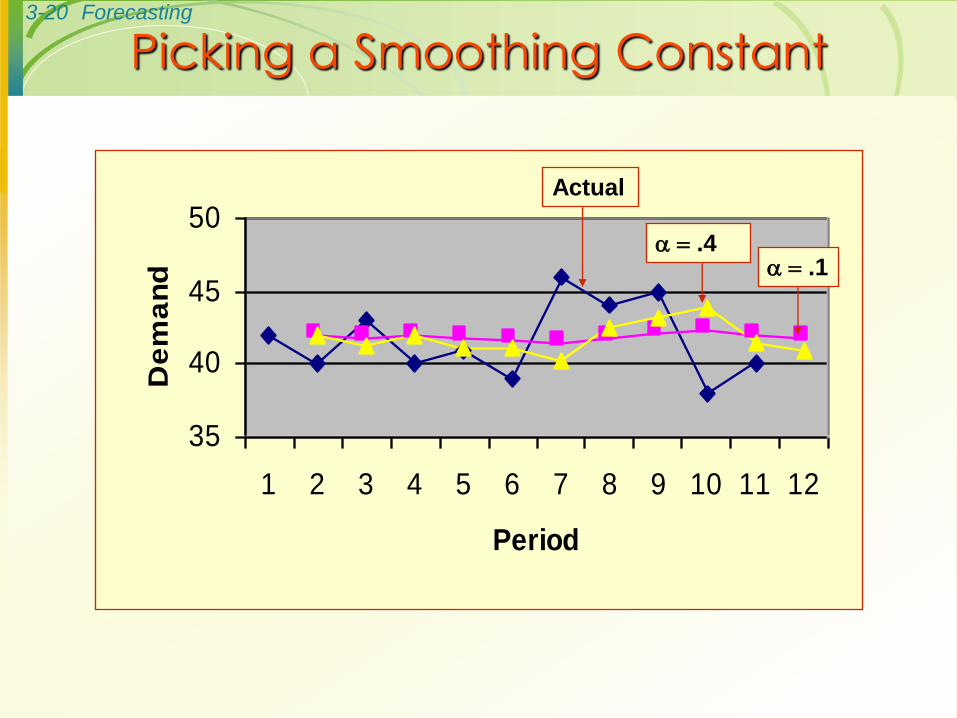
Period Actual Alpha = 0.1 Error Alpha = 0.4 Error
1 42
2 40 42 -2.00 42 -2
3 43 41.8 1.20 41.2 1.8
4 40 41.92 -1.92 41.92 -1.92
5 41 41.73 -0.73 41.15 -0.15
6 39 41.66 -2.66 41.09 -2.09
7 46 41.39 4.61 40.25 5.75
8 44 41.85 2.15 42.55 1.45
9 45 42.07 2.93 43.13 1.87
10 38 42.36 -4.36 43.88 -5.88
11 40 41.92 -1.92 41.53 -1.53
12 41.73 40.92
Example 3 - Exponential Smoothing
3-20 Forecasting
Picking a Smoothing Constant
35
40
45
50
1 2 3 4 5 6 7 8 9 10 11 12
Period
De
ma
nd .1
.4
Actual

3-21 Forecasting
Common Nonlinear Trends
Parabolic
Exponential
Growth
Figure 3.5

3-22 Forecasting
Linear Trend Equation
Ft = Forecast for period t
t = Specified number of time periods
a = Value of Ft at t = 0
b = Slope of the line
Ft = a + bt
0 1 2 3 4 5 t
Ft

3-23 Forecasting
Calculating a and b
b = n (ty) - t y
n t 2 - ( t) 2
a = y - b t
n

3-24 Forecasting
Linear Trend Equation Example
t y
Week t2
Sales ty
1 1 150 150
2 4 157 314
3 9 162 486
4 16 166 664
5 25 177 885
t = 15 t2 = 55 y = 812 ty = 2499
( t)2 = 225

3-25 Forecasting
Linear Trend Calculation
y = 143.5 + 6.3t
a = 812 - 6.3(15)
5 =
b = 5 (2499) - 15(812)
5(55) - 225 =
12495 - 12180
275 - 225 = 6.3
143.5

3-26 Forecasting
Associative Forecasting
Predictor variables - used to predict values of
variable interest
Regression - technique for fitting a line to a set
of points
Least squares line - minimizes sum of squared
deviations around the line

3-27 Forecasting
Linear Model Seems Reasonable
A straight line is fitted to a set of sample points.
0
10
20
30
40
50
0 5 10 15 20 25
X Y
7 15
2 10
6 13
4 15
14 25
15 27
16 24
12 20
14 27
20 44
15 34
7 17
Computed
relationship

3-28 Forecasting
Forecast Accuracy
Error - difference between actual value and predicted
value
Mean Absolute Deviation (MAD)
Average absolute error
Mean Squared Error (MSE)
Average of squared error
Mean Absolute Percent Error (MAPE)
Average absolute percent error

3-29 Forecasting
MAD, MSE, and MAPE
MAD = Actual forecast
n
MSE = Actual forecast)
- 1
2
n
(
MAPE = Actual forecas
t
n
/ Actual*100) (

3-30 Forecasting
Example 10
Period Actual Forecast (A-F) |A-F| (A-F)^2 (|A-F|/Actual)*100
1 217 215 2 2 4 0.92
2 213 216 -3 3 9 1.41
3 216 215 1 1 1 0.46
4 210 214 -4 4 16 1.90
5 213 211 2 2 4 0.94
6 219 214 5 5 25 2.28
7 216 217 -1 1 1 0.46
8 212 216 -4 4 16 1.89
-2 22 76 10.26
MAD= 2.75
MSE= 10.86
MAPE= 1.28

3-31 Forecasting
Controlling the Forecast
Control chart
A visual tool for monitoring forecast errors
Used to detect non-randomness in errors
Forecasting errors are in control if
All errors are within the control limits
No patterns, such as trends or cycles, are
present

3-32 Forecasting
Sources of Forecast errors
Model may be inadequate
Irregular variations
Incorrect use of forecasting technique

3-33 Forecasting
Tracking Signal
Tracking signal = (Actual - forecast)
MAD
•Tracking signal
–Ratio of cumulative error to MAD
Bias – Persistent tendency for forecasts to be
Greater or less than actual values.

3-34 Forecasting
Choosing a Forecasting Technique
No single technique works in every situation
Two most important factors
Cost
Accuracy
Other factors include the availability of:
Historical data
Computers
Time needed to gather and analyze the data
Forecast horizon
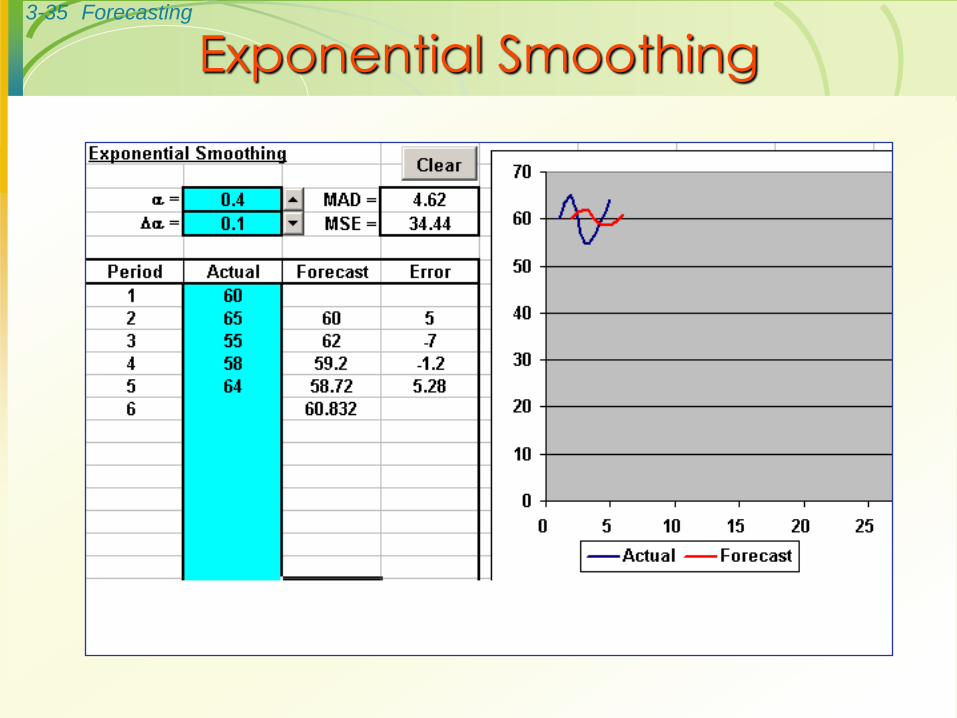
3-35 Forecasting
Exponential Smoothing

3-36 Forecasting
Linear Trend Equation

3-37 Forecasting
Simple Linear Regression