Embed Size (px)
Citation preview
The Seventh International Colloquium on Bluff Body Aerodynamics and Applications (BBAA7) Shanghai, China; September 2-6, 2012
Wind force and wind-induced vibration characteristics of slender beam with angle cross-section
Toshio Tsurumi a Junji Katagiri a Takeshi Ohkuma b
a Urban Environment Research Center, Izumi Sohken Engineering Co.,Ltd.,51 Minamisode Sodegaura Chiba, Japan
b Institute of Technology, Kanagawa University, 3-27-1 Rokkakubashi Kabagawa-ku Yokohama Kanagawa, Japan
ABSTRACT: This paper investigates the characteristics of wind forces and wind induced vibra-tions on L-130x130x9 angle members used as members for large towers through wind forces tests and vibration tests in a wind tunnel using section models. It is thus clarified that unstable aerodynamic vibrations such as vortex induced vibrations, galloping and flutter occur in the an-gle member.
KEYWORDS: Angle cross-section member, Wind tunnel test, Wind force, Wind-induced vibra-tion, Aerodynamic damping 1 INTRODUCTION Angle-cross section members have been used in a lot of open structures such as transmission towers, radio towers and canopy roofs. Members of large open type structures in particular have large aspect ratios (ratio of length to width), so their natural frequencies are low and/or their crit-ical damping ratios are small. For such members, vibrations induced by vortex shedding or self-exited vibrations may occur frequently under the design wind speed, which may cause fatigue damage or loosening of bolts at connections. To avoid these problems, characteristics of wind-induced vibrations need to be clarified and estimated in the design stage.
Cook[1], Modi et al.[2] and Okajima et al.[3] studied the relationship between the charac-teristics of mean wind forces on beams with angle sections and wind angles of attack (wind di-rection). However, there have been few studies on fluctuating wind forces in these members, and they did not provide enough information to estimate wind responses analytically.
Wardlaw[4], Modi et al.[2] and Okajima et al.[3] studied wind-induced vibrations in angle members. They suggested that vortex-induced vibration, galloping and/or flutter could occur in angle members. However, some of these vibration modes did not agree with the real vibration modes of angle members in open structures. Thus, the characteristics of real vibrations are not clarified by these results.
This paper discusses the characteristics of wind forces and wind induced vibrations on L-130x130x9 angle members usually used as members for large towers, through wind force tests and vibration tests in a wind tunnel.
2 OUTLINE OF WIND TUNNEL TESTS
2.1 Wind force test
An Eiffel type wind tunnel with a cross section 2.2m wide by 1.8m high was used.
1324
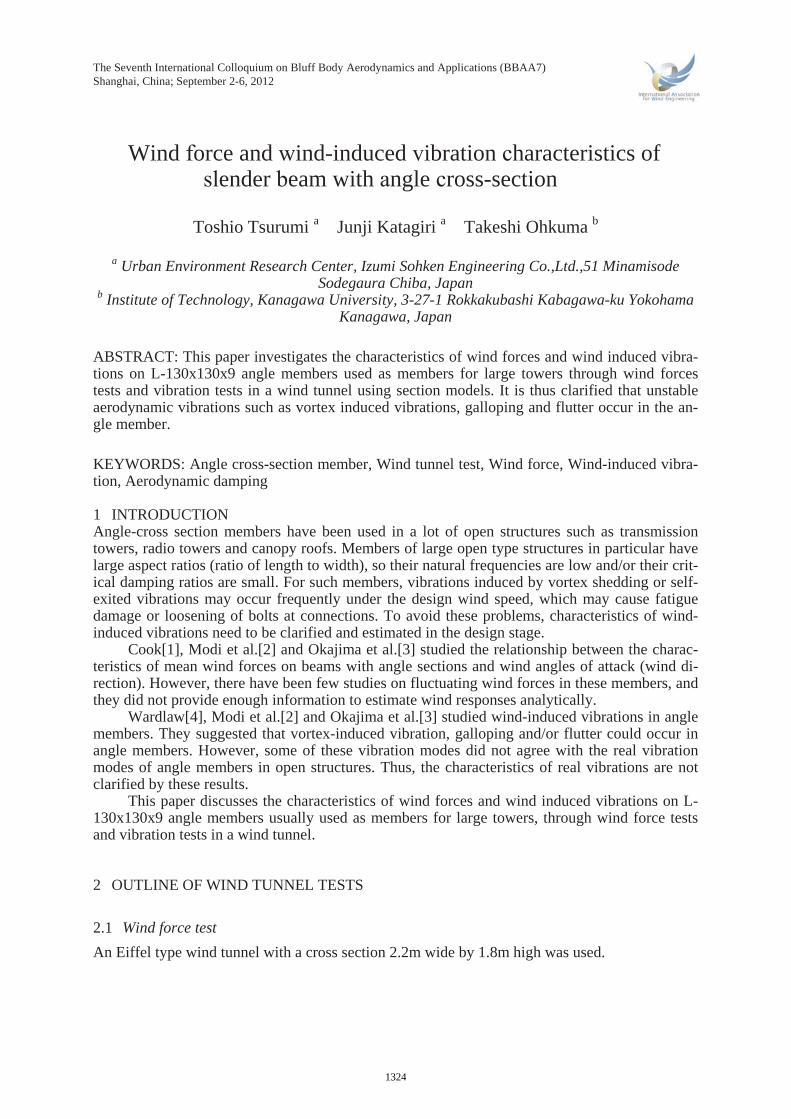
The section of the model used in this study was L-130x130x9, which was the same as that of a full-scale member. The model was 1m long with end plates 0.5m in diameter, as shown in Figure 1(a). Wind forces were obtained from simultaneous wind pressure measurements at 37 points set on the center of the span (see Figure 1(b)). Approaching wind flow was generated by a turbulence grid. The mean wind speed profiles were almost constant. The wind turbulence inten-sity was about 5% and the turbulence scale was 0.12m. Wind direction was defined as shown in Figure 2. Wind tunnel tests were carried out for wind directions from 45o to 225o taking the sec-tion’s symmetry into consideration. Wind speed was 4m/s. Sampling frequency of wind pressure was 500Hz and sampling length was 130seconds.
2.2 Vibration test
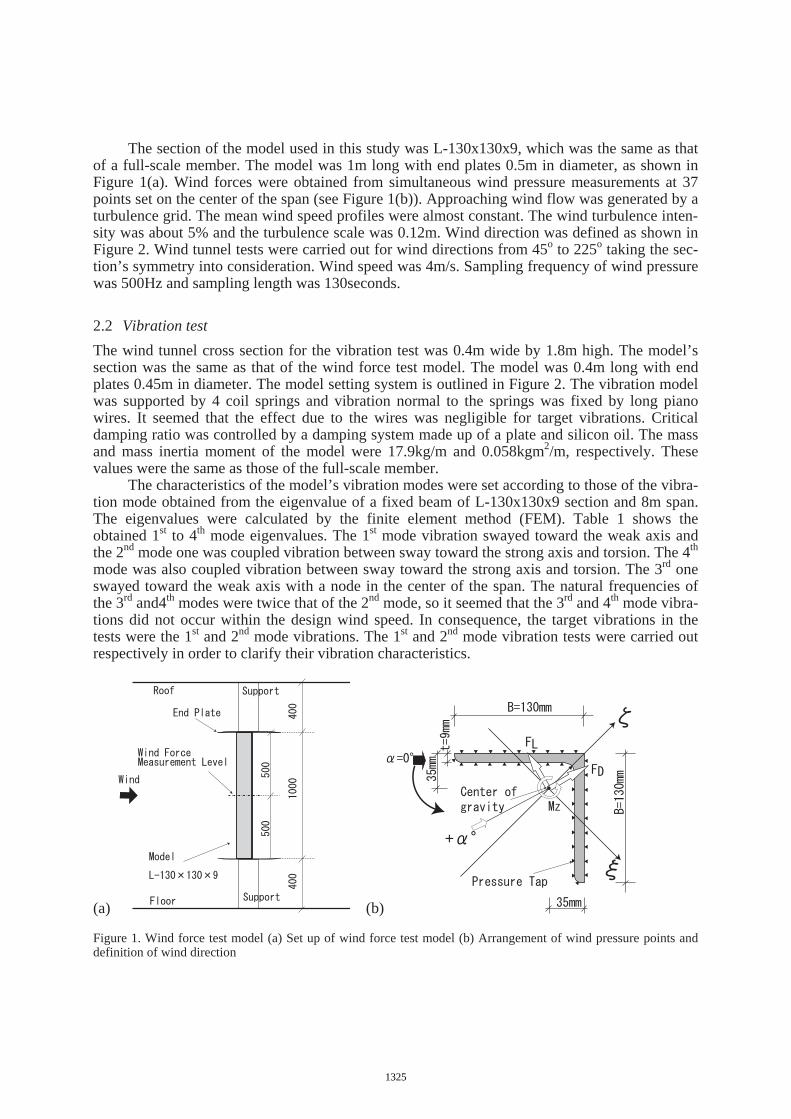
The wind tunnel cross section for the vibration test was 0.4m wide by 1.8m high. The model’s section was the same as that of the wind force test model. The model was 0.4m long with end plates 0.45m in diameter. The model setting system is outlined in Figure 2. The vibration model was supported by 4 coil springs and vibration normal to the springs was fixed by long piano wires. It seemed that the effect due to the wires was negligible for target vibrations. Critical damping ratio was controlled by a damping system made up of a plate and silicon oil. The mass and mass inertia moment of the model were 17.9kg/m and 0.058kgm2/m, respectively. These values were the same as those of the full-scale member.
The characteristics of the model’s vibration modes were set according to those of the vibra-tion mode obtained from the eigenvalue of a fixed beam of L-130x130x9 section and 8m span. The eigenvalues were calculated by the finite element method (FEM). Table 1 shows the obtained 1st to 4th mode eigenvalues. The 1st mode vibration swayed toward the weak axis and the 2nd mode one was coupled vibration between sway toward the strong axis and torsion. The 4th mode was also coupled vibration between sway toward the strong axis and torsion. The 3rd one swayed toward the weak axis with a node in the center of the span. The natural frequencies of the 3rd and4th modes were twice that of the 2nd mode, so it seemed that the 3rd and 4th mode vibra-tions did not occur within the design wind speed. In consequence, the target vibrations in the tests were the 1st and 2nd mode vibrations. The 1st and 2nd mode vibration tests were carried out respectively in order to clarify their vibration characteristics.
(a) (b) Figure 1. Wind force test model (a) Set up of wind force test model (b) Arrangement of wind pressure points and definition of wind direction
1325
The Seventh International Colloquium on Bluff Body Aerodynamics and Applications (BBAA7) Shanghai, China; September 2-6, 2012
(a) (b) Figure 2. Wind vibration test system (a) View from leeward side, (b) Side view
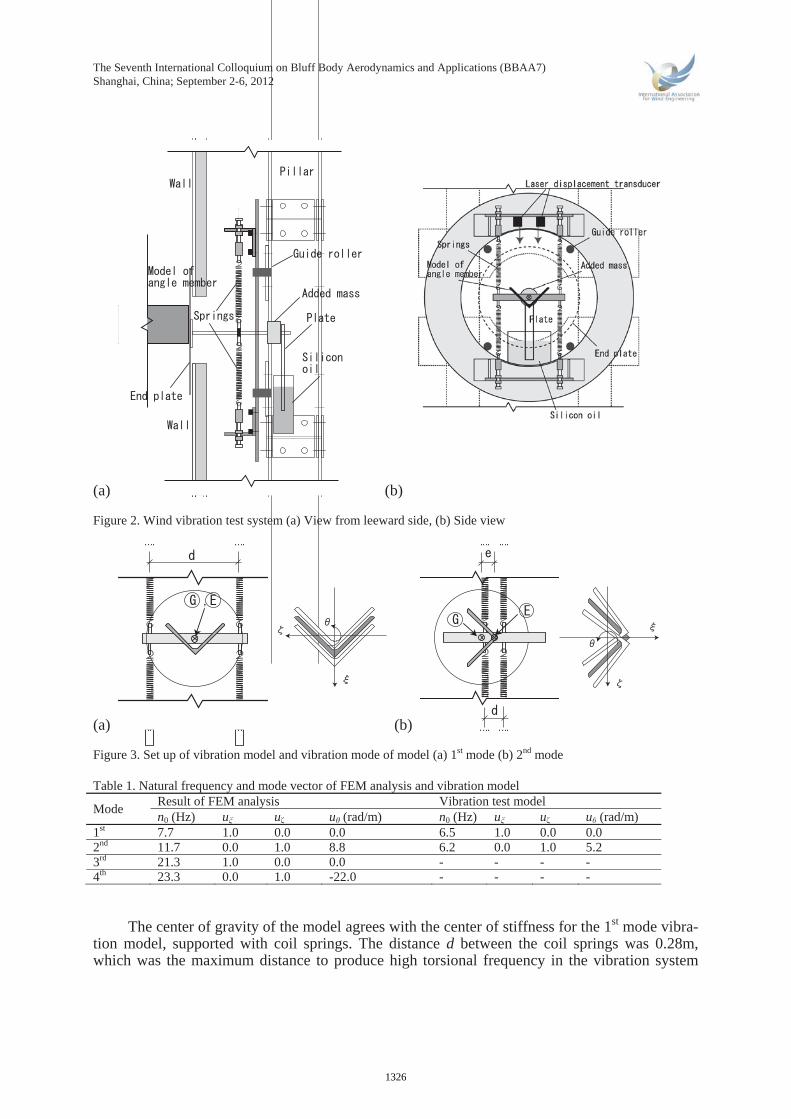
(a) (b) Figure 3. Set up of vibration model and vibration mode of model (a) 1st mode (b) 2nd mode
Table 1. Natural frequency and mode vector of FEM analysis and vibration model
Mode Result of FEM analysis Vibration test modeln0 (Hz) u u u (rad/m) n0 (Hz) u u u (rad/m)
1st 7.7 1.0 0.0 0.0 6.5 1.0 0.0 0.0 2nd 11.7 0.0 1.0 8.8 6.2 0.0 1.0 5.2 3rd 21.3 1.0 0.0 0.0 - - - - 4th 23.3 0.0 1.0 -22.0 - - - -
The center of gravity of the model agrees with the center of stiffness for the 1st mode vibra-
tion model, supported with coil springs. The distance d between the coil springs was 0.28m, which was the maximum distance to produce high torsional frequency in the vibration system
1326
(see Figure 3(a)). The resulting torsional frequency was 15Hz, being almost twice the 1st mode frequency. Therefore, it seemed that the effect of torsional vibration upon the 1st mode vibration was negligible.
The 2nd mode vibration test model was set such that the distance e between its center of gravity and center of stiffness was 0.042m, which was the same as the full-scale value. The dis-tance d between coil springs was 0.061m (see Figure 3(b)).
Figure 3 and Table 1 show the characteristics of the 1st and the 2nd mode vibrations for the section model, where u , u and u are the mode vectors for the weak axis, strong axis and rota-tion axis, respectively, and n0 is the modal natural frequency. For the 2nd modal vibration, the vector for the rotation axis was smaller than the target value. However, the characteristics of coupled vibration were evaluated accurately enough by the model.
The critical damping ratio of the model was adjusted by silicon oil and the number of plates submerged in silicon oil (see figure 2). The critical damping ratios in the experiments were ad-justed in the rage from 0.1% to 1%. The ratios were measured by free vibration tests in the no-wind condition. The experimental wind speed of the vibration tests were in the range from 3m/s to 20m/s. The model displacements were measured by two raiser displacement transducers at each end sides of the vibration system. The sampling frequency of displacement was 200Hz and the measurement time was 80 seconds for each case.
3 RESULTS OF WIND FORCE TEST AND DISSCUSSION
3.1 Characteristic of mean wind force coefficient
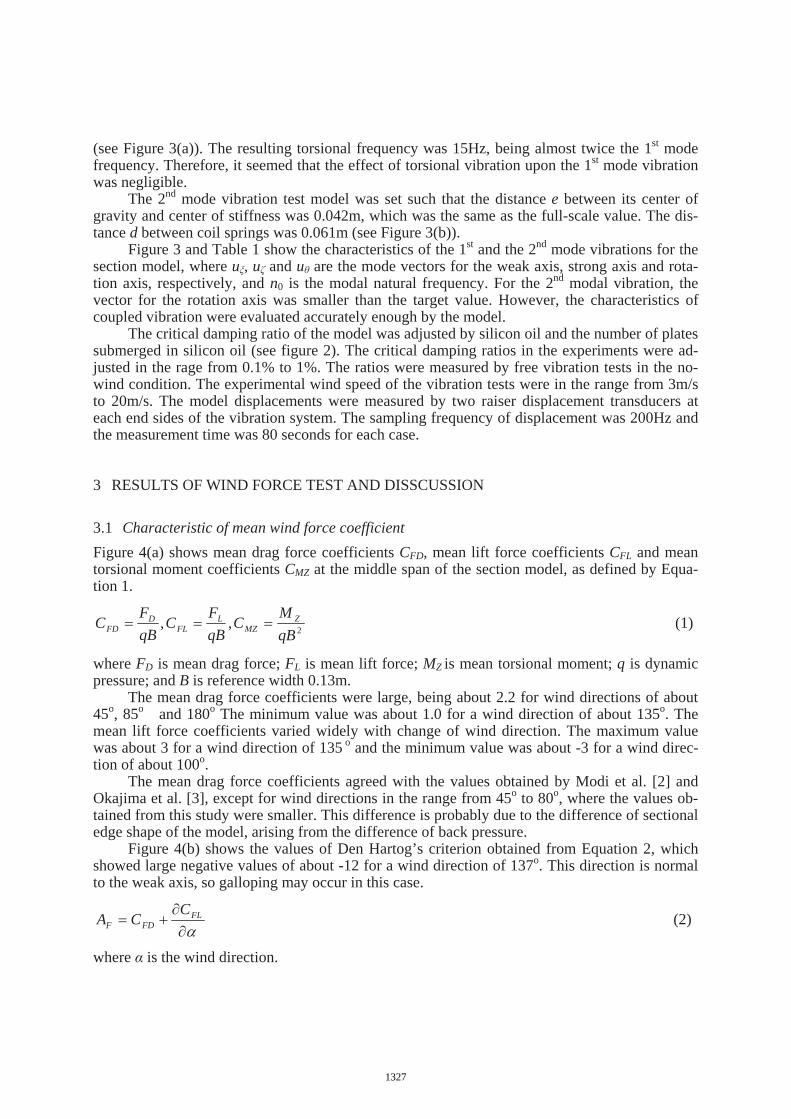
Figure 4(a) shows mean drag force coefficients CFD, mean lift force coefficients CFL and mean torsional moment coefficients CMZ at the middle span of the section model, as defined by Equa-tion 1.
2,,
qB
MC
qB
FC
qB
FC Z
MZL
FLD
FD (1)
where FD is mean drag force; FL is mean lift force; MZ is mean torsional moment; q is dynamic pressure; and B is reference width 0.13m.
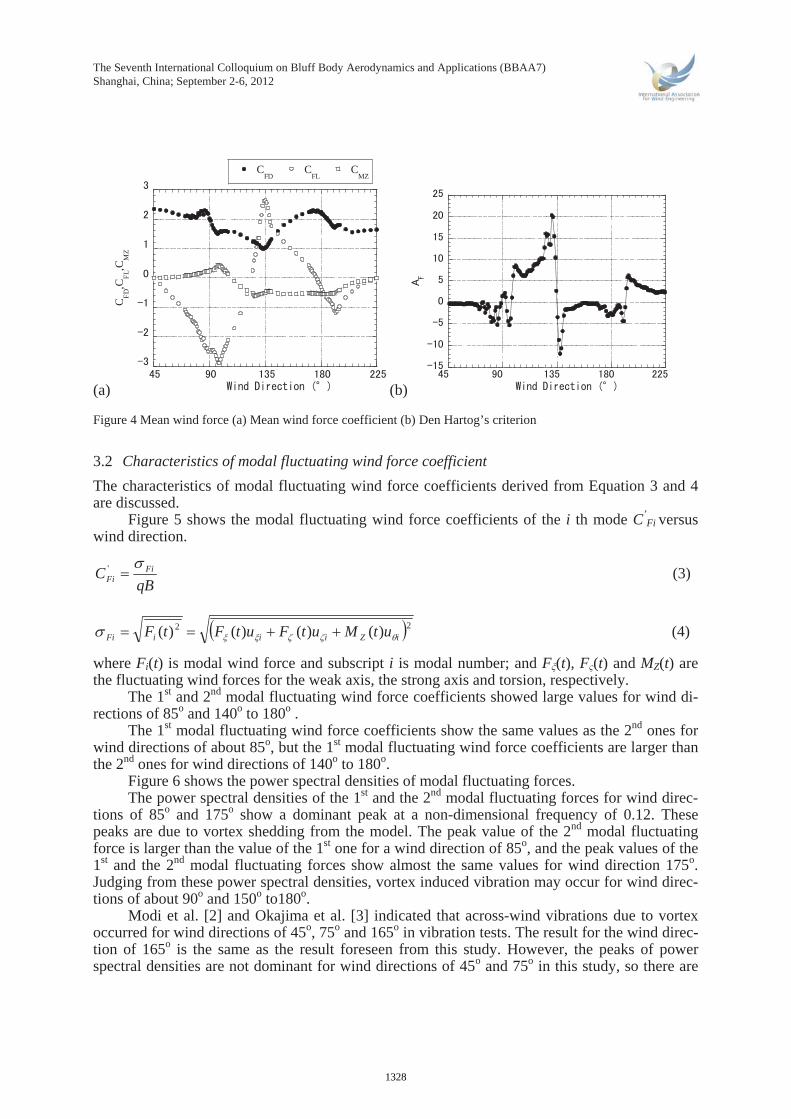
The mean drag force coefficients were large, being about 2.2 for wind directions of about 45o, 85o and 180o The minimum value was about 1.0 for a wind direction of about 135o. The mean lift force coefficients varied widely with change of wind direction. The maximum value was about 3 for a wind direction of 135 o and the minimum value was about -3 for a wind direc-tion of about 100o.
The mean drag force coefficients agreed with the values obtained by Modi et al. [2] and Okajima et al. [3], except for wind directions in the range from 45o to 80o, where the values ob-tained from this study were smaller. This difference is probably due to the difference of sectional edge shape of the model, arising from the difference of back pressure.
Figure 4(b) shows the values of Den Hartog’s criterion obtained from Equation 2, which showed large negative values of about -12 for a wind direction of 137o. This direction is normal to the weak axis, so galloping may occur in this case.
FLFDF
CCA (2)
where is the wind direction.
1327
The Seventh International Colloquium on Bluff Body Aerodynamics and Applications (BBAA7) Shanghai, China; September 2-6, 2012
(a)
CFD
CFL
CMZ
CF
D,C
FL,C
MZ
(b) Figure 4 Mean wind force (a) Mean wind force coefficient (b) Den Hartog’s criterion
3.2 Characteristics of modal fluctuating wind force coefficient
The characteristics of modal fluctuating wind force coefficients derived from Equation 3 and 4 are discussed.
Figure 5 shows the modal fluctuating wind force coefficients of the i th mode C’Fi versus
wind direction.
qBC Fi
Fi' (3)
22 )()()()( iZiiiFi utMutFutFtF (4)
where Fi(t) is modal wind force and subscript i is modal number; and F (t), F (t) and MZ(t) are the fluctuating wind forces for the weak axis, the strong axis and torsion, respectively.
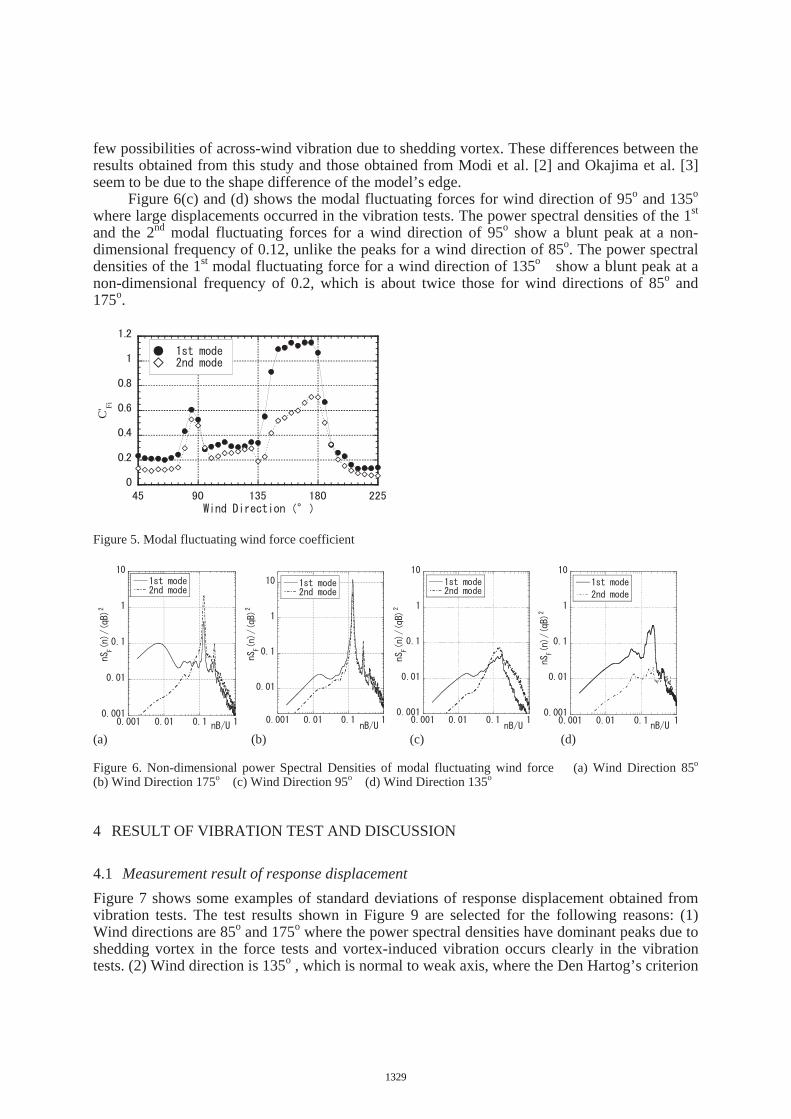
The 1st and 2nd modal fluctuating wind force coefficients showed large values for wind di-rections of 85o and 140o to 180o .
The 1st modal fluctuating wind force coefficients show the same values as the 2nd ones for wind directions of about 85o, but the 1st modal fluctuating wind force coefficients are larger than the 2nd ones for wind directions of 140o to 180o.
Figure 6 shows the power spectral densities of modal fluctuating forces. The power spectral densities of the 1st and the 2nd modal fluctuating forces for wind direc-
tions of 85o and 175o show a dominant peak at a non-dimensional frequency of 0.12. These peaks are due to vortex shedding from the model. The peak value of the 2nd modal fluctuating force is larger than the value of the 1st one for a wind direction of 85o, and the peak values of the 1st and the 2nd modal fluctuating forces show almost the same values for wind direction 175o. Judging from these power spectral densities, vortex induced vibration may occur for wind direc-tions of about 90o and 150o to180o.
Modi et al. [2] and Okajima et al. [3] indicated that across-wind vibrations due to vortex occurred for wind directions of 45o, 75o and 165o in vibration tests. The result for the wind direc-tion of 165o is the same as the result foreseen from this study. However, the peaks of power spectral densities are not dominant for wind directions of 45o and 75o in this study, so there are
1328
few possibilities of across-wind vibration due to shedding vortex. These differences between the results obtained from this study and those obtained from Modi et al. [2] and Okajima et al. [3] seem to be due to the shape difference of the model’s edge.
Figure 6(c) and (d) shows the modal fluctuating forces for wind direction of 95o and 135o where large displacements occurred in the vibration tests. The power spectral densities of the 1st and the 2nd modal fluctuating forces for a wind direction of 95o show a blunt peak at a non-dimensional frequency of 0.12, unlike the peaks for a wind direction of 85o. The power spectral densities of the 1st modal fluctuating force for a wind direction of 135o show a blunt peak at a non-dimensional frequency of 0.2, which is about twice those for wind directions of 85o and 175o.
C' F
i
Figure 5. Modal fluctuating wind force coefficient
(a) (b) (c) (d) Figure 6. Non-dimensional power Spectral Densities of modal fluctuating wind force (a) Wind Direction 85o (b) Wind Direction 175o (c) Wind Direction 95o (d) Wind Direction 135o
4 RESULT OF VIBRATION TEST AND DISCUSSION
4.1 Measurement result of response displacement
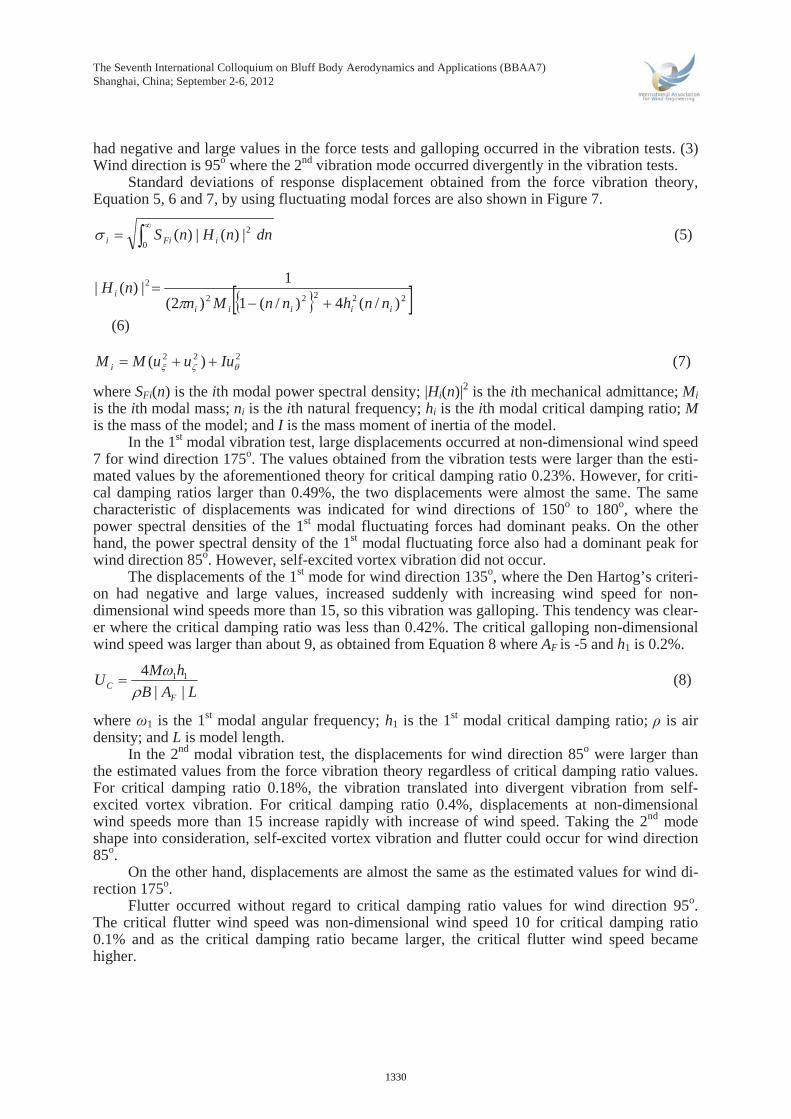
Figure 7 shows some examples of standard deviations of response displacement obtained from vibration tests. The test results shown in Figure 9 are selected for the following reasons: (1) Wind directions are 85o and 175o where the power spectral densities have dominant peaks due to shedding vortex in the force tests and vortex-induced vibration occurs clearly in the vibration tests. (2) Wind direction is 135o , which is normal to weak axis, where the Den Hartog’s criterion
1329
The Seventh International Colloquium on Bluff Body Aerodynamics and Applications (BBAA7) Shanghai, China; September 2-6, 2012
had negative and large values in the force tests and galloping occurred in the vibration tests. (3) Wind direction is 95o where the 2nd vibration mode occurred divergently in the vibration tests.
Standard deviations of response displacement obtained from the force vibration theory, Equation 5, 6 and 7, by using fluctuating modal forces are also shown in Figure 7.
0
2|)(|)( dnnHnS iFii (5)
22222
2
)/(4)/(1)2(
1|)(|
iiiii
innhnnMn
nH
(6)
222 )( IuuuMM i (7)
where SFi(n) is the ith modal power spectral density; |Hi(n)|2 is the ith mechanical admittance; Mi is the ith modal mass; ni is the ith natural frequency; hi is the ith modal critical damping ratio; M is the mass of the model; and I is the mass moment of inertia of the model.
In the 1st modal vibration test, large displacements occurred at non-dimensional wind speed 7 for wind direction 175o. The values obtained from the vibration tests were larger than the esti-mated values by the aforementioned theory for critical damping ratio 0.23%. However, for criti-cal damping ratios larger than 0.49%, the two displacements were almost the same. The same characteristic of displacements was indicated for wind directions of 150o to 180o, where the power spectral densities of the 1st modal fluctuating forces had dominant peaks. On the other hand, the power spectral density of the 1st modal fluctuating force also had a dominant peak for wind direction 85o. However, self-excited vortex vibration did not occur.
The displacements of the 1st mode for wind direction 135o, where the Den Hartog’s criteri-on had negative and large values, increased suddenly with increasing wind speed for non-dimensional wind speeds more than 15, so this vibration was galloping. This tendency was clear-er where the critical damping ratio was less than 0.42%. The critical galloping non-dimensional wind speed was larger than about 9, as obtained from Equation 8 where AF is -5 and h1 is 0.2%.
LAB
hMU
FC ||
4 11 (8)
where 1 is the 1st modal angular frequency; h1 is the 1st modal critical damping ratio; is air density; and L is model length.
In the 2nd modal vibration test, the displacements for wind direction 85o were larger than the estimated values from the force vibration theory regardless of critical damping ratio values. For critical damping ratio 0.18%, the vibration translated into divergent vibration from self-excited vortex vibration. For critical damping ratio 0.4%, displacements at non-dimensional wind speeds more than 15 increase rapidly with increase of wind speed. Taking the 2nd mode shape into consideration, self-excited vortex vibration and flutter could occur for wind direction 85o.
On the other hand, displacements are almost the same as the estimated values for wind di-rection 175o.
Flutter occurred without regard to critical damping ratio values for wind direction 95o. The critical flutter wind speed was non-dimensional wind speed 10 for critical damping ratio 0.1% and as the critical damping ratio became larger, the critical flutter wind speed became higher.
1330
(a)
(b) Figure 7. Results of standard deviations of response displacement form vibration test (a) 1st mode vibration, (b) 2nd mode vibration
4.2 Aerodynamic damping ratio
The vibration test suggested that galloping for wind direction 135o in the 1st mode occurred and flutter for wind direction 95o in the 2nd mode occurred. We discuss aerodynamic damping ratios estimated by the random decrement method (RD method) for these wind directions. However, these power spectral densities of fluctuating wind forces had a peak because the shedding vortex added a peak of components of natural frequency. Therefore, the time series obtained from the RD method is approximated by Equation 9. Equation 9 gives equivalent modal damping ratio, so aerodynamic damping ratio was one that was deducted from the critical damping ratio of the model from the equivalent modal damping ratio.
1331
The Seventh International Colloquium on Bluff Body Aerodynamics and Applications (BBAA7) Shanghai, China; September 2-6, 2012
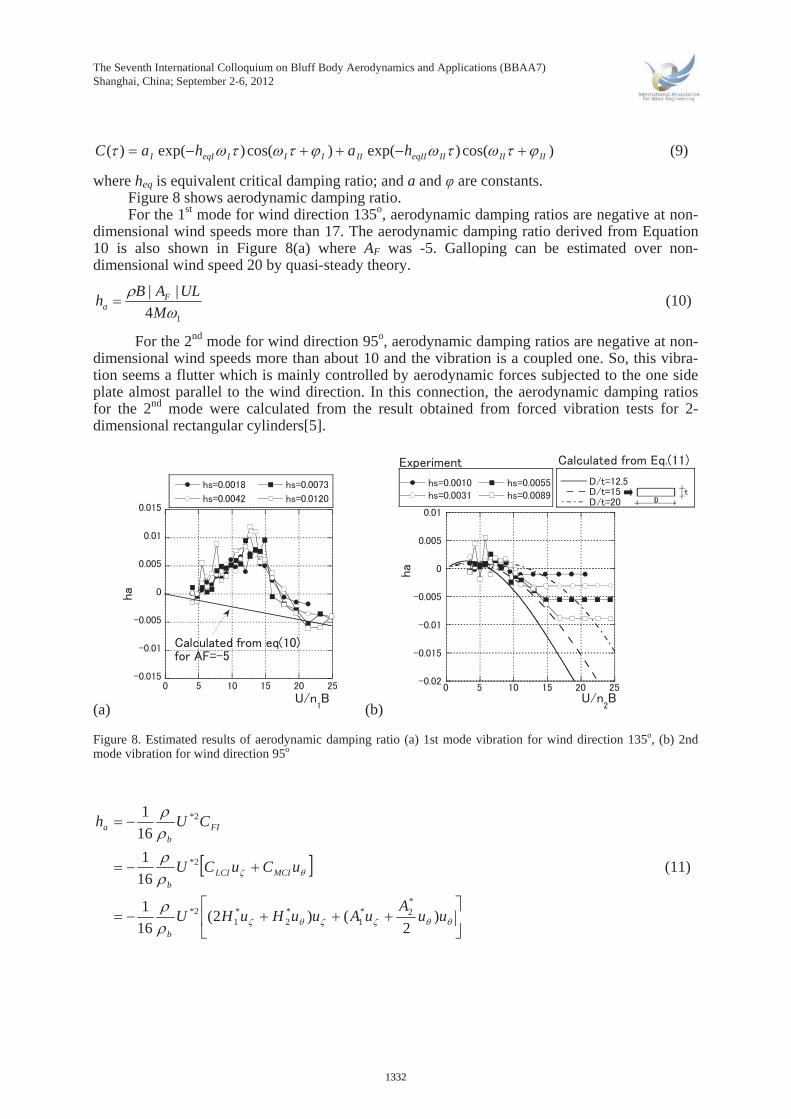
)cos()exp()cos()exp()( IIIIIIeqIIIIIIIeqII hahaC (9)
where heq is equivalent critical damping ratio; and a and are constants. Figure 8 shows aerodynamic damping ratio. For the 1st mode for wind direction 135o, aerodynamic damping ratios are negative at non-
dimensional wind speeds more than 17. The aerodynamic damping ratio derived from Equation 10 is also shown in Figure 8(a) where AF was -5. Galloping can be estimated over non-dimensional wind speed 20 by quasi-steady theory.
14
||
M
ULABh F
a (10)
For the 2nd mode for wind direction 95o, aerodynamic damping ratios are negative at non-dimensional wind speeds more than about 10 and the vibration is a coupled one. So, this vibra-tion seems a flutter which is mainly controlled by aerodynamic forces subjected to the one side plate almost parallel to the wind direction. In this connection, the aerodynamic damping ratios for the 2nd mode were calculated from the result obtained from forced vibration tests for 2-dimensional rectangular cylinders[5].
(a) (b) Figure 8. Estimated results of aerodynamic damping ratio (a) 1st mode vibration for wind direction 135o, (b) 2nd mode vibration for wind direction 95o
uuA
uAuuHuHU
uCuCU
CUh
b
MCILCIb
FIb
a
)2
()2(16
1
16
1
16
1
*2*
1*2
*1
2*
2*
2*
(11)
1332
where CFI is out-of-phase component of unsteady aerodynamic force coefficient (motion-induced force coefficient); CLCI and CMCI are unsteady lift force coefficient and unsteady torsional mo-ment coefficient during coupled vibration, respectively; H1
*, H2*, A1
* and A2* are aerodynamic
derivatives[5]; U*=U/ 2b; b=D/2; and D is depth of rectangular cylinder. Figure 8(b) shows the aerodynamic damping ratio obtained from vibration tests and the re-
sult derived from Equation 11. The test result is in good agreement with the values obtained from Equation 11 where the ratio of width to thickness of a plate is 15. The ratio of width to thick-ness(t:see Figure 1) of one side plate of the angle model is 14.4. Therefore, it seems that the vi-brations are due to the same factor as that causing plate flutter.
5 CONCLUSIONS
This study investigated the characteristics of wind forces and wind-induced vibrations on L-130x130x9 angle member usually used as members for large towers, through wind force tests and vibration tests in a wind tunnel. (1) In the 1st mode vibration, the self-excited vortex vibration occurs at non-dimensional wind
speed 7 for wind direction 175o. For wind direction 135o, galloping occurs in the case of low critical damping ratios at non-dimensional wind speed over 15.
(2) In the 2nd mode vibration, the self-excited vortex vibration occurs at non-dimensional wind speed 7 for wind direction 85o. For wind direction 95o, flutter occurs for more than non-dimensional wind speed 10 without regard to critical damping ratio values.
6 REFERENCES
[1] Cook., N.J., The designer’s guide to wind loading of building structures Part 2 Static structures, BRE press [2] Modi, V.J., Slater, J.E., Unsteady aerodynamics and vortex induced aeroelastic instability of a structural angle
section, Journal of Wind Engineering and Industrial Aerodynamics, 11(1983) 321-334 [3] Okajuna, A., Ueno, H., Nishi, T., Harada, H., Yano, K., Uno, T., Study on aeroelastic characteristics and
aeroelastic instability of structural L-shaped, T-shaped and cross-shaped section, 12th National Symposium of Wind Engineering, 149-154 (in Japanese)
[4] Wardlaw, R.L., Wind-induced vibrations of slender beams with angle cross-sections, Wind Effects on Buildings and Structures, 1967, 739-772
[5] Matsumoto, M., Kobayashi, Y., Niihata, Y., Shirato, H., Hamasaki, H., Flutter mechanism and its stabilization of bluff bodied, Proceeding of 9th ICWE, 1995, 827-838
1333