Embed Size (px)
Citation preview

UNIVERSITY of CALIFORNIA
COOPERATIVE EXTENSION
Forage Production Strategies
with Limited Water Supplies2015 Kearney Alfalfa and Forage Field Day
Parlier, CA September 18, 2015
Blake Sanden – Irrigation & Agronomy, Kern County
Dan Putnam – Chief of Comic Relief
Blaine Hanson – Irrigation Specialist, UC Davis

California is not
building more dams.
Meeting increased
water demand is going
to come through
conservation and
shifting water supply to
“higher value” uses.
Why would anyone
come up with such a
hair-brained idea?
Forage Production
with Reduced Water

Irrigated Acreage
& Water Demand
in California
1970 to 2000
Kern County
Population
increase of 10
million in 30 years
Year 1970 2000Total Irrigation (MAc): 8.7 9.6
Gravity 7.2 5.1
Sprinkler 1.5 2.8
Micro 0.0 1.7
Ag demand (MAF): 26.0 25.0
Avg Water Cost ($/ac-ft): $18 $85
Population: 25.1 35.4
Municipal demand (MAF): 5.0 6.4
Ag Demand/Total: 84% 80%
Ag Demand (ac-ft/ac): 3.00 2.60
Ag Savings (%): Base 13%

This is your
forage.
Forage Production with Reduced Water
First: a public service message …

This is your forage
on reduced water.
Forage Production with Reduced Water

I’m
screwed!
Forage Production with Reduced Water
Any questions?

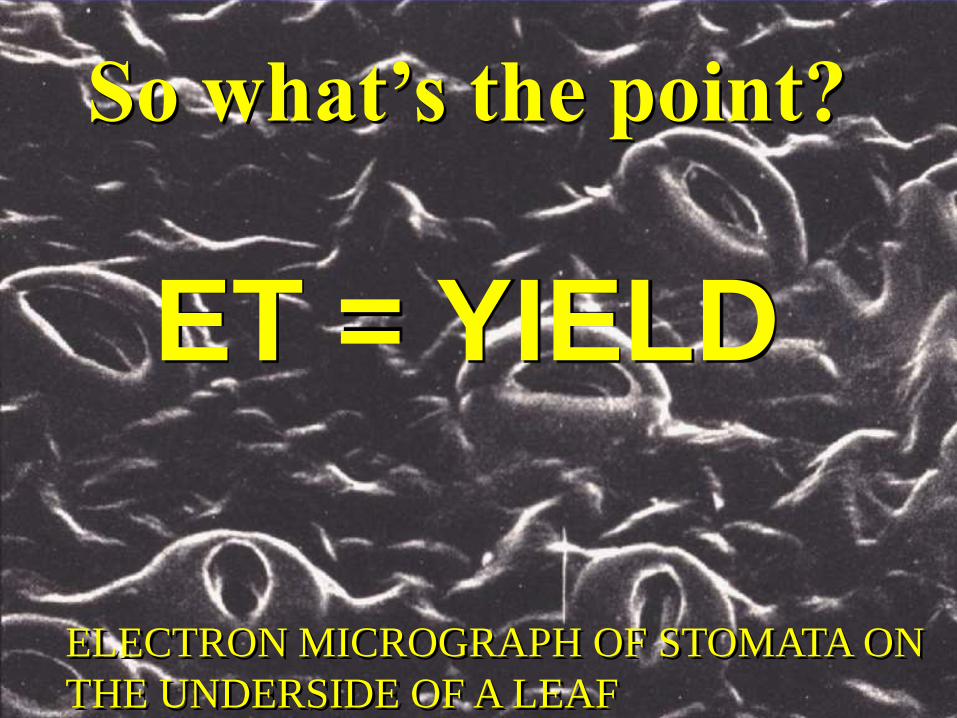
ELECTRON MICROGRAPH OF STOMATA ON
THE UNDERSIDE OF A LEAF.
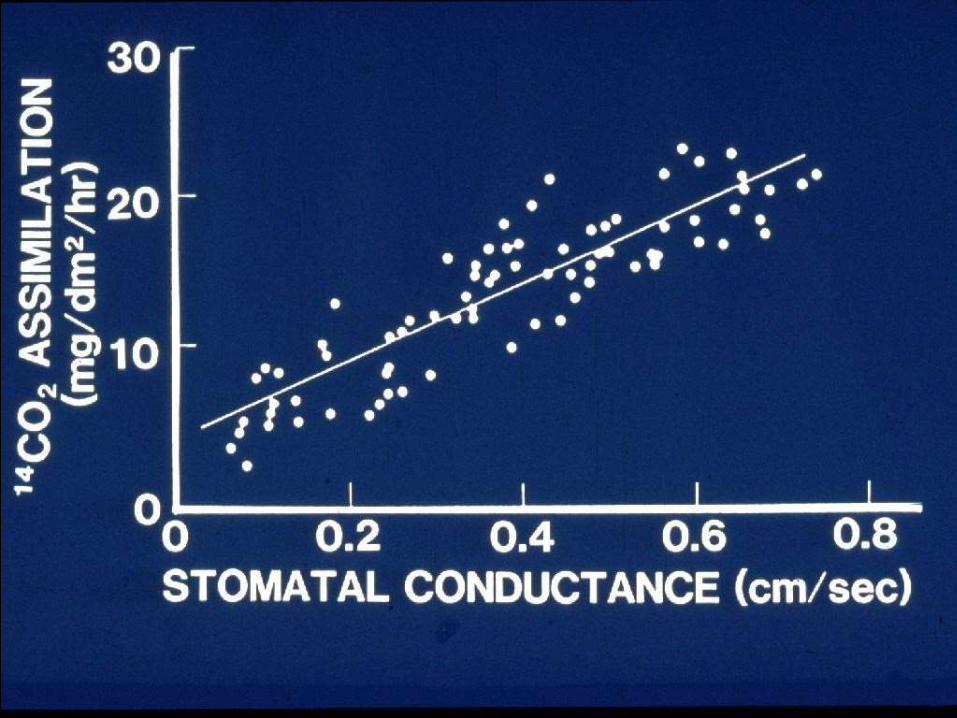
WHY YOU ARE SCREWED:
Reduced water, deficit irrigation, causes less turgor
pressure in the plant, reduces the size of stomatal
openings; thus decreasing the uptake of carbon dioxide
and reducing vegetative growth.

Google (images):
“statewide alfalfa water demand”
Here’s what you come
up with – the thirstiest
guy on the planet!
At least he found his boat
when the reservoir went dry!

Annual alfalfa water demand: 4 to 5.5 MAC
(Source: California Department of Water Resources,
above figure from Pacific Institute 2012)

The irrigation method / system is the
“ESSENTIAL” integrating factor for
California farming.
TOPOGRAPHY
TEXTURE
INFILTRATION RATE
DRAINAGE
SALTS / QUALITY
AMENDMENTS / COST
TOPOGRAPHY
TEXTURE
INFILTRATION RATE
DRAINAGE
SALTS / QUALITY
AMENDMENTS / COST
LIFE CYCLE & WATER USE (ET)
ROOTING CHARACTERISTICS
DESIRED STRUCTURE / SPACING
HARVEST REQUIREMENTS
FIELD TRAFFIC
LIFE CYCLE & WATER USE (ET)
ROOTING CHARACTERISTICS
DESIRED STRUCTURE / SPACING
HARVEST REQUIREMENTS
FIELD TRAFFIC
SOURCE / SUPPLY
SALTS / QUALITY
REQUIRED AMENDMENTS
COST
SOURCE / SUPPLY
SALTS / QUALITY
REQUIRED AMENDMENTS
COST
IRRIGATION METHOD
DISTRIBUTION PATTERN
IRRIGATION FREQUENCY
MONITORING
MAINTENANCE / REPAIR
OPERATING COST
CAPITAL COST
IRRIGATION METHOD
DISTRIBUTION PATTERN
IRRIGATION FREQUENCY
MONITORING
MAINTENANCE / REPAIR
OPERATING COST
CAPITAL COST
System
Crop
Soil
Water
TOPOGRAPHY
TEXTURE
INFILTRATION RATE
DRAINAGE
SALTS / QUALITY
AMENDMENTS / COST
TOPOGRAPHY
TEXTURE
INFILTRATION RATE
DRAINAGE
SALTS / QUALITY
AMENDMENTS / COST
LIFE CYCLE & WATER USE (ET)
ROOTING CHARACTERISTICS
DESIRED STRUCTURE / SPACING
HARVEST REQUIREMENTS
FIELD TRAFFIC
LIFE CYCLE & WATER USE (ET)
ROOTING CHARACTERISTICS
DESIRED STRUCTURE / SPACING
HARVEST REQUIREMENTS
FIELD TRAFFIC
SOURCE / SUPPLY
SALTS / QUALITY
REQUIRED AMENDMENTS
COST
SOURCE / SUPPLY
SALTS / QUALITY
REQUIRED AMENDMENTS
COST
IRRIGATION METHOD
DISTRIBUTION PATTERN
IRRIGATION FREQUENCY
MONITORING
MAINTENANCE / REPAIR
OPERATING COST
CAPITAL COST
IRRIGATION METHOD
DISTRIBUTION PATTERN
IRRIGATION FREQUENCY
MONITORING
MAINTENANCE / REPAIR
OPERATING COST
CAPITAL COST
SystemSystem
CropCrop
SoilSoil
WaterWater
California crops sit
most firmly on a
chair with 4 legs!
California crops sit
most firmly on a
chair with 4 legs!

4 3-point sermon:
• Understanding soil water holding
characteristics
• Crop water requirements (ET), CIMIS
• Monitoring soil moisture & irrigation
uniformity
• Forage crop salinity tolerance
Forage Production with Reduced Water
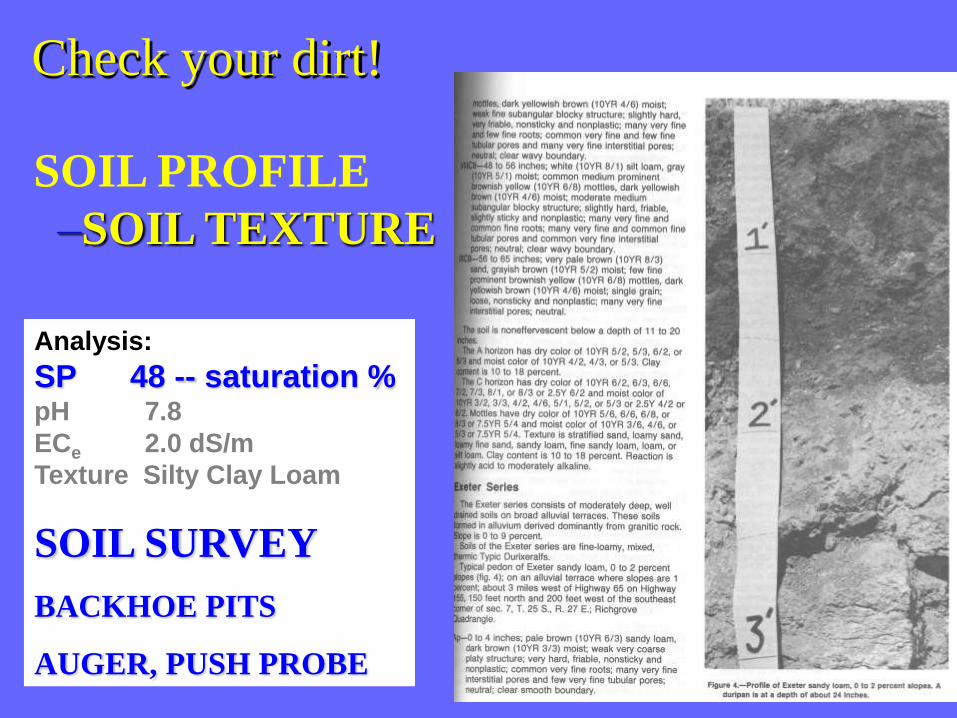
SOIL PROFILE
–SOIL TEXTURE
Analysis:
SP 48 -- saturation %pH 7.8
ECe 2.0 dS/m
Texture Silty Clay Loam
SOIL SURVEY
BACKHOE PITS
AUGER, PUSH PROBE
Boron Leaching Curve(Hoffman, 1980)
Check your dirt!

Backhoe Pits –
the Worm’s
Eye View!

Check your dirt! It
has more secrets
than the CIA.

The “dirt” is the thing. Know your soil!
Soil Texture
Field
Capacity
(in/ft)
Wilting Point
(in/ft)
Available
Soil Moisture
(in/ft)
Avg Drip
Subbing
Diameter
from 1 to 4'
Depth (ft)
*Moisture
Reserve
(gals)
Sand 1.2 0.5 0.7 2 4
Loamy Sand 1.9 0.8 1.1 3 16
Sandy Loam 2.5 1.1 1.4 4 35
Loam 3.2 1.4 1.8 5 70
Silt Loam 3.6 1.8 1.8 6 102
Sandy Clay Loam 3.5 2.2 1.3 7 100
Sandy Clay 3.4 1.8 1.6 7 123
Clay Loam 3.8 2.2 1.7 8 170
Silty Clay Loam 4.3 2.4 1.9 9 241
Silty Clay 4.8 2.4 2.4 9 305
Clay 4.8 2.6 2.2 10 345
*This is the maximum gallons of water stored to a 4' depth beneath a single drip emitter. In fine
textured soils, the wetted volume of one emitter merges with another on the same hose and final
gallons of moisture reserve per emitter will be less than the number shown in the table. Plant
stress will usually be seen when about 50% of this reserve has been used.
Ref: Ratliff LF, Ritchie JT, Cassel DK. 1983. Field-measured limits of soil water availab ility as related
to laboratory-measured properties. Soil Sci Soc Am. 47:770-5.

So what’s the big deal with about
monitoring soil moisture? Doesn’t
the field always take in the same
amount of water?
One answer:
Each field, crop, climate and grower has
unique characteristics. The majority of acreage
in CA is still flood irrigated. Infiltration is often
uncertain – maybe 1.5 inches up to 12 inches
depending on the mix of soil and water
chemistry.

Many Class I sandy loam soils
planted to almonds in Kern
County have water penetration
problems due to low aggregate
stability from loss of clays at
the surface and irrigation with
extremely low salinity water.

0
1
2
3
4
5
6
0 3 6 9 12 15 18 21 24
Cu
mu
lati
ve
In
filt
ra
tio
n (
in)
Time (hrs)
6/16
6/25
7/20
8/4-Gypsum
COMBINED
CRUSTING AND
DISPERSION
AFTER LAYBY
IN COTTON
After layby
cultivation
infiltration over a
12 hour set went
from 4.3” to 0.4”
from 6/16 to
7/20/96. Water run
gypsum on 8/4
improved
infiltration to 1.3”.
Wasco Sandy Loam (Shafter Field Station)

3-point sermon:
• Understanding soil water holding
characteristics
• Crop water requirements (ET),
CIMIS
• Monitoring soil moisture, & irrigation
uniformity
Forage Production with Reduced Water
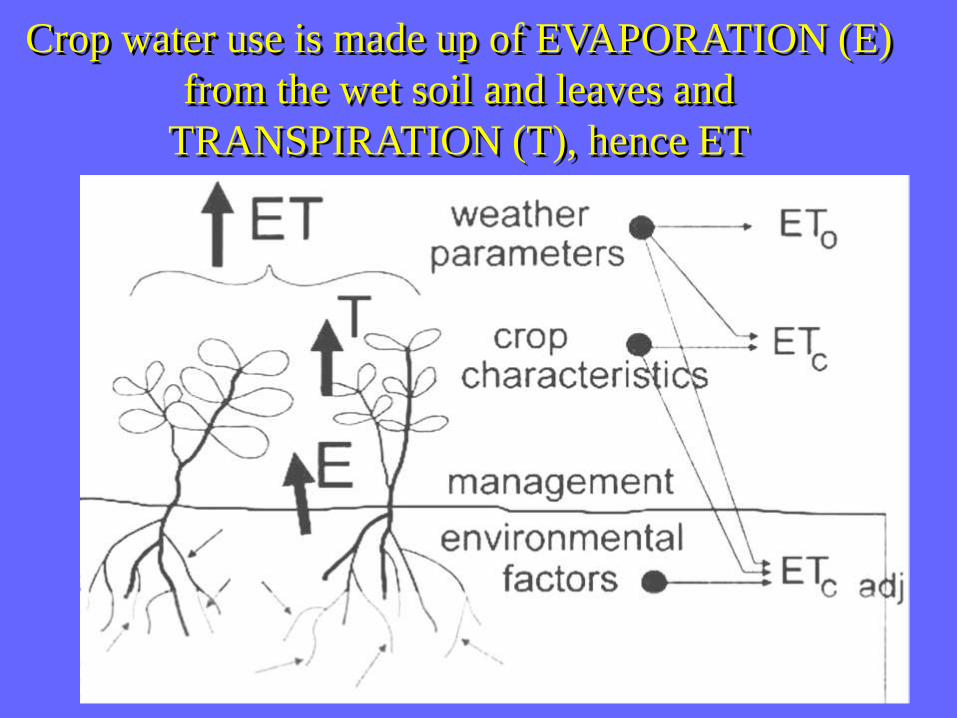
Crop water use is made up of EVAPORATION (E)
from the wet soil and leaves and
TRANSPIRATION (T), hence ET

Courtesy of Mark Anderson, DWR
CALIFORNIA IRRIGATION
MANAGEMENT INFORMATION
SERVICE

Courtesy of Mark Anderson, DWR
CIMIS station
locations around
California as of 2002
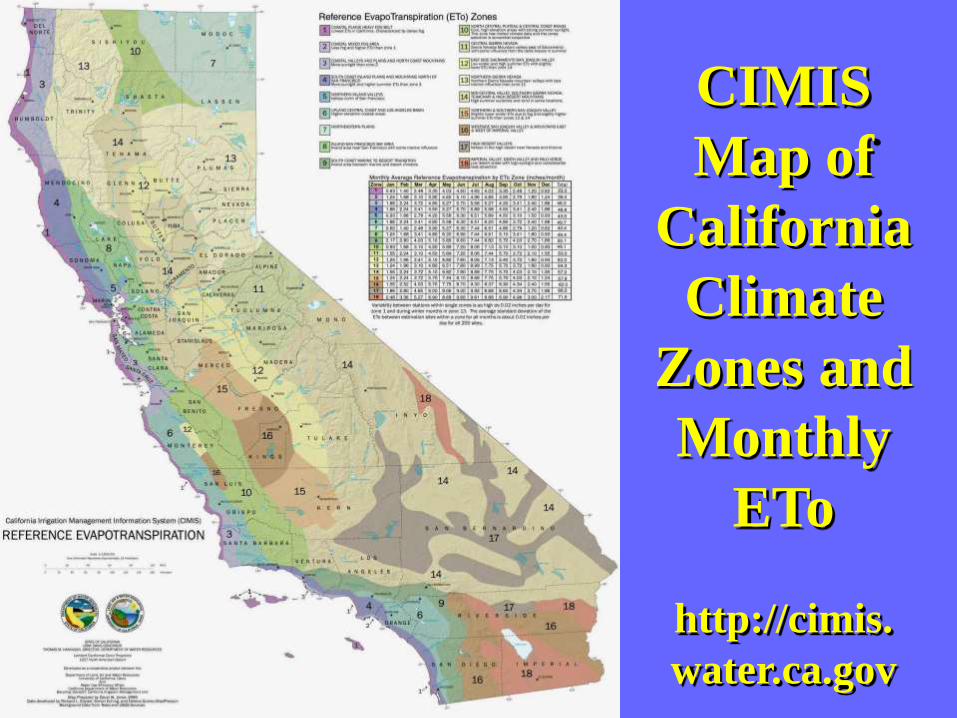
CIMIS
Map of
California
Climate
Zones and
Monthly
ETo
http://cimis.
water.ca.gov

The whole Central
Valley covers Zones
12 to 16: for an
“normal year” ETo
of 53.3 to 62.5 in/yr,
with most area
@ 53 to 58 inches.

Calculating ET for crops:
ETcrop = ETo * Kc * Ef
ETo = reference crop (tall grass) ET
Kc = crop coefficient for a given stage of growth
as a ratio of grass water use. May be 0 to 1.3,
standard values are good starting point.
Ef = an “environmental factor” that can account
for immature permanent crops and/or impact of
salinity. May be 0.1 to 1.1, determined by site.

"Normal Year" grass potential evapotranspiration (ETo), forage
crop coefficients and ET for the southern San Joaquin Valley
Pasture
DATE
*ETo
(inch)2Alfalfa
Silage
4/1-8/25
Silage
6/15-10/153Sudan
Winter
Forage
Triple
Crop2Alfalfa
Silage
4/1-8/25
Silage
6/15-10/153Sudan
Winter
Forage
Triple
Crop
1/15 0.54 0.95 0.62 0.62 0.51 0.33 0.33
2/1 0.70 0.95 0.80 0.80 0.67 0.56 0.56
2/15 0.98 0.95 0.95 0.95 0.93 0.93 0.93
3/1 1.26 0.95 1.15 1.15 1.20 1.45 1.45
3/15 1.64 0.95 1.15 1.15 1.56 1.89 1.89
4/1 2.08 0.95 Plant 1.20 1.20 1.98 1.04 2.50 2.50
4/15 2.55 0.95 0.14 1.20 Silage90 2.42 0.35 3.06 1.28
5/1 3.15 0.95 0.18 Plant 1.15 0.14 2.99 0.55 1.58 3.62 0.44
5/15 3.50 0.95 0.31 0.58 0.22 3.33 1.09 2.03 0.77
6/1 3.79 0.95 0.94 Plant 0.80 0.45 3.60 3.55 1.90 3.03 1.71
6/15 4.00 0.95 1.14 0.14 0.95 1.00 3.80 4.55 0.55 3.80 4.00
7/1 4.25 0.95 1.18 0.25 1.05 1.10 4.04 5.02 1.06 4.46 4.68
7/15 4.35 0.95 1.18 0.56 1.10 1.20 4.13 5.13 2.45 4.79 5.22
8/1 4.33 0.95 1.15 1.00 1.10 Sudan 4.11 4.98 4.33 4.76 2.17
8/15 4.11 0.95 1.06 1.15 0.60 0.60 3.90 4.36 4.72 2.46 2.46
9/1 3.64 0.95 0.98 1.20 1.10 0.90 3.46 3.55 4.37 4.01 3.28
9/15 3.10 0.95 1.20 1.10 1.05 2.95 3.72 3.41 3.26
10/1 2.70 0.95 1.06 0.60 1.10 2.57 2.87 1.62 2.97
10/15 2.20 0.95 0.98 1.10 0.60 2.09 2.16 2.42 1.32
11/1 1.73 0.95 1.10 1.10 1.65 1.91 1.91
11/15 1.20 0.95 1.00 Plant TriGrain 1.14 1.20 0.60 0.60
12/1 0.88 0.95 0.25 0.25 0.84 0.22 0.22
12/15 0.70 0.95 0.36 0.36 0.67 0.25 0.25
12/31 0.52 0.95 0.52 0.52 0.49 0.27 0.27
TOTALS 57.90 55.01 34.18 28.12 41.47 15.68 44.45
2Kc of 0.95 takes into account reduced ET during cuttings over season.
3Total of 3 cuttings. ET reduced for 1 to 2 weeks after cutting 7/15 and 9/1.
4ET numbers in italics are evaporation losses from water at planting.
4Normal Year Crop ET (inches)
1Adapted from Pruitt, W.O., E. Fereres, K. Kaita, and R.L. Snyder. 1987. "Reference Evapotranspiration (ETo) for California." UC Bull. 1922. Pp.
12-13.
1Crop Coefficient Values (Kc)
*Jones, D.W., R.L. Snyder, S. Eching and H. Gomez-McPherson. 1999. California Irrigation Management Information System (CIMIS) Reference
Evapotranspiration. Climate zone map, Dept. of Water Resources, Sacramento, CA.

Normal Year Alfalfa ET (dips indicate cutting schedule)
Weekly Normal Year ETo & Alfalfa ET
for the Southern San Joaquin Valley
(Non-dormant, cut every 28 days.)
0.0
0.5
1.0
1.5
2.0
2.5
12/31 1/28 2/25 3/24 4/21 5/19 6/16 7/14 8/11 9/8 10/6 11/3 12/1 12/29
Weekly
ET
(in
)
Pasture (ETo): 57.9 in
Weekly Alfalfa ET: 55.1 in
Forage Production with Reduced Water
ELECTRON MICROGRAPH OF STOMATA ON
THE UNDERSIDE OF A LEAF
So what’s the point?
ET = YIELD

San Joaquin Valley Alfalfa Tonnage & ET
Avg Annual t/ac = 0.2 (Inches ET) - 0.6
0
2
4
6
8
10
12
14
16
0 10 20 30 40 50 60
Alfalfa ET (in)
YIe
ld (
t/a
c)
Alfalfa Yield/ET Production Functions for Various Regions
Forage Production with Reduced Water

Production Functions for …
Record Yuma, AZ: 24.1 t/ac @ 151 inches
Typical Tulelake: 6 ton production
Tulelake Alfalfa Tonnage & Applied Water
Annual t/ac = -0.00034(Irrig)3 + 0.00941(Irrig)
2
+ 0.178(Irrig) + 1.2030
1
2
3
4
5
6
7
0 10 20 30 40
Applied Water (in)
YIe
ld (
t/a
c)
Annual t/ac = -0.0000511(Irrig)3 +
0.0155024(Irrig)2 - 1.275(Irrig) + 37.96
R2 = 0.989
0
4
8
12
16
20
24
28
50 75 100 125 150 175
Applied Water (in)
YIe
ld (
t/a
c)
Mesa Sirsa
Lew
Poly. (Mesa
Sirsa)
Record Yuma Alfalfa Tonnage & Applied Water
Forage Production with Reduced Water
Yuma: 140 / 23 = 6.1inch/ton Tulelake: 25 / 6.2 = 4.0 inch/ton
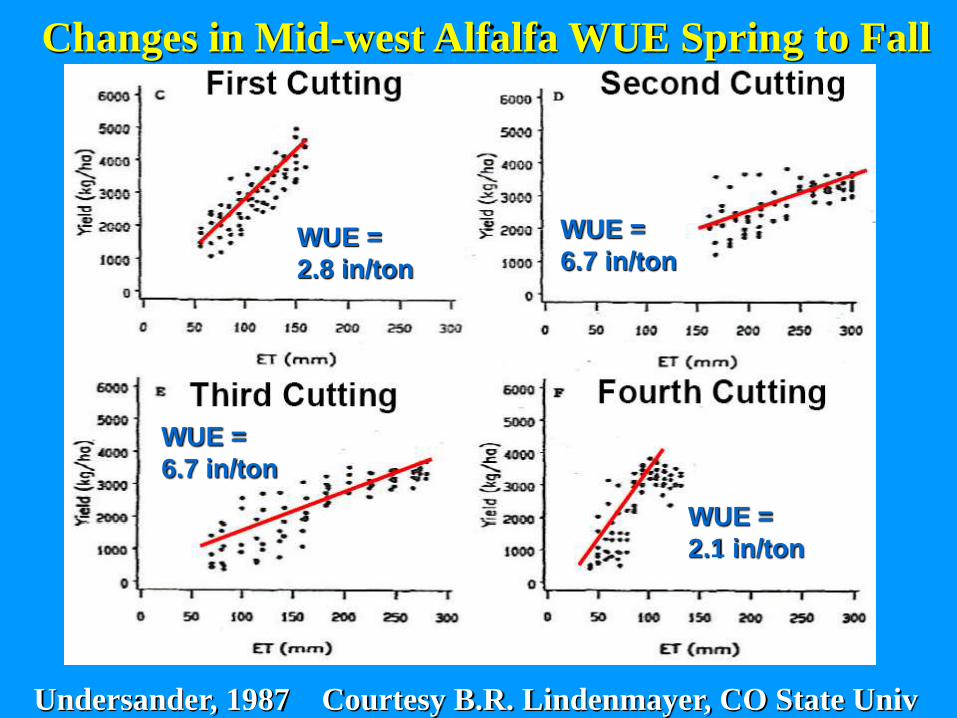
Changes in Mid-west Alfalfa WUE Spring to Fall
Undersander, 1987 Courtesy B.R. Lindenmayer, CO State Univ
WUE =
2.8 in/ton
WUE =
2.1 in/ton
WUE =
6.7 in/ton
WUE =
6.7 in/ton

Water Use Efficiency (WUE):
Forage Production with Reduced Water
WUE can vary by season, variety, field
fertility level and % available moisture.
Water Beneficially Used
Total Water Applied=
Yield
Applied (ET+leaching)
=Crop
Drop=

Alfalfa Deficit Irrigation, Kern County
Loggers have to be downloaded every 3 weeks and instrument
area hand cut with each cutting
Forage Production with Reduced Water

8/24/06: condition of deficit treatment
(irrigation 7/18) compared to no stress
(irrigation 7/18 and again 8/11)
Forage Production with Reduced Water

Forage Production with Reduced Water
8/24/06: condition of
deficit treatment (irriga-
tion 7/18) compared to
no stress (irrigation 7/18
and again 8/11)

Alfalfa Daily ETc for Full & Deficit Irrigation
0.0
1.0
2.0
3.0
4.0
5.0
6.0
7.0
8.0
9.0
10.0
11.0
12.0
4/16 4/30 5/14 5/28 6/11 6/25 7/9 7/23 8/6 8/20 9/3 9/17 10/1 10/15 10/29
Day of year
Da
ily
ET
c (
mm
/da
y)
West (Full Irrig) Daily ETc (mm)
East (Aug Deficit) Daily ETo (mm)
Irrig 5/2
Total ETc 5/23 to 10/29
Full irrigation = 941mm (37.04 inches)
Deficit = 863mm (34.01 inches)
Belridge ETo = 849mm (33.40 inches)
Cloudy
Irrig 8/11
(Full only)
Irrig 7/15
Irrig 6/22
Irrig 6/6
Irrig 9/6
(All)
1st Cut 4/25
5th cut 8/30/06
ET
West @ 6.79"
East @ 5.39"
4th cut 8/3/06
ET
West @ 7.64"
East @ 7.31"
3rd cut 7/6/06
ET
West @ 10.8"
East @ 10.2"
2nd cut 5/30/06
ET
West missing data
East @ 8.73"
Irrig 9/19
(Deficit 12 hrs)
6th cut 10/8/06
ET
West @ 7.22"
East @ 6.85"
0.2" rain
10/13

Alfalfa Full ETc & CIMIS Potential Grass ETo
0.0
1.0
2.0
3.0
4.0
5.0
6.0
7.0
8.0
9.0
10.0
11.0
12.0
4/16 4/30 5/14 5/28 6/11 6/25 7/9 7/23 8/6 8/20 9/3 9/17 10/1 10/15 10/29
Day of year
Dai
ly E
Tc
(mm
/day
)
Alfalf Full Irrig Daily ETc (mm)
CIMIS Daily Grass ETo (mm)
FULL IRRIGATION
0.0
0.3
0.5
0.8
1.0
1.3
1.5
1.8
2.0
2.3
2.5
4/16 4/30 5/14 5/28 6/11 6/25 7/9 7/23 8/6 8/20 9/3 9/17 10/1 10/15 10/29
Day of year
Dai
ly C
rop
Co
effi
cien
t (K
c)
FULL IRRIGATION
Irrig 5/2
Total ETc & CIMIS -- 5/23 to 10/29
Full irrigation = 941mm (37.04 inches)
Belridge ETo = 849mm (33.40 inches)
Season Average Kc = 1.10
Irrig 8/11
(Full only)
Irrig 7/15
Irrig 6/22Irrig 6/6
Irrig 9/6
(All)
1st Cut 4/25
5th cut 8/30/06
ET
West @ 6.79"
East @ 5.39"
4th cut 8/3/06
ET
West @ 7.64"
East @ 7.31"
3rd cut 7/6/06
ET
West @ 10.8"
East @ 10.2"
2nd cut 5/30/06
ET
West missing data
East @ 8.73"
Irrig 9/19
(Deficit 12 hrs)
6th cut 10/8/06
ET
West @ 7.22"
East @ 6.85"
0.2" rain
10/13

Forage Production with Reduced Water
Kern County Deficit
Irrigation Trial
Irrigation off 20 days
Irrigation off 45 days at
cutting. Total 50 days off.
Hay cut 8/29
Water back 9/5
Pictures
8/30/07
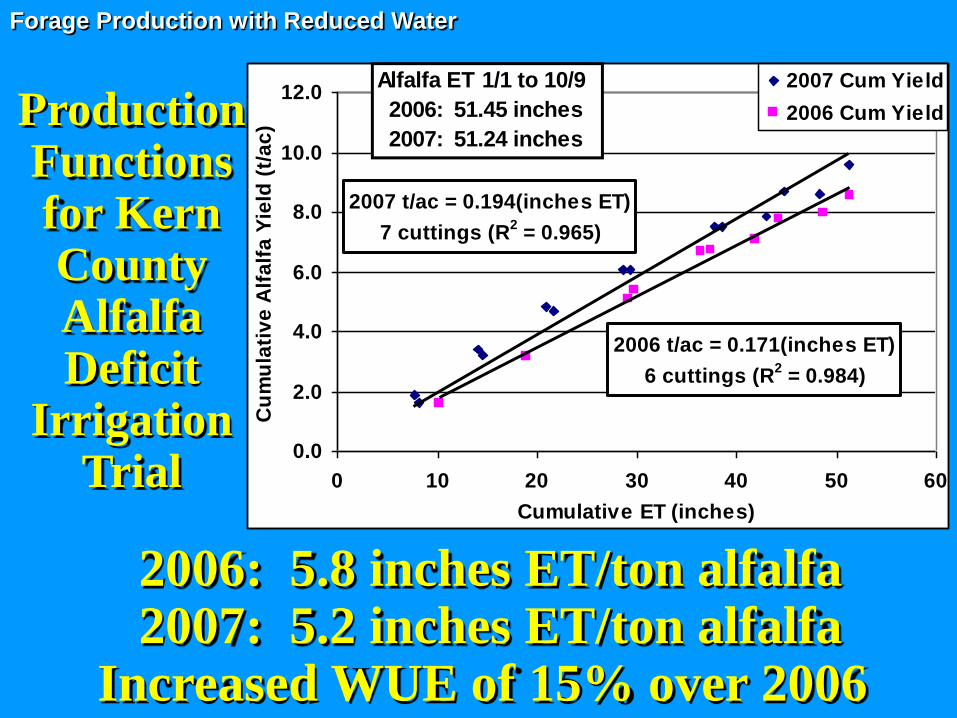
Production Functions for Kern County Alfalfa Deficit
Irrigation Trial
Forage Production with Reduced Water
2006: 5.8 inches ET/ton alfalfa2007: 5.2 inches ET/ton alfalfa
Increased WUE of 15% over 2006
2006 t/ac = 0.171(inches ET)
6 cuttings (R2 = 0.984)
2007 t/ac = 0.194(inches ET)
7 cuttings (R2 = 0.965)
0.0
2.0
4.0
6.0
8.0
10.0
12.0
0 10 20 30 40 50 60
Cumulative ET (inches)
Cu
mu
lati
ve
Alf
alf
a Y
ield
(t/
ac
)
2007 Cum Yield
2006 Cum Yield
Alfalfa ET 1/1 to 10/9
2006: 51.45 inches
2007: 51.24 inches

3-point sermon:
• Understanding soil water holding
characteristics
• Crop water requirements (ET), CIMIS
• Monitoring soil moisture, &
irrigation uniformity
Forage Production with Reduced Water

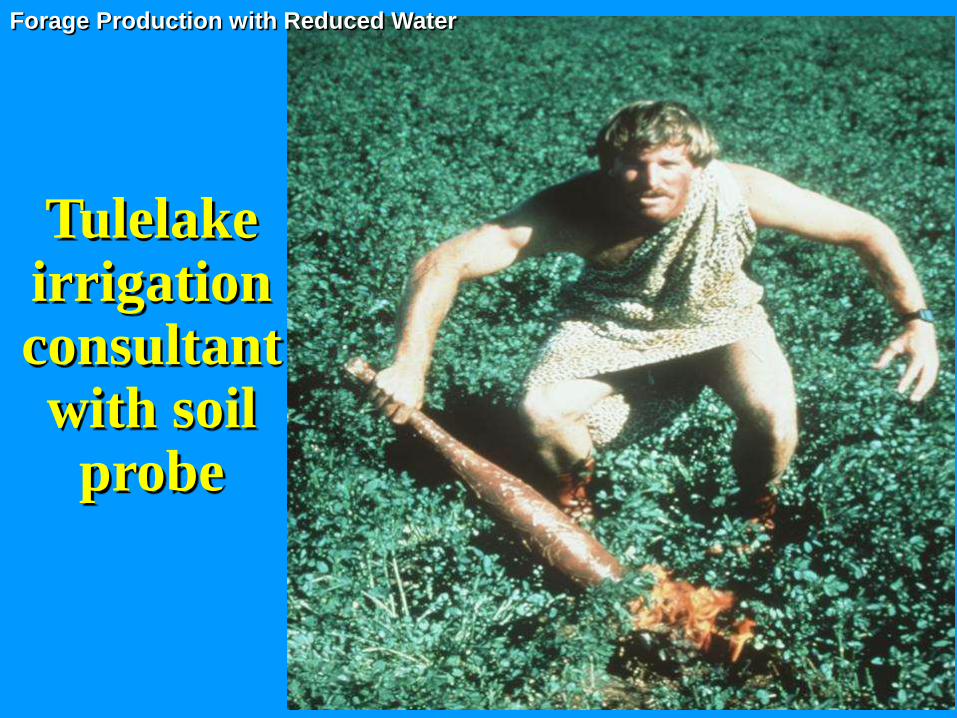
Equipment for checking soil Moisture
•Most Common Method
Forage Production with Reduced Water
Forage Production with Reduced Water
Tulelake irrigation consultant with soil
probe
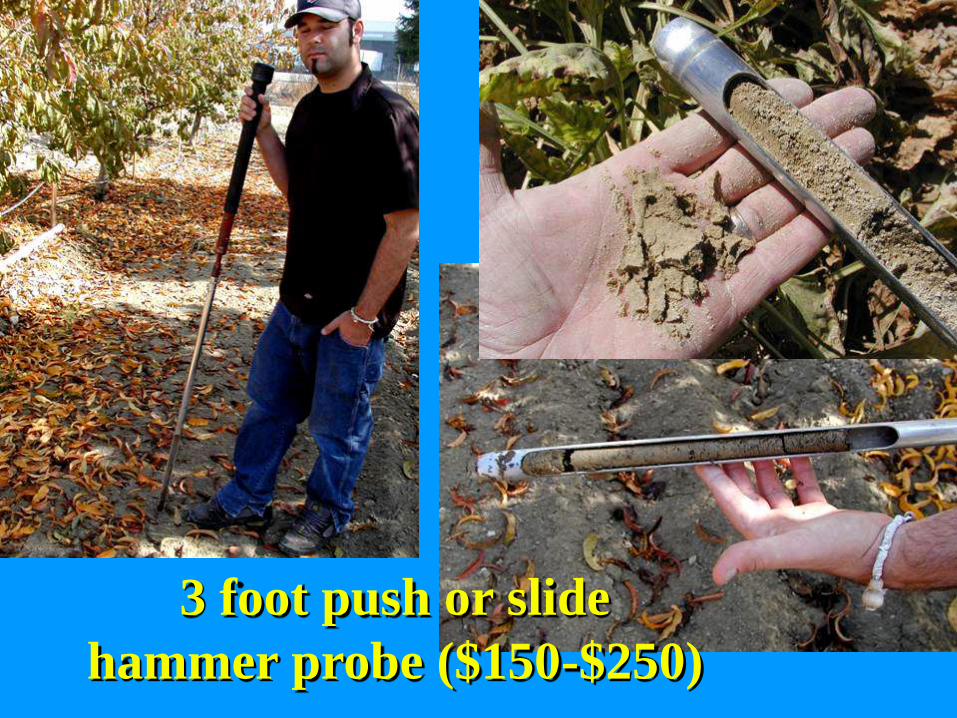
3 foot push or slide
hammer probe ($150-$250)
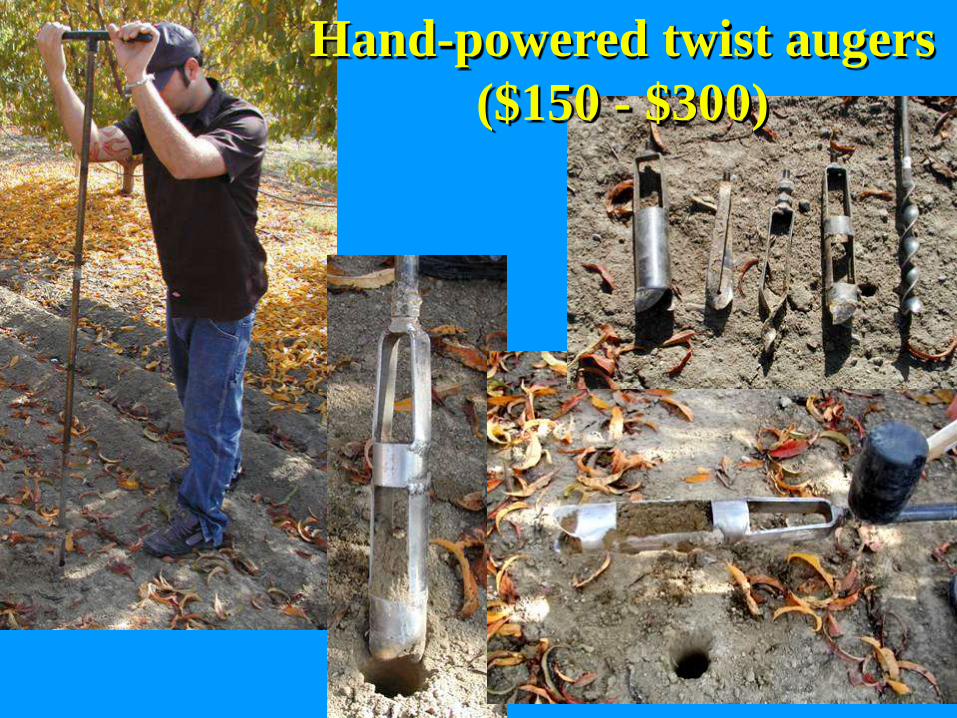
Hand-powered twist augers
($150 - $300)

SOIL TEXTURE DETERMINES
AVAILABLE WATER HOLDING
CAPACITY
SOIL TEXTURE
“FEEL METHOD”
AWHC = %Volume =inch depth of water
1 foot depth of soil

Guide for Estimating Actual Available Field Soil Moisture by the "Feel" Method.
SOIL TEXTURE CLASSIFICATION Coarse
(loamy sand)
Sandy
(sandy loam)
Medium
(loam)
Fine
(clay loam, silty clay loam)
Available Water (AW) in the Soil by Appearance (inches/foot soil)
0.6-1.2 in/ft *AW@FC 1.2-1.8 in/ft AW@FC 1.4-2.2 in/ft AW@FC 1.7-2.4 in/ft AW@FC
AW AW AW AW Deficit
Leaves wet outline On hand when
1.0
Appears very dark leaves wet outline
1.6
Appears very dark leaves wet outline
1.9
Appears very dark, leaves slight moisture
2.2 0
squeezed. Appears moist,
0.7
on hand, makes a short ribbon (0.5-0.75 inch)
on hand , will ribbon about 1 – 2 inches.
1.7
on hand when squeezed, will ribbon > 2 inches.
0.2
Makes a weak ball.
Appears slightly
Quite dark color
makes a hard ball.
1.2
Dark color, forms a
plastic pall, slicks when rubbed.
1.4
Dark color will feel slick And ribbons easily
1.8 0.5
moist, sticks together slightly.
0.4
Fairly dark color, makes a good ball
1.0
Quite dark, forms a hard ball
1.2
Quite dark, will make
0.7
Dry, loose, flows thru fingers. (wilting point)
0
Slightly dark color makes a weak ball
0.7
Fairly dark, forms a
1.0
thick ribbon may slick when rubbed.
1.4
1.0
Lightly colored by moisture, will not
0.4
a good ball
Fairly dark, makes a good ball.
1.1
1.2
ball. Very slight color
0
Slightly dark, forms weak ball
0.6 Will ball, small clods will flatten out rather
0.7
1.4
due to moisture.
(wilting point)
Lightly Colored, small clods crumble
0.2
Slightly dark, clods
0.4
1.7
Fairly easily. Slight color due to
Crumble. Some darkness due to
1.9
moisture, small colds hard (wilting point).
0 unavailable moisture, clods are hard, cracked (wilting pt)
0 2.2
* AW@FC: Available Water @ Field Capacity = the available water a soil can store against gravity after irrigation and drainage.
Adapted from: Merriam, J.L. 1960. Field method of approximating soil moisture for irrigation. Am. Soc. Agri. Engr. Vol. 3. No.1

Watermark blocks estimate soil
moisture tension (matric poten-
tial) using electrical resistance
and require no maintenance
(~$30). However, a separate
meter or logger ($200+) is
needed to read the device.

Loggers used in Kern County
irrigation projects
Forage Production with Reduced Water

Fig. 1. Typical field layout of monitoring sites with surface irrigation. Spacing
of Watermark sensor groups varied according to irrigation system, but
usually set @ 18, 36 and 60 inch depths. (Not to scale.)
18”
36”
60”
18”
36”
60”
1280’
800’150’
Bed
Watermark
Group
Neutron Probe Access Tube
(2”x 6’ Class 125 PVC)
18”
36”
60”
18”
36”
60”
18”
36”
60”
18”
36”
60”
1280’
800’150’
Bed
Watermark
Group
Neutron Probe Access Tube
(2”x 6’ Class 125 PVC)
Typical field layout for flood systems.
Total soil moisture monitoring system cost: $850

Wadel Alfalfa - Full Irrigation
Wasco Sandy Loam.
Border Flood
750' from HEAD (TAIL END)-180
-160
-140
-120
-100
-80
-60
-40
-20
0
4/1 4/29 5/27 6/24 7/22 8/19 9/16 10/14 11/11
So
il M
ois
ture
Ten
sio
n (
cb
)
12"
24"
48"
Wadel Alfalfa - Full Irrigation
Wasco Sandy Loam.
Border Flood
150' from HEAD
-180
-160
-140
-120
-100
-80
-60
-40
-20
0
4/1 4/29 5/27 6/24 7/22 8/19 9/16 10/14 11/11
So
il M
ois
ture
Ten
sio
n (
cb
)
12"
24"
48"
Season Total 9.72 t/ac
Last Cut 10/10/07
Watermark Readings: “Full Irrigation” Sandy Loam Alfalfa
2 Irrigations per cutting peak season

Watermark Readings: “Deficit Irrigation” Sandy Loam Alfalfa
1 Irrigation only for July and August cuttings
Wadel Deficit - 1 Irrigation
in Jul and Aug
Wasco Sandy Loam.
Border Flood
750' from HEAD (TAIL END)-180
-160
-140
-120
-100
-80
-60
-40
-20
0
4/1 4/29 5/27 6/24 7/22 8/19 9/16 10/14 11/11
So
il M
ois
ture
Ten
sio
n
(cb
)
12"
24"
48" Malfunction of 12"
sensor
Wadel Deficit - 1 Irrigation
in Jul and Aug
Wasco Sandy Loam.
Border Flood
150' from HEAD-180
-160
-140
-120
-100
-80
-60
-40
-20
0
4/1 4/29 5/27 6/24 7/22 8/19 9/16 10/14 11/11
So
il M
ois
ture
Ten
sio
n
(cb
)
12"
24"
48"
Season Total 9.79 t/ac
Last Cut 10/10/07

Irrigation distribution uniformity (DU) determined by soil infiltration rate, flow down
the check and set duration.
Forage Production with Reduced Water
DU (%) = 100 *
“low quarter” infiltration
Average field infiltration
0 –
0.5 –
1.0 –
1.5 –
2.0 –
Stressed plant growth
Too little water
Possible stress
N leaching, water logging
Infiltration @ 6 hrs
Infiltration @ 12 hrs
Infiltration @ 18 hrs
Infiltration @ 24 hrs
Head
Tail – no leaching
Roo
tzo
ne D
ep
th (
m)
Deep percolation – lost water & N fertilizer
0 –
0.5 –
1.0 –
1.5 –
2.0 –
0 –
0.5 –
1.0 –
1.5 –
2.0 –
Stressed plant growth
Too little water
Stressed plant growth
Too little water
Possible stress
N leaching, water logging
Possible stress
N leaching, water logging
Infiltration @ 6 hrs
Infiltration @ 12 hrs
Infiltration @ 18 hrs
Infiltration @ 24 hrs
Head
Tail – no leaching
Roo
tzo
ne D
ep
th (
m)
Deep percolation – lost water & N fertilizer

Uniform stands with high irrigation efficiency require large/fast heads of water and usually a tail water
return system.Forage Production with Reduced Water
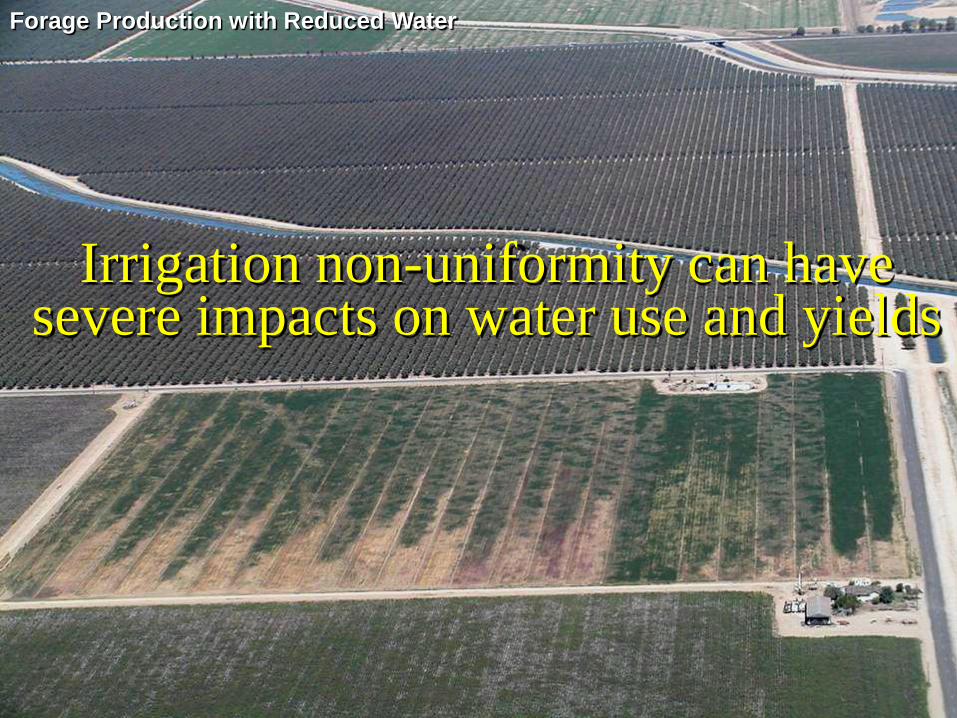
Irrigation non-uniformity can have severe impacts on water use and yields
Forage Production with Reduced Water

Impact of irrigation distribution uniformity (DU)
on field applied water and alfalfa yield
Field Qtr
70% DU 42 48 54 60 42 48 54 60 36 6.2
Wettest 55 62 70 78 8.5 7.6 6.0 5.0 42 7.4
Wet 46 53 59 66 8.2 8.6 8.1 6.7 48 8.6
Drier 38 43 49 54 6.6 7.8 8.5 8.5 55 8.6
Dry 29 34 38 42 3.6 5.3 6.6 7.6 60 8.000
6.7 7.3 7.3 7.0
80% DU 42 48 54 60 42 48 54 60
Wettest 50 58 65 72 8.5 8.3 7.0 5.9
Wet 45 51 58 64 8.1 8.6 8.3 7.2
Drier 39 45 50 56 7.0 8.1 8.5 8.4
Dry 34 38 43 48 5.3 6.8 7.8 8.4
7.2 7.9 7.9 7.5
90% DU 42 48 54 60 42 48 54 60
Wettest 46 53 59 66 8.2 8.6 8.1 6.7
Wet 43 50 56 62 7.8 8.5 8.4 7.6
Drier 41 46 52 58 7.3 8.3 8.6 8.2
Dry 38 43 49 54 6.6 7.8 8.5 8.5
7.5 8.3 8.4 7.8
Qtr Irrig by Avg Depth (in) Qtr Yield by Avg Depth (t/ac)
Field Average Yield (t/ac):
Field Average Yield (t/ac):
Field Average Yield (t/ac):
Yield (t/ac) = -0.0096x2 +
1.0004x - 17.491
R2 = 0.9789
5.0
5.5
6.0
6.5
7.0
7.5
8.0
8.5
9.0
35 45 55 65Applied water(in)
Alf
alf
a Y
ield
(t/
ac
)
Forage Production with Reduced Water

Field Qtr
70% DU 42 48 54 60 42 48 54 60 36 6.2
Wettest 55 62 70 78 8.5 7.6 6.0 5.0 42 7.4
Wet 46 53 59 66 8.2 8.6 8.1 6.7 48 8.6
Drier 38 43 49 54 6.6 7.8 8.5 8.5 55 8.6
Dry 29 34 38 42 3.6 5.3 6.6 7.6 60 8.000
6.7 7.3 7.3 7.0
80% DU 42 48 54 60 42 48 54 60
Wettest 50 58 65 72 8.5 8.3 7.0 5.9
Wet 45 51 58 64 8.1 8.6 8.3 7.2
Drier 39 45 50 56 7.0 8.1 8.5 8.4
Dry 34 38 43 48 5.3 6.8 7.8 8.4
7.2 7.9 7.9 7.5
90% DU 42 48 54 60 42 48 54 60
Wettest 46 53 59 66 8.2 8.6 8.1 6.7
Wet 43 50 56 62 7.8 8.5 8.4 7.6
Drier 41 46 52 58 7.3 8.3 8.6 8.2
Dry 38 43 49 54 6.6 7.8 8.5 8.5
7.5 8.3 8.4 7.8
Qtr Irrig by Avg Depth (in) Qtr Yield by Avg Depth (t/ac)
Field Average Yield (t/ac):
Field Average Yield (t/ac):
Field Average Yield (t/ac):
Yield (t/ac) = -0.0096x2 +
1.0004x - 17.491
R2 = 0.9789
5.0
5.5
6.0
6.5
7.0
7.5
8.0
8.5
9.0
35 45 55 65Applied water(in)
Alf
alf
a Y
ield
(t/
ac
)
Impact of Distribution Uniformity (DU) on Water
Applied to the Field and Final Alfalfa Yields

Net Revenue for Average SJV Alfalfa Yields for $30, $60 and $90/ac-ft Water Costs and Different
Field Irrigation Uniformities
Improving DU from 70 to 80% increases net income by $63 @ 48
inches applied water and $60/ac-ft.
Assumptions:
All base costs without water ($/ac): $300.00
No. of cuttings: 8
Cost of cut and rake ($/ac/cutting): $12.00
Custom bale ($/ton): $10.25
Harrow bed ($/ton): $4.00
Hay price ($/ton): $120.00
-100
-50
0
50
100
150
200
250
300
350
400
35 40 45 50 55 60Average Applied Water (inches)
Net
Inco
me (
$)
$30/ac-ft $60/ac-ft $90/ac-ft
6.7
7.3 7.3
7.0
Yield (t/ac)
70% DU-100
-50
0
50
100
150
200
250
300
350
400
35 40 45 50 55 60Average Applied Water (inches)
Net
Inco
me (
$)
$30/ac-ft $60/ac-ft $90/ac-ft
7.2
7.9 7.9
7.5
Yield (t/ac)
80% DU

ET
(inches)
Yield
(ton/ac)
Price
($/ton)
Gross
($)
Water
Productivity
($/in)
Water
Value
($/ac-ft)
Alfalfa (7 cuts) 55 9 $180 $1,620 $29.45 $353
Silage 4/1-8/25 34 30 $28 $840 $24.57 $295
Silage 6/15-10/15 28 25 $28 $700 $24.89 $299
Sudan (3 cuts) 41 10 $120 $1,200 $28.93 $347
Winter Forage 16 17 $24 $408 $26.02 $312
Wheat grain 21 3.2 $220 $704 $33.52 $402
Assess “Water Productivity” in terms of most $/ac-ft return when water supply is the most limiting factor.
Forage Production with Reduced Water

CONCLUSIONS:
•Use “Normal Year” ET schedules to estimate
forage crop water consumption
•Understand AND CHECK the depth of
infiltration during irrigation events
•Knowing this depth and “normal” ET, check
head and tail soil moisture to best schedule the
next irrigation…
Forage Production with Reduced Water

CONCLUSIONS (continued):
•Increasing DU from 70 to 80% can return a
SJV grower $60/ac @ hay prices of $120/ton.
Increasing DU from 70 to 90% will return $90
to $110/ac
•Alfala ET in the SJV uses about 5.5 inches/ton.
Summer fallow of hay will cost you 2 to 3
tons/ac to save a foot of water, but the stand
will be fine if you rewater for a fall cutting.
This is not the case for…
Forage Production with Reduced Water

Imperial Valley
“Where’d my
stand go?!”
(Excessive heat
scorches crowns
and hurts stand
when cover and
ET decrease)

CONCLUSIONS (concluded … at last):
•Total water use is least with winter
grain/forage crops and provides high water
productivity ($/inch).
•Organize all data for each field in a water
balance spreadsheet.
•Install a tailwater return system to improve
DU, avoid scald and phytophthora
•Stay profitable so you can make it to the next
CA Alfalfa Symposium and buy Dan a drink!Forage Production with Reduced Water