Embed Size (px)
Citation preview
'~ \
I
I !...._._.I J
i
\
\
SHELTER STUDY FOR THE STATE OF !Ol;.IJ\
- - f - WORTMAN
I
\ \ \ 1- ---
JUNE 1958
~. I '
\ t
IOWA STATE TRA YEUNG LIBRARY DES MOI N ES, IOWA
1' /I
/ I / I
L
(
/
SHELTER STUDY
For The
STATE OF IOWA
_j
•
SHELTER STUDY FOR THE STATE OF IOWA
I
INTRODUCTION
In the age of nuclear weapons the type of war Which can
be waged presents many problems that heretofore have not been
present. The use of thermal nuclear weapons so increases the
extent of destruction available to the enemy that planning
for the survival of the people is made more difficult. Two
possibilities are available to protect the people from the
effects of an attack upon this country; one of which is the
planned evacuation of the people from the target areas re-
sulting in a dispersion of the population. Another possibi
lity is the construction of shelters to protect the popula-
tion from the effects of nucl~ar weapons. It is this last
possibility, shelters, which is the object of this study.
The Effects of Nuclear Weapons. The effects of nuclear
weapons are very diversified; however, three definite e!fects
can be studied in relation to shelters. The three effects
are the blast effect, the thermal radiation effect, and the
.J effect of radiation fallout. The effect of blast and radia-. \ tion fallout are the two important effects of nuclear weapons
· for which shelters must be built. The effect of thermal
i -,,_
radiation occurs so closely with the blast effect that any
shelter designed to withstand blast will also·withstand the
effects of thermal radiation.
1
Area of study. The study of shelters for the protection
from the effects of blast is limited to the seven target
areas in the state. These seven target areas are as follows:
Davenport, Critical Target Area; Cedar Rapids, council Bluff~
Des Moines, Dubuque, Sioux City and Waterloo Target Areas.
The area of study for the construction of fallout shelters
in the state would include the entire State less that area
defined as targetsJ
Assumptions, Several assumptions have been made for con
ducting a shelter study for the state of Iowa. One assump
tion is the size of weapons that might be used upon any
target in the state. Four weapon.sizes have been considered
as possibilities which are: a 20 MT bomb, a 30 MT bomb,
a 60 MT bomb, and four 5 MT bombs placed in such a manner
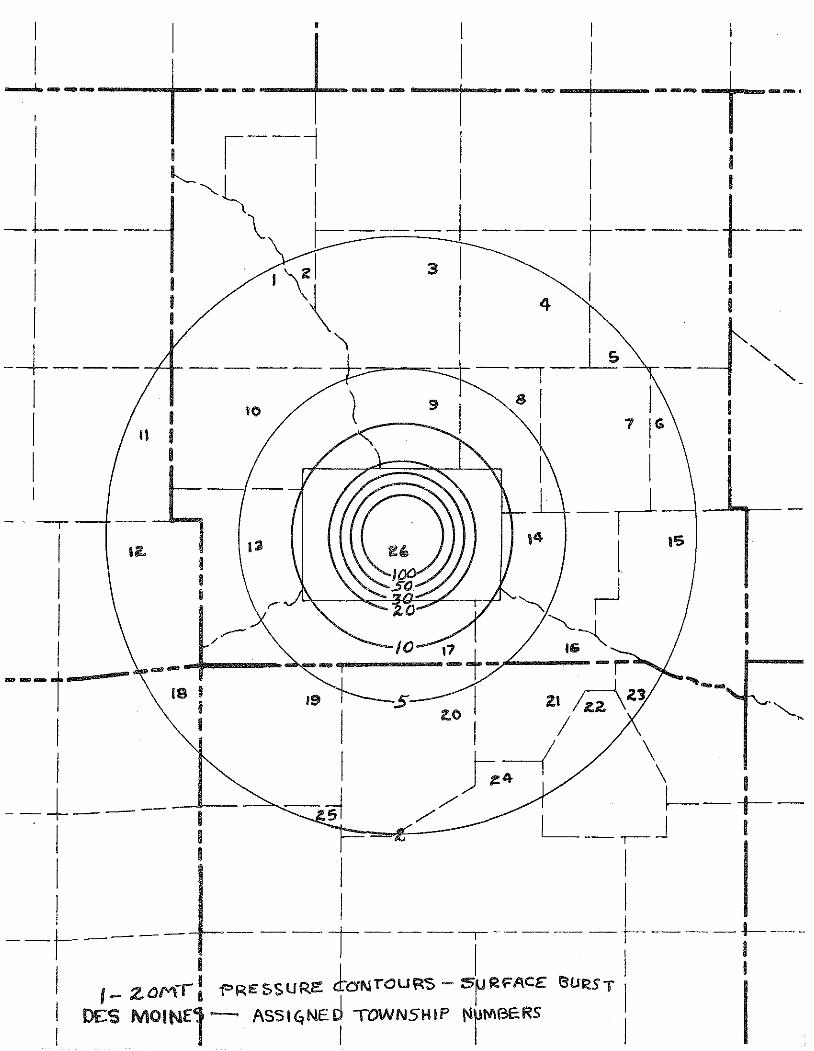
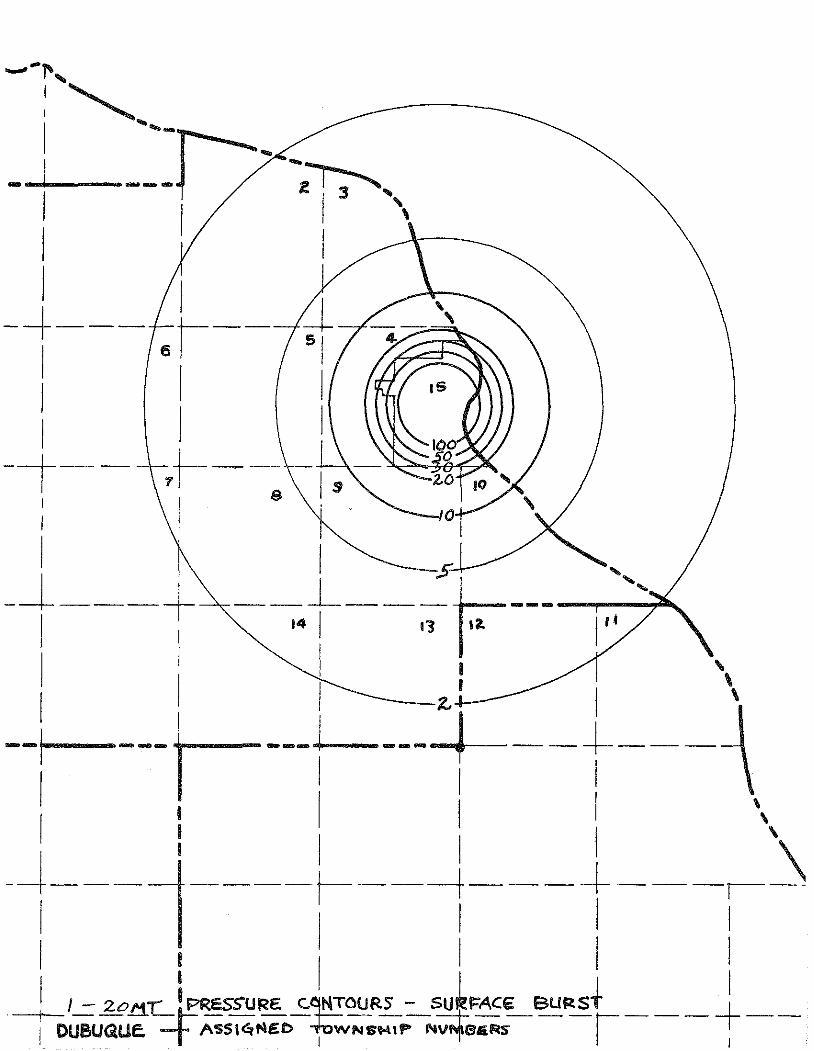
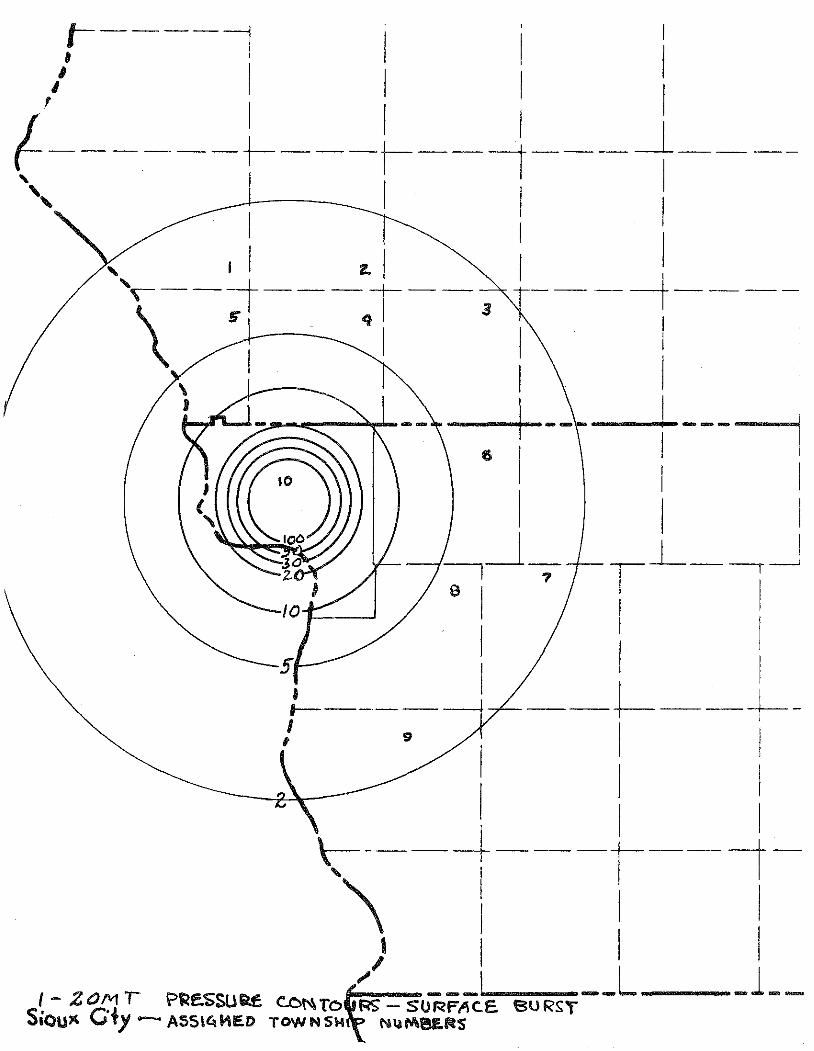
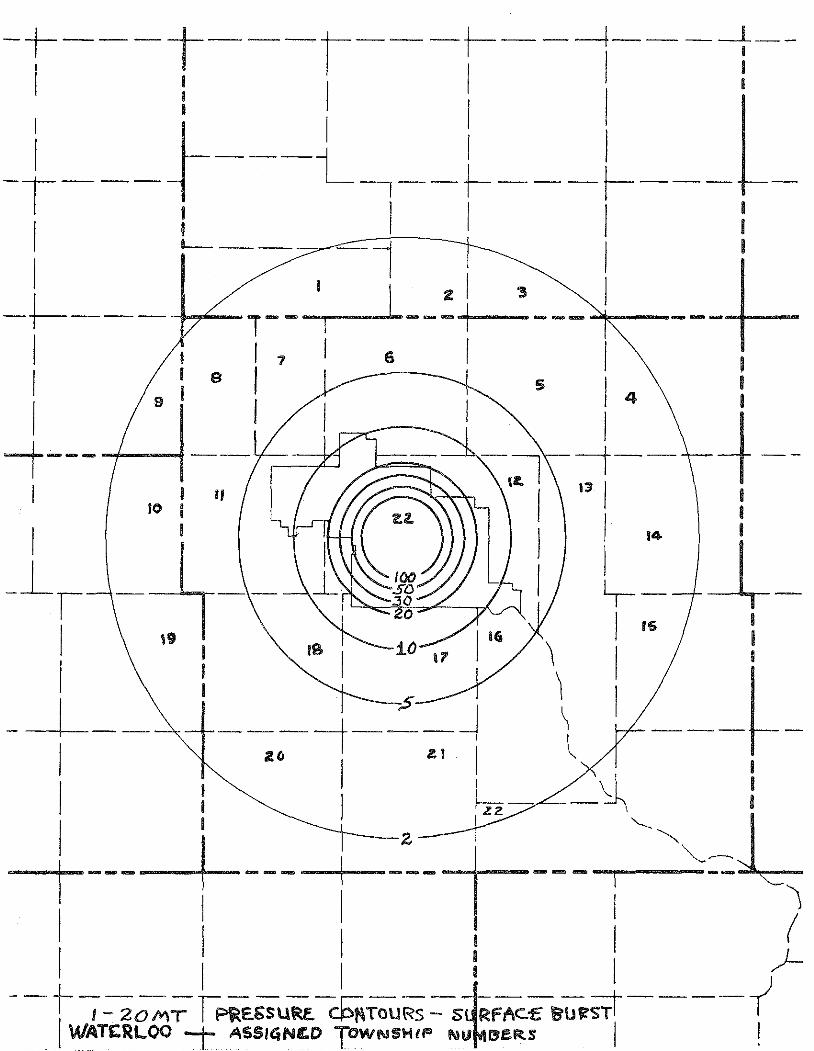
that the 30 psi rings touch. The psi rings, as a result
of each weapon being dropped on a target, are imposed upon
the maps included in the study as an attachment. Another
assumption is the location of ground zero in determining the
exact location of the psi over pressure rings. In all but
two targets ground zero is assumed to be the geographic cen
ter of the target area. In the other two targets, Council
Bluffs and Davenport, the fact that these targets are part
of a target complex which extends across state lines was
considered, This criteria is the same for all weapons ex
cept the four 5 MT bombs in which case the bombs were placed
2
so that the most damage would result to the particular tar-
get area.
A third assumption is the population data used~ The
statistical analysis is based upon 1950 resident population
found in the Bureau of Census report for 1950. This data
has preference over any updated data available because the
distribution of the resident population within an urban tar
get area is available and in addition, the distribution of
population within a county by townships. The updated data
is not available with the stratification or distribution as
available in the 1950 data.
Validity of Statistical Data. It must be realized that
the data presented is not without bias, which results from
the fact that the data was estimated without the benefit of
a sample or survey which would remove the bias. For the pur-
pose of this study, with the time and funds allotted, the
estimates, as determined, will serve the purposes for which
it is inten~ed - an initial study of the shelter requirement
in the State of Iowa.
In addition, only the resident population data is used.
This does not present a complete analysis of the effects of
nuclear weapons upon a target. However, if daytime popula-
tion concentrations had been collected by survey, the surviv~l
percentages in each target area v1ould have been less.
The theory concerning the validity of shelters is based
entirely upon the statistical analysis of the 20 MT bomb.
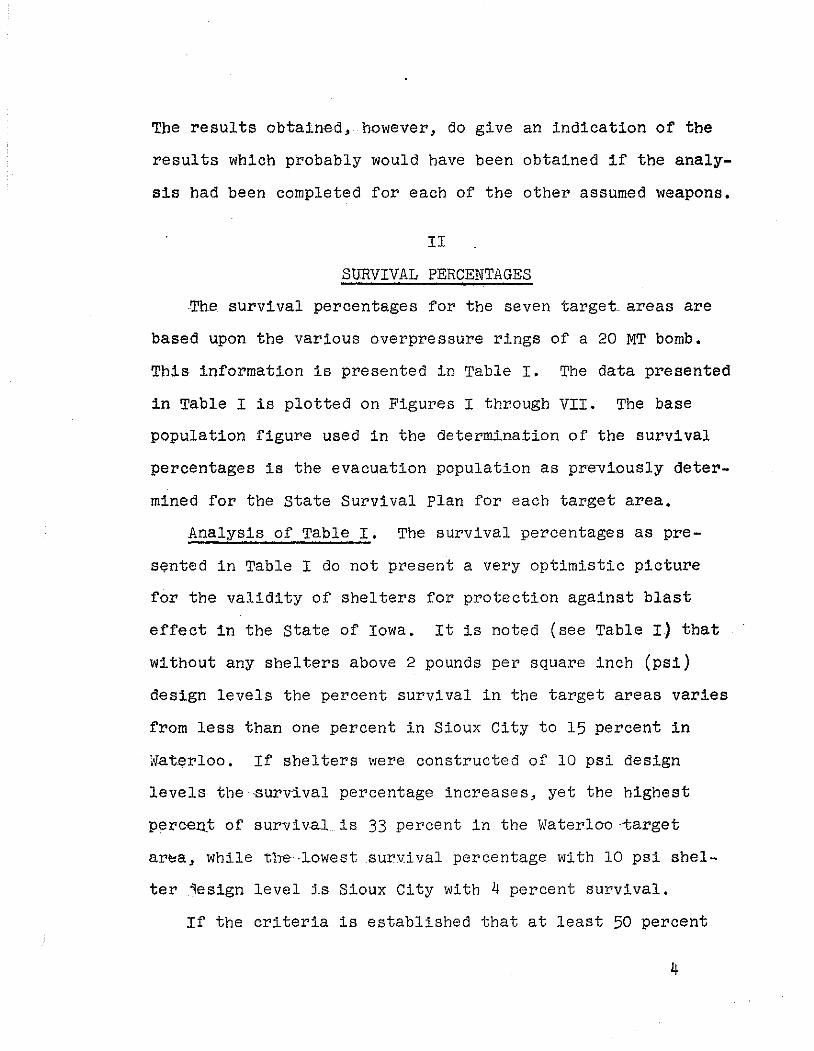
The results obtained, however, do give an indication of the
results which probably would have been obtained if the analy
sis had been completed for each of the other assumed weapons.
II
SURVIVAL PERCENTAGES
The survival percentages for the seven target areas are
based upon the various overpressure rings of a 20 MT bomb.
This information is presented in Table I. The data presented
in Table I is plotted on Figures I through VII. The base
population figure used in the determination of the survival
percentages is the evacuation population as previously deter
mined for the state Survival Plan for each target area.
Analysis of Table I. The survival percentages as pre
sented in Table I do not present a very optimistic picture
for the validity of shelters for protection against blast
effect in the state of Iowa. It is noted (see Table I) that
without any shelters above 2 pounds per square inch (psi)
design levels the percent survival in the target areas varies
from less than one percent in Sioux City to 15 percent in
Waterloo. If shelters were constructed of 10 psi design
levels the ,survival percentage increases, yet the highest
peroaQt of survival is 33 percent in the waterloo,target
area, while t11e,,lowest sur vi val percentage with 10 psi shel
ter 4esign level 1s Sioux City with 4 percent survival.
If the criteria is established that at least 50 percent
4
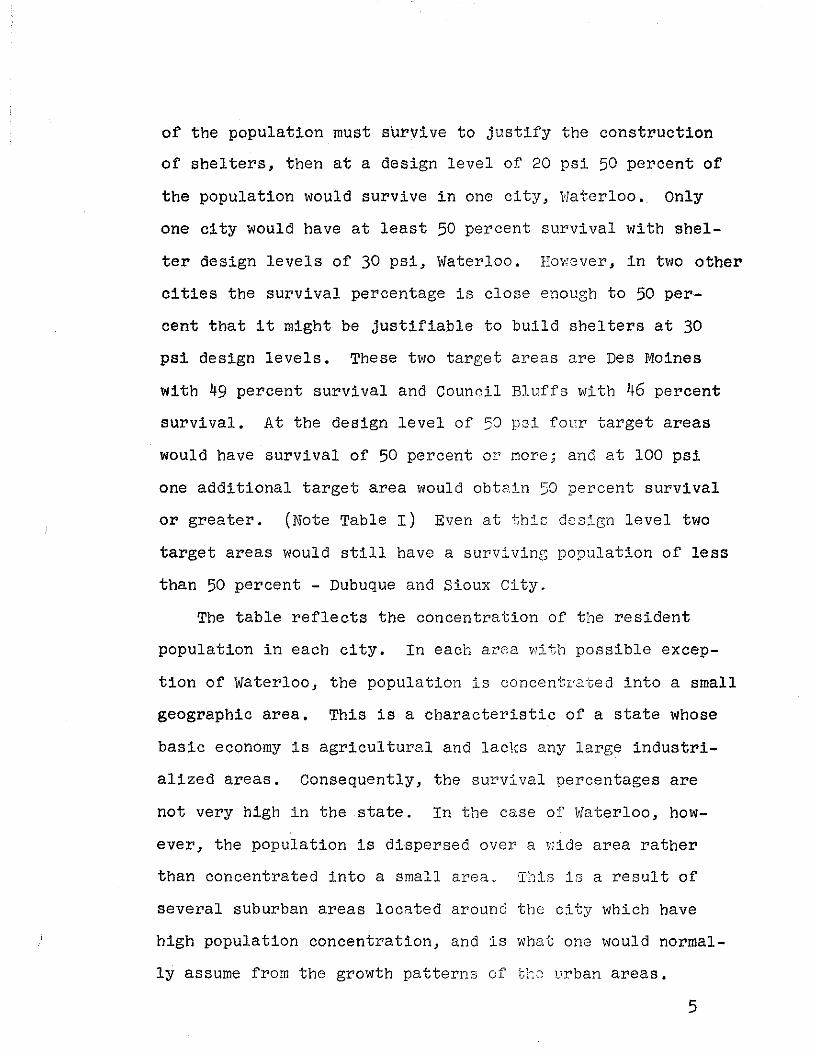
of the population must survive to justify the construction
of shelters, then at a design level of 20 psi 50 percent of
the population would survive in one city, Haterloo. Only
one city would have at least 50 percent survival with shel
ter design levels of 30 psi, Waterloo. Hov;ever, in two other
cities the survival percentage is close enough to 50 per
cent that it might be justifiable to build shelters at 30
psi design levels. These two target areas are Des Moines
with 49 percent survival and Counr.il Bluffs with 46 percent
survival. At the design level of 50 psi fonr target areas
would have survival of 50 percent or more; and at 100 psi
one additional target area would obtain 50 percent survival
or greater. (Note Table I) Even at this dcs5_gn level two
target areas would still have a surviving population of less
than 50 percent -Dubuque and Sioux City.
The table reflects the concentration of the resident
population in each city. In each area with possible excep
tion of waterloo, the population is concentr'ated into a small
geographic area. This is a characteristic of a state whose
basic economy is agricultural and lacks any large industri
alized areas. Consequently, the survival percentages are
not very high in the state. In the case of Waterloo, how
ever, the population is dispersed over a wide area rather
than concentrated into a small area" This is a result of
several suburban areas located around the city which have
high population concentration, and is what one would normal
ly assume from the growth patterns of tte u.rban areas.
5
Effects of Larger Weapons Upon Survival Percentages.
The use of either of the other assumed weapons upon any tar
get in the State would decrease the percentage of survival in
the target areas. This would occur because the area of des
truction, as a result of blast effect, would be greater in
each of the target areas. It is because of the lack of time
and the findings of a 20 MT bomb analysis that the survival
percentages for the other bomb sizes have not been determined.
III
COST OF SHELTERS IN RELATION TO SURVIVAL
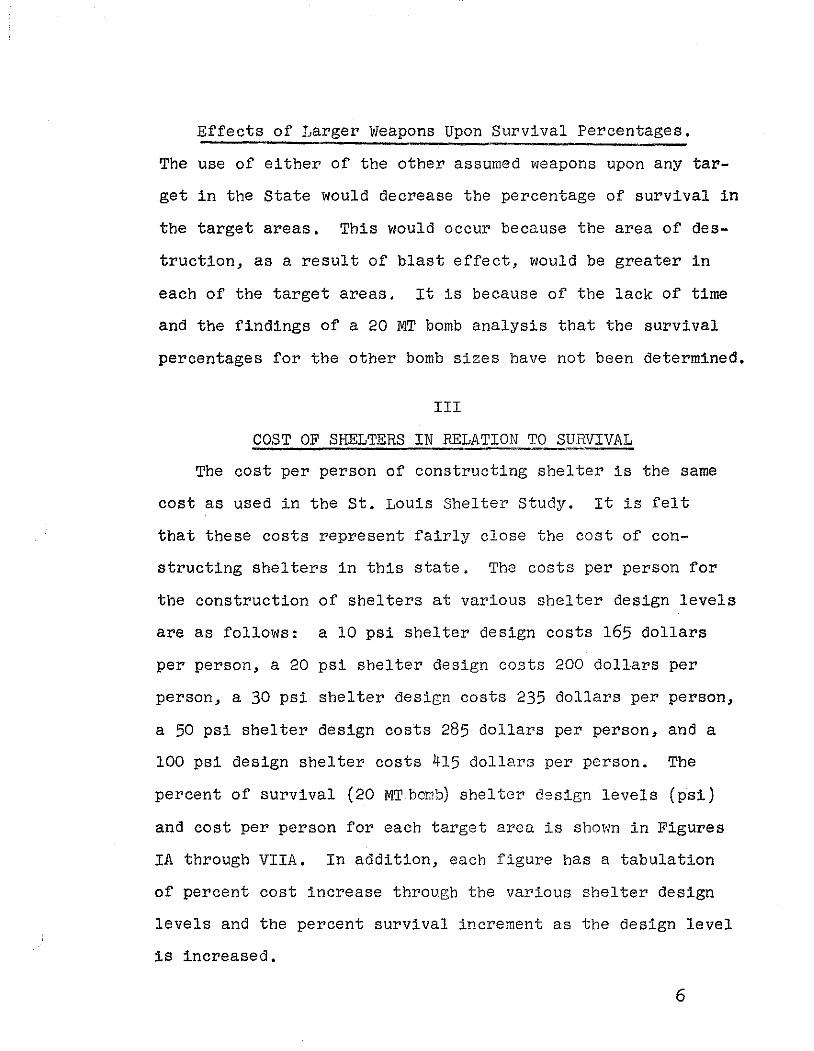
The cost per person of constructing shelter is the same
cost as used in the St. Louis Shelter Study. It is felt
that these costs represent fairly close the cost of con
structing shelters in this state. The costs per person for
the construction of shelters at various shelter design levels
are as follows: a 10 psi shelter design costs 165 dollars
per person, a 20 psi shelter design costs 200 dollars per
person, a 30 psi shelter design costs 235 dollars per person,
a 50 psi shelter design costs 285 dollars per person, and a
100 psi design shelter costs 415 dollars per person. The
percent of survival (20 MTbomb) shelter design levels (psi)
and cost per person for each target area is shown in Figures
IA through VIIA. In addition, each figure has a tabulation
of percent cost increase through the various shelter design
levels and the percent survival increment as the design level
is increased.
6
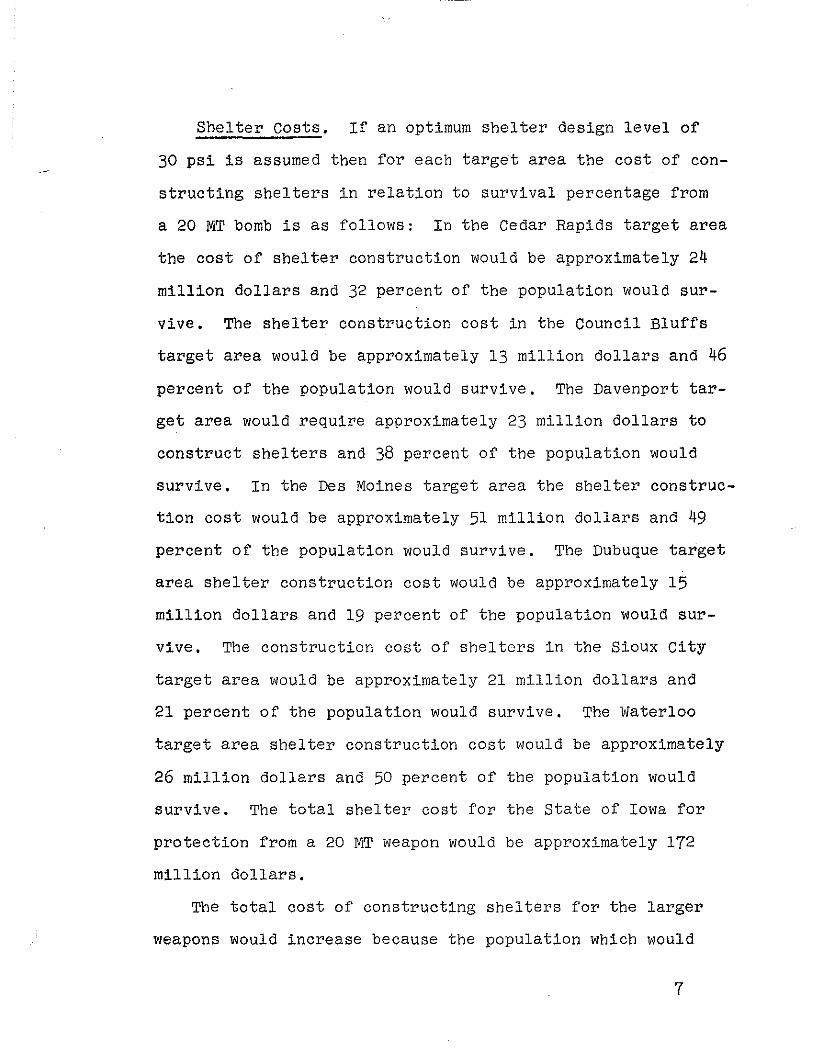
Shelter Costs. If an optimum shelter design level of
30 psi is assumed then for each target area the cost of con
structing shelters in relation to survival percentage from
a 20 MT bomb is as follows: In the Cedar .Rapids target area
the cost of shelter construction would be approximately 24
million dollars and 32 percent of the population would sur
vive. The shelter construction cost in the Council Bluffs
target area would be approximately 13 million dollars and 46
percent of the population would survive. The Davenport tar
get area would require approximately 23 million dollars to
construct shelters and 38 percent of the population would
survive. In the Des Moines target area the shelter construc
tion cost would be approximately 51 million dollars and 49
percent of the population would survive. The Dubuque target
area shelter construction cost would be approximately 15
million dollars and 19 percent of the population would sur
vive. The construction cost of shelters in the Sioux City
target area would be approximately 21 million dollars and
21 percent of the population would survive. The Waterloo
target area shelter construction cost would be approximately
26 million dollars and 50 percent of the population would
survive. The total shelter cost for the State of Iowa for
protection from a 20 MT weapon would be approximately 172
million dollars.
The total cost of constructing shelters for the larger
weapons would increase because the population which would
7
need shelters would increase. However, it is doubtful that
the increased number of shelters would increase the survival
percentages. It is felt that the converse would occur; the
total cost of she'l ters would increase and the percent of
survival would decrease. The above statement is based upon
the knowledge that the target areas have centralized popula
tions in a small geographic area, while the destruction rings
from larger weapons increase in radius.
IV
SHELTER LOCATION FOR BLAST EFFECT
The shelter location for each of the target areas is
presented in Tables II through VIII. The tables contain
the resident population as of 1950 by county stratified by
township and the estimated shelter needs to protect the popu
lation from the blast effect. In addition, two methods of
estimating the size of the shelters to the number of shelters
which should be constructed is presented. The size of the
shelters in column 6 is determined by estimating the number
of shelters, column 5, needed for the resident population in
each township based upon an estimate of placing the shelters
by geographic location. Then an assumption was made that
shelters should be constructed of three sizes which are:
100 person shelters in the rural areas, 1000 person shelters
in the more densely populated small communities and townships
and 2000 person shelters in the target cities. The findings
8
under this assumption are presented in columns 7 and 8 of
the tables.
It is noted that by basing the number of shelters upon
the population and geographic location will require less
shelters than arbitrarily setting a shelter size and deter
mining the number of shelters. (See Tables II through VIII)
However, it is felt that due to the characteristics of the
rural areas, low concentration of population, the latter cri.;..
teria is more realistic in determining the number of shelters
needed to protect the people from the effects of blast. The
construction of more and smaller shelters may increase the
cost of constructing shelters per person, but data to sub
stantiate this has not been determined. The increased cost
of constructing shelters, if such an increase is present,
would be justified in that it is more likely that the popula
tion in the rural areas would have a better chance of reaching
the shelters in the event of an attack than if the shelters
were located over a wide area and constructed of a larger
size.
v
FALLOUT SHELTE.RS IN THE STATE
A statistical study of fallout shelters for the State of
Iowa has not been made due to the lack of time; however,
several problems and considerations in determining the fall
out shelter needs are presented. The type of shelter needed
9
to protect the population from the effects of nuclear radia
tion need not cost as much per person as the cost of con
structing shelters for protection against blast. However,
it must be realized that the number of shelters needed for
the protection against radiation fallout will be greater
than the need of shelters for the protection against blast,
thus increasing total costs. The size of the shelters in
the fallout areas can be larger, if needed, due to the ele
ment of time. More time will be available to reach the fall~
out shelters than the time which will be available to reach
the blast shelters.
So far, the consideration has been that shelters be con
structed for the protection of populations from the hazards of
fallout. However, in an agricultural state such as Iowa, con
sideration should be made for the protection of livestock and
grain from the effects of nuclear radiation. This would pre~
sent additional problems in the design of shelters and would,
of course, increase the total cost of constructing shelters
for the protection against the fallout effects. The decision
concerning the construction of fallout shelters for livestock
and grain is based in part upon social costs vs. social bene
fits. This means that if the cost of constructing the shel
ters in the long run is less than the benefits received then
such construction would be justified. rt is felt that if the
need ever arose in which the shelters for livestock and grain
were used the benefit would more than out-weigh the cost of
10
construction. Therefore, the nation would be assured a
potential food supply to aid recovery in the post-attack
period.
VI SUMMARY AND CONCLUSIONS
The shelter study as presented is based entirely upon
the complete utilization of shelters rather than evacuation.
Because it is impossible to predict which method an enemy
might use to deliver a bomb upon any target in the State,
it seems advisable to consider the combination of evacua-
tion and shelters in the State of Iowa. This is based upon
the findings of this study and as the situation changes a
later study may arrive at different findings.
In summarizing the shelter study for the State of Iowa
it is noted that the survival percentages as presented in
Table I indicate that the survival percentage for 4 of the
targets at 30 psi shelter design levels would be considerably
less than 50 percent. Even at a 100 psi shelter design level
two target areas would still have less than 50 percent sur-
vival of the population of the target area.
In determining the cost of sheltere for the State a 30
psi shelter design level was assumed and for a 20 MT weapon
the total cost for constructing shelters in the State is
approximately 172 million dollars. This is based upon a
shelter construction cost of 235 per person. It was felt
that a larger weapon size than 20 MT would increase the
11
shelter cost while the percent of survival of any target
area would decrease.
The number of shelters needed in any one of the target
areas was determined two ways. One, the location was based
upon geographic considerations and the other by establishing
an assumed size, then determining the number of shelters re
quired. The latter method was thought to be the better of
the two methods for locating shelters; for while costs may
be increased the implementation time for the utilization of
the shelters would be less, particularly in the sparsely
populated rural areas.
The basic problem in the construction of shelters for
the protection against fallout radiation is whether or not
to include the use of shelters for the protection of live
stock and grain as well as people. Such a consideration is
based upon the social cost vs. the social benefit principle,
which in this case would justify the construction of shel
ters for the protection of all resources -- human, animal
and others.
It should be noted that the determination of the statis
tical analysis is based upon the most optimum damage situa
tion which could be devised for each of the target areas.
Any deviation from the assumed ground zero in any target
area would increase the survival percentage regardless of
the size of bomb which might be dropped by the enemy,
This study has considered only the protection of the
12
population from enemy attack, but the shelters, if construc
ted, could be used also for protection from natural disas
ters which might affect any area, i.e., a tornado or high
winds.
A more detailed analysis of the needs and requirements
of shelters in the State of Iowa could have been made if
time had been available. A more complete study would have
placed considerably more emphasis upon the construction of
shelters for the protection against radiation fallout. This.
should include a detailed analysis of the feasibility and
cost of construction shelters for the protection of live
stock and other essential resources from the dangers of
radioactivity. Another area of study is the construction
of shelters in the target areas to protect essential re
sources from all the effects of nuclear weapons. While this
study is basically concerned with the protection from nuclear
weapons, some planning for shelter protection against bac
teriological and chemical warfare should be considered.
This is particularly true in an agricultural area where de
fense against such types of attack assumes considerable
importance.
13
TABLF. I. ---= .._, ___ , __
Percent survival seven target cities of Iowa, 20 MT bomb based upon shelter design resistance levels of 2 psi, 10 psi, 20 psi, 30
50 psi, and 100 psi. psi,
% % % % % % TARGET SlJlW, SURV. SURV. SURV. SURV. SURV. AREA 2 PSI 10 PSI 20 PSI 30 PSI ~0 PSI 100 PSI
Cedar Rapids 3 26 29 32 41 52
Council Bluffs 9 20 39 46 55 64
Davenport 3 23 25 38 53 64
Des Moines 2 17 19 49 55 61
Dubuque 3. 12 17 19 28 43
Sioux City (1) 4 5 21 29 38
Waterloo 15 33 50 50 62 72
(1) LESS THAN 1%, ACTUAL .4%
SOURCE: 1950 United States Census Of Population, Department Of
Commerce, Bureau Of Census, estimated population in each target
area from studies conducted for evacuation, IOWA SURVIVAL PLAN,
ANNEX W; population in each psi ring estimated by D.E.W.
. ·------100·-
g~ Rapids Target Area
90
80
70 rl
~ 60 ..-1
:> J.t ::s
(I) 50
'I!R.
20 MT
40
30
20
10
i . o 1 I 1 l '1 1 l 1 \ I 1
2 10 20 JO 4o 5'0 60 70 80 90 100
Shelter Design Resistance (psi)
Figure I % Survival/Shelter Design Resistance; Source: Tab:).e I
'
CEDAR RAPIDS TARGET AREA
DESIGN PSI 10 2., ,,, t 100 I Pi!RCEJITT COST INCREA~E ~ 18 ·21'-f -46 ---~ PE¥2~ft!v~~VIVAL ~----_]_ _ _,________3. _ _1_ 9 1l
80 -
60
20 MT ---1oo psi r-1
~4o
~ tf.l
~
20 10 psi
--------~ -r-- 1 0 ~ J L ___ t _ -~--~----1- ---------~---------•---------·
100 150 165 200 235 250 285 300 350 400 415 450
Cost Per Person ·'
igure I-l Survival Percentages/Shelter Design Levels (Psi)/Cost Per Person ___ _::S:,::o:,::u::r.::;c:_e.:.:_:T::_:a::b~l~e:._::I:_::Sur:=:v::i::v::a::l::::I::n::::Pu:;b::l:;:i;:c:::::S::h:;:e::1::t::er::s:_,:_:F~C~D:A:_:,_:::19:_5::_7~-- -----··--··-·-·
100-COUNCIL BLUFFS TARGET AREA
90
80-~~
70.
60 20 MT ----___ _....-----
.-i 5'0-· (\j :>
..-1 :> 8 4o (/)
* 30
20
10
I ' -
0 10 20 30 40 5'0 60 70 80 90 100
Shelter Design Resistance (Psi)
figure II %Survival/Shelter Design Resistance, Source: Table I
COUNCIL BLUFFS TARGET AREA ' - ' --- -~ . ---DESIGN PSI lQ __ _g_g, ____ 30 0 ___ 1,5)0
-PERCZNT COST INCR~SE ~ 18 __ ?.L::f ____ '!§ __ l _, ~E~gfi}H~!,&VIVAL 19 , 2 ---• _;__ _____ ---9- ----- :
80 ·c
20 MT ----100 psi 60 - /'5o psi
~ 40. ~3o psi
1-20 psi
~ -~ (Q
~ _I
20 / 10 psi
0 100
I t ' ---~-~ 150 165 200 235 250 285 300 350 400 415 450
Figure II-A
Cost Per Person
Survival Percentages/Shelter Design Levels (Psi)/Cost Per Person Source: Table I 1 Survival In Public Shelters, FCDA, 1957 -----------
I
I
I I
100
I DAVENPORT TARGET AREA
90
80
70
60 I 20 MT
50 .-l
"' :> •rl 40 :> I'< ::J
D)
~ 30
I 7-20
10
' 70 80 90 100 0 10 2b 30 40 50 60
Shelter Design Resistance (Psi)
Figure III % Survival/Shelter Design Resistence, Source: Table I
J
c-1
~ ':;! M ;:l
t:f.l
~
DAVENPORT TARGET AREA ' ,----------. ---------- '
i !?_ESIGNPSI J\0 2b ___ 3lo_____ Q_ ______ 1 0
~~~~El~E2~. I ~~ T ~~=1 : ~ 80 ~-
60
40 -·
20
0 100
----,
20 MT __.-------~-----100 ps4
-.------ ... //50 psi
_,/" /
,/30 P'i _______ /.
10 psi 20 psi
.. l.--+----1- t--1-150 165 200 235 250 285 300 350 400 415 450
Cost Per Person
Figure III-A Survival Percentages/Shelter Design Levels (Psi)/Cost Per Person Source: Table I Survival In Publ,;j,c Shelters, FCDA, 1957
100 r
90 -·-
sot 70·
60-
.-I 50., "' :> ·~
.. t':l Ul
40 .
DES MOINES TARGET AREA - -
r -----
I '*' 301 I
201 , .... -/
1: V._;..., ----t--...------,----~---+---o-10 20 30 40 50 60 70 80 90 100
Shelter Design Resistance (Psi)
Figure IV %Survival/Shelter Design Resistance~ Source: Table I
0 ::E )>
tJ> o--; ~')>
Vl :::
>- rr~ > 0--i '-;;o
~?< "' -r o-
~ti ..-;;; ;;o )> ;;o -<
l''"' iL ~.J
on ClJ 0 en e-=, <:4,-.:f
I -··-----. _ .. ___ , ________________ .
TARGET AREA
80
60
lto -
20
m:s MOINES J
j};lESIGN PSI 1 _ .,.YERCENT COST .INQREA E 21
PERCENT SURVIVAL 2 _ .. ..niCBEHENT ... ---- --·----
---'20 psi 10 psi
2f ~~ 3t 2~ f ~ --~j
20 MT ------- ------------ 50 psi
100 psi
30 psi
0 ~-oo 1501
;65 2ob 23~ 215o 2S5 1oo 350 ltoo lt~5 i -. lt50
Cost Per Person
Figure IV-A Survival Percentages/Shelter Design Levels (Psi)/Cost Per Person Source: Table I Survival In Public Shelters, FDCA, 1957
'----------- .. •·• I
100 l 90 j·
! 80 1-
701 I
601-50-~
.-t •
. ~ 4ol-g 30 L ~ 1
0 -
DUBUQUE TARGET AREA
\ !_, (
10 20 30 40 50 60 70 80 90 100
Shelter Design Resistance (Psi) !
.__ ___ F_::igure V % Survival/Shelter Design Resistance, Source: Table I I -------· ·---· -···---·
DUBUQUE TARGET AREA .----··------·~---- ~ -------- . . !~,.~.~~. n;~~ ·~ 2~-2 ~8 -j- a-::- -------~r t PEj~~W~J:~VIYAL. ____ L _____ _5 ____ . _____ 2__! ____ 2 ________ 15. ____ !
80 ...
60
r-1 «! >
•.-I 4 > 0-·· ··100 psi
~ <J)
~
20
0 !. .• _, ____ -+ '
~-5o psi
~2o;;i-3o psi
10 psi
100 150 165 -+---~-+-----L---t--
200 235 250 285 300
Cost Per Person
-· ····+-··-· ' ... L ....... -. I 350 400 415 450
I
Figure V-A Survival Percentages/Shelter Design Levels (Psi)/Cost Per Person I Source: Table I, Survival In Public Shelters, FCDA, 1957 J
100. ---·· . ---------SIOUX CITY TARGET AREA
901 I
80 L
70 -·
6o .•.
';;I 50 -~-:> •rl :> 13 40. m ~
30
20-l- /~--
lOt// 0 I/-'
' \ 10 20 30 40 50 60 70 80 90 100
·1 Shelter Design Resistance (Psi) , Figure VI % Survival/Shelter Design Resistance, Source: Table I L- ... -·----~------ -- -·----·-·
rl
,.
fl? ~~
81 I
6
SIOUX CITY TARGET AREA "
B;SIGN PSI --- l b_ 2b < B;RCENT COST INCREA ~E 21 f-· _18 - ~ _ ..... ···- ·-··-I]; .QDRVIVAL 1 16
-r:;h _li· 0 • 46 21 I
8 ! 9 ' --·-~ I
~ ·:; 4Q~.
-- 100 psi 1'-i ::; 20 MT (J)
~ )0 psi
20 /30pd . ; lq··-p-s-i-""'20 psi , , , .
OL----.1..-+ . ··---- . --~--- ----t ..... ··--t- ··;
100 i 150 165 2oo 235 250 285 300 350 4oo 415 450
Cost Per Person
I
I
Figure VI-A Survival Percentages/Shelter Design Levels (Psi)/Cost Per Person
1.
So~ce: Table I, Survival In.E~blic Shelt~, FCDA, 1957 .. -- -- -
1:: J WATERLOO TARGET AREA
so I 70
60
.-1 50
-~ ':;! 40
/~-" -----------------~----------~~----~---··· /
l'i ;:l
CQ
-~ 30
20 I
i ' I
10
0 I
0 10 20 30 40 50 60 70 80 90 100
Shelter Design Resistance
Figure VII %Survival/Shelter Design Resistar-:ce, Source: Table I ~·~------ ·-----.. ··----·--·---··-·--------------·---~----·-··· .
' I
I
I
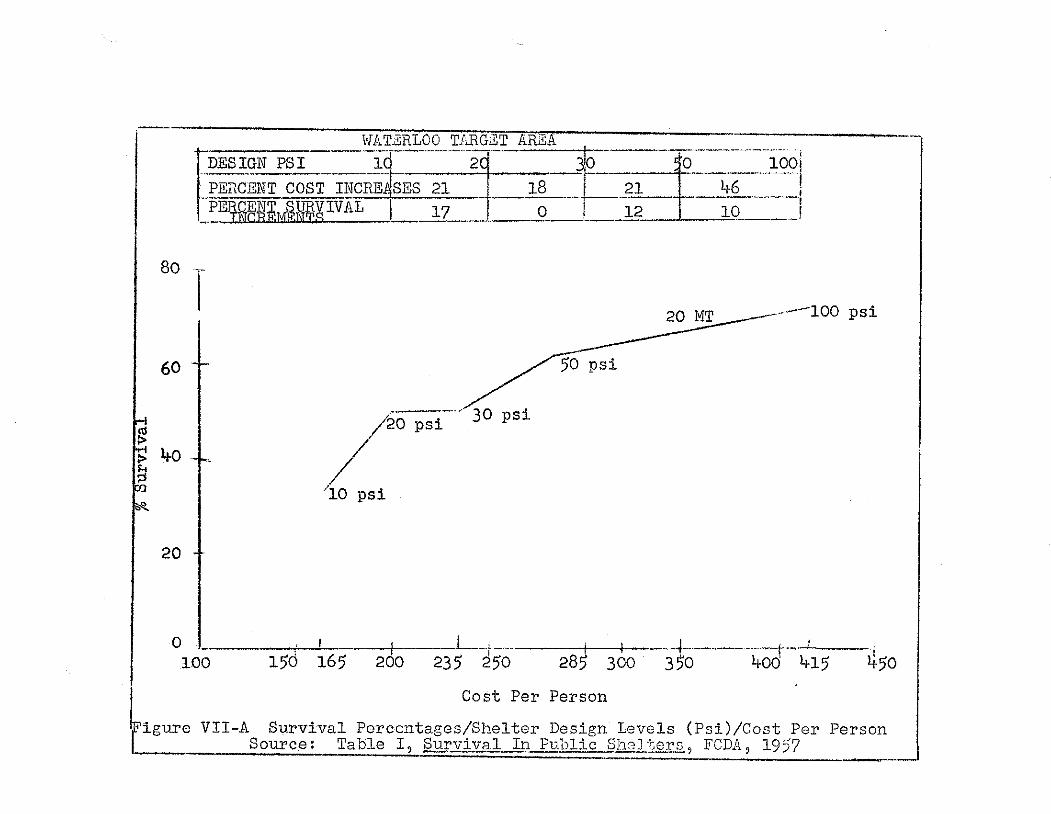
lrJATi!:RLOO TARGET AREA t--DE_S_I-GN_P_S=-I -- ld------ --~------+3i0 ____ 10 ---------iooi ::!:E~CENT COST INCREASES 21 ~ 18 __ :c 21 46 :-~~~-~~-~ ;--~E~fi~UJ:~XIVAL I 17 - 0 J 12 - 10 _I
80 ,_
I 20 MT ----100 psi
60
40.
20
0
/20 psi
/ -'10 psi
/"5o -- 30 psi
-----i-~1 ----1------L--'- _ lDO 150 165 200 235 250
psi
-+-------+---_( 0 350 400 415 ~50
I Cost Per Person
figure VII-A Survival Percentage.s/Shelte_r Design Levels (Psi)/Cost Per Person I_ ____ _:S::.:o:::.u:;:;r:_c::;e::;:_: _T.:::a::..::b.:::l:::_e_:::I2,_,S::u::r::::v::;i::::v::a::l=:I:.;n:::::::P::u::b;::l::;i:;:c:::::;S.:;h::2:::J:;t:;e::t:;s:_:9~F::_C::_-:D:A:_:9_::1:.::9:.::5~7---~-
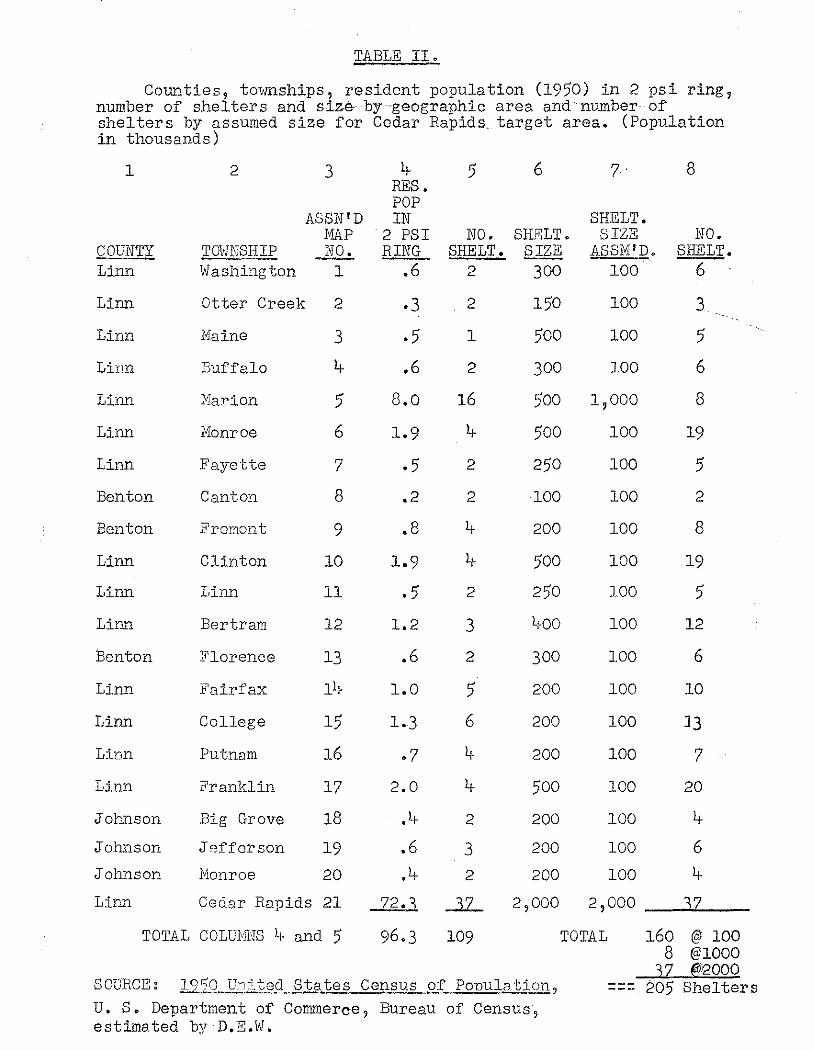
TABLE II.
Counties, tovmships, resident population (1950) in 2 psi ring, number of shelters and siz.e- by ·geog:raphic area and· number of shelters by assumed size for Cedar Rapids target area. (Population in thousands)
1
COUNTY Linn
Linn
Linn
Lirm
Linn
Linn
Linn
Benton
Benton
Linn
Linn
Linn
Benton
Linn
Linn
Linn
Linn
2 3
ASSN 1 D 1'1A.P
T01tiN§HIP NO. VJashi:1gton 1
Otter Creek 2
Maine 3
Buffalo 4
Marion 5
Jl!onroe 6
Fayette 7
Canton 8
Fremont 9
Clinton 10
Linn 11
Bertram 12
Florence 13
Fairfax 14
College 15
Putnam 16
Franklin 17
Big Grove 18
Jefferson 19
Monroe 20
4 RES. POP IN
2 PSI RING
.6
·3
.5
.6
8.0
1.9
.5
.2
.8
1.9
.5
1.2
.6
1.0
1.3
.7
2.0
.4
.6
.4
5 6
NO. SHELT. SHELT. SIZE
2 300
2 150
1 500
2 300
16 500
4 500
2 250
2 100
4 200
4 500
2 250
3 400
2 300
5 200
6 200
4 200
4 500
2 200
3 200
2 200
7
SHELT. SIZE
ASSJVI' D. 100
100
100
100
1,000
100
100
100
100
100
100
100
100
100
100
100
100
100
100
100
8
NO. SHELT.
6
3
5
6
8
19
5
2
8
19
5
12
6
10
J)
7
20
4
6
4
Johnson
Johnson
Johnson
Linn Cedar Rapids 21 72. "\ _l2_ 2 '000 2 '000 ----'"~~--
TOTAL COLUiViNS 4 and 5 96.3 109
SOURCE: 19'50 UCJ~1 teg._ States Census of Ponulation, U. S. Department of Commerce, Bureau of Census, estimated by D.E.VJ.
TOTAL 160 @ 100 8 @1000
37 @'2000 205 Shelters
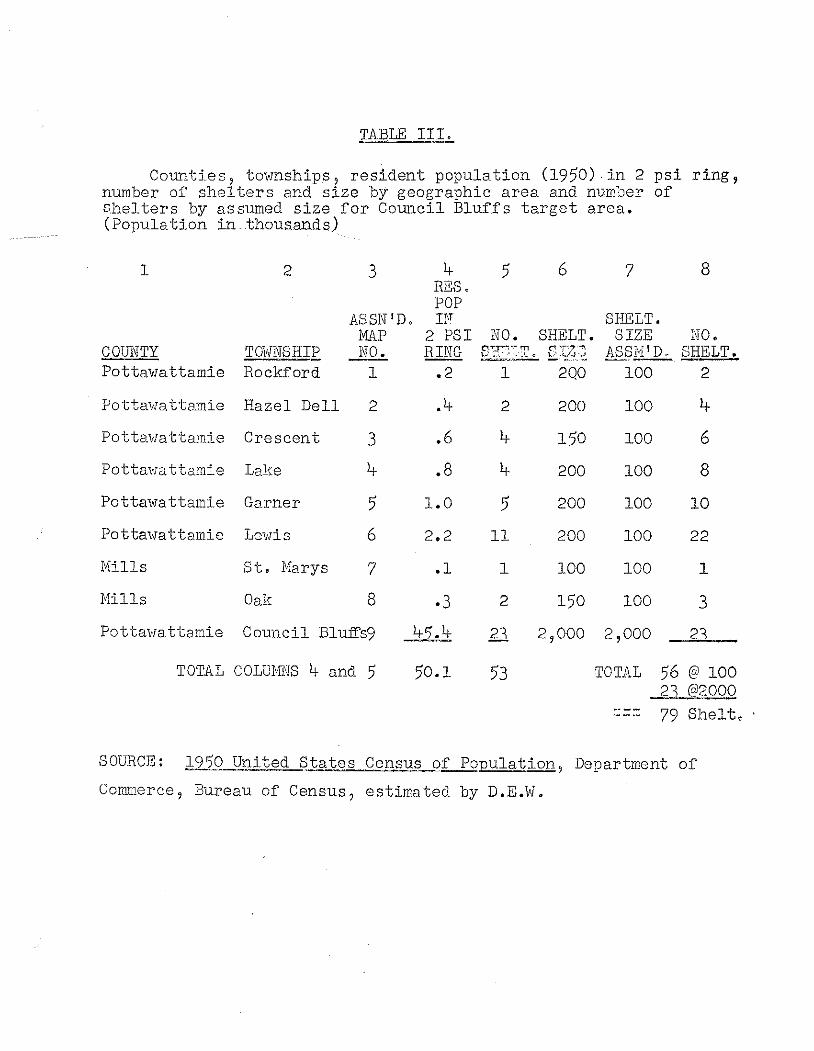
}'ABLE IJ:.I.
Counties, townships, resident population (1950).in 2 psi ring, number of shelters and size by geographic area and number of s.helters by assumed size for Com1eil Bluffs target area. (Population in thousand:o;)
1 2 3 4 5 6 7 8 RES. POP
ASSN'D. DT SHELT. MA.P 2 PSI NO. SHELT. SIZE NO ..
COUNTY TOVJ]I)SHIP NO. RING f~:2~-~ -~ 0 rr~~-;-J. ASSJvi'D. SHELT. Pottawattamie Rockford 1 .2 1 2QO 100 2
Pottawattamie Hazel Dell 2 .4 2 200 100 4
Pottavrattamie Crescent 3 .6 4 150 100 6
Pottmva ttamie LaJ'e 4 .8 4 200 100 8
Po ttavra ttamie Garner 5 1.0 5 200 100 10
Pottavmttamie Lewis 6 2.2 11 200 100 22
Jvrills St. Marys 7 .l 1 100 100 1
Mills Oak 8 ·3 2 150 100 3
Potta1:1a ttamie COUl1Cil Bluifs9 4') .4 21 2,000 2,000 21
TOTAL COLUMNS 4 and 5 50.1 53 TOTAL 56 @ 100 21 @~000
79 Shelto
SOURCE: 19')_Q United States Census of Ponulation, Department of
Commerce, Bureau of Census, estimated by D.E.W.
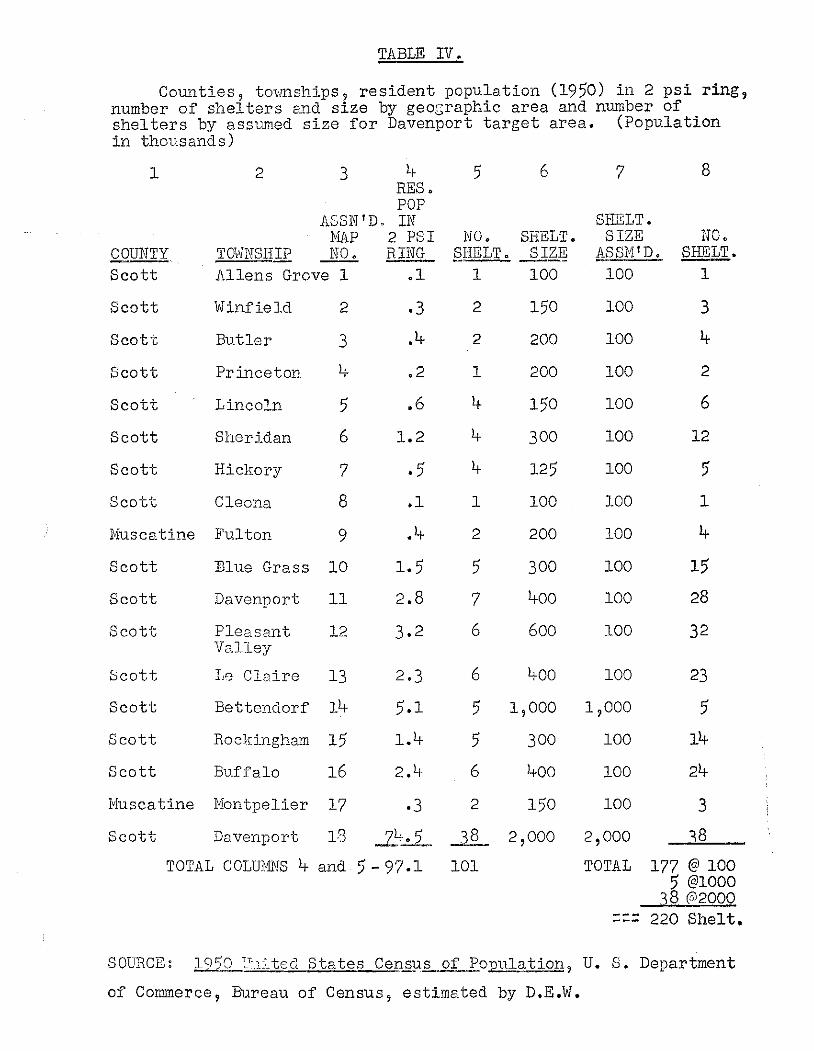
TABLE IV.
Counties, to-vmships, resident population (1950) in 2 psi ring, number of shelters and size by geocraphic area and number of shelters by assc@ed size for Davenport target area. (Population in thousands)
l 2 3 4
COUNTY Scott
RES. POP
AGSN'D. IN JVlAP 2 PSI
TOWNSHIP NO. RING Allens Grove l .1
Scott Winfield 2
Scott Butler 3
Scott Princeton 4
Scott Linco~n 5
Scott Sheridan 6
Scott Hickory 7
Scott Cleona 8
!v[uscatine Fulton 9
Scott Blue Grass 10
Scott Davenport ll
Scott Pleasant 12 Valley
Scott Le Claire 13
Scott Bettendorf 14
Scott
Scott
Rockingham 15
Buffalo 16
JvJuscatine JV!ontpelier 17
·3 .4
.2
.6
1.2
.l
.4
1.5
2.8
3.2
2.3
5.1
1.4
·3
5 6
NO. SHELT. §HELT..:. SIZ]j;
l 100
7
SHELT. SIZE
ASSN 1D. 100
2 150 100
2 200 100
l 200 100
4 150 100
4 300 100
4 125 100
l 100 100
2 200 100
5 300 100
7 400 100
6 600 100
6 lfOO 100
5 1,000 1,000
5
6
2
300
400
150
100
100
100
8
NO. §lillLT.
1
3
4
2
6
12
5 l
4
15
28
32
Scott Davenport 18 .1.t:..:.2... __]§__ 2 '000 2,000
23
5
14
24
3
i8
TOTAL C OLUHNS 4 and 5 - 97.1 101 TOTAL 177 @ 100 5 @1000
'\8 012000 220 Shelt,
SOURCE: 1950 ~r-_15" ted States Cel}S:\1~ of l2_opulation, U. S. Department
of Commerce, Bureau of Census, estimated by D.E.W.
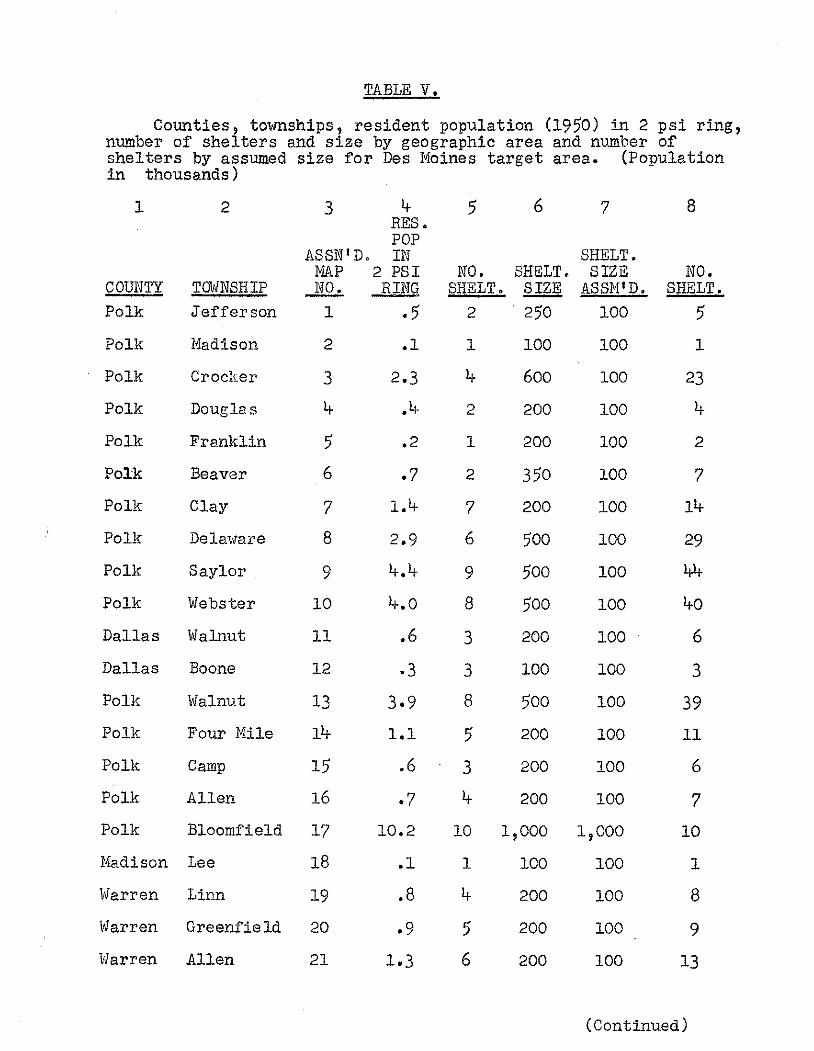
TABLE V.
Counties~ townships, resident population (1950) in 2 psi ring, number of shelters and size by geographic area and number of shelters by assumed size for Des Moines target area. (Population in thousands)
1 2 3 l.j. RES. POP
ASSN 1 D. IN HAP 2 PSI
COUNTY Polk
TOWNSHIP Jefferson
.JiQ.:. RING 1 .5
Polk Madison 2
Polk Crocker 3
Polk Douglas l.r
Polk Franklin 5
Polk Beaver 6
Polk Clay 7
Polk Dela1:1are 8
Polk Saylor 9
Polk Webster 10
Dallas Walnut 11
Dallas Boone 12
Polk Walnut 13
Polk Four Mile llt
Polk Camp 15
Polk Allen 16
Polk Bloomfield 17
Madison Lee 18
vlarren Linn 19
1rJarren Greenfield 20
Warren Allen 21
.1
2.3
.l.r
.2
.7
l.lt
2.9
l.r.l.r
tr.o
.6
·3
3·9
1.1
.6
.7
10.2
.1
.8
5 6
NO, SHELT. SHELT. SIZE
2 250
7
SHELT. SIZE
ASS£1Jl D. 100
1 100 100
l.j. 600 100
2 200 100
1 200 100
2 350 100
7 200 100
6 500 100
9 500 100
8 500 100
3 200 100
3 100 100
8 500 100
5 200 100
3 200 100
l.j. 200 100
10 1,000 1~000
1 100 100
l.j. 200 100
5 200 100
6 200 100
8
NO. SHELT.
5 1
23
l.j.
2
7
llt
29
l.j.l.j.
tro
6
3
39
11
6
7
10
1
8
9
13
(Continued)
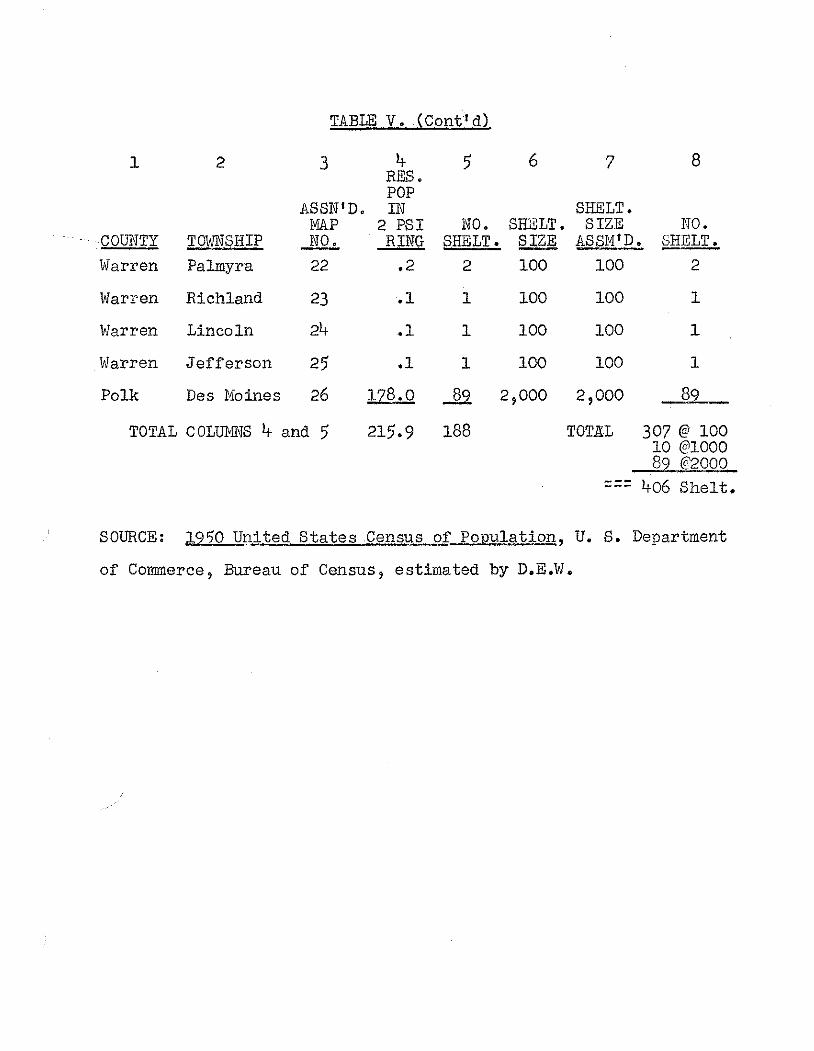
TABLE V. (Cont 1 d)
1 2 3 4 5 6 7 8 RES. POP
ASSN 1D. IN SHELT. MAP 2 PSI NO. SHELT. SIZE NO.
COUNTY TOWNSHIP ...N.Q.!. RING SHELT. ~ ASSM 1D. Sill~ Warren Palmyra 22 .2 2 100 100 2
Warren Richland 23 .1 1 100 100 1
Warren Lincoln 24 .1 1 100 100 1
Warren Jefferson 25 .1 1 100 100 1
Polk Des Heines 26 178.0 .Jl2. 2,000 2,000 89
TOTAL COLUMNS 4 and 5 215.9 188 TOTKL 307@ 100 10 @1000 82 @2000
406 Shelt.
SOURCE: ~250 United States Census of Po2ulation, U. S. Department
of Commerce, Bureau of Census, estimated by D.E.W.
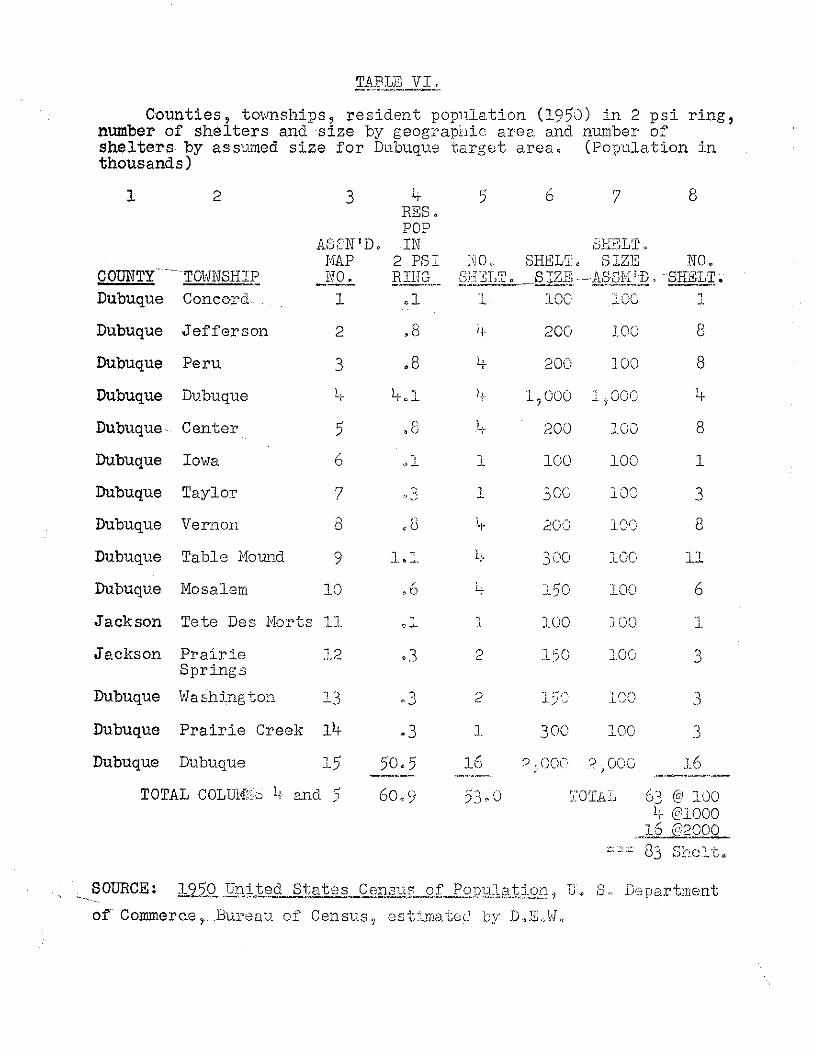
!,~~1~.-YI "-Counties, townships, resident population (1950) in 2 psi ring,
number of shelters and size by geograpr1ic area and number of shelters by assumed size for Dubuque target area. (Population in thousands)
1 2 3 ' I" 6 7 8 '+ )
RES. POP
ASfN'D. IN SI-E~LT,. MAP 2 PSI NO., SHEW, SIZE NO.
COTThlTY -- TO\'JNSHIE _N£.:.. RIHG S}f~IJT, _S ±ZE! --L\.J?.§Jvl~J2. · SHEI.J;. ---·--Dubuque Con-cord 1 .l
., 100 lOO 1 .;..
Dubuque Jefferson 2 ,8 '+ 200 IOO 8
Dubuque Peru 3 .8 4- 200 100 8
Dubuque Dubuque l..;- L.. 1 '·~
L!. 11000 "": "!" "· .J '1 Vdl. .. .: 4
Dubuque Center 5 ,8 ~- 200 100 8
Dubuque Io11ra 6 ; l 100 100 1 o.L
Dubuque Taylor 7 ~ ... ., 3CC 100 3 J.
Dubuque Vernon 8 .8 4 2CO lQC 8
Dubuque Table Hound 9 l.l ' LJ· 300 lOC 11
Dubuque Hosalern 10 ~6 4 150 lOO 6
Jackson Tete Des lvlorts ""1 'l ' 100 J .. OO "1 .-1..-<. o.L ' .L
Jackson Prairie ].2 .3 2 1~50 l.CG ., :J
Springs
Dubuque vl a shj_ng ton l3 r.] 2 1?.:: 1SO 3
Dubuque Prairie Creek llt .3 1 300 , (\(\ ...Lvv .3
Dubuque Dubuque 15 50.5 16 ') ,.,,.."Jc· .- ;lA '? ocu 1 ?.
.J_\.) -------- ·-·-~~~--
TOTAL COL Ul•f::,S 1j and 5 60.9 53-0 ~;-~OT.AI.~ ... ·~ 0_, @ 100
I. -;~ @1000
_16 @~000 --·- 83 Sl-:_t~1t4
SOURCE: ;:L. Department
of Commerce, .Bureau of Census, est:.maceJ by D.E .. H,.
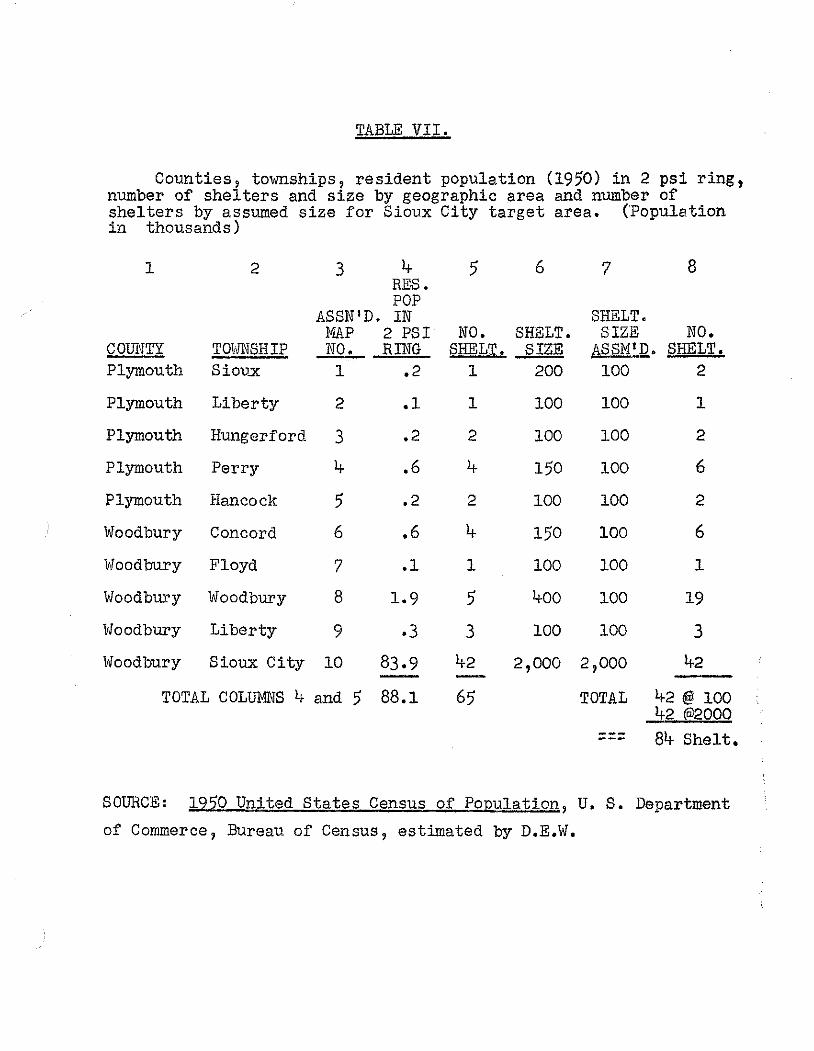
TABLE VII.
Counties, townships, resident population (1950) in 2 psi ring, number of shelters and size by geographic area and number of shelters by assumed size for Sioux City target area. (Population in thousands)
1 2 3 4
COUNTY Plymouth
TOvJNSHIP Sioux
RES. POP
ASSN 1D. IN MAP 2 PSI NO. RING
1 .2
Plymouth Liberty 2
Plymouth Hungerford 3
Plymouth Perry 4
Plymouth Hancock 5
Woodbury Concord 6
11/oodbury Floyd 7
Woodbury Woodbury 8
\lfoodbury Liberty 9
Woodbury Sioux City 10
.1
.2
.6
.2
.6
.1
1.9
·3 83.9
TOTAL COLUMNS 4 and 5 88.1
5 6
NO. SHELT. SHELT. SIZE
1 200
1
2
4
2
1
100
100
150
100
150
100
400
100
7 8
SHELT. SIZE NO.
ASSM 1D. SHELT. 100 2
100
100
100
100
100
100
100
100
1
2
6
2
6
5
3
42 2,000 2,000
1
19
3
42
65 TOTAL 42 @ 100 42 @2000
84 Shelt.
SOURCE: 1950 Unjted States Census of Population, u. s. Department
of Commerce, Bureau of Census, estimated by D.E.W.
TABLE VIII,
Counties, townships 2 resident population (1950) in 2 psi ring, number of shelters and s1ze by geographic area and number of shelters by assumed size for 11Jaterloo target area. (Population in thousands)
1
COUNTY Bremer
Bremer
Bremer
2
TOWNSHIP Jackson
Jefferson
Maxfield
BlackhavJk Lester
Blackhawk Bennington
Blackhawk Mt. Vernon
Blackhawk Washington
Blackhm..rk Union
Butler Beaver
Grundy Fairfield
Blackhawk Cedar Falls
3
ASSN'D. JI:!AP NO.
1
2
3
4
5
6
7
8
9
10
11
Blackhav1k East Waterloo 12
Blackha111k Poyner
Blackhawk Barclay
Blackhawk Fox
Blackha>vk Cedar
Blackhawk Orange
Blackha111k Blackhavrk
Grundy Grant
Blackhawk Lincoln
Black.havk Eagle
13
14
15
16
17
18
19
20
21
Blackhawk Waterloo 22
TOTAL COLUHNS 4 and 5
4 RES. POP IN
2 PSI RING
.4
.6
1.1
1.0
.4
.4
·3 15.8
2.0
1.4
.3
.2
·9
1.1
1.2
.4
.3
.4
5
NO. SHELT.
2
2
2
2
4
5
5 4
2
3
10
4
7
3
2
3
4
4
2
2
4
65.]: 33 91r.6 109
6 7
SHELT. SHELT. SIZE SIZE ASSM 1D.
200 100
250 100
250 100
150
150
200
200
100
200
100
100
100
100
100
100
100
100
150 1,000
500
200
100
100
300
300
300
200
150
100
100
100
100
100
100
100
100
100
100
100
2,000 2,000
TOTAL
8
NO. SHELT.
4
5
5
3
6
11
10
4
4
3
16
20
14
3
2
9
11
12
4
3
4
33
SOURCE: 1220 United States Census of Ponu1atio~, u. S. Department of Commerce, Bureau of Census, estimated by D.E.W.
137@ 100 16 @1000 ii @2000
186 Shelt.
. __ ..___ --- ...,__.....__ __ - ---+-------+---- ---!-?----- ----+--1 u t.o 19 ,s I
I I I I 1--
1 I 1 l I I L ) I :
1- ZCJMT: p~f:SSIJ~ cor-frou1't1i- su~]cE I$W~S) I I
I I !---1 •. I
~ I I
\_r, I i t=-----+------+------......._- ___ L_
-, I I ' 1 I I I
1 I I -r---~---+---
1 I I
I --t-3 I I!
~- I I I ---t---t-------+
5 I
I I
-~t I I
1 I
I ~---
--~---l 1 r---1 I
s-! I ___ __,.... ___ j __ j __
( ? 1 a I \ I I
t _ __,.J ::1 I . -~--~---t-----
1 I I .--- ___J
, I I I }----_l-~--.-_j~--
1 _ 20
MT PR~'S~RE c:ot~root<s- f'JI"<I=AC.C 13\JRfT I COUNCIL BLUFFS -t A~S14N£r::> Tot"t'u; •. nr Nu""e~Yts 1
i I i _c_j -Ll I i ---r---t--lL_ 1 L?--t-L I I I I I I
I I I I ----....-------+--..!' ~ ...... J f/·~~ II
~ - !_......- I ._,. i I '-~ ~· ..... ~~
I I I i ) --- ---~-- -r--~t--;-t 4 :
I 7 I I r-- -·1 I I I I I I
I
I --~
L_ I
______ ..
I I I
j_ 17 I
I I
:::;:;:;=----=.:::::L ~-. I IZ.
....
I- ZOMT pRE.SSU~€.. conTouRS- SlJRFAce BURST DAVE:NPORT - ASS14tU:C TOWNSMIP NUMGE.RS
•
\
I I I
\ I ~-t--
L_,_J I
I I
I
I
I I s-
-f---t -~t--;--p---- I'' I I f I \
I I I :z.' I ' --~-------+--------L----t---+----
1 1 I I I
-~---1
I I I I ', : I I I ' ----r--~---+---~~
1 I I 1
I I I I I I -+--1 /_::: Zo-"l_L__~RE -'1:T0Uf1._>_ ::__SU~FA<~ BURSt ___ +I __
I ousucaue. A'SSI41"l£b I WNSt·UP N~SG:RS" r I
:-----r I i I
/ I I I II
' I I I I I +- -+ __ _L ___ _ r----.---,---~-- ~- I
',, I I 1
I I
' I • I --+--- -----
6 I i
I I I
~--L. rj__,_j I I ! I I
• __ 1 __ -L,, -t----·--------; +-
! • I : I ~~ [ I I
~-----+---~--~-\ i I I
• 1 I I ,/ __ L _l_~ 1- .Z ()M T PRf.SSUQt: C.CN To u"R'F..Ke. au R5;T
Sioux Cfy - ASSI41<1ED TowN SH eE.Rs
I I I
-+--I I I J,_
I I I
I I I
I I II I
I I :
-Ll. /~ ~---~-~=-==-::::-=-....J....,----l----~------, I I I
7 ' I I
t--_/ I'\ I I I I
--~ ___ j ~-,_-l_-~_1_ ____ ~-- ~--1 ' I I
I I --r---1
I I
l ;; I
I I I
I I I t---- --j-\---
1
I l I ~----
I I I
1 :
'--- /','--/ I
I I
-+------+--1
I '
I ~ r--/"' I /-----... ( ) I
~--r---. -1 "'~r ~ r (~ r--i--, I L ~ I l I l- ) I I I 1_ '30 MT PRf:$SUu RE koNroui~S- IJRFA(-15 13Uf?ST +
--fE.DA~APIDS1 ----~ ~--r--1_L__ __ ' r------1 \ I I I
1, I
'\ I
I
v', I
I I I I
..............;----~----L-1
1 I I
1 I I --t---r --~---+--· I I I I
I ! I
--+--- '----+---: I I I I ~---
_t__ r-----1 I I r--1 I I
_j __ j __
I I I
I I I I I
I _l_ -~--+----1 I I
r--- __J
-2--\ I I I _l ~-, }-- -f-----,--- r-----
1- 30 MT PRfiFSUR.€ c.o~Toul~s- sURf~c.k I'?Ui~Sf 1
COUNCIL BlUFFS \ I ! l
------
I I I
I I I
---~---(- 30 MT PR€-SSURE CO~Totr~!>- SURFACE BU~T
DAVE:.N PORT
I I I
_ ... i',
I" I ...... _~--- ~~~~
I 1 I ',__,__ __
I I I I --+ ---~--1 I
: I ---t- --+--
: I
I I _j_ __ -'---+---j_ ___ s ---...........,...~
I I I I I I I I I ' I I : I \
--~---------+---- -L---+--- ---1 I I .I I \ I I I I I \ --t--- ----r----+----+---r--· ! I I I I I • I I I I
-l--1 L:::3Q..MT_~ ~s~u ~~ _!~ rDIJ RS _:-__$RFAC£ __!!vRJ~ ___ ~ __ I DUSUQU~ I I ! l I
t-----~ I 1
l I I I I I I
I___ --+-' ---+-----"! ....__ I I I (-· _, ___ _L ___ j
',, j I I I 1
1 I I
',, __ J ___ +---+-- I I I I I -t----t
.l-:30 MT StOt.IX Cify
I I I I I :
~--- I -------t I I I I
--f-t_j __ , --,_1
I I I
I I ~~--+--
1 I I I I
-/!.. ~-- :::+---~---t-\ I I I
) I I I ~""e<"S<<I<li LOI4TO\'!!"~¢e ""RfT __ L _J __
I
-~----+---~
--, I
I
I I I I • !P I
I I ~ I
I I /"' I /~ ( \ I ~ ~~t-""- I ) L
I I I
----!-i I I
----!-I I I
t---1 I
---t- --, I I c\ __ I : I I l I I I L ) I :
--i-· I 1- 60 MT PRESSURe coN-fouRs l suRF::AJ:.e:. 6UR.LT +I
---f£DA~APIDS8 ---~ r--f--_1
_L__ __ I t ~---~ \ I
' I I
I I I :
\..L..--1--c------+- --- ---t--, I I I
I I I I I ~--t----r-- ~--~--
1 I I
I I I -t----+ --t---
1 I I I I ~--t ___ l --1 I I r--· I I I
..............__-.p_j __ j __
I I
--s- I / I /
I _l_r__ --+----1 I I , /_j I
~t ,_ _ _l_f---,-_lf---1- eo MT PR€S~URE C.ONTOU~'S- suR.FAdE: BURST I
couN c' L 6LUrF.S \ 1 ! 1
---t---1--~Ls,-J I I I I I I i I
I --+---~ --- --- I, _ ~- ... -J f ... ~- ...
Ll I I L-+----, I r r--L I I I I
I I
'-~
: I I 1 I I I I I I
-----t----t-----+---TJ :
I I i ~---1 l I I I
m_.., ...,j......,.___..,_~ _L~ ...,.#
I _J
I I I
L __ --~-~. I
l ;r----
\-60 Mr DAVENPORT
10
---.e--
I I
- I, ____ .......,.... ____ "!=---------_+-1-_------+-------t--1 --l I I I
-r- -l "1, i I j \ r-------+---r--I I I
I I I I
t----t-1 :
I I I
\1 I 1 1 I I
-~ l_-r---t', I I I
I I I I
I I I
_ ... 1', I
---1--,i~-~~r- .......... .....,...._ _____ _ ... ,
I \
I I
-+-----r-1 I
I I ~---t-
1
I I __ j_ __ _
I I s I I I I I I I : I
-- ---L---+---+---' \
1 I 1 I
I I \ I I 1 ' I \ --+--- ----r----+----+---r---: I I I I I I I I I I
__ I I_:::::_~T-~PR€S.SUR£_to!'IITouR~-JuRFAcE._ 8.!JL •r_ __ + __ I DUBUQUE' I , t r ,
r-----~ I I I I I
I I i I I I
,------~---r--1 --~---J ', I 1 I I I """ I 1 1 I I
', I 1 I I , --t---. ---r----4>.----+
I-60MT Sioux c.'fy
I I I I I I I I
~--- I -------t
I J I I I
__ 11_ ___,__L
I I I I I I
__ j;---·- 1---t- -~-
1 I i t------+- -t--I-
l I I ~ ,J I I I
P~Essu~:o>& C.ON~--- __ L _j __ \_"'S - SUI";?FAC£ i5'CJRS'r
-+---~---r----t----+----+--1 : I I I : I I I I I ----1 I
_T ___ : L-~--~---r I L_ ____ / I I I I l
I I I
--- ----+-----~-
I I I I
_j_~--~ I
I l
t---t-
1
I
\ I
I I I
--i--I I I
--~-I I I
'" 1 I --t-· __ ___j l ~---.,...__ s---- "\ I
l----~ I
I ~ I I I '--
--1-----
1 I I I ( I I "Z I I )-
.- t -1-SOMT-~ P~E.>SURE icoJJTOURS :::1-suRFACE EtRs.;=----1 I WATERLOO I ! I I !
8 I I
• - -o~--- ----~------+------ ---+-___,.,.-. ---+--- ----4----
1 : I I I I ~ I 1--
1 I /"" I /"" /\ I : I-" ~/'--r~/ y ) L t ---r----: I I "~-- ~-- --
' I L ) I :
---fEDA_!LRAPID51 --~ r--r--,-L__ __ I l :---~ \ I
' I I I
'v, I :
t=-----+--- --- ---f--\ i I I I
I I I I -- ---r---~---+--· I I I I
--r-...1 i I
~ ~---+ ---+---i---
1 i ! I I ~--·
~.,L---\-H'~~---~---~-- t --I---1 I I r---1 I !
---¥-----J __ j __
I I I I \
__ •z I 1 .
' _L_r---.-1---r------1 I I
..-- ___.J
, I I I }---_l-f----.--__j~--
4- 5 MT p(:l.e.*UC:i!£ CONTOURS~ SU~FACE' GU~ST I COUNCIL BLUF'F'S \ I I I
+-1
I i _c_j -Ll : . i
--- ---t--IL l L?--r--L : I I I I I I I I I I I
--- --- I ' I ___ j ..,...,-~'l~VL I ' I ... ,_~ I ... f\ ... ~,
I I I I I I : )
I I 1 I --- ----t----c- J ,
I I --1 I I I
I
--~
J I )
I I I
L---+ I l I
____ .,., ;r----
4- 5 NT PREssu~c c:o~TouRS - suR.FAc£ 13URn
DAVENPORT
- ---,--
1
I
I I
I I I
... ......r--- _..,..._...... _ ... __
I I I ___ t ___ .... '-....- "'- i
I I I \ ~ I I a \\ 1 i
--J-----+---~ /// I ~-t--: I I r--/ L__,_J I
I I I I
I I I --r----- ---,----, ----J-----..__ __ I I I I
I 4- sMr : PR&S'SU!leE L~TOUR~- .S~RFACe BI.IR..STI II
: DES MO«Wf i I I
_ ... 1',
:"' I ...... _
I 1 I
I I I --+----~ -- ~t-1-1-r--~,
I I
I I --t----f-
1 I I
I I I --1----4---- ---~~
I I : I ' I I I : I \
--r----------+-------L----t---+---1 I . I I \ I : I t
1
1 \
I I I \ --t--- ----r-----+---+---y---1 I I I I I I . I I I I
I 4-SMT : PRiissu~e ~tN-rt~uRs _:_sukrAc.E_ mJ~s~ ___ _j_ __ ----+--' DUBUQUE-~- - I 1 r ,
,-----~ I I I l I [ I I i
',, I 1 I I I
"" I I 1 I I _I I 1 I t
~\~ ~---,---r--i---t I I I
---M---- I -------r l
I I . I I
----, -- j_ I I I - ---r ___L
I 1 I -s I 1 I
t----- ---' +-' I . +---- ---z' I I
I I I I I I
~----+---~--~-\ l I I
) I I I 4- 5MT p~e.ssu~E c• ... Tor SU!!':!'=f 6U ... '>T __ L _l __
Siou~~; Ci~
--t----~---r----t----+----+--1 : I I I l
I -----1 I I _T ___ l L~--~---~---:
I ._ ____ / I I I
I I 1 -+---- --- -+-------i---
1 I
I I -t--- -+--.f--
1
I I I
---t--I
• I _J,_ I I I