Embed Size (px)
Citation preview

FIRE DISTRICT SACRAMENTO METROPOLITAN
COMPREHENSIVE ANNUAL FINANCIAL REPORT FOR THE FISCAL YEAR ENDED JUNE 30, 2014
CALIFORNIA

COMPREHENSIVE ANNUAL FINANCIAL REPORT For the Fiscal Year Ended June 30, 2014
PREPARED BY THE FINANCE DIVISION
Sacramento Metropolitan Fire District 10545 Armstrong Avenue, Suite 200 Mather, California 95655

TABLE OF CONTENTS
INTRODUCTORY SECTION Letter of Transmittal . . . . . . . . . . . . . . . . . . . . . . . . . . . . . . . . . . . . . i
Directory of Officials . . . . . . . . . . . . . . . . . . . . . . . . . . . . . . . . . . . . . . vii
Organizational Chart . . . . . . . . . . . . . . . . . . . . . . . . . . . . . . . . . . . . . viii
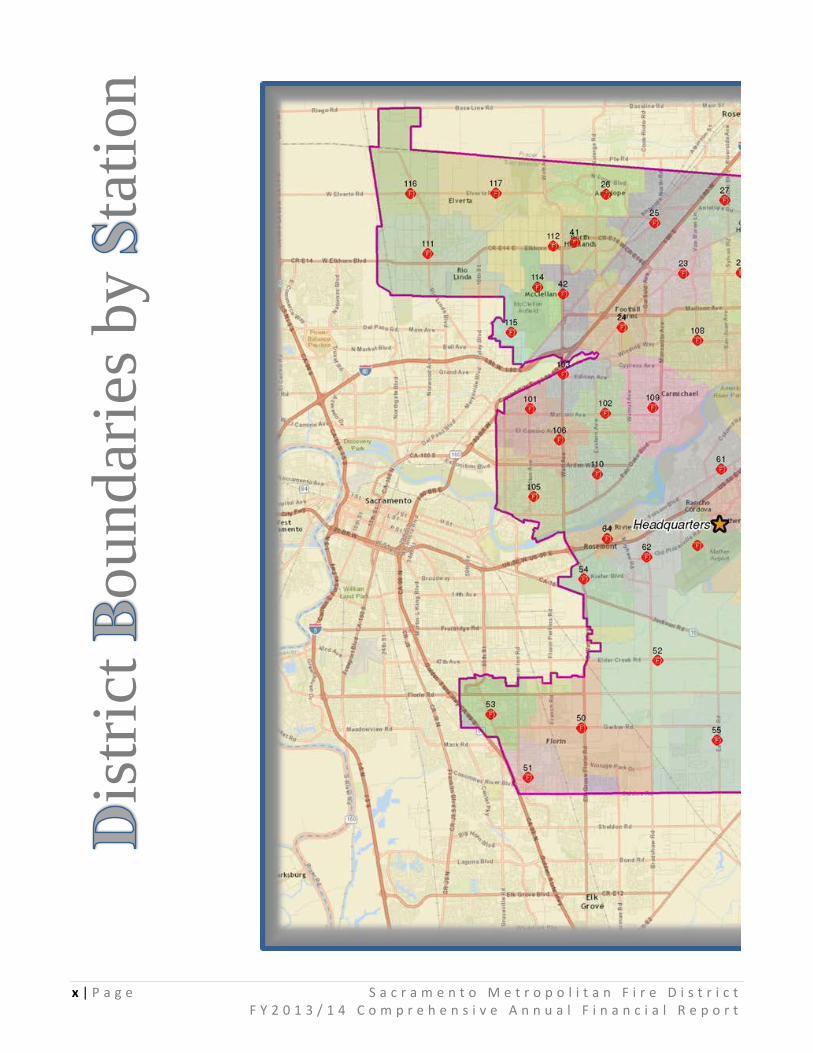
District Boundaries by Station . . . . . . . . . . . . . . . . . . . . . . . . . . . . . x
Stations and Facilities . . . . . . . . . . . . . . . . . . . . . . . . . . . . . . . . . . . . . xii
District History . . . . . . . . . . . . . . . . . . . . . . . . . . . . . . . . . . . . . . . . . . xviii FINANCIAL SECTION
Independent Auditor’s Report . . . . . . . . . . . . . . . . . . . . . . . . . . . . . . 1
Management’s Discussion and Analysis . . . . . . . . . . . . . . . . . . . . . . 3
Basic Financial Statements
Governmental-wide Financial Statements –
Statement of Net Position . . . . . . . . . . . . . . . . . . . . . . . . . 15
Statement of Activities . . . . . . . . . . . . . . . . . . . . . . . . . . . 16
Fund Financial Statements –
Governmental Funds Balance Sheet . . . . . . . . . . . . . . . . 17
Reconciliation of the Governmental Funds Balance Sheet to the Statement of Net Position . . . . . . . . . . . . . 18
Statement of Revenues, Expenditures, and Changes in Fund Balances – Governmental Funds . . . . . . . . . . . 19
Reconciliation of the Statement of Revenues, Expenditures, and Changes in Fund Balances to the Statement of Activities . . . . . . . . . . . . . . . . . . . . 20
Statements of Revenues, Expenditures and Changes in Fund Balances - Budget and Actual –
General Fund . . . . . . . . . . . . . . . . . . . . . . . . . . . . . . . 21
Grant Fund . . . . . . . . . . . . . . . . . . . . . . . . . . . . . . . . . 22
Notes to the Financial Statements . . . . . . . . . . . . . . . . . . . . 23
Required Supplementary Information
Schedule of Funding Progress –
PERS Safety Employees’ Pension Plan . . . . . . . . . . . . . . . 45
Other Post-Employment Benefits (OPEB) Plans . . . . . . . 45
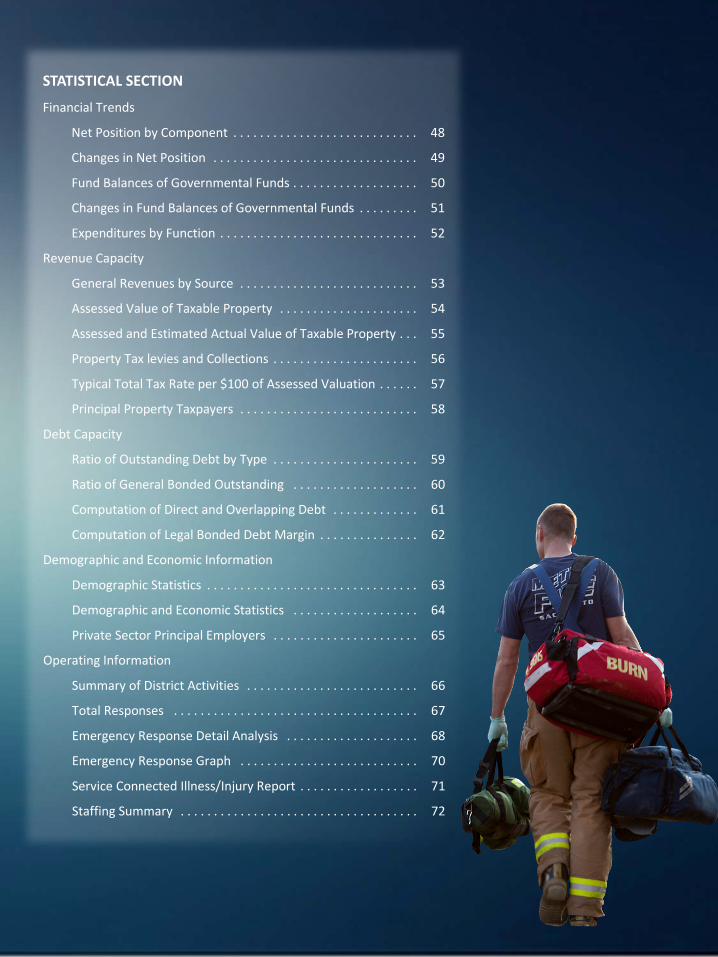
STATISTICAL SECTION
Financial Trends
Net Position by Component . . . . . . . . . . . . . . . . . . . . . . . . . . . . 48
Changes in Net Position . . . . . . . . . . . . . . . . . . . . . . . . . . . . . . . 49
Fund Balances of Governmental Funds . . . . . . . . . . . . . . . . . . . 50
Changes in Fund Balances of Governmental Funds . . . . . . . . . 51
Expenditures by Function . . . . . . . . . . . . . . . . . . . . . . . . . . . . . . 52
Revenue Capacity
General Revenues by Source . . . . . . . . . . . . . . . . . . . . . . . . . . . 53
Assessed Value of Taxable Property . . . . . . . . . . . . . . . . . . . . . 54
Assessed and Estimated Actual Value of Taxable Property . . . 55
Property Tax levies and Collections . . . . . . . . . . . . . . . . . . . . . . 56
Typical Total Tax Rate per $100 of Assessed Valuation . . . . . . 57
Principal Property Taxpayers . . . . . . . . . . . . . . . . . . . . . . . . . . . 58
Debt Capacity
Ratio of Outstanding Debt by Type . . . . . . . . . . . . . . . . . . . . . . 59
Ratio of General Bonded Outstanding . . . . . . . . . . . . . . . . . . . 60
Computation of Direct and Overlapping Debt . . . . . . . . . . . . . 61
Computation of Legal Bonded Debt Margin . . . . . . . . . . . . . . . 62
Demographic and Economic Information
Demographic Statistics . . . . . . . . . . . . . . . . . . . . . . . . . . . . . . . . 63
Demographic and Economic Statistics . . . . . . . . . . . . . . . . . . . 64
Private Sector Principal Employers . . . . . . . . . . . . . . . . . . . . . . 65
Operating Information
Summary of District Activities . . . . . . . . . . . . . . . . . . . . . . . . . . 66
Total Responses . . . . . . . . . . . . . . . . . . . . . . . . . . . . . . . . . . . . . 67
Emergency Response Detail Analysis . . . . . . . . . . . . . . . . . . . . 68
Emergency Response Graph . . . . . . . . . . . . . . . . . . . . . . . . . . . 70
Service Connected Illness/Injury Report . . . . . . . . . . . . . . . . . . 71
Staffing Summary . . . . . . . . . . . . . . . . . . . . . . . . . . . . . . . . . . . . 72

ntro
duct
ion

Sacramento Metropolitan Fire District
10545 Armstrong Ave., Suite 200 · Mather, CA 95655 · Phone (916) 859-4300 · Fax (916) 859-3702 MARK A. WELLS
Fire Chief
January 22, 2015 Board of Directors Sacramento Metropolitan Fire District 10545 Armstrong Ave, Suite 200 Mather, California 95655 Members of the Board: We are pleased to present the Sacramento Metropolitan Fire District (“Metro Fire”) Comprehensive Annual Financial Report (CAFR) for the fiscal year ended June 30, 2014. This is the first CAFR produced by Metro Fire. This report has been prepared by the Finance Division following the guidelines recommended by the Government Finance Officers Association (GFOA) and is in conformance with generally accepted accounting principles (GAAP) for state and local government entities established by the Governmental Accounting Standards Board (GASB). Management assumes full responsibility for the completeness and reliability of the information contained in this report, based upon a comprehensive framework of internal control that management has established for this purpose. Because the cost of internal control should not exceed anticipated benefits, the objective is to provide reasonable, rather than absolute, assurance that the financial statements are free of any material misstatements. Richardson & Company, LLP, Certified Public Accountants, have issued an unmodified (“clean”) opinion on Metro Fire’s financial statements for the year ended June 30, 2014. The independent auditor’s report is located at the front of the financial section of this report. Management’s discussion and analysis (MD&A) immediately follows the independent auditor’s report and provides a narrative introduction, overview, and analysis of the basic financial statements. MD&A complements this letter of transmittal and should be read in conjunction with it.
PROFILE OF SACRAMENTO METROPOLITAN FIRE DISTRICT REPORTING ENTITY Metro Fire is an autonomous Special District established under California Health and Safety Code Section 13800 on December 1, 2000. Metro Fire is the result of the reorganization of the American River and Sacramento County Fire Protection Districts, which brought together 16 predecessor fire districts including Arcade, Arden, Carmichael, Citrus Heights, Elverta, Fair Oaks, Florin, Mather Field, McClellan Field, Michigan Bar, Mills, North Highlands, Orangevale, Rancho Cordova, Rio Linda, and Sloughhouse. Metro Fire provides fire suppression services along with various other public safety and hazard mitigation community services. As a special district, Metro Fire is governed by a Board of Directors; each member is elected by the voters within a geographical area, or division, of Metro Fire's operational area. The Fire Chief oversees the general operations of Metro Fire in accordance with the policy direction prescribed by the Board of Directors. The Fire Chief is
Serving Sacramento and Placer Counties

supported by his executive staff consisting of the Board Clerk and three Deputy Chiefs that manage the Operations, Administration, and Support Services Branches of Metro Fire. SERVICE AREA AND SERVICES Today, Metro Fire is the largest fire agency in the County of Sacramento and 7th largest in the state. Metro Fire serves a population of about 720,000 in a service area encompassing 417 square miles that include unincorporated Sacramento County, the cities of Citrus Heights and Rancho Cordova, and a portion of Placer County. Within the boundaries of the Metro Fire are wildland areas, single and multi-family residential units, commercial and light industrial occupancies, hotels, regional hospitals, institutional buildings, local airfields, numerous convalescent/assisted living facilities, equestrian areas, and open space areas including hiking trails. Several major interstate highways also traverse Metro Fire’s jurisdiction, along with the American River, a major recreation resource for area residents. Metro Fire provides all-hazard emergency services to the communities it serves. Additionally, mutual aid agreements to provide fire and/or emergency medical assistance between Metro Fire and other public safety agencies are in place and are honored by Metro Fire. Metro Fire staff is also routinely deployed to local, state, and federal emergencies around the country. Metro Fire’s philosophy with regard to all-hazard emergencies is one of a rapid and effective deployment of appropriate resources to mitigate any emergency. Metro Fire’s response goal as approved by the Board of Directors is for a 4 minute travel time to 90% of all major emergencies (in addition to a 1 minute dispatch and 2 minute turnout time). Metro Fire is organized into three branches - Operations, Administration, and Support Services. The all-hazard nature of Metro Fire is exemplified by the Operations Branch, which consists of Suppression, Emergency Medical Services (EMS), Special Operations, Training, Safety, Health & Fitness, Emergency Planning, and Communications.
• Suppression oversees all aspects of Metro Fire’s all-hazard emergency services delivered from 40 stations with daily shift staffing of 188 personnel. The Operations Branch answered over 88,000 calls for service in 2014; a number that has steadily increased during each year of the economic downturn that the region has experienced in recent years.
• The EMS Division is responsible for the management of the emergency medical system which ensures that our emergency medical technician (EMT) and paramedic personnel are trained and equipped to serve the public at the highest levels. EMTs are certified health care professionals trained to provide basic life support in accordance with the State of California Scope of Practice for EMTs, while Paramedics are licensed by the State of California to provide advanced life support (ALS). The provision of ALS services is accomplished through the strategic deployment of dual-role fire department medic units (FDM) and the single role paramedic program (SRPP). Metro Fire employs over four hundred (400) paramedics who are assigned on engines, trucks, ambulances, helicopters, ARFF (Aircraft Rescue and Fire Fighting) units, boats, and bicycles. On a daily basis, all ambulances and suppression apparatus are staffed with at least one paramedic. Metro Fire currently deploys thirteen 24-hour FDM units that are staffed by Firefighter/Paramedics and Firefighter/EMTs, along with six reserve ambulances that are available if needed to be staffed and placed in service. The additional ambulances provide surge protection during periods of high call volume. There are thirty-three ALS engine companies and eight ALS truck companies in service on a 24-hour basis. These apparatus responded to calls for emergency medical service with paramedics who assist with critically ill or injured patients if needed.
ii | P a g e S a c r a m e n t o M e t r o p o l i t a n F i r e D i s t r i c t F Y 2 0 1 3 / 1 4 C o m p r e h e n s i v e A n n u a l F i n a n c i a l R e p o r t

In fiscal year 2012/13, Metro Fire introduced a Single Role Paramedic Program (SRPP). This program enhances emergency medical services within the community by providing five additional 24-hour ALS ambulances along with five peak time ambulances to augment the EMS system during times of high demand. The SRPP units are staffed with non-firefighter EMT & Paramedic personnel. To implement the SRPP, Metro Fire acquired four Type-II (“Sprinter”) ambulances. Four additional Sprinter ambulances were placed in service as front-line vehicles in fiscal year 2013/14. The Sprinter ambulances offer greatly improved fuel economy and reduced overhead costs.
• Metro Fire has several Special Operations programs that are managed under the Operations Division. These programs include Hazardous Materials (HAZMAT), Technical Rescue, Urban Search and Rescue (US&R), Swift Water Rescue, Tactical Emergency Medical Support (TEMS), Aviation and Dozer programs. Metro Fire’s HAZMAT and Technical Rescue programs are certified by the California Office of Emergency Services for Type I statewide response. The US&R program is a member of California Urban Search and Rescue Task Force 7 (CA TF-7), one of 28 US&R task forces in the nation, and one of eight in California. Metro Fire’s aviation and dozer programs are the only ones of their kind regionally, and provide critical response capabilities to the region. Metro Fire’s TEMS program, also the only one of its kind regionally, provides tactical medical support to the Sacramento County Sheriff, Citrus Heights Police Department, and FBI SWAT Teams. Additionally, Metro Fire is a member of the FBI Joint Terrorism Task Force, Regional Fusion Center and Urban Area Security Initiative’s Urban Area Working Group.
• The Training Division’s mission is to improve service delivery to the community by providing realistic, ongoing, and verifiable training to Metro Fire personnel and assisting them to develop and strengthen essential job skills. Training strives to ensure all-hazard operational readiness and enhance the ability of our members to provide quality public service.
• Communications oversees radio communications throughout Metro Fire’s fire stations, administrative
buildings, and vehicles. The Support Services branch of Metro Fire is comprised of four divisions; Fleet, Facilities, Logistics and Community Risk Reduction. Each division has specific duties within Metro Fire ranging from construction projects and building maintenance to fire inspections.
• Under the direction of the Fire Marshal, the Community Risk Reduction Division (CRRD) works with developers and citizens to make the community safe through activities such as Plan Review, Fire Inspections, Code Enforcement, Fire Investigation and Exterior Fire Hazard Mitigation. The Fire Marshal also oversees the Community Services Division which facilitates school/event presentations with Firefighters and/or Public Education Technicians, fire station tours, Fire Camp for children within Metro Fire’s jurisdiction, fire extinguisher training, life jacket loan program, and other programs.
• The Facilities Division has the responsibility of providing repairs, improvements and maintenance for all
of Metro Fire's existing fire stations, support and administrative facilities.
• The Fleet Maintenance Division maintains a fleet in excess of 340 emergency and support vehicles in a modern facility that contains 30 functional working bays. The majority of the fleet services and repairs are performed at this facility and range from routine service and maintenance to full engine in-frame and pump overhauls. A Mobile Repair Program provides limited field repairs in an effort to reduce inconvenience and downtime to emergency apparatus.
• Logistics is responsible for ordering, receiving and storing of fire suppression equipment, emergency medical equipment and other essential supplies that are used on a daily basis.
S a c r a m e n t o M e t r o p o l i t a n F i r e D i s t r i c t iii | P a g e 2 0 1 4 C o m p r e h e n s i v e A n n u a l F i n a n c i a l R e p o r t

The Administration Branch is comprised of three divisions: Human Resources, Information Technology, and Finance.
• The Finance Division oversees all financial aspects Metro Fire’s multi-million dollar operation. Processes are in place to safeguard Metro Fire’s assets, track spending, properly pay employees, collect all revenue and cost reimbursements, and produce quality reporting of all transactions. This Division also guides the very important budget process to see resources are properly allocated for optimum public service levels.
• Providing the highest quality of service to the citizens of Metro Fire depends on having a dedicated, well-qualified group of employees. The Human Resources Division seeks to recruit and maintain a diverse workforce that reflects the community served, and strives to support Metro Fire’s mission of providing professional and compassionate protection, education, and service to the community.
• Information Technology is responsible for providing data, voice, and video communications to 40 fire stations, four administrative buildings and over 340 vehicles.
APPARATUS Metro Fire’s fleet is made up of emergency vehicles and apparatus which must be kept in a constant state of readiness, and consists of:
Metro Fires’ fire suppression apparatus have been equipped to the highest industry standards for fighting and extinguishing structural type fires, and rendering assistance to patients on medical emergency incidents. Metro Fire’s fire engines are capable of delivering water at rates up to 1,500 gallons per minute. Metro Fire's philosophy related to wildland fires revolves around strategically located, specialized "off road" wildland apparatus specifically designed to combat these difficult fires. Because of the potential for major wildland fires, Metro Fire deploys water tender units capable of supplying smaller attack vehicles during large incidents. These units are strategically placed within Metro Fire for maximum effectiveness. Metro Fire is the only fire agency in the region with aircraft and dozer response programs. Because of this, these apparatus are critical assets to the region and enhance regional capabilities. Other support vehicles include mobile air units, fuel trucks, helicopter tender, aircraft tow vehicle, battalion chief and staff vehicles, SCBAs (Self-Contained Breathing Apparatus) repair unit, trailers, flatbeds, forklifts, pallet jack, scissor lift, tractors, and tow vehicles. Metro Fire has in place a 20-year rolling vehicle/apparatus replacement plan which measures the proper utilization period for each piece of apparatus and when replacements should occur.
Apparatus Type No. in Service Apparatus Type No. in ServiceEngine 53 Aircraft Rescue Firefighting Unit 4Wildland Engine 40 Ambulance 54Pumper/Foam 1 Decontamination Unit 1Ladder Truck 10 Dozer 2Hazmat Truck 1 Rescue Boat 2Rescue Truck 2 Helicopter 2Water Tender 6
iv | P a g e S a c r a m e n t o M e t r o p o l i t a n F i r e D i s t r i c t F Y 2 0 1 3 / 1 4 C o m p r e h e n s i v e A n n u a l F i n a n c i a l R e p o r t

ECONOMIC OUTLOOK LOCAL ECONOMY Metro Fire’s primary source of funding is property tax revenue and as such, its operations are significantly affected by property values. While the lingering effects of the economic recession continue to present Metro Fire with significant fiscal challenges, all aggregate economic indicators point to a recovery underway in the Sacramento Region. In 2013, Sacramento County saw the largest increase in property values since 2007/08, yet median home prices still remain 40% below peak values. Metro Fire is projecting a modest increase in property tax revenues for the upcoming year. Although the Sacramento County Assessor is beginning to reinstate single-family home values that were lowered during the recession, the Assessor is now working through a backlog of commercial property value appeals that could have a dampening effect on property tax recovery. Metro Fire is confident that the positive economic outlook will continue and will allow Metro Fire to maintain current service levels. Another major source of funding for Metro Fire is cost recovery associated with providing emergency medical (“ambulance”) transport services. Metro Fire bills approximately $110 million annually for these services, with a collection rate of around 30%, which is typical for public sector providers in California. As property tax revenues declined during the recession, greater emphasis was placed on cost recovery and this revenue source has steadily increased over recent years. LONG-TERM FINANCIAL PLANNING AND MAJOR INITIATIVES The Board of Directors, command staff and employees have been working together to not only address the immediate fiscal challenges, but also to address future financial and operational challenges with the goal of putting Metro Fire on a more predictable and sustainable path going forward. This is being accomplished by adopting balanced budgets, maintaining sufficient reserves, forecasting long-term needs, identifying cost-saving measures, enhancing cost recovery where appropriate, and exploring potential new revenue sources. Metro Fire’s long range fiscal planning efforts identified several key issues that, if left unaddressed, would create fiscal uncertainty and likely result in a disruption in future service delivery. Two of these critical issues are the long-term liability associated with retiree medical benefits and the retirement of $67 million of pension obligation bonds originally issued in 2004. Metro Fire’s OPEB funding plan involves a combination of contributions and cost-saving measures agreed to by Metro Fire employees that both lowered the long-term cost of other post-employment benefits (OPEB) and provides for fully funding the annual required contribution (ARC). As a result, and as reported in recent OPEB actuarial valuations, Metro Fire experienced a substantial reduction in the OPEB unfunded liability; which in turn substantially lowered the ARC. With respect to the pension obligations bonds, Metro Fire has a longstanding policy to set aside funds each year, in addition to the annual debt service required by the bond documents, so as to accumulate the necessary funds to fully retire two series of pension bonds maturing in 2018 and 2025. Another key component of long-term fiscal stability is looking ahead and planning for the needs of future development. This is especially critical for the greater Sacramento metropolitan area, where there is significant development on the horizon. Metro Fire has reached out to the regional planning departments to ascertain current and future development plans. This data was used to identify the approximate location of future fire stations; that information was then used to develop a Facilities Master Plan. Costs were assigned for the land acquisition, station construction and related apparatus and equipment. This development information and cost data is being incorporated into an updated Capital Facilities Fee study to ensure capital funds will be available when needed to address the impacts of new development and avoid any degradation of services to the existing communities served by Metro Fire.
S a c r a m e n t o M e t r o p o l i t a n F i r e D i s t r i c t v | P a g e 2 0 1 4 C o m p r e h e n s i v e A n n u a l F i n a n c i a l R e p o r t
Metro Fire has made great strides in identifying new sources of revenues. Metro Fire has led a statewide effort to increase the cost recovery associated with emergency medical transport services by sponsoring state legislation allowing ground emergency medical transporters (GEMT) in California to seek additional reimbursement from the federal government related to fee-for-service Medi-Cal patients. In addition, Metro Fire will be participating in an Inter-Governmental Transfer (IGT) program that will allow Metro Fire to receive federal matching funds for medical transports related to Managed Care HMO beneficiaries. Any additional funding from these cost recovery efforts will free up general property tax revenues for Metro Fire’s all-hazard, non-fee based services.
ACKNOWLEDGEMENTS The preparation of this report reflects the combined and dedicated effort of Metro Fire staff. We especially want to recognize the Finance Division staff, along with Metro Fire’s independent auditors, Richardson & Company, LLP for their contributions to provide complete, reliable, open and transparent financial information, and for fostering the enhanced stewardship of public funds. Credit is also due to the Development Division which assisted in designing the report. We would like to take this opportunity to express our thanks and sincere appreciation to the Board of Directors for their continued support, trust, and guidance. Together, Metro Fire’s leadership and staff bring an effective combination of skills, experience and dedication to carry out Metro Fire’s mission:
“TO PROVIDE PROFESSIONAL AND COMPASSIONATE PROTECTION, EDUCATION AND SERVICE TO OUR COMMUNITY.”
Respectfully submitted,
Mark A. Wells Kenneth R. Campo, CPA Fire Chief Interim Chief Financial Officer
vi | P a g e S a c r a m e n t o M e t r o p o l i t a n F i r e D i s t r i c t F Y 2 0 1 3 / 1 4 C o m p r e h e n s i v e A n n u a l F i n a n c i a l R e p o r t

irect
ory
of
ffic
ials
Randy Orzalli Grant B. Goold Dave Pierson
PRESIDENT VICE-PRESIDENT SECRETARY
D'Elman Clark Gay Jones Matt KellyDIRECTOR DIRECTOR DIRECTOR
Gary Monk Jack Scheidegger Ted WoodDIRECTOR DIRECTOR DIRECTOR
Kurt P. HenkeFIRE CHIEF
Mark Wells Chris Holbrook Scott CockrumDEPUTY CHIEF DEPUTY CHIEF DEPUTY CHIEF
ADMINISTRATION OPERATIONS SUPPORT SERVICES
Larry Davis Rhonda McFarlaneCHIEF DEVELOPMENT CHIEF FINANCIAL
OFFICER OFFICER
Darren Taylor Brian Shannon John WagnerA SHIFT B SHIFT C SHIFT
Scott Clough Bill Daniels Walt WhiteEMS FIRE MARSHAL TRAINING/SAFETY
Board of Directors
Command Staff
Assistant Chiefs
As o
f Jun
e 30
, 201
4
S a c r a m e n t o M e t r o p o l i t a n F i r e D i s t r i c t vii | P a g e F Y 2 0 1 3 / 1 4 C o m p r e h e n s i v e A n n u a l F i n a n c i a l R e p o r t

rgan
izat
iona
l ha
rt BOARD
OFDIRECTORS
CITIZENSof the
DISTRICT
BoardOf
Directors
Fire Chief
Deputy ChiefAdmin
EconomicDevelopment
Public Information
Officer
Senior StaffCoordinator
Day StaffCaptains
Finance
InformationTechnology
HumanResources
Inter-GovernAffairs
viii | P a g e S a c r a m e n t o M e t r o p o l i t a n F i r e D i s t r i c t F Y 2 0 1 3 / 1 4 C o m p r e h e n s i v e A n n u a l F i n a n c i a l R e p o r t

LegalCounsel
Clerk of theBoard
IndependentAuditors
Deputy ChiefOperations
Deputy ChiefSupport Services
Assistant Chiefs
Battalions Chiefs
CaptainsEngineers
Firefighters
SpecialOperations
EmergencyMedicalServices
TrainingAnd Safety
Assistant ChiefFire Marshal
Facilities
Fleet
Logistics
Communications
CommunityRisk Reduction
CommunityServices
S a c r a m e n t o M e t r o p o l i t a n F i r e D i s t r i c t ix | P a g e F Y 2 0 1 3 / 1 4 C o m p r e h e n s i v e A n n u a l F i n a n c i a l R e p o r t
istri
ct
ound
arie
s by
tatio
n
x | P a g e S a c r a m e n t o M e t r o p o l i t a n F i r e D i s t r i c t F Y 2 0 1 3 / 1 4 C o m p r e h e n s i v e A n n u a l F i n a n c i a l R e p o r t

S a c r a m e n t o M e t r o p o l i t a n F i r e D i s t r i c t xi | P a g e F Y 2 0 1 3 / 1 4 C o m p r e h e n s i v e A n n u a l F i n a n c i a l R e p o r t

tatio
ns a
nd
acili
ties
xii | P a g e S a c r a m e n t o M e t r o p o l i t a n F i r e D i s t r i c t F Y 2 0 1 3 / 1 4 C o m p r e h e n s i v e A n n u a l F i n a n c i a l R e p o r t

FLEET LOGISTICS/TRAINING/SAFETY4425 Dudley Blvd.
McClellan3012 Gold Canal Drive
Rancho Cordova
HEADQUARTERS' DIVISONS
OFFICE OF THEFIRE CHIEF
ADMINISTRATIONEMERGENCY
MEDICALSERVICES
FINANCE
COMMUNITYRISK REDUCTION
HUMANRESOURCES OPERATIONS
INFORMATIONTECHNOLOGY
S a c r a m e n t o M e t r o p o l i t a n F i r e D i s t r i c t xiii | P a g e F Y 2 0 1 3 / 1 4 C o m p r e h e n s i v e A n n u a l F i n a n c i a l R e p o r t

STATION #21 STATION #227641 Greenback Lane
Citrus Heights6248 Chestnut Avenue
Orangevale
STATION #23 STATION #246421 Greenback Lane
Citrus Heights4942 College Oak Drive
Sacramento
STATION #25 STATION #267352 Roseville Road
Sacramento8000 Palmerson Drive
Antelope
STATION #27 STATION #287474 Grand Oaks Blvd.
Citrus Heights8189 Oak Avenue
Citrus Heights
STATION #29 STATION #318681 Greenback Lane
Orangevale7950 California Avenue
Fair Oaks
STATION #32 STATION #418890 Roediger Lane
Fair Oaks6900 Thomas Drive
North Highlands
xiv | P a g e S a c r a m e n t o M e t r o p o l i t a n F i r e D i s t r i c t F Y 2 0 1 3 / 1 4 C o m p r e h e n s i v e A n n u a l F i n a n c i a l R e p o r t

10595 Folsom Blvd.Rancho Cordova
3646 Bradshaw RoadSacramento
STATION #63 STATION #6412395 Folsom Blvd.
Rancho Cordova9116 Vancouver Drive
Sacramento
STATION #58 STATION #597250 Sloughhouse Road
Elk Grove7210 Murieta Drive
Rancho Murieta
STATION #61 STATION #62
8210 Meadowhaven DriveSacramento
6722 Fleming AvenueSacramento
STATION #54 STATION #558900 Fredic Avenue
Sacramento7776 Excelsior Road
Sacramento
STATION #42 STATION #505608 North HavenHorth Highlands
8880 Gerber RoadSacramento
STATION #51 STATION #53
S a c r a m e n t o M e t r o p o l i t a n F i r e D i s t r i c t xv | P a g e F Y 2 0 1 3 / 1 4 C o m p r e h e n s i v e A n n u a l F i n a n c i a l R e p o r t

5634 Robertson AvenueCarmichael
1432 Eastern AvenueSacramento
STATION #111 STATION #1126609 Rio Linda Blvd.
Rio Linda6801 34th StreetNorth Highlands
STATION #106 STATION #1082200 Park Towne Circle
Sacramento6701 Winding Way
Fair Oaks
STATION #109 STATION #110
3000 Fulton AvenueSacramento
4501 Marconi AvenueSacramento
STATION #103 STATION #1053824 Watt Avenue
Sacramento2691 Northrop Avenue
Sacramento
STATION #65 STATION #6611201 Coloma Road
Rancho Cordova3180 Kilgore Road
Rancho Cordova
STATION #101 STATION #102
xvi | P a g e S a c r a m e n t o M e t r o p o l i t a n F i r e D i s t r i c t F Y 2 0 1 3 / 1 4 C o m p r e h e n s i v e A n n u a l F i n a n c i a l R e p o r t

7995 Elwyn AvenueElverta
7961 Cherry Brook DriveElverta
STATION #114 STATION #1155824 Kelly Way
McClellan4727 Kilzer Avenue
McClellan
STATION #116 STATION #117
S a c r a m e n t o M e t r o p o l i t a n F i r e D i s t r i c t xvii | P a g e F Y 2 0 1 3 / 1 4 C o m p r e h e n s i v e A n n u a l F i n a n c i a l R e p o r t

istri
ct
isto
ry 1918- Mather Air Force Base
Fire Department was established in 1918, named after a WWI test pilot, Carl Mather.
1922- Established in June 1922, the Mills Fire Department covered approximately 55 square miles. Its original budget was in the $3,000 range. 1923- In May 1923, the first meeting was held to form the Rio Linda Outpost of Fire Protection which had a roster of 13 volunteers and a newly purchased soda and acid type fire engine, affectionately known as “Old Betsy”. 1925- The Elverta Fire District was formed in October 1925. A Graham Dodge truck was later purchased and modified to serve as its first fire truck. On its main
fire station, a siren was installed with a button on the outside of the building – the first person to hear of a fire would run to the station to push it and activate the siren. 1933- The Orangevale Volunteer Fire Dept. was formed in 1933 with a single fire station located on Hazel Avenue and Greenback Lane. Its first fire engine was a converted 1917 REO touring car purchased for $650 by volunteers. 1935- While onlookers stood by helplessly as a
barn burned to the ground on December 31, 1933, talk began on the need for fire protection. In 1935, the non-profit corporation called the Citrus Heights Fire District was formed. Amidst the depression and lack of funds, everything pertaining to the District was purchased with funds from the local residents rather than county taxes. This was the only source of income until 1941. 1938- In late December 1938, the first piece of firefighting equipment was put into service at the Sacramento Air Depot and staffed by temporary firefighters. In 1939, staff was replaced with an all-civilian fire department and the base and was ultimately renamed to McClellan Air Force Base. McClellan AFB Fire Department grew to a maximum of six fire stations with personnel in excess of 30. It was augmented early on by over 125 airmen. 1942- In January 1942, a temporary Board of Commissioners was elected and in July of that same year, a groundbreaking ceremony was held for Station 1 of the newly formed Arcade Fire Protection District. The construction of the station began with volunteer labor and donated materials. In the summer of 1952, Station 2 was built, Station 3 was purchased from the San Juan School District in 1957, and Station 4 was converted from a portion of a warehouse in 1973. 1942- In 1935, several concerned citizens conceived the idea of fire protection and received eight donated Indian back pumps. In 1938, the community appropriated $250 for the purchase of a 1932 Model “B” Ford pickup with a small
water tank, pump and hose. In 1942, the Fair Oaks Fire District was legally formed. Ten volunteer firemen served the area and in 1947 the first voluntary Fire Chief was appointed. 1942- Local merchants and citizens, seeing the need for fire protection, purchased a hand drawn chemical cart for $950 in 1918. In the 1930s, the cart was no longer serviceable and the area was without any organized fire protection. On July 26, 1942, the Florin Fire District was formally organized and the first official act of the Board of Directors was to appoint a Fire Chief.
xviii | P a g e S a c r a m e n t o M e t r o p o l i t a n F i r e D i s t r i c t F Y 2 0 1 3 / 1 4 C o m p r e h e n s i v e A n n u a l F i n a n c i a l R e p o r t

1942- Mr. Daniel W. Carmichael developed the Carmichael Colony in 1909 with the purchase of 2,000 acres of land north and west of the American River. Two years later, he acquired an additional 1,000 acres. Fire prevention at that time was a community endeavor. In 1927 a local businessman instituted a more formal volunteer firefighting force, purchasing a Model T fire engine which held 30 gallons of water, 100 feet of hose and other tools and equipment. In 1942, the Carmichael Fire District was officially organized and the area that was known as Donovan’s Corners became Fire Station 1. 1943- County maps refer to Arden as “Rancho del Paso.” It is a community of approximately 2,000 people which included two stores, two service stations, three large hop ranches, and one school in a nine-square mile agricultural area. On January 4, 1943, from the efforts of a close-knit group of citizens, a petition for formation of a fire district was submitted and approved by the Sacramento County Board of Supervisors and the Arden Fire District was born. 1945- The Citrus Heights Fire Protection District became a legal governmental entity in 1945 with the merger of the Citrus Heights Fire District and the Orangevale Volunteer Fire Department. 1947- The Sloughhouse Fire Protection District was formed in 1947 with volunteers and donated equipment. Without a formal fire station, the pumper and other apparatus were housed at Riella Ranch and the Sloughhouse Grocery Store until 1965 when volunteers built a station on Sloughhouse Road. 1951- The first firehouse for the North Highlands Village Fire District, which was formed in September 1951, was located next to the Flying A gasoline station on North Haven Drive. Daytime alarms were received by telephone at the Flying A gasoline station and night calls were answered at an apartment across the street. This District remained an all-volunteer district until July, 1957 when three firefighters were hired at $340 per month.
1958- The Rancho Cordova community was protected by the Mills Fire Dept. In 1958, the name of the department was changed to the Rancho Cordova Fire Protection District. 1983- The American River Fire Protection District was formed on August 1, 1983 by the consolidation of the Arden and Carmichael Fire Districts. At conception, the District had six fire stations and served 26 square miles. It responded to 3,715 alarms during the inaugural year. 1984- In 1983 the Board of Directors voted to merge the Citrus Heights and North Highlands Fire Districts. It was approved and on February 4, 1984, the North Highlands Village Fire District became part of the Citrus Heights Fire Protection District. 1989- The Sacramento County Fire Protection District was organized with the consolidation of the Rancho Cordova Fire Protection District and the Citrus Heights Fire Protection District in July 1989. Emergency services were provided to the community through 20 fire stations. 2000- On December 1, 2000, the Sacramento Metropolitan Fire District was formed from the consolidation of 16 historic fire districts. Now commonly known as Metro Fire, it is the seventh largest local fire district in the State of California and the largest in Sacramento County. For more detail on the merge, please see the Letter of Transmittal in this report.
www.metrofire.ca.gov
S a c r a m e n t o M e t r o p o l i t a n F i r e D i s t r i c t xix | P a g e F Y 2 0 1 3 / 1 4 C o m p r e h e n s i v e A n n u a l F i n a n c i a l R e p o r t

This page intentionally left blank
xx | P a g e S a c r a m e n t o M e t r o p o l i t a n F i r e D i s t r i c t F Y 2 0 1 3 / 1 4 C o m p r e h e n s i v e A n n u a l F i n a n c i a l R e p o r t

inan
cial

Richardson & Company, LLP 550 Howe Avenue, Suite 210 Sacramento, California 95825
Telephone: (916) 564-8727
FAX: (916) 564-8728
S a c r a m e n t o M e t r o p o l i t a n F i r e D i s t r i c t 1 | P a g e F Y 2 0 1 3 / 1 4 C o m p r e h e n s i v e A n n u a l F i n a n c i a l R e p o r t
INDEPENDENT AUDITOR’S REPORT
To the Board of Directors Sacramento Metropolitan Fire District Sacramento, California
Report on the Financial Statements
We have audited the accompanying financial statements of the governmental activities, each major fund and the aggregate remaining fund information of Sacramento Metropolitan Fire District (Metro Fire) as of and for the year ended June 30, 2014, and the related notes to the financial statements, which collectively comprise Metro Fire’s financial statements as listed in the table of contents.
Management’s Responsibility for the Financial Statements
Management is responsible for the preparation and fair presentation of these financial statements in accordance with accounting principles generally accepted in the United States of America; this includes the design, implementation, and maintenance of internal control relevant to the preparation and fair presentation of financial statements that are free from material misstatement, whether due to fraud or error.
Auditor’s Responsibility
Our responsibility is to express opinions on these financial statements based on our audit. We conducted our audit in accordance with auditing standards generally accepted in the United States of America and the standards applicable to financial audits contained in Government Auditing Standards, issued by the Comptroller General of the United States, and the State Controller’s Minimum Audit Requirements for California Special Districts. Those standards require that we plan and perform the audit to obtain reasonable assurance about whether the financial statements are free of material misstatement.
An audit involves performing procedures to obtain audit evidence about the amounts and disclosures in the financial statements. The procedures selected depend on the auditor’s judgment, including the assessment of the risks of material misstatement of the financial statements, whether due to fraud or error. In making those risk assessments, the auditor considers internal control relevant to the entity’s preparation and fair presentation of the financial statements in order to design audit procedures that are appropriate in the circumstances, but not for the purpose of expressing an opinion on the effectiveness of the entity’s internal control. Accordingly, we express no such opinion. An audit also includes evaluating the appropriateness of accounting policies used and the reasonableness of significant accounting estimates made by management, as well as evaluating the overall presentation of the financial statements.
We believe that the audit evidence we have obtained is sufficient and appropriate to provide a basis for our audit opinion.

To the Board of Directors Sacramento Metropolitan Fire District
2 | P a g e S a c r a m e n t o M e t r o p o l i t a n F i r e D i s t r i c t F Y 2 0 1 3 / 1 4 C o m p r e h e n s i v e A n n u a l F i n a n c i a l R e p o r t
Opinions
In our opinion, the financial statements referred to above present fairly, in all material respects, the respective financial position of the governmental activities, each major fund and the aggregate remaining fund information of Metro Fire as of June 30, 2014 and the respective changes in financial position for the year then ended in accordance with accounting principles generally accepted in the United States of America as well as accounting systems prescribed by the State Controller’s Office and state regulations governing special districts.
Other Matters
Report on Supplemental Information
Accounting principles generally accepted in the United States of America require that the management’s discussion and analysis and budgetary comparison information on pages 3 to 14 and 21 to 22 be presented to supplement the basic financial statements. Such information, although not a part of the basic financial statements, is required by the Governmental Accounting Standards Board, who considers it to be an essential part of financial reporting for placing the basic financial statements in an appropriate operational, economic, or historical context. We have applied certain limited procedures to the required supplementary information in accordance with auditing standards generally accepted in the United States of America, which consisted of inquiries of management about the methods of preparing the information and comparing the information for consistency with management’s responses to our inquiries, the basic financial statements, and other knowledge we obtained during our audit of the basic financial statements. We do not express an opinion or provide any assurance on the information because the limited procedures do not provide us with sufficient evidence to express an opinion or provide any assurance.
Other Information
Our audit was conducted for the purpose of forming opinions on the financial statements that collectively comprise Metro Fire’s basic financial statements. The introductory section and statistical section are presented for purposes of additional analysis and are not a required part of the basic financial statements. The introductory and statistical sections have not been subjected to the auditing procedures applied in the audit of the basic financial statements and, accordingly, we do not express an opinion or provide any assurance on them.
Other Reporting Required by Government Auditing Standards
In accordance with Government Auditing Standards, we have also issued our report dated January 16, 2015 on our consideration of Metro Fire’s internal control over financial reporting and on our tests of its compliance with certain provisions of laws, regulations and contracts and grant agreements and other matters. The purpose of that report is to describe the scope of our testing of internal control over financial reporting and compliance and the results of that testing and not to provide an opinion on internal control over financial reporting or on compliance. That report is an integral part of an audit performed in accordance with Government Auditing Standards in considering Metro Fire’s internal control over financial reporting and compliance.
January 16, 2015

MANAGEMENT’S DISCUSSION AND ANALYSIS
Our discussion and analysis of the Sacramento Metropolitan Fire District (Metro Fire) provides the reader with a narrative overview of Metro Fire’s financial position and performance for the fiscal year ending June 30, 2014. We encourage readers to consider the information presented here in conjunction with additional information that we have furnished in our letter of transmittal, which can be found on pages i-vi of this report.
FINANCIAL HIGHLIGHTS During the year, Metro Fire generated $165,460,882 in taxes and other revenues from governmental
programs, which was $682,244 less than related expenses.
The assets of Metro Fire exceeded its liabilities at the close of the fiscal year by $31,206,587 (net position).
Metro Fire’s governmental funds reported combined fund balances of $37,750,116, a decrease of $836,309 in comparison with the prior year. Approximately 34.6% of this amount ($13,084,121) is available for spending at the government’s discretion (unassigned fund balance).
Unrestricted fund balance (the total of the committed, assigned, and unassigned components of fund balance) for the general fund was $32,213,185, or approximately 20.1% of total general fund expenditures.
During the year, Metro Fire completed several constructions projects relating to its Armstrong Headquarters and acquired several pieces of new apparatus for its operations. This led to a decrease in the Capital Facilities Fund balance of $3,217,208.
Overall outstanding long-term debt decreased by $824,925 during the year. This was the net result of scheduled debt payments ($3.9 million), new capital lease obligations ($2.9 million), accreted interest on pension bonds ($1 million), and a reduction in the long-term liabilities associated with compensated absences, workers’ compensation and retiree medical benefits ($800,000).
ANNUAL REPORT OVERVIEW The discussion and analysis provided herein is intended to serve as an introduction to Metro Fire’s basic financial statements. The basic financial statements consist of three components: 1) government-wide financial statements, 2) fund financial statements, and 3) the notes to financial statements. This report also includes supplementary information intended to furnish additional detail to support the basic financial statements. The government-wide financial statements are comprised of the Statement of Net Position and the Statement of Activities which provide broad financial information and present a longer-term view of Metro Fire’s finances. These statements are reported using the accrual basis of accounting which is similar to the accounting used by most private sector companies. All of Metro Fire’s assets and liabilities are included in these statements, with the difference between the two reported as net position. Revenues and expenses are recognized as soon as the underlying event occurs, regardless of the timing of related cash flows. These two statements report Metro Fire’s net position and changes in them. Over time, increases or decreases in net position may serve as a useful indicator of whether the financial health of Metro Fire is improving or deteriorating. The governmental fund financial statements are comprised of the Balance Sheet and the Statement of Revenues, Expenditures, and Changes in Fund Balances which focus on near-term inflows and outflows of spendable resources, as well as balances of spendable resources available at the end of the fiscal year. These statements present a detailed short-term view of Metro Fire’s operations and services. The modified accrual basis of accounting is used to measure cash and all other financial assets that can readily be converted into cash. It helps determine the availability of financial resources that can be spent in the near future to finance Metro Fire’s programs.
S a c r a m e n t o M e t r o p o l i t a n F i r e D i s t r i c t 3 | P a g e F Y 2 0 1 3 / 1 4 C o m p r e h e n s i v e A n n u a l F i n a n c i a l R e p o r t

Financial statement notes are an important part of the basic financial statements. They provide the readers additional information required by Generally Accepted Accounting Principles. The notes to the basic financial statements can be found on pages 23-44 of this report. In addition to the Basic Financial Statements and accompanying notes, this report also presents certain Required Supplementary Information such as Budgetary Comparison Schedules and a Statistical Section, providing financial tables conforming to GASB 44 standard requirements and historical trend data.
FINANCIAL ACTIVITIES OF METRO FIRE AS A WHOLE This analysis focuses on the net position and changes in net position of Metro Fire’s Governmental Activities presented in the Government-wide Statement of Net Position and Statement of Activities.
GENERAL AND PROGRAM REVENUES The primary source of funding for the services provided by Metro Fire comes from property taxes, which comprised about 67% of total revenues for the year. Other large revenue sources are charges for services and grant revenue. A summary of revenue sources is presented below:
2014 2013General revenues
Property taxes and assessments $ 111,089 $ 105,260Intergovernmental 2,698 5,545Rent and other income 985 1,012Miscellaneous 1,103 (54)
Total general revenues 115,875 111,763
Program revenuesCharges for services 47,286 39,473Operating grants and contributions 920 4,007Capital grants and contributions 1,380 3,940
Total program revenues 49,586 47,420
Total revenues $ 165,461 $ 159,183
Condensed Schedule of Revenues (in thousands)
Table 1
4 | P a g e S a c r a m e n t o M e t r o p o l i t a n F i r e D i s t r i c t F Y 2 0 1 3 / 1 4 C o m p r e h e n s i v e A n n u a l F i n a n c i a l R e p o r t

Property values in Metro Fire’s service area reached $56.8 billion in 2008. The real estate market in the region was hit hard by the recession, and property values within Metro Fire’s boundaries steadily declined to $49.5 billion in 2013; a reduction of $7.3 billion, or 13%. Annual property revenue during this time declined from a high of $130 million in 2008 to $105 million in 2013; a drop of $25 million, or 19%, in annual property tax revenue from the 2008 peak level. While certain areas of the state have been showing significant increases in property values for the past several years, the Sacramento region has been slow to rebound. Property values within Metro Fire finally saw growth in 2014, increasing by $1.9 billion, to a total of $51.4 billion. Property tax revenue in 2014 grew by $5.8 million, or 5.5%.
Property Taxes $111,089,471
Intergovernmental $ 2,697,715
Charges for Services
$47,286,105
Grants $ 2,300,323
Other $ 2,087,268
REVENUE SOURCES
S a c r a m e n t o M e t r o p o l i t a n F i r e D i s t r i c t 5 | P a g e F Y 2 0 1 3 / 1 4 C o m p r e h e n s i v e A n n u a l F i n a n c i a l R e p o r t

To mitigate the decline in property tax revenue, Metro Fire deployed a number cost saving measures, including the closing of engine companies and working with labor to reduce personnel costs while simultaneously exploring ways to enhance cost recovery where appropriate and seek federal grant revenues to maintain service levels. As noted in the chart in the previous page, non-property tax related revenue grew from $34 million in 2007/08 to $53 million in 2013/14; an increase of $20 million, or 58%, over the 2007/08 level. Metro Fire was successful in securing federal grant funds to maintain the operation of two truck companies, while the implementation of the SRPP, Ground Emergency Medical Transportation (GEMT) and other changes relative to delivery of emergency medical transport services provided for a substantial increase in cost reimbursement. As a result of these efforts, charges for services were up $7.9 million in fiscal year 2013/14. During the year, operating and capital grants decreased by $5.2 million or about 69% compared to the prior year. Fiscal year 2012/13 was Metro Fire’s most successful grant year which garnered awards amounting to $7.1 million, a majority of which ended in FY 2012/13. One of two Staffing for Adequate Fire and Emergency Response (SAFER) federal grant awards, which provided about $2.7 million in revenues in FY 2012/13, expired in July 2013. Metro Fire also received in FY 2012/13 one-time Assistance to Firefighter Grants (AFG) of $1.7 million and $1 million to purchase defibrillators and thermal imaging cameras, respectively. In addition, in fiscal year 2012/13, Metro Fire recognized retroactive GEMT cost reimbursements relating to fiscal years prior to 2012/13 amounting to $3.3 million. Ongoing GEMT revenues in the current year amounted to $819 thousand only.
EXPENSES As a public safety provider, the majority of Metro Fire’s operating expense relates to labor costs, which comprise about 82% of total expenses. A summary of Metro Fire’s expenses is presented below:
2014 2013Public protection
135,099$ 129,040$ 21,814 17,600
206 1,037 Total public protection 157,119 147,677
Interest 4,412 4,484 Depreciation 4,612 4,461
TOTAL EXPENSES 166,143$ 156,622$
Table 2Condensed Schedule of Expenses
(in thousands)
Services and supplies Other
Compensation
6 | P a g e S a c r a m e n t o M e t r o p o l i t a n F i r e D i s t r i c t F Y 2 0 1 3 / 1 4 C o m p r e h e n s i v e A n n u a l F i n a n c i a l R e p o r t

EXPENSES
Public protection expenses for the year were $157.1 million, or 6.4% more than the prior year. The majority of program expenses relates to salaries and benefits. Salaries and benefits increased by about 4.7% primarily due to increases in the cost of retirement and medical benefits, and overtime costs associated with state and national wildland fire deployments (for which Metro Fire was reimbursed). The other significant program expense is services and supplies which amounted to $21.8 million, an increase of $4.2 million or 24% from prior year. Several factors contributed to this increase, the most significant of which are the following:
• Dispatch fees paid to a Joint Powers Authority providing dispatch services, of which Metro Fire is a member agency, increased by more than $800,000. The increase was due to higher operational costs and necessary improvements for the dispatch center.
• Metro Fire undertook a feasibility study related to a proposed fire suppression benefit assessment. This study along with the cost of other projects increased expenses by more than $600,000.
• One-time expenditures of about $600,000 were incurred for the development of a Community Wildfire Protection Plan.
• Medic Supply and EMS billing fees increased by more than $800,000 as a result the first full-year operation of the SRPP.
• More than $300,000 of non-capitalizable equipment was purchased to upgrade Metro Fire’s computer and networking hardware.
Below is a history of Metro Fire’s total expenses:
Labor Costs $135,098,653
Services and Supplies
$21,814,187
Depreciation $4,612,234
Interest $4,411,918
Taxes, Licenses and
Assessments $206,134
S a c r a m e n t o M e t r o p o l i t a n F i r e D i s t r i c t 7 | P a g e F Y 2 0 1 3 / 1 4 C o m p r e h e n s i v e A n n u a l F i n a n c i a l R e p o r t

NET POSITION This analysis focuses on the net position and changes in net position of Metro Fire’s Governmental Activities (Tables 3 and 4), as presented in the government-wide Statement of Net Position and Statement of Activities that follow.
2014 2013
61,056 $ 61,949 $ 76,211 74,480 92,898 91,598
230,165 228,027
38,699 40,283 160,259 155,855 198,958 196,138
capital assets 71,375 71,966 2,523 5,698
(42,691) (45,775)31,207 $ 31,889 $
Condensed Schedule of Net Position(in thousands)
Table 3
Net Position:
RestrictedUnrestricted
TOTAL NET POSITION
Net investment in
Total Liabilities
Assets:Current and otherPension assetCapital assets
Total AssetsLiabilities:
CurrentLong-Term
Unrestricted net position, which can be used to finance day-to-day operations without constraints, increased by $3.1 million, which lowered the net deficit to $42.7 million. This deficit is caused by the inclusion of post-employment medical costs in the operating expenses; as of June 30, 2014, the Other Post-Employment Benefits (OPEB) liability was at $52 million. Restricted net position decreased by $3.2 million resulting in a balance of $2.5 million, the bulk of which can only be used for capital outlay expenses and debt service. This decrease is mainly due to construction projects and equipment acquisitions that occurred during the year.
2014 2013Total revenues 165,461$ 159,183$ Total expenses (166,143) (156,622)Excess (Deficiency) (682) 2,561Beginning net position 31,889 29,328 Ending Net Position 31,207$ 31,889$
Table 4
(in thousands)Schedule of Changes in Net Position
8 | P a g e S a c r a m e n t o M e t r o p o l i t a n F i r e D i s t r i c t F Y 2 0 1 3 / 1 4 C o m p r e h e n s i v e A n n u a l F i n a n c i a l R e p o r t

The graph above shows the decline in Metro Fire’s net position that occurred during the recession. However, in the most recent fiscal year, Metro Fire’s total net position has stabilized due to efforts by management to lower operating costs and enhance revenues.
ASSETS AND LIABILITIES The following points explain the major changes impacting net position as shown in Table 3:
• Total assets of Metro Fire increased by $2.1 million or 1%. Pension Assets accounted for $1.7 million of the increase due to the resulting actuarial interest adjustments. Capital assets are more thoroughly discussed in a later section.
• Current liabilities include amounts for trade payables, labor costs payable, unearned revenue, accrued interest payable and that portion of long-term debt due within one year. The decrease of $1.6 million was primarily due to a decrease in the estimated current portion of the liability for OPEB offset mostly by amounts owed to employees to comply with the overtime provisions of the federal Fair Labor Standards Act.
• Long-term liabilities include capital leases, bonds, compensated absences, OPEB liability and workers’ compensation liability. Capital leases and bonds are discussed on pages 36-38. During fiscal year 2013/14, Metro Fire expended $7.3 million on retiree medical benefits while about $5.3 million has contributed into an irrevocable trust to pay future retiree medical benefits. The $638,000 difference between the annual required contribution (ARC) and the amount funded during the year was added to the OPEB liability, which amounted to $52 million as of June 30, 2014. Metro Fire is self-insured for workers’ compensation claims and the liability is actuarially determined. Claim liabilities and related expenditures are reported when it is probable that a loss has occurred and the loss amount can be reasonably estimated. The liability for workers’ compensation claims on June 30, 2014 was $24.6 million.
S a c r a m e n t o M e t r o p o l i t a n F i r e D i s t r i c t 9 | P a g e F Y 2 0 1 3 / 1 4 C o m p r e h e n s i v e A n n u a l F i n a n c i a l R e p o r t

Below is a chart depicting Metro Fire’s claim losses by policy year since 2004, which reflects how much remains outstanding for each year.
The breakdown of Metro Fire’s liabilities is as follows:
$0
$1,000
$2,000
$3,000
$4,000
$5,000
$6,000Th
ousa
nds
Policy Year
Summary of Workers' Compensation Claims
Paid Reserves IBNR
Other Current Liabilities,
$17,404,280
Bonds, $78,790,389
Capital Leases, $10,430,752
Compensated Absences,
$15,741,192
Workers' Compensation
Liability, $24,557,281
OPEB Liability, $52,034,142
10 | P a g e S a c r a m e n t o M e t r o p o l i t a n F i r e D i s t r i c t F Y 2 0 1 3 / 1 4 C o m p r e h e n s i v e A n n u a l F i n a n c i a l R e p o r t

GOVERNMENTAL FUND BALANCE AND BUDGETARY HIGHLIGHTS
General Fund The General Fund is the general operating fund of Metro Fire and is generally used to account for all financial resources relative to operations. The major source of revenue for the General Fund is property taxes ($113 million), which accounts for 70% of the Metro Fire’s operational funding. Charges for ambulance transport services, deployments, and other services ($42 million) accounts for 26% of operational funding. General Fund expenditures increased by $15.6 million (11%) from prior year. Major factors affecting this increase include increasing medical and retirement costs, and federally required overtime adjustments.
General Fund Budgetary Highlights Budgetary fund variances are monitored by the Board of Directors during regular Finance and Audit Committee meetings. As necessary, the Board revises the budget when new information is available. The general fund final adopted budget for fiscal year 2013/14 forecasted for a $4 million (modified accrual basis, see page 24) deficit to be funded by the use of reserves. Actual results had a more favorable $1.2 million surplus. A comparison of Metro Fire’s original and final budget as well as the actual governmental fund results for the various major funds appears on pages 21 to 22 of this report. Below is summary of final budget and actual results for all funds for fiscal year 2013/14:
Final Budget Actual VarianceTotal Revenues 161,196$ 162,014$ 818$ Total Expenditures (164,735) (160,598) 4,137Financing Sources (439) (249) 190Net Change in Fund Balance (3,978)$ 1,167$ 5,145$
Condensed Schedule of Revenues and Expenditures
(in thousands)Budget to Actual - General Fund
Table 5
Actual revenue was slightly ahead (0.5%) of budgeted revenues due to higher than projected intergovernmental revenues. Actual expenditures were $4.1 million lower than budgeted due to the following:
$3.1 million due budget savings resulting from successful implementation of various cost-cutting programs in services and supplies and not moving forward with a proposed benefit assessment in the current fiscal year.
$2.5 million was set-aside in anticipation of pension bond retirements and was budgeted as an expenditure; in the fund financial statements, it is treated as a restricted asset rather than as an expenditure
the above savings were offset by about $1.2 million more in overtime costs to fully comply with the federal Fair Labor Standards Act (FLSA)
During the year, there was an increase in General Fund budgeted revenues of $4.8 million between the original and final budget primarily due to GEMT as well as significant deployment cost reimbursements. The final budget further increased appropriations by about $11.3 million mainly due to increases in constant staffing costs (overtime) and federally required overtime rate adjustments.
S a c r a m e n t o M e t r o p o l i t a n F i r e D i s t r i c t 11 | P a g e F Y 2 0 1 3 / 1 4 C o m p r e h e n s i v e A n n u a l F i n a n c i a l R e p o r t

Other Governmental Funds The Capital Facilities Fund is used to account for development impact fees and capital lease proceeds. During the year, Metro Fire acquired several pieces of apparatus and undertook construction projects and major repair projects for a total expenditure of $4.9 million. Annual amortization payments for capital leases and a portion of the lease revenue bonds ($2.5 million) were also paid out of this fund. The remaining fund balances are restricted for capital expenditures only.
The Grant Fund is used to account for various types of grants awarded to Metro Fire. During the year, there was a total of $4.9 million spent in this fund. As previously discussed, the largest of these grants include the SAFER grants which assisted Metro Fire in paying for 24 firefighter positions and funding fire prevention planning. Also included is the Homeland Security and Emergency Management Simulator Grant which funded the construction of an exercise simulation center which can simulate disasters in real time. The remaining fund balances can only be used for purposes authorized in the grant awards.
CAPITAL ASSET AND DEBT ADMINISTRATION
CAPITAL ASSETS At the end of fiscal year 2013/14, Metro Fire had $92.9 million invested in a broad range of capital assets, including buildings, fire stations, and various pieces of equipment. This amount represents an increase of about $1.3 million, or 1.4%, from the previous year.
2014 2013
Land 25,860$ 23,131$ Construction in progress 3,156 3,945Building and improvements 38,492 38,473Equipment 25,390 26,049 Totals 92,898$ 91,598$
Capital Assets at Year-End
(in thousands)Net of Depreciation
Table 6
Metro Fire owns 42 fire stations: 40 fire stations currently providing fire suppression/EMS responses and two stations closed for cost savings. Metro Fire also owns its headquarters building, a logistics warehouse building, a training facility, a fleet maintenance building, a radio shop building, and two surplus office buildings. Resources include more than 340 vehicles and equipment consisting of fire engines, fire trucks, ambulances, a hazardous materials unit, a heavy rescue unit, two firefighting rescue helicopters, a bulldozer, rescue boats, a decontamination unit, and multiple support staff vehicles. Funding for infrastructure has historically come from a combination of development fees and property tax revenue; both of which sources were negatively impacted by the recession. As a result, in order to fund infrastructure and fire service apparatus needs, a combination of lease revenue bond issues and capital lease financing was employed. Additional detail regarding capital assets is located in Note 3 of the financial statements.
12 | P a g e S a c r a m e n t o M e t r o p o l i t a n F i r e D i s t r i c t F Y 2 0 1 3 / 1 4 C o m p r e h e n s i v e A n n u a l F i n a n c i a l R e p o r t

DEBT ADMINISTRATION The following table summarizes the long-term debt for the last two years:
2014 2013
Pension bonds payable 67,572$ 68,376$ Lease revenue bonds payable 11,218 11,981 Capital Leases 10,431 8,895 Totals 89,221$ 89,252$
Outstanding Debt at Year-End(in thousands)
Table 7
New debt resulted mainly from the acquisition of new fire apparatus and support vehicles as well as computer and networking equipment financed through capital leasing. In conjunction with the December 2011 lease revenue bond debt issuance, Moody’s Investor Service rated Metro Fire’s credit as a favorable A1. Metro Fire budget includes bi-annual principal and interest payments. In addition, Metro Fire has a policy that requires setting aside of an annual deposit payment for the eventual extinguishment of the Pension Bond Series B and C, in 2018 and 2025, respectively. Additional detail regarding long-term debt is located in Note 6 of the financial statements.
ECONOMIC FACTORS AND NEXT YEAR’S BUDGET Since 2008, the economy has presented Metro Fire with significant challenges. The Board of Directors, management and employees responded by working together to address both the immediate and long-term fiscal challenges confronting Metro Fire, with the goal of preserving service levels. While fiscal challenges remain, Metro Fire at least appears to be on a more predictable and fiscally sustainable path moving forward. As discussed previously, Metro Fire is now utilizing long-range financial planning tools to help identify fiscal challenges and guide current decision making. These fiscal planning efforts reflect a shared commitment on the part of the Board, management and employees to provide an exceptionally high level of service within a framework that promotes long-term fiscal stability. During this time, management and union representatives engaged in a highly collaborative effort to address a structural budget imbalance in the General Fund brought on by the negative impacts of the lingering economic recession; namely reduced property tax revenue, rising health care costs and rising pension costs caused by significant pension fund investment losses. Labor and management were able to reach agreement on a number of concessions that both achieved operational cost savings, and allowed Metro Fire to begin pre-funding retiree medical benefits. Pre-funding retiree medical benefits was identified as a key measure in preserving and reducing the long-term cost of this significant retirement benefit. The agreed-upon labor concessions have resulted in annual cost savings in excess of $9 million. Employees agreed to “pick-up” a portion of Metro Fire’s required retirement contributions, as follows: Safety employees - 12%; non-safety - 8%. This concession resulted in significant pension cost savings. To address the unfunded liability for retiree medical benefits, employees and retirees agreed to pay 8% of their monthly health premiums, and are subject to a “cap” on the monthly premium. In exchange, Metro Fire has agreed that all savings associated with these changes will be used to pre-fund retiree medical contributions (i.e. paid into the retiree medical benefit “OPEB” trust fund). This is expected to both lower the unfunded liability and reduce the long-term cost of providing retiree medical benefits. Metro Fire has budgeted contributions of $5.3 million into
S a c r a m e n t o M e t r o p o l i t a n F i r e D i s t r i c t 13 | P a g e F Y 2 0 1 3 / 1 4 C o m p r e h e n s i v e A n n u a l F i n a n c i a l R e p o r t

the OPEB trust fund for fiscal year 2014/15, which when combined with the $7.6 million for retiree medical premium payments in 2014/15, is just slightly below the ARC of $13.7 million. The Board has committed to revisit the OPEB funding during 2014/15 with the intent of fully funding the ARC if resources are available. Property values within Metro Fire’s jurisdiction have increased for two consecutive years and are projected to grow by 5% in next fiscal year. However, this growth is being driven primarily by the restoration of values previously reduced by the County Assessor during the height of the recession, not by change of ownership. What this means is that sales prices (or the value of property) remain sluggish. This trend is expected to continue for the foreseeable future. While the final budget for 2014/15 falls short of achieving the Board’s desired goal of establishing an operating reserve of 15%, it does achieve the following: balances current operating expenditures with current revenue; keeps Metro Fire on track with respect to addressing the long-term financial obligations associated with the commitment to current employees and retirees to pay medical benefits after retirement; maintains the funding plan for the outstanding pension obligation bonds; maintains a 10% reserve level for 2014/15; and projects an increase in reserves to around 12% for 2015/16. Management regularly reviews financial projections and makes adjustments based on recent trends in real property value, new commercial and residential development, State of California economic forecasts, and changes adopted by the retirement and healthcare systems under which Metro Fire provides benefits to its employees. District spending choices are prioritized and reflect public values, with service levels balanced against adequate funding to maintain facilities, vehicles and equipment and providing a sustainable level of fair and reasonable employee compensation. These efforts are undertaken with a commitment to sustaining the high level of service Metro Fire currently provides to the community and maintaining its long-term fiscal stability.
OBTAINING ADDITIONAL INFORMATION These financial reports are intended to provide Metro Fire’s elected officials, citizens, investors, and creditors with a general overview of Metro Fire’s financial condition and an accounting of the public’s money. If you have questions about this report or need more financial information, contact Metro Fire’s Chief Financial Officer at 10565 Armstrong Avenue, Mather, CA 95655. More information on Metro Fire’s operations can also be found at www.metrofire.ca.gov.
14 | P a g e S a c r a m e n t o M e t r o p o l i t a n F i r e D i s t r i c t F Y 2 0 1 3 / 1 4 C o m p r e h e n s i v e A n n u a l F i n a n c i a l R e p o r t

ASSETS Cash and investments 41,828,755$ Receivables, net of
allowance for uncollectibles:Medic fees receivable 5,523,814Interest receivable 2,997Taxes receivable 1,200,000Other receivables 1,000,488
Due from other governments 6,668,614Inventory 3,052,805Prepaid expenses and other assets 7,728Restricted cash and investments 1,770,422Pension asset 76,211,413Capital assets:
Not being depreciated 29,016,553 Being depreciated, net 63,881,034
Total Assets 230,164,623
LIABILITIESAccounts payable and accrued expenses 10,396,384 Salaries and benefits payable 5,719,891 Unearned revenue 602,202 Accrued interest payable 685,803 Long-term liabilities:
Due within one year 21,294,851Due in more than one year 160,258,905
Total Liabilities 198,958,036
NET POSITIONNet investment in capital assets 71,374,548 Restricted 2,522,753Unrestricted (42,690,714)
Total Net Position 31,206,587$
The accompanying notes are an integral part of these financial statements.
Sacramento Metropolitan Fire DistrictStatement of Net Position
June 30, 2014
S a c r a m e n t o M e t r o p o l i t a n F i r e D i s t r i c t 15 | P a g e F Y 2 0 1 3 / 1 4 C o m p r e h e n s i v e A n n u a l F i n a n c i a l R e p o r t

EXPENSESPublic protection
Salaries, benefits, services and supplies 157,118,974$ Interest and financing costs 4,411,918 Depreciation 4,612,234
Total Expenses 166,143,126
PROGRAM REVENUESCharges for services
Emergency medical services 34,155,622 Reimbursements from other agencies 3,762,073 Development fees and other charges 9,368,410
Operating grants and contributions 920,143 Capital contribution:
Capital grants 1,380,180
Total Program Revenues 49,586,428
Net Program Expense (116,556,698)
GENERAL REVENUESProperty taxes 111,089,471 Intergovernmental 2,697,715 Rental and other income 984,578 Miscellaneous 1,102,690
Total General Revenues 115,874,454
Change in Net Position (682,244)
Net Position, Beginning of Year 31,888,831
Net Position, End of Year 31,206,587$
The accompanying notes are an integral part of these financial statements.
Sacramento Metropolitan Fire DistrictStatement of Activities
For the Year Ended June 30, 2014
16 | P a g e S a c r a m e n t o M e t r o p o l i t a n F i r e D i s t r i c t F Y 2 0 1 3 / 1 4 C o m p r e h e n s i v e A n n u a l F i n a n c i a l R e p o r t

Non-majorFund
General Grant CapitalFund Funds Facilities Total
ASSETS Cash and investments 40,065,139$ 1,763,616$ 41,828,755$ Receivables, net of
allowance for uncollectibles:Medic fees receivable 5,523,814 5,523,814Interest receivable 1,685 545 767$ 2,997Taxes receivable 1,200,000 1,200,000Other receivables 1,000,488 1,000,488
Due from other governments 6,131,532 492,596 44,486 6,668,614Due from other funds 206,086 205,472 411,558Inventory 3,052,805 3,052,805Prepaid costs and other assets 7,728 7,728Restricted cash and investments 91,057 1,679,365 1,770,422
Total Assets 57,280,334$ 2,462,229$ 1,724,618$ 61,467,181$
LIABILITIESAccounts payable and accrued expenditures 9,700,896$ 595,320$ 100,168$ 10,396,384$ Salaries and benefits payable 5,446,873 273,018 5,719,891Due to other funds 205,472 206,086 411,558Unearned revenue 602,202 602,202Workers compensation payable 258,075 258,075
Total Liabilities 15,611,316 1,470,540 306,254 17,388,110
DEFERRED INFLOWS OF RESOURCESUnavailable revenue 6,282,100 2,369 44,486 6,328,955
Total Deferred Inflows of Resources 6,282,100 2,369 44,486 6,328,955
FUND BALANCESNonspendable 3,061,033 3,061,033Restricted 112,700 989,320 1,373,878 2,475,898Committed 19,129,064 19,129,064Unassigned 13,084,121 13,084,121
Total Fund Balances 35,386,918 989,320 1,373,878 37,750,116
Total Liabilities, Deferred Inflows of Resources and Fund Balances 57,280,334$ 2,462,229$ 1,724,618$ 61,467,181$
The accompanying notes are an integral part of these financial statements.
Sacramento Metropolitan Fire DistrictGovernmental Funds Balance Sheet
June 30, 2014
Major Funds
S a c r a m e n t o M e t r o p o l i t a n F i r e D i s t r i c t 17 | P a g e F Y 2 0 1 3 / 1 4 C o m p r e h e n s i v e A n n u a l F i n a n c i a l R e p o r t

Fund Balances - Total Governmental Funds 37,750,116$
When capital assets that are to be used in governmental activities arepurchased or constructed, the costs of those assets are reported asexpenditures in governmental funds. However, the statement of netposition includes those capital assets among the assets of Metro Fire as awhole. 92,897,587
Pension asset of the governmental activities is not a financial resource and,therefore, is not reported in the funds. 76,211,413
Certain receivables are not available to pay current period expenditures andtherefore are unavailable in the governmental funds. 6,328,955
Long-term liabilities applicable to Metro Fire's governmental activities arenot due and payable in the current period and accordingly are not reportedas fund liabilities. All liabilities, both current and long-term, are reported inthe statement of net position.
Bonds payable (78,790,389) Compensated absences (15,741,192) Interest payable on long-term debt (685,803) Workers compensation liability (24,299,206) Liability for other post-employment benefits (52,034,142) Capital lease (10,430,752)
Net Position of Governmental Activities 31,206,587$
The accompanying notes are an integral part of these financial statements.
Sacramento Metropolitan Fire DistrictReconciliation of the Governmental Funds Balance Sheet
to the Statement of Net PositionJune 30, 2014
18 | P a g e S a c r a m e n t o M e t r o p o l i t a n F i r e D i s t r i c t F Y 2 0 1 3 / 1 4 C o m p r e h e n s i v e A n n u a l F i n a n c i a l R e p o r t

Non-majorFund
General Grant Capital Fund Funds Facilities Total
REVENUESProperty taxes 112,297,471$ 112,297,471$ Intergovernmental 4,255,030 6,154,462$ 5,928$ 10,415,420Charges for services 44,207,768 44,207,768Development fees 1,092,120 1,092,120Use of money and property 1,020,039 3,519 (4,813) 1,018,745Miscellaneous 233,783 233,783
Total Revenues 162,014,091 6,157,981 1,093,235 169,265,307
EXPENDITURESCurrent:
Public protection 155,038,995 3,874,377 812,069 159,725,441Capital outlay 671,063 1,104,884 4,136,022 5,911,969Debt service:
Principal 2,124,480 1,839,488 3,963,968Interest and financing costs 2,763,716 616,663 3,380,379Total Expenditures 160,598,254 4,979,261 7,404,242 172,981,757
Excess (Deficiency) ofRevenues Over Expenditures 1,415,837 1,178,720 (6,311,007) (3,716,450)
OTHER FINANCING SOURCES (USES): Transfers in 248,979 213,658 462,637 Transfers out (248,979) (213,658) (462,637) Proceeds from capital leases 2,880,141 2,880,141
Total Other Financing Sources (Uses) (248,979) 35,321 3,093,799 2,880,141
Excess (Deficiency) of Revenues andOther Sources Over Expenditures 1,166,858 1,214,041 (3,217,208) (836,309)
Fund Balance, Beginning of Year 34,220,060 (224,721) 4,591,086 38,586,425
Fund Balance, End of Year 35,386,918$ 989,320$ 1,373,878$ 37,750,116$
Sacramento Metropolitan Fire DistrictStatement of Revenues, Expenditures, and Changes in Fund Balances
For the Year Ended June 30, 2014
Major Funds
Governmental Funds
S a c r a m e n t o M e t r o p o l i t a n F i r e D i s t r i c t 19 | P a g e F Y 2 0 1 3 / 1 4 C o m p r e h e n s i v e A n n u a l F i n a n c i a l R e p o r t

Net Change in Fund Balance - Total Governmental Funds (836,309)$
Governmental funds report capital outlay as expenditures. However, in theGovernment-wide Statement of Activities the cost of those assets whencompleted is allocated over their estimated useful lives as depreciation expense.
Cost of assets capitalized 5,911,969Depreciation expense (4,612,234)
Debt proceeds provide current financial resources to governmental funds, butissuing debt increases long-term liabilities in the Government-wide Statement ofNet Position. Repayment of principal is an expenditure in the governmentalfunds, but the repayment reduces long-term liabilities in the Statement of NetPosition principal payments on long-term debt.
Principal payments 3,963,968Bond accretion and write-off of issuance costs (1,053,546) Proceeds from debt issuance (2,880,141)
Some expenses reported in the Government-wide Statement of Activities do notrequire the use of current financial resources and therefore are not expendituresin the governmental funds.
Change in accrued interest payable 22,007 Change in compensated absences 1,379,974 Change in other post-employment benefits liability (638,051) Change in workers compensation 82,981
Any excess of the amount funded during the fiscal year over the annual requiredcontributions (ARC) for pension benefits was recorded as an expenditure forgovernmental funds. However, the difference between the ARC and the amountfunded is recorded as an adjustment to retirement expense in the statement ofactivities. 1,731,676
Some receivables are unavailable in the Governmental Funds because theamounts do not represent current financial resources that are recognized underthe accrual basis in the Statement of Activities. (3,754,538)
Change in Net Position of Governmental Activities (682,244)$
The accompanying notes are an integral part of these financial statements.
Sacramento Metropolitan Fire DistrictReconciliation of the Statement of Revenues, Expenditures,
and Changes in Fund Balances of Governmental Funds to the Statement of Activities
For the Year Ended June 30, 2014
20 | P a g e S a c r a m e n t o M e t r o p o l i t a n F i r e D i s t r i c t F Y 2 0 1 3 / 1 4 C o m p r e h e n s i v e A n n u a l F i n a n c i a l R e p o r t

Original Variance withBudget Final Budget Actual Final Budget
REVENUESProperty taxes 112,100,001$ 112,378,501$ 112,297,471$ (81,030)$ Intergovernmental 3,246,000 3,144,550 4,255,030 1,110,480 Charges for services 39,424,000 43,344,516 44,207,768 863,252 Use of money and property 1,099,435 1,167,238 1,020,039 (147,199) Miscellaneous 542,800 1,160,800 233,783 (927,017)
Total Revenues 156,412,236 161,195,605 162,014,091 818,486
EXPENDITURESCurrent:
Public protectionSalaries and benefits 124,237,223 132,048,806 134,902,380 (2,853,574) Services and supplies 20,698,123 22,984,266 19,930,481 3,053,785 Other 271,500 270,160 206,134 64,026
Capital outlay 731,553 857,102 671,063 186,039 Debt service:
Principal 4,645,246 5,781,246 2,124,480 3,656,766 Interest and financing costs 2,798,554 2,793,554 2,763,716 29,838 Total Expenditures 153,382,199 164,735,134 160,598,254 4,136,880
Excess (Deficiency) ofRevenues Over Expenditures 3,030,037 (3,539,529) 1,415,837 4,955,366
OTHER FINANCING SOURCES (USES)Transfers out (448,979) (448,979) (248,979) 200,000 Proceeds from sale of assets 10,000 10,000 (10,000)
Total Other Financing Sources (Uses) (438,979) (438,979) (248,979) 190,000
Net Change in Fund Balance 2,591,058$ (3,978,508)$ 1,166,858$ 5,145,366$
The accompanying notes are an integral part of these financial statements.
Sacramento Metropolitan Fire DistrictStatement of Revenues, Expenditures,
and Changes in Fund Balance - Budget and Actual
For the Year Ended June 30, 2014General Fund
S a c r a m e n t o M e t r o p o l i t a n F i r e D i s t r i c t 21 | P a g e F Y 2 0 1 3 / 1 4 C o m p r e h e n s i v e A n n u a l F i n a n c i a l R e p o r t

Original Variance withBudget Final Budget Actual Final Budget
REVENUESIntergovernmental 6,187,281$ 7,765,059$ 6,154,462$ (1,610,597)$ Use of money and property 750 (748) 3,519 4,267
Total Revenues 6,188,031 7,764,311 6,157,981 (1,606,330)
EXPENDITURESCurrent:
Public protectionSalaries and personnel 2,962,382 3,245,292 2,752,769 492,523 Services and supplies 1,466,485 1,441,745 1,121,608 320,137
Capital outlay 712,957 2,626,311 1,104,884 1,521,427 Total Expenditures 5,141,824 7,313,348 4,979,261 2,334,087
Excess (Deficiency) ofRevenues Over Expenditures 1,046,207 450,963 1,178,720 727,757
OTHER FINANCING SOURCES (USES)Transfers in 290,599 297,389 290,599 (6,790) Transfers out (41,620) (255,278) (255,278) -
Total Other Financing Sources (Uses) 248,979 42,111 35,321 (6,790)
Net Change in Fund Balance 1,295,186$ 493,074$ 1,214,041$ 720,967$
The accompanying notes are an integral part of these financial statements.
Sacramento Metropolitan Fire District
and Changes in Fund Balance - Budget and ActualGrant Fund
For the Year Ended June 30, 2014
Statement of Revenues, Expenditures,
22 | P a g e S a c r a m e n t o M e t r o p o l i t a n F i r e D i s t r i c t F Y 2 0 1 3 / 1 4 C o m p r e h e n s i v e A n n u a l F i n a n c i a l R e p o r t

NOTE 1 – SUMMARY OF SIGNIFICANT ACCOUNTING POLICIES
The basic financial statements of Sacramento Metropolitan Fire District (“Metro Fire”) have been prepared in conformity with accounting principles generally accepted in the United States of America as applied to government units. The Governmental Accounting Standards Board (GASB) is the standard-setting body for establishing governmental accounting and financial reporting principles. Metro Fire’s significant accounting policies are described below.
A. SCOPE OF FINANCIAL REPORTING ENTITY
Metro Fire was established under Health & Safety Code Section 13800 on December 1, 2000, as a result of the merger between the American River and Sacramento County Fire Protection Districts. It is governed by a nine member Board of Directors elected by geographic division. Metro Fire’s boundaries cover approximately 417 square miles that include Sacramento and Placer counties with a population exceeding 715,000 residents. Metro Fire provides fire protection services including fire suppression, fire prevention, inspection, plan checking, and public education programs. It also provides emergency medical services, advanced life support and rescue services. It employs approximately 644 people and operates forty fire stations, an administration building, a fire prevention/supply warehouse building, a training facility, a fleet maintenance shop, and two surplus office buildings. Metro Fire has reviewed criteria to determine whether other entities with activities that benefit Metro Fire should be included within its financial reporting entity. The criteria include, but are not limited to, whether it exercises oversight responsibility (which includes financial interdependency, selection of governing authority, designation of management, ability to significantly influence operations and accountability for fiscal matters), the scope of public service, and a special financing relationship. Metro Fire has determined that no outside entity meets the above criteria, and therefore, no agency has been included as a component unit in Metro Fire's financial statements. In addition, Metro Fire is not aware of any entity that would exercise such oversight responsibility that would result in Metro Fire being considered a component unit of that entity.
Joint Powers Authorities or Jointly Governed Organizations
Metro Fire is a member of the California Fire and Rescue Training Authority (CFRTA) at Sacramento, the Sacramento Regional Fire/EMS Communications Center (SRFECC), the Special District Risk Management Authority (SDRMA), and the California Municipal Finance Authority (CMFA) for which Metro Fire’s participation does not involve an ongoing financial interest or responsibility. As a member of these organizations, Metro Fire receives the following services:
CFRTA provides fire, rescue, EMS, and Haz-Mat training SRFECC serves as Metro Fire’s fire and EMS dispatch center SDRMA provides insurance coverage for general and auto liability, errors and omissions, property,
boiler and machinery and employee dishonesty CMFA facilitates the issuance of Metro Fire bonds
The amounts contributed to these jointly governed organizations in fiscal year 2013/14 consist of the following:
CFRTA 45,000$ SRFECC 3,618,306 SDRMA 406,356
S a c r a m e n t o M e t r o p o l i t a n F i r e D i s t r i c t 23 | P a g e 2 0 1 4 C o m p r e h e n s i v e A n n u a l F i n a n c i a l R e p o r t

NOTE 1 – SUMMARY OF SIGNIFICANT ACCOUNTING POLICIES (Cont.)
During the year, Metro Fire paid CFRTA $186,405 for training costs. On December 19, 2011, Metro Fire entered into a ground lease agreement with CFRTA whereby Metro Fire leased 8.25 acres of land to CFRTA for 55 years at a minimum rental fee of $30,000 per year, to be increased by $10,000 per year upon additional agencies joining CFRTA. On March 14, 2013, Metro Fire entered into a reimbursement agreement with CFRTA for the construction and installation of Urban Search and Rescue props on the aforementioned land leased by CFRTA. The total reimbursement for the year was $2,923,442.
B. BASIS OF ACCOUNTING AND PRESENTATION
Government-Wide Financial Statements
The government-wide financial statements (i.e., the statement of net assets and the statement of activities) report information on all of the activities of Metro Fire. The effect of interfund activity has been removed from these statements. Metro Fire has only governmental activities, which are supported primarily by taxes, intergovernmental revenues and charges for services.
The statement of activities demonstrates the degree to which the direct expenses of a given function or segment is offset by program revenues. Direct expenses are those that are clearly identifiable with a specific function or segment. Program revenues include 1) charges to customers who purchase, use or directly benefit from goods, services, or privileges provided by a given function or segment and 2) grants and contributions that are restricted to meeting the operational or capital requirements of a particular function or segment. Taxes and other items not properly included among program revenues are reported instead as general revenues.
The government-wide financial statements are reported using the economic resources measurement focus and the accrual basis of accounting. Revenues are recorded when earned and expenses are recorded when a liability is incurred, regardless of the timing of related cash flows. Property taxes are recognized as revenues in the year which they are levied. Grants and similar items are recognized as revenue when all eligibility requirements have been met.
When both restricted and unrestricted resources are available for use, it is Metro Fire’s policy to use restricted resources first, then unrestricted resources as they are needed.
Fund Financial Statements
Governmental fund financial statements are reported using the current financial resources measurement focus and the modified accrual basis of accounting. Revenues are recognized as soon as they are both measurable and available. Revenues are considered to be available when they are collectible within the current period or soon enough thereafter to pay liabilities of the current period. For this purpose, Metro Fire considers all revenues, except property taxes, to be available if they are collected within 90 days of the end of the current fiscal period. Property taxes are recognized if received within 60 days. Property taxes, charges for services, intergovernmental revenues, rental income, and investment earnings associated with the current fiscal period are all considered to be susceptible to accrual and so have been recognized as revenues of the current fiscal period. All other revenue items are considered to be measurable and available only when cash is received by the government. Expenditures generally are recorded when a liability is incurred, as under accrual accounting. However, debt service expenditures, as well as expenditures related to compensated absences and workers compensation claims, are recorded only when payment is due. General capital asset acquisitions are reported as expenditures in governmental funds. Payable balances consist primarily of payables to vendors.
24 | P a g e S a c r a m e n t o M e t r o p o l i t a n F i r e D i s t r i c t 2 0 1 4 C o m p r e h e n s i v e A n n u a l F i n a n c i a l R e p o r t

NOTE 1 – SUMMARY OF SIGNIFICANT ACCOUNTING POLICIES (Cont.)
C. FUND ACCOUNTING
The accounts of Metro Fire are organized on the basis of funds. A fund is a separate accounting unit with a self-balancing set of accounts. The operations of each fund are accounted for with a separate set of self-balancing accounts that comprise its assets, liabilities, fund equity, revenues, and expenditures. Metro Fire resources are allocated to and accounted for in individual funds based upon the purpose for which they are to be spent. Metro Fire’s funds are as follows:
Major Funds
The General Fund is the general operating fund of Metro Fire. It is used to account for all financial resources except those required or designated by the Board of Directors to be accounted for in another fund.
The Grant Fund is a special revenue fund used to account for the proceeds of federal and state grants that are legally restricted to expenditures for specific purposes.
Nonmajor Funds
The Capital Facilities Fund is a capital projects fund used to account for all resources received from development impact fees as well as proceeds from Metro Fire’s lease revenue bonds. It is used for the acquisition or construction of major capital facilities and equipment.
D. BUDGETARY PRINCIPLES
As required by the laws of the State of California, Metro Fire prepares and legally adopts a final operating budget on or before October 1 of each fiscal year. Public hearings are conducted on the proposed final budget to review all appropriations, sources of financing, and to provide opportunities for public comment. Metro Fire’s governing board satisfied these requirements.
Operating budgets are adopted for the General Fund on the modified accrual basis of accounting. Budgetary control and the legal level of control are at the fund level. Significant operating or capital spending changes are addressed by Metro Fire’s Board of Directors in their Mid-Year Budget amendment or earlier if necessary. The final budget data contained in the financial statements reflects the effect of all approved budget amendments.
The Statements of Revenues, Expenditures and Changes in Fund Balances – Budget and Actual is included as part of the basic financial statements. Reclassifications were made in the budgeted amounts to be consistent with the presentation of the actual balances. These reclassifications include transferring budgeted capital outlay to services and supplies for capital expenditures not meeting Metro Fire’s capitalization threshold and eliminating intra-fund transfers.
E. MEDIC FEES RECEIVABLE
Accounts receivable arises from billings to insurance companies and patients medic services. Metro Fire has a receivable balance of $5,523,814 which is net of allowance for doubtful accounts of $10,664,194 at June 30, 2014. The allowance includes an estimate for future uncollectible debt and insurance write-offs.
F. INVENTORY
Inventories are stated at cost using the weighted average method. Inventories consist of medical and other supplies, vehicle parts, helicopter parts, and fuel. The cost of such inventories is recorded as expenditures/expenses when consumed rather than when purchased.
S a c r a m e n t o M e t r o p o l i t a n F i r e D i s t r i c t 25 | P a g e 2 0 1 4 C o m p r e h e n s i v e A n n u a l F i n a n c i a l R e p o r t

NOTE 1 – SUMMARY OF SIGNIFICANT ACCOUNTING POLICIES (Cont.)
G. PREPAID COSTS
Certain payments to vendors reflect costs applicable to future accounting periods and are recorded as prepaid costs in both government-wide and fund financial statements. The cost of prepaid items is recorded as expenditures/expenses when consumed rather than when purchased. Prepaid costs of governmental funds offset nonspendable fund balance to indicate they do not constitute resources available for future appropriation.
H. CAPITAL ASSETS
Capital assets for governmental fund types are not capitalized in the funds used to acquire or construct them. Capital acquisitions are reflected as expenditures in the governmental fund, and the related assets are reported in the government-wide financial statements. Capital assets are defined by Metro Fire as assets with an initial, individual cost of more than $5,000. Such assets are recorded at historical cost if purchased or constructed. Donated capital assets are recorded at the estimated fair market value at the date of donation. For certain older assets, including infrastructure, estimated historical costs are used. The costs of normal maintenance and repairs that do not add to the value of the asset or materially extended assets lives are not capitalized.
Capital assets are depreciated using the straight-line method over the following useful lives:
Costs of assets sold or retired (and related amounts of accumulated depreciation) are eliminated from the accounts in the year of sale or retirement and the resulting gain or loss is included in the operating statement of the related fund. In governmental funds, the sale of general capital assets is included in the statement of revenues, expenditures and changes in fund balances as proceeds from sale.
I. RESTRICTED ASSETS
Metro Fire’s restricted assets consist of fees collected to defray the cost of constructing facilities to serve new construction, unspent bond proceeds for capital acquisitions, amounts held for payment of workers compensation claims and for Metro Fire’s flexible spending plan, and debt service reserves.
J. COMPENSATED ABSENCES
Regular, full-time Metro Fire employees are granted vacation, sick and holiday leave in varying amounts based upon length of service. Any accrued hours, not in excess of the maximum allowable and unused during the current period, are carried forward to following years. Additionally, certain employees are allowed compensated time-off in lieu of overtime compensation and/or from working on holidays. Metro Fire employees may receive from 36% to 38% of accumulated sick leave in cash upon termination, with the remainder applied as an additional service credit for the purpose of determining pension benefits under the Public Employees’ Retirement System. Compensated absences are accrued in the government-wide financial statements when earned. A liability for compensated absences is reported in governmental funds only if they have matured, for example, as a result of employee resignations and retirements and is currently payable. Each year’s budget includes a provision for the estimated expenditure for the current year.
Asset Class YearsBuildings and Improvements 25 to 50Equipment 5 to 25
26 | P a g e S a c r a m e n t o M e t r o p o l i t a n F i r e D i s t r i c t 2 0 1 4 C o m p r e h e n s i v e A n n u a l F i n a n c i a l R e p o r t

NOTE 1 – SUMMARY OF SIGNIFICANT ACCOUNTING POLICIES (Cont.)
K. UNAVAILABLE AND UNEARNED REVENUES
Unearned revenues arise when resources are received by Metro Fire before it has legal claim to them (i.e., when grant monies are received prior to the incurrence of qualifying expenditures). Unavailable revenues in governmental funds arise when a potential revenue source does not meet both the “measurable” and “available” criteria for recognition in the current period. Revenues not received in the availability period are recognized for the government-wide presentation.
L. LONG-TERM OBLIGATIONS
In the government-wide financial statements, long-term debt and other long-term obligations are reported as liabilities in the applicable government activities. Issuance costs are expensed as incurred. In the fund financial statements, governmental fund types recognize bond premiums and discounts, as well as issuance costs, during the current period. The face amount of the debt issued is reported as other financing sources. Premiums received on debt issuances are reported as other financing sources while discounts on debt issuances are reported as other financing uses. Issuance costs, even if withheld from the actual net proceeds received, are reported as debt service expenditures.
M. PROPERTY TAXES
The County of Sacramento is responsible for the collection and allocation of property taxes. Under California law, property taxes are assessed and collected by the County of Sacramento up to 1% of the full cash value of taxable property, plus other increases approved by the voters and distributed in accordance with statutory formulas. Metro Fire recognizes property taxes when the individual installments are due provided they are collected within 60 days after year-end.
Secured property taxes are levied on or before the first day of September of each year. They become a lien on real property on March 1 preceding the fiscal year for which taxes are levied. These taxes are paid in two equal installments; the first is due November 1 and delinquent with penalties after December 10; the second is due February 1 and delinquent with penalties after April 10. Secured property taxes, which are delinquent and unpaid as of June 30, are declared to be tax defaulted and are subject to redemption penalties, cost, and interest when paid. If the delinquent taxes are not paid at the end of five years, the property is sold at public auction and the proceeds are used to pay the delinquent amounts due. Any excess is remitted, if claimed, to the taxpayer. Additional tax liens are created when there is a change in ownership of property or upon completion of new construction. Tax bills for these new tax liens are issued throughout the fiscal year and contain various payments and delinquent dates, but are generally due within one year. If the new tax liens are lower, the taxpayer receives a tax refund rather than a tax bill. Unsecured personal property taxes are not a lien against real property. These taxes are due on March 1, and become delinquent, if unpaid on August 31.
The County uses the alternative method of property tax apportionment known as the “Teeter Plan.” Under this method of property tax apportionment, the County purchases the delinquent secured taxes at June 30 of each fiscal year. These taxes are accrued as intergovernmental receivables; they are recognized as governmental fund revenues only if they are received from the County within 60 days after year-end. For government-wide presentation, they are accrued when earned regardless of the timing of the related cash flows.
S a c r a m e n t o M e t r o p o l i t a n F i r e D i s t r i c t 27 | P a g e 2 0 1 4 C o m p r e h e n s i v e A n n u a l F i n a n c i a l R e p o r t

NOTE 1 – SUMMARY OF SIGNIFICANT ACCOUNTING POLICIES (Cont.)
N. CHARGES FOR SERVICES
Charges for services represent various cost reimbursements that Metro Fire obtains in the normal course of its operations. A bulk of these charges comes from cost reimbursements for its emergency medical transports. In addition, Metro Fire obtains reimbursements from other agencies for costs associated with deploying strike teams to fight fires. These reimbursements are reflected as revenues and the related costs as expenses.
O. ELIMINATIONS AND RECLASSIFICATIONS
In the process of aggregating data for the government-wide statements, some amounts reported as interfund activity and balances in the fund financial statements were eliminated or reclassified. Interfund receivables and payables were eliminated to minimize the “grossing up” effect on assets and liabilities. In addition, certain reclassifications have been made to revenue categories compared to those reported in the prior year financial statements. The prior year balances reported in the MD&A have been reclassified to conform to the current year presentation.
P. NEW PRONOUNCEMENTS
In June 2012, the GASB approved Statement No. 68, Accounting and Financial Reporting for Pensions. This Statement requires governments providing defined benefit pension plans to recognize their long-term obligation for pension benefits as a liability on the statement of net position and to more comprehensively and comparably measure the annual costs of pension benefits. Among other things, this Statement requires the balance sheet to reflect the plan funding status showing the net difference between the pension liabilities and pension assets. Pension liabilities are determined using the entry age normal cost method and pension assets are determined using market value. Certain other changes will also impact the pension liability and expense. In addition, this Statement requires employers to revise and expand note disclosures and to provide required supplementary information (RSI). The implementation of this GASB Statement will have a significant impact on Metro Fire’s financial statements and is effective for Metro Fire’s June 30, 2015 financial statements. In January 2013, GASB issued Statement No. 69, Government Combinations and Disposals of Government Operations. The primary objective of this Statement is to establish accounting and financial reporting standards related to government combinations and disposals of government operations. As used in this Statement, the term government combinations include a variety of transactions referred to as mergers, acquisitions, and transfers of operations. The provisions of Statement 69 are effective for financial statements for periods beginning after December 15, 2013, with earlier application encouraged. Metro Fire has not determined its effect on the financial statements. In November 2013, the GASB approved Statement No. 71, Pension Transition for Contributions Made Subsequent to the Measurement Date – an amendment of GASB Statement No. 68. GASB Statement No. 68 requires a local government employer to recognize a net pension liability measured as of a date (measurement date) no earlier than the end of its prior fiscal year. This Statement requires that, at transition, a government recognize a beginning deferred outflow of resources for its pension contribution made subsequent to the measurement date of the beginning net pension liability. This Statement will be implemented simultaneously with Statement No. 68.
28 | P a g e S a c r a m e n t o M e t r o p o l i t a n F i r e D i s t r i c t 2 0 1 4 C o m p r e h e n s i v e A n n u a l F i n a n c i a l R e p o r t

NOTE 2 – CASH AND INVESTMENTS
As of June 30, 2014, Metro Fire’s cash and investments are classified in the accompanying financial statements as follows:
Cash and investments as of June 30, 2014 consisted of the following:
Cash on hand and in banks consists of all cash held by Metro Fire and all cash maintained in commercial bank accounts. Cash in County treasury consists of Metro Fire cash held by the Sacramento County Treasury that is invested in the County investment pool. Investments with fiscal agent consist of funds held with a bank trustee committed to the planned early retirement of Metro Fire’s pension bond obligations. It is also comprised of funds held for debt reserve requirements of its lease revenue bonds as well as for qualified capital outlay expenditures. Investments are stated at fair value.
A. DEPOSIT AND INVESTMENT POLICIES
California statutes authorize special districts to invest idle or surplus funds in a variety of credit instruments as provided for in the California Government Code, Section 53600. The following table identifies the investment types that are authorized for Metro Fire by the California Government Code (or Metro Fire’s investment policy, whichever is more restrictive) that address interest rate risk, credit risk, and concentration of credit risk.
Cash and investments 41,828,755$ Restricted cash and investments 1,770,422
43,599,177$
Cash on hand and in banks 574,267$ Investment in Sacramento County Pooled
26,840,041 Investments with fiscal agent
Money market mutual funds 16,184,869
Total Cash and Investments 43,599,177$
Investment Fund
Maximum MaximumMaximum Percentage Investment
Authorized Investment Type Maturity of Portfolio in One Issue
U.S. Treasury obligations and Agency securities 5 years None NoneCalifornia Local Agency debt 5 years None NoneBankers acceptances 180 days 40% 30%High grade commercial paper 270 days 25% 10%Negotiable certificates of deposit 5 years 30% NoneMedium term corporate notes 5 years 30% NoneMutual funds N/A 20% 10%Mortgage pass-through securities 5 years 20% NoneCollateralized negotiable investments 5 years None NoneRepurchase agreements 92 days 20% NoneLocal government investment pools N/A None None
S a c r a m e n t o M e t r o p o l i t a n F i r e D i s t r i c t 29 | P a g e 2 0 1 4 C o m p r e h e n s i v e A n n u a l F i n a n c i a l R e p o r t

NOTE 2 – CASH AND INVESTMENTS (Cont.)
Metro Fire complied with the provisions of California Government Code and Metro Fire’s investment policy pertaining to the types of investments held, institutions in which deposits were made and security requirements.
B. INVESTMENT IN POOLED FUNDS
Metro Fire’s investments in the Sacramento County pooled investment fund is managed by the Sacramento County Treasurer and is stated at fair value or amortized cost, which approximates fair value. The total amount invested by all public agencies as of June 30, 2014 was $2,482,277,534. The investment pool is actively managed with a weighted average maturity of 293 days. Metro Fire’s share of the pool is stated at market value in Metro Fire’s financial statement. Sacramento County does not invest in any derivative financial products directly. The Sacramento County Treasury Investment Oversight Committee (Committee) has oversight responsibility for Sacramento County’s cash and investment pool. The Committee consists of ten members as required by State law. The value of pooled shares in Sacramento County that may be withdrawn is determined on an amortized cost basis, which is different than the fair value of Metro Fire’s position in the pool.
C. INTEREST RATE RISK
Interest rate risk is the risk that changes in market interest rates will adversely affect the fair value of an investment. Generally, the longer the maturity of an investment, the greater the sensitivity of its fair value to changes in market interest rates. Information about the sensitivity of the fair values of Metro Fire’s investments to market fluctuations is provided by the following table that shows the distribution of its investments by maturity as of June 30, 2014:
D. CREDIT RISK
Generally, credit risk is the risk that an issuer of an investment will not fulfill its obligation to the holder of the instrument. This is measured by the assignment of a rating by a nationally recognized statistical rating organization. Presented below is the minimum rating required by (where applicable) the California Government Code, and the actual rating as of year-end for each investment type as of June 30, 2014:
Total < 1 year 1-5 yearsInvestment in Sacramento County Pooled
Investment Fund 26,840,041$ 26,840,041$ -$ Investments with fiscal agent
Money market mutual funds 16,184,869 16,184,869 -
Total 43,024,910$ 43,024,910$ -$
Effective Duration
Total AAA Not RatedInvestment in Sacramento County Pooled
Investment Fund 26,840,041$ N/A -$ 26,840,041$ Investments with fiscal agent
Money market mutual funds 16,184,869 N/A 16,184,869$ -
Total 43,024,910$ 16,184,869$ 26,840,041$
Minimum Legal Rating
Ratings as of Year End
30 | P a g e S a c r a m e n t o M e t r o p o l i t a n F i r e D i s t r i c t 2 0 1 4 C o m p r e h e n s i v e A n n u a l F i n a n c i a l R e p o r t

NOTE 2 – CASH AND INVESTMENTS (Cont.)
E. CONCENTRATION OF CREDIT RISK
Metro Fire had no investment policy limiting the amount that can be invested in any one issuer beyond that stipulated by the California Government Code. At June 30, 2014, Metro Fire had no investments in one issuer (other than mutual funds and the Sacramento County Pooled Investment Fund) that represented 5% or more of total Metro Fire investments.
F. CUSTODIAL CREDIT RISK
Custodial risk for deposits is the risk that, in the event of the failure of a depository financial institution, a government will not be able to recover its deposits or will not be able to recover collateral securities that are in the possession of an outside party. The California Government Code and Metro Fire’s investment policy do not contain legal or policy requirements that would limit the exposure to custodial credit risk for deposits, other than the following provision for deposits: The California Government Code requires that a financial institution secure deposits made by state or local governmental units by pledging securities in an undivided collateral pool held by a depositary regulated under state law (unless so waived by the governmental unit). The market value of the pledged securities must be equal to at least 110% of the total amount deposited by the public agencies. California law allows financial institutions to secure deposits by pledging first trust deed mortgage notes having a value of 150% of the secured deposits.
At June 30, 2014, the carrying value of Metro Fire’s deposits was $573,767 and the balance in financial institutions was $654,992. At June 30, 2014, Metro Fire had $209,311 in deposits at banks above the federally insured limit.
NOTE 3 – CAPITAL ASSETS
Metro Fire’s capital assets consist of the following:
DeductionsJuly 1, 2013 Additions Transfers June 30, 2014
Capital assets, not being depreciated: Land and Land Improvements 23,131,184$ -$ 2,728,931$ 25,860,115$ Construction-in-progress 3,944,886 1,940,483 (2,728,931) 3,156,438 Total capital assets, not being depreciated 27,076,070 1,940,483 - 29,016,553
Capital assets, being depreciated: Buildings and improvements 55,288,853 1,161,130 56,449,983 Equipment 57,762,669 2,810,356 (140,000) 60,433,025 Total capital assets, being depreciated 113,051,522 3,971,486 (140,000) 116,883,008
Less accumulated depreciation for: Buildings and improvements (16,816,217) (1,142,269) (17,958,486) Equipment (31,713,523) (3,469,965) 140,000 (35,043,488) Total accumulated depreciation (48,529,740) (4,612,234) 140,000 (53,001,974)
Total capital assets, being depreciated, net 64,521,782 (640,748) - 63,881,034
Total capital assets 91,597,852$ 1,299,735$ -$ 92,897,587$
S a c r a m e n t o M e t r o p o l i t a n F i r e D i s t r i c t 31 | P a g e 2 0 1 4 C o m p r e h e n s i v e A n n u a l F i n a n c i a l R e p o r t

NOTE 3 – CAPITAL ASSETS (Cont.)
Net depreciation expense of $4,612,234 was recorded for the year ended June 30, 2014. As discussed in Note 6, on November 15, 2011, Metro Fire issued lease revenue bonds to finance certain capital acquisitions. Three fire stations with a net book value of $10,005,340 as of June 30, 2014 were used as security for the bonds. In addition, Metro Fire also has a capital lease obligation in which equipment with a total net book value of $10,912,625 as of June 30, 2014 were pledged as collateral.
NOTE 4 – INTERFUND TRANSACTIONS
Transactions between funds of Metro Fire are recorded as interfund transfers. The unpaid balances at year-end, as a result of such transactions, are shown as due to and due from other funds. Interfund balances at June 30, 2014 consisted of the following:
The balance between the General and the Capital Facilities Fund represent an interfund-loan which is not expected to be paid within the next year. All remaining balances resulted from processing certain disbursements by Metro Fire’s fiscal agent out of funds other than the intended fund. Interfund transfers for the fiscal year ended June 30, 2014, consisted of the following amounts:
The interfund transfer made by the General Fund to the Grant Fund was made to fulfill grant match requirements. The transfer from the Grant Fund to the Capital Facilities Fund was made to offset expenditures recorded in the latter in the previous year for which reimbursements were recorded in the Grant Fund.
General Grant CapitalFund Funds Facilities Total
Due toGeneral Fund -$ -$ 206,084$ 206,084$ Grant Funds 205,472 - - 205,472
Total 205,472$ -$ 206,084$ 411,556$
Due from
General Grant CapitalFund Funds Facilities Total
Transfer toGrant Funds 248,979$ -$ -$ 248,979$ Capital Facilities Fund - 213,658 - 213,658
Total 248,979$ 213,658$ -$ 462,637$
Transfer from
32 | P a g e S a c r a m e n t o M e t r o p o l i t a n F i r e D i s t r i c t 2 0 1 4 C o m p r e h e n s i v e A n n u a l F i n a n c i a l R e p o r t

NOTE 5 – RETIREMENT PLAN
A. PLAN DESCRIPTIONS
Metro Fire contributes to the following defined benefit pension plans:
The Safety Plan of the Sacramento Metropolitan Fire District (the Safety Plan), an agent multiple-employer defined benefit pension plan administered by the California Public Employees’ Retirement System (PERS).
The Miscellaneous Plan of the Sacramento Metropolitan Fire District (the Miscellaneous Plan), a cost-sharing multiple-employer defined benefit pension plan administered by PERS.
The Sacramento County Employees Retirement System Safety Tier 1 Plan (the SCERS Plan), a cost-sharing multiple-employer defined benefit pension plan administered by the County of Sacramento.
Benefit provisions and all other requirements for PERS are established by State statute and benefit provisions and all other requirements for SCERS are established by Section 31584 of the County of the Sacramento Retirement Law of 1932. The establishment and amendment of specific benefit provisions of the plans are authorized by resolutions of the Board. Each plan provides retirement and disability benefits, annual cost-of-living adjustments and death benefits to plan members and beneficiaries. PERS acts as a common investment and administrative agent for participating public entities within the State of California. All permanent and part-time employees working at least 1,000 hours per year are enrolled in the Safety Plan or the Miscellaneous Plan. Under the Safety Plan or the Miscellaneous Plan, benefits vest after five years of service. Upon retirement, participants are entitled to an annual retirement benefit, payable for life, in an amount equal to a benefit factor multiplied by their highest average monthly salary over 12 consecutive months of employment or in the case of PEPRA employees 36 consecutive months of employment. Only the plans administered by PERS are open for new enrollment. Safety Plan members benefit formula is 3% at age 50 for non-PEPRA safety employees and 2.7% at age 57 for PEPRA safety members. The Miscellaneous Plan participates in the PERS Miscellaneous 3% at age 60 Risk Pool for non-PEPRA employees and 2% at age 62 for PEPRA employees. PERS issues publicly available financial reports for its plans. Copies of the PERS annual financial report and pertinent past trend information may be obtained from their website at www.calpers.ca.gov. SCERS issues a publicly available financial report for its plans. Copies of the SCERS annual report may be obtained from their website at www.scers.org.
B. FUNDING POLICY
Metro Fire is required by statute to contribute the actuarially determined amounts necessary to fund the benefits for participants in each of its plans. Required contributions of active plan members and of Metro Fire for fiscal year 2013/14 were as follows:
PERS Safety Plan:Plan participants 9.00%Metro Fire rate 34.367%
Required contributions 26,964,675$ Metro Fire contributions made 20,133,800$ Employee contributions made 6,830,875$
S a c r a m e n t o M e t r o p o l i t a n F i r e D i s t r i c t 33 | P a g e 2 0 1 4 C o m p r e h e n s i v e A n n u a l F i n a n c i a l R e p o r t

NOTE 5 – RETIREMENT PLAN (Cont.)
Contribution rates and amounts for each plan are actuarially determined annually by the respective administrators. Required contributions were made each pay period, based on required contribution rates. Metro Fire makes the contributions on behalf of the plan participants. However, due to the changes made to the plan, the employees paid a portion of Metro Fire’s contribution. Contribution rates for the Safety Plan are individually determined for Metro Fire by PERS. Contribution rates for the Miscellaneous Plan are determined with reference to the risk pool to which it belongs. Additionally, PERS manages a Side Fund for the Miscellaneous Plan, that was created at the time Metro Fire joined the plan, to reflect the difference between the funded status of Metro Fire’s plan and the funded status of the risk pool. The Side Fund is invested and is being amortized to reduce the normal required contributions. Contribution rates and amounts for the SCERS Plan are determined annually by SCERS.
C. ANNUAL PENSION COST AND NET PENSION ASSET—PERS SAFETY PLAN
The annual pension cost and net pension asset for the year ended June 30, 2014 was as follows:
PERS Miscellaneous Plan:Plan participants 8.00%Metro Fire rate 15.866%
Required contributions 1,420,506$ Metro Fire contributions made 990,000$ Employee contributions made 430,506$
SCERS Plan (Safety Tier 1):Plan participants 14.52%Metro Fire rate 41.85%Required contributions 1,136,000$ Contributions made 1,136,000$
Annual Required Contribution (ARC) 26,964,675$ Less interest on pension asset (4,764,533) Plus amortization on pension asset 3,567,193 Annual pension cost 25,767,335 Contributions made 26,964,675 Increase in net pension asset 1,197,340 Net pension asset - beginning of year 63,527,112
Net pension asset - end of year 64,724,452$
34 | P a g e S a c r a m e n t o M e t r o p o l i t a n F i r e D i s t r i c t 2 0 1 4 C o m p r e h e n s i v e A n n u a l F i n a n c i a l R e p o r t

NOTE 5 – RETIREMENT PLAN (Cont.)
D. FUNDED STATUS AND FUNDING PROGRESS
As of June 30, 2012, the most recent actuarial valuation date, the Safety Plan was 78.3% funded. The actuarial liability for benefits was $854 million and the actuarial value of assets was $669 million, resulting in an unfunded actuarial accrued liability (UAAL) of $185 million. The covered payroll (annual payroll of active employees covered by the plan) was $60 million, and the ratio of the UAAL to the covered payroll was 307.1%. The schedule of funding progress, presented as Required Supplementary Information (RSI), provides multi-year trend information about whether the actuarial value of plan assets are increasing or decreasing over time relative to the actuarial accrued liability for benefits.
E. ACTUARIAL METHODS AND ASSUMPTIONS
In the June 30, 2012 actuarial valuation for the Safety Plan, the entry age normal cost method was used to determine the required contribution. The actuarial assumptions included (a) 7.5% investment rate of return (net of administrative expenses) (b) projected salary increases ranging from 3.30% to 14.20% depending on age, service and type of employment and (c) an inflation component of 2.75%, which is included in the salary increase assumptions. The actuarial value of assets was determined using techniques that spread the effects of short term volatility in the market value of investments over a 15-year period. The UAAL is being amortized as a level percentage of projected payroll on an open basis. The remaining rolling amortization period at June 30, 2012 was 28 years.
F. OTHER PENSION ASSETS
In addition to the Net Pension Asset of the Safety Plan, pension assets exist for the Miscellaneous Plan and SCERS Plan. Contributions to the plans and the net pension asset were as follows for the past three fiscal years:
Fiscal Year Ended
Annual Pension Cost (APC)
% of APC Contributed
Net Pension Asset
June 30, 2012 17,288,782$ 107% 62,302,926$ June 30, 2013 24,551,376$ 105% 63,527,112$ June 30, 2014 25,767,335$ 105% 64,724,452$
Three-year Trend Information for PERS Safety Plan
Fiscal Year Ending
Annual Pension Cost (APC)
% of APC Contributed
Net Pension Asset
June 30, 2012 1,361,271$ 100% 1,002,971$ June 30, 2013 997,174$ 100% 1,039,721$ June 30, 2014 990,000$ 100% 1,091,441$
Fiscal Year Ending
Annual Pension Cost (APC)
% of APC Contributed
Net Pension Asset
June 30, 2012 567,647$ 100% 9,406,325$ June 30, 2013 567,647$ 100% 9,912,904$ June 30, 2014 1,136,000$ 100% 10,395,520$
Three-year Trend Information for PERS Miscellaneous Plan
Three-year Trend Information for SCERS Plan
S a c r a m e n t o M e t r o p o l i t a n F i r e D i s t r i c t 35 | P a g e 2 0 1 4 C o m p r e h e n s i v e A n n u a l F i n a n c i a l R e p o r t

NOTE 6 – LONG-TERM LIABILITIES
The following is a summary of long-term obligation transactions for the fiscal year ended June 30, 2014:
The liability for compensated absences, worker’s compensation, and other postemployment benefits are fully liquidated by the general fund.
A. PENSION BONDS PAYABLE
In October 2004, Metro Fire issued pension obligation bonds in the original amount of $69,998,975. The proceeds were used to reduce the unfunded actuarial liabilities in three of its pension plans. The bonds were issued in three series and bear interest at rates of 4.79% to 5.51%. Two of the series require semi-annual payments of interest. The remaining series accretes interest, which results in increases to principal, until November 15, 2018. Principal repayments, which are made annually, began May 15, 2005 for one series, and begin May 15, 2020, 2026 and 2031 for the other three series, respectively. The interest rates for two of the series change to auction rate as of November 15, 2018 and 2025, respectively. The bonds mature at various dates from May 15, 2019 to 2034. In the following maturity schedule, an interest rate of 5% is assumed at the point in time where the rates change to auction rates. As of June 30, 2014, pension bonds payable maturities based on the fully accreted amounts were as follows:
Amounts Due Balance Balance within One
July 1, 2013 Additions Repayments June 30, 2014 Year
Pension bonds payable 68,375,545$ 1,056,465$ (1,860,000)$ 67,572,010$ 2,105,000$ Lease revenue bonds payable, net of unamortized premiums 11,981,300 - (762,921) 11,218,379 795,000 Capital leases 8,894,579 2,880,141 (1,343,968) 10,430,752 1,658,950 Compensated absences 17,121,166 4,842,705 (6,222,679) 15,741,192 5,075,000 Workers' compensation liability 24,610,000 2,813,128 (2,865,847) 24,557,281 4,395,753 OPEB Liability 51,396,091 13,299,404 (12,661,353) 52,034,142 7,265,148
182,378,681$ 24,891,843$ (25,716,768)$ 181,553,756$ 21,294,851$
Fiscal year endingJune 30, Principal Interest Total
2015 2,105,000$ 2,476,357$ 4,581,357$ 2016 2,365,000 2,375,527 4,740,527 2017 2,640,000 2,262,244 4,902,244 2018 2,940,000 2,135,788 5,075,788 2019 2,465,000 2,632,462 5,097,462
2020-2024 12,155,000 14,475,990 26,630,990 2025-2029 18,035,000 10,646,362 28,681,362 2030-2034 30,400,000 4,853,750 35,253,750
73,105,000$ 41,858,480$ 114,963,480$
36 | P a g e S a c r a m e n t o M e t r o p o l i t a n F i r e D i s t r i c t 2 0 1 4 C o m p r e h e n s i v e A n n u a l F i n a n c i a l R e p o r t

NOTE 6 – LONG-TERM LIABILITIES (Cont.)
B. LEASE REVENUE BONDS
On November 15, 2011, Metro Fire sold Lease Revenue Bonds with interest rates ranging from 3% to 5.125% and a face value of $12,960,000, of which $11,786,000 was available to replenish reserves for the headquarters building fund, building improvements, purchase of firefighting and computer equipment and to pay off the note payable of $74,509. The bonds were issued at a premium of $85,926. The debt service on the bonds is approximately $1,322,000 per year until May 15, 2016 and then drops to about $675,000 per year through 2041.
Standard & Poor’s Rating Agency rated the bonds at AA-. As of June 30, 2014, unspent bond proceeds amounted to $126,092 which will be drawn down as expenditures are incurred.
As of June 30, 2014, bonds payable maturities were as follows:
C. CAPITAL LEASES
Metro Fire previously leased equipment under capital leases which have yearly payments of $1,122,164 through September 27, 2020 and $340,008 through September 27, 2015, including interest at 2.88% and 2.17%, respectively. During the year, Metro Fire entered into three lease agreements as lessee for financing the acquisition of various computer and networking equipment as well as several apparatuses. The yearly payments were $351,589, $92,502, and $38,519 through June 9, 2021, February 1, 2018, and November 1, 2017, with interest rates of 1.88%, 5.90%, and 6.52%, respectively. Capital assets acquired under the capital leases consist of equipment with cost totaling $12,974,080 and accumulated depreciation of $2,061,455 at June 30, 2014. This lease agreement qualifies as a capital lease for accounting purposes and, therefore, has been recorded at the present value of future minimum lease payments as of the inception date.
Fiscal year endingJune 30, Principal Interest Total
2015 795,000$ 529,306$ 1,324,306$ 2016 830,000 497,506 1,327,506 2017 210,000 464,306 674,306 2018 215,000 455,906 670,906 2019 225,000 447,306 672,306
2020-2024 1,310,000 2,064,281 3,374,281 2025-2029 1,615,000 1,756,069 3,371,069 2030-2034 2,060,000 1,316,094 3,376,094 2035-2039 2,630,000 738,001 3,368,001 2040-2044 1,250,000 96,862 1,346,862
11,140,000$ 8,365,637$ 19,505,637$
S a c r a m e n t o M e t r o p o l i t a n F i r e D i s t r i c t 37 | P a g e 2 0 1 4 C o m p r e h e n s i v e A n n u a l F i n a n c i a l R e p o r t

NOTE 6 – LONG-TERM LIABILITIES (Cont.)
Future minimum lease payments under the capital lease obligation are as follows:
NOTE 7 – RISK MANAGEMENT
Metro Fire is exposed to various risks of loss related to torts, theft of, damage to and destruction of assets, errors and omission, injuries to employees, and natural disasters. Metro Fire is self-insured for all losses from workers compensation claims from 2003, when it terminated its excess liability insurance coverage until 2009. Beginning in 2010, Metro Fire obtained excess commercial coverage for the first $1,000,000 of losses in excess of $3,000,000, for each claim. Claims expenditures and liabilities are reported when it is probable that a loss has occurred and the amount of that loss can be reasonably estimated. The liability for claims is based on historical cost and/or actuarial estimates of the amounts needed to pay prior and current year claims, and to allow the accrual of estimated incurred but not reported claims and incremental claims expense. Changes in Metro Fire’s claims liability for the fiscal year ended June 30, 2014 and 2013 were as follows:
Fiscal year endingJune 30, Principal Interest Total
2015 1,658,950$ 285,833$ 1,944,783$ 2016 1,704,656 240,126 1,944,782 2017 1,411,764 193,010 1,604,774 2018 1,452,962 151,812 1,604,774 2019 1,364,495 109,258 1,473,753
2020-2024 2,837,925 109,583 2,947,508 10,430,752$ 1,089,622$ 11,520,374$
2014 2013Unpaid claims and claim adjustment expenses at beginning of fiscal year 24,610,000$ 23,085,975$
Incurred claims and claim adjustment expenses:Provision for insured events of current fiscal year 5,308,000 8,048,280 Decreases in provision for insured events of prior fiscal year (2,494,872) (4,076,328)
Total incurred claims and claim adjustment expenses 2,813,128 3,971,952
Payments:Claim and claim adjustment expenses attributable to insured events of the current fiscal year 457,534 673,114 Claim and claim adjustment expenses attributable to insured events of the current fiscal year 2,408,313 1,774,813
Total payments 2,865,847 2,447,927
Total unpaid claims and claim adjustment expenses 24,557,281$ 24,610,000$
38 | P a g e S a c r a m e n t o M e t r o p o l i t a n F i r e D i s t r i c t 2 0 1 4 C o m p r e h e n s i v e A n n u a l F i n a n c i a l R e p o r t

NOTE 7 – RISK MANAGEMENT (Cont.)
Metro Fire’s claims liability consists of the following:
Metro Fire is a member of the Special District Risk Management Authority (SDRMA). The SDRMA is a risk-pooling self-insurance authority, created under the provisions of the California Government Code Sections 6500 et. seq. Its purpose is to provide a full risk management program for California local governments. Metro Fire pays an annual premium to SDRMA for general and auto liability, errors and omissions, property, boiler and machinery and employee dishonesty insurance coverage. Metro Fire’s annual premium is based on its pro-rata share of charges for the pooled risk, claims adjusting and legal costs, and administrative and other costs to operate the SDRMA. Aviation insurance continues to be covered through a commercial insurer.
Metro Fire’s coverage and corresponding deductibles are as follows:
Metro Fire did not have any claim settlements in excess of the insurance coverage in any of the three prior fiscal years.
NOTE 8 – OTHER POST-EMPLOYMENT BENEFITS
A. PLAN DESCRIPTION
The Sacramento Metropolitan Fire District Retiree Healthcare Plan (“Plan”) is a single-employer defined benefit healthcare plan administered by Metro Fire. The Plan provides healthcare benefits to eligible retirees and their dependents through the California Public Employees’ Retirement System healthcare program (PEMHCA). Benefit provisions are established and may be amended through agreements and memorandums of understanding among Metro Fire, its non-represented employees, and the unions for represented Metro Fire employees. The Retiree Healthcare Plan does not issue financial statements.
2014 2013
Claims Reserve 15,790,440$ 18,092,823$ Incurred but not reported (IBNR) 8,332,681 6,088,427 Unallocated loss adjustment expenses (ULAE) 434,160 428,750
24,557,281$ 24,610,000$
Short-term liability 4,395,753$ 4,411,071$ Long-term liability 20,161,528 20,198,929
Total unpaid claims and claim adjustment expenses 24,557,281$ 24,610,000$
Coverage Amount Deductible
General liability 10,000,000$ 500$ Auto liability 10,000,000 3,000 Property damage 1,000,000,000 1,000 Boiler and machinery 100,000,000 1,000 to 250,000Errors and omissions 10,000,000 25,000 Employment practices liability 10,000,000 25,000 Employee dishonesty 400,000 - Aviation 10,000,000 1,000 - 30,000
S a c r a m e n t o M e t r o p o l i t a n F i r e D i s t r i c t 39 | P a g e 2 0 1 4 C o m p r e h e n s i v e A n n u a l F i n a n c i a l R e p o r t

NOTE 8 – OTHER POST-EMPLOYMENT BENEFITS (Cont.)
Metro Fire provides a retiree medical contribution for employees who retire directly from Metro Fire under CalPERS. Metro Fire’s contribution is capped at the greater of the non-Medicare eligible Blue Shield and Kaiser family premiums. The benefit continues to surviving spouses and dependents. Since PEMHCA is a community-rated plan, an implied subsidy is not valued under GASB 45. Metro Fire also provides subsidy/offset payments for certain retirees receiving benefits through the Sacramento County Employees Retirement System. The benefit continues at 50% for surviving spouses of retirees.
B. FUNDING POLICY
The contribution requirements of the Plan participants and Metro Fire are established by and may be amended pursuant to agreements with its non-represented employees and the union for represented Metro Fire employees. Retired plan members and their beneficiaries pay the annual premium cost not paid by the employer. On June 19, 2012, Metro Fire entered into an agreement to contribute to the California Employer’s Retiree Benefit Trust (CERBT) Fund. The CERBT Fund is managed by the California Public Employees' Retirement System (CalPERS) and provides Metro Fire with a trust through which it may prefund retiree medical costs and other post-employment benefits. In addition to Metro Fire contributions, employee healthcare cost-sharing as well as employee healthcare premium savings are also being contributed to the trust. On April 25, 2013 the Board of Directors approved a new agreement with union and unrepresented employees share the cost of medical premium cost. Both employees and retirees as of July 1, 2013 will contribute 8% towards their medical premium cost.
C. ANNUAL OPEB COST AND NET OPEB OBLIGATION
Metro Fire’s annual other post-employment benefit cost (expense) is calculated based on the annual required contribution (ARC) of the employer. The ARC represents a level of funding that, if paid on an ongoing basis, is projected to cover the normal cost each year and amortize any unfunded actuarial liabilities (or funding excess) over a period not to exceed 30 years. The following table shows the components of Metro Fire’s annual OPEB cost, the amount actually contributed to the Plan, and changes in Metro Fire’s Net OPEB obligation for the fiscal year ended June 30, 2014:
Annual OPEB Cost Annual Required Contribution 12,651,332$ Interest on net OPEB obligation 3,726,217
Adjustment to annual required contribution (3,078,145) 13,299,404
Contributions Made Payments on behalf of retirees (7,333,808) Contribution to OPEB trust (5,327,545)
(12,661,353)
Increase in net OPEB obligation 638,051 Net OPEB Obligation, beginning of year 51,396,091
Net OPEB Obligation, end of year 52,034,142$
40 | P a g e S a c r a m e n t o M e t r o p o l i t a n F i r e D i s t r i c t 2 0 1 4 C o m p r e h e n s i v e A n n u a l F i n a n c i a l R e p o r t

NOTE 8 – OTHER POST-EMPLOYMENT BENEFITS (Cont.)
Metro Fire’s annual OPEB cost, the percentage of annual OPEB cost contributed to the Plan, and the net OPEB obligation for fiscal year ended June 30, 2014 and the two preceding fiscal years were as follows:
D. FUNDED STATUS AND FUNDING PROGRESS
The funded status of the Plan as of July 1, 2013, the most recent valuation date, was as follows:
Actuarial valuations of an ongoing plan involve estimates of the value of expected benefit payments and assumptions about the probability of occurrence of events far into the future. Examples include assumptions about future employment, mortality, and the healthcare cost trend. Amounts determined regarding the funded status of the plan and the annual required contributions of the employer are subject to continual revision as actual results are compared with past expectations and new estimates are made about the future. The schedule of funding progress, presented as required supplementary information immediately following the notes to the financial statements, presents multi-year trend information about whether the actuarial value of plan assets is increasing or decreasing over time relative to the actuarial accrued liabilities for benefits.
E. ACTUARIAL METHODS AND ASSUMPTIONS
Projections of benefits for financial reporting purposes are based on the substantive plan (the plan as understood by the employer and the plan participants) and include the types of benefits provided at the time of each valuation and the historical pattern of sharing of benefit costs between the employer and plan participants to that point. The actuarial methods and assumptions used include techniques that are designed to reduce the effects of short-term volatility in actuarial accrued liabilities and the actuarial value of assets, consistent with the long-term perspective of the calculations. For the July 1, 2013 actuarial valuation, the entry age normal actuarial cost method and market value asset valuation method was used. The actuarial assumptions included a 7.25% investment rate of return (net of administrative expenses), 3.25% annual salary increase, and a general inflation rate of 3%. Premiums were assumed to increase from 8.5% in 2015 with an ultimate rate of 4.5% for 2023 and thereafter. The initial UAAL was amortized as a level percentage of projected payroll over a closed 30-year period. As of June 30, 2014, the remaining period was 28 years.
Percentage of NetFiscal Year Annual Annual OPEB OPEB
Ended OPEB Cost Cost Contributed Obligation
June 30, 2012 16,579,431$ 37.15% 47,561,450$ June 30, 2013 12,686,666$ 69.77% 51,396,091$ June 30, 2014 13,299,404$ 95.20% 52,034,142$
Actuarial accrued liability (AAL) $ 156,358,864 Actuarial value of Plan assets 2,099,846 Unfunded actuarial accrued liability (UAAL) $ 154,259,018
Funded ratio (actuarial value of Plan assets/AAL) 1.3%Covered payroll (active Plan participants) 50,863,948 UAAL as a percentage of covered payroll 303.3%
S a c r a m e n t o M e t r o p o l i t a n F i r e D i s t r i c t 41 | P a g e 2 0 1 4 C o m p r e h e n s i v e A n n u a l F i n a n c i a l R e p o r t

NOTE 9 – NET POSITION AND FUND BALANCES
The government-wide financial statements report net position. The following are the three categories:
Net investment in capital assets – This category groups all capital assets into one component of net position. Accumulated depreciation and the outstanding balances of debt, net of unspent proceeds, which are attributable to the acquisition, construction or improvement of these assets, reduce the balance in this category.
Restricted net position – This category presents external restrictions imposed by creditors, grantors, contributors, laws or regulations of other governments and restrictions imposed by law through constitutional provisions or enabling legislation.
Unrestricted net position – This category represents net position of Metro Fire not restricted for any project or other purpose.
In the fund financial statements, governmental funds report fund balances in the following categories:
Nonspendable Funds – Fund balance should be reported as nonspendable when the amounts cannot be spent because they are either not in spendable form, or are legally or contractually required to be maintained intact. Nonspendable balances are not expected to be converted to cash within the next operating cycle, which comprise inventory, pre-paid items and other assets.
Restricted Funds – Fund balance should be reported as restricted when constraints placed on the use of resources are either externally imposed by creditors, grantors, contributors, or laws or regulations of other governments, or imposed by law through constitutional provisions or enabling legislation.
Restricted for capital acquisitions – represents developer and impact fees to mitigate the impact of providing additional fire stations and fire equipment. It also includes unspent bond proceeds.
Debt service – represents the amount held by bond trustees and the County of Sacramento for payment of bonds.
Workers compensation checking account – represents the amount maintained in the checking account for the payment of workers compensation claims.
Deferred compensation – represents amounts restricted for the costs of administering the deferred compensation program.
Grants - represents amounts restricted for purposes enumerated in the grant agreements.
Committed Funds – Fund balance should be reported as committed when the amounts can only be used for specific purposes pursuant to constraints imposed by formal action (i.e. resolution) of Metro Fire’s highest level of decision-making authority, the Board of Directors. These amounts cannot be used for any other purpose unless the Board Directors modifies or removes the fund balance commitment through another resolution.
Workers compensation claims – represents the amount recommended for contingency reserves in the actuarial reports.
Pension bond retirement – to set aside amounts for the retirement of the pension bonds prior to their repricing at auction rates in 2018 and 2025.
42 | P a g e S a c r a m e n t o M e t r o p o l i t a n F i r e D i s t r i c t 2 0 1 4 C o m p r e h e n s i v e A n n u a l F i n a n c i a l R e p o r t

NOTE 9 – NET POSITION AND FUND BALANCES (Cont.) Assigned Funds – Fund balance should be reported as assigned when the amounts are constrained by the government’s intent to be used for specific purposes, but are neither restricted nor committed. Intent is expressed by the Board of Directors or the Fire Chief and may be changed at their discretion.
Unassigned Funds – Unassigned fund balance is the residual classification of Metro Fire’s funds and includes all spendable amounts that have not been restricted, committed, or assigned to specific purposes.
Although the Board has established a contingency reserve for unanticipated or extraordinary expenditures equal to a minimum of 1.8 months of the General Fund Operating Expenditures, this reserve does not meet the definition of a committed fund balance. An individual government fund could include nonspendable resources and amounts that are restricted or unrestricted (committed, assigned, or unassigned) or any combination of those classifications. Restricted or unrestricted amounts are to be considered spent when an expenditure is incurred for purposes for which both restricted or unrestricted fund balance is available. Committed, assigned, then unassigned amounts are considered to have been spent when an expenditure is incurred for purposes for which amounts in any of those unrestricted fund balance classifications can be used.
The following are components of fund balances as of June 30, 2014:
General Grant CapitalFund Funds Facilities Total
Nonspendable:Inventory 3,052,805$ -$ -$ 3,052,805$ Prepaid expenses 7,728 - - 7,728 Petty cash 500 - - 500
Total nonspendable fund balance 3,061,033 - - 3,061,033
Restricted for:Capital acquisition - 444,170 444,170
- 929,708 929,708 Workers compensation claims 91,057 - - 91,057 Deferred compensation 21,643 - - 21,643 Grant-approved expenditures - 989,320 - 989,320
Total restricted fund balance 112,700 989,320 1,373,878 2,475,898
Committed to: Workers compensation claims 4,000,000 - - 4,000,000 Pension bond retirement 15,129,064 - - 15,129,064
Total committed fund balance 19,129,064 - - 19,129,064
Unassigned 13,084,121 - - 13,084,121
Total fund balance 35,386,918$ 989,320$ 1,373,878$ 37,750,116$
Debt service reserves
S a c r a m e n t o M e t r o p o l i t a n F i r e D i s t r i c t 43 | P a g e 2 0 1 4 C o m p r e h e n s i v e A n n u a l F i n a n c i a l R e p o r t

NOTE 9 – NET POSITION AND FUND BALANCES (Cont.)
The following are components of restricted net position as of June 30, 2014:
NOTE 10 – COMMITMENTS AND CONTINGENCIES
A. COMMITMENTS
Metro Fire has several construction contracts relating to its Headquarters and the Zinfandel Training Facility. As of June 30, 2014, Metro Fire had total construction commitments of $692,720.
B. CONTINGENCIES
Metro Fire is a defendant in a number of lawsuits, which have arisen in the normal course of business. While substantial damages are alleged in some of these actions, their outcome cannot be predicted with certainty. In the opinion of Management and legal counsel, these actions, when finally adjudicated will not have a material adverse effect on the financial position of Metro Fire. Metro Fire participates in a number of federal grant programs subject to financial and compliance audits by the grantors or their representatives. Audits of certain grant programs, including those for the year ended June 30, 2014, have yet to be conducted. The amount, if any, of expenditures that may be disallowed by the granting agencies cannot be determined at this time. Management believes that such disallowances, if any, would not have a material effect on the financial statements.
NOTE 11 – BORROWINGS
Metro Fire has borrowings available from the County of Sacramento equal to 85% of estimated tax revenues for July 1 to December 10 and 42.50% of estimated revenues for December 10 to April 10. These borrowings are permitted until the last Monday of April each year. The amount available as of June 30, 2014 is $47,698,154. The interest rate charged is the rate earned by the County investment pool.
NOTE 12 – SUBSEQUENT EVENTS
On October 14, 2014, Metro Fire secured a lease for the purchase of additional computer and networking equipment as part of its plan to upgrade its technology infrastructure. The lease was funded for $849,000 and will be repaid with approximately 1.6% interest. There are 5 annual payments of $177,898 with the final payment due in October 2018. The funds are being held in a trust account with Bank of America and will be disbursed directly to vendors as items are purchased throughout the fiscal year.
Capital acquisition 488,656$ Debt service reserve 929,708 Workers compensation claims 91,057 Deferred compensation 21,643 Grant-approved expenditures 991,689 Total restricted net position 2,522,753$
44 | P a g e S a c r a m e n t o M e t r o p o l i t a n F i r e D i s t r i c t 2 0 1 4 C o m p r e h e n s i v e A n n u a l F i n a n c i a l R e p o r t
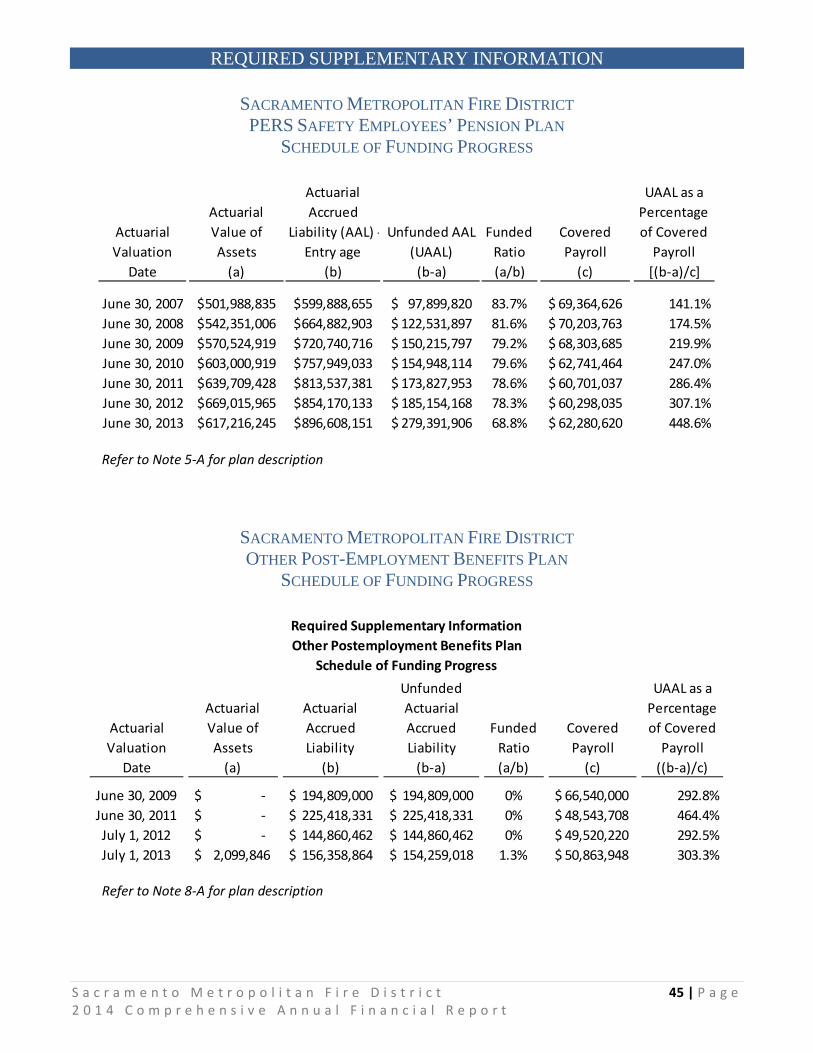
REQUIRED SUPPLEMENTARY INFORMATION
SACRAMENTO METROPOLITAN FIRE DISTRICT PERS SAFETY EMPLOYEES’ PENSION PLAN
SCHEDULE OF FUNDING PROGRESS
Refer to Note 5-A for plan description
SACRAMENTO METROPOLITAN FIRE DISTRICT OTHER POST-EMPLOYMENT BENEFITS PLAN
SCHEDULE OF FUNDING PROGRESS
Refer to Note 8-A for plan description
Actuarial Valuation
Actuarial Value of Assets
Actuarial Accrued
Liability (AAL) - Entry age
Unfunded AAL (UAAL)
Funded Ratio
Covered Payroll
UAAL as a Percentage of Covered
PayrollDate (a) (b) (b-a) (a/b) (c) [(b-a)/c]
June 30, 2007 501,988,835$ 599,888,655$ 97,899,820$ 83.7% 69,364,626$ 141.1%June 30, 2008 542,351,006$ 664,882,903$ 122,531,897$ 81.6% 70,203,763$ 174.5%June 30, 2009 570,524,919$ 720,740,716$ 150,215,797$ 79.2% 68,303,685$ 219.9%June 30, 2010 603,000,919$ 757,949,033$ 154,948,114$ 79.6% 62,741,464$ 247.0%June 30, 2011 639,709,428$ 813,537,381$ 173,827,953$ 78.6% 60,701,037$ 286.4%June 30, 2012 669,015,965$ 854,170,133$ 185,154,168$ 78.3% 60,298,035$ 307.1%June 30, 2013 617,216,245$ 896,608,151$ 279,391,906$ 68.8% 62,280,620$ 448.6%
Actuarial Value of Assets
Actuarial Accrued Liability
Unfunded Actuarial Accrued Liability
Funded Ratio
Covered Payroll
UAAL as a Percentage of Covered
Payroll(a) (b) (b-a) (a/b) (c) ((b-a)/c)
June 30, 2009 $ - $ 194,809,000 $ 194,809,000 0% $ 66,540,000 292.8%June 30, 2011 $ - $ 225,418,331 $ 225,418,331 0% $ 48,543,708 464.4%July 1, 2012 $ - $ 144,860,462 $ 144,860,462 0% $ 49,520,220 292.5%July 1, 2013 $ 2,099,846 $ 156,358,864 $ 154,259,018 1.3% $ 50,863,948 303.3%
Required Supplementary InformationOther Postemployment Benefits Plan
Schedule of Funding Progress
Actuarial Valuation
Date
S a c r a m e n t o M e t r o p o l i t a n F i r e D i s t r i c t 45 | P a g e 2 0 1 4 C o m p r e h e n s i v e A n n u a l F i n a n c i a l R e p o r t

This page intentionally left blank
46 | P a g e S a c r a m e n t o M e t r o p o l i t a n F i r e D i s t r i c t 2 0 1 4 C o m p r e h e n s i v e A n n u a l F i n a n c i a l R e p o r t

tatis
tical

STATISTICAL SECTION
This part of Metro Fire’s comprehensive annual financial report presents detailed information as a context for understanding what the information in the financial statements, note disclosures, and required supplementary information says about Metro Fire’s overall financial health.
Contents Pages
FINANCIAL TRENDS 48-52 These schedules contain trend information to help the reader understand how Metro Fire’s financial performance and well-being have changed over time.
1. Net Position by Component 2. Changes in Net Position 3. Fund Balances of Governmental Funds 4. Changes in Fund Balances of Governmental Funds 5. Expenditures by Function
REVENUE CAPACITY 53-58 These schedules contain information to help the reader assess Metro Fire’s most significant local revenue source, the property tax.
1. General Revenues by Source 2. Assessed Value of Taxable Property 3. Assessed and Estimated Actual Value of Taxable Property 4. Property Tax Levies and Collections 5. Direct and Overlapping Property Tax Rates 6. Principal Property Taxpayers
DEBT CAPACITY 59-62 These schedules present information to help the reader assess the affordability of Metro Fire’s current level of outstanding debt and its ability to issue additional debt in the future.
1. Ratio of Outstanding Debt by Type 2. Ratio of General Bonded Debt Outstanding 3. Computation of District and Overlapping Debt 4. Computation of Legal Bonded Debt Margin
DEMOGRAPHIC AND ECONOMIC INFORMATION 63-65 These schedules present information to help the reader understand the environment within which Metro Fire’s financial activities take place.
1. Demographic Statistics 2. Demographic and Economic Statistics 3. Private Sector Principal Employers
OPERATING INFORMATION 66-72 These schedules contain service and infrastructure data to help the reader understand how the information in Metro Fire’s financial report relates to the services it provides and the activities it performs.
1. Summary of District Activities 2. Total Responses 3. Emergency Response Detail Analysis 4. Emergency Response – Percent of Total Response by Type 5. Service-connected Injury/Illness Report 6. Staffing Summary
S a c r a m e n t o M e t r o p o l i t a n F i r e D i s t r i c t 47 | P a g e 2 0 1 4 C o m p r e h e n s i v e A n n u a l F i n a n c i a l R e p o r t

SACRAMENTO METROPOLITAN FIRE DISTRICT NET POSITION BY COMPONENT
LAST TEN FISCAL YEARS (ACCRUAL BASIS OF ACCOUNTING)
(IN THOUSANDS)
2005 2006 2007 2008 2009 2010 2011 2012 2013 2014Governmental Activities Net Investment in
capital assets $40,625 $54,419 $63,087 $76,706 $77,964 $74,713 $80,148 $69,132 $71,966 $71,375Restricted 662 13,070 11,762 7,969 7,061 7,609 2,901 9,507 5,698 2,523Unrestricted 15,348 7,560 10,492 8,981 (4,740) (18,476) (40,160) (49,310) (45,775) (42,691)
Total net position $56,635 $75,050 $85,341 $93,656 $80,285 $63,846 $42,890 $29,328 $31,889 $31,207
48 | P a g e S a c r a m e n t o M e t r o p o l i t a n F i r e D i s t r i c t 2 0 1 4 C o m p r e h e n s i v e A n n u a l F i n a n c i a l R e p o r t

SACRAMENTO METROPOLITAN FIRE DISTRICT CHANGES IN NET POSITION LAST TEN FISCAL YEARS
(ACCRUAL BASIS OF ACCOUNTING)
(IN THOUSANDS)
2005 2006 2007 2008 2009 2010 2011 2012 2013 2014EXPENSESGovernmental Activities:
Public Protection $ 120,060 $ 121,399 $ 137,712 $ 145,930 $ 164,474 $ 152,208 $ 154,796 $ 154,206 $ 147,677 $ 157,119
Interest on Long-Term Debt 2,542 5,304 3,787 6,593 4,305 3,872 4,139 4,580 4,484 4,412
Depreciation 2,710 3,144 3,469 3,968 3,841 3,864 3,507 4,461 4,612
Total Government Activities 122,602 129,412 144,642 155,993 172,747 159,920 162,799 162,293 156,622 166,143
PROGRAM REVENUESGovernmental Activities:
Charges for Services 18,068 19,423 18,533 19,992 19,552 19,066 20,356 30,149 39,473 47,286
Operating Grants and Contributions 3,767 3,676 3,939 4,174 4,288 5,170 5,469 4,007 920
Capital Grants and Contributions 986 923 83 1,909 3,465 1,380
Donated equipment 475
Total Program Revenues 18,068 24,176 22,209 23,931 24,648 23,436 27,435 35,618 47,420 49,586
NET (EXPENSES)/REVENUE
Total Program Expenses (104,534) (105,236) (122,433) (132,062) (148,099) (136,484) (135,364) (126,675) (109,202) (116,557)
Total Net Expense (104,534) (105,236) (122,433) (132,062) (148,099) (136,484) (135,364) (126,675) (109,202) (116,557)
GENERAL REVENUESGovernmental Activities:
Property Taxes 101,649 115,512 126,032 129,962 126,816 114,845 111,182 108,310 105,260 111,089
Intergovernmental 3,834 4,086 4,218 5,570 5,954 4,171 3,366 3,972 5,545 2,698
Rent and others 1,204 3,746 2,233 4,595 1,157 327 101 718 1,012 985
Miscellaneous 831 340 271 321 461 197 (109) 158 394 1,103
Gain (loss) on disposal of assets (33) (30) (71) 340 506 (132) (46) (448)
Total General Revenues 107,519 123,651 132,724 140,376 134,728 120,045 114,408 113,114 111,763 115,874
CHANGE IN NET POSITION
Governmental Activities 2,985 18,415 10,291 8,315 (13,371) (16,439) (20,956) (13,561) 2,560 (682)
Net Position Beginning Fund Balance, as restated 53,650 56,635 75,050 85,341 93,656 80,285 63,846 42,890 29,328 31,889Net Position Ending Fund Balance $ 56,635 $ 75,050 $ 85,341 $ 93,656 $ 80,285 $ 63,846 $ 42,890 $ 29,328 $ 31,889 $ 31,207
S a c r a m e n t o M e t r o p o l i t a n F i r e D i s t r i c t 49 | P a g e 2 0 1 4 C o m p r e h e n s i v e A n n u a l F i n a n c i a l R e p o r t

SACRAMENTO METROPOLITAN FIRE DISTRICT FUND BALANCES OF GOVERNMENTAL FUNDS
LAST TEN FISCAL YEARS (MODIFIED ACCRUAL BASIS OF ACCOUNTING)
(IN THOUSANDS)
(a) In fiscal year 2010-2011, Metro Fire adopted GASB 54. (b) Metro Fire did not start segregating special revenue funds in the fund financial statements until 2012 so 2011 and prior amounts for
the General Fund include these other funds
2005 2006 2007 2008 2009 2010 2011 2012 2013 2014GENERAL FUND
Reserved $ 406 $ 16,682 $ 15,737 $ 11,426 $ 9,513 $ 9,980Unreserved 38,070 28,397 28,385 24,218 32,259 31,620Nonspendable $ 2,866 $ 2,836 $ 2,710 $ 3,061Restricted 2,901 1,726 468 113Committed 13,622 17,050 15,882 19,129Unassigned 7,470 11,207 15,161 13,084
Total General Fund $ 38,476 $ 45,080 $ 44,121 $ 35,644 $ 41,772 $ 41,600 $ 26,858 $ 32,819 $ 34,220 $ 35,387
Nonspendable $ 3 $ 671Restricted 7,781 3,920 $ 2,363CommittedUnassigned (22) (225)
Total all other Governmental funds $ 7,761 $ 4,366 $ 2,363
ALL OTHER GOVERNMENTAL FUNDS
50 | P a g e S a c r a m e n t o M e t r o p o l i t a n F i r e D i s t r i c t 2 0 1 4 C o m p r e h e n s i v e A n n u a l F i n a n c i a l R e p o r t

SACRAMENTO METROPOLITAN FIRE DISTRICT CHANGES IN FUND BALANCES OF GOVERNMENTAL FUNDS
LAST TEN FISCAL YEARS (MODIFIED ACCRUAL BASIS OF ACCOUNTING)
(IN THOUSANDS)
2005 2006 2007 2008 2009 2010 2011 2012 2013 2014REVENUESProperty Taxes $ 101,649 $ 112,417 $ 124,200 $ 128,817 $ 128,170 $ 116,509 $ 112,080 $ 108,149 $ 105,058 $ 112,297Intergovernmental revenues 3,834 8,678 7,297 8,040 11,083 7,503 12,730 9,019 10,562 10,415Charges for services 16,746 14,867 15,960 17,321 18,104 18,464 18,521 28,646 36,711 44,208Development Fees 4,051 2,961 2,156 1,369 893 671 1,153 1,326 1,092Use of money and property 1,204 3,746 2,233 4,595 1,157 327 101 522 1,015 1,019Miscellaneous 846 358 281 335 481 454 159 452 401 234
Total Revenues 124,280 144,118 152,931 161,264 160,363 144,150 144,262 147,940 155,072 169,265
EXPENDITURESCurrent:
Public Safety 182,163 122,042 138,457 145,857 146,191 140,182 145,363 137,989 143,613 159,725Capital Outlay 3,682 16,408 11,841 17,375 3,352 740 20,790 2,735 5,665 5,912Debt Service:
Principal repayment 816 40,423 563 45,714 874 1,045 1,236 2,965 3,556 3,964Interest and fiscal charges 2,414 4,583 3,028 5,795 3,465 2,988 2,974 3,587 3,516 3,380
Total Expenditures 189,075 183,456 153,890 214,741 153,883 144,954 170,362 147,276 156,349 172,982
Excess (deficiency) of revenues
over (under) expenditures (64,795) (39,338) (958) (53,477) 6,480 (804) (26,100) 664 (1,277) (3,716)
OTHER FINANCING SOURCES (USES)Transfers in 86 504Transfers out (86) (504)Proceeds from debt 69,999 40,000 45,000 13,046Proceeds from sale of assets 512 631 133 13 46Leased proceeds 11,226 2,880Total other financing
sources (uses) 69,999 40,000 45,000 512 631 11,359 13,059 46 2,880
Net Change in fund balances $ 5,204 $ 662 $ (958) $ (8,477) $ 6,992 $ (173) $ (14,741) $ 13,722 $ (1,230) $ (836)
Debt service as a percentage of noncapital expenditures 1.8% 36.9% 2.6% 35.3% 3.0% 2.9% 2.9% 4.7% 4.9% 4.6%
S a c r a m e n t o M e t r o p o l i t a n F i r e D i s t r i c t 51 | P a g e 2 0 1 4 C o m p r e h e n s i v e A n n u a l F i n a n c i a l R e p o r t

SACRAMENTO METROPOLITAN FIRE DISTRICT EXPENDITURES BY FUNCTION
LAST TEN FISCAL YEARS (MODIFIED ACCRUAL BASIS OF ACCOUNTING)
Note: In FY 2004-05, Metro Fire issued pension obligation bonds amounting to $69,998,975 which were used to prepay the unfunded actuarial liabilities in its pension plans.
Source: Sacramento Metropolitan Fire District Financial Statements and Records
Fiscal YearSalaries & Benefits
Services & Supplies
Capital Outlay / Debt Service Total
2005 170,493,386$ 11,669,224$ 6,912,143$ 189,074,753$ 2006 106,325,824 15,716,394 61,413,469 183,455,687 2007 121,963,586 16,493,870 15,432,171 153,889,627 2008 129,976,903 15,879,944 68,884,063 214,740,910 2009 132,604,682 13,586,427 7,691,800 153,882,909 2010 128,045,471 12,136,337 4,772,250 144,954,058 2011 129,650,797 15,711,906 24,999,569 170,362,272 2012 120,307,666 17,681,749 9,286,859 147,276,274 2013 124,975,145 18,637,441 12,736,479 156,349,065 2014 137,655,149 22,070,292 13,256,316 172,981,757
52 | P a g e S a c r a m e n t o M e t r o p o l i t a n F i r e D i s t r i c t 2 0 1 4 C o m p r e h e n s i v e A n n u a l F i n a n c i a l R e p o r t

SACRAMENTO METROPOLITAN FIRE DISTRICT GENERAL REVENUES BY SOURCE
ALL GOVERNMENTAL FUND TYPES LAST TEN FISCAL YEARS
(MODIFIED ACCRUAL BASIS OF ACCOUNTING)
Source: Sacramento Metropolitan Fire District Financial Statements and Records
Fiscal YearProperty
TaxesCharges for
ServicesDevelopment
Fees
Revenue From Other
AgenciesOther
Revenues Total2005 101,649,254$ 16,746,475$ -$ 3,834,072$ 2,050,310$ 124,280,111$ 2006 112,417,254 14,867,458 4,051,246 8,678,031 4,103,514 144,117,503 2007 124,199,920 15,959,841 2,960,561 7,296,914 2,514,122 152,931,358 2008 128,816,821 17,321,455 2,155,674 8,039,820 4,930,112 161,263,882 2009 128,169,834 18,103,703 1,368,581 11,083,485 1,637,805 160,363,408 2010 116,508,904 18,464,189 893,121 7,503,415 780,699 144,150,328 2011 112,080,077 18,521,065 670,997 12,730,378 259,364 144,261,881 2012 108,148,609 28,645,724 1,152,633 9,019,099 973,898 147,939,963 2013 105,058,038 36,710,780 1,326,406 10,561,785 1,415,487 155,072,496 2014 112,297,471 44,207,768 1,092,120 10,415,420 1,252,528 169,265,307
S a c r a m e n t o M e t r o p o l i t a n F i r e D i s t r i c t 53 | P a g e 2 0 1 4 C o m p r e h e n s i v e A n n u a l F i n a n c i a l R e p o r t

SACRAMENTO METROPOLITAN FIRE DISTRICT ASSESSED VALUE OF TAXABLE PROPERTY
LAST TEN FISCAL YEARS
Source: Sacramento County Assessor Tax Rolls
Fiscal Year Local Secured Unsecured UtilityTotal Assessed
Value2005 39,913,809,682$ 1,511,238,261$ 5,006,669$ 41,430,054,612$ 2006 44,822,756,665 1,599,062,259 4,810,612 46,426,629,536 2007 50,743,413,073 1,873,754,209 4,306,679 52,621,473,961 2008 54,733,895,432 2,109,204,925 2,804,597 56,845,904,954 2009 55,285,269,256 2,337,740,343 2,935,847 57,625,945,446 2010 51,286,454,165 2,222,237,544 2,935,847 53,511,627,556 2011 50,609,340,722 2,004,513,815 27,666,847 52,641,521,384 2012 48,712,749,798 1,901,522,231 10,268,185 50,624,540,214 2013 47,566,618,901 1,966,760,711 12,397,271 49,545,776,883 2014 49,477,107,848 1,929,129,291 12,293,600 51,418,530,739
54 | P a g e S a c r a m e n t o M e t r o p o l i t a n F i r e D i s t r i c t 2 0 1 4 C o m p r e h e n s i v e A n n u a l F i n a n c i a l R e p o r t
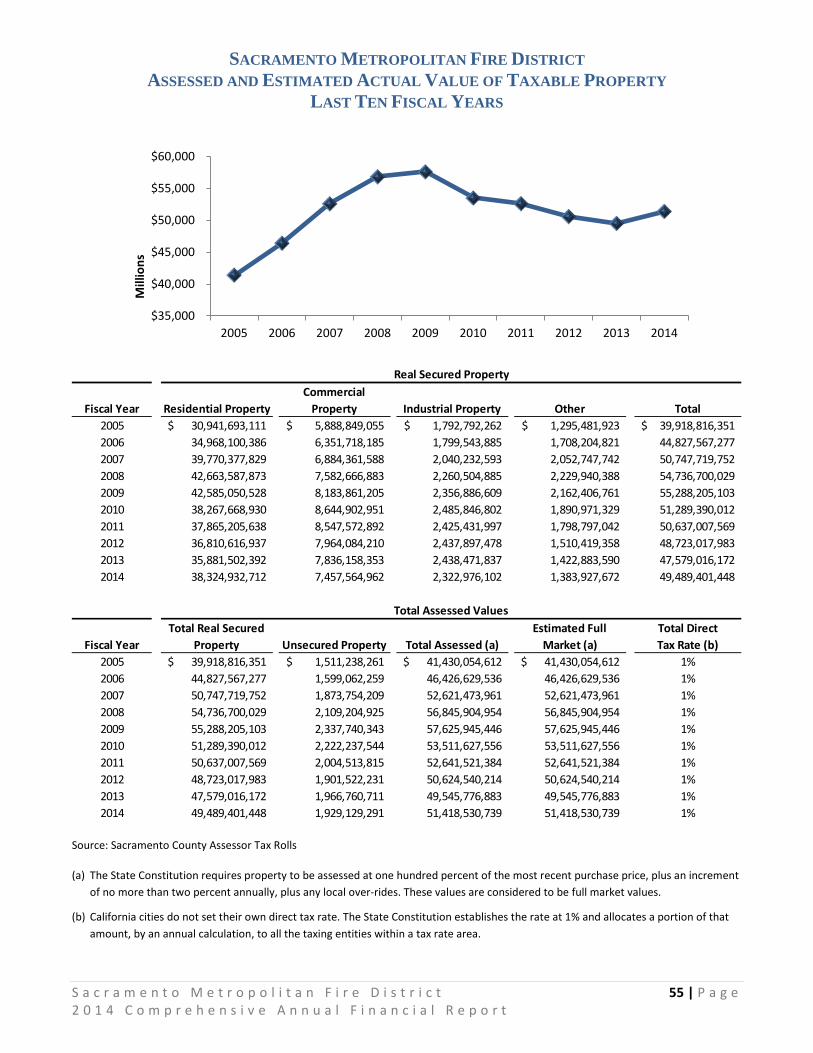
SACRAMENTO METROPOLITAN FIRE DISTRICT ASSESSED AND ESTIMATED ACTUAL VALUE OF TAXABLE PROPERTY
LAST TEN FISCAL YEARS
Source: Sacramento County Assessor Tax Rolls
(a) The State Constitution requires property to be assessed at one hundred percent of the most recent purchase price, plus an increment of no more than two percent annually, plus any local over-rides. These values are considered to be full market values.
(b) California cities do not set their own direct tax rate. The State Constitution establishes the rate at 1% and allocates a portion of that amount, by an annual calculation, to all the taxing entities within a tax rate area.
$35,000
$40,000
$45,000
$50,000
$55,000
$60,000
2005 2006 2007 2008 2009 2010 2011 2012 2013 2014
Mill
ions
Fiscal Year Residential PropertyCommercial
Property Industrial Property Other Total2005 30,941,693,111$ 5,888,849,055$ 1,792,792,262$ 1,295,481,923$ 39,918,816,351$ 2006 34,968,100,386 6,351,718,185 1,799,543,885 1,708,204,821 44,827,567,277 2007 39,770,377,829 6,884,361,588 2,040,232,593 2,052,747,742 50,747,719,752 2008 42,663,587,873 7,582,666,883 2,260,504,885 2,229,940,388 54,736,700,029 2009 42,585,050,528 8,183,861,205 2,356,886,609 2,162,406,761 55,288,205,103 2010 38,267,668,930 8,644,902,951 2,485,846,802 1,890,971,329 51,289,390,012 2011 37,865,205,638 8,547,572,892 2,425,431,997 1,798,797,042 50,637,007,569 2012 36,810,616,937 7,964,084,210 2,437,897,478 1,510,419,358 48,723,017,983 2013 35,881,502,392 7,836,158,353 2,438,471,837 1,422,883,590 47,579,016,172 2014 38,324,932,712 7,457,564,962 2,322,976,102 1,383,927,672 49,489,401,448
Fiscal YearTotal Real Secured
Property Unsecured Property Total Assessed (a)Estimated Full
Market (a)Total Direct Tax Rate (b)
2005 39,918,816,351$ 1,511,238,261$ 41,430,054,612$ 41,430,054,612$ 1%2006 44,827,567,277 1,599,062,259 46,426,629,536 46,426,629,536 1%2007 50,747,719,752 1,873,754,209 52,621,473,961 52,621,473,961 1%2008 54,736,700,029 2,109,204,925 56,845,904,954 56,845,904,954 1%2009 55,288,205,103 2,337,740,343 57,625,945,446 57,625,945,446 1%2010 51,289,390,012 2,222,237,544 53,511,627,556 53,511,627,556 1%2011 50,637,007,569 2,004,513,815 52,641,521,384 52,641,521,384 1%2012 48,723,017,983 1,901,522,231 50,624,540,214 50,624,540,214 1%2013 47,579,016,172 1,966,760,711 49,545,776,883 49,545,776,883 1%2014 49,489,401,448 1,929,129,291 51,418,530,739 51,418,530,739 1%
Total Assessed Values
Real Secured Property
S a c r a m e n t o M e t r o p o l i t a n F i r e D i s t r i c t 55 | P a g e 2 0 1 4 C o m p r e h e n s i v e A n n u a l F i n a n c i a l R e p o r t

SACRAMENTO METROPOLITAN FIRE DISTRICT PROPERTY TAX LEVIES AND COLLECTIONS
LAST TEN FISCAL YEARS
(a) Metro Fire participates in a Teeter Plan wherein it receives three distributions equal to the actual amount of property
taxes collected. Any delinquencies at June 30 are purchased by the County and remitted to Metro Fire. As part of the Plan, the County retains the penalties and interest on the delinquent taxes.
Source: Sacramento Metropolitan Fire District Financial Records
$80
$90
$100
$110
$120
$130
$140
Mill
ions
Property Taxes
$30
$35
$40
$45
$50
$55
$60
Billi
ons
Value of Property
Fiscal Year Property TaxesCurrent
Collections
Percentage of Levy
Collected(a)
Value of Property Subject to Local
Tax Rate2005 101,649,254$ 101,649,254$ 100% 41,430,054,612$ 2006 112,417,254 112,417,254 100% 46,426,629,536 2007 124,199,920 124,199,920 100% 52,621,473,961 2008 128,816,821 128,816,821 100% 56,845,904,954 2009 128,169,834 128,169,834 100% 57,625,945,446 2010 116,508,904 116,508,904 100% 53,511,627,556 2011 112,080,077 112,080,077 100% 52,641,521,384 2012 108,148,609 108,148,609 100% 50,624,540,214 2013 105,058,038 105,058,038 100% 49,545,776,883 2014 112,297,471 112,297,471 100% 51,418,530,739
56 | P a g e S a c r a m e n t o M e t r o p o l i t a n F i r e D i s t r i c t 2 0 1 4 C o m p r e h e n s i v e A n n u a l F i n a n c i a l R e p o r t

SACRAMENTO METROPOLITAN FIRE DISTRICT
DIRECT AND OVERLAPPING PROPERTY TAX RATES LAST FIVE FISCAL YEARS
Note: In 1978, California voters passed Proposition 13 which set the property tax rate at a 1.00% fixed amount. This 1.00% is shared by all taxing agencies for which the subject property resides within. In addition to the 1.00% fixed amount, property owners are charged taxes as a percentage of assessed property values for the payment of any voter approved bonds. Overlapping rates are those of local and county governments that apply to property owners within Metro Fire. Not all overlapping rates apply to all Metro Fire property owners. Information for fiscal years prior to 2010 is not available.
Source: California Municipal Statistics, Inc.
Fiscal YearBasic County
Wide Levy
Los Rios Community
College DistrictSan Juan Unified
School District Total
2010 1.0000 0.0124 0.0688 1.08122011 1.0000 0.0090 0.0813 1.09032012 1.0000 0.0192 0.0948 1.11402013 1.0000 0.0193 0.1003 1.11962014 1.0000 0.0181 0.1630 1.1811
S a c r a m e n t o M e t r o p o l i t a n F i r e D i s t r i c t 57 | P a g e 2 0 1 4 C o m p r e h e n s i v e A n n u a l F i n a n c i a l R e p o r t

SACRAMENTO METROPOLITAN FIRE DISTRICT PRINCIPAL PROPERTY TAXPAYERS
CURRENT YEAR AND NINE YEARS AGO
Source: Sacramento County Assessor 2004/05 and 2013/14 Tax Rolls
TaxpayerTaxable Assessed
Value Rank
Percentage of Total
Assessed Value
Taxable Assessed Value Rank
Percentage of Total
Assessed Value
Easton Development Company LLC 192,829,568$ 1 0.38%Wal Mart Stores, Inc. 155,151,746 2 0.30%Mp Holdings LLC 153,015,396 3 0.30% 97,435,548$ 3 0.24%Ampac Fine Chemicals LLC 152,694,319 4 0.30%California American Water Company 123,638,553 5 0.24% 67,325,283 8 0.16%Xojet Inc. 118,371,545 6 0.23%Comcast Cable 98,010,193 7 0.19% 76,342,499 5 0.18%Thr California LP 95,615,782 8 0.19%Steadfast Sunrise LLC 84,271,231 9 0.16%Franklin Resources Inc. 81,071,456 10 0.16%Aerojet General Corporation 278,774,477 1 0.67%A Teichert And Son Inc. 109,960,913 2 0.27%Intel Corporation 83,967,694 4 0.20%Prospect Green Partners 73,855,934 6 0.18%Altair Holding Company 70,058,905 7 0.17%Gmac Model Home Finance Inc. 65,678,489 9 0.16%Costco Wholesale Corporation 63,239,186 10 0.15%
1,254,669,789$ 2.44% 986,638,928$ 2.38%
Total Net Assessed Valuation: Fiscal Year 2013-14 51,418,530,739$ Fiscal Year 2004-05 41,430,054,612
2013-2014 2004-2005
58 | P a g e S a c r a m e n t o M e t r o p o l i t a n F i r e D i s t r i c t 2 0 1 4 C o m p r e h e n s i v e A n n u a l F i n a n c i a l R e p o r t

SACRAMENTO METROPOLITAN FIRE DISTRICT RATIO OF OUTSTANDING DEBT BY TYPE
LAST TEN FISCAL YEARS
(a) Debt amounts exclude any premiums or discounts. (b) See page 64 (Demographic Statistics) for population data.
Sources: Sacramento Metropolitan Fire District Financial Records and the State of California, Department of Finance.
Fiscal Year
General Obligation
Bonds (a)Capital Leases
Notes Payable
Total Primary Government
Percentage of Personal Income (b)
Debt per Capita (b)
2005 69,188,975$ 129,101$ 69,318,076$ 0.29% 99$ 2006 69,830,950 121,376 69,952,326 0.28% 99 2007 69,997,855 113,220 70,111,075 0.27% 100 2008 70,055,305 104,496 70,159,801 0.25% 99 2009 69,995,000 95,000 70,090,000 0.26% 98 2010 69,810,000 85,000 69,895,000 0.26% 98 2011 69,483,000 11,226,000$ 75,000 80,784,000 0.30% 112 2012 81,650,000 10,076,000 91,726,000 0.32% 130 2013 80,276,000 8,895,000 89,171,000 0.30% 125 2014 78,712,010 10,430,752 89,142,762 0.28% 125
S a c r a m e n t o M e t r o p o l i t a n F i r e D i s t r i c t 59 | P a g e 2 0 1 4 C o m p r e h e n s i v e A n n u a l F i n a n c i a l R e p o r t

SACRAMENTO METROPOLITAN FIRE DISTRICT RATIO OF GENERAL BONDED DEBT OUTSTANDING
LAST TEN FISCAL YEARS
(a) Debt amounts exclude any premiums or discounts. (b) This is the amount set aside for debt service principal payments. (c) See the Assessed Value and the Estimated Actual Value of Taxable Property for property value data. (d) Population data can be found in the Schedule of Demographic and Economic Statistics.
Fiscal Year
General Obligation
Bonds(a)
Less: Amounts
Available for Debt Service(b)
Net General Bonded Debt
Ratio of Net General Bonded Debt to
Estimated Actual Taxable Value of
Property(c)Per
Capita(d)
2005 69,188,975$ 69,188,975$ 0.17% 98$ 2006 69,830,950 69,830,950 0.15% 99 2007 69,997,855 69,997,855 0.13% 99 2008 70,055,305 2,378,780$ 67,676,525 0.12% 95 2009 69,995,000 6,067,039 63,927,961 0.11% 89 2010 69,810,000 7,767,081 62,042,919 0.12% 86 2011 69,483,000 7,766,882 61,716,118 0.12% 87 2012 81,650,000 9,518,396 72,131,604 0.14% 102 2013 80,276,000 11,881,581 68,394,419 0.14% 96 2014 78,712,010 15,129,062 63,582,948 0.12% 88
60 | P a g e S a c r a m e n t o M e t r o p o l i t a n F i r e D i s t r i c t 2 0 1 4 C o m p r e h e n s i v e A n n u a l F i n a n c i a l R e p o r t

SACRAMENTO METROPOLITAN FIRE DISTRICT COMPUTATION OF DISTRICT AND OVERLAPPING DEBT
JUNE 30, 2014
Total Debt Amount Applicable2013-14 Assessed Valuation: $51,418,530,739 Outstanding % Applicable (1) to Metro FireOVERLAPPING TAX AND ASSESSMENT DEBTLos Rios Community College District 370,270,000$ 32.919% 121,889,181$ Center Joint Unified School District 37,496,861 89.447% 33,539,817 Folsom Cordova USD School Facilities Improvement District Nos. 1, 2, 3 and 4 187,920,596 0.680-100.000% 155,088,286 Sacramento Unified School District 372,362,966 11.663% 43,428,693 San Juan Unified School District 335,630,397 96.337% 323,336,256 Twin Rivers Unified School District (former Grant Joint Union High School District Bonds) 192,856,793 43.650% 84,181,990 Twin Rivers Unified School District (former Elementary School District Bonds) 18,945,000 50.898% 9,642,626 Other School Districts 367,084,134 Various 56,439,050 City of Folsom 6,195,000 0.759% 47,020 Dry Creek Joint School District Community Facilities District No. 1 12,124,952 100.000% 12,124,952 Elk Grove Unified School District Community Facilities District No. 1 182,043,915 29.406% 53,531,834 City of Rancho Cordova Community Facilities District No. 2003-1 and 2004-1 82,290,000 100.000% 82,290,000 Other Community Facilities Districts 36,080,000 100.000% 36,080,000 1915 Act and Benefit Assessment Bonds 233,245,000 Various 54,777,076 TOTAL OVERLAPPING TAX AND ASSESSMENT DEBT 1,066,396,781$
DIRECT AND OVERLAPPING GENERAL FUND DEBTSacramento County General Fund Obligations 297,541,055$ 42.442% 126,282,375$ Sacramento County Pension Obligation Bonds 990,307,535 42.442% 420,306,324 Sacramento County Board of Education Certificates of Participation 8,010,000 42.442% 3,399,604 Folsom-Cordova Unified School District Certificates of Participation 21,575,000 36.658% 7,908,964 Sacramento USD Certificates of Participation and Pension Obligation Bonds 76,025,000 11.663% 8,866,796 San Juan Unified School District Certificates of Participation 999,191 96.337% 962,591 Twin Rivers Unified School District Certificates of Participation 129,825,000 43.650% 56,668,613 Other School District Certificates of Participation 18,796,803 Various 3,594,871 City of Folsom General Fund Obligations 8,694,642 0.754% 65,558 City of Rancho Cordova Certificates of Participation 21,570,000 100.000% 21,570,000 City of Sacramento Certificates of Participation 654,165,000 0.001% 3,271 Sacramento Metropolitan Fire District Pension Obligation Bonds 67,572,010 100.000% 67,572,010 (2)
Sacramento Metropolitan Fire District Lease Revenue Bonds 11,218,379 100.000% 11,218,379 Sacramento Metropolitan Fire District Capital Lease Obligations 10,430,752 100.000% 10,430,752 Recreation and Park District Certificates of Participation 11,905,130 82.201-100.000% 10,956,420 TOTAL GROSS DIRECT AND OVERLAPPING GENERAL FUND DEBT 749,806,526 Less: Sacramento County supported obligations (2,739,631) TOTAL NET DIRECT AND OVERLAPPING GENERAL FUND DEBT 747,066,895$
OVERLAPPING TAX INCREMENT DEBT Successor Agency 73,500,000$ 100.00% 73,500,000$
TOTAL DIRECT DEBT 89,221,141$ TOTAL GROSS OVERLAPPING DEBT 1,800,482,165$ (3)
TOTAL NET OVERLAPPING DEBT 1,797,742,534$
GROSS COMBINED TOTAL DEBT 1,889,703,306$ NET COMBINED TOTAL DEBT 1,886,963,675$
(1)
(2) Includes accreted value.
(3) Excludes tax and revenue anticipation notes, enterprise revenue, mortgage revenue and non-bonded capital lease obligations.
Ratios to 2013-14 Assessed Valuation: Total Overlapping Tax and Assessment Debt 2.074% Total Direct Debt 0.174% Gross Combined Total Debt 3.675% Net Combined Total Debt 3.670%
Ratios to Redevelopment Successor Agency Incremental Valuation ($1,381,818,094): Total Overlapping Tax Increment Debt 5.32%
Source: California Municipal Statistics, Inc.
The percentage of overlapping debt applicable to Metro Fire is estimated using taxable assessed property value. Applicable percentages were estimated by determining the portion of the overlapping district's assessed value that is within the boundaries of the Metro Fire divided by the overlapping district's total taxable assessed value.
S a c r a m e n t o M e t r o p o l i t a n F i r e D i s t r i c t 61 | P a g e 2 0 1 4 C o m p r e h e n s i v e A n n u a l F i n a n c i a l R e p o r t

SACRAMENTO METROPOLITAN FIRE DISTRICT COMPUTATION OF LEGAL BONDED DEBT MARGIN
JUNE 30, 2014
(a) California Health and Safety Code, Section 13937 sets the debt limit at 10%. The Code section was enacted when
assessed valuations were based on 25% of full market value. This has since changed to 100% of full market value. Thus, the limit shown is 2.50% (one-fourth the limit of 10%) to account for the adjustment of showing assessed valuation at full market value.
Assessed Valuation 51,418,530,739$
Debt Margin Ratio (a) 2.50%
Bonded Debt Limit 1,285,463,268
Outstanding DebtTotal Bonded Debt 78,712,010$ Less Amounts in Sinking Fund (15,129,062) Total Applicable Debt 63,582,948
Legal Debt Margin 1,221,880,320$
Percentage of Total Net Debt Legal Debt
Fiscal Year Debt Limit Applicable to Limit Legal Debt Margin Margin Available2005 1,035,751,365$ 69,188,975$ 966,562,390$ 93.32%2006 1,160,665,738 69,830,950 1,090,834,788 93.98%2007 1,315,536,849 69,997,855 1,245,538,994 94.68%2008 1,421,147,624 67,676,525 1,353,471,099 95.24%2009 1,440,648,636 63,927,961 1,376,720,675 95.56%2010 1,337,790,689 62,042,919 1,275,747,769 95.36%2011 1,316,038,035 61,716,118 1,254,321,917 95.31%2012 1,265,613,505 72,131,604 1,193,481,901 94.30%2013 1,238,644,422 68,394,419 1,170,250,003 94.48%2014 1,285,463,268 63,582,948 1,221,880,320 95.05%
62 | P a g e S a c r a m e n t o M e t r o p o l i t a n F i r e D i s t r i c t 2 0 1 4 C o m p r e h e n s i v e A n n u a l F i n a n c i a l R e p o r t

SACRAMENTO METROPOLITAN FIRE DISTRICT DEMOGRAPHIC STATISTICS LAST TEN FISCAL YEARS
Source: State of California, Department of Finance.
Fiscal Year Citrus HeightsRancho Cordova
Unincorporated Population
Total Population % Increase
2005 87,549 55,145 560,785 703,479 0.22%2006 86,883 56,355 560,741 703,979 0.07%2007 87,017 59,056 561,951 708,024 0.57%2008 87,321 60,975 563,514 711,810 0.53%2009 87,565 61,817 565,309 714,691 0.40%2010 88,115 62,899 567,700 718,714 0.56%2011 83,618 65,502 558,061 707,181 -1.60%2012 83,881 66,093 560,675 710,649 0.49%2013 84,345 66,927 564,657 715,929 0.74%2014 84,544 67,839 567,095 719,478 0.50%
S a c r a m e n t o M e t r o p o l i t a n F i r e D i s t r i c t 63 | P a g e 2 0 1 4 C o m p r e h e n s i v e A n n u a l F i n a n c i a l R e p o r t

SACRAMENTO METROPOLITAN FIRE DISTRICT DEMOGRAPHIC AND ECONOMIC STATISTICS
LAST TEN FISCAL YEARS
Source: State of California, Department of Finance.
48.50%
49.00%
49.50%
50.00%
50.50%
51.00%
51.50%
District Population as a % of County
$
$5
$10
$15
$20
$25
$30
$35
Mill
ions
Total Personal Income
$-
$5
$10
$15
$20
$25
$30
$35
$40
$45
Thou
sand
s
Per Capita Personal Income (in $ 000's)
0.0%
2.0%
4.0%
6.0%
8.0%
10.0%
12.0%
14.0%
Unemployment Rate (%)
Fiscal YearDistrict
PopulationTotal Personal
Income (in $ 000's)Per Capita Personal Income (in $ 000's)
Unemployment Rate (%)
County Population
District Population as a
% of County 2005 703,479 $ 23,631,970 $ 34 5.1% 1,369,855 51.35%2006 703,979 24,765,277 35 4.9% 1,385,607 50.81%2007 708,024 25,729,592 36 5.4% 1,406,804 50.33%2008 711,810 27,893,698 39 6.9% 1,424,415 49.97%2009 714,691 27,323,352 38 11.5% 1,433,187 49.87%2010 718,714 27,095,518 38 12.6% 1,445,327 49.73%2011 707,181 27,015,729 38 12.6% 1,428,355 49.51%2012 710,649 28,646,794 40 10.8% 1,435,153 49.52%2013 715,929 29,947,643 42 9.2% 1,445,806 49.52%2014 719,478 31,637,020 44 7.1% 1,454,406 49.47%
64 | P a g e S a c r a m e n t o M e t r o p o l i t a n F i r e D i s t r i c t 2 0 1 4 C o m p r e h e n s i v e A n n u a l F i n a n c i a l R e p o r t
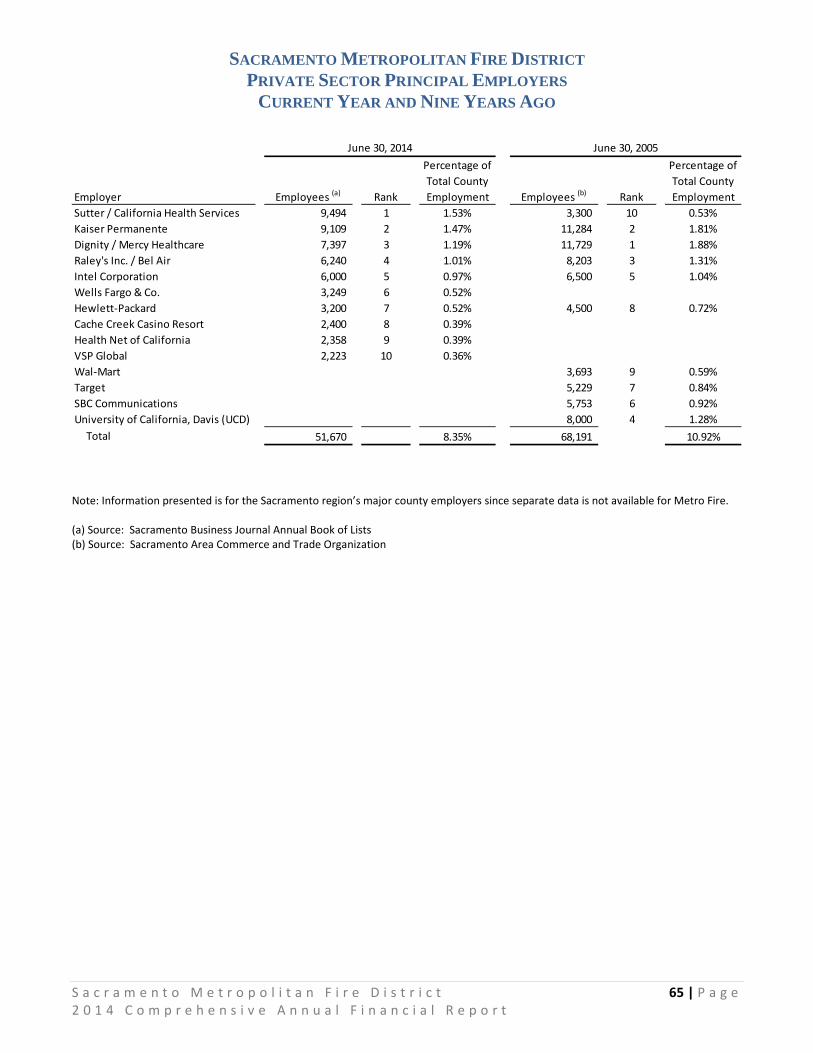
SACRAMENTO METROPOLITAN FIRE DISTRICT PRIVATE SECTOR PRINCIPAL EMPLOYERS
CURRENT YEAR AND NINE YEARS AGO
Note: Information presented is for the Sacramento region’s major county employers since separate data is not available for Metro Fire. (a) Source: Sacramento Business Journal Annual Book of Lists (b) Source: Sacramento Area Commerce and Trade Organization
Employer Employees (a) Rank
Percentage of Total County Employment Employees (b) Rank
Percentage of Total County Employment
Sutter / California Health Services 9,494 1 1.53% 3,300 10 0.53%Kaiser Permanente 9,109 2 1.47% 11,284 2 1.81%Dignity / Mercy Healthcare 7,397 3 1.19% 11,729 1 1.88%Raley's Inc. / Bel Air 6,240 4 1.01% 8,203 3 1.31%Intel Corporation 6,000 5 0.97% 6,500 5 1.04%Wells Fargo & Co. 3,249 6 0.52%Hewlett-Packard 3,200 7 0.52% 4,500 8 0.72%Cache Creek Casino Resort 2,400 8 0.39%Health Net of California 2,358 9 0.39%VSP Global 2,223 10 0.36%Wal-Mart 3,693 9 0.59%Target 5,229 7 0.84%SBC Communications 5,753 6 0.92%University of California, Davis (UCD) 8,000 4 1.28% Total 51,670 8.35% 68,191 10.92%
June 30, 2014 June 30, 2005
S a c r a m e n t o M e t r o p o l i t a n F i r e D i s t r i c t 65 | P a g e 2 0 1 4 C o m p r e h e n s i v e A n n u a l F i n a n c i a l R e p o r t

SACRAMENTO METROPOLITAN FIRE DISTRICT SUMMARY OF DISTRICT ACTIVITIES
FISCAL YEAR 2013-2014
Note: % change is the measurement against prior year actuals
(a) Metro Fire has historically been tracking responses on a calendar year basis. There is no available data on the number of incidents for the prior fiscal year so the change cannot be calculated. However, please see the next page for historical data on the past calendar years.
Source: Sacramento Metropolitan Fire District Records
CATEGORY TOTAL % CHANGE
POPULATION 715,929 0.7%
OPERATIONAL FIRE STATIONS 40 0.0%
INCIDENT RESPONSES 86,308 (a)
TOTAL ACTUAL FULL-TIME EMPLOYEES 644 -3.3%
WORKERS' COMPENSATION CLAIMSPremium and Claims Expenses $ 3,180,400 14.7%
LEAVE HOURS (All Personnel)Sick Leave Used 48,900 25.3%Service Connected Disability Leave 24,350 -21.1%Vacation Time Used 123,259 -1.9%
TRAINING FOR SUPPRESSION PERSONNELTotal Training Hours 149,358 -3.9%
66 | P a g e S a c r a m e n t o M e t r o p o l i t a n F i r e D i s t r i c t 2 0 1 4 C o m p r e h e n s i v e A n n u a l F i n a n c i a l R e p o r t

SACRAMENTO METROPOLITAN FIRE DISTRICT TOTAL RESPONSES
LAST NINE CALENDAR YEARS
Note: Total incident responses have been tracked on a calendar year basis for the past ten years. Data for the 2014 calendar year is not yet available as of the time of the preparation of this report.
Source: Sacramento Metropolitan Fire District Operations Division Records
S a c r a m e n t o M e t r o p o l i t a n F i r e D i s t r i c t 67 | P a g e 2 0 1 4 C o m p r e h e n s i v e A n n u a l F i n a n c i a l R e p o r t

SACRAMENTO METROPOLITAN FIRE DISTRICT EMERGENCY RESPONSE DETAIL ANALYSIS
FISCAL YEAR 2013-14 TOTAL RESPONSES: 86,308
INCIDENT REPORT SYSTEM CODE CATEGORY DESCRIPTIONNUMBER OF INCIDENTS
FIRE INCIDENTSNo Code on Report 315
100 Fire, Other 220111, 123 Building Fires 413
112 Fire in a structure other than a building 12113 Cooking Fires 172
114, 115, 116, 118, 120 Fires other than building or transportation 45121 Mobile home used as a fixed residence 17131 Passenger vehicle fire 238
122, 130, 132, 133, 134, 135, 136, 137, 138 Transportation fires other than passenger vehicles 75140, 141, 142, 143 All vegetation fires 666
150, 151, 152, 153, 154, 155 Rubbish and dumpster/trash fires 487160, 161, 162, 163, 164, 170, 171, 172, 173 Other outside fires 133
TOTAL FIRE INCIDENTS 2,793
OVERPRESSURE RUPTURE & EXPLOSION INCIDENTS200, 210, 211, 220, 221, 223, 231 Steam, Air, Gas, or Chemical Rupture 20
240, 241, 243 Fireworks or Bomb Explosion (no fire) 7251 Excessive heat, scorch burns with no ignition 30
TOTAL OVERPRESSURE & RUPTURE & EXPLOSION 57
EMS & RESCUE INCIDENTS300,311,320 Rescue, EMS incident, other 3,014
321 EMS call, excluding vehicle accident with injury 53,874322, 323, 324 Motor vehicle accidents 3,446
331, 340, 341, 342 Searches 10350, 351, 352, 353, 355, 356, 357 Extrications of various types 39
360, 361, 363, 365 Water Rescues 8371 Electrocution 0381 EMS Standby 10
TOTAL EMS & RESCUE INCIDENTS 60,401
HAZARDOUS CONDITIONS (No Fire)400 Other 112
410, 411, 412, 413 Flammable liquids and gas spills 331420, 421, 422, 423 Toxics and chemical spills 23
424 Carbon monoxide incidents 32440, 441, 442, 443, 444, 445 Electrical hazards 289
451 Biological hazards 5460, 461, 462, 463, 471, 480, 481, 482 Building/vehicle and other hazards 72
TOTAL HAZARDOUS CONDITIONS 864
68 | P a g e S a c r a m e n t o M e t r o p o l i t a n F i r e D i s t r i c t 2 0 1 4 C o m p r e h e n s i v e A n n u a l F i n a n c i a l R e p o r t
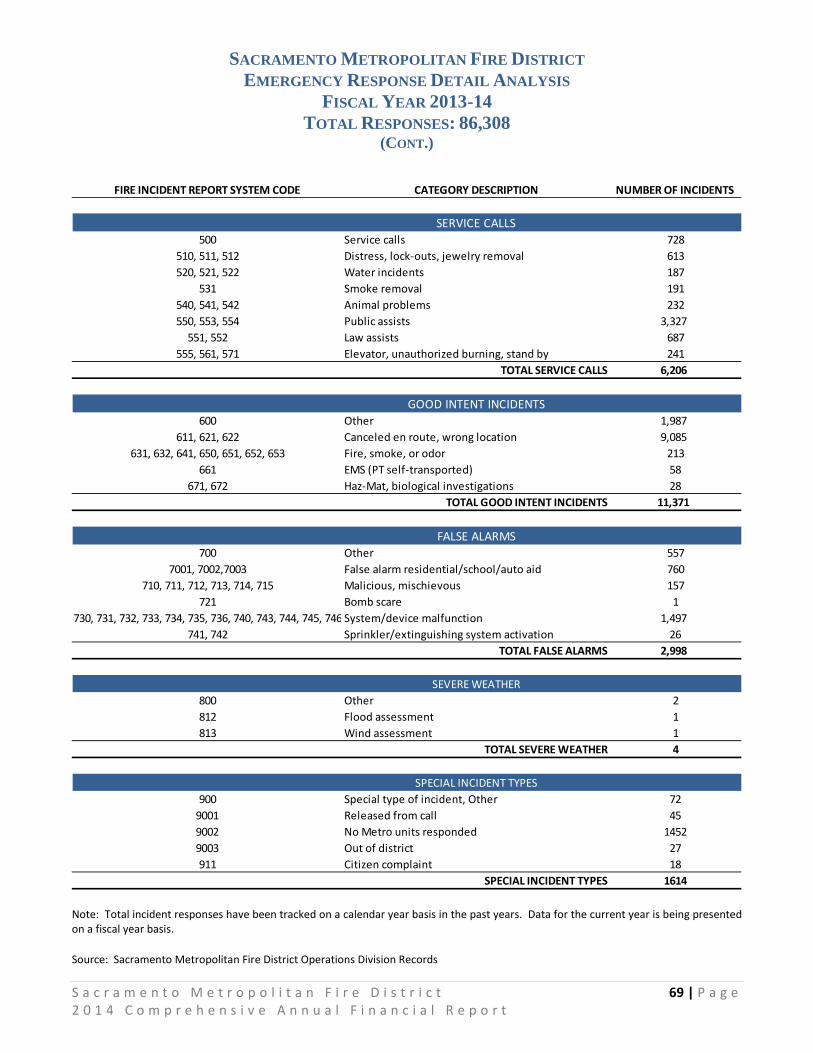
SACRAMENTO METROPOLITAN FIRE DISTRICT EMERGENCY RESPONSE DETAIL ANALYSIS
FISCAL YEAR 2013-14 TOTAL RESPONSES: 86,308
(CONT.)
Note: Total incident responses have been tracked on a calendar year basis in the past years. Data for the current year is being presented on a fiscal year basis.
Source: Sacramento Metropolitan Fire District Operations Division Records
FIRE INCIDENT REPORT SYSTEM CODE CATEGORY DESCRIPTION NUMBER OF INCIDENTS
SERVICE CALLS500 Service calls 728
510, 511, 512 Distress, lock-outs, jewelry removal 613520, 521, 522 Water incidents 187
531 Smoke removal 191540, 541, 542 Animal problems 232550, 553, 554 Public assists 3,327
551, 552 Law assists 687555, 561, 571 Elevator, unauthorized burning, stand by 241
TOTAL SERVICE CALLS 6,206
GOOD INTENT INCIDENTS600 Other 1,987
611, 621, 622 Canceled en route, wrong location 9,085631, 632, 641, 650, 651, 652, 653 Fire, smoke, or odor 213
661 EMS (PT self-transported) 58671, 672 Haz-Mat, biological investigations 28
TOTAL GOOD INTENT INCIDENTS 11,371
FALSE ALARMS700 Other 557
7001, 7002,7003 False alarm residential/school/auto aid 760710, 711, 712, 713, 714, 715 Malicious, mischievous 157
721 Bomb scare 1730, 731, 732, 733, 734, 735, 736, 740, 743, 744, 745, 746 System/device malfunction 1,497
741, 742 Sprinkler/extinguishing system activation 26TOTAL FALSE ALARMS 2,998
SEVERE WEATHER800 Other 2812 Flood assessment 1813 Wind assessment 1
TOTAL SEVERE WEATHER 4
SPECIAL INCIDENT TYPES900 Special type of incident, Other 72
9001 Released from call 459002 No Metro units responded 14529003 Out of district 27911 Citizen complaint 18
SPECIAL INCIDENT TYPES 1614
S a c r a m e n t o M e t r o p o l i t a n F i r e D i s t r i c t 69 | P a g e 2 0 1 4 C o m p r e h e n s i v e A n n u a l F i n a n c i a l R e p o r t

SACRAMENTO METROPOLITAN FIRE DISTRICT EMERGENCY RESPONSE - PERCENT OF TOTAL RESPONSE BY TYPE
FISCAL YEAR 2013-14
Source: Sacramento Metropolitan Fire District Operations Division Records
FIRE INCIDENTS 3.24%
OVERPRESSURE RUPTURE &
EXPLOSION INCIDENTS 0.07%
EMS & RESCUE INCIDENTS
69.98%
HAZARDOUS CONDITIONS (No Fire)
1.00%
SERVICE CALLS 7.19%
GOOD INTENT INCIDENTS
13.17%
FALSE ALARMS 3.47%
SPECIAL INCIDENT TYPES 1.87%
70 | P a g e S a c r a m e n t o M e t r o p o l i t a n F i r e D i s t r i c t 2 0 1 4 C o m p r e h e n s i v e A n n u a l F i n a n c i a l R e p o r t

SACRAMENTO METROPOLITAN FIRE DISTRICT SERVICE-CONNECTED INJURY/ILLNESS REPORT
FISCAL YEAR 2013-14
Source: Sacramento Metropolitan Fire District Human Resources Division Records
INCIDENT ACTIVITY NUMBER %Administrative 5 2.0%Fire Academy 7 2.8%Firefighting 156 63.3%Fire Prevention 1 0.4%Fleet/Maintenance 3 1.2%Medical Emergency 7 2.8%Other 59 23.9%Physical Fitness 2 0.8%Training 7 2.8%TOTAL NUMBER OF MEDICAL INJURIES 247 100%
Administrative 2.0%
Fire Academy 2.8%
Firefighting 63.3%
Fire Prevention 0.4%
Fleet/Maintenance 1.2%
Medical Emergency 2.8% Other
23.9% Physical Fitness
0.8% Training 2.8%
S a c r a m e n t o M e t r o p o l i t a n F i r e D i s t r i c t 71 | P a g e 2 0 1 4 C o m p r e h e n s i v e A n n u a l F i n a n c i a l R e p o r t

SACRAMENTO METROPOLITAN FIRE DISTRICT STAFFING SUMMARY
LAST NINE FISCAL YEARS
Note: Data above represents authorized positions.
Source: Sacramento Metropolitan Fire District Human Resources Division Records
DIVISION 2006 2007 2008 2009 2010 2011 2012 2013 2014
Office of the Fire Chief 4 5 4 4 7 7 7 9 8
Administration 22 22 21 5 4 3 2 2 2
Human Resources 7 9 8 9 4 4 3 4 4
Finance 12 13 13 16 12 11 10 12 12
Information Technology 12 10 11 10 7 8 9 7 7
Operations 6 7 6 8 7 7 8 8 8
Fire Suppression 570 620 605 605 533 520 525 522 522
Single Role Paramedic Program 65
EMS 5 5 5 8 5 7 7 6 6
Training, Safety, Health & Fitness 11 12 11 15 6 7 7 7 7
Communications 2 2
Support Services 2 2 2 2 2 1 1 1 1
Logistics 13 12 12 13 10 10 10 10 10
Facilities 4 6 4 6 3 3 4 4 4
Fleet 18 18 18 19 14 13 13 13 13
Community Risk Reduction 34 36 36 42 18 17 17 20 20
Community Services 6 9 8 9 4 2 2 2 2TOTAL 726 786 764 771 636 620 625 629 693
72 | P a g e S a c r a m e n t o M e t r o p o l i t a n F i r e D i s t r i c t 2 0 1 4 C o m p r e h e n s i v e A n n u a l F i n a n c i a l R e p o r t


![Consolidated Financial Results for the Fiscal Year Ended ...Note: Comprehensive income Fiscal year ended March 31, 2019: ¥1,761 million [24.3%] Fiscal year ended March 31, 2018: ¥1,417](https://img.pdfslide.us/doc/110x75/5fe4d06806b4775830253106/consolidated-financial-results-for-the-fiscal-year-ended-note-comprehensive.jpg)