Embed Size (px)
Citation preview

Visions FOR SUSTAINABLE GROWTH
ANNUAL REPORT 2016
Group

Freight Dry Bulk Shipping Routes
Oil Fuel Oil Hubs: Singapore and Rotterdam
Fertiliser Fertiliser DAP and Urea contracts
Coal Delivery Points:Amsterdam, Rotterdam, Antwerp, Richards Bay
MARKETS AND PRODUCTS OF EEX GROUP

TTFNBP
ZEE
TRS
NCG
CEGH
PSV
GAS POOL
PEGNORD
ZTP
ETF
Emission Allowances EUA Primary Market Auctions for 25 EU member states as well as Germany and Poland
Metals Iron Ore Tjanjin European steel contracts
Natural Gas
Location spreads
Natural Gas hubs
New Natural Gas hubs
Power Spot
Germany / Austria / Luxembourg
France
United Kingdom
The Netherlands
Belgium
Switzerland
Market Operations for
Hungarian Power Exchange HUPX
Market operation services for the
Serbian power exchange SEEPEX
Power Derivates
Exchange-traded Power Futures
Trade Registration Services
for Power Futures

KEY DATA
* Million tonnes** Thousand days
1 2015 EBIT and EBITDA adjusted because of a reclassification in the 2016 profit and loss account 2 Trade volumes, including APX volumes from 4 May 2015, SEEPEX volumes from 17 February 2016 and PXE volumes from June 2016 onwards3 PEGAS trade volumes, including Gaspoint Nordic and PXE volumes from June 2016, CEGH from December 2016 onwards 4 Trade volumes, including PXE volumes, from June 2016 5 Trade volumes from 11 May 2015, excluding fertilisers 6 2015 EBT adjusted for one-off effects caused by the acquisition; equity as at the beginning of the period 7 Equity as at the balance sheet date/adjusted balance sheet total (adjusted for cash collateral of the Clearing Members, derivative financial instruments, payments made and received on account as of the balance sheet date and trade payables and receivables as of the balance sheet date)
2016 2015 Change %
Profit and loss account
Sales revenue kEUR 234,158 190,424 +23
Earnings before interest, taxes, depreciation and amortisation (EBITDA) 1 kEUR 99,460 70,316 +41
Earnings before interest and taxes (EBIT) 1 kEUR 87,129 49,380 +76
Earnings before taxes (EBT) kEUR 87,629 99,461 –12
Earnings before taxes (EBT) — 2015 adjusted kEUR 87,629 49,737 +76
Balance sheet (as of 31 December)
Non-current assets kEUR 218,862 185,441 +18
Equity kEUR 283,846 244,323 +16
Balance sheet total kEUR 3,721,238 1,922,537 +94
Core business parameters
Spot market
Power spot market volume 2 TWh 535 524 +2
Emissions spot market volume mt* 691 613 +13
Gas spot market volume 3 TWh 666 458 +45
Derivatives market
Power derivatives market volume TWh 3,920 2,537 +55
Emissions derivatives market volume mt* 258 65 +299
Gas derivatives market volume 3 TWh 1,091 584 +87
Agriculturals derivatives market volume 5 Contracts 55,838 36,564 +53
Freight derivatives market volume — futures and options kd** 438 449 –3
Company parameters
Trading participants 555 461 +120
Employees (balance sheet date) 453 421 +8
Sales revenue per employee kEUR 517 452 +14
Return on equity 6 % 36 22 +65
Equity ratio, adjusted 7 % 75 70 +8

Visionsgrowth
for sustainable

What began as the vision of two power
exchanges in 2000 has evolved into the leading
energy exchange in continental Europe:
the European Energy Exchange.
Even 16 years later, a shared vision promotes
the development of EEX Group. New markets
and a dynamic market environment offer
challenges and opportunities which have to
be used to ensure that EEX can position itself
as a global market leader in the long term.

CONTENTS
MANAGEMENT REPORT
4 FOREWORD
10 REPORT OF THE SUPERVISORY BOARD
14 FACTS AND FIGURES
VISIONS
20 DESIGNING GLOBAL
EMISSIONS TRADING
26 OPENING GLOBAL
COMMODITY MARKETS FOR
EUROPEAN PARTICIPANTS
32 EXPANDING RISK MANAGEMENT
FOR AGRICULTURAL PRODUCTS
GUEST CONTRIBUTION
40 CLIMATE PROTECTION
ON THE TRADING FLOOR
42 CORPORATE RESPONSIBILITY
FINANCIAL REPORT
49 CONSOLIDATED
MANAGEMENT REPORT
99 CONSOLIDATED
FINANCIAL STATEMENTS
104 CONSOLIDATED NOTES

4 Annual Report 2016
PETER REITZ
has been the CEO of EEX since
1 August 2011.
After gaining a degree in
mathematics, he started his
career as a product manager at
Deutsche Börse AG in Frankfurt.
From 2000 to 2001, he worked
at Dow Jones Indexes in New York
before he became a Management
Board member of the Eurex
derivatives exchange.

5Management Report Visionen Gastbeitrag Corporate Responsibility Financial Report Foreword
We look back on 2016 as an extraordinarily successful financial year. We were
again able to reach new records for all the important parameters, such as
trading volume, sales revenue and earnings before taxes. In 2016, EEX Group
sales revenue rose by 23% to EUR 234.2 million. Furthermore, with regards to
the earnings before taxes, we recorded an increase of 76% to EUR 87.6 million.
Our core markets of power and gas, in which new trading records were achieved,
accounted for the biggest share in this success. Within the power segment,
a volume of 4,456 TWh was achieved (+46% as against the previous year),
while the volume traded in natural gas rose to 1,756 TWh (+69% as against
the previous year). Regarding the trading in emission allowances, we have also
improved our market position with trading turnover increasing to 950 million
tonnes of C02 which represents a 40% increase compared to the previous year.
Furthermore, we were also pleased about the excellent development of our
numerous new markets. Therefore, I would like to take this opportunity to invite
you to take a look at the next section, in which we will take an in-depth look
at the development of, and our visions for, the “new” EEX Group markets.
Our successes confirm our strategy based on growth in three dimensions:
growth on the core markets, expansion of our geographic reach and entry into
new business fields. We have made progress in all three fields, strengthened
our competitive position and, yet again, moved closer to our long-term goal of
developing EEX Group into a global commodity exchange. In addition to our
organic growth in the core markets — primarily through the expansion of the
product range — we were able to further increase our reach, specifically through
acquisitions on the European power and gas markets. Since June, the Prague-
based Power Exchange Central Europe (PXE) has been a member of EEX Group.
With its power derivatives markets in the Czech Republic, Slovakia, Hungary,
Poland and Romania, it supplements the existing EEX Derivatives Markets for
eleven market areas in Central and Western Europe. As a result, PXE provides
the EEX Group with access to new markets and the potential for growth in

6 Annual Report 2016
Eastern Europe. On the gas markets, we have supplemented trading on the PEGAS
platform with Danish and Austrian products. In addition, our subsidiary Power-
next increased its shareholding in Gaspoint Nordic from 50 to 100%. In 2016, we
expanded the cooperation with the Central European Gas Hub (CEGH) with which
we have co-operated in clearing for several years and integrated the Austrian gas
exchange products of CEGH into PEGAS.
Furthermore, in 2016, we were also successful in our new business fields which
supplement our energy offerings. Within the Agricultural Index Contracts segment,
we generated significant growth, particularly on the dairy derivatives market.
Our subsidiary Cleartrade Exchange (CLTX) which constitutes our access point
to globally traded commodity products and to the Asian market was also able to
increase volumes, in particular, on the marine diesel and iron ore markets.
Of course, we are pleased about the very successful last year and are proud of our
achievements. However, we are also aware of our responsibility as an exchange
operator with a public service mandate for our markets. As a corporate group,
we are united by the values for which we stand: customer orientation, entrepre-
neurship and respect. We place our customers at the centre of our activities and
develop fitting solutions for the diverse challenges they face. We think ahead and
consider what design tomorrow’s markets might have and how we can contribute
to them. This does not only apply to trading and the corresponding products, but
also to all the associated services — with clearing playing a special role in this.
By now, our clearing subsidiary ECC has been a reliable partner for the market for
more than ten years. ECC does not only ensure the highest possible level of security
in trading but through its extensive network of partner exchanges and integrated
markets, it also creates a significant additional value for our customers.
The energy markets, in particular, are undergoing profound change — and our
customers are at the heart of this process. The transformation process of the German
“Energiewende” and the expansion of renewable energies are having a profound
Growth in the core markets
Regional growthNew
business fields

7Management Report Visionen Gastbeitrag Corporate Responsibility Financial Report Foreword
impact on the energy world. Digitalisation, decarbonisation and decentralisation
are certainly more than buzzwords in this respect. The potential that these
entail will certainly bring change to the markets, creating new risks and oppor-
tunities, including for trading.
This motivates us to provide close-knit support to the markets on which we
actively operate. We want to be a partner in the truest sense of the word and to
help to shape the transformation. For example, this includes us developing new
products for the energy market of the future which will help the market partici-
pants to better manage their risks. Following the Cap Future, which we intro-
duced in 2015, we launched the Wind Power Future — a second innovative energy
turnaround product on the Power Derivatives Market — last autumn. Moreover,
our commitment in emissions trading, which we consider to be a fundamental
contribution to global climate protection, is yet another example of this. In this
sense, the confirmation of EEX as the European auction platform for the auctioning
of emission allowances for another five years is certainly a positive sign, in
addition to the success of the world climate conference in Paris 2015.
We are on the right track and will continue to strengthen the EEX core business.
This includes, first and foremost, the European power and gas markets. However,
we see long-term potential for growth even beyond Europe. Sooner or later,
renewable energy sources will also be signifi-
cantly expanded in other parts of
the world — and this process will
be accompanied by system trans-
formations. Even if power per se
cannot become a globally tradable
commodity, our experience and
ideas can certainly be exported.
In the field of gas, it remains to
be seen whether a global market
will in fact actually evolve. There
is certainly potential for such a
development in the case of lique-
fied natural gas (LNG). In order to
operate globally and expand, we
Local power exchange
Europeanenergyexchange
Globalmulti-commodity platform
Trading participants
Products

8 Annual Report 2016
will significantly step up our commitment outside energy and reinforce the
interlinking between the Global Commodities segment with the existing
EEX markets. With the strong support of our shareholders, we will exploit
further opportunities as they arise.
Today, more than 450 employees work for EEX Group across 15 locations.
On behalf of the entire Management Board, I would like to thank you — our
esteemed employees — for your outstanding performance. You have always
formed the basis of our success and will continue to do so in the future.
Finally, I would like to thank our customers and partners. Your trust motivates
us to once again achieve our ambitious aims in the forthcoming year and to
build upon those successes achieved in the previous year.
Leipzig, April 2017
For the Management Board
Peter Reitz

9Annual Report 2016Management Report Visionen Gastbeitrag Corporate Responsibility Financial Report
THE MANAGEMENT BOARD
From left to right:
Jean-François Conil-Lacoste › Executive Director Power Spot Markets
Steffen Köhler › Chief Operating Officer
Dr Egbert Laege › Executive Director Gas Markets
Dr Dr Tobias Paulun › Chief Strategy Officer
Peter Reitz › Chief Executive Officer
Dr Thomas Siegl › Chief Risk Officer
Iris Weidinger › Chief Financial Officer

10 Annual Report 2016
During the reporting year (2016), the Supervisory Board of EEX
diligently carried out the tasks with which it was en trust ed,
according to the applicable legislation, the statutes of the
Company and its rules of procedure. It accompanied the Man-
agement Board in the running of the Company in an advisory
capacity and continuously monitored the conduct of the busi-
ness of the Company. The Supervisory Board was directly in -
volved in all the decisions and measures which were of funda-
mental importance to the Company.
The Management Board of EEX regularly, promptly and com-
prehensively reported to the Supervisory Board regarding cor-
porate planning, including financial, investment and human
resources planning, the course of the business, the further
strategic development and the current situation of the Group.
The business transactions, which were of significant impor-
tance to the Company, were intensively discussed by the
Supervisory Board on the basis of reports provided by the
Management Board in writing and verbally. The Supervisory
Board approved the draft resolutions of the Management
Board, following thorough examination and deliberation.
In addition to the adoption of resolutions at meetings, one
resolution was adopted by circulation on account of its
urgency during the year under consideration.
In addition to the meetings of the Supervisory Board, the
Chairman of the Supervisory Board was in regular contact
with the Management Board. In addition, the Management
Board informed him of the current development of the busi-
ness situa tion and essential business transactions at the ear-
liest opportunity.
Work of the CommitteesIn order to efficiently discharge its tasks, the Supervisory
Board has established two committees which prepare reso-
lutions to be voted on by the Supervisory Board and deal
with matters to be discussed by the board. In addition, the
Supervisory Board has transferred individual tasks and parts
of its decision-making competences to these committees. The
chairmen of the committees regularly and comprehensively
report to the board on the content and the results of the com-
mittee meetings.
During the reporting period, the Executive Committee held
seven meetings. The Executive Committee consists of the
chairman and the deputy chairmen of the Supervisory Board,
and has the task of preparing resolutions to be adopted by
the Supervisory Board, subjects to be covered by the Super-
visory Board and the issuing of recommendations with regard
to these matters.
The Personnel Committee prepares decisions to be made
by the Supervisory Board regarding the appointment and
dismissal of Management Board members as well as regard-
ing the determination of their compensation. Furthermore,
the Personnel Committee submits proposals regarding the
conclusion or amendment of employment contracts with
Management Board members — including decisions relevant
for the setting of compensation and regarding target agree-
ments and attainment. Additionally, instead of the Super-
visory Board and on the basis of the competences transferred
to it, it adopts resolutions on matters specified in detail in the
rules of procedure for the Supervisory Board, in particular,
the approval of ancillary activities of members of the Man-
agement Board. The committee consists of the chairman and
the deputy chairmen of the Supervisory Board. During the
reporting period, the Personnel Committee met three times.
At these meetings, it dealt with the introduction of a new
system for the assessment of financial targets for the Manage-
ment Board; those targets were applied for the first time for
the 2016 financial year on the basis of a corresponding reso-
lution by the Supervisory Board. The Personnel Committee
prepared proposals for target agreements and the degrees
of target attainment by the Management Board members and
issued recommendations for the corresponding resolutions to
be voted on by the Supervisory Board.
Supervisory Board meetingsIn the reporting year 2016, four ordinary meetings of the
Supervisory Board were held. At all ordinary meetings, the
REPORT OF THE SUPERVISORY BOARD

11Management Report Visionen Gastbeitrag Corporate Responsibility Financial Report
DR JÜRGEN KRONEBERG
Dr Jürgen Kroneberg is a
renowned expert in the energy
industry. As a lawyer, he held
leading positions in various
municipal and district administra-
tions from 1984 to 1997.
In 1997, he became an
Executive Board member of RWE
Energie AG with responsibility
for Sales Germany / Benelux and
Law. As a member of the Executive
Board of RWE Net AG, he was
responsible for Sales / Law from
2000 to 2003 and subsequently
joined the Executive Board of
RWE Energy AG.
Since leaving RWE Energy AG in
June 2009, he worked as a lawyer
at Clifford Chance before joining
White & Case (Düsseldorf) as a
lawyer in April 2015.
Dr Kroneberg has been Chairman
of the Supervisory Board of EEX
since 2000.
Report of the Supervisory Board
12 Annual Report 2016
focus was on the current report of the Management Board
regarding the existing situation of the Company, which the
Supervisory Board then discussed with the Management
Board in detail. Furthermore, in accordance with the resolu-
tion of the Supervisory Board regarding the dissolution of the
strategy committee as of the end of 2015 — two Supervisory
Board meetings focusing on strategic subjects were held for
the first time in 2016 in addition to two extraordinary Super-
visory Board meetings which also took place.
The Supervisory Board meetings were characterised by a
thorough and open exchange regarding the Company’s situa-
tion, the development of the business and financial situation,
as well as the discussion of fundamental questions as to cor-
porate policy and strategy. The Supervisory Board members
regularly prepared resolutions regarding matters requiring
their approval on the basis of documents made available to
them in advance by the Management Board. In addition to
this, the Management Board regularly informed the Super-
visory Board of the most important commercial parameters
and developments in the form of written monthly reports.
At an extraordinary meeting on 29 February 2016, the Super-
visory Board adopted a new system for the assessment of
financial targets for the Management Board, which was applied
for the first time in the 2016 financial year.
At the meeting convened to approve the balance sheet as of
6 April 2016, the Supervisory Board comprehensively looked
into the 2015 annual and consolidated financial statement
and the corresponding management reports in the presence of
the external auditor of the annual accounts. The annual finan-
cial statements prepared were approved and are, therefore,
considered as adopted. Furthermore, the Supervisory Board
approved the Management Board’s proposal to the Annual
General Meeting to use the balance sheet profit to pay a div-
idend of EUR 0.18 per share certificate entitled to dividends.
In addition, a proposal to the Annual General Meeting regard-
ing the election of a Supervisory Board member was adopted.
In addition, the Supervisory Board diligently dealt with the
development of the group company Cleartrade Exchange Pte.
Ltd. (CLTX) and approved the takeover of all remaining shares
of the co-shareholders by EEX on the basis for comprehensive
restructuring of this company. Upon a recommendation to this
end by the Personnel Committee, the board also approved the
proposed degrees of target achievement of the Management
Board members for the financial year 2015, and the manage-
ment bonuses connected with these.
The first strategy meeting on 9 May 2016 focused on the
di scussion of the strategy framework conditions for preparing
revenue planning from 2017 to 2022. The Supervisory Board
also discussed the IT strategy of EEX Group and was provided
with a report on strategic initiatives in the gas business. In
this context, the Supervisory Board approved the acquisition
of all the remaining shares in Gaspoint Nordic A/S by EEX as
well as the subsequent intragroup resale of the total share-
holding to its subsidiary Powernext S.A.
At the Supervisory Board meeting on 16 June 2016, the Super-
visory Board approved the project costs for the development
of an offering for trading of non-financial instruments, so-
called Non-MTF products, in the course of the introduction
of the MiFID II financial market regulation. In addition, the de -
liberations focused on reporting on current strategic projects.
The meeting on 19 October 2016 focused on the approval of
the 2017 budget and the medium-term planning from 2018 to
2022 as well as reporting on a potential transaction outside
the European core markets of EEX. The Supervisory Board
also intensively discussed a draft resolution for the gen-
eral meeting regarding the execution of a significant capital
increase which was intended to create the financial basis for
implementing the global growth strategy of EEX. Since not all
detailed questions could be finally resolved at the meeting,
the adoption of the resolution was postponed to an extraordi-
nary meeting on 31 October 2016. Following renewed delib-
erations, the Supervisory Board approved the proposed reso-
lutions regarding the execution of a capital increase to be
submitted to the general meeting. This was followed by an
extraordinary general meeting of EEX chaired by the Super-
vis ory Board chairman on 16 December 2016.
At the second strategy meeting of 2016 (held on 14 Novem-
ber 2016), the Supervisory Board focused on the revised EEX
Group strategy whose objective during the reporting year was
on analysing and identifying target markets outside Europe.
In this context, the Supervisory Board was comprehensively
informed of the methods, revenue potential and results of
the assessment for the global product-country combinations
considered. In addition, the Supervisory Board approved two
acquisitions of shareholdings within the Group. The report on
the status of the acquisition project as well as an update on the
EEX IT strategy comprised another focus of the deliberations.
In addition to regular reporting and updates on market
dynamics, financial performance, strategy, IT and risk devel-

13Management Report Visions Guest Contribution Corporate Responsibility Financial Report
opment, the discussion of a preliminary dividend proposal for
the 2016 financial year, which was approved by the Supervis-
ory Board following thorough deliberations, formed a central
subject at the meeting on 14 December 2016. Furthermore,
the Supervisory Board adopted the individual target agree-
ments for the Management Board members for 2017 as pro-
posed by the Personnel Committee.
Audit of the annual accountsThe Management Board prepared the annual financial state-
ment and the management report as well as the consolidated
financial statement and the consolidated management report
of EEX, and submitted these to the Supervisory Board at the
due time.
KPMG AG Wirtschaftsprüfungsgesellschaft, Frankfurt am
Main, was appointed as the auditor of the annual accounts
and group auditor for the 2016 financial year by the Annual
General Meeting, and audited the annual financial statement
as of 31 December 2016 prepared according to the rules of the
German Commercial Code (HGB) and the appertaining man-
agement report as well as the consolidated financial state-
ment as of 31 December 2016 (prepared according to IFRS in
the version in which these have to be applied within the EU)
and the appertaining consolidated management report and
has certified each of these without qualification.
The auditor of the annual accounts submitted reports on the
type and extent as well as the result of the audits to the Super-
visory Board. The documents regarding the financial state-
ments referred to, as well as the audit reports provided by
the auditors of the annual accounts, were submitted to all
the Supervisory Board members by the due date. The audi-
tor of the annual accounts took part in the Supervisory Board
meeting on 5 April 2017 and comprehensively reported on the
essential findings of the audit.
The Supervisory Board has examined the annual financial
statement and the management report, as well as the consol-
idated financial statement and the consolidated management
report. As there were no objections, the result of the audit
made by the auditor of the annual accounts was approved.
The Supervisory Board approved the annual financial state-
ment prepared by the Management Board as well as the con-
solidated financial statement for the financial year 2016. The
annual financial statement of EEX is, therefore, adopted. The
Supervisory Board has approved the Management Board’s pro-
posal regarding the appropriation of the balance sheet profit.
Matters of the Management BoardThere were no changes in the staffing of the EEX Management
Board in 2016.
Matters of the Supervisory BoardWith effect from 20 January 2016, Dr Nigel Hawkins, Head of
Power & Fuel Portfolio Management at Enel Trade S.p.A., was
delegated to the EEX Supervisory Board as the successor of
Pierre Bornard, who had left the Supervisory Board in 2015.
Dr Randolf Roth resigned from his position on the Supervis-
ory Board with effect from 16 June 2016. He was succeeded
in office by Andreas Preuß, Deputy Chief Executive Officer
of Deutsche Börse AG, who was elected as a member of the
Supervisory Board of EEX at the annual general meeting on
16 June 2016.
The Supervisory Board would like to thank the members of the
Management Board and all the members of staff of European
Energy Exchange AG for the work which they have undertaken
during the year under review — they have made a significant
contribution to the success of EEX during this particularly
successful financial year.
Leipzig, April 2017
On behalf of the Supervisory Board
Dr Jürgen Kroneberg
Chairman of the Supervisory Board
Report of the Supervisory Board

14 Annual Report 2016
EEX GROUP
CLTX is a platform
for trading in
global commodity
derivatives transactions.
More than
40 derivatives contracts
focusing on the
Asian markets
EPEX SPOT
operates the
power spot markets
of the Group.
Power: Day-ahead and
intraday trading
EEX is the leading
European energy exchange.
Contracts on energy,
environmental products,
freight, metals
and agriculturals
ECC provides clearing
as well as physical
and financial settlement
of the transactions.
Central clearing house
of EEX Group
PEGAS is the central
gas trading platform of
EEX Group and bundles
the liquidity of a large
number of markets.
Operated by Powernext
Powernext offers
spot and derivatives
trading for European
gas markets and operates
the register for French
guarantees of origin.
Gas products for AT, BE,
DE, DK, FR, IT, NL, UK
Gaspoint Nordic
is a company
specialising
in the Danish
gas market.
Part of the PEGAS
platform since 2016
The Prague-based PXE
is the centre of com-
petence for the eastern
European markets.
Trading products
for power in
CZ, SK, HU, PL, RO
FACTS & FIGURES
“The whole is greater than the sum of its par
ts.”Aristotle

15Management Report Visionen Gastbeitrag Corporate Responsibility Financial Report Facts & Figures
The companies of EEX Group
each specialise in certain products
in order to be able to address the customers’
requirements and develop the market
in a targeted way.
THE EEX GROUP
employs
more than
450 EMPLOYEES
at
15 SITES
brings together
more than
500 TRADING PARTICIPANTS
from more than
30 COUNTRIES

16 Annual Report 2016
16 June
New short-term maturitiesEEX launches day and weekend
futures for power peak load
deliveries for France and Italy.
Additional week futures are
launched for the market areas
of the Netherlands, Switzerland
and the Nordic market.
17 February
EPEX SPOT launches
services for the South East
European Power Exchange
SEEPEX—
clearing provided by ECC.
31 May
The Prague-based
PXE becomes a member of EEX Group.
NEW PRODUCTS, SERVICES,
PARTNERS AND COOPERATIONS IN 2016
30 March
PEGAS expands its
offerings with hourly
contracts for the
GASPOOL, NCG and TTFmarket areas.
April
ECC assumes clearing
of the Dutch, Belgian
and British power spot
markets of
EPEX SPOT
(formerly: APX-Belpex).
July
EEX is appointed the
European platform, for execution of CO2
primary market auctions
for another 5 years.
1 July
Non-MTFEEX and Powernext launches
“non-MTF” platforms for German
and French power futures and
for all gas futures.
29 February
On that day, the
1000th primary market auctionis held on EEX.

17Management Report Visionen Gastbeitrag Corporate Responsibility Financial Report Facts & Figures
5 October
Intraday harmonisationThe Dutch and Belgian power
intraday markets of EPEX SPOT
(formerly: APX-Belpex) are now
connected with the intraday
markets for Germany, France,
Austria and Switzerland in one
trading system.
4 October
EEX launches
Wind Power Futures as the second product
for the ‘Energiewende’.
26 September
EEX launches
4 Additional maturities
for EUA futures
beyond 2020.
Introduction of
Options
on EUA Futures.
September
ECC introduces a model
for direct participation
in clearing for the
power spot markets.
Direct Clearing Participant Model
17 November
Gaspoint NordicDanish gas products
of Gaspoint Nordic
successfully migrated
to PEGAS.
1 December
CEGHAustrian gas exchange products
on the Central European
Gas Hub available on PEGAS.
25 August
ECC celebrates 10-year anniversaryThe clearing house was created
as a result of the spin-off
of EEX’s clearing activities.
ECC was registered in the
Leipzig commercial register
on 25 August 2006.

18 Annual Report 2016
“It is only a vision if it exceeds the imagination
of others.”

Management Report Visionen Gastbeitrag Corporate Responsibility Financial Report
page 32
Designing
Opening
risk management
EEX as a one-stop-shop: from the European energy exchange
page 20
page 26
global emissions trading
for European participantsglobal commodity markets
for agriculturals
to the internationalcommodity exchange
Expanding
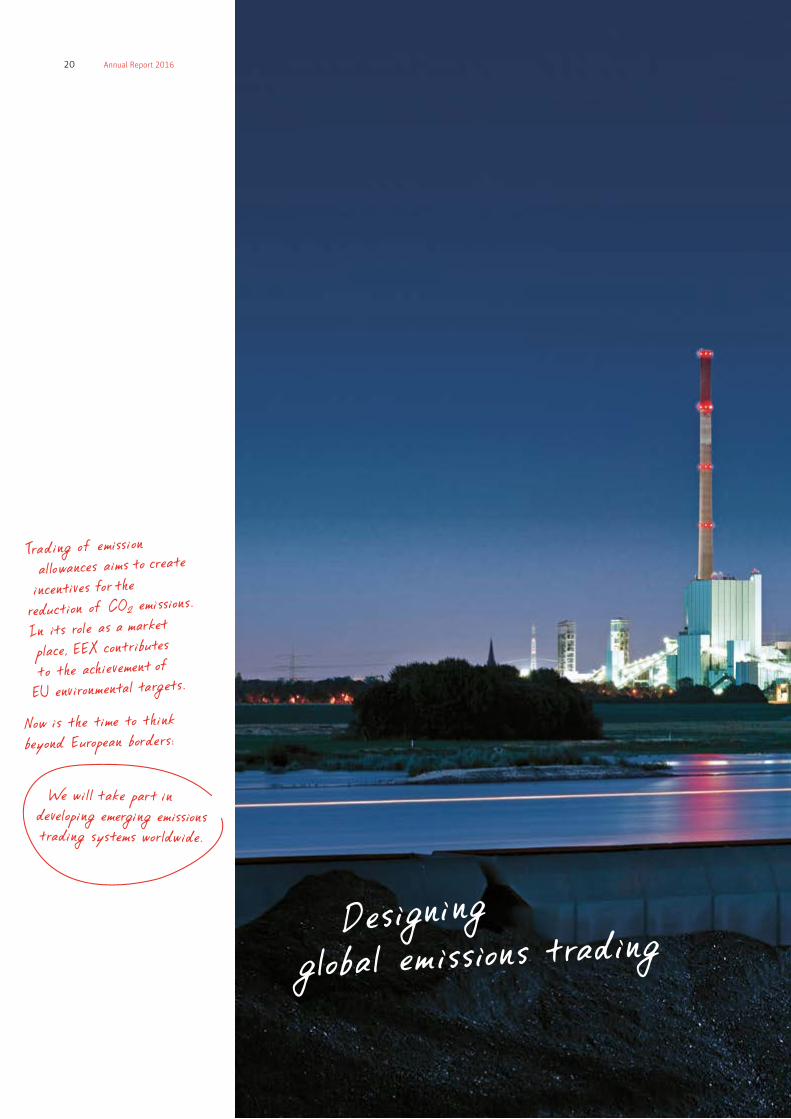
20 Annual Report 2016
Designing global emissions trading
Trading of emission allowances aims to create incentives for the reduction of CO2 emissions. In its role as a market place, EEX contributes to the achievement of EU environmental targets.
We will take part in developing emerging emissions trading systems worldwide.
Now is the time to think beyond European borders:

21Management Report Visionen Gastbeitrag Corporate Responsibility Financial Report

22 Annual Report 2016
World climate negotiations rely on the marketThere are moments in history which you simply
do not forget. One such moment was the con-
clusion of the COP21 world climate conference
which was held in Paris in December 2015. For
the first time in history, governments world-
wide committed to the long-term aim of limiting
global warming to 2°C higher than in the pre-
industrial age — and even to strive to achieve a
reduction of 1.5°C. The weeks of negotiations
and the years of preparations for the final reso-
lutions were certainly worth it.
What is particularly positive is that the world cli-
mate treaty recognises the importance of markets
for the attainment of climate protection targets.
In fact, it goes further than this — by calling for
the expansion of the use of market mechanisms.
Article 6 of the agreement provides for three spe -
cific measures to this end. These include the crea-
tion of new rules regarding the cross-border trans-
fers of reduction obligations, the draft of a new
mechanism under which these can be settled and
the specification of joint accounting stan dards in
order to prevent the double counting of reduc-
tions. This establishes the foundation for the effi-
cient attainment of the ambitious climate protec-
tion targets as set by the climate confe rence — with
the help of market-based instruments.
The world climate conference was followed by
the unparalleled rush of countries worldwide
to ratify the treaty as quickly as possible. Upon
its signing by the EU Commission, Germany and
other EU member states on 5 October 2016, the
contract finally took effect in November 2016
and, as a result, its aims became binding under
international law.
The attainment of these targets will require the
greater expansion of pricing of greenhouse gases
(first and foremost CO2) and emissions trading
has certainly evolved into the most efficient
market-based instrument to achieve this. Within
the European Union it is the main instrument
for cli mate protection — with an ever increasing
number of countries worldwide adopting this
approach. Despite the partly critical discussion
on the further development of emissions trading
in Europe, there is one aspect on which we can
be sure: Europe remains a pioneer and a model
for emissions trading. Although the current price
level appears to be too low to many, the market
is working: Emissions trading has delivered the
reduction targets, and CO2 emissions have fallen
significantly. Globally, Europe remains a pioneer
and role model in emissions trading. Govern-
ments worldwide use the design of the European
emissions trading system (ETS) as a template
when introducing their own trading systems.
However, long-term success will depend — to a
significant degree — on us as Europeans under-
standing the ETS as a market-based and consis-
tently European instrument, and further devel-
oping it as such. Instead of discussing possible
Market-based instruments
can support climate protection targets
adopted at the world climate conference.
Trading in emission allowances
is one of the mechanisms in which EEX
has many years of experience.

Management Report Visionen Gastbeitrag Corporate Responsibility Financial Report Den globalen Emissionshandel
mitgestalten
interventions in price levels, we must guarantee
free pricing and we need to determine ambitious
and long-term reduction goals. Rather than dis-
cussing proposals for purely national reforms,
we have to understand that the system can
only be developed further on the basis of joint,
supranational considerations.
EEX taking responsibilityEEX is an exchange with extensive experience
on the emissions market, and this commitment,
which dates back to 2005, is also reflected in
impressive figures: So far, more than 3.5 billion
emission allowances have been traded on EEX.
We have carried out more than 1,150 auctions
for 27 countries. More than 150 participants
are licensed to trade on this market. This does
not only testify to our experience but also to the
trust which the market and our customers place
in us.
For this reason, we are very pleased that, in a
tendering procedure in 2016, 25 EU member
states again commissioned us to carry out auc -
tions of new emission allowances on their behalf
for another five-year period. This supplements
the auctions for Germany, which we have carried
out since 2010. As a result and in combination
with the auctions for Poland, more than 90 per-
cent of the certificates auctioned in Europe reach
the market via EEX.
At the same time, we have single-mindedly ex -
panded our secondary market offering for emis-
sion allowances: by launching new products (e.g.
spread and option contracts), by acquiring new
partners as Market Makers that ensure liquidity
as a result of their constant presence in the order
book and through an attractive transaction fee
structure. This enables our trading participants
to fulfil their requirements in emissions trading
even more efficiently through the use of spot and
By means of primary market auctions, emission allowances are issued to the market for the first time.
23
At 309.5 million tonnes of CO2 , EEX almost tripled its volume on the EUA secondary market (2015: 105.9 million tonnes of CO2).
More than
1,150AUCTIONS
on behalf of
27EU MEMBER STATES
24 Annual Report 2016
derivatives products. This results in a constantly
growing number of active trading participants
and higher trading volumes on the EEX market.
Even today, EEX is well-prepared for the fourth
trading period. While, at a political level, the
design of the trading system from 2020 to 2028
is still being discussed, we have offered con-
tracts beyond 2020 since September 2016. The
response of the market is positive and the first
transactions have already been concluded. This
shows that — even in view of political uncer-
tainty — established market structures can safe-
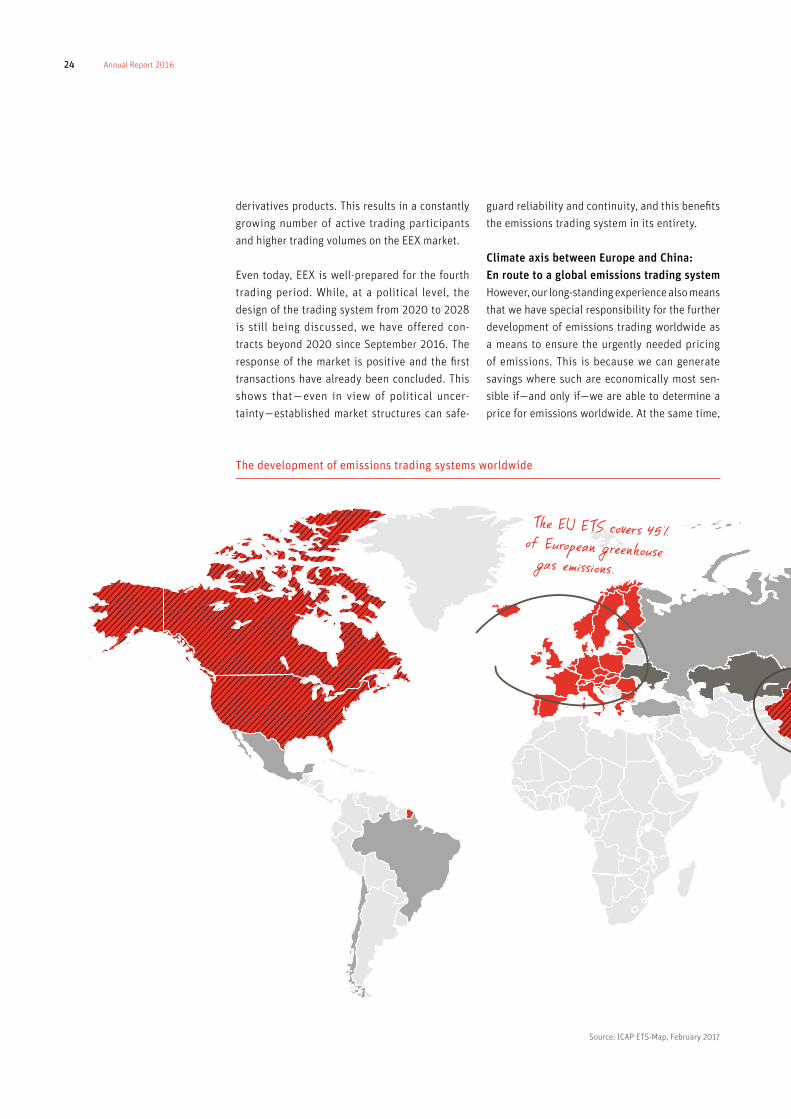
The development of emissions trading systems worldwide
guard reliability and continuity, and this benefits
the emissions trading system in its entirety.
Climate axis between Europe and China: En route to a global emissions trading systemHowever, our long-standing experience also means
that we have special responsibility for the further
development of emissions trading worldwide as
a means to ensure the urgently needed pricing
of emissions. This is because we can generate
savings where such are economically most sen-
sible if — and only if — we are able to determine a
price for emissions worldwide. At the same time,
Source: ICAP ETS-Map, February 2017
24
The EU ETS covers 45% of European greenhouse gas emissions.

25Management Report Visions Guest Contribution Corporate Responsibility Financial Report
this helps to simplify the emissions trading sys-
tems as such; because if there is a “level playing
field”, you can dispense with expensive balancing
mechanisms for industries in international com-
petition. For this reason, our long-term vision is a
global emissions trading system. A glance at the
map of the world shows that the world is coming
ever closer to reaching this target.
The launch of the national trading system in
China in 2017 forms an important milestone in
this direction. With an annual volume “cap” of
approximately 4 billion tonnes of CO2 (more than
The long-term vision – a global
emissions trading system
double the volume of the EU ETS — 1.8 billion
tonnes of CO2), the biggest emissions trading
system in the world will be created in China.
This means that the most significant producer
of greenhouses gases will now rely on a market-
based solution for limiting its emissions.
A close connection between the emissions mar-
kets in Europe and China is of central importance
since — as seen from the perspective of the mar-
ket participants — both markets already have
close interconnections and many companies
will be covered by the emissions trading sys-
tem in both regions as a result of their business
activities. Therefore, EEX not only supports the
development of new trading systems worldwide
but also actively promotes the integration of
these different systems.
We have operated as consultants in China for
some time and, for 2017, we plan to offer our
own products for the national Chinese emis-
sions trading system. In doing so, we will not
only offer our trading participants instruments
for price hedging for the European emissions
market but also for the Chinese emissions mar-
ket via one central platform. This is an offering
which we want to gradually expand in coopera-
tion with Chinese partners and, through this, link
the EU ETS with the Chinese ETS.
The climate conference in Paris has shown us that
the world is determined to limit global warm-
ing. Pricing of CO2 and, in particular, emissions
markets are prevailing as the means of choice
to ensure the required restriction of greenhouse
gas emissions. We should continue this course
and, at the same time, expand the links between
the trading systems. EEX is certainly ready and
willing to make its contribution to this historic
development.
1. Strengthening its position as an auction platform2. Expanding liquidity in secondary trading in emission allowances
3. Contributing to the development of ETS worldwide
“Level playing field” means that all participants on a market are subject to the same rules and conditions.
EEX targets:
Designing Global Emissions Trading
National trading system in China planned for 2017
Existing ETS
Existing ETS at a regional level
Planned ETS
ETS under discussion

26 Annual Report 2016
Our trading participants already operate far beyond Europe.With our products, such as freight and iron ore, we are further expanding our offerings to include commodities traded worldwide, aiming to meet our customers’ needs.
We support trading in energy and commodities along the entire value chain.

Openingglobal commodity markets
for European participants

28 Annual Report 2016
From an energy exchange to a commodity exchange Launched in 2014, the Global Commodities busi -
ness is the most recent addition to the EEX Group
product portfolio. Broadly speaking, we define
Global Commodities as any major seaborne bulk
commodity, i.e. iron ore, coal as well as freight
products. This can be further explained as the
product portfolio of Cleartrade Exchange (CLTX)
— part of EEX Group since 2014 — as well as ad -
ditional products listed at EEX. Essentially, the
reason we are active in this market is twofold:
> We aim to support our customers on
a global level
> We enable efficient risk management
throughout the supply chain.
Supporting our customers on a global level Commodity markets are globally connected and
often have correlations. Many of our customers
are not only active in one market. They no longer
wish to trade one asset class per exchange but
instead they require a much broader range of
trading possibilities in a single marketplace. By
launching our global commodities business, we
are supporting and enabling our customers to
trade and clear a broader portfolio of products
from a global perspective.
The global supply chain As you can see from the below sketch, the global
supply chain is interconnected, with each com-
modity being dependent on the next. By offer-
By expanding its product portfolio
with “global commodities”,
EEX offers its customers a broad range of products
at a global level.
Fertz
Freight
Agri
Emissions
FreightOil
Gas
Power
Steel
Iron Ore
Coking Coal
Scrap Freight
Freight
Coal
Fuel Oil
Freight
In 2016, CLTX became a wholly owned subsidiary of EEX.
”Dry Bulk Freight Market“ Transport costs on worldwide sea trading routes can be hedged through futures.

29
ing various commodities which complement
each other on one platform the exchange adds
value for the customers.
By entering into new commodities, not only are
EEX Group able to offer our customers a greater
level of trading possibilities, we are also en -
abling more efficient risk management at the
corporate level. By offering clearing of all prod-
ucts in one clearing house, it enables customers
to use their capital more efficiently by only post-
ing a single collateral position at ECC for several
of their trading positions (cross-margining).
Dry Bulk Freight — a significant step into Global CommoditiesThe ultimate aim of EEX Group is to be able to
provide our customers with a “one-stop-shop”
where they can trade their entire global port-
folio on one screen. Therefore, in order to com-
pete at a global level, with other commodity
exchanges, the dry bulk freight market was
tar geted as a key entry point into the Global
Commodities space. We found that the dry bulk
In the above example, a customer holds a purchase position in German power futures and a sales position in freight futures, both with delivery in 2017. If these positions are held in separate portfolios, the sum of the collateral to be deposited (on this day) would be EUR 229,861. If the positions are held in one portfolio, the opposite risks are offset. As a result, one net risk position is calculated which reduces the collateral to be deposited to an amount of EUR 150,272 which corresponds to a saving of 35%.
Management Report Visions Guest Contribution Corporate Responsibility Financial Report
Example Portfolio
EUR 229,861
Sum of
single
margins
EUR 150,272
After cross
Margining
Marging savings
EUR 79,624
35%
EUR 118,260
F1BY2017
EUR 111,601
CTCM2017
35%
Credit
Advantageous for companies with broad portfolios
Let’s take the example of a coal-fired power
plant: the operator can buy the coal for
operating their power plant on the deriva-
tives market of the exchange and thereby
secure a long-term price for the future de -
livery. The freight rates for the transport of
their goods can be hedged against future
price movements by freight futures. They
can also use the spot and futures market for
power to optimise their electricity produc-
tion both in the short term and long term.
Finally, they are able to fulfil their compli-
ance obligations from emissions trading
on the same platform.
Freight Emissions
Power
Coal
Opening Global Commodity Markets for European Participants
German Power Base Front Year (F1BY2017) 5 buy Capesize Time Charter Front Year (CTCM2017) 10 sell
Data from 31.10.2016

30 Annual Report 2016

31
freight market had the most potential to create a
bridge from the traditionally European member
base, EEX’s biggest customer base, to a globally
traded market with a new customer base in Asia.
This is due to the fact that the dry bulk freight
market consists of both European and Asian
players. Dry bulk freight futures are offered by
CLTX directly and EEX also offer these products
for Trade Registration on its platform. The future
contracts enable market participants to hedge
against volatile prices for freight rates, referring
to the transport of commodities in different sizes
and for different sea trade routes. This service
en ables the, primarily European, customers of
EEX to access the global freight markets. In the
Management Report Visions Guest Contribution Corporate Responsibility Financial Report
year 2016 12,655 contracts were registered for
clearing which indicates an interest from our
market participants in the use of these products.
Opening Global Commodity Markets for European Participants
CLTX — an important player in the EEX Group strategyThe acquisition and amalgamation of CLTX
into the EEX Group opens up an already
existing channel into Asia — one of the
most important global trading markets.
Headquartered in Singapore and initially
set up in 2010, CLTX is a regulated futures
exchange specialising in freight, ferrous
metals, agricultural and energy markets.
Regulated by the Monetary Authority of
Singapore (MAS) as an RMO, CLTX offers a
portfolio of futures and options contracts.
CLTX offers a trading platform, focused on
the execution of trades in a central order
book. A special feature of the platform is
its connection to several clearing houses
thereby offering its members the choice
of, and best possible execution for, every
trade. In addition, CLTX works closely with
brokers and supports them in brokering
business through their platform.
EEX Group can benefit greatly from CLTX’s
experience in global commodity markets,
regardless of whether the counterparties
want to take advantage of the liquidity
offered on CLTX’s order books or use their
broker to execute on their behalf. CLTX
will continue to develop as a specialist
business, providing a market dedicated
to managing shipping risk. This in turn
supports our customers’ needs for trading
across a variety of markets and geographic
zones.
In 2016,
in total
12,655 CONTRACTS
were registered
for clearing on EEX.

Expanding risk management for
agricultural products

33
In the agricultural segment, EEX already provides the leading derivatives market for dairy products and potatoes in Europe today.
We offer solutions for price hedging in the European agricultural markets.
For the further development of our markets, we rely on a close cooperation with the agricultural and food sector.
Expanding Risk Management for Agricultural Products

34 Annual Report 2016
How do agricultural products fit in with EEX as an energy exchange?The trading participants of EEX have also been
able to trade potatoes, dairy products and pigs
recently. How does this all fit together? Within
Deutsche Börse Group, EEX has the expertise in
commodity markets. The agricultural markets
are the biggest and oldest subcategory in com-
modity trading. For us, the agricultural busi-
ness is a strategically important component of
the evolution from being the leading energy
exchange in Europe to becoming a globally
operating commodity exchange. Even today, we
have customers operating in both market seg-
ments — energy and agriculture — for whom the
trading of all products on one platform makes
sense.
Agricultural markets — benefiting through exchange experience Since May 2015, agricultural derivatives con-
tracts for dairy products, processing potatoes
as well as for livestock and meat have supple-
mented the EEX product portfolio. Participants
from the agricultural and food sector use these
products for hedging against price fluctuations
on the physical markets. These price fluctua-
tions can have a wide range of causes: Prices
are created through the development of supply
and demand and are influenced by a number
of external factors — such as the weather, stock
levels, freight rates and commodity prices as
well as political interventions.
The advantages of exchange trading can be illus-
trated with the help of an example: A potato
farmer can assess the likely production output
in advance; however, there is uncertainty as
regards the future price at which the crop can
be sold. According to the European Processing
Potato Index, during the 2015/16 marketing sea-
son, the potato price ranged between EUR 11.00
per 100 kg and EUR 22.10 per 100 kg. EEX gives
producers and consumers the possibility to
trade anonymously and without any default risk
on a supervised and transparent market and to
hedge against price fluctuations — up to two har-
vest seasons in advance, in the case of potatoes.
For us, the agricultural segment is a strategically important element of further development—taking us from being the leading energy exchange in Europe to a globally operating commodity exchange.
Agricultural derivative contracts
have been recently added to the EEX portfolio.
We bring together the market segments
of energy and agriculturals to
develop a commodity exchange with global reach.
In 2016, a volume of
55,838 CONTRACTS
was traded
in the agricultural segment.
This corresponds to a
53% increase as against the 2015 volume
(trading on EEX was launched in May 2015).


36 Annual Report 2016
with various players have shown that this market
environment increases the awareness of the
need to use exchange hedging instruments. We
facilitate this development in our capacity as an
exchange operator by participating in various
education and training initiatives established by
our partners on the range of subjects regarding
the risk management of agriculture. For exam-
ple, in 2016, we supported events held by the
Kiel-based ife Institute of Food Economics and
Consumption Studies, the German Raiffeisen
Organisation, the Federal Bank for Agricultural
Development (Landwirtschaftliche Rentenbank)
as well as numerous exchange trading partici-
pants and agricultural brokers in this context.
The dialogue with our customers forms an essen-
tial component of our work in order to estab-
lish EEX as a contact and to develop the markets
together with the agricultural and food sector.
Furthermore, we are also in high demand among
expert groups in the political sector and industry
associations: In the past year, EEX was able to
relate its experience as an exchange ope rator in
numerous lectures and seminars.
Customers from the entire value chain of the
agricultural and food sector throughout Europe
trade on our market platform with trading usu-
ally taking place indirectly: Banks and brokers
bundle the customers’ trading interest on these
markets. The target customers include compa-
nies from the agricultural and food sector, such
as farmers, dairies, pig fatteners and other com-
panies from the agricultural industry that use
our contracts to hedge their price change risk in
the physical segment.
EEX satisfied with development in the agricultural segmentDuring the 2016 financial year, a volume of
55,838 contracts was traded in the Agricultural
segment. This corresponds to an increase of 53%
compared to the same period in 2015. In addi-
tion to the potato market which has already been
established, we are confident that we are on the
right track as regards the derivatives market for
dairy products: At 82,050 tonnes of commodity
equivalent in 2016, we generated the highest
an nual trading volume achieved by any exchange
operator in Europe so far. As early as at the be gin-
ning of May, the trading activities exceeded the
annual volume achieved in 2015. Our offering is
well received — the liquidity in Butter and Skimmed
Milk Contracts, in particular, has developed very
positively.
As a result of the increasing globalisation of the
market for milk and dairy products over the last
ten years, the participants in the industry are
facing increasing price volatility. Conversations
82,050 t TRADING VOLUME
on the dairy
derivatives market
As a result of increasing globalisation, participants will have to expect increasing price volatility on the markets.
Highest trading volume on a European derivatives market so far—
EEX’s position as the leading European derivatives market for dairy products strengthened

EEX a valued contact for expertsOn 6 June 2016, Peter Bleser, Parliamentary
Undersecretary at the German Federal Ministry
of Food and Agriculture, visited EEX in Leip-
zig. He exchanged experiences in agricultural
derivatives trading with the Market Supervision
Department and at an experts’ meeting.
OutlookWe are convinced that the demand for exchange
risk management instruments for the agricul-
tural sector in Europe will grow. Our focus is on
acquiring new customers for trading in the exist-
ing products. Over the coming years, we want to
further expand our offering in close cooperation
with the agricultural and food sector — both with
a view to the products offered and in terms of
geographic reach.
With regards to the derivatives market for dairy
products, the request for a liquid milk contract
has repeatedly been voiced. With the help of
butter and skimmed milk powder contracts on
EEX, “synthetic” hedging of liquid milk is already
possible today and there is an increasing num-
ber of producers using this hedge. In addition,
we are checking which conditions have to be
fulfilled in order to be able to offer a raw milk
contract on EEX.
In addition to exchange trading in dairy prod-
ucts, potatoes, livestock and meat, fertiliser con -
tracts are also part of the agriculture portfolio
which EEX exclusively offers as a clearing prod-
uct. The physical fertiliser markets have high
trading volumes, but the clearing of fertiliser
contracts (which we offer in cooperation with
CLTX) is still in its infancy. We also see de velop-
ment potential on these markets and are evalu-
ating how we can improve the integration of the
fertiliser markets into the existing agricultural
product portfolio.
The demand for exchange risk management tools for the agricultural sector will continue to grow in Europe.
37Expanding Risk Management for Agricultural Products
Management Report Visions Guest Contribution Corporate Responsibility Financial Report

38 Annual Report 2016
What causes the price volatility in milk?THIELE Higher price fluctuations on the global
dairy products market have been observed
since 2007. This is primarily due to supply
fluctuations caused by the increasing number
of extreme weather events and the strongly
increasing demand for dairy products on the
global market, which is also subject to signif-
icant fluctuations depending on the economic
and political situation. The influence of global
energy prices — with fluctuations in international
demand caused by the energy-exporting coun-
tries — has also increased significantly.
Will the price volatility in milk continue?THIELE Yes, the price volatility in dairy products
will probably even increase. It is conceivable
that the factors for the price fluctuations men-
tioned hereinabove might even lead to more pro-
nounced changes in the international demand
and supply of milk volumes. For example, ex -
treme weather conditions are expected to in -
crease. Moreover, the demand effects accompa-
nying international income fluctuations will also
have a bigger impact in the event of an increase
in the milk volume traded internationally. In this
context, it is important for the European dairy
markets that the international price fluctuations
are having an increasingly significant impact
on the EU dairy price changes as a result of
the liberalisation of the EU dairy market policy
since 2004. In addition to this, the global mar-
ket price level is higher. According to one of
our studies, the international price fluctuations
account for more than 80% of the fluctuations,
e.g. in the German dairy prices (ife Kiel, 2013).
PROF DR HOLGER D. THIELE, KIEL UNIVERSITY OF APPLIED SCIENCES
Milk Price Volatility
Higher price volatility in dairy products
on the global market for 10 years
6,000
5,000
4,000
3,000
2,000
1,000
0
’94 ’95 ’96 ’97 ’98 ’99 ’00 ’01 ’02 ’03 ’04 ’05 ’06 ’07 ’08 ’09 ’10 ’11 ’12 ’13 ’14 ’15 ’16
Butter Oceania Skimmed milk powder Oceania © ife Kiel 2016
in US-$ / t
Since the Oceanian region accounts for the highest share in global trading in dairy products, these prices are usually considered reliable indicators for the world market price structure in milk.
Price volatilityIN DAIRY PRODUCTS

39Management Report Visions Guest Contribution Corporate Responsibility Financial Report
PROF DR HOLGER D. THIELE
is a professor of
agricultural economics and statistics
at the Kiel University of Applied Sciences and
managing director of the
ife Institute of the Food Industry in Kiel.
His research and consulting focuses
are in cost analysis of the dairy chain,
fundamental analysis of the dairy markets
and risk management in milk,
as well as raw material assessment of milk.
He is the author of the
“Kiel commodity milk index”
designed in 2010 and of new industry indices
for the spot market,
as well as the European dairy market.
Further, the “Kiel exchange dairy price”
which is calculated every day and
based on EEX closing prices is also based
on his work and analyses.
How can exchange derivatives transactions help to reduce price volatility?THIELE In view of the high level of uncertainty re-
garding the future price developments, the pro f -
itability and, in particular, the liquidity risks of
the market participants on the dairy market are
increasing. So far, the sales price risk of the dairy
companies has largely been assumed by the
commodity producers — i.e. the dairy farmers.
Since their liquidity situation is increasingly
deteriorating because of high investment lev-
els, it becomes harder and harder for them to
assume this price uncertainty. Therefore, risk
management throughout the entire dairy value
chain needs to be reinforced. Due to the ex -
change derivatives transactions on butter and
skimmed milk powder, which is offered on EEX,
dairy plants and the food industry can assume
the entire price hedging for buyers and sell-
ers. The derivatives contracts for other indus-
tries show how these price hedging strategies
can be implemented for all market partners.
The potential for various models, e.g. including
premium contracts, is huge in this context. The
dairy plants can hedge buying prices for milk as
a commodity and future sales prices for dairy
products via exchange derivatives transactions
and calculate net utilisations to be expected. As
a result, milk producers can be given fixed milk
prices for several months ahead; that has not
been the case up until now.
Reinforced risk management
throughout the entire value chain for milk
is necessary.
In the case of premium contracts, the delivery date, volume and schedule are agreed. Finally, the price can be determined by the buyer within the time frame specified depending on the exchange price.
Expanding Risk Management for Agricultural Products
Milk price fluctuations
in Germany
determined by the global market
to an amount of
80%

40 Annual Report 2016
Guest ContributionCLIMATE PROTECTION
ON THE TRADING FLOOR
At the world climate conference in Paris, we decided to operate
on a climate-neutral basis in the second half of this century.
This will require a far-reaching transformation of our econo-
mies towards CO2-low technologies. In addition, the financial
flows will also have to be adjusted accordingly.
Of course, as the government, we specifically support climate-
friendly technologies. However, it is impossible for us to know
which reduction potentials can be exploited specifically in
which industries and companies. Therefore, we need a tech-
nology-neutral CO2 price instrument, such as the emissions
trading scheme (ETS). This creates the necessary framework
conditions for climate protection.
Important advantages of the ETS include its accuracy and
flexibility. Furthermore, it creates incentives for innovation,
investment and further reductions. Companies will consider
the CO2 price in their decisions and have the highest possi-
ble level of freedom regarding the question of how, when and
with the help of which measures they will implement emission
reductions. This requires market stability and reliable pric-
ing. At the same time, it guarantees that emission targets are
reached reliably and cost-effectively: an important precon-
dition for sophisticated climate protection. Emission allow-
ances are auctioned off — the revenue can be used to finance
measures in non-ETS sectors in a targeted way — in Germany,
all the auction revenue goes into our energy and climate fund.
With the EU Emissions Trading Scheme (EU ETS) launched
in 2005, we broke completely new ground. At the time, this
instrument was introduced as the first of its kind worldwide
with the aim of reducing greenhouse gas (GHG) emissions.
Since then, we have confirmed that economic growth and
emissions can be decoupled: While the EU GDP rose by more
than 44% from 2005 to 2012, GHG emissions declined by
19% with the decline amounting to as much as 24% from
2005 to 2014 in those sectors in which the ETS is mandatory.
This is certainly an important signal for other countries — in
particular, those growing quickly.
The experience gathered since 2013 has shown that a change
in the system towards auctioning as the standard allocation
method works. During this time of fundamental change, EEX
has proved to be a reliable partner. For this reason, we welcome
the renewal of the contract for EEX as the German auction
platform.
Furthermore, the EU ETS is to form a central tool for climate
protection in the energy sector and industries, including in
the future. Therefore, we want to sustainably strengthen it. It
was also thanks to EEX that important reform steps, such as
back-loading and the market stability reserve, could be taken.
By now, 17 emissions trading systems have been implemented
at the national or sub-national level worldwide. All of these
were based on the European system. Asian countries, such
as China and South Korea, in particular, have analysed the
EU ETS in detail, and adopted those elements which work
well — however, they have also learnt from our mistakes. For
years, Germany has cooperated closely with other countries
in order to support them in their emissions trading systems.
These international developments provide many opportuni-
ties for the further expansion and interlinking of emissions
FEDERAL MINISTER DR BARBARA HENDRICKS
The role of emissions trading in the
implementation of the Paris Convention

41Climate Protection on the Trading Floor
Management Report Visions Guest Contribution Corporate Responsibility Financial Report
trading systems. As a result of the Paris Convention, countries
now have to take specific measures to attain their nationally
determined climate protection contributions (NDCs), and these
have to be reviewed regularly — and improved upon if neces-
sary! Many countries provide for market mechanisms in order
to attain their NDCs; however, they have not yet specified
these. The Paris Convention permits cooperations between
countries with the aim of expanding ambitions. Correspond-
ing rules support the linking of emissions trading systems as
well as other CO2 pricing methods; this forms the basis of a
global carbon market.
For years, we have been dedicated partners in the Interna-
tional Carbon Action Partnership (ICAP) and the Partnership
for Market Readiness (PMR), a World Bank initiative, in order
to promote these processes through technical dialogues and
capacity building. Last year, we also established the Carbon
Market Platform to initiate a strategic dialogue on carbon
market developments.
During its G20 presidency, Germany will once again establish
climate protection and energy subjects at the highest political
level. This forms an important contribution to the attainment
of the aims of the Paris Convention. In this way, we want to
promote the global expansion of CO2 pricing methods. Fur-
thermore, we will continue the work of the Green Finance
Study Group (set up by China) and prepare a framework for
a financial market system facilitating investments in climate
neutral and resilient technologies. This will also be of funda-
mental importance for EEX as an energy exchange and trading
platform.
DR BARBARA HENDRICKS
Dr Barbara Hendricks has been
the Federal Minister for the Environment,
Nature Conservation, Building and Nuclear Safety
since December 2013.
As a post-graduate with a PhD in the fields
of history and social science,
she joined the SPD in 1972. Within the party,
she was previously the spokeswoman for
the minister of finance of North Rhine-Westphalia.
During her term of office as the chairwoman
of the SPD sub-district of the district
of Kleve from 1989 to 2014,
she was also responsible for
border-crossing plans, in addition,
in her capacity as the undersecretary
at the Ministry for the Environment,
Regional Planning and Agriculture of the state
of North Rhine-Westphalia.
Dr Hendricks was also the parliamentary
undersecretary at the Federal Ministry
of Finance from 1998 to 2007.
As a member of the Federal Executive Committee
of the Social Democratic Party, she was the
treasurer of the federal SPD from 2007 to 2013.
Dr Hendricks has been a member
of the German Bundestag since 1994.
“International developments
provide numerous opportunities
for future expansion and connection
of emissions trading systems.”
DR BARBARA HENDRICKS
41

42 Annual Report 2016
CorporateRESPONSIBILITY
INTERNATIONAL
At present, more than
400 employees work at the
15
international sites
of EEX Group with
approximately
200
employees working at our
headquarters in Leipzig.
DIVERSITY
We respect people of every
age and gender, irrespective
of their family background,
religious beliefs or sexual
orientation.
TRANSPARENCY
Open dialogue with our
employees is very important
to us. Therefore, we promote
an active exchange between
the employees of all hierarchy
levels.
COMMITMENT
Social commitment
is close to our hearts:
We support projects in
the fields of education,
social aspects and ecology.
CUSTOMER ORIENTATION
Our ultimate aim is to provide added value for our customers.
To this end, we engage in ongoing dialogue with our trading
participants and partners to further develop our offering together
with them.
We place a high value on sustainable
corporate management. In our day-to-day work,
we protect the environment and its resources, in addition
to supporting various social projects in and around Leipzig
within the framework of our sponsorship concept.
However, our employees are always
at the centre of our activities:
We support the compatibility of family life and career
and promote our colleagues’ health
with numerous offers.
43Corporate Responsibility
Management Report Visions Guest Contribution Corporate Responsibility Financial Report
TEAM ORIENTATION
We also cooperate very efficiently, effectively and closely,
across different departments. In order to safeguard a good
working atmosphere, we provide a setting in which we get
to know our colleagues better (outside the day-to-day work
routine) at our annual team event.
ATHLETICS
In addition to various
corporate sports groups for
football, beach volleyball
and bad minton — as well as
running groups and the boot
camp — we also successfully
take part in various local
sports events, such as the
Company Run in Leipzig.
FLEXIBILITY
In most departments, our
employees can make use
of the flexitime model with
regard to their working hours.
In addition to this, we also
support individually tailored
working hour models.
CONFIDENCE
Our colleagues are experts
in a wide range of subjects.
They assume responsibility
for specific objectives and
projects and can autonomous -
ly promote their implemen-
tation.
INDIVIDUALITY
We support employees in
their personal career plan-
ning by offering perform-
ance-based remuneration
packages, attractive fringe
benefits and temporary
assignments abroad.
RESPONSIBILITY
Our teams are the motor of our
success and, therefore, we
provide numerous additional
offerings to ensure that our
colleagues enjoy working with us.
SUSTAINABILITY
Our sustainability working
group constantly develops
our commitment for corporate
management as well as the
protection of the environment
and its resources.
HEALTH CONSCIOUSNESS
During our annual health day, we provide numerous offers
regarding health and well-being. We also support our
employees with fresh fruit every day — and provide regular
health check-ups. We also promote the fitness of our
employees through various sports events, such as our
boot camp or back training.
WORK-LIFE-INTEGRATION
We provide support for the
employees in finding suitable
child care and, in emergencies,
we also facilitate childcare at
work in our dedicated family
room “Entenhausen”.
FAMILY FRIENDLINESS
In 2016, we were awarded
the title of a “Family-Friendly
Company” within the frame-
work of the “audit berufund-
familie”.

44 Annual Report 2016
Social commitment — a broad field: Holger, what role do these activities play in your life and what is your personal contribution?GOLDAMMER As an athlete, I have benefitted
from voluntary commitment over a long period;
I took the conscious decision to do something
for children and young people ten years ago.
Junior athletes frequently do not have the pos-
sibilities — or means — to put their own wishes
into practice. For this reason, together with some
friends, I founded the first speed and inline skat-
ing association in Leipzig, which has so far taught
several hundred children how to inline skate. As a
result of our initiatives and donations, two skat-
ing tracks providing traffic-free and safe skating
have been built in Leipzig. At least once a week,
I coach 20 children and convey the enjoyment of
physical exercise. After the training, there is also
office work to be done — since I am also in charge
of finances within the divisional management of
our association.
In 2016, which EEX sports and social activities did you take part in and why?GOLDAMMER I took part in the Company Run,
the Team Run, the Heart Race and the EEX Social
Day. In general, lots of team members take part
in all of these events. We have to work hand in
hand and, in part, closely together to achieve
our joint aim as a team. The Team Run as well as
the joint work at the centre for donations in kind
during our Social Day are good examples of this.
The Heart Race draws a lot of attention to organ donation. What was the special thing about this as far as you are concerned?GOLDAMMER The Heart Race organisation award-
ed our group the title of the “team with the most
international participants”. This highlights how
much the EEX Group has evolved and that we
can actually come together through sports. At the
same time, we were also able to raise the aware-
ness of the importance of organ donation — both
among ourselves and among the spectators lin-
ing the streets. Ultimately, for me as a former
competitive athlete, it was certainly fascinating
to take my body to the limit once again after a long
break. Sore muscles to support a good cause — this
certainly makes it all the more worthwhile!
Heart Race
“La course du coeur” is a charity race in
France raising awareness of organ dona -
tion. Over a period of 4 days and 4 nights,
14 EEX Group team members covered
a distance of 750 km across France —
on foot, by bike or on in-line skates.
HOLGER GOLDAMMER, SENIOR EXPERT ACCOUNTING & TAX
Social commitmentAT EEX
Why making an active contribution is also important
for us as private individuals, how success feels
and why joint activities make the EEX team even better.

45Social Commitment at EEXManagement Report Visions Guest Contribution Corporate Responsibility Financial Report
Regarding the Social Day: What is your position on this? In your opinion, what personal and social benefit does this create? What do you think the difference is versus regular EEX team events?GOLDAMMER Due to my own voluntary commit-
ment, I understand how non-profit organisations
work, I know their motives — as well as their
problems. Therefore, it is always very helpful
for such initiatives and associations when there
is a big group of supporters that does work
wherein the few available volunteers would
otherwise have to spend a lot of their free time.
In this way, certain objectives can be reached
quickly — together. Personally, I like to choose
projects that directly or, at least, indirectly,
concern children and young people. Over the
last two years, the focus has been on projects
dealing with the integration of refugees and on
coping with the challenges resulting from this.
Finally, it is also wonderful to meet again as a
big group after the day’s work and discuss our
experiences during the day.
Holger Goldammer joined EEX in January 2012.
The EEX Group team at the last stage of the Heart Race.

46 Annual Report 2016
The team event aims to facilitate closer
cooperation between the employees of
various departments. While the activities
take place in smaller groups throughout
the day, all colleagues traditionally get
together again later to spend a pleas-
ant evening together and to get to know
each other better outside their day-to-
day work routine.
TEAM EVENT
COMMUNITY
Together FOR A SUSTAINABLE
COMPANY
In 2016, ECC celebrated its 10th
anniversary. On this occasion, it
hosted a great birthday party for
employees and business contacts,
at which it celebrated the success
achieved so far and raised a toast
to future cooperation.
Once a year, the focus is on the subject of health.
Our employees can learn more on subjects like
stress reduction, health in the workplace and
healthy diet in various workshops and lectures
while becoming more active in the context of
sport offerings.
HEALTH DAY
10-YEAR ANNIVERSARY OF ECC
Making a contribution with commitment and team spirit —
our campaigns in 2016

47Together for a Sustainable Company
Management Report Visions Guest Contribution Corporate Responsibility Financial Report
The Leipzig Companies Run and the “Sachsenbeach” beach
volleyball tournament have long since become a tradition with
the sports enthusiasts among our staff. In 2016, an EEX team
also took part in the Dragon Boat Race — and in the first attempt,
our team was able to overtake six other teams.
EEX presented its Excellence
Award for outstanding scientific
theses for the fifth time in 2016.
Many of the theses submitted
dealt with the trends and inno-
vations on the energy markets.
The award was presented to five
winners from Germany and the
United Kingdom.
Climbing the three highest
peaks in England, Scotland
and Wales within 24 hours —
some of our colleagues again
accomplished this feat this
year. The event supports the
“Havering Mind” association
promoting mental health for
people aged 50 and over.
We held our team event as a “Social Day” for the third
time. On this occasion, our colleagues helped out in
various social facilities taking part in craft activities
and also working directly with home residents.
In 2016, our colleagues
again fulfilled the Christmas
wishes of children living
in Leipzig children’s homes.
We received more than
200 wish lists within this
initiative, and we were
delighted to see so many
smiles on the children’s
faces.
SPORTING SPIRIT
SOCIAL DAY
CHRISTMAS WISH TREE EXCELLENCE AWARD
THREE PEAKS CHALLENGE
TEAM
COMMITMENT

Annual Report 2016
FOR THE FINANCIAL YEAR 2016
CONSOLIDATED MANAGEMENT REPORT
1 GROUP OVERVIEW AND BASIC INFORMATION 50
Business activities and group structure 50
Strategy and group management 54
Research and development 56
2 ECONOMIC POSITION 57
Macro-economic, industry-specific and regulatory framework conditions 57
Business development 60
Earnings position 68
Asset position 70
Financial position 72
Employees 73
General statement on the economic position by the Management Board 74
3 RISK AND OPPORTUNITIES REPORT 75
Risk management 75
Essential risks 77
Essential opportunities 85
General statement on the risk and opportunities position 86
4 OUTLOOK REPORT 87
Comparison of earnings position with forecast for 2016 87
Outlook for the 2017 financial year 87
Overall statement on the future development of EEX Group 88
5 EEX AG (NOTES BASED ON HGB [GERMAN COMMERCIAL CODE]) 89
Business and general framework 89
Earnings position 89
Asset position 92
Financial position 94
Employees of EEX AG 94
Risk and opportunities report 94
Outlook report 94
Other notes 95
6 POST REPORTING DATE EVENTS 95
7 OTHER NOTES 96
Rounding differences of ± one unit may occur in tables for arithmetical reasons.

BUSINESS ACTIVITIES AND GROUP STRUCTURE
BUSINESS MODEL
The European Energy Exchange AG (EEX), having its regis-
tered office in Leipzig, Germany, is Europe’s leading energy
exchange and a member of Deutsche Börse Group. It was es tab-
lished in 2002 as a result of the merger of two German power
exchanges in Frankfurt / Main and Leipzig. Since then, it has
evolved from its origins as a pure power exchange to become
a leading trading platform for energy and related products
with international partnerships. As at 31 December 2016, EEX
Group had 15 offices in Amsterdam, Berlin, Bern, Brussels,
Copenhagen, Leipzig, London, Luxembourg, Madrid, Milan,
Oslo, Paris, Prague, Singapore and Vienna, and employed a
total of 453 employees.
EEX Group develops, operates and interconnects secure, liquid
and transparent markets for energy and commodity products.
Clearing and settlement of all transactions are provided by
European Commodity Clearing AG (ECC), a wholly-owned sub-
sidiary of EEX. EEX Group pursues a “one-stop-shop” business
model, offering customers efficient and cost-effective services
ranging from exchange trading, clearing and settlement to
special services, such as market and transparency data as
well as data reporting services — all from one source.
Business Areas of the EEX AG 1
Power Spot Power Derivatives Natural Gas Environmental Products Agriculturals Global Commodities
Clearing Services
Market Data Services
1 GROUP OVERVIEW AND BASIC INFORMATION
EEX Group relies on a business model which achieves en hanced
flexibility, increasing market coverage and higher volumes,
e.g., through co-operations and partnerships. Through these
consistently expanding co-operative relationships, EEX makes
a decisive contribution towards the integration of European
energy markets. Its flexible structure, consisting of special-
ised companies for different markets with sites in different
countries, ensures close contact with the market, as well as
optimum local support for customers.
BUSINESS AREAS AND PRODUCT PORTFOLIO
Generally, exchange trading is differentiated into spot and
derivatives markets. Trading transactions concluded on the
spot market are settled physically, at the latest two days after
their conclusion. As a result, the spot market facilitates the
short-term optimisation of procurements and sales. On the
other hand, trades concluded on the derivatives market are
settled physically or financially at a later point in time which
is agreed in advance. As such, the derivatives market permits
the optimisation of medium to long-term portfolios.
In addition to exchange trading, transactions can also be re -
gistered for clearing (Trade Registration). As a result, trading
participants can register transactions concluded off the ex -
change, on the exchange and have these settled via ECC. There -
fore, the participants benefit from standardised processes and
protection against payment and / or delivery default.
In terms of organisational structure, the EEX Group offering is
divided into six commodity-specific and two cross-commodity
business areas:
EEX Group has more than 15 offices
with a total of 453 employees
50 Annual Report 2016

Management Report Visions Guest Contribution Corporate Responsibility Financial Report Consolidated Management Report
Group Overview and Basic Information
Products for Trading and Clearing 2
Power Spot > Intra-day and Day-ahead products for Germany, France, Austria, Switzerland, Belgium, the Netherlands and the United Kingdom
> Day-ahead products for Serbia > Capacity certificate products for France > Market coupling products and services to Transmission
System Operators > Tender services in the Czech Republic
Power Derivatives
> Futures and Trade Registration services for Germany / Austria, France, Italy, Spain, the Netherlands, Belgium, Switzerland, the United Kingdom, the Nordic countries, Poland, the Czech Republic, the Slovak Republic, Hungary and Romania
> Trade Registration services for Greece > Options for Germany / Austria, France, Italy and Spain > “Energiewende” products: Intraday Cap Futures
and Wind Power Futures
Natural Gas > Spot- and derivatives products and Trade Registration services for Germany (GASPOOL, NCG market areas), France (PEG Nord, TRS), the Netherlands (TTF), Belgium (ZTP, ZEE), the United Kingdom (NBP), Denmark (ETF), Austria (CEGH) and the Czech Republic (CEGH CZ)
> Derivatives products and Trade Registration services for Italy (PSV)
Environmental Products
> Spot and derivatives products for secondary trading in emission allowances (EU Emission Allowances — EUA; EU Aviation Allowances — EUAA; Certified Emission Reductions — CER)
> Spot primary market auctions for emission allowances (EUA, EUAA) for 27 EU member states
> Guarantees of origin for hydroelectric power from Scandinavia and the Alpine region and guarantees of origin for wind power from the North Sea region
Agriculturals > Futures on butter, skimmed milk powder and whey powder > Futures on European processing potatoes > Futures on piglets and hogs > Futures on fertilisers
Global Commodities
> Futures on freight rates and container capacities > Futures on fuel oil > Futures on iron ore (iron ore and steel) > Futures on coal > Options on freight rates
The most important business areas for EEX Group are the spot
and derivatives markets for power and natural gas. Approxi-
mately 80% of EEX Group’s sales revenue is generated through
trading and clearing the products offered in these business
areas and the provision of related services.
Within the commodity-specific business areas, the following
products are offered for trading and clearing — primarily in
Europe but also increasingly in Asia:1
The cross-commodity business areas primarily offer the fol-
lowing services:Tab 3
GROUP STRUCTURE
EEX AG offers derivatives trading in coal and freight as well
as guarantees of origin. It operates the Market Data Services
business area for all companies based in Germany and pro-
vides the technical application landscape for these companies’
customers. It also works in the area of service level agree-
ments as a central service-provider for its subsidiaries.
Further, through ECC and its subsidiary European Commodity
Clearing Luxembourg S.à.r.l. (ECC Lux), EEX Group has a clear-
ing house operating throughout Europe. Its range of services
comprises clearing and settlement for exchange transactions
and transactions registered for clearing on the connected
exchanges, as well as operation of the Clearing Services busi-
ness area.
The trading services of the power derivatives segment (except
for Eastern Europe) are focussed within EEX Power Deriva-
tives GmbH (referred to as EPD below). Trading services for
environmental products (except for guarantees of origin) are
provided by Global Environmental Exchange GmbH (GEEX);
corresponding services for agricultural products (with the
exception of fertilisers) are provided by Agricultural Commod-
ity Exchange GmbH (ACEX).
1 Products generating highest sales in each of the power spot, power derivatives and natural gas business areas respectively are underlined.
Services 3
Clearing Services
> Provision of infrastructure and services for execution of clearing and settlement of trades in the above-mentioned business areas
> Risk management services > Clearing services for partner exchanges that are not
part of EEX Group: · HUPX (spot and derivatives market for power in Hungary) · NOREXECO (derivatives market for pulp and paper)
Market Data Services
> Services in connection with EEX Group trading data > Services in connection with generation, storage
and consumption data in the area of power and gas > Services in the area of data reporting and regulatory
reporting
51

In the 2016 financial year, EEX Link GmbH (EEX Link) com-
menced operations. EEX Link provides services with the aim
of bundling liquidity between regulated exchange markets for
power and gas and another category of market platforms —
designated as non-MTF markets. Further details can be found
in the sections “Macro-economic, industry-specific and regu-
latory framework conditions” as well as “Essential risks” below.
France-based EPEX SPOT SE (EPEX) and its partially integrated
Dutch subsidiary APX Holding B.V. (APX) is the leading Euro-
pean power spot exchange and is part of EEX Group. It provides
trading and market data services for the power spot business
area (with the exception of the Czech Republic). EPEX also
provides market coupling services to Transmission System
Operators and exchange services to other power exchanges in
Serbia, Hungary, Slovakia and Ireland. EPEX also owns 25%
of the shares in the South Eastern European Power Exchange
(SEEPEX), an exchange that operates a spot market with deliv-
ery in Serbia.
Following the merger of EPEX and APX, 100% of the shares in
the Dutch company APX Shipping B.V. were transferred to EEX.
Together with its subsidiaries, the French company Powernext
SA (Powernext) provides trading services as well as market data
services within the natural gas business area (except for the
Czech Republic). In the 2016 financial year, Powernext
acquired 100% of the shares in the Danish entity Gaspoint
Nordic A / S (Gaspoint Nordic) from EEX, after EEX had ini-
tially purchased the remaining 50% of the shares in Gaspoint
Nordic. Furthermore Powernext, together with the Austrian
Central European Gas Hub AG (CEGH), established the PEGAS
CEGH Gas Exchange Services GmbH (PCG) subsidiary, which
operates the Austrian gas market. Powernext holds 51% of the
shares in PCG. In addition, Powernext operates the French
registry of guarantees of origin for power and is therefore also
active in the Environmental Products business area.
During the 2016 financial year, EEX acquired the remaining
48% of the shares in Cleartrade Pte Ltd. (CLTX) and is now
the sole shareholder of that company. This derivatives mar-
ket operator, regulated by the supervisory authority in Singa-
pore, offers a global electronic market platform for commod-
ity derivatives, such as freight, iron ore, coal, fertiliser, steel
and container contracts. As a result, it essentially operates
the Global Commodities business area in conjunction with
EEX. Moreover, with its fertiliser futures, CLTX also operates
within the Agriculturals business field.
In the 2016 financial year, EEX acquired, in total, two thirds
of the shares in the Czech Power Exchange Central Europe a.s.
(PXE). PXE operates the power spot, power derivatives and
natural gas business fields in the Czech Republic and other
eastern European countries and, in addition, also offers Market
Data Services for these products.
In addition, EEX holds a 20% interest in European Market
Coupling Company GmbH i.L. (EMCC), a company which pro-
vided market coupling for power between the Central West
Europe region and Scandinavia until mid-2014, as well as a
12% interest in store-x Storage Capacity Exchange GmbH i.L.
(store-x), an online platform for the trading of natural gas
storage capacities. As at the reporting date, both entities are
in liquidation.
52 Annual Report 2016

Management Report Visions Guest Contribution Corporate Responsibility Financial Report Consolidated Management Report
Group Overview and Basic Information
SHAREHOLDER AND OWNERSHIP STRUCTURE
The subscribed capital of EEX consists of 40,050,000 regis-
tered no-par shares with a calculated nominal value of EUR 1
per share.
In 2011, Eurex Zurich AG became a majority shareholder in
EEX AG with a current shareholding of 62.82%. It is the only
shareholder which holds an interest of more than 10% in the
capital of the company. Tab 4
As at the reporting date (31 December 2016), EEX held its own
shares corresponding to a calculated share of EUR 58,498 in
the nominal capital.
At an extraordinary annual meeting of EEX held on 16 Decem-
ber 2016, it was resolved to increase the nominal capital
of EEX from EUR 40,050,000 to up to EUR 60,075,000 by
means of a cash contribution of up to EUR 20,025,000. The
nominal capital was increased in return for the issue of up
to 20,025,000 new, registered no-par value shares as non-
voting preferential shares. During the subsequent subscrip-
tion period, all new preferential shares were subscribed to by
shareholders of EEX. With the capital increase and associated
amendment of the articles of association having been regis-
tered in the commercial register on 10 February 2017, the
nominal capital of EEX comprises EUR 60,075,000 EUR, di -
vid ed into 40,050,000 registered, voting, no-par value shares
(“ordinary shares”) and 20,025,000 registered, non-voting no-
par value shares (“preferential shares”).
CORPORATE MANAGEMENT
As a German public limited company, EEX is comprised of the
following statutory bodies / functions: the annual general meet -
ing, the supervisory board and the management board, each
with their own competencies.
At the annual general meeting, the members of the Supervis-
ory Board are appointed, resolutions approving the activities
of the Management Board and of the Supervisory Board are
adopted and decisions are made on the distribution of bal-
ance sheet profit.
The Supervisory Board appoints, monitors and advises the
Management Board and is directly involved in decisions which
are of fundamental importance to the company. It also adopts
the annual financial statement prepared by the Management
Board. At present, the Supervisory Board has 18 members, each
with a term of office of three years.
The Management Board manages the company and is coordi-
nated by the Chief Executive Officer (CEO). The CEO represents
the company publicly and also has a leading role in verbal and
written communications with the Supervisory Board.
As at 31 December 2016, the Management Board of EEX con-
sisted of seven members: in addition to the Chief Executive
Officer (CEO), a Chief Financial Officer (CFO), a Chief Operations
EEX shareholders (as at 31 December 2016) 4
Shareholder Country Shareholding
Eurex Zürich AG CH 62.82%
50Hertz Transmission GmbH D 8.66%
LVV Leipziger Versorgungs- und Verkehrsgesellschaft mbH D 7.38%
Uniper Global Commodities SE D 5.67%
Free State of Saxony D 4.51%
EnBW Energie Baden-Württemberg AG D 3.30%
Enel Trade S.p.A. I 2.17%
MVV Energie AG D 0.99%
Edison S.p.A. I 0.76%
EDF Électricité de France F 0.67%
VERBUND Trading GmbH A 0.67%
DB Energie GmbH D 0.50%
Iberdrola Generación España, S.A.U. E 0.50%
Morgan Stanley Capital Group Inc. UK 0.50%
Naturkraft Energievertriebsgesellschaft m.b.H. A 0.50%
SWU Energie GmbH D 0.25%
City of Leipzig D 0.01%
Own shares of European Energy Exchange AG D 0.15%
53
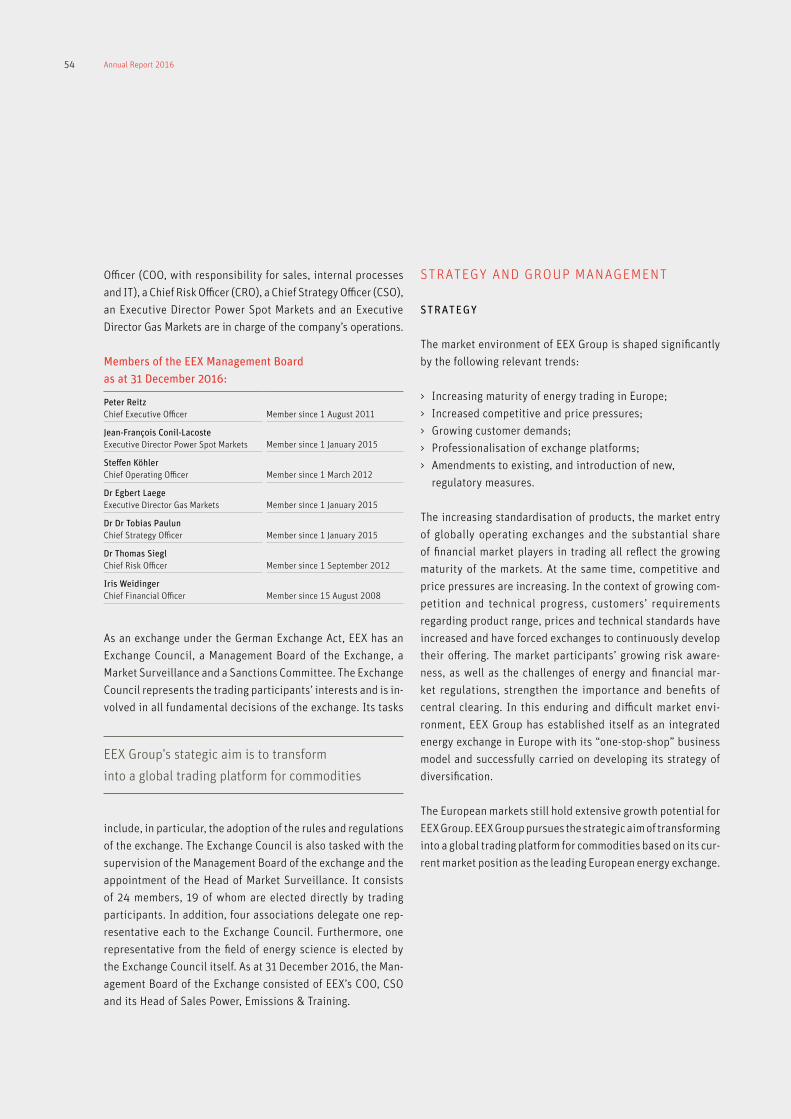
Officer (COO, with responsibility for sales, internal processes
and IT), a Chief Risk Officer (CRO), a Chief Strategy Officer (CSO),
an Executive Director Power Spot Markets and an Executive
Director Gas Markets are in charge of the company’s operations.
Tab5
As an exchange under the German Exchange Act, EEX has an
Exchange Council, a Management Board of the Exchange, a
Market Surveillance and a Sanctions Committee. The Exchange
Council represents the trading participants’ interests and is in -
volved in all fundamental decisions of the exchange. Its tasks
include, in particular, the adoption of the rules and regulations
of the exchange. The Exchange Council is also tasked with the
supervision of the Management Board of the exchange and the
appointment of the Head of Market Surveillance. It consists
of 24 members, 19 of whom are elected directly by trading
participants. In addition, four associations delegate one rep-
resentative each to the Exchange Council. Furthermore, one
representative from the field of energy science is elected by
the Exchange Council itself. As at 31 December 2016, the Man-
agement Board of the Exchange consisted of EEX’s COO, CSO
and its Head of Sales Power, Emissions & Training.
Members of the EEX Management Board
as at 31 December 2016: 5
Peter Reitz Chief Executive Officer Member since 1 August 2011
Jean-François Conil-Lacoste Executive Director Power Spot Markets Member since 1 January 2015
Steffen KöhlerChief Operating Officer Member since 1 March 2012
Dr Egbert Laege Executive Director Gas Markets Member since 1 January 2015
Dr Dr Tobias Paulun Chief Strategy Officer Member since 1 January 2015
Dr Thomas SieglChief Risk Officer Member since 1 September 2012
Iris WeidingerChief Financial Officer Member since 15 August 2008
STRATEGY AND GROUP MANAGEMENT
STRATEGY
The market environment of EEX Group is shaped significantly
by the following relevant trends:
> Increasing maturity of energy trading in Europe;
> Increased competitive and price pressures;
> Growing customer demands;
> Professionalisation of exchange platforms;
> Amendments to existing, and introduction of new,
regulatory measures.
The increasing standardisation of products, the market entry
of globally operating exchanges and the substantial share
of financial market players in trading all reflect the growing
maturity of the markets. At the same time, competitive and
price pressures are increasing. In the context of growing com-
petition and technical progress, customers’ requirements
regarding product range, prices and technical standards have
increased and have forced exchanges to continuously develop
their offering. The market participants’ growing risk aware-
ness, as well as the challenges of energy and financial mar-
ket regulations, strengthen the importance and benefits of
central clearing. In this enduring and difficult market envi-
ronment, EEX Group has established itself as an integrated
energy exchange in Europe with its “one-stop-shop” business
model and successfully carried on developing its strategy of
diversification.
The European markets still hold extensive growth potential for
EEX Group. EEX Group pursues the strategic aim of transforming
into a global trading platform for commodities based on its cur-
rent market position as the leading European energy exchange.
Tab 6
EEX Group’s stategic aim is to transform
into a global trading platform for commodities
54 Annual Report 2016
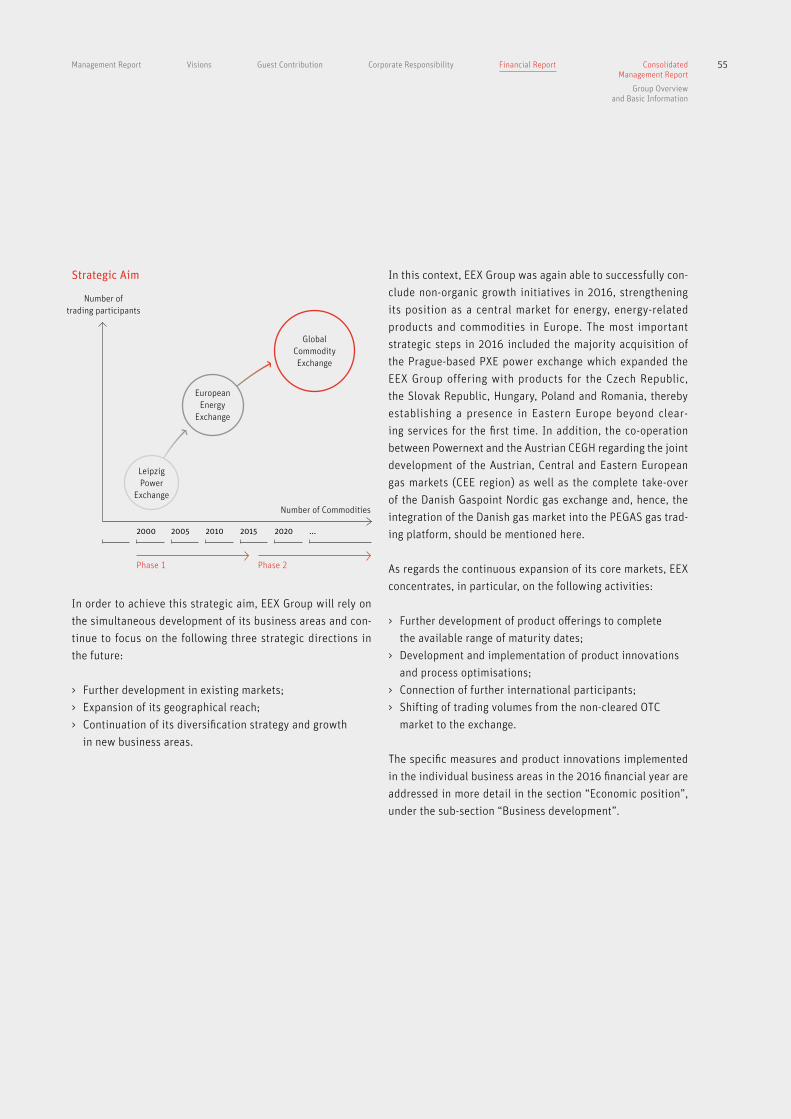
Management Report Visions Guest Contribution Corporate Responsibility Financial Report Consolidated Management Report
Group Overview and Basic Information
Strategic Aim 6
Number of Commodities
Number of trading participants
LeipzigPower
Exchange
European Energy
Exchange
Global Commodity Exchange
In order to achieve this strategic aim, EEX Group will rely on
the simultaneous development of its business areas and con-
tinue to focus on the following three strategic directions in
the future:
> Further development in existing markets;
> Expansion of its geographical reach;
> Continuation of its diversification strategy and growth
in new business areas.
In this context, EEX Group was again able to successfully con-
clude non-organic growth initiatives in 2016, strengthening
its position as a central market for energy, energy-related
products and commodities in Europe. The most important
strategic steps in 2016 included the majority acquisition of
the Prague-based PXE power exchange which expanded the
EEX Group offering with products for the Czech Republic,
the Slovak Republic, Hungary, Poland and Romania, thereby
establishing a presence in Eastern Europe beyond clear-
ing services for the first time. In addition, the co-operation
between Powernext and the Austrian CEGH regarding the joint
development of the Austrian, Central and Eastern European
gas markets (CEE region) as well as the complete take-over
of the Danish Gaspoint Nordic gas exchange and, hence, the
integration of the Danish gas market into the PEGAS gas trad-
ing platform, should be mentioned here.
As regards the continuous expansion of its core markets, EEX
concentrates, in particular, on the following activities:
> Further development of product offerings to complete
the available range of maturity dates;
> Development and implementation of product innovations
and process optimisations;
> Connection of further international participants;
> Shifting of trading volumes from the non-cleared OTC
market to the exchange.
The specific measures and product innovations implemented
in the individual business areas in the 2016 financial year are
addressed in more detail in the section “Economic position”,
under the sub-section “Business development”.
20001995 2005 2010 2015 2020 ...
Phase 1 Phase 2
55

MANAGEMENT CONTROL
Essentially, EEX Group uses the parameters of annual net pro fit,
earnings before tax (EBT) or earnings before interest and tax
(EBIT), as well as (net) sales revenue and fix costs, as the main
factors for all group companies to indicate corporate success.
Net sales revenue consists of transaction revenue, other sales
revenue, other operating income and variable costs. In this
context, the main focus is on transaction revenue and variable
costs. Transaction revenue comprises variable fees which are
generated on the basis of the trading and clearing volumes
realised. The variable costs correlate with the amount of the
transaction fees and essentially include performance-related
reimbursements for certain market participants, such as mar-
ket makers, brokers or liquidity providers. Furthermore, some
IT, index and balancing group contracts contain sales- or vol-
ume-based components which are part of the variable costs.
All costs which are not directly linked to the amount of the
transaction fees are defined as fix costs. As regards fix costs,
the Group essentially differentiates between staff expenses,
depreciation / amortization and other operating costs.
Approximately 86% of the total costs of EEX Group are fix costs
(2015: 87%). As a result of this cost structure, EEX Group can
generate economies of scale and therefore satisfactorily settle
additional trading volumes without a significant increase in
total costs. This is confirmed by a growing EBT margin (ratio
of EBT to gross sales revenue) and applies, in particular, to
established products and markets. In the past, economies of
scale were largely observed on the power derivatives market.
New or less developed products and markets, on the other
hand, require long-term investment, meaning that no or lower
economies of scale can be achieved initially in respect of them.
The high share of fix costs, on the other hand, also means that
a decline in business volumes has a direct negative impact on
the profitability of the Group.
Due to the considerable share of non-controlling interests
within the Group result generated, the controlling parameters
of the “adjusted EBT” and “adjusted Net Income” have been
used at a Group level since January 2015, in addition to the
parameters mentioned above. These refer to the result figures
of EEX Group according to International Financial Reporting
Standards (IFRS) and adjusted for the following two aspects:
> Transaction-related one-off effects;
> Profit shares (before tax) of non-controlling interests.
The corresponding values of the parameters for 2016 are
explained in the section “Earnings position”. Forward-looking
state ments on the parameters are provided in the “Outlook
report” section.
EEX Group has an internal control system (ICS) which ensures
process reliability and indirectly helps to attain the corporate
aims. The ICS has been duly set up and is monitored by the
Internal Auditing Department. Critical and important opera-
tional events are reported to the Management Board and the
Supervisory Board regularly — and, if required, ad hoc (see
also the chapter “Risk management” in this regard).
RESEARCH AND DEVELOPMENT
As a service-providing company, EEX Group does not engage
in any research and development activities, which are for
example common for similar manufacturing companies. New
developments of products and services for 2015 are covered
in the “Business development” section, while future develop-
ments are described in the “Risk and opportunities report”.
Economies of scale can be generated
as a result of EEX Group’s cost structure
56 Annual Report 2016

Management Report Visions Guest Contribution Corporate Responsibility Financial Report Consolidated Management Report
Economic Position
MACRO-ECONOMIC, INDUSTRY-SPECIFIC AND REGULATORY FRAMEWORK CONDITIONS
ESSENTIAL FACTORS INFLUENCING
EEX GROUP TRANSACTION REVENUE
The amount of EEX Group transaction revenue is influenced,
in total, by three key factors—the size of the overall market,
the market share held by EEX Group, and the fee structure.
Market share and the fee structure are monitored in the con-
text of the implementation of the group strategy and man-
agement control by focusing on growing market share and
maintaining a competitive fee structure. In contrast, the size
of the overall market cannot be influenced by EEX Group and,
essentially, depends on the following factors:
> Physical energy consumption and market maturity
(churn rate);
> Price development and volatility on the energy markets;
> Regulatory framework conditions.
PHYSICAL ENERGY CONSUMPTION
AND MARKET MATURITY
According to calculations by the Working Group on Energy
Balances (AGEB), physical energy consumption in Germany
rose by 1.6% in 2016 as against 2015. This development was
essentially driven by the colder weather in 2016, the leap
day this year, and continuing favourable economic develop-
ment and population growth, which was partly offset by the
increases in energy efficiency in Germany. Moreover, it is
highly probable that overall European physical energy con-
sumption will again have increased in the 2016 financial year.
Natural gas consumption also increased during the past finan-
cial year. According to the quarterly report of the European
Commission on the European gas markets, gas consumption
stagnated in the first quarter of 2016, but rose by 9% and 3%
respectively in the second and third quarters. Figures for the
fourth quarter however were not yet available at the creation
date of this management report.
2 ECONOMIC POSITION
The maturity of the individual energy markets is measured
with the help of the so-called churn rate. This parameter indi-
cates how often a mega-watt hour of power or natural gas is
traded on the markets before it is actually physically deliv-
ered. This means it corresponds to the proportion between
the total trading volume and energy consumption. The higher
the churn rate is, the higher are the total trading volume and
the liquidity of the market and, hence, its market maturity.
According to data from the European Union, the churn rate of
the German power derivatives market increased significantly
in the past and at a level of 18, it reached a new maximum
value in the second quarter of 2016. Herewith, Germany is
the most mature market. All other European power derivative
markets show churn rates of 5 at the maximum. The churn
rate of the French power derivatives market increased to a
value of 3.5, in Italy it totals approximately 3. Within the gas
market segment, the Dutch TTF (Title Transfer Facility) market
area has the highest churn rate, followed by the British mar-
ket area NBP (National Balancing Point). In 2015, churn rates
amounted to 47.7 for TTF and 28.5 for NBP. Churn rates for
2016 were not yet available at the creation date of this man-
agement report.
PRICE DEVELOPMENT AND VOLATILITY
ON THE ENERGY MARKETS
In the 2016 financial year the price decline on the commodity
markets, already observed in previous years, essentially con-
tinued. While, in 2011, a price of EUR 51.12 per MWh was paid
on the German Day-Ahead market for power, this price declined
to EUR 28.98 per MWh in 2016 (2015: EUR 31.63 per MWh).
In 2016, market participants who bought base-load power for
2017 on the derivatives market (Phelix Baseload Year Future)
only had to pay EUR 26.58 per MWh on average (2015: EUR 30.97
per MWh). Moreover, the monthly EGIX gas price index had an
average price level of EUR 14.13 per MWh during the reporting
year and was, therefore, 31% below the 2015 level (EUR 20.46
per MWh). While the 2016 average prices were lower than the
2015 prices, commodity prices increased again during the
financial year and, in part, concluded the year significantly
above the annual average.
57

In general, the 2016 financial year was shaped by high vola-
tility and strong price fluctuations, in particular on the power
derivatives markets. Due to unscheduled production down-
time of French nuclear power plants in the autumn and win-
ter of 2016, significant price increases were observed on the
power derivatives markets. High volatility usually has a pos-
itive effect on trading activity since in the event of a broader
range of fluctuations in commodity prices there is a higher
need for the adjustment of hedging positions. Tab 7+8
REGULATORY FRAMEWORK CONDITIONS
In 2016, the energy markets were again characterised by
di scussions regarding adjustments of existing measures, and
the introduction of new regulatory measures. The most impor-
tant projects for energy trading are or were:
> The design and national implementation of the revised
EU Markets in Financial Instruments Directive (MiFID II)
and the associated EU MiFIR regulation and Regulatory
Technical Standards (RTS) No. 20 and No. 21, which were
published in December 2016, being particularly relevant
in this respect;
> The entry into force and the detailed design of the EU
Benchmarking Ordinance with binding rules for the
creation of indices which are used as reference values
for market players in order to avoid conflicts of interest
as well as manipulation and abuse;
> Definition of the framework for the power market design
with regard to the further integration or renewable
energies, the flexibilisation of the market and ensuring
security of supply;
> The continuing critical discussion regarding the division
of the German-Austrian price zone into two market areas
as a result of network congestion and insufficient grid
capacity;
> The institutionalisation of the role of exchanges in market
coupling with a guideline for the capacity allocation and
congestion management (CACM).
Price development 2016 of the 7
Phelix Baseload Year Future with delivery in 2017
40
35
30
25
20
15
01 02 03 04 05 06 07 08 09 10 11 12 / 2016
01 02 03 04 05 06 07 08 09 10 11 12 / 2016
EUR/ MWh
Price development of the
monthly EGIX gas price index
20
18
16
14
12
10
EUR / MWh
58 Annual Report 2016

Management Report Visions Guest Contribution Corporate Responsibility Financial Report Consolidated Management Report
Economic Position
The revised EU Markets in Financial Instruments Directive
(MiFID II), which will take effect in January 2018, signifi-
cantly changes the rules for trading in commodity derivatives.
The general exception for commodity derivatives, which has
applied so far, has been cancelled and replaced by an “ancil-
lary activity exemption”. As a result, only trading participants
with relatively low trading activities will be exempt from
MiFID II requirements. This could lead to a situation where
a number of energy traders might be forced to reduce their
trading activities (relative to their other activities) according -
ly. In this regard, it has to be highlighted that after long
di scussions, the technical regulatory standards now establish
that in assessing whether a company benefits from the ancil-
lary activity exemption, the volume of trading transactions is
compared in proportion to the invested capital of a company,
e.g. in power plants (the designated “Capital Employed Test”).
The smaller the share, the higher the likelihood of benefitting
from the “ancillary activity exemption”. This takes account of
the particularities of energy suppliers. However, it remains to
be seen in practice how this exception will be used by market
participants. In addition, trading activities which are carried
out at an Organised Trading Facility (OTF) — a new trading
platform category introduced under MiFID II — will be exempt
from MiFID II. Compared with this, similar transactions which
are concluded at a regulated market or on an exchange are
part of the scope of application of MiFID II. We cannot rule
out that such unequal regulatory treatment might entail shifts
in volumes from regulated markets to OTFs.
The benchmark regulation requires that the preparation and
administration of indices classified as benchmarks should be
made more transparent and that conflicts of interest should
be avoided. The commodity benchmarks will also be part of
the directive’s scope of application. Depending on the origin
of the underlying data and market size, this will have effects
on individual indices of EEX Group. As a neutral index pro-
vider, EEX Group is taking steps towards the group-wide im -
plementation of the benchmark regulation.
After years of discussions, important strategic decisions re -
garding future power market design were taken in 2016. In
Germany, the new electricity market law adopted in the sum-
mer of 2016 paved the way for the “power market of the
future”. Based on market mechanisms and using the market
price signal as a central coordinating instrument, the exist-
ing market design is sought to be optimised and made more
flexible. At the same time, a number of detailed regulatory
specifications and implementation measures are required
which in part conflict with a market-based approach. At the
end of 2016, the EU Commission also presented proposals for
the further development of the power market in the context
of its designated “Winter Package”. In addition to address-
ing fundamental questions of market design, these proposals
also concern cross-border trading as well as the promotion
and integration of renewable energies. These proposals will
now go through the proper EU legislative procedure. Concrete
results and legally binding decisions can be expected, at the
earliest, in 2018.
The debate regarding the re-structuring of bidding zones on
the power market as a result of grid congestion and insuffi-
cient grid expansion has reached a critical phase. In this pro-
cess, both the federal government together with the Federal
Network Agency and the European Agency for the Cooperation
of Energy Regulators (ACER) have advocated the introduction
of congestion management at the German-Austrian border,
which would amount to a de-facto separation of the current
common price zone. At present, talks involving the transmis-
sion system operators and power exchanges are underway in
order to prepare for such a step. As seen from the perspective
of EEX Group, care has to be taken to ensure that a division — if
indeed it is actually carried out — is designed in such a way as
to minimise any possible effect on the market.
In Germany, the new electricity market law
adopted in summer 2016 paved the way
for the “power market of the future”
59

Originally, the guideline for capacity allocation and conges-
tion management (CACM) was designed to facilitate a stronger
cross-border co-operation between the respective transmis-
sion system operators, and in the form of a non-binding tech-
nology and operations guideline. In 2015, this guideline took
effect and, essentially, pursues three aims:
> Promoting competition at all levels of the value chain
and creating the necessary framework;
> Optimum use of transmission infrastructure;
> Ensuring security of supply.
For the exchanges, CACM is of great importance, in particular
because it introduces a new concept: the “nominated electrici -
ty market operator” (NEMO). This helps to institutionalise the
role of the exchanges in the context of market coupling —
a role which has only been assumed as de-facto so far. In
other words, it formulates and validates the roles and tasks
in legal terms. The concrete rules themselves are also submit-
ted to a review and developed further if required. As a result,
new rules for the cooperation between NEMOs and transmis-
sion system operators are introduced and a system is created
which also permits NEMOs to actively operate in other mem-
ber states. In particular, in the future, exchanges will be reg-
ulated by national authorities in the context of CACM in the
areas of activity it concerns. This will have a lasting influence
on EPEX’s relationship with regulators.
The concrete effects of the individual regulatory measures on
the markets of EEX Group and on the activity of trading par-
ticipants are explained in more detail in the “Risk and oppor-
tunities report”.
BUSINESS DEVELOPMENT
OVERVIEW OF BUSINESS DEVELOPMENT IN 2016
Thanks to the successful development of all business areas,
EEX Group was able to continue its expansion strategy in the
2016 financial year. In almost all areas of business, significant
growth rates were generated as against 2015. In addition to
the increase in trading volumes and market shares, growth
was, in part, also due to the full-year effect of the APX integra-
tion as well as the expansion of the scope of the consolidation
of EEX Group with the Prague-based power exchange PXE, the
Danish gas exchange Gaspoint Nordic and PCG, a joint venture
with the CEGH, that runs the Austrian gas market.
In 2016, the sales revenue figures for the individual business
areas were as follows: Tab 9
Sales revenue per business area 9
kEUR 2016 Share 2015 Change
Power Derivatives 87,206 37% 60,006 +45%
Power Spot 67,534 29% 63,393 +7%
Natural Gas 32,846 14% 21,132 +55%
Market Data Services 5,019 2% 3,745 +34%
Environmentals 2,479 1% 1,590 +56%
Clearing Services 1,727 1% 1,964 –12% 2
Global Commodities 501 0% 1,157 –57%
Agriculturals 326 0% 217 +50%
Other revenues:
Annual fees 14,152 6% 12,161 +16%
Technical connections 8,790 4% 7,926 +11%
Services to third parties 5,488 2% 4,306 +27%
Refunds of project costs 3,754 2% 4,960 –24%
Fix revenues from market-coupling 2,962 1% 4,055 –27%
Others 1,373 1% 3,811 –64%
Sales revenue 234,158 100% 190,424 +23%2 The decline in the business area of Clearing Services is due to the expansion
of the scope of the consolidation of EEX Group and the associated transfer of the markets of PXE, Gaspoint Nordic und CEGH to the business areas of power spot, power derivatives and natural gas. The remaining business of clearing services increased in the 2016 financial year.
60 Annual Report 2016

Management Report Visions Guest Contribution Corporate Responsibility Financial Report Consolidated Management Report
Economic Position
POWER DERIVATIVES
The Power Derivatives business area developed extremely pos -
itively in the 2016 financial year. Thanks to a growing overall
market — e.g. on account of temporarily very high rates of vol-
atility — combined with a growing market share, EEX Group
achieved a new record in traded volumes. At the same time,
diversification within individual products was promoted fur-
ther. More than 27% of trading volumes in power derivatives
(futures and options) were generated in products for market
areas outside of Germany. Tab 10+11
In the past financial year, EEX Group again supported its
growth through the introduction of new products. For example,
further short-term products (day respectively week futures)
for the market areas Italy, France, the Netherlands, Switzer-
land and the Nordic countries were introduced. As a result,
EEX Group contributed to strengthening the liquidity of these
market areas. Further, these product launches also pursue the
strategic aim of expanding the product portfolio for all mar-
ket areas and of completing the offering in European energy
trading.
In response to the enduring challenges of the energy transi-
tion, EEX Group is constantly working on innovations, e.g. in
the context of product development, in order to comply with
the requirements of the market. For example, after the Intra-
day Cap Futures, with the Wind Power Futures a second spe-
cific “Energiewende” product was introduced in the autumn of
2016. By means of Wind Power Futures, market participants
can hedge volume risks which arise from the fluctuating feed-
in of wind power in a focused manner.
In addition, EEX Group further promoted the expansion of the
power derivatives market. After the acquisition of the major-
ity shareholding in PXE, products are now also offered in the
market areas of the Czech Republic, Slovakia, Hungary and
Poland for the first time. Furthermore, exchange trading in
Romanian power futures is now also possible via PXE — in
addition to the possibility of Trade Registration, which has
existed for a longer period.
EEX Group faces unchanged and strong competition on the
power derivatives market. More than one half of trading is
still carried out via over-the-counter broker platforms, even
though their market share has declined compared with the
previous year. The remaining trading volume is distributed
over several energy exchanges. Apart from EEX Group, these
essentially consist of the global exchange operators NASDAQ
OMX, CME and ICE as well as smaller national energy ex -
changes. In the competition among these exchanges, EEX
Group was able to prevail and expand its leading position, in
particular, with regard to its main competitor NASDAQ OMX.
Despite new market entrants and, in part, aggressive pricing
policies, the competitor exchanges were not able to funda-
mentally improve their market positions.
Power Derivatives trading volumes 10
TWh 2016 2015 Change
Futures 3,708 2,469 +50%
Germany / Austria 2,665 1,747 +53%
Italy 481 396 +21%
France 454 299 +52%
Spain 72 22 +219%
Eastern Europe 17 <1 >+1,000%
Others 20 5 +316%
Options 212 68 +212%
Power Derivatives 3,920 2,537 +55%
Selected Power Derivatives market shares 11
% 2016 2015
Futures Germany / Austria 37 31
Futures Italy 63 49
Futures France 33 24
Power Derivatives (all) 30 24
The Power Derivatives business experienced
an extremely positive development throughout
the 2016 financial year
61

POWER SPOT
EEX Group was also able to increase its trading volumes
within the Power Spot business area as against the previous
year. This was supported by the full-year effect of the APX
markets, which were integrated into EPEX as of 4 May 2015
(Day-ahead markets and Intraday markets in the Netherlands,
Belgium and the United Kingdom). The German Day-ahead
market recorded declines in volume. However, these were
over compensated for by the growth generated in the other
market areas. Tab 12
Moreover, trading volumes have benefited from the trans-
mission system operators’ obligation to market quotas of
power from renewable energies on a power exchange and from
direct marketing. The obligation to market quotas was estab-
lished in the context of the German Renewable Energies Law
(EEG), which took effect in 2010, and is specified in more de -
tail in the Ordinance on a Nationwide Equalisation Scheme
(AusglMechV). Since 2010, the transmission system opera-
tors (TSO) have had to market EEG power which is subsidised
with a fixed feed-in tariff on the exchange and, in return,
receive a levy from the supply company in accordance with
AusglMechV. In addition, the Power Spot business area bene-
fitted from direct marketing, which was introduced in 2012.
This permits the sale of EEG power outside the fixed feed-in
tariff. There is no obligation to market power through an
exchange. However, on account of the high liquidity for exam-
ple, EEX Group was able to establish itself as a strong market
platform in this respect.
Within the Power Spot business area, the Intraday markets
continue to gain in importance even though volumes are still
low in absolute terms when compared with the Day-ahead
markets. This trend is primarily due to the growing impor-
tance of digitalisation and the fluctuating supply of renew-
able energies. This, in turn, results in an increased demand for
short-term balancing options for balancing group managers.
In the 2016 financial year, the integration of APX into the EEX
Group was further promoted. For example, the APX clearing
business was taken over by ECC on 31 March 2016. The Intra-
day markets in the Netherlands and Belgium were migrated to
EPEX systems in the fourth quarter; migration of the remain-
ing APX markets is also envisaged.
In the context of further development of the Power Spot busi-
ness area, the first auction for generation capacity certifi-
cates in France was carried out in 2016 and the coupling of
the European power markets was expanded to the Austrian-
Slo venian border. Furthermore, the Serbian Day-ahead mar-
ket was launched successfully by SEEPEX, a joint venture
between EPEX and the Serbian transmission system operator,
Elektromreža Srbije (EMS). After the acquisition of the major-
ity shareholding in PXE, EEX Group also launched tender ser-
vices in the Czech Republic in 2016.
Power Spot trading volumes 12
TWh 2016 2015 Change
Day-ahead markets 474 472 +0%
Germany 235 264 –11%
France 111 106 +4%
United Kingdom 44 34 +29%
Netherlands 35 28 +24%
Others 49 39 +27%
Intraday markets 62 53 +17%
Germany 39 37 +6%
United Kingdom 14 9 +48%
France 4 4 +9%
Netherlands 1 1 +56%
Others 4 3 +52%
Power Spot 535 524 +2%
Trading volumes within the Power Spot
business area have also increased
compared to the previous year
62 Annual Report 2016

Management Report Visions Guest Contribution Corporate Responsibility Financial Report Consolidated Management Report
Economic Position
EEX Group directly competes with other spot exchanges
within the power spot business area. In the United King-
dom, short-term trading in power is, in addition to EPEX, also
offered by N2EX, a subsidiary of the second-biggest European
power spot exchange, the Norwegian Nord Pool Spot. In 2016,
N2EX had a market share of 63%, while EPEX’s market share
amounted to 37%. Nord Pool Spot is also active in the German
market area where it offers Intraday products, and is currently
admitted for all other relevant market areas of EEX Group. As
a result of the further liberalisation of the market and regula-
tory changes (CACM), overall competition intensified and is ex -
pected to further intensify in the future.
NATURAL GAS
In 2016, the Natural Gas business area made a significant
contribution to the growth of EEX Group and established itself
as a second important revenue mainstay, in addition to the
power markets. In almost all market areas, two-digit growth
rates were achieved both on the spot and on the derivatives
market. On the spot market, this growth was essentially based
on gains in market share, while the overall market itself grew
only slightly. However, on the derivatives market, the growth
in trading volumes is essentially due to growth of the over-
all market, in addition to the growing market shares of EEX
Group. On the French gas derivatives market alone, declining
volumes were observed because of declining market share.
Tab 13+14
In the 2016 financial year, the geographic growth of the gas
markets of EEX Group was promoted by the acquisition of a
majority shareholding in PXE and Gaspoint Nordic as well as
the newly established joint venture PCG. As a result, products
in the gas market areas in Denmark, Austria and the Czech
Republic are now offered to EEX Group customers for trading,
in addition to the products already offered in nine gas market
areas in six countries in 2015. With the exception of the Czech
products, all gas products can be traded via the PEGAS trad-
ing platform operated by Powernext.
Natural Gas trading volumes 13
TWh 2016 2015 Change
Spot market 653 441 +48%
Germany 295 195 +51%
Netherlands 183 124 +47%
France 137 117 +17%
Others 38 5 +644%
Derivatives market 1,091 584 +87%
Netherlands 893 429 +108%
Germany 129 97 +33%
France 43 51 –15%
Others 26 8 +230%
Natural Gas 1,744 1,025 +70%
The Natural Gas business area made
a significant contribution to the growth
of EEX Group in 2016
Selected Natural Gas market shares 14
% 2016 2015
Spot market Germany 36 29
Spot market Netherlands 25 18
Spot market France 75 67
Spot market (all) 26 18
Derivatives market Netherlands 4 2
Derivatives market Germany 6 5
Derivatives market France 10 13
Derivatives market (all) 3 1
63

FURTHER AREAS OF BUSINESS
Market Data ServicesThe essential task of the Market Data Services business area
is to ensure the biggest possible reach of EEX Group market
data and its products, to provide support in efficient pricing
and market the data available within EEX Group.
The information product offering is used to market data which
is generated in the course of trading activities within EEX
Group. In addition to the pure sale of data products, this seg-
ment also aims to ensure the widest possible dissemination
and highest possible visibility of trading products. In 2016,
EEX Group was able to further increase revenue from informa-
tion products compared with previous years.
Transparency services focus on the publication of insider in for-
mation and fundamental data on the “Transparency in Energy
Markets” platform in the context of the European Regulation
on Wholesale Energy Markets Integrity and Transparency
(REMIT). This offering is a central element for EEX Group in
order to give every trading participant the possibility to pub-
lish insider information on the one hand and establish indi -
vi dual trading platforms as transparent market platforms on
the other. In the 2016 financial year, the transparency data
offering was expanded to include data on power generation
and gas consumption in Italy. As a result, transparency data
regarding eight European countries are now published. Further-
more, EEX Group has also offered its customers weather data
in the form of actual and forecast temperatures since 2016.
The area of regulatory reporting brings together reporting
services which are provided on the basis of various legal
provisions. On the one hand, Trade Reporting according to
the European Market Infrastructure Regulation (EMIR) is pro-
vided for various Clearing and Non-Clearing members of ECC;
on the other hand, EEX Group, in its function as a “Registered
Reporting Mechanism” reports order and trade data to ACER,
the Agency for the Cooperation of Energy Regulators, on be -
half of its market participants. After its launch in November
In addition to geographical expansion, measures were taken
to further improve the offering and, as a result, increase cus-
tomer benefit within the existing product portfolio. For exam-
ple, an action plan for the Dutch derivatives market, which
further boosted liquidity in this market, was implemented
at the beginning of the year. Among other measures, the fee
for the physical settlement of futures was lowered, trading
hours were extended and additional maturities were offered.
In addition, new technical connection solutions were created
and additional risk tools were introduced. Furthermore, var-
ious services were expanded in the German and French gas
market areas.
The competitive environment on the European natural gas
markets resembles that of the power derivatives markets: The
main share of natural gas trading takes place off-exchange
via brokerage platforms. The remainder of trading is distrib-
uted across EEX Group, the CME and ICE exchanges as well
as smaller national energy exchanges. So far, NASDAQ OMX
has been unable to generate trading volumes on EEX Group
gas markets. While EEX Group is the exchange with the by far
biggest trading volumes on the spot markets, ICE has the big-
gest market share in exchange trading on the derivatives mar-
kets. There is growth potential for EEX Group, in particular,
because of the fact that the Dutch market area replaced the
British market area as the biggest market in 2015. While the
shrinking British market is dominated by ICE and brokers,
EEX Group can benefit from growth and the shift of trading
activities to the Dutch market.
64 Annual Report 2016

Management Report Visions Guest Contribution Corporate Responsibility Financial Report Consolidated Management Report
Economic Position
Environmentals trading volumes 15
Various units 2016 2015 Change
Emission allowances (Mio. t) 950 678 +40%
Primary auctions (spot) 640 572 +12%
Secondary trading (spot) 51 41 +25%
Secondary trading (derivatives) 258 65 +299%
Guarantees of origin (GWh) 0 60 –100%
On behalf of the European Commission, new emission allow-
ances for all member states are introduced to the market via
auctions (primary auctions). The volumes are determined
in advance and are auctioned separately for Germany, the
United Kingdom and Poland, while auctions for the remaining
25 member states are carried out together. Auctions for the
United Kingdom are carried out by ICE, while EEX Group pro-
vides auctions for all other EU member states. Last year, the
respective underlying contracts were extended for a period of
up to five years.
In the secondary trading of emission allowances, the market
is dominated by ICE which settles 90% of the market. The
remaining trading volumes are essentially generated by bro-
kers and by EEX Group, which, as a result, forms the third-big-
gest trading platform on the secondary market. In this respect
CME and NASDAQ OMX play only a subordinate role. In order
to further enhance its position on the secondary market, EEX
Group has expanded its offering in the past financial year.
For example, on the derivatives market additional maturities
beyond 2020 as well as options were introduced for trading.
On the spot market, registration of over-the-counter trans-
actions for clearing was simplified through the introducing
“Straight-Through-Processing” (STP).
2015, regulatory reporting developed very positively and cur-
rently contributes to more than 40% of the revenues of the
Market Data Services business area.
EnvironmentalsWithin the Environmental Products business area, EEX Group
was able to continue its growth strategy following growing
trading volumes of emission allowances both on the primary
and on the secondary market. While primary market auction
volumes are determined by the EU, EEX Group benefitted from
a growing overall market on the secondary market combined
with constantly growing market share. During the financial
year, trading in guarantees of origin came to a halt. Tab 15
The regulatory reporting developed
very positively — in 2016 it contributed more than
40% of the revenues in the Market Data segment
65

Global Commodities trading volumes 17
Various units 2016 2015 Change
Freight (futures / options) (k days) 438 449 –3%
Iron ore (k t) 315,621 204,188 +55%
Fuel oil (k t) 4,703 3,432 +37%
Container (Standard container) 0 40 –100%
Others (k t) 1,785 1,636 +9%
Global CommoditiesWithin the Global Commodities area, EEX Group generated
significant growth rates in the volumes traded. While freight
products (to date the most profitable product group in this
business area) were traded to approximately the same extent
as in 2015, trading volumes in iron ore, fuel oil and other
products increased significantly. Trading in container capaci-
ties came to a standstill in the 2016 financial year. Tab17
In addition to the expansion of the CLTX offering, EEX also im -
proved its offerings in the area of Global Commodities. For
example, options on freight, futures on iron ore and addition al
maturities for coal futures were introduced. In the freight
segment, in particular, use of the EEX Trade Registration ser-
vice increased significantly, thanks to the market initiative
launched in 2016.
Clearing ServicesThe Clearing Services area includes clearing for those partner
exchanges that are not part of EEX Group. Following the full
consolidation of PXE (from 1 June 2016) and of Gaspoint Nor-
dic (from 1 July 2016) as well as the take-over of the CEGH gas
markets into EEX Group (from 1 December 2016), the Hungar-
ian HUPX and the Norwegian NOREXECO remain in this busi-
ness area as partner exchanges of ECC. As a result of these
changes during the year, a comparison with the previous year
is not particularly meaningful. The volumes from clearing and
settlement of trades for the remaining partner exchanges have
increased as against the previous year. Tab16
In the past business year, new markets and services were devel-
oped for the business area of Clearing Services. For example,
the Hungarian Intraday market for power was launched to -
gether with HUPX and new maturities for pulp futures were
introduced in collaboration with NOREXECO.
Clearing Cooperation volumes 16
Various units 2016 2015 Change
HUPX (TWh) 26 22 +22%
NOREXECO (k t) 63 0 n / a
PXE (until 31 / 05 / 16) (TWh) 19 36
Gaspoint Nordic (until 30 / 06 / 16) (TWh) 13 17
CEGH (until 30 / 11 / 16) (TWh) 29 27
66 Annual Report 2016
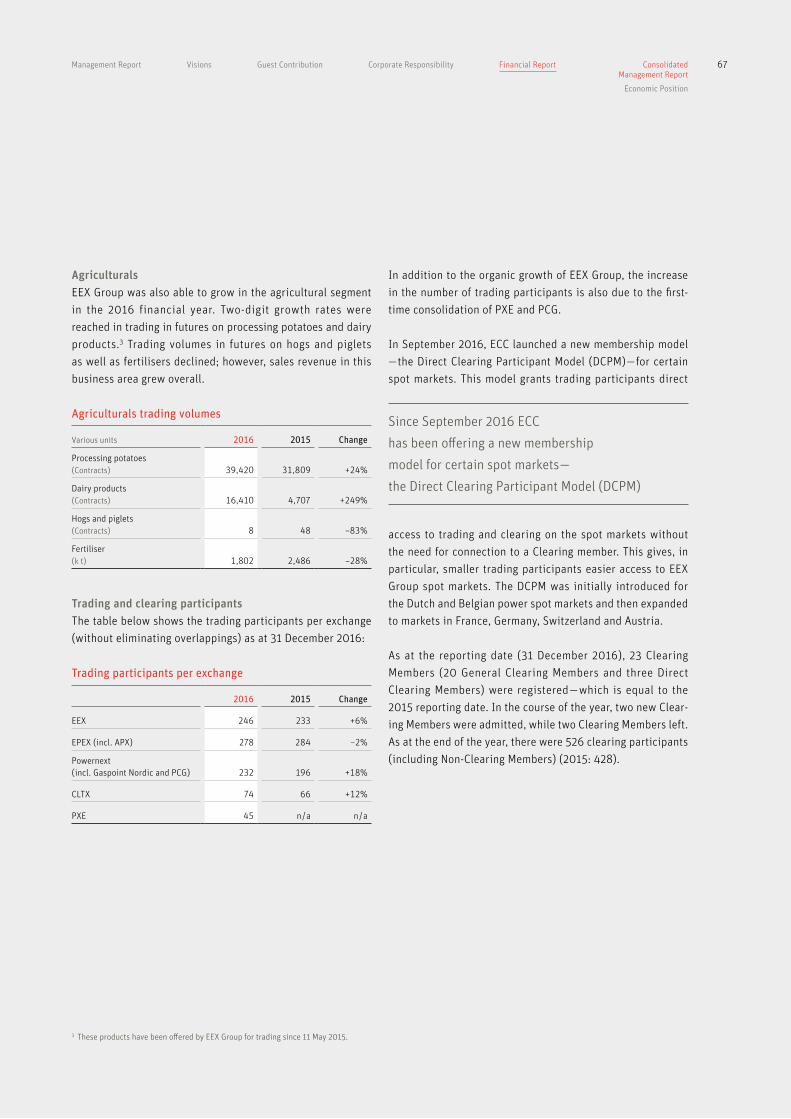
Management Report Visions Guest Contribution Corporate Responsibility Financial Report Consolidated Management Report
Economic Position
Agriculturals trading volumes 18
Various units 2016 2015 Change
Processing potatoes (Contracts) 39,420 31,809 +24%
Dairy products (Contracts) 16,410 4,707 +249%
Hogs and piglets (Contracts) 8 48 –83%
Fertiliser (k t) 1,802 2,486 –28%
Trading participants per exchange 19
2016 2015 Change
EEX 246 233 +6%
EPEX (incl. APX) 278 284 –2%
Powernext (incl. Gaspoint Nordic and PCG) 232 196 +18%
CLTX 74 66 +12%
PXE 45 n / a n / a
AgriculturalsEEX Group was also able to grow in the agricultural segment
in the 2016 financial year. Two-digit growth rates were
reached in trading in futures on processing potatoes and dairy
products.3 Trading volumes in futures on hogs and piglets
as well as fertilisers declined; however, sales revenue in this
business area grew overall. Tab18
Trading and clearing participantsThe table below shows the trading participants per exchange
(without eliminating overlappings) as at 31 December 2016:
Tab19
In addition to the organic growth of EEX Group, the increase
in the number of trading participants is also due to the first-
time consolidation of PXE and PCG.
In September 2016, ECC launched a new membership model
— the Direct Clearing Participant Model (DCPM) — for certain
spot markets. This model grants trading participants direct
access to trading and clearing on the spot markets without
the need for connection to a Clearing member. This gives, in
particular, smaller trading participants easier access to EEX
Group spot markets. The DCPM was initially introduced for
the Dutch and Belgian power spot markets and then expanded
to markets in France, Germany, Switzerland and Austria.
As at the reporting date (31 December 2016), 23 Clearing
Members (20 General Clearing Members and three Direct
Clearing Members) were registered — which is equal to the
2015 reporting date. In the course of the year, two new Clear-
ing Members were admitted, while two Clearing Members left.
As at the end of the year, there were 526 clearing participants
(including Non-Clearing Members) (2015: 428).
3 These products have been offered by EEX Group for trading since 11 May 2015.
Since September 2016 ECC
has been offering a new membership
model for certain spot markets —
the Direct Clearing Participant Model (DCPM)
67

EARNINGS POSITION
The successful growth of EEX Group trading volumes is re-
flected accordingly in its earnings. In the past financial year,
EEX Group sales revenue was kEUR 234,158 and therefore
increased by kEUR 43,734 or 23%. Revenue growth was accom-
panied by disproportionately growing costs so that the result-
ing operating result of kEUR 87,129 was kEUR 37,749 (76%)
above the previous year’s figure. As a result of a consolidation-
related one-off effect in the financial result in 2015, the 2016
consolidated net profit of the period (kEUR 57,731) can only
be compared with the value for the previous year to a limited
extent. The adjusted growth was kEUR 27,610 (92%).
The profit and loss account for 2016 includes the values for
the PXE, Gaspoint Nordic and PCG subsidiaries, which were
newly consolidated in the financial year for the first time.
Since the effect of these values on the profit and loss account
for the financial year is minor, the consolidation-related
effects are not addressed separately below. Tab20
Consolidated statement of profit or loss 20
kEUR 2016 2015, adj.4 2015
Sales revenue 234,158 190,424 190,424
Net income from banking transactions –59 396 396
Other operating income 2,856 3,115 3,115
Volume-related costs –21,218 –20,266 –20,266
Net revenue 215,736 173,669 173,669
Staff costs –52,898 –47,125 –47,125
Depreciation, amortisation and impairment losses –12,331 –20,936 –20,936
Other operating expenses –63,378 –56,228 –56,228
Operating result 87,129 49,380 49,380
Financial result 472 311 50,035
Income from at-equity investments 28 46 46
Result from ordinary business activities 87,629 49,737 99,461
Income tax expense –29,898 –19,615 –20,411
Consolidated net profit for the period 57,731 30,121 79,050
4 Adjusted by the one-off effect from the disclosure of hidden reserves in the context of the acquisition of control of EPEX in the 2015 financial year
68 Annual Report 2016

Management Report Visions Guest Contribution Corporate Responsibility Financial Report Consolidated Management Report
Economic Position
SALES REVENUE AND NET REVENUE
EEX Group’s sales revenue consists of transaction fees from
trading, clearing and settlement of transactions and other
sales revenue. The development of the sales revenue reflects
the development of the business areas described in the section
“Business development”. The structure of the sales revenue
is also outlined in that section.
Apart from sales revenue, net revenue consists of net income
from banking transactions (kEUR –59), other operating in come
(kEUR 2,856) and variable costs (kEUR –21,218). During the
financial year, variable costs rose by kEUR 952 and, as a
result, developed at a disproportionately low rate compared
to sales revenue. Therefore, strong business growth could — at
least on average — be achieved without significant additional
performance-related reimbursements to trading participants.
In the past financial year, net revenue totalled kEUR 215,736,
which is kEUR 42,067 (24%) above the previous year’s figure.
EXPENSES
During the reporting period, total expenses included in the
operating result (staff costs, depreciation, amortisation and
impairment losses and other operating expenses) rose from
kEUR 124,289 to kEUR 128,607 and, hence, by 3%.
In this context, staff costs rose to kEUR 52,898 (2015: kEUR 47,125)
on account of the planned increase in staff and the integration
of PXE and Gaspoint Nordic employees during the reporting
period.
At kEUR 12,331, depreciation, amortisation and impairment
losses were kEUR 8,605 be low the level of the previous year.
This was caused by an impairment loss of kEUR 9,276 to the
lower fair value of the goodwill and net assets of CLTX in
the 2015 financial year. Adjusted for this effect, deprecia-
tion / amortisation increased by kEUR 671. On the one hand,
this reflects the enduring high investment in the IT systems
of EEX Group. On the other hand, it also reflects the inte-
gration of the new subsidiaries. They contribute additional
depreciation / amortisation on the assets included in the bal-
ance sheet in the context of the purchase price allocation for
the newly consolidated companies.
Other operating expenses, at kEUR 63,378, increased by kEUR
7,150 or by 13% as against the previous year. This includ ed
for ex ample, other expenses for the further development and
operation of IT infrastructure by external service providers, con-
sultancy expenses as well as expenses for infrastructure and
marketing. Furthermore, the other operating expenses in-
cluded costs for the sites and offices of EEX Group, as well
as travelling expenses which are primarily incurred in the
context of sales activities. The increase in other operating
expenses was essentially due to:
> The implementation of resource-intense projects,
in particular, in the power spot business area;
> The further integration of the subsidiaries added in 2015
and 2016 and, in particular, the integration of APX into
EPEX, as well as the strengthening of EEX as a group;
> The constant optimisation of IT infrastructure and IT
processes as well as the general expansion of the business
areas affecting the system environment;
> Growing regulatory requirements;
> Growth of the entire corporate group and the resulting
increase in costs for infrastructure and travelling activities.
FURTHER REVENUE ITEMS
In the past financial year, the financial result was kEUR 472 and,
hence, kEUR 161 higher than the adjusted value for the pre-
vious year. The non-adjusted value for the previous year in-
cluded kEUR 49,724 from the disclosure of hidden reserves
associated with obtaining control of EPEX in the financial
year 2015.
Income from at-equity investments (kEUR 28) includes income
of the shareholdings reported in the balance sheet in accord-
ance with the at-equity method within EEX Group. It includes
the result of Gaspoint Nordic up to (and including) 30 June 2016
and of SEEPEX, a joint venture in which EPEX holds an interest.
69

ASSET POSITION
Tab21
DEVELOPMENT OF ASSETS
As at 31 December 2016, the non-current assets of EEX Group
were kEUR 218,862 (2015: kEUR 185,441). They essentially
con sist of intangible assets (kEUR 116,387), goodwill (kEUR
57,257), derivative financial instruments (kEUR 31,388) and
deferred tax assets (kEUR 10,044). The increase in non-current
assets is primarily driven by the following:
> Increase in derivative financial instruments by kEUR 26,915:
This concerns options with a due date of more than one
year which are cleared by ECC and were recognized at fair
value. The fair value is determined with the help of the
current exchange price of the open positions. Since ECC
operates as the central counterparty for the different
markets of EEX Group, there is a liability of the same value
as this asset. The growth in this position reflects the posi-
tive development of options trading within the entities
of EEX Group.
> Growth of goodwill by kEUR 5,182: In addition to the good-
will recognized with the acquisition of the majority share -
holdings in EPEX, APX and Powernext in the financial year
2015, this position also includes the goodwill of ECC and
EPD. The increase in the past financial year is due to the
new subsidiaries PXE and Gaspoint Nordic being inte-
grated into EEX Group as well as the gas business acquired
from CEGH.
SIGNIFICANT INCREASE IN EARNINGS FIGURES
At kEUR 87,629, earnings before taxes (EBT) were kEUR 37,892
or 76% higher than the adjusted value for the previous year
(kEUR 49,737). After the deduction of income taxes (kEUR
29,898), consolidated net profit was kEUR 57,731.
In the past financial year, the parameter of the “adjusted EBT”,
which was introduced in the section “Management control”
above, reached a value of kEUR 72,598 (2015: kEUR 34,601)
and, hence, more than doubled within a period of one year. In
addition to the growth of the power derivatives markets and
of the gas markets, this is also due to the full-year effect of the
integration of APX as well as the integration of the new subsid-
iaries in the 2016 financial year.
As a ratio of earnings before taxes to sales revenue, the EBT
margin was 37% and, therefore, 11% higher than the level of
the previous year after adjustment for one-off effects.5 This
development confirms the scalability of the EEX Group busi-
ness model.
At 36%, the equity ratio before taxes increased significantly as
against the previous year (22%). It is calculated from the result
of ordinary business activities in proportion to the equity
base of the group at the beginning of the reporting period.
Tab21
5 In the management report regarding the previous year, an EBT margin of 30% was specified. Due to the switch in the calculation system from EBT / total revenues to EBT / sales revenue as well as the adjustment for one-off-effects, there is now a comparative value of 26% for the previous year.
Consolidated statement of financial position of EEX Group
kEUR 31 / 12 / 2016 31 / 12 / 2015
ASSETS
Non-current assets 218,862 185,441
Current assets 3,502,375 1,737,096
Total assets 3,721,238 1,922,537
LIABILITIES
Equity 283,846 244,323
Long-term liabilities 63,835 40,775
Short-term liabilities 3,373,557 1,637,439
Total equity and liabilities 3,721,238 1,922,537
70 Annual Report 2016

Management Report Visions Guest Contribution Corporate Responsibility Financial Report Consolidated Management Report
Economic Position
As at the reporting date, long-term liabilities largely con-
sisted of derivative financial instruments (kEUR 31,388) and
deferred tax liabilities (kEUR 30,911). In addition, it included
long-term provisions and long-term liabilities. The increase
in long-term liabilities essentially reflects the development
of options trading at the entities of EEX Group which is also
reflected accordingly on the assets side of the balance sheet
in the derivative financial instruments with an increase of
kEUR 26,915. At the same time, long-term liabilities and pro-
visions declined by kEUR 2,623 and deferred tax liabilities
reduced by kEUR 1,233.
Short-term liabilities are shaped to a significant degree by
the trading participants’ cash deposits of kEUR 2,973,739
and trade payables of kEUR 359,459. Furthermore, short-
term liabilities include other liabilities, short-term provisions,
derivative financial instruments as well as other banks and
overdrafts. The increase in short-term liabilities is largely
influenced by the following:
> Increase in trading participants’ cash deposits by
kEUR 1,652,690: This is the opposite position to the
restricted bank balances on the current assets side.
> Increase in trade liabilities by kEUR 109,065:
This position forms the opposite position to the balancing
date-specific recognition of accounts receivable from the
physical fulfilment of power and gas contracts by ECC
Luxembourg on the assets side. The remaining increase in
trade payables is due to the expansion of the operations
of EEX Group.
> Decline in other bank loans and overdrafts by kEUR 41,733:
In the past financial year, the external credits which had
been used as at the reporting date in the previous year
were fully repaid.
> Growth of intangible assets by kEUR 2,623: The increase
in intangible assets is essentially due to the current invest-
ments into the IT systems of the group.
The assets side of the balance sheet is largely shaped by
current assets of kEUR 3,502,375 (2015: kEUR 1,737,096).
These comprise, first and foremost, restricted bank balances
(kEUR 2,973,739), trade receivables (kEUR 376,658) and other
cash and bank balances (kEUR 127,115). There were essential
changes in current assets with regard to the following items:
> Increase in restricted bank balances by kEUR 1,652,690.
This concerns the cash collateral deposited by clearing
participants in connection with the ECC clearing business.
This cash collateral increased accordingly as a result of
the increasing scope of business of EEX Group. However,
this asset is offset by a liability having the same value.
> Growth in trade receivables by kEUR 106,733: This item
essentially includes receivables from the physical fulfil-
ment of power and gas contracts by ECC Luxembourg on
account of the reporting date, which also increased as
against the previous year in line with the business devel-
opment. In this case too, there is a liability having the
same value on the liabilities side of the balance sheet.
This item also confirms the successful expansion of the
operations of EEX Group.
DEVELOPMENT OF EQUITY AND DEBT
The assets of EEX Group were financed through equity of
kEUR 283,846 (2015: kEUR 244,323) as well as debt of
kEUR 3,437,392 (2015: kEUR 1,678,214). The debt consisted
of long-term liabilities of kEUR 63,835 (2015: kEUR 40,775)
as well as short-term liabilities of kEUR 3,373,557 (2015:
kEUR 1,637,439).
The increase in equity during the past financial year reflects
the fact that the 2015 profits were partially retained. As a
result, reserves increased by kEUR 43,240. At the same time,
the non-controlling interests declined by kEUR 3,522 during
the reporting year. The subscribed capital is kEUR 39,992
without change, and the capital reserve is kEUR 10,000.
71

FINANCIAL POSITION
The Group’s liquidity again increased significantly during the
reporting year. However, given that ECC is a clearing house,
there are high requirements regarding liable equity according
to EMIR, which tie up financial resources. Tab22
As at the reporting date, the cash and cash equivalent of EEX
Group was kEUR 127,097, which corresponds to an increase
of kEUR 46,623 as against the previous year (kEUR 80,474).
Cash and cash equivalent comprises cash in hand, cash at
bank and financial investments available at short notice
reduced by short-term liabilities to banks from credits.
The growth in cash and cash equivalent was driven by cash
flow from current operations of kEUR 92,951 as well as the
expansion of the scope of the consolidation with PXE, Gaspoint
Nordic and PCG (effect: kEUR 2,355). Cash outflows of funds
from investing and financing activities of EEX Group of kEUR
–23,871 and kEUR –24,811 were financed from this source.
The cash flow from current operations comprised the annual
net profit generated (kEUR 57,731) after adjustment for non-
cash-effective income and expenses during the reporting
period. These amount to kEUR 35,220 and essentially include
depreciation / amortisation and changes in receivables, liabil-
ities and provisions.
ADJUSTMENT OF BALANCE SHEET TOTAL
BY CLEARING-SPECIFIC MATTERS
The balance sheet includes certain items which are identi-
cal on the assets and liabilities side because of ECC’s role as
the central counterparty in clearing. A central counterparty
steps into the chain between the original counterparties to
a transaction and replaces the original transaction between
these two counterparties with two individual transactions
with the central counterparty. Below, the balance sheet total
after adjustment for these positions is established, on the
basis of which valid parameters for the evaluation of the
capital structure and profitability of EEX Group are deter-
mined. On the one hand, there is a restricted bank balance of
kEUR 2,973,739 (2015: kEUR 1,321,049), while, on the other
hand, there is identical short-term debt from the cash deposits
of the trading participants. Moreover, reporting date-specific
customer balances of settlement transactions of kEUR 329,549
(previous year: kEUR 244,843) were included. This concerns the
reporting date-specific recognition of receivables and liabil-
ities from the nomination of power and natural gas. Further -
more, the short- and long-term derivative financial instru-
ments recognised at the fair value of the options are included
in the assets and liabilities sides at kEUR 41,957 (2015:
kEUR 6,615). After the deduction of these items, the adjusted
balance sheet total at the end of the period under review was
kEUR 375,993 (2015: kEUR 350,030) and the equity ratio on
the reporting date was 75% (2015: 70%). The equity ratio,
which continues to be high, underlines the high profitability
of EEX and that its financing strategy, in principle, is aligned
towards maximum independence from outside creditors.
The debt ratio, being the proportion of long-term and short-
term debt in the adjusted balance sheet total, fell to 25%
(2015: 30%). The Group was able to cover all expenses on the
basis of its financial resources and current income at all times
during the year. The external credits taken out in the previous
financial year were repaid, but the credit lines will be main-
tained as potential financing for future strategic projects.
Consolidated statement of cash flows of EEX Group 22
kEUR 2016 2015
Change in scope of consolidation 2,355 21,118
Cash flow from operating activities 92,951 39,530
Cash flow from investing activities –23,871 –49,250
Cash flow from financing activities –24,811 –4,325
Cash-effective change in cash and cash equivalent 46,623 7,073
Cash and cash equivalent at the beginning of the accounting period 80,474 73,401
Cash and cash equivalent at the end of the accounting period 127,097 80,474
72 Annual Report 2016
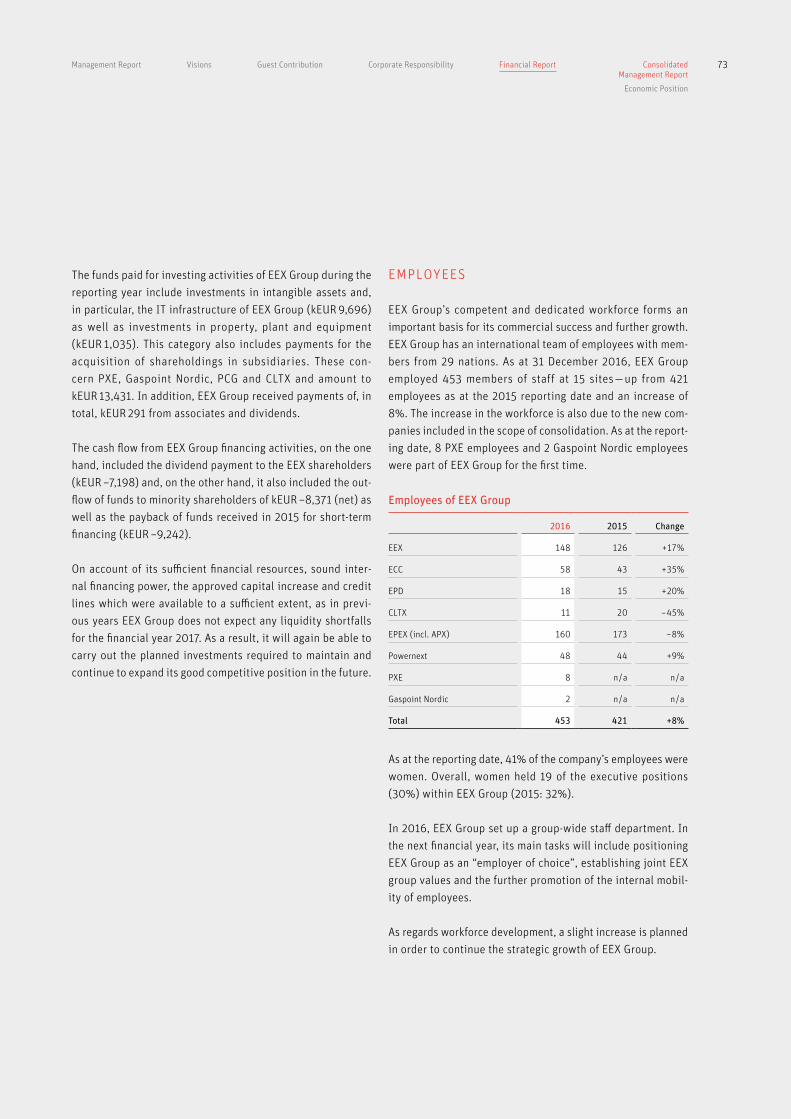
Management Report Visions Guest Contribution Corporate Responsibility Financial Report Consolidated Management Report
Economic Position
EMPLOYEES
EEX Group’s competent and dedicated workforce forms an
important basis for its commercial success and further growth.
EEX Group has an international team of employees with mem-
bers from 29 nations. As at 31 December 2016, EEX Group
employed 453 members of staff at 15 sites — up from 421
employees as at the 2015 reporting date and an increase of
8%. The increase in the workforce is also due to the new com-
panies included in the scope of consolidation. As at the report-
ing date, 8 PXE employees and 2 Gaspoint Nordic employees
were part of EEX Group for the first time. Tab23
As at the reporting date, 41% of the company’s employees were
women. Overall, women held 19 of the executive positions
(30%) within EEX Group (2015: 32%).
In 2016, EEX Group set up a group-wide staff department. In
the next financial year, its main tasks will include positioning
EEX Group as an “employer of choice”, establishing joint EEX
group values and the further promotion of the internal mobil-
ity of employees.
As regards workforce development, a slight increase is planned
in order to continue the strategic growth of EEX Group.
The funds paid for investing activities of EEX Group during the
reporting year include investments in intangible assets and,
in particular, the IT infrastructure of EEX Group (kEUR 9,696)
as well as investments in property, plant and equipment
(kEUR 1,035). This category also includes payments for the
acquisition of shareholdings in subsidiaries. These con-
cern PXE, Gaspoint Nordic, PCG and CLTX and amount to
kEUR 13,431. In addition, EEX Group received payments of, in
total, kEUR 291 from associates and dividends.
The cash flow from EEX Group financing activities, on the one
hand, included the dividend payment to the EEX shareholders
(kEUR –7,198) and, on the other hand, it also included the out-
flow of funds to minority shareholders of kEUR –8,371 (net) as
well as the payback of funds received in 2015 for short-term
financing (kEUR –9,242).
On account of its sufficient financial resources, sound inter-
nal financing power, the approved capital increase and credit
lines which were available to a sufficient extent, as in previ-
ous years EEX Group does not expect any liquidity shortfalls
for the financial year 2017. As a result, it will again be able to
carry out the planned investments required to maintain and
continue to expand its good competitive position in the future.
Employees of EEX Group 23
2016 2015 Change
EEX 148 126 +17%
ECC 58 43 +35%
EPD 18 15 +20%
CLTX 11 20 –45%
EPEX (incl. APX) 160 173 –8%
Powernext 48 44 +9%
PXE 8 n / a n / a
Gaspoint Nordic 2 n / a n / a
Total 453 421 +8%
73

erates a high cash flow from ongoing business activities. In
addition, a high equity ratio, the approved capital increase
and a solid liquidity position are essential preconditions
which enable the Group to finance both organic and inorganic
growth on the basis of its own resources, both now and in the
future.
At the time of preparation of this management report, the
commercial position of the company and its financial strength
both remain very good. However, since significant uncertain-
ties and risks persist, setbacks in the implementation of the
growth strategy cannot be fully excluded.
GENERAL STATEMENT ON THE ECONOMIC POSITION BY THE MANAGEMENT BOARD
The Management Board of EEX Group is very satisfied with the
development of the business in 2016. The Group has signifi-
cantly exceeded its sale and results targets, which is particu-
larly positive in view of the challenging market environment
and the prevailing uncertainties in the market.
The Management Board assesses the financial position of EEX
Group in 2016 as being extremely sound. The company gen-
74 Annual Report 2016

Management Report Visions Guest Contribution Corporate Responsibility Financial Report Consolidated Management Report
Risk and Opportunities Report
specified by the Management Board of EEX AG for all group
companies. Depending on their size, the individual group
companies may have a risk management unit of their own. As
part of the Group risk management process, group companies
report on a monthly basis. In order to gain an overall impres-
sion, the EEX Group risk management department brings
together the prescribed information on risks from the various
activity categories and the individual organisational units.
Moreover, there is a requirement for the Management Board
to submit ad-hoc reports to the Supervisory Board with regard
to specific changes in the risk position.
The EEX Group risk management function has the following
structure: Grafik24
RISK MANAGEMENT
ORGANISATIONAL STRUCTURE
In accordance with the requirements defined in art. 91 para. 2
AktG [German Companies Act], the Management Board of EEX
Group implemented an early warning risk system covering all
business areas. This is intended to ensure that risks are recog-
nised early and can be addressed accordingly.
The Chief Risk Officer (CRO) of EEX is responsible for the design
of the early risk warning system. The individual group com-
panies largely control their risks on their own. With regard to
risks that require group coordination, minimum standards are
3 RISK AND OPPORTUNITIES REPORT
Supervisory Board EEX AG
Management Board EEX AG
Internal audit
Departments
Planning / Controlling process
examines
Risk controlling
monitors control
Counterparty risk
Market price risk
Liquidity risk
Operational risk
Compliance risk
Business risk
75

RISK STRATEGY AND RISK CONTROL
EEX Group aligns its risk control to its business model and
corporate strategy. It aims to ensure that risks do not pose a
threat to the existence of the EEX Group. Minimum standards
for risk management are established and risk awareness is
ensured.
The risk management system is integrated into all planning,
controlling and reporting systems in the individual EEX Group
companies and at the level of the Group. The internal auditing
department and the respective compliance departments form
an essential component of the risk management system. It is
based on the systematic identification, assessment, documen-
tation and communication of risks. Corresponding principles,
processes and responsibilities are established in guidelines
applicable throughout the Group.
FRAMEWORK CONDITIONS
The risk position of EEX Group is determined by its business
areas: Specifically, the companies of EEX Group operate elec-
tronic market platforms for derivatives and spot transactions
in various commodities. Due to the complex requirements of IT
operations (e.g. because of 24 / 7 trading for power and gas spot
transactions), operational risk constitutes a dominant com -
ponent in risk control, in addition to business risks. For ECC,
in turn, the default risk is of significant importance for risk
control on account of its activity as a central counterparty.
Further, the companies of EEX Group operate within an envi-
ronment which is increasingly determined by regulatory
requirements. This results in operational risks as well as
business risks, since negative effects on trading behaviour of
market participants cannot be excluded. In addition, the envi-
ronment is being shaped by increasing risks associated with,
in particular, low interest rates and Brexit threatening the sta-
bility of European financial institutions.
Due to the complex requirements
of IT operations, operational risk constitutes
a dominant com ponent in risk control,
in addition to business risks
76 Annual Report 2016

Management Report Visions Guest Contribution Corporate Responsibility Financial Report Consolidated Management Report
Risk and Opportunities Report
Moreover, a potential counterparty risk arises with regard to
the investment of funds of the companies of EEX Group. For
this reason, funds are exclusively invested in recognised insti-
tutes with a low default risk in accordance with the invest-
ment guidelines of EEX Group. For identification purposes,
the EEX Group has developed an internal scoring procedure.
At ECC, in particular, funds are largely invested at the central
bank or in reverse-repo transactions in return for securities
collateral with a high credit rating and liquidity.
Furthermore, low default risks arise in the event that a trading
participant does not pay its due transaction fees. Therefore,
trading participants’ credit standing is monitored constantly
on the basis of financial parameters and of rating information
(providing such is available). In this context, the concentra-
tion of transaction fee payments on individual trading partici-
pants (cluster or concentration risk) is also analysed.
MARKET PRICE RISK
Market price risks are defined as adverse developments in the
value of assets on account of a change in valuation-relevant
market parameters, such as, for example, exchange prices. In
the context of the investment guideline, market price risks are
to be largely avoided. As a result of the positions, which are
balanced on principle, there are no market price risks in the
clearing business. The market price risks resulting from other
operations (essentially currency risks) are minor and are con-
trolled in accordance with the respective situation.
ESSENTIAL RISKS
During the year under review, EEX Group observed the fol-
lowing relevant risks which, if they materialise, might have
adverse effects on the Group and its asset, financial and earn-
ings positions.
COUNTERPARTY RISK
Counterparty risk is defined as the risk that business partners
might not fulfil their payment obligations under the relevant
contract, or that they might not fulfil these obligations in due
time and with resulting potential loss for the Group. Within
EEX Group, the main counterparty risks occur within the ECC
subsidiary. ECC is a central counterparty according to Regula-
tion (EU) No. 648 / 2012 on OTC derivatives, central counter-
parties and trade repositories, and is an institute within the
meaning of art. 1 para. 1 fig. 12 KWG [German Banking Act]. In
this function, it positions itself between the buyer and the
seller and assumes the default risk of both sides for all trans-
actions concluded on its markets, including OTC transactions
registered for clearing. ECC pursues a risk strategy of cover-
ing this default risk with a high security level through its mar-
gin system, the clearing fund and its own financial resources
at all times. The quality of the margin system is reviewed on
an on-going basis with the help of regular back testing. By
means of daily stress tests, ECC simulates the counterparty
risk in extreme yet plausible market conditions and adjusts
the clearing fund and its own financial resources in such a way
that the counterparty risk is also covered under these condi-
tions and also in the event of a simultaneous default of two
Clearing Members.
77

OPERATIONAL RISK
Operational risks are defined as all potential cases of damage
arising from malfunctions of IT systems used, due to inade-
quate design of internal processes, errors of members of staff,
errors or defaults of external service providers, and project
risks. Due to the high degree of automation in processing
busi ness transactions combined with a large number of trans-
actions, malfunctions of the IT systems used constitute essen-
tial operational risks for EEX Group. Since key parts of the IT
systems are operated by external service providers, errors or
defaults of external service providers also constitute a signif-
icant source of risk.
The risk strategy pursues the fundamental aim of minimis-
ing operational risks by using approved methods of system
development and comprehensive test procedures. EEX Group
either provides core services itself or has them performed by
selected specialised, external partners. Individual services
are also provided by specialised companies which are part
of Deutsche Börse Group. The quality of the service providers
is reviewed in the context of selection processes and contin-
uously on the basis of established service level agreements.
Furthermore, back-up processes are implemented for critical
business processes. The quality of the internal control system
is checked regularly with the help of examinations by internal
auditors and the targeted use of external auditors. There are
process descriptions and control activities for all fundamen-
tal processes. These are documented in checklists in order to
reduce the likelihood of human error. Operational risks are
identified and assessed throughout the Group in the context
of an annual self-assessment.
In addition to this, professional liability insurance with regard
to errors in commercial activities (E&O insurance) has been
taken out.
A damage incident database is maintained for the on-going
monitoring and reporting of cases of malfunctions during
operations. All untoward incidents which occur in the course
of operations — even where not leading to any direct financial
loss — are recorded in this database and analysed in coopera-
tion with responsible members of the Management Board on
a monthly basis and, if required, preventative measures are
adopted and implemented.
LIQUIDITY RISK
Liquidity risk is defined as the risk that the EEX Group might
not be able to fulfil its payment obligations at a point in time
agreed on under a contract. Due to the business strategy
pursued, the current operations do not lead to any essen-
tial incongruities of dates within EEX Group. The financing
need for current expenses and investments is identified and
concluded within the context of medium-term planning. Any
possible gaps in financing are closed or avoided by provid-
ing sources of liquidity within the Group. Structural liquidity
risk is monitored within the context of the medium-term plan,
which is prepared every year, and through on-going liquidity
management. The aim is to specify the liquidity reserve and
credit lines in planning in such a way as to ensure that suf-
ficient liquidity is available in all eventualities. The invest-
ment guideline only permits investments of free liquidity
with counterparties with a good credit standing and within
approved limits. Further, the maximum term is limited so
that sufficient liquidity is available at all times in the event of
short-term demand.
The risk of a default of a Clearing Member and its impact on
liquidity at ECC are controlled according to the requirements
under EMIR Article 44 in conjunction with the delegated reg-
ulation 153 / 2013 by means of the following:
> High requirements regarding the realisability
of collaterals received;
> Adequate safety discounts on collateral provided;
> Provision of liquid resources which, at least, provide the
liquidity required in the event of the stress test scenario
(concurrent default of the two Clearing Members which
generate the highest liquidity demand in extreme yet
plausible market conditions)
On a daily basis, ECC generates a liquidity report regarding
the available liquid resources as well as the liquidity require-
ment under the stress test scenario. Moreover, potential
sources of liquidity risks are recorded in the liquidity plan
which is updated every quarter and submitted to the overall
Management Board.
78 Annual Report 2016

Management Report Visions Guest Contribution Corporate Responsibility Financial Report Consolidated Management Report
Risk and Opportunities Report
BUSINESS RISK
Business risks are defined as effects resulting from the market
entry of new competitors, regulatory or other legal amend-
ments, technical changes or modifications of the product envi-
ronment which have a negative effect on the earnings position
in the medium to long term.
These risks are monitored by means of analysing information
on competitors, customers, products and markets. Further-
more, the effects which certain price and volume changes
have on earnings of EEX Group are analysed in the context of
scenario calculations.
STRICTER REGULATION IN THE FINANCIAL
AND ENERGY SECTOR AS A RISK FOR EEX
Regulation on capacity allocation and congestion management (CACM)The EU regulation specifying a guideline for capacity alloca-
tion and congestion management (CACM) outlined in the sec-
tion “Regulatory Framework Conditions” and the introduction
of the Nominated Electricity Market Operator (NEMO) con-
tained therein entail risks for EEX Group. In the future, NEMOs
can use the market depth and the development status of EPEX
SPOT with the aim of implementing uniform day-ahead mar-
ket coupling and uniform intraday market coupling, and as a
result benefit from existing liquidity without necessarily con-
tributing additional liquidity themselves. On the other hand,
CACM creates the possibility to offer day-ahead and intraday
trading services with delivery in other member states without
the need for a NEMO to be appointed in this member state or
actively operating in that state previously. This reciprocity
creates uniform conditions for power market operators in
Europe, namely a “level playing field”. For EEX Group, this
means the possible market entry of competitors into EPEX
markets. However, it also entails the possibility of developing
new market areas.
COMPLIANCE RISK
EEX Group is exposed to potential compliance risks primar-
ily in the fields of sales tax fraud, damage to its reputation
on account of the unauthorised publication of information
and abuse through money laundering and / or the financing
of terrorism. Furthermore, as a credit institution, ECC has to
ensure that transactions are not concluded with individual
persons or legal entities which are included in the relevant
sanctions lists.
Within EEX Group, ECC settles all fundamental payments. In
turn, ECC settles all payments via Clearing Members or settle-
ment banks. These institutions are subject to the rules of the
German Banking Act (KWG) or other, equivalent European
provisions which require the implementation of measures
to combat these risks. Therefore, ECC has a low risk of being
abused for the purposes of money laundering, financing of
terrorism or fraud. This risk is re-evaluated every year in the
context of a risk analysis.
In addition, know-your-customer measures are intended to
identify suspicious counterparties during the initial stages of
the business relationship. In case of doubt in the admission
process, a decision by the Management Board is requested.
As a supplement to this, continuous monitoring processes are
undertaken at ECC (essentially for detecting sales tax fraud)
and by the Market Surveillance departments of the markets.
Moreover, all business partners, including important associates
of these business partners, are continuously (and on an ad-hoc
basis, if necessary) checked against known sanctions lists.
Sensitive data requiring specific protection are required to be
treated as being confidential and protected against unautho-
rised access in accordance with internal instructions. In order
to prevent conflicts of interest, rules of conduct have addi-
tionally been established for staff.
79

With reference to excessive speculation and high volatility
on the agricultural market, MiFID II / MiFIR introduced des-
ignated position limits which also apply to trading in energy
derivatives. These are specified in more detail in the regula-
tory technical standards no. 21, which have now been submit-
ted. The underlying “baseline limits” for energy derivatives
appear acceptable.
In addition, certain physical derivatives on gas and power
which are traded over the counter are not classified as finan-
cial instruments. This means that trading in such derivatives
is not regulated via MiFID II. These less regulated products
can only be traded on platforms referred to as “Organised
Trading Facilities (OTFs)”. Trading transactions which are
concluded at an OTF are exempt from MiFID II, while simi-
lar transactions concluded on a regulated market or on an
exchange are covered by the scope of application of MiFID
II. As a result, OTFs have a regulatory advantage in respect
of physical power and gas derivatives trading and there is
the risk of a shift in volumes from the exchange towards the
OTFs. This can lead to a general restraint on the part of play-
ers in trading with EEX products. A general decline in trading
activities also seems feasible. In order to counter this, EEX
and Powernext set up a designated Non-MTF as a precursor to
an OTF in 2016. As soon as an OTF licence can be applied for,
EEX and Powernext will do this accordingly. This will enable
the customers of EEX Group to use the OTF exemption under
MiFIDII / MiFIR and, at the same time, prevent them from ceas-
ing exchange trading.
EU Markets in Financial Instruments Directive (MiFID)The Management Board considers the definition of financial
instruments within the European MiFID II regulatory directive
as being a risk for EEX. The revised EU Markets in Financial
Instruments Directive (MiFID II) changes the rules for trading
in financial instruments and, as a result, in commodity deriva-
tives. The general exception for commodity derivatives, which
has applied under MiFID I so far, has been cancelled and
replaced by a designated “ancillary activity exemption”. As
a result, only trading participants with relatively low trading
activities (compared to their other activities) will be exempt
from MiFID II requirements in the future. Those trading par-
ticipants that are subject to MiFID II because they exceed
certain thresholds, however, are considered “financial institu-
tions”. As a result, these companies have to fulfil a number of
additional requirements, such as organisational and capital
requirements. Therefore, the implementation of these rules is
also expected to have significant impacts on energy markets.
Further details on the implementation of MiFID II / MiFIR were
presented in the context of designated regulatory technical
standards (RTS), the final version of which has been available
since December 2016. These RTS, for example, contain pro-
posals regarding threshold values for the determination of the
ancillary activity exemption as well as clarifications regarding
publication and reporting requirements. This is positive in so
far as the designated “Capital Employed Test” has become a
firm element of the regulation. This means that invested cap-
ital is used in the calculation of the ancillary activity exemp-
tion. The specific application is elaborated further at the level
of the European regulator (ESMA) and the national regula-
tors (designated “Level 3”). In practice, it remains to be seen
whether and to what extent the customers of EEX Group will
be affected by these stricter rules and regulations. It is undis-
puted that the overall requirements will increase and that
every company will have to deal individually with the new
regulatory landscape.
80 Annual Report 2016

Management Report Visions Guest Contribution Corporate Responsibility Financial Report Consolidated Management Report
Risk and Opportunities Report
EU Benchmark RegulationIn response to the manipulation of certain financial market
indices, such as the reference interest rates in the interbank
business, LIBOR and EURIBOR, industry standards for finan-
cial benchmarks (IOSCO) and, based on IOSCO, EU regulation
2016 / 1011 regarding indices used as benchmarks have been
developed. The far-reaching proposed regulation by the EU
Commission took effect on 8 June 2016 and will apply compre-
hensively from January 2018. It provides for benchmarks to
be regulated according to their size and the origin of the data,
making the preparation and administration of indices more
transparent and overcoming conflicts of interest. Commodity
benchmarks will also be part of the scope of application of
this regulation and, depending on the origin of the underly-
ing data and market sizes, could have corresponding impacts
on individual indices of EEX Group. The regulation covers, in
particular, the designated administrators of benchmarks, i.e.
those entities holding responsibility for benchmarks. By April
2017, the level II process, as it is called, will be carried out
with the preparation of regulatory technical standards. This
will be followed by the further development of the regulation
in the context of the level III process involving national reg-
ulatory authorities. Based on currently available information,
the individual companies of EEX Group will be affected by this
regulation; however, there are exemptions. Further, commodity
benchmarks in niche markets which have a corresponding ly
limited external effect are entirely exempt from the regula-
tion. This should apply to some of the benchmarks for which
EEX Group currently operates as an administrator. As a neu-
tral index provider, EEX Group is taking precautions regarding
the group-wide implementation of the benchmark regulation.
Moreover, EMIR uses the definition of financial instruments
provided in MiFID so that these over-the-counter physical
derivatives are also not regulated by EMIR. As a result, trad-
ing in such physical derivatives has significant regulatory
advantages as compared to the products offered by EEX
(no need to obtain a financial services licence along with the
requirement of providing corresponding equity, no position
limits, no reporting requirements and no mandatory clear-
ing according to EMIR, etc.). As a result, volumes which are
re gistered for clearing using the Trade Registration channel
are also subject to this risk since derivatives which are traded
OTC are converted into financial instruments in the Trade
Regis tration process.
Financial transaction taxThe introduction of a common financial transaction tax in
individual EU countries — including Germany — is still subject
to political negotiation. The question of how a financial trans-
action tax will be introduced and if, or in what manner, deriv-
atives will be covered, remains unanswered. Even if it is anti c i -
pated that such a tax would have the lowest possible effect
on the real economy, it could nevertheless have an enduringly
negative impact on derivatives trading. The tax could, in par-
ticular, lead to a shift in trading activities to trading platforms
in countries not affected by such a tax.
81

As seen from the perspective of the exchange, the draft of
the electricity market law can be assessed as being positive
in principle. The commitment to free pricing, in particular,
ensures that the exchange price signal will remain the rele-
vant decision-making basis for market players in the future.
In particular, the commitment to free pricing ensures that the
exchange price signal will continue to form the fundamental
decision-making basis for market players. Invitations to ten-
der under the EEG are an important step towards the further
market integration of renewable energies. Pilot invitations to
tender for ground-installed photovoltaic systems which have
already taken place were positive and showed that this com-
petitive tool can be used to reduce subsidy costs. It remains
to be seen whether the commitment to free pricing will be
implemented consistently in the coming years, as required by
the electricity market law, or whether the market price signal
will be weakened by regulatory interventions into the market,
which is also legitimated by the electricity market law.
While Germany has already paved the way for the “Power
Market 2.0”, the debate on energy market design continues
at a European level. At the end of 2016, the EU Commission
presented a package comprising numerous legislative mea-
sures for the further development of the power market and
the integration of renewable energies. The Commission also
placed well-functioning power markets and strong price sig-
nals at the centre of its considerations. At the same time, the
aim is to prevent uncoordinated national measures which
impair cross-border trading and cause increased costs for
consumers. One example of this is capacity mechanisms, with
respect to which there have been a range of different views
and approaches taken by individual EU member states so
far. To this end, the Commission aims to achieve the highest
possible harmonisation of standards at a European level and
to enforce non-discriminatory cross-border access to these
market segments. As seen from the perspective of EEX Group,
the basic trend and most of the proposals contained in the
package can be regarded as being positive since they reflect
CHANGE IN ENERGY MARKET DESIGN
Energy turnaround and power market designThe increasing transformation of the energy markets to cater
for renewable energies creates challenges for current market
design and will require it to be modified and further devel-
oped. In addition to the market integration of renewable ener-
gies, this will also have effects on other fields, such as grid
expansion or aspects of the security of supply in the event of
fluctuating renewable energies not being able to sufficiently
cover load requirements.
In Germany, the federal government took a fundamental deci-
sion last year and created a framework for the power market
of the future with the new Electricity Market Act. The Elec-
tricity Market Act focuses on the price signal, which is essen-
tially established on exchanges, as well as the competitive
and innovative strengths of the market. To this end, the Act
contains, for example, a “commitment” to free market pricing
and a self-imposed restriction against political intervention. A
capacity reserve is to be introduced in order to ensure the secu-
rity of supply. In addition, a number of supporting provisions
are defined in detail. These pursue the aim of further develop-
ing the power market and, in particular, enhancing its flexibil-
ity. The measures include increasing balancing group responsi-
bility as well as grid- and transparency-related measures.
In addition, the Renewable Energies Act (EEG) was also revised
last year. In this context, a particularly important innovation
is the fact that the subsidy amount is no longer set adminis-
tratively by the legislator but determined on a competitive
basis as part of invitations to tender.
As seen from the perspective of the exchange,
the draft of the electricity market law
can be assessed as being positive in principle
82 Annual Report 2016
Management Report Visions Guest Contribution Corporate Responsibility Financial Report Consolidated Management Report
Risk and Opportunities Report
At present, talks involving the transmission system opera-
tors and power exchanges concerned are underway in order
to prepare for such a step. As seen from the perspective of
EEX Group, care has to be taken to ensure that any division,
if actually implemented, is carried out with the least possible
impact on the market.
General political uncertaintyWhile, in principle, trading markets are subject to the influ-
ence of the political environment, uncertainty regarding the
stability of the political framework has increased recently.
This for example, includes the United Kingdom’s vote to leave
the European Union, which reflects its scepticism about or
even rejection of the European Union as such. In addition,
a strengthening of movements in some European countries,
which reject established institutions of the political systems,
has been observed. Further, Donald Trump’s success in the
US presidential elections is also a reflection of this develop-
ment. From a market perspective, the impact of these political
changes on energy markets via changes in energy policy and
international trading remains to be seen.
confidence in competitive and market-based principles. How-
ever, care has to be taken to ensure that the ambitious targets
and proposals of the Commission are supported by all parties
involved in the European Parliament and member states and
are not watered down in the further course of the legislative
process, which is expected to last for two years.
Power market: Configuration of price zonesEven though, as an overall trend, focus is to be increasingly
placed on market mechanisms and pricing signals, the exact
design of bidding zones within the European market is still
being discussed, leading to continued uncertainty. The preser -
vation of the German-Austrian price zone, in particular, is
being increasingly called into question without sufficient con-
sideration of possible effects on the trading market, and in
particular the power derivatives market. Most recently, at the
end of October 2016, the Federal Network Agency called upon
German transmission system operators to make preparations
for congestion management at the German-Austrian border
from mid-2018 onwards. At the same time, there are further
processes at the European level at ACER and ENTSO-E that
deal with the design of the price zones in Europe and that can
potentially also have an impact on the German-Austrian mar-
ket area. So far, it remains unclear which process will actually
apply, and who will take final decisions. This dispute is also
obvious from the fact that individual players — in particular
from Austria — have already announced that they would take,
or have even already initiated, legal steps against decisions
by ACER and the Federal Network Agency referring to a lack of
competence or an incorrect legal basis.
Irrespective of the final design, negative effects on the mar-
kets of EEX Group would in any case have to be expected.
This does not only concern liquidity (which would be lower
in smaller market areas) but also the quality of the price
signal. Against the backdrop of the further development of
the market design through the envisaged strengthening of
the price signal and increased flexibilisation, both of these
effects appear to be counterproductive. The potential of mar-
ket-based European integration and innovations cannot be
fully developed in this way. There is even the risk that the
aims achieved with liberalisation — in particular, the integra-
tion of the European power markets — might be called into
question and permanently impaired.
83

CHALLENGING MARKET ENVIRONMENT
FOR THE CUSTOMERS OF EEX GROUP
The great majority of EEX Group customers primarily consist
of energy and utility companies, transmission system opera-
tors, commodity traders and commodity hedge funds.
As a consequence of the energy transition, energy and util-
ity companies are facing far-reaching strategic and financial
challenges which could, ultimately, lead to their withdrawal
from the markets of EEX Group, as has already happened in
individual cases. The decline in revenue associated with the
energy transition with a concurrent increase in depreciation /
amortisation and provisions for the decline of conventional
power generation puts a significant strain on the profitabil-
ity of these companies. The current situation has effects on
the willingness of energy and utility companies to pay for
exchange trading activities as well as credit assessments of
external investors and, as a result, on the energy and utility
companies’ ability to provide collateral for exchange transac-
tions. On the other hand, the decline in the credit assessment
of trading participants leads to the reduction of bilateral
credit lines, as is usual in OTC trading. In part, this has led to
a shift from over-the-counter trading to the exchange and, as
a result, it has had a positive impact on the business of EEX
Group.
In addition, commodity hedge funds have been under pres-
sure for some time because of the developments in the global
commodity markets. As a result, it cannot be excluded that
individual funds might close.
Intensification of competitionIncreasing competition and price pressures form a further
significant risk. Over the last few years, all three main com-
petitors of EEX Group (NASDAQ OMX, ICE and CME) have
introduced power and gas products in the most important
European market areas. Tab25
At present, the competitors’ success in the power derivatives
markets of EEX Group is not excessive. Only NASDAQ OMX
generated any noteworthy volumes on the German power
derivatives market. In the gas markets, in turn, ICE recorded
significant volumes in part. It can be expected that the very
positive development of exchange-traded volumes on the
European energy markets will lead to the intensification of
competition, for example in the form of price wars and fur-
ther market entrants. As a result of new regulatory provisions,
increasing competition between broker and exchange trad-
ing platforms is conceivable. The entry of competitors both
into existing markets and into growth markets of EEX Group
entails the risk of losing the possibility to influence the design
of the European energy markets and of inability to reach the
Group’s desired business objectives.
Presence of the main competitors
on the core markets of EEX Group 25
NASDAQ OMX ICE CME
Power derivatives market
Germany / Austria x x x
Italy x x x
France x x x
Gas spot markets
Germany x
Netherlands x
France
Gas derivatives markets
Netherlands x x x
Germany x x
France x
The decline in the credit assessment of trading
participants leads to the reduction of bilateral credit
lines, as is usual in OTC trading. In part, this has
led to a shift from over-the-counter trading to
the exchange and, as a result, it has had a positive
impact on the business of EEX Group
84 Annual Report 2016

Management Report Visions Guest Contribution Corporate Responsibility Financial Report Consolidated Management Report
Risk and Opportunities Report
The increase of the attractiveness of EEX Group markets can
be achieved via various measures. On the one hand, the qual-
ity of individual order books can be enhanced by improving
liquidity in the order books and reducing the bid-ask spread
by means of the acquisition of additional market makers or
liquidity providers. Targeted price measures also offer the
opportunity to increase the attractiveness of the markets of
EEX Group. Moreover, the establishment of new representa-
tive offices raises the presence of EEX Group in local markets
and, as a result, ensures increased awareness.
The enhancement and expansion of clearing services directly
improves the competitive position of ECC as a clearing house.
All measures which reduce, on the one hand, entry barriers
(which are relevant, in particular, for smaller trading partici-
pants) and, on the other, the costs of clearing, can lead to the
addition of further clearing participants. Further, the intro-
duction of new services and the connection of new partner
exchanges are also relevant here. Against the background of
increasingly stringent regulatory requirements and therefore
the growing importance of clearing worldwide, this consti-
tutes a significant opportunity to improve the positioning of
ECC in the global clearing business.
Product innovations tailored to customers’ requirements can
provide EEX with significant opportunities for increasing its
market share. EEX Group can respond to changing conditions
by developing new customized products or by adjusting the
existing product portfolio. Examples include the day and week
futures introduced on the power derivatives market due to the
energy transition or the implementation of further short-term
products in the gas segment. In this context, the release of
Wind Power Futures is also worth mentioning.
ESSENTIAL OPPORTUNITIES
ORGANISATION OF OPPORTUNITY MANAGEMENT
Within EEX Group, management of opportunities is carried
out in the context of strategic management, corporate and
product development as well as the continuous improvement
process. Based on an analysis of strengths and weaknesses,
which is updated regularly, opportunities are identified for
entry into new markets or strengthening the market position
in existing markets via sophisticated products or processes,
an improved cost base, new pricing strategies or new partner-
ships. The projects are then prioritised as part of the annual
strategy discussion and planning processes as well as project
portfolio management. In this context, the added value as seen
from the perspective of the customer is taken into account,
as well as strategic aims and available resources. Essential
opportunities are characterised by a significant impact on
the assets, financial and earnings position and, as a result,
are regularly submitted for profitability assessments during
the prioritisation phase. These assessments are recorded in a
business plan, along with any major quality assumptions. In
this context, financial analysis (costs, revenue, cash flows and
net present value) is conducted for a multi-year period.
ORGANIC GROWTH POTENTIAL
Generally, there is organic growth potential for EEX Group, in
particular, by growing its market shares in the existing mar-
kets and by developing new markets.
The market share in existing markets can be expanded by
means of the following measures:
> Further increase in the attractiveness of EEX Group
as a trading platform;
> Further improvement and expansion of the
Clearing Services;
> Product innovations.
85

account of individual risks or aggregated risk positions. Since
there are further noteworthy — in particular, industry-specifi c —
risks, setbacks en route to the enduring implementation of
the growth aims envisaged cannot be fully excluded.
Overall, in view of its innovative and increasingly diversified
product and service offering, as well as its earnings power
and financial strength, EEX Group sees itself as being well pre-
pared to achieve its aims and to strengthen and / or defend its
position with respect to intensified competition. This is due
to the competitive value chain within EEX, which is charac-
terised by liquid trading platforms and cost-effective clearing
solutions, as well as further services. EEX Group has set itself
the aim of achieving ambitious growth rates in the future and
increasing its market share in the medium term.
The Group is confident that the risk and opportunities man-
agement system established within the company will also rec-
ognise risks and opportunities early on in future and that, as
a result, the current risk position can be met successfully and
opportunity potentials can be realised.
INORGANIC GROWTH POTENTIAL
In the future, opportunities might again arise for EEX Group
to expand its activities inorganically. In this context, both
partnerships and acquisitions can play an important role
with a view to strengthening existing markets and a focus
on regional expansion and extension of the product offer-
ing. Inorganic growth supports the achievement of the stra-
tegic aim of establishing EEX Group as a globally operating
exchange for commodity products.
GENERAL STATEMENT ON THE RISK AND OPPORTUNITIES POSITION
In spite of growing uncertainties, in particular due to grow-
ing financial burdens on the large energy groups (which are
important trading participants of EEX Group) and increasing
regulatory developments in both the financial and the energy
sector, the risk assessment for the 2016 financial year has not
indicated any threat to the Company’s continued existence on
86 Annual Report 2016

Management Report Visions Guest Contribution Corporate Responsibility Financial Report Consolidated Management Report
Outlook Report
The forecasts listed below are essentially based on the fol-
lowing assumptions regarding the economic, regulatory and
competitive environment in 2017:
> Potential changes within the regulatory environment
(in particular with regard to OTF) do not have a detrimental
impact on regulated platforms;
> No impairment as a result of regulatory changes affecting
financial markets (for example higher capital requirements
for Clearing Members, no introduction of a financial trans-
action tax);
> No negative impact on the liquidity of the core markets as
a result of changed power market design and, in particular,
a possible division of the German-Austrian market area or
through the introduction of capacity markets;
> No development of price wars with competitors.
Further growth of the sales revenue in all business areas is
expected for the financial year 2017, with the power and gas
markets foreseen as being the essential drivers. This is mainly
supported by the growing market share of EEX Group on the
power derivatives markets and the further development of the
wholesale gas markets while concurrently expanding the gas
market share of EEX Group. Furthermore, because of the con-
stant growth in liquidity on the EEX Group trading platforms
as well as the improvement and expansion of the product
and service offering and the technical availability for the cus-
tomer, growth of the number of trading and clearing partici-
pants is expected to continue in the future.
The attainment of these growth aims requires additional
expenses for product development and projects, for IT infra-
structure and an increase in staff numbers, which means that
fixed costs are expected to increase.
COMPARISON OF EARNINGS POSITION WITH FORECAST FOR 2016
EEX Group significantly exceeded the range of sales revenue
forecast for the year under review, as well as earnings before
taxes, as a result of the very successful development in the
power derivatives markets as well as the gas markets. Fur-
thermore, the 2016 forecast did not include the full consol-
idation effects of the new companies PXE, Gaspoint Nordic
and PCG. Tab26
OUTLOOK FOR THE 2017 FINANCIAL YEAR
The outlook report describes the probable development of
EEX Group in the 2017 financial year. It contains statements
and information regarding processes which lie in the future
and is based on current expectations, assumptions and fore-
casts of the Management Board and on the information avail-
able at present. These forward-looking statements cannot be
considered as guarantees regarding the future developments
and events referred to therein. Instead, the future develop-
ments and results depend on a large number of factors. They
involve different risks and uncertainties and are based on
assumptions which might turn out to be inaccurate. The Group
does not assume any obligation to update the forward-looking
statements made in this report.
4 OUTLOOK REPORT
Sales revenue and earnings before taxes 26
kEUR Forecast 2016 Actual 2016
Sales revenue 187,391 — 206,586 234,158
Earnings before taxes 42,387 — 57,492 87,629
87

If, contrary to expectations, conditions do not develop as out-
lined above, EEX is convinced that it will still be able to ope-
rate its business profitably because of its successful business
model. Sensitivity analyses have shown that a decline in sales
of 10% as against budget would correspond to a decline in
profits of approximately 25%. In this context, it was for exam-
ple assumed that variable costs would develop in line with
transaction revenue and that all further cost items would be
kept constant. Subject to these assumptions, a decline in turn-
over of approx. 40% could be coped with, without bringing
about negative earnings before taxes.
OVERALL STATEMENT ON THE FUTURE DEVELOPMENT OF EEX GROUP
As a result of its diversified business model, EEX Group is
convinced that it is very well prepared and expects a positive
development of its earnings position in the coming year as
well as in the medium term. In 2017, the focus will be on the
further development of the position in individual markets, the
development of new markets, as well as the continuing inte-
gration of acquisitions from 2015 and 2016 into the corporate
group. The further strengthening and expansion of the good
position established within a competitive environment, in
particular, on the power spot and derivatives market as well
as the gas markets, forms the strategic aim for the coming
financial year.
As a result, increased earnings before taxes are expected,
ranging from kEUR 86,056 to kEUR 95,114. Tab27
Increased earnings before taxes 27
kEUR 2017 forecast 2016 actual
Power Derivatives 95,800 — 105,884 87,206
Power Spot 69,202 — 76,487 67,534
Natural Gas 37,442 — 41,383 32,846
Market Data Services 5,196 — 5,743 5,019
Environmentals 4,566 — 5,047 2,479
Clearing-Services 809 — 894 1,727
Global Commodities 1,934 — 2,138 501
Agriculturals 317 — 350 326
Other revenues 37,933 — 41,926 36,520
Sales revenue 253,200 — 279,852 234,158
Net income from banking transactions 0 –59
Other operating income 247 — 272 2,856
Volume-related costs –39,123 — –43,241 –21,218
Net revenue 214,323 — 236,884 215,736
Non-variable costs –128,312 — –141,819 –128,607
EBIT 86,011 — 95,065 87,129
Financial result 44 — 49 472
Income from at-equity investments 0 28
EBT 86,056 — 95,114 87,629
Income taxes –28,732 — –31,756 –29,898
Net profit for the period 57,324 — 63,358 57,731
The strategic aim of the coming year
will be to further strenghten and expand
the position amongst competitors, especially
when it comes to the spot and derivatives
markets as well as natural gas markets
88 Annual Report 2016

Management Report Visions Guest Contribution Corporate Responsibility Financial Report Consolidated Management Report
EEX AG
Because of the structure of EEX Group and EEX’s position
as a parent company within the Group, EEX participates in
the development of all business areas within the Group in
accordance with the respective shareholdings via profit and
loss transfer agreements and dividends. With regard to state-
ments on business development and the general framework
reference is made in the report on the “Economic position” of
EEX Group and the corresponding sections “Macro-economic,
industry-specific and regulatory framework conditions” and
“Business development”.
EARNINGS POSITION
In the past financial year, EEX was able to further significantly
improve its earnings position. The very positive development
of the subsidiaries of EEX and, as a result, the income from
shareholdings drove this strong growth. In the past financial
year, the total revenue of EEX — the sum of sales revenue,
other operating income and the income from sharehold-
ings — was kEUR 127,107 and, hence, 67% higher than in in 2015
(kEUR 76,330). The resulting annual net profit was kEUR
66,132 as against kEUR 20,656 in the previous year, thereby
increasing by 220%. Tab28
BUSINESS AND GENERAL FRAMEWORK
Unlike the consolidated financial statement, the annual finan-
cial statement of EEX is not prepared in accordance with
the International Financial Reporting Standards (IFRS) but
according to the provisions of the German Commercial Code
(HGB) as well as the supplementary provisions of the German
Companies Act (AktG).
EEX is the parent company of EEX Group. It offers derivatives
trading for coal and freight as well as for guarantees of ori-
gin. It operates the Market Data Services business area for
all subsidiaries based in Germany and provides the technical
application landscape for the customers of these companies.
Furthermore, it is the central service provider for its subsidi-
aries in the context of service level agreements.
Statements on the shareholding structure, the shareholder
and capital structure as well as the corporate management
of EEX are provided under the section “Group overview and
basic information” in the “Business activities and group struc-
ture” subsection. Information on strategy and research and
development is also provided in the corresponding sections
on EEX Group.
5 EEX AG (NOTES BASED ON HGB [GERMAN COMMERCIAL CODE])
Profit and loss account of EEX AG 28
kEUR 2016 2015 after BilRUG6 2015 before BilRUG
Sales revenue 28,424 24,194 5,916
Other operating income 1,225 2,816 21,095
Staff costs 17,161 15,659 15,659
Depreciation, amortisation and impairment losses 3,850 2,835 2,835
Other operating expenses 19,868 17,611 17,611
Investment income 97,458 49,320 49,320
Other interest and similar income 473 34 34
Depreciation / reversal of impairments on financial assets 129 11,637 11,637
Interest and similar expenses 263 151 151
Income taxes 20,175 7,813 7,813
Other taxes 1 2 2
Net profit for the period 66,132 20,656 20,656
6 Reporting of revenue from service level agreements as sales revenue according to BilRUG (Accounting Directive Implementation Law)
89

OTHER OPERATING INCOME
In the 2016 financial year, other operating income was
kEUR 1,225 (previous year: kEUR 2,816). This decline is largely
due to a one-off effect in 2015. After adjustment for this one-
off effect, other operating income rose by kEUR 468, essen-
tially because of increased income from the reversal of pro-
visions as well as exchange rate gains during the reporting
period.
EXPENSES
During the reporting period, EEX staff costs increased by 10%,
from kEUR 15,659 to kEUR 17,161. This was mainly caused by
a staff increase of 17% during the past financial year (see also
“Employees of EEX AG” in this regard).
Compared with 2015, depreciation, amortisation and impair-
ment losses rose by kEUR 1,014 to kEUR 3,850. This increase
(36%) is due to the ongoing high investments in IT systems.
These are necessary for the:
> Optimization of IT infrastructure and IT processes;
> Implementation of system adjustments for the intro-
duction of new markets and products;
> Fulfilment of regulatory reporting requirements.
In total, other operating expenses grew from kEUR 17,611 to
kEUR 19,868 during the reporting year. These are to a sig-
nificant degree determined by expenditures for IT systems,
consultancy, marketing and infrastructure. This increase in
expenses was primarily connected with:
> The further integration of the subsidiaries added in 2015
and 2016 as well as the strengthening of EEX as a group;
> The implementation of new strategic projects;
> The constant optimisation of IT infrastructure and IT
processes as well as the general expansion of the business
area with effects on IT systems;
> Increasing regulatory requirements;
> The growth of the entire corporate group and the resulting
increasing costs for infrastructure and travelling.
SALES REVENUE
In the 2016 financial year, EEX generated sales revenue of
kEUR 28,424, which corresponds to a 17% increase as against
the previous year (kEUR 24,194). This consists of transaction
fee revenue from the trades concluded at EEX, other sales rev-
enue and revenue from the provision of services in the con-
text of the intragroup service agreements. In this context, the
latter made a significant contribution to the increase in sales
revenue in the past financial year.
During the reporting year, transaction revenue of kEUR 10 was
generated from trading in freight contracts at EEX (previous
year: EUR 0). As in the previous year, EEX did not generate any
transaction revenue in trading in coal and guarantees of origin.
The other sales revenue consisted of revenue from technical
connections (kEUR 2,732; previous year: kEUR 2,750), revenue
from marketing of information products and transparency data
as well as regulatory reporting (kEUR 2,666; previous year:
kEUR 2,081), training fees (kEUR 373; previous year: kEUR
393), annual fees (kEUR 126; previous year: kEUR 692) and
further other sales revenue (kEUR 179; previous year: kEUR 72).
In the past financial year, the revenue from intragroup ser-
vice agreements of kEUR 22,338 (previous year: kEUR 18,206)
formed an essential sales component of EEX. In its capacity
as the parent company of EEX Group, EEX provides a wide
range of services, such as IT services, management services
and administrative services, for its subsidiaries. The costs of
these services are charged via service level agreements. In
addition to the provision of additional services for the subsid-
iaries, the increase in sales is particularly due to the growing
cost base of EEX.
90 Annual Report 2016

Management Report Visions Guest Contribution Corporate Responsibility Financial Report Consolidated Management Report
EEX AG
FINANCIAL RESULT
During the reporting year, the financial result (consisting of
interest income and expenses as well as appreciations and
depreciation / amortisation in the value of financial assets)
was kEUR 81 (2015: kEUR –11,754). However, the previous
year included a one-off loss from the impairment of the share-
holding in CLTX. The 2016 financial result essentially included
interest income from tax receivables, interest expenses for
internal and external credits as well as an impairment loss of
the store-x shareholding.
COMPARISON OF THE EARNINGS POSITION
WITH THE 2016 FORECAST
While the result before taxes for the reporting year was fore-
casted between kEUR 28,929 and kEUR 36,627, the actual
result before taxes was kEUR 86,309. In this respect, EEX
benefited from the positive development of its business areas
and therefore significantly higher investment income, in par-
ticular, from ECC and EPD as well as from the high dividend
payment of Powernext.
INVESTMENT INCOME
As a result of the structure of EEX Group and the position of
EEX as the parent company within the Group, EEX participates
in the development of its subsidiaries and, as a result, of all
business fields within the group through profit-and-loss trans-
fer agreements and dividends.
EEX’s results were primarily driven by investment income,
which increased from kEUR 49,320 to kEUR 97,458 in the past
financial year. These results consist of income from share-
holdings in EPEX, Powernext and Gaspoint Nordic as well as
income or loss from the transfer of results of ECC, EPD, GEEX
and ACEX and the store-x dividend.
The significant increase of investment income during the
past financial year was essentially due to the strong growth
of the subsidiaries ECC and EPD. During the 2016 financial
year, they transferred results of kEUR 48,195 from ECC to
EEX (2015: kEUR 32,310) and kEUR 27,666 from EPD to EEX
(2015: kEUR 15,039). Furthermore, Powernext paid out a div-
idend of kEUR 23,147 (as against kEUR 3,171 in 2015) in the
past financial year.
In the 2016 financial year, EPEX paid a dividend from 2015
profits of kEUR 2,015 to EEX (2015: kEUR 2,212). Furthermore,
EEX took over losses totalling kEUR –4,387 (2015: kEUR
–3,429) as a result of the profit-and-loss transfer agreements
with GEEX and ACEX.
Until 30 June 2016, EEX’s investment portfolio also included
the 50% shareholding in Gaspoint Nordic, which distributed
kEUR 802 to EEX (2015: EUR 0). In addition, EEX received a div -
idend of kEUR 20 in respect of its 12% shareholding in store-x
as against kEUR 18 in the previous year.
As the parent company, EEX depends on the operating results
of its subsidiaries. The combined results from the sharehold-
ings account for 77% (2015: 65%) of the total results (consist-
ing of sales revenue, other operating income and investment
income).
91

ASSET POSITION
Tab29
Balance Sheet of EEX AG as at 31 December 2016 29
kEUR 31 / 12 / 2016 31 / 12 / 2015
ASSETS
A. Fixed assets 114,986 87,328
I. Intangible assets 7,437 6,392
II. Property, plant and equipment 978 1,114
III. Financial assets 106,571 79,822
B. Current assets 38,420 53,411
I. Receivables and other assets 24,760 52,669
II. Cash in hand and cash at bank 13,660 741
C. Accruals 535 592
153,941 141,331
LIABILITIES
A. Equity 129,282 70,348
I. Subscribed capital 39,992 39,992
II. Capital reserve 10,000 10,000
III. Retained earnings 46,224 10,029
IV. Balance sheet profit 33,066 10,328
B. Provisions 16,166 9,996
C. Liabilities 8,493 60,987
I. Liabilities to banks 17 16,149
II. Pre-payments received on orders 776 622
III. Trade payables 1,236 1,822
IV. Liabilities to affiliated companies 6,250 42,212
V. Other liabilities 213 182
153,941 141,331
92 Annual Report 2016

Management Report Visions Guest Contribution Corporate Responsibility Financial Report Consolidated Management Report
EEX AG
DEVELOPMENT OF EQUITY AND DEBT
EEX’s assets were financed through equity of kEUR 129,282
(2015: kEUR 70,348) and debt of kEUR 24,659 (2015: kEUR
70,983). The debt consisted of provisions of kEUR 16,166 and
liabilities of kEUR 8,493.
Compared with the previous year, provisions rose by kEUR
6,171 and essentially consisted of tax provisions (kEUR 7,218),
provisions for profit shares (kEUR 5,608), provisions for
outstanding invoices (kEUR 2,298) and for staff liabilities
(kEUR 518). In this context, the tax provisions specifically
were kEUR 4,990 higher than on the previous reporting date.
Liabilities were kEUR 52,494 lower than in the previous year.
They essentially consisted of liabilities to affiliated companies
(kEUR 6,250) and trade payables (kEUR 1,236). The significant
decline in liabilities compared to the previous year reflects
the repayment of a large part of the external and internal
credits which had been used to finance the strategic invest-
ments as of the reporting date in the previous year.
As at the reporting date, the EEX balance sheet total was
kEUR 153,941 as against kEUR 141,331 in the previous year. At
84%, the equity ratio at the end of the financial year was signi f -
icantly higher than in the previous year (50%) because of the
repayment of large parts of EEX AG’s credits. The equity ratio is
calculated as the proportion of equity and balance sheet total
as at the reporting date (31 December of the reporting year).
DEVELOPMENT OF ASSETS
During the year under review, the fixed asset value of
kEUR 114,986 increased by kEUR 27,658 and was prima-
rily shaped by the growth in value of financial assets by
kEUR 26,749 to kEUR 106,571. This growth is largely due to
an appropriation to ECC’s capital reserves of kEUR 25,000,
which raised the value of the shareholding accordingly. Fur-
thermore, this position also reflects the acquisition and sale
of shareholdings and, in particular, the proportionate acquisi-
tion of PXE (see section “Business activities and group struc-
ture”). Intangible assets and property, plant and equipment
rose by kEUR 909 to kEUR 8,416. This was driven by invest-
ments into the business data warehouse (system for the cen-
tral provision and processing of corporate data) and into the
Market Data Services business area (in particular, transpar-
ency platform and regulatory reporting).
As at the reporting date, the current assets of kEUR 38,420
(kEUR –14,991 compared to the previous year) essentially
consisted of accounts receivable from affiliated companies
in the amount of kEUR 23,253 (2015: kEUR 50,507), trade
receivables in the amount of kEUR 784 (2015: kEUR 766),
other assets in the amount of kEUR 723 (2015: kEUR 1,348)
as well as cash in hand and cash at bank in the amount of
kEUR 13,660 (2015: kEUR 741). The decline in accounts
receivable from affiliated companies reflects an adjustment
of the payment method regarding the profit-and-loss transfer
agreements between EEX and its subsidiaries in the way that
results generated are to be prepaid to EEX on a quarterly basis
instead of annual payments.
As at the reporting date, accruals were kEUR 535 (2015:
kEUR 592).
93

As at 31 December 2016, 90% of EEX’s workforce had a college
or university degree (as against 90% in the previous year).
This share is based on the number of employees who gradu-
ated from a university, college or vocational academy.
As at the reporting date, female employees accounted for 47%
of staff. As at 31 December 2016, there were 15 executive
positions in EEX (2015: 14), of which women held 4 (2015: 4).
RISK AND OPPORTUNITIES REPORT
The risks and opportunities for EEX, as well as the measures
and processes to be adopted when dealing with these risks
and opportunities essentially correspond to those of EEX
Group. For this reason, we refer to the “Risk and opportunities
report” of EEX Group. In principle, EEX holds a share in the
risks and opportunities of every shareholding and subsidiary
in accordance with its shareholding.
The description of the internal control system (ICS) requested
according to art. 289 para. 5 HGB was provided in the “Group
overview and basic information” of EEX Group within the
“Management control” section.
OUTLOOK REPORT
The probable business development of EEX is essentially sub-
ject to the same influences as EEX Group. Statements on this
are contained in the “Outlook report” of EEX Group.
FINANCIAL POSITION
Due to the positive business development in 2016, liquidity as
at the reporting date rose from kEUR 741 on the reporting date
of the previous year to kEUR 13,660. As a result, the solvency
of EEX was not at risk at any time during the year under review
and the company was able to cover the expenses resulting from
its business operations at all times. In order to secure EEX’s
liquidity requirements, there are also intra-group and exter-
nal credit lines which can cover short-term, additional liquid-
ity requirements as they arise. As a result of the amendment
of the payment method regarding the profit-and-loss trans-
fer agreements with its subsidiaries (quarterly pre-payment
instead of annual payment) the liquidity of EEX is additionally
protected.
EMPLOYEES OF EEX AG
In the 2016 financial year, EEX employed further staff members
and internalised existing temporary employment contracts.
As at the reporting date, there were 148 employees as against
126 employees as at 31 December 2015.
As at the reporting date, the age group of the employees was
as follows: Tab30
Age group 30
Age groupNo. of
employees Share
< 30 years 26 18%
30 to 39 years 83 56%
40 to 49 years 31 21%
> 50 years 8 5%
Total 148 100%
94 Annual Report 2016

Management Report Visions Guest Contribution Corporate Responsibility Financial Report
“The Management Board of European Energy Exchange AG,
Leipzig, declares in accordance with art. 312 AktG that the
company has received adequate consideration for every legal
transaction listed. The assessment was effected on the basis
of the circumstances at the time at which the legal transaction
was concluded.
During the period under review, there were no further legal
transactions in addition to the legal transactions listed and
we are not aware of any measures which would have to be
reported.”
OTHER NOTES
The annual financial statement of European Energy Exchange
AG, Leipzig, as at 31 December 2016 was prepared in accord-
ance with the provisions of the German Commercial Code
(HGB) in compliance with the supplementary provisions of
the German Companies Act (AktG).
STATEMENT BY THE MANAGEMENT BOARD
ACCORDING TO ART. 312 PARA. 3 AKTG
As a subsidiary of Eurex Zurich AG, EEX has prepared a depen-
dency report according to art. 312 AktG. The final statement
is as follows:
Consolidated Management Report
EEX AG
Post Reporting Date Events
European Energy Exchange AG and the shareholders of Nodal
Exchange Holdings, LLC agreed in principle on the acquisi-
tion of all shares in Nodal Exchange Holdings, LLC. The total
purchase price for all shares is in the low three digit million
US-Dollar range.
6 POST REPORTING DATE EVENTS
The closing of the acquisition shall take place shortly and is
still subject to customary conditions such as required regula-
tory approvals.
95

The 2016 consolidated financial statement of European Energy
Exchange AG, Leipzig, and its subsidiaries was prepared in
accordance with the International Financial Reporting Stan-
dards (IFRS) of the International Accounting Standards Board
(IASB) in the version in which these have to be applied in the
European Union.
The consolidated management report was prepared on the
basis of art. 315 HGB (German Commercial Code). The consoli-
dated management report was prepared based on the German
Accounting Standard DRS 20.
EEX AG (as the parent company of the Group) is not publicly
listed and does not use any organised markets (within the
meaning of art. 2 para. 7 of the German Securities Acquisition
and Takeover Act) by means of voting shares issued by it.
7 OTHER NOTES
96 Annual Report 2016

Management Report Visions Guest Contribution Corporate Responsibility Financial Report Consolidated Management Report
Other Notes
Steffen Köhler
Chief Operating Officer (COO)
Dr Dr Tobias Paulun
Chief Strategy Officer (CSO)
Iris Weidinger
Chief Financial Officer (CFO)
Leipzig, 3 March 2017
Peter Reitz
Chief Executive Officer (CEO)
Jean-François Conil-Lacoste
Executive
Director Power Spot Markets
Dr Egbert Laege
Executive
Director Gas Markets
Dr Thomas Siegl
Chief Risk Officer (CRO)
97

Rounding differences of ± one unit may occur in the tables for arithmetical reasons.
During the current year, the structure of the consolidated statement of comprehensive income was adjusted
to improve comparability within Deutsche Börse Group. In order to ensure comparability with the previous year,
the figures for the previous year were also reclassified accordingly.
Annual Report 2016

CONSOLIDATED STATEMENT OF PROFIT OR LOSS AND OTHER COMPREHENSIVE INCOME 100
CONSOLIDATED STATEMENT OF FINANCIAL POSITION 101
CONSOLIDATED STATEMENT OF CHANGES IN EQUITY 102
CONSOLIDATED STATEMENT OF CASH FLOWS 103
NOTES ON THE CONSOLIDATED FINANCIAL STATEMENTS 104
Principles and Methods 104
1. General principles 104
2. New standards and interpretations 104
3. Fundamental accounting and valuation methods 106
4. Estimates, valuation uncertainties and
discretionary decisions 114
5. Changes in the scope of consolidation 114
Notes on the Consolidated Profit and Loss Account 117
6. Sales revenue 117
7. Net revenue from banking transactions 117
8. Other operating income 117
9. Volume-related costs 117
10. Staff costs 117
11. Depreciation, amortisation and impairment losses 118
12. Other operating expenses 118
13. Financial result 118
14. Income from at equity investments 118
15. Income tax expense 118
16. Other comprehensive income 120
Notes on the Consolidated Statement
of Financial Position 121
17. Goodwill and intangible assets 121
18. Property, plant and equipment 123
19. Investment in associates and joint ventures, other equity
investments as well as other financial assets 124
20. Derivative financial instruments 124
21. Trade receivables 125
22. Other assets and income tax assets 125
FOR THE FINANCIAL YEAR 2016
CONSOLIDATED FINANCIAL STATEMENTS
23. Accounts receivable from associates 125
24. Restricted bank balances 125
25. Other cash and bank balances 126
26. Equity 126
27. Non-current provisions 126
28. Long-term liabilities 127
29. Current provisions 127
30. Trade payables 127
31. Cash deposits by trading participants 127
32. Other current liabilities 127
Notes on the Consolidated Statement of Cash Flows 128
33. Notes on the consolidated statement of cash flows 128
Other Notes 129
34. Classification of financial instruments as per IFRS 7 129
35. Financial risk and capital management 132
36. Treasury shares 132
37. Trust assets 132
38. Other financial liabilities and contingent liabilities 133
39. Auditor fees according to Sec. 314 No. 9 HGB
[German Commercial Code] 133
40. Relations with related parties and companies 133
41. Overview of shareholdings as at reporting date according
to Sec. 313 Para. 2 Nos 1 to 4 HGB
[German Commercial Code] 136
42. Waiver according to Sec. 264 Para.3 HGB and Sec. 264b
HGB [German Commercial Code] 137
43. Essential events after the reporting date 137
AUDIT REPORT 139

Consolidated Statement of Profit or Loss and Other Comprehensive Income
kEUR
Note 2016 2015
Sales revenue [6] 234,158 190,424
Net income from banking transactions [7] –59 396
Other operating income [8] 2,856 3,115
Volume-related costs [9] –21,218 –20,266
Net revenue 215,736 173,669
Staff costs [10] –52,898 –47,125
Depreciation, amortisation and impairment losses [11] –12,331 –20,936
Other operating expenses [12] –63,378 –56,228
Operating result 87,129 49,380
Financial income [13] 1,174 50,651
Financial expense [13] –703 –616
Financial result 472 50,035
Income from at equity investments [14] 28 46
Earnings before tax (EBT) 87,629 99,461
Income tax expense [15] –29,898 –20,411
Net profit for the period 57,731 79,050
Of which attributable to
shareholders of EEX AG 49,648 71,065
non-controlling interests 8,083 7,985
Reconciliation to consolidated comprehensive income
Net profit for the period 57,731 79,050
Other comprehensive income [16] –196 2,912
Total comprehensive income 57,535 81,962
Of which attributable to
shareholders of EEX AG 49,647 73,524
non-controlling interests [26] 7,888 8,438
CONSOLIDATED STATEMENT OF PROFIT OR LOSS AND OTHER COMPREHENSIVE INCOME
100 Annual Report 2016

Management Report Visions Guest Contribution Corporate Responsibility Financial Report Consolidated Financial Statements
Consolidated Statement of Profit or Loss and
Other Comprehensive Income
Consolidated Statement of Financial Position
CONSOLIDATED STATEMENT OF FINANCIAL POSITION
Assets
kEURConsolidated
Notes 31/12/2016 31/12/2015
Non-current assets 218,862 185,441
Goodwill [17] 57,257 52,075
Intangible assets [17] 116,387 113,764
Property, plant and equipment [18] 3,731 4,399
Investments in associates and joint ventures [19] 31 1,023
Other equity investments [19] 24 203
Derivative financial instruments [20] 31,388 4,473
Deferred tax assets [15] 10,044 9,504
Current assets 3,502,375 1,737,096
Derivative financial instruments [20] 10,569 2,142
Trade receivables [21] 376,658 269,925
Other assets [22] 13,831 20,085
Income tax assets [15] 151 1,266
Accounts receivable from associates [23] 313 405
Restricted bank balances [24] 2,973,739 1,321,049
Other cash and bank balances [25] 127,115 122,224
Total assets 3,721,238 1,922,537
Liabilities
kEURConsolidated
Notes 31/12/2016 31/12/2015
Equity 283,846 244,323
Subscribed capital [26] 39,992 39,992
Capital reserve [26] 10,000 10,000
Reserves [26] 77,269 34,029
Retained earnings [26] 93,951 94,669
Other results [16] 3,320 2,797
Non-controlling interests [26] 59,314 62,836
Long-term liabilities 63,835 40,775
Non-current provisions [27] 1,316 1,954
Derivative financial instruments [20] 31,388 4,473
Non-current liabilities [28] 219 2,204
Deferred tax liabilities [15] 30,911 32,144
Short-term liabilities 3,373,557 1,637,439
Current provisions [29] 13,674 9,634
Derivative financial instruments [20] 10,569 2,142
Other bank loans and overdrafts 17 41,750
Trade payables [30] 359,459 250,394
Cash deposits by trading participants [31] 2,973,739 1,321,049
Other current liabilities [32] 16,099 12,470
Total equity and liabilities 3,721,238 1,922,537
101

Consolidated Statement of Changes in Equity
kEURSubscribed
capitalCapital reserve
Reserve according to EMIR Article
45 (4)Results
generated
Equity of EEX
shareholders
Share of non-
controlling interests
Consoli-dated
equity
As of 31/12/2014 40,050 10,000 5,500 68,975 124,525 7,677 132,202
Total result 71,065 7,985
Consolidation effects –8,989 53,734
Dividends paid –7,209 –7,013
Reclassifications of reserves 500 –500
Acquisition of own shares –58 –306
Foreign currency effects 2,459 453
As of 31/12/2015 39,992 10,000 6,000 125,495 181,487 62,836 244,323
Total result 49,648 8,083
Consolidation effects 597 1,053
Dividends paid –7,198 –12,463
Reclassifications of reserves 1,500 –1,500
Foreign currency effects –1 –195
As of 31/12/2016 39,992 10,000 7,500 167,041 224,533 59,314 283,846
CONSOLIDATED STATEMENT OF CHANGES IN EQUITY
102 Annual Report 2016

Management Report Visions Guest Contribution Corporate Responsibility Financial Report Consolidated Financial Statements
Consolidated Statement of Changes in Equity
Consolidated Statement of Cash Flows
CONSOLIDATED STATEMENT OF CASH FLOWS
Consolidated Statement of Cash Flows
kEURConsolidated
Notes 2016 2015
Change in scope of consolidation [5] 2,355 21,118
Annual net profit 57,731 79,050
Depreciations on intangible assets and property, plant and equipment [12] 12,331 20,936
Expenses for / income from deferred taxes [15] 652 935
Result of at-equity investments [14] 48 –49,770
(Increase) / Reduction in trade receivables and other assets [21–22] 1,470 –24,360
(Increase) / Reduction in liabilities and provisions [27–30, 32] 20,719 12,739
Cash flow from operating activities 92,951 39,530
Payments for investments in associated companies [19] 219 –725
Payments for investments in intangible assets [17] –9,696 –6,959
Payments for investments in property, plant and equipment [18] –1,035 –1,242
Payments for the acquisition of shares in fully consolidated subsidiaries [5] –13,431 –40,342
Dividends received [13, 19] 72 18
Cash flow from investing activities –23,871 –49,250
Dividend payments to shareholders of EEX AG [26] –7,198 –7,209
Dividend payments to non-controlling interests –12,463 –7,013
Cash inflow from non-controlling interests 4,092 1,002
Cash inflow (outflow) from short-term financing –9,242 9,259
Outflow of funds from the acquisition of own shares 0 –364
Cash flow from financing activities –24,811 –4,325
Cash-effective change in cash and cash equivalents 46,623 7,073
Cash and cash equivalents at the beginning of the accounting period 80,474 73,401
Cash and cash equivalents at the end of the accounting period 127,097 80,474
In the financial year
Interest received and similar income [13] 1,154 909
Dividends received [13, 19] 72 18
Interest paid and similar expenses [13] –664 1,893
Taxes on income paid [15] 25,691 16,619
103

2. NEW STANDARDS AND INTERPRETATIONS
INFORMATION ACCORDING TO IAS 8.28
The standards and interpretations listed below were applied
for the first time in the 2016 financial year.
IFRS 11 Accounting for Acquisitions of Interests in Joint OperationsThe acquirer of interests in joint operations according
to IFRS 3 is required to apply all of the principles on busi-
ness combinations accounting in IFRS 3 and other IFRSs
with the exception of those principles that conflict with the
guidance in IFRS 11.
IAS 16 / IAS 38 Clarification of Acceptable Methods of Depreciation and Amortisation Guidelines on the depreciation of property, plant and
equipment and of intangible assets — in particular,
revenue-based depreciation methods.
IAS 16 / IAS 41 Bearer Plants Fruit-bearing plants without significant biological
modifications within the scope of application of IAS 16
Property, plant and equipment.
IAS 27 Equity Method in Separate Financial StatementsEquity method as an accounting option for shares in
subsidiaries, joint ventures and associated companies in
the separate financial statement of an investor.
Annual Improvements 2012 — 2014
Modifications and clarifications of various IFRS.
IAS 1 Disclosure Initiative Simplified possibility for using discretion in the presentation
in the financial statements.
IFRS 10, IFRS 12, IAS 28 Consolidation Exception Use of the consolidation exception for investment companies.
1. GENERAL PRINCIPLES
The European Energy Exchange (EEX) is the leading energy ex -
change in Europe. It develops, operates and connects secure,
liquid and transparent markets for energy and commodity
products. Within EEX Group, contracts on Power, Coal and
Emission Allowances, as well as Freight Rates and Agricultural
Products, are traded or registered for clearing and settled.
EEX is a public limited company registered in the Federal
Republic of Germany. It has its registered offices at Augustus-
platz 9, 04109 Leipzig, Germany and is registered in the com-
mercial register of the Leipzig Local Court under HRB no. 18409.
EEX Group is fully consolidated in the consolidated financial
statements of Deutsche Börse AG.
These consolidated financial statements are submitted to the
Supervisory Board at its meeting on 6 April 2017.
NOTES ON THE CONSOLIDATED FINANCIAL STATEMENTS PRINCIPLES AND METHODS
104 Annual Report 2016

Management Report Visions Guest Contribution Corporate Responsibility Financial Report Consolidated Financial Statements
Notes on the Consolidated Financial Statements
Principles and Methods
IFRS 2 Classification and Measurement of Share-based Payment TransactionsAccounting of share-based payment transactions with cash
settlement; determination of the fair value of the liabilities
resulting from share-based payments.
IFRS 4 Applying IFRS 9 Financial Instruments with IFRS 4 Insurance ContractsReduced effects from different first-time applications of IFRS
9 and the subsequent standard to IFRS 4, in particular, in the
case of companies with comprehensive insurance activities.
Annual Improvements 2014 — 2016
Modifications and clarifications of various IFRS.
IFRIC 22 Foreign Currency Transactions and Advance Consideration Accounting of business transactions upon receipt or payment
of considerations in foreign currency.
IAS 40 Transfers of Investment PropertyClarification of the provisions regarding transfers from
or to the stock of investment properties upon an obvious
change of use.
IFRS 16 LeasesAccounting of leasing contracts.
With the exception of the new IFRS 16 for leasing contracts,
the amendments specified above do not have any essential
impact on the presentation of the assets, earnings and finan-
cial position of EEX Group.
IAS 19 Employee Contributions Clarification of employee contributions or contributions by
third parties which are connected with the period of service
and establishing a relief if the amount of the contribution is
independent of the number of service years performed.
Annual Improvements 2010 — 2012
Modifications and clarifications of various IFRS.
INFORMATION ACCORDING TO IAS 8.30
EEX Group does not plan to apply the following new or amend -
ed standards and interpretations, whose application will only
become necessary in subsequent financial years, earlier than
required.
IFRS 9 Financial InstrumentsRevised guidelines for the classification of financial assets;
new provisions regarding recording of impairments on
the basis of a model of the expected losses; new provisions
regarding the representation of hedge accounting.
IFRS 15 Revenue from Contracts with CustomersNew provision regarding revenue recognition in terms
of time and amount.
The following amendments do not have to be applied on
account of their lacking of EU endorsements:
IAS 12 Recognition of Deferred Tax Assets for Unrealised LossesAssessment of deferred tax assets for unrealised losses
in the case of assets assessed at fair value.
IAS 7 Disclosure InitiativeNotes regarding changes in the liabilities for financing
activities.
105

PRINCIPLES OF CONSOLIDATION
SubsidiariesAll companies in which the Group controls rights which are
required to conduct the decisive activities of the subsidiary
are defined as subsidiaries; as a rule, such control is accompa-
nied by a share of more than 50% of the voting rights. In addi-
tion to this, EEX is exposed to fluctuating returns from subsid-
iaries and is able to influence these returns. In assessing the
question of whether such control is ensured, the existence
and effect of potential voting rights, which can be currently
exercised or converted, is taken into account.
Subsidiaries are included in the consolidated financial state-
ments (full consolidation) as of the time at which control was
transferred to the Group. They are deconsolidated at the time
at which such control ceases.
Accounting for subsidiaries acquired in a business combina-
tion is done according to the purchase method. The acqui-
sition costs correspond to the fair value of the assets given,
the equity instruments issued and the debts created and / or
taken over at the time of the transaction. Assets, debts and
contingent liabilities which can be identified in the context
of a corporate merger are measured at fair value on the date
of acquisition, regardless of the extent of non-controlling
interests. The surplus of the acquisition costs over and above
the Group’s share in the net assets measured at fair value is
shown as goodwill. If the acquisition costs are lower than the
net assets of the acquired subsidiary measured at fair value,
the amount of such difference is directly recorded in the profit
and loss account.
Intra-group receivables and payables as well as intra-group
transactions are eliminated. In so far as necessary, the ac -
counting and valuation methods for subsidiaries were adapted
in order to ensure uniform accounting throughout the Group.
Assets held in the context of a fiduciary relationship are not
considered as assets of the Group and are not reported in the
consolidated financial statement.
3. FUNDAMENTAL ACCOUNTING AND VALUATION METHODS
The fundamental accounting and valuation methods which
are used in the preparation of these consolidated financial
statements are described below. The methods described are
used consistently for the accounting periods detailed, unless
otherwise specified.
PRINCIPLES FOR THE PREPARATION
OF THE FINANCIAL STATEMENT
The consolidated financial statements as of 31 December
2016 were prepared according to the International Financial
Reporting Standards (IFRS) adopted and published by the
International Accounting Standards Board (IASB) as adopted
for application in the European Union. The consolidated finan-
cial statements were prepared by applying the regulations
contained in (EC) Regulation no. 1606 / 2002 of the European
Parliament and Council of 19 July 2002 regarding the appli-
cation of international accounting standards in conjunction
with art. 315a paragraph 3 HGB [German Commercial Code]
under consideration of the supplementary provisions under
commercial law.
The requirements of IFRS are fully fulfilled and ensure that
an impression of the assets, earnings and financial position
of the Group is conveyed which is in line with the actual situ-
ation of the Group.
With the exception of derivatives, which are assessed at fair
value, the consolidated financial statements were prepared
on the basis of the historical costs of acquisition and pro-
duction.
The consolidated financial statements are prepared in EUR.
Unless otherwise specified, all amounts are specified in thou-
sand Euros (kEUR).
106 Annual Report 2016

Management Report Visions Guest Contribution Corporate Responsibility Financial Report
PROPERTY, PLANT AND EQUIPMENT
Property, plant and equipment assets are capitalised at the
cost of acquisition and / or production and depreciated line-
arly as scheduled in accordance with the probable useful life.
Subsequent costs of acquisition and production, e.g. on ac count
of expansion or replacement investments, are only recorded
as a part of the costs of acquisition and production of the
asset or — if appropriate — as a separate asset, provided it is
likely that an economic benefit will accrue to the company
from it in the future and that the costs of the asset can be reli-
ably estimated.
Expenses for maintenance activities which do not constitute
essential replacement investments (day-to-day services) are
recognised as expenses in consolidated statement of profit or
loss for the financial year during which they were incurred.
All assets are depreciated linearly. Office equipment is depre-
ciated over a period of 13 years, while hardware is essentially
depreciated over a period of three years.
Residual book values and useful life are reviewed as of every
reporting date and adjusted if required. If the book value
of an asset exceeds its estimated recoverable amount, it is
immediately depreciated to the latter.
Gains and losses from the disposal of property, plant and
equipment are determined as the amount of the difference
between the sales proceeds and the book value of the prop-
erty, plant and equipment, and recognised in profit or loss.
Transactions with non-controlling interestsTransactions with non-controlling interests are treated like
transactions with parties external to the Group. Acquisitions
and sales of non-controlling interests are recognised directly
in equity in the consolidated financial statements.
AssociatesAssociates are those companies on which the Group exercises
major influence but which it does not control; as a rule, this is
accompanied by a share of between 20% and 50% of voting
rights. Investments in associates are reported in the balance
sheet by using the equity method and, initially, they are as-
sessed at their acquisition costs. The investment in associates
includes the goodwill created upon the acquisition (after con-
sideration of cumulative impairments).
The Group’s share in the profit and loss of associates is recorded
in the consolidated statement of profit or loss as at the date of
acquisition. The cumulative changes after acquisition are set
off against the book value of the investment. If the Group’s
share in the loss of an associate is equal to the share of the
Group in this company, including other unsecured accounts
receivable, or exceeds said value, the Group does not record
any further losses unless it has entered into obligations for the
associate or has made payments for it.
Insofar as necessary, the accounting and valuation methods
for associates were adapted in order to ensure uniform accoun-
ting throughout the Group.
Joint VenturesJoint ventures are accounted for using the equity method as
per IFRS 11.
Consolidated Financial Statements
Notes on the Consolidated Financial Statements
Principles and Methods
107

> Technical feasibility of completion of the intangible asset
is ensured so that it will be available for use or for sale;
> The completion of the intangible asset as well as its use
or sale are intended;
> There is a likelihood of using or selling the intangible asset;
> It has been assessed how the intangible asset will
generate its probable future economic benefit;
> The expected future benefit in the form of external sales
revenues exceeds the expected costs of the project;
> The availability of adequate technical, financial and
other resources for the completion of the development
and the use or sale of the intangible asset is ensured;
> There exists the capacity to reliably determine the
expenses allocable to the intangible asset in the context
of the development.
The value at which an intangible asset created by the com-
pany itself is capitalised for the first time corresponds to the
total of the expenses incurred as of the day on which said
intangible asset fulfils the conditions specified above. In the
case where an intangible asset created by the company can-
not be capitalised, the development costs are recognised as
cost in the accounting period during which they are incurred.
Capitalised costs of acquisition and production for software
are amortised linearly over its useful life. A useful life of three
years is assumed for standard software. Individual software,
on the other hand, is amortised over five years.
Impairment of non-monetary assetsAssets which have an indefinite useful life are not depreciated
according to schedule; rather, they are subject to an impair-
ment test, at least once a year, as well as upon the emergence
of corresponding indicators as a supplement. Assets which are
subject to scheduled depreciations are tested for impairment
in case there are corresponding indications (events and / or
changes in circumstances) signalling that the book value may
no longer be realised. An impairment loss is recorded as the
INTANGIBLE ASSETS
Intangible assets are amortised linearly, provided they have a
definite useful life.
Goodwill Goodwill is defined as the difference between the costs of
acquisition of a company over and above the fair value of the
share of the Group in the net assets of the company acquired
at the time of acquisition. Any goodwill created by the acqui-
sition of the company is reported in the consolidated state-
ment of financial position under intangible assets. Any good-
will resulting from the acquisition of an associate is contained
in the book value of the investment in this associate. The
goodwill shown in the balance sheet is subject to an annual
impairment test and carried at its historical cost of acquisi-
tion minus cumulated impairments. Reversals of impairment
losses are not permissible.
Goodwill is allocated on cash-generating units for the pur-
pose of the impairment test. This allocation is effected on
those cash-generating units which were expected to benefit
from the business combination during which the goodwill was
created.
Other intangible assetsPurchased software is capitalised at its cost of acquisition
and production plus the cost for establishing a state ready
for going into operation minus any possible grants. The total
costs of acquisition are depreciated over the estimated use-
ful life.
An intangible asset which is created by the company itself and
results from development activity (or the development phase
of an internal project) is shown, if and only if, all of the follow-
ing proofs can be presented:
108 Annual Report 2016

Management Report Visions Guest Contribution Corporate Responsibility Financial Report
Financial assetsA financial instrument is defined as a contract which simul-
taneously leads to a financial asset for one company and to
a financial liability or equity instrument for the respective
other company.
Financial assets comprise the following:
> Available funds;
> An equity instrument of another company held as an asset;
> A contractual right:
a) to obtain available funds or other financial assets
from another company, or
b) to exchange financial assets or financial liabilities
with another company at potentially advantageous
conditions; or
> A contract which will or can be fulfilled in own equity
instruments of the company and which constitutes the
following:
a) a non-derivative financial instrument which comprises
or can comprise a contractual obligation of the com-
pany to receive a variable number of equity instruments
of the company, or
b) a derivative financial instrument which will or can be
fulfilled in another manner than through the exchange
of a fixed amount of available funds or other financial
assets in return for a fixed number of equity instruments
of the company. In that sense, the equity instruments
of a company do not comprise any instruments which
themselves constitute contracts regarding the future
receipt or the future sale of equity instruments of the
company.
amount by which the book value exceeds the recoverable
amount. The recoverable amount is the higher of the fair value
of the asset less costs of disposal and its value in use.
For the purpose of the impairment test, assets are combined at
the lowest level for which the cash flows can be identified sep-
arately (so-called cash-generating units). Non-monetary assets
for which an impairment has been recorded in the past are
reviewed as to whether a reversal of impairment losses needs
to be effected as at every reporting date.
Leasing contractsThe allocation of beneficial ownership has to be evaluated for
every leasing contract. Leasing contracts in which an essen-
tial share of the risks and rewards associated with the owner-
ship of the object of the lease remains with the lessor are clas-
sified as operating leases. Otherwise, the contract constitutes
a finance lease.
Rented or leased assets whose beneficial owner is EEX are,
according to IAS 17 (finance lease), shown in the assets at the
present value of the rent or leasing instalments or at the fair
value of the rental or leasing object, if such is lower, and de-
preciated linearly according to schedule.
In the case when ownership is transferred to EEX at the end
of the leasing term, the period of depreciation corresponds to
the useful life; otherwise, it corresponds to the leasing term
of the object of the lease. The present value of the payment
obligations from the future rental and leasing instalments is
reported as a liability and subsequently reduced by the repay-
ment share contained in the rental and leasing payments.
Rental and leasing contracts in which EEX cannot be allocated
beneficial ownership are classified as operating leases. The
expenses resulting from these agreements are recorded fairly
at the time of the use of the corresponding rental and leas-
ing objects. They are recorded linearly in the profit and loss
account throughout the term of the leasing contract.
The classification of a leasing contract occurs when the total
of the leasing payments exceeds kEUR 50.
Consolidated Financial Statements
Notes on the Consolidated Financial Statements
Principles and Methods
109

Loans and receivablesLoans and receivables are non-derivative financial assets with
fixed and / or definable payments which are not quoted on an
active market. They are part of the current assets if their term
does not exceed a period of 12 months after the reporting date.
If this is not the case, they are reported as non-current assets.
Loans and receivables are reported under trade receivables
and other assets in the balance sheet.
Financial assets available for saleAccording to IAS 39, financial assets are also allocated to
the category of “financial assets available for sale”. They are
shown in the balance sheet at fair value as at the reporting
date or, in as far as this cannot be determined or, in as far as
this cannot be determined reliably, at the amortised acquisi-
tion cost. Since the fair values of equity investments held by
EEX Group cannot be determined by means of suitable valu-
ation methods, they are reported in the assets at acquisition
cost.
FINANCIAL INSTRUMENTS OF
THE CENTRAL COUNTERPARTIES
The European Commodity Clearing (ECC) is the clearing house
of EEX Group and it has the function of a central counterparty.
The transfer of the APX clearing business to ECC was com-
pleted in 2016.
Unconditional futures transactionsIn the case of certain futures, the physical delivery of the sub-
ject of the contract is intended and mandatory from the out-
set. The parties to the contract can close out their obligations
through a matching transaction. Futures which were already
traded before the reporting date but whose last trading day
occurs after the reporting date, in particular, are relevant in
terms of the balance.
Variation margins cover daily profits and losses of open posi-
tions which are caused by changes in the market price. Since
this is a daily profit and loss settlement in cash, futures are
not shown in the consolidated balance sheet according to IAS
39.17(a) and IAS 39.39.
Recognition and derecognition of financial instruments are
effected as per trading day. Said day is the day of the purchase
or sale of a financial asset on which the terms of contract
provide for the delivery of the financial asset within the time
frame common for the market concerned. Initial recognition is
effected at fair value plus transaction costs. Financial assets
categorised as “at fair value through profit or loss” are exempt
from this. In this case, initial recognition is effected at fair
value without consideration of transaction costs.
Financial assets are allocated according to the following cat-
egories:
> Assets recognised at fair value through profit or loss;
> Financial assets held to maturity;
> Financial assets available-for-sale;
> Loans and receivables.
The allocation to a category depends on the type and intended
purpose of the financial assets and is effected upon addition
of the asset. The allocation to a category needs to be reviewed
as of every reporting date.
Financial assets in EEX group are allocated to the following
three categories:
Financial assets at fair value through profit or lossThese are financial assets classified as “held for trading” right
from the outset and financial assets classified as “assets rec-
ognised at fair value through profit or loss” right from the
outset. A financial asset is assigned to this category if it was
acquired with the intention of selling it in the short term on
principle or where the financial asset was designated accord-
ingly by management. Derivatives are also part of this cat-
egory unless they are specified as financial instruments in
a hedge relationship (hedges). Assets falling under this cat -
e gory are reported as current assets if they are either held for
trading or will probably be realised within a period of 12 months
after the reporting date.
110 Annual Report 2016

Management Report Visions Guest Contribution Corporate Responsibility Financial Report
CASH AND CASH EQUIVALENTS
Cash and cash equivalents comprise cash assets, sight depos-
its and other highly liquid short-term financial assets with an
original term of, at a maximum, three months, and overdraft
facilities. These are financial assets available for sale.
Overdraft facilities used are shown as “Other bank loans and
overdrafts” under current liabilities in the consolidated state-
ment of financial position.
COLLATERALS
According to the Clearing Conditions, every trading participant
needs to furnish a certain amount of collateral. This form of col-
lateral can be delivered in securities, bank guarantees (only for
the clearing fund) or in the form of cash funds.
Liabilities from cash collaterals are reported under the item
“Cash deposits by trading participants” in the consolidated
statement of financial position. The corresponding amounts are
reported under “Restricted bank balances”.
Collaterals delivered in the form of securities are pledged by
the Clearing Members. These are not shown in the consolidated
statement of financial position.
FINANCIAL DEBTS
Upon their first recognition, financial debts are assessed at
fair value and after the deduction of transaction costs. In
subsequent accounting periods, they are valued at amortised
acquisition costs; every difference between the payout amount
(after the deduction of transaction costs) and the repayment
amount is recorded in the profit and loss account by using the
effective interest method throughout the term of lending.
Loan liabilities are classified as current liabilities if the Group
does not have the unconditional right to postpone the repay-
ment of the liability to a date at least 12 months after the
reporting date.
Futures with mandatory cash settlement are treated as being
equivalent to forward contracts with physical settlement and,
consequently, they are neither shown as assets nor as liabili-
ties in the consolidated statement of financial position.
Conditional futures transactionsIn the case of options, the buyer of an option has to pay an
option premium upon the conclusion of the contract. In the
event of price fluctuations which have a negative impact on
the seller of the option and lead to losses if the option is exer-
cised, collaterals are called from the seller. The buyer of an
option, on the other hand, cannot sustain any further losses
beyond the option premium already paid, since the buyer is
not obliged to exercise the option. In other words, the value
of an option depends on the possible losses which the seller
might sustain.
Options need be shown at fair value as at the reporting date.
In this context, the option premiums for open positions are
used. Assets and liabilities positions of the same amount are
created since ECC, in its capacity as the central counterparty,
has both an account receivable from the seller of the option
and an account payable to the buyer of the option.
Options are classified under the category “financial assets at
fair value through profit or loss”.
TRADE RECEIVABLES
Initially, trade receivables are recognised at fair value. After-
wards, they are valued at amortised acquisition cost and, in
as far as they have a remaining term of more than 12 months,
by using the effective interest rate method, as well as by
deducting impairments. An impairment of trade receivables is
recorded if there are objective indications pointing to the fact
that the amounts of trade receivables which have fallen due
cannot be collected in their entirety. Considerable financial
difficulties of a debtor, an increased likelihood of the debtor
becoming insolvent or entering into some other reorganisa-
tion measure and a breach of contract such as a default or
delay in interest or redemption payments are considered indi-
cators of the presence of an impairment. The amount of such
impairment is categorised as other operating expenses in the
consolidated statement of profit or loss.
Consolidated Financial Statements
Notes on the Consolidated Financial Statements
Principles and Methods
111

EMPLOYEE BENEFITS
Within the Group there are both defined benefit pension plans
and defined contribution pension plans.
A defined contribution pension plan is a pension plan under
which the Group pays fixed contributions to a company (fund)
which is not part of the Group. The Group is not subject to any
legal or de facto obligation to provide additional contribu-
tions in case the fund does not have sufficient assets in order
to settle the pension claims of all employees from the current
and previous business years. In contrast to this, defined bene-
fit pension plans typically specify an amount for the pension
benefit which an employee will receive upon retirement and
which usually depends on one or more factors, such as age,
length of service and salary.
The provision for defined benefit plans recognised in the con-
solidated stamen of financial position corresponds to the
present value of the defined benefit obligation (DBO) at the
reporting date. The DBO is calculated annually by an inde-
pendent actuarial expert by using the projected unit credit
method. The present value of the DBO is calculated by dis-
counting the expected future outflow of funds at the interest
rate for industrial bonds with the highest credit rating. The
industrial bonds are specified in the currency of the payment
amounts and have terms corresponding to those of the pen-
sion obligations.
Current service costs to be settled subsequently are immedi-
ately recognised in the statement of profit or loss unless the
modifications of the pension plan depend on the continuance
of the employee in the company for a fixed term (term until
the beginning of non-vesting). In this case, the current service
costs to be settled subsequently are recognised in the state-
ment of profit or loss linearly throughout the period until the
beginning of non-vesting.
Actuarial profits and losses are immediately recognised in the
statement of profit or loss. Insofar as there are plan assets,
these are deducted from the pension provision.
DEFERRED TAXES
Deferred taxes are recognised for all temporary differences
between the tax balance sheet value of the assets / liabili-
ties and their book values according to IFRS. Deferred taxes
are assessed by using the tax rates (and taxation provisions)
which are applicable on the reporting date or which have
essentially been adopted legally at the reporting date and
which are expected to be valid at the time of the realisation of
the deferred tax asset and / or of the settlement of the deferred
tax liability.
Deferred tax liabilities which are caused by temporary dif-
ferences in connection with investments in subsidiaries and
associates are stated, unless the time of the reversal of the
temporary differences can be determined by the Group and it
is likely that the temporary differences will not be reversed in
the foreseeable future on account of this influence.
Deferred tax assets on losses carried forward are assessed to
the degree to which it is likely that they can be used. The use
of deferred tax assets on losses carried forward depends on
whether sufficient taxable income is likely to be generated in
the future. The earnings situation in the past as well as plan-
ning calculations are used to evaluate the likelihood of such
a situation.
112 Annual Report 2016

Management Report Visions Guest Contribution Corporate Responsibility Financial Report
TRANSACTIONS IN FOREIGN CURRENCIES
Transactions in foreign currencies are converted into the func-
tional currency (EUR) at the mean foreign exchange rate valid
at the time of the transaction. Gains and losses resulting from
the fulfilment of such transactions as well as from the conver-
sion of monetary assets and debts recorded in foreign cur-
rencies at the exchange rate, valid at the reporting date, are
recorded in the statement of profit or loss. Foreign exchange
differences which arise in the context of consolidation as a
result of the conversion of financial statements in foreign cur-
rencies are recognised in other comprehensive income.
FAIR VALUE MEASUREMENT
The fair values of financial instruments are determined on the
basis of corresponding market values or valuation methods.
The fair values for cash funds and other current original finan-
cial instruments (in particular trade receivables and trade
payables) correspond to the book values shown in the balance
sheet as at the respective reporting dates.
The fair value of derivatives traded in an active market is
based on the exchange price on the reporting date. Since
ECC acts as buyer and seller at the same time, the relevant
exchange price of financial assets corresponds to their cur-
rent bid price.
The fair value of financial liabilities disclosed in the Notes is
determined by discounting contractual future cash flowsat the
currently valid market interest rate which would be granted to
the Group for comparable financial instruments.
In order to economically hedge against foreign currency risks,
EEX has concluded short-term derivative currency hedging
contracts with a term of less than one year. The fair values of
the currency derivatives transactions were measured on the
basis of discounted cash flows expected in the future. In this
context, the currently valid market interest rates were used
for the residual terms of the financial instruments.
PROVISIONS
Provisions are carried as liabilities where the Group has a cur-
rent legal or de facto obligation resulting from a past event if
it is more likely than not that the settlement of the obligation
will lead to an cash outflow and the amount of the provision
can be determined reliably. Provisions for future operating
losses are not recorded.
Provisions are recognised at the present value of the expected
expenses; in this process, a pre-tax interest rate is used which
takes into account current market expectations regarding
the interest effect and the risks specific to the obligation.
Increases in the provision resulting merely from compound-
ing are recognised as interest expenses in the statement of
profit or loss.
REVENUE RECOGNITION
All trading and clearing fees for derivatives transactions are
provided on the trading day, while delivery fees for spot mar-
ket transactions are provided upon successful nomination.
Sales revenue is recorded during the period in which the ser-
vices are provided by the Group.
Interest revenue and interest expenses are recorded if it
appears sufficiently likely that an economic benefit from the
transaction will accrue to the Company and the amount of
the revenue can be determined reliably. Interest expenses are
recorded as expenses during the period in which they were
incurred.
The statement of profit or loss is structured according to the
total cost method.
Consolidated Financial Statements
Notes on the Consolidated Financial Statements
Principles and Methods
113

5. CHANGES IN THE SCOPE OF CONSOLIDATION
In the 2016 financial year, EEX Link GmbH (EEX Link), all of
whose shares are held by EEX, started operations. It provides
services with the aim of bundling the liquidity between the
regulated exchange platforms for power and gas and the non-
MTF markets which are subject to less stringent regulations.
Moreover, it has been fully consolidated since 1 January 2016.
With effect from 31 May 2016, EEX acquired a further 47.8%
of the voting shares in Cleartrade Exchange Pte. Limited,
Singapore, and, as a result and in combination with a capi-
tal increase in February 2016, it increased its shareholding
in this company to 100%. A purchase price of GBP 1 plus a
revenue-based purchase price component was agreed as con-
sideration. The company continues to be fully included in the
consolidated financial statements.
In the course of the restructuring of CLTX, the subsidiary
Cleartrade Exchange (UK) Ltd., London, United Kingdom was
liquidated during the current financial year.
With effect as of 31 May 2016, EEX acquired a 66.67% share-
holding in Power Exchange Central Europe a.s., Prague, Czech
Republic (PXE), in order to expand the power derivatives mar-
ket in central and eastern Europe. Following the final approval
of the transaction by the Czech National Bank on 16 June
2016, EEX attained full control of PXE within the meaning of
IFRS 10. Since then, the company has been fully consolidated
in the consolidated financial statements.
4. ESTIMATES, VALUATION UNCERTAINTIES AND DISCRETIONARY DECISIONS
All estimates and assessments are constantly re-evaluated
and are based on experience gained in the past and further
factors, including expectations with regard to future events,
which appear reasonable under the prevailing circumstances.
The Group makes assessments and assumptions regarding the
future. The estimates derived from these will obviously only
in very rare cases correspond exactly to the actual circum-
stances arising later.
The corporate planning of EEX Group based on its business
segments constitutes the basis for the annual impairment
test regarding the respective goodwill. This planning makes
assumptions regarding the future development of the expense
and income items of the cash-generating units concerned.
Further estimates and assessments have been made, espe-
cially, with regard to the evaluation of the likelihood of
demands on certain provisions, as well as the realisability of
deferred tax assets.
114 Annual Report 2016

Management Report Visions Guest Contribution Corporate Responsibility Financial Report
In order to develop the Danish gas trading market EEX
acquired a further 50% of the shares in Gaspoint Nordic A / S
(GPN), Brøndby, Denmark, for a purchase price of kEUR 700
with effect as of 1 July 2016. As a result, it increased its share-
holding in GPN to 100%. In July, the shares were transferred
to Powernext SA, Paris, France. Following the increase of
the share, Gaspoint Nordic A / S is no longer accounted for at
equity but fully consolidated.
The purchase price allocation had the following results:
As a result of the transaction, synergetic effects from bundling
of gas trading on the PEGAS platform operated by Powernext
SA can be taken advantage of.
The full consolidation of GPN resulted in an increase in sales
revenue of kEUR 682 and in the result after taxes and after
the consideration of the share of non-controlling interests of
kEUR 238. If the company had been fully consolidated as of
1 January 2016, this would have led to an increase in sales
of kEUR 1,468 and in the profit after tax and non-controlling
interests of kEUR 492.
The purchase price allocation had the following results:
The goodwill of kEUR 2,624 created through the transaction
essentially reflects expected synergetic effects in sales result-
ing from the improvement in border-crossing trading.
The full consolidation of PXE has led to an increase in sales
revenue of kEUR 810 and in the result after taxes and after
the consideration of the share of non-controlling interests of
kEUR 24. If the company had been fully consolidated as of
1 January 2016, the sales revenue would have been kEUR 1,375
higher and the corresponding profit would have been kEUR 84
higher.
kEUR
Transferred consideration 4,411
Acquired bank balances –1,179
Total consideration 3,232
Acquired assets and debts
Customer relationships 1,475
Brand names 296
Other intangible assets 45
Other non-current assets 3
Deferred tax assets 18
Other current assets 219
Debts –210
Deferred tax liabilities on temporary differences –345
Non-controlling interests –893
Total acquired assets and debts 608
Goodwill 2,624
kEUR
Transferred consideration 1,400
Acquired bank balances –1,176
Total consideration 224
Acquired assets and debts
Customer relationships 195
Brand names 36
Other non-current assets 5
Deferred tax assets 52
Other current assets 140
Debts –334
Deferred tax liabilities on temporary differences –51
Total acquired assets and debts 43
Goodwill 181
Consolidated Financial Statements
Notes on the Consolidated Financial Statements
Principles and Methods
115

This transaction enables Powernext SA to benefit from syner-
getic effects in trading in contracts for the major European gas
markets on the joint PEGAS platform.
The company started operations on 1 December 2016 and since
then it has contributed to an increase in sales revenue within
EEX Group of kEUR 233 and to an increase in profit after tax
and non-controlling interests of kEUR 9.
As of 31 December 2016, several APX companies were merged
to EPEX SPOT in the context of an intragroup merger. In the
context of this restructuring, EPEX Netherlands BV was incor-
porated in 2016 in order to take over the employees of the
former APX Holding BV and their pension entitlements. This
company was fully consolidated upon the launch of opera-
tions from 1 December 2016 onwards. In addition, APX Ship-
ping BV was transferred to EEX within the group.
The liquidation of EMCC GmbH i.L. (which has been accounted
for using the equity method so far) was concluded on
8 December 2016 and the remaining capital was paid out to
the shareholders. The company was deleted from the commer-
cial register on 13 February 2017.
In the 2016 financial year, Powernext SA together with the
Austrian Central European Gas Hub AG (CEGH) established
the subsidiary PEGAS CEGH Gas Exchange Services GmbH,
Vienna, Austria (PCG). Powernext holds 51% of the shares
in PCG. This company has been fully included in the consol-
idated financial statements of EEX since its incorporation on
2 September 2016. In September 2016, PCG acquired the Aus-
trian gas business segment from CEGH. This transaction con-
stitutes a business combination within the meaning of IFRS 3.
The purchase price allocation had the following results:
kEUR
Transferred consideration 4,097
Acquired assets and debts
Customer relationships 2,143
Brand names 89
Deferred tax assets 1,461
Share of non-controlling interests –1,973
Total acquired assets and debts 1,720
Goodwill 2,377
116 Annual Report 2016

Management Report Visions Guest Contribution Corporate Responsibility Financial Report
7. NET REVENUE FROM BANKING TRANSACTIONS
This newly included item shows the result generated from
investing of cash collateral provided by trading participants
in the context of clearing. The negative contribution margin
results from the currently negative interest rate for short term
investments which was not fully covered by service charges.
8. OTHER OPERATING INCOME
This item essentially includes income from the reduction of
the conditional purchase price liability for the acquisition of
the remaining Cleartrade shares.
9. VOLUME-RELATED COSTS
This new item reflects variable costs, such as Market Maker
costs or system costs which are incurred based on sales. The
increase in these is essentially due to increased transaction
volume.
10. STAFF COSTS
As at 31 December 2016, 453 members of staff were employed
in EEX Group (2015: 421). As at the reporting date, female
employees accounted for 41% of staff.
6. SALES REVENUE
Sales revenue was as follows:
Transaction revenue is calculated on the basis of the gene-
rated trading volumes by using the prices published in the
respective current price list. Reference is made to the man-
agement report with regard to further explanations on the
development of sales.
NOTES ON THE CONSOLIDATED PROFIT AND LOSS ACCOUNT
kEUR 2016 2015
Transaction fees
Power Derivatives 87,206 60,006
Power Spot 67,534 63,393
Natural Gas 32,846 21,132
Environmental Products 2,479 1,590
Clearing Services 1,727 1,964
Global Commodities 501 1,157
Agriculturals 326 217
Other revenues
Market Data Services 5,019 3,745
Other 36,520 37,220
Total sales revenue 234,158 190,424
kEUR 2016 2015
Wages and salaries 40,069 36,087
Social security contributions 9,625 7,713
Pension costs 3,204 3,325
Total 52,898 47,125
Consolidated Financial Statements
Notes on the Consolidated Financial Statements
Notes on the Consolidated Profit and Loss Account
117

13. FINANCIAL RESULT
The financial result has the following structure:
14. INCOME FROM AT EQUITY INVESTMENTS
The result from at equity investments contains basically the
result for SEEPEX a.d. and for Gaspoint Nordic A / S for the first
half of 2016 accounting for using the equity method.
15. INCOME TAX EXPENSE
This item records the current taxes on income and profit paid
or owed as well as deferred taxes. Current income taxes are
recognised at the time at which they are incurred.
For the purpose of calculation of deferred taxes, a country-
specific tax rate is used according to the following overview:
11. DEPRECIATION, AMORTISATION AND IMPAIRMENT LOSSES
Depreciation, amortisation and impairment losses were struc-
tured as follows:
12. OTHER OPERATING EXPENSES
As of the current year, the expenses for Market Maker and
broker services are reported under volume-related costs. The
figures for the previous year were adjusted accordingly. Other
expenses include, for example, costs for temporary employ-
ment, training programmes and foreign currency exchange
losses.
kEUR 2016 2015
System costs 24,819 25,511
Consulting 19,730 14,402
Marketing, events and travelling expenses 6,229 5,859
Office expenses 5,394 5,655
Non-deductible input tax –305 959
Insurances, contributions 1,141 893
Audit costs 653 716
Supervisory Board emoluments 474 280
Other expenses 5,241 1,953
Total 63,378 56,228
kEUR 2016 2015
Interest and similar income 1,155 909
Interest expenditure –664 –602
Revaluation of EPEX shares 0 49,724
Dividends from investments 20 18
Compounding of provisions –39 –14
Financial result 472 50,035
kEUR 2016 2015
Current income taxes 30,550 19,509
Income taxes for previous periods 0 –33
Deferred income taxes –652 935
Total 29,898 20,411
kEUR 2016 2015
Intangible assets 10,753 19,197
Property, plant and equipment 1,579 1,739
Total 12,331 20,936
118 Annual Report 2016

Management Report Visions Guest Contribution Corporate Responsibility Financial Report
The following deferred tax assets and deferred tax liabilities
arise from temporary differences between the tax balance
sheet and the IFRS balance sheet and from tax loss carry-for-
wards:
Deferred tax assets are recognised with regard to tax loss carry-
forwards if their realisation appears sufficiently probable,
based on corporate planning calculations. Tax loss carry-for-
wards of kEUR 18,839 (2015: kEUR 15,340) were not recog-
nised. These loss carry-forwards are not restricted as to the
date at which they may be used.
There are taxable temporary outside basis differences of
kEUR 8,351 (2015: kEUR 5,402), which were not shown as
deferred tax liabilities in accordance with IAS 12.39.
The tax rate for Germany is unchanged with an assessment
rate for the trade tax rate of 460%, a basic rate of tax of 3.5%,
a corporation tax rate of 15% and the solidarity surcharge of
5.5% on corporation tax.
The expected income tax expenses which would have resulted
from the application of the tax rate of 31.925% for Germany
on the earnings before tax under IFRS are reconciled to the
reported income taxes as follows:
Tax rate in %
Germany 31.925
Denmark 22.000
Belgium 34.000
France 33.333
United Kingdom 20.000
Netherlands 25.000
Austria 25.000
Czech Republic 19.000
kEUR 2016 2015
Earnings before tax 87,629 99,461
Tax rate 31.925% 31.925%
Expected tax expenditure 27,975 31,753
Tax-free income –47 –15,813
Deviating tax rates 39 1,843
Non-deductible operating expenses 629 1,662
Other permanent balance sheet deviations 103 1,158
Tax expenses / income for previous periods –164 –687
Amendments / Non-use of loss carry-forwards 292 656
Deviation from the assessment basis for trade tax and other taxes 1,318 125
Others –248 –286
Effective tax expenditure 29,898 20,411
Deferred tax assets
Deferred tax liabilities
kEUR 2016 2015 2016 2015
Intangible assets 8,986 7,248 31,459 32,142
Property, plant and equipment 330 575 12 3
Other financial assets 0 0 0 0
Financial instruments 0 0 0 0
Other receivables 34 64 0 3
Loss carry-forwards 0 462 0 0
Non-current provisions 49 280 19 0
Current provisions 418 909 0 0
Current liabilities 902 0 96 29
Outside basis differences 0 0 0 0
Gross value 10,719 9,538 31,586 32,177
Offset –675 –33 –675 –33
Total 10,044 9,505 30,911 32,144
Consolidated Financial Statements
Notes on the Consolidated Financial Statements
Notes on the Consolidated Profit and Loss Account
119

16. OTHER COMPREHENSIVE INCOME
This item includes effects recorded directly in “Other results”
from the conversion of financial statements of subsidiaries
prepared in foreign currencies in the amount of kEUR 3,320
(2015: kEUR 2,797).
With regard to currency conversion as at 31 December 2016,
the following relevant exchange rates to the Euro were used:
Closing rate on31/12/2016
CHF 1.0731954
GBP 0.8561374
SGD 1.5222078
USD 1.0521500
The deferred taxes are structured as follows (depending on the
term until realisation):
kEUR 2016 2015
Deferred tax assets
which will be realised after more than 12 months 9,398 9,537
which will be realised within a period of 12 months 1,321 0
Total 10,719 9,537
Deferred tax liabilities
which will be realised after more than 12 months 31,490 32,177
which will be realised within a period of 12 months 96 0
Total 31,586 32,177
120 Annual Report 2016

Management Report Visions Guest Contribution Corporate Responsibility Financial Report
With regard to further notes regarding the change in the
scope of consolidation, reference is made to item 5.
17. GOODWILL AND INTANGIBLE ASSETS
The goodwill and intangible assets developed as follows:
The increase in “Other intangible assets” is essentially based
on the recognition of customer relationships from the pur-
chase price allocations for the new companies consolidated
during the year under review.
NOTES ON THE CONSOLIDATED STATEMENT OF FINANCIAL POSITION
kEUR Other intangible assets Goodwill Total
Costs of acquisition as at 31/12/2014 26,213 37,099 63,312
Change in the scope of consolidation 109,578 39,865 149,443
Additions 6,959 0 6,959
Disposals –312 0 –312
Costs of acquisition as at 31/12/2015 142,438 76,964 219,402
Change in the scope of consolidation 4,279 6,812 11,091
Additions 9,696 0 9,696
Disposals –986 0 –986
Costs of acquisition as at 31/12/2016 155,427 83,776 239,203
Depreciation / impairment as at 31/12/2014 19,241 17,801 37,042
Scheduled amortisation 9,195 0 9,195
Impairment 1,285 8,718 10,003
Disposal –312 0 –312
Depreciation / impairment as at 31/12/2015 29,409 26,519 55,928
Scheduled amortisation 10,753 0 10,753
Disposal –232 0 –232
Depreciation / impairment as at 31/12/2016 39,930 26,519 66,449
Currency differences 890 890
Book value as at 31/12/2015 113,764 52,075 165,839
Book value as at 31/12/2016 116,387 57,257 173,644
Consolidated Financial Statements
Notes on the Consolidated Financial Statements
Notes on the Consolidated Statement of Financial Position
121

SENSITIVITY OF THE PLANNING ASSUMPTIONS
A sensitivity analysis was carried out for the CGUs which con-
tain a goodwill. The question of by what amount sales revenue
may decline without requiring impairment was analysed.
In all cases, the declines in sales revenue calculated are far
beyond any scenario which can be regarded as being realistic
at present.
ANNUAL IMPAIRMENT TEST
AS AT 30 SEPTEMBER 2016
The impairment test is based on medium-term planning for the
cash generating units (CGU). In 2015, the CGU were defined
as a business segment for the first time so that the respective
clearing income is assigned to the asset classes. Subsidiaries
which are not planned within the business segments and
which largely operate independently are exempt from this
for the initial period after their acquisition. These cash flows,
which are forecast on an annual basis, are discounted.
For current planning, a growth rate of –1 to +2% was used.
The rate of the weighted average cost of capital (WACC),
which reflects the capital market’s required rate of return for
the provision of borrowed capital and equity for EEX, is used
for the purpose of discounting cash flows. The rate used for
the weighted average costs of capital for the calculation of
the recoverable amount is 5–6% (Global Commodities and
PXE: 9%).
In all cases, the calculation resulted in a fair value less costs
of disposal which was above the book values of the cash gen-
erating units.
122 Annual Report 2016

Management Report Visions Guest Contribution Corporate Responsibility Financial Report
18. PROPERTY, PLANT AND EQUIPMENT
During the year under review, property, plant and equipment developed as follows:
kEURLeasehold
improvementsComputer hardware,
fixtures and furnishings Total
Costs of acquisition as at 31 December 2014 1,673 4,257 5,930
Change in scope of consolidation 513 2,996 3,509
Additions 201 1,041 1,242
Disposals 0 –2 –2
Costs of acquisition as at 31 December 2015 2,387 8,292 10,679
Change in scope of consolidation 0 3 3
Additions 0 1,035 1,035
Disposals –127 0 –127
Costs of acquisition as at 31 December 2016 2,260 9,330 11,590
Depreciation / impairment as at 31 December 2014 1,090 3,444 4,534
Scheduled depreciation 485 1,254 1,739
Depreciation / impairment as at 31 December 2015 1,575 4,698 6,273
Scheduled depreciation 193 1,386 1,579
Depreciation / Impairment as at 31 December 2016 1,768 6,084 7,852
Currency differences 0 –7 –7
Book value as at 31 December 2015 812 3,587 4,399
Book value as at 31 December 2016 492 3,239 3,731
Consolidated Financial Statements
Notes on the Consolidated Financial Statements
Notes on the Consolidated Statement of Financial Position
123

The book values developed as shown in the table below:
20. DERIVATIVE FINANCIAL INSTRUMENTS
This item comprises the fair value of options, which is deter-
mined on the basis of the current exchange price of open
positions.
On account of ECC’s function as the central counterparty, ac -
counts receivable and accounts payable are recorded on the
asset side and on the liabilities side to the same amount of
kEUR 41,957 (2015: kEUR 6,615). Options with a total value
of kEUR 10,569 included in this will mature within one year.
19. INVESTMENT IN ASSOCIATES AND JOINT VENTURES, OTHER EQUITY INVESTMENTS AS WELL AS OTHER FINANCIAL ASSETS
Associates and joint ventures, as well as equity investments,
as at the reporting date were as follows:
Associates and joint ventures
Equity investment
SEEPEX a.d.
Index Marketing Solutions
Limited
store-x Storage Capacity
Exchange GmbH i.L.
Registered officesBelgrade,
SerbiaLondon,
Great BritainLeipzig,
Germany
Initial recognition in the balance sheet 2015 2014 2008
Share in capital as at 31 December 2015 (%) 12 26 12
Share in capital as at 31 December 2016 (%) 12 50 12
Nominal capital (kEUR) 500 0 200
Inclusion At equity Costs of acquisition
kEUR AssociatesOther equity investments
Costs of acquisition as at 31/12/2014 20,451 153
Change in scope of consolidation –20,131 0
Addition 657 50
Costs of acquisition as at 31/12/2015 977 203
Addition 56 0
Change in scope of consolidation –600 –50
Disposal –404 0
Costs of acquisition as at 31/12/2016 29 153
Revaluation as at 31/12/2014 7,171 0
Change in scope of consolidation –7,171 0
Result of at-equity valuation 46 0
Revaluation as at 31/12/2015 46 0
Dividend payment –52 0
Result of at-equity valuation 8 0
Impairment 0 –129
Revaluation as at 31/12/2016 2 –129
Book value as at 31/12/2015 1,023 203
Book value as at 31/12/2016 31 24
124 Annual Report 2016

Management Report Visions Guest Contribution Corporate Responsibility Financial Report
22. OTHER ASSETS AND INCOME TAX ASSETS
The other assets and income tax assets are short term.
23. ACCOUNTS RECEIVABLE FROM ASSOCIATES
There are accounts receivable from SEEPEX a.d., which are
explained under note 40.
24. RESTRICTED BANK BALANCES
The restricted bank balances of kEUR 2,973,739 (2015: kEUR
1,321,049) concern in particular collaterals which have been
paid by clearing members for the Spot and Derivatives Market
in the form of cash collaterals. These are shown as a liability
to the same amount.
The increase as against the previous year is largely due to
increased business volume and the low interest rate level.
21. TRADE RECEIVABLES
Trade receivables essentially comprise sales on the Power and
Gas Spot Market which are high due to the reporting date, in
addition to trading and clearing fees.
As in the previous year, there were no accounts receivable for
sales and services with a remaining term of more than one year.
kEUR 31/12/2016 31/12/2015
Accounts receivable 376,838 270,232
Less lump-sum specific individual allowance –180 –307
Trade receivables 376,658 269,925
kEUR 2016 2015
Initial amount of the specific allowance as at 1 January 307 122
Change in scope of consolidation 0 92
Addition 10 118
Utilisation of allowance –5 0
Reversal –128 –30
Currency conversion –4 5
Final amount of the specific allowance as at 31 December 180 307
kEUR 31/12/2016 31/12/2015
Accounts receivable from tax authorities regarding sales tax 5,242 754
Accruals for system adjustments 2,393 1,656
Accruals and deferrals 2,377 2,025
Income tax assets 151 1,266
Fixed term deposits / cash pooling 0 5,000
Other 3,819 10,650
Total 13,981 21,351
Consolidated Financial Statements
Notes on the Consolidated Financial Statements
Notes on the Consolidated Statement of Financial Position
125

27. NON-CURRENT PROVISIONS
Non-current provisions comprise provisions for pensions,
archiving and the removal of installations with a term of more
than one year. These developed as follows during the financial
year under review:
There are provisions for pensions for a former employee in
Germany and, in total, 140 employees in France. As at 31 De -
cem ber 2016, there were IFRS expert opinions available stating
a discount rate of 1% (2015: 2%).
The amount of the provision for another employee is based on
the asset value of the reinsurance contract.
The dominant share of non-current provisions had an esti-
mated pay-out after more than five years.
25. OTHER CASH AND BANK BALANCES
As at the reporting date, the Group had cash and cash equiva-
lents of kEUR 127,115 (2015: kEUR 122,224).
26. EQUITY
The changes in the equity items are shown in the consolidated
statement of changes in equity.
EEX has 40,050,000 shares issued with a nominal value of
Euro 1 each. At the reporting date (31 December 2016), EEX
held own shares in the amount of a calculated share in the
nominal capital of kEUR 58. The subscribed capital of EEX
amounts to kEUR 39,992, as in the previous year. The capital
reserve still amounts to kEUR 10,000, without change.
In the 2016 financial year, kEUR 7,198 were paid out to the
shareholders of EEX.
This item shows the shares of minority shareholders of EPEX
Group, Powernext, Gaspoint Nordic, PCG and PXE. The change
compared with the previous year can be explained by divi-
dend payments to minority shareholders and by the changed
scope of consolidation (see note no. 5).
kEURPension
provisions
Other non-current
provisions
As at 01/01/2015 39 484
Change in scope of consolidation 903 133
Utilisation –51 –108
Reversal 0 –2
Compounding 0 12
Addition 314 1,213
Transfer 0 –200
Deduction plan assets –783 0
As at 31/12/2015 422 1,532
Change in scope of consolidation 0 73
Utilisation 0 –4
Reversal 0 –77
Compounding 0 35
Addition 264 417
Transfer 0 –660
Deduction plan assets –697 0
As at 31/12/2016 –11 1,316
126 Annual Report 2016

Management Report Visions Guest Contribution Corporate Responsibility Financial Report
31. CASH DEPOSITS BY TRADING PARTICIPANTS
The amount of cash deposits by trading participants cor -
res ponds to the restricted bank balances. As at the reporting
date, these amounted to kEUR 2,973,739 (2015: kEUR
1,321,049).
32. OTHER CURRENT LIABILITIES
Other current liabilities comprise the following items:
All other liabilities are short-term.
28. LONG-TERM LIABILITIES
This position shows a purchase price liability to former Clear-
trade shareholders.
29. CURRENT PROVISIONS
Current provisions developed as follows during the financial
year under review:
The provisions essentially concern legal risks and bonuses for
employees and members of the Management Board.
30. TRADE PAYABLES
As at the reporting date, there were trade payables in the
amount of kEUR 359,459 (2015: kEUR 250,394). As in the
case of the trade receivables, these trade payables primarily
include high liabilities from Spot Market sales in power and
gas on account of the reporting date.
There were no trade payables with a remaining term of more
than one year as at 31 December 2016, as in the previous year.
kEUR 2016 2015
As at 01/01/2016 9,634 5,219
Change in scope of consolidation 91 3,218
Utilisation –6,443 –6,779
Reversal –1,100 –1,014
Addition 10,399 8,790
Transfer 1,099 200
Currency adjustment –6 0
As at 31/12/2016 13,674 9,634
kEUR 2016 2015
Tax liabilities 10,253 4,990
Liabilities to staff 3,387 5,241
Payments received on account 776 622
Supervisory Board emoluments 401 312
Other liabilities 1,282 1,304
Total 16,099 12,470
Consolidated Financial Statements
Notes on the Consolidated Financial Statements
Notes on the Consolidated Statement of Financial Position
127
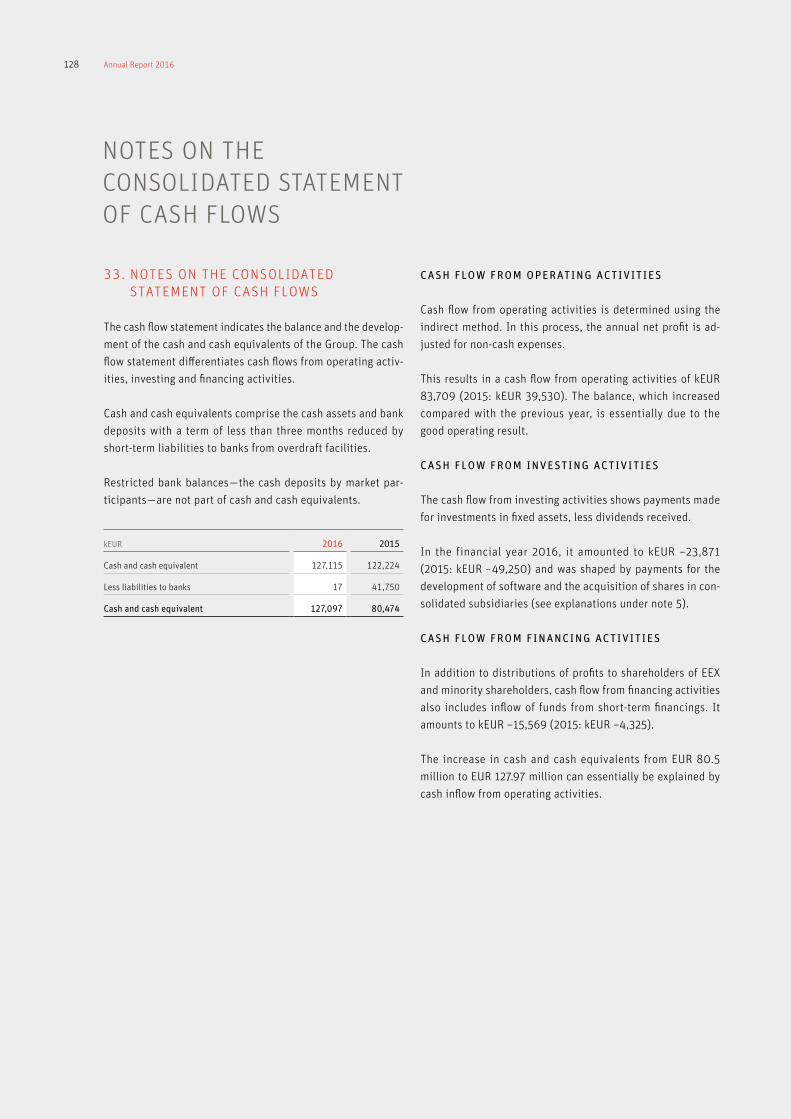
CASH FLOW FROM OPERATING ACTIVITIES
Cash flow from operating activities is determined using the
indirect method. In this process, the annual net profit is ad-
justed for non-cash expenses.
This results in a cash flow from operating activities of kEUR
83,709 (2015: kEUR 39,530). The balance, which increased
compared with the previous year, is essentially due to the
good operating result.
CASH FLOW FROM INVESTING ACTIVITIES
The cash flow from investing activities shows payments made
for investments in fixed assets, less dividends received.
In the financial year 2016, it amounted to kEUR –23,871
(2015: kEUR –49,250) and was shaped by payments for the
development of software and the acquisition of shares in con-
solidated subsidiaries (see explanations under note 5).
CASH FLOW FROM FINANCING ACTIVITIES
In addition to distributions of profits to shareholders of EEX
and minority shareholders, cash flow from financing activities
also includes inflow of funds from short-term financings. It
amounts to kEUR –15,569 (2015: kEUR –4,325).
The increase in cash and cash equivalents from EUR 80.5
million to EUR 127.97 million can essentially be explained by
cash inflow from operating activities.
33. NOTES ON THE CONSOLIDATED STATEMENT OF CASH FLOWS
The cash flow statement indicates the balance and the develop-
ment of the cash and cash equivalents of the Group. The cash
flow statement differentiates cash flows from operating activ-
ities, investing and financing activities.
Cash and cash equivalents comprise the cash assets and bank
deposits with a term of less than three months reduced by
short-term liabilities to banks from overdraft facilities.
Restricted bank balances — the cash deposits by market par-
ticipants — are not part of cash and cash equivalents.
NOTES ON THE CONSOLIDATED STATEMENT OF CASH FLOWS
kEUR 2016 2015
Cash and cash equivalent 127,115 122,224
Less liabilities to banks 17 41,750
Cash and cash equivalent 127,097 80,474
128 Annual Report 2016

Management Report Visions Guest Contribution Corporate Responsibility Financial Report
kEUR
ASSETS as at 31/12/2015Amortised
acquisition costs Fair Value Total
Valuation category Other accounts receivable
Financial assets recognised at fair value through profit or loss (FVTPL)
Trading (HFT) Fair value option
Classes of financial instruments Book value Fair Value Book value Fair Value Book value Fair Value Book value Fair Value
Other equity investments 203 203 203 203
Derivative financial instruments 6,615 6,615 6,615 6,615
Trade receivables 269,925 269,925 269,925 269,925
Other assets 20,085 20,085 20,085 20,085
Income tax assets 1,266 1,266 1,266 1,266
Accounts receivable from associates 405 405 405 405
Restricted bank balances 1,321,049 1,321,049 1,321,049 1,321,049
Other cash and bank balances 122,224 122,224 122,224 122,224
Total 1,735,157 1,735,157 6,615 6,615 0 0 1,741,772 1,741,772
kEUR
ASSETS as at 31/12/2016Amortised acquisition
costs costs Fair Value Total
Valuation category Other accounts receivable
Financial assets recognised at fair value through profit or loss (FVTPL)
Trading (HFT) Fair value option
Classes of financial instruments Book value Fair Value Book value Fair Value Book value Fair Value Book value Fair Value
Other equityl investments 24 24 24 24
Derivative financial instruments 41,957 41,957 41,957 41,957
Trade receivables 376,658 376,658 376,658 376,658
Other assets 13,831 13,831 13,831 13,831
Income tax assets 151 151 151 151
Accounts receivable from associates 313 313 313 313
Restricted bank balances 2,973,739 2,973,739 2,973,739 2,973,739
Other cash and bank balances 127,115 127,115 127,115 127,115
Total 3,491,831 3,491,831 41,957 41,957 0 0 3,533,788 3,533,788
OTHER NOTES
34. CLASSIFICATION OF FINANCIAL INSTRUMENTS AS PER IFRS 7
Consolidated Financial Statements
Notes on the Consolidated Financial Statements
Notes on the Consolidated Statement of Cash Flows
Other Notes
129

kEUR
LIABILITIES as at 31/12/2015Amortised
acquisition costs Fair Value Total
Valuation category Other liabilities Financial assets recognised at fair value through profit or loss (FVTPL)
Trading (HFT) Fair value option
Classes of financial instruments Book value Fair Value Book value Fair Value Book value Fair Value Book value Fair Value
Non-current provisions 1,954 1,954 1,954 1,954
Derivative financial instruments 6,615 6,615
Non-current liabilities 2,204 2,204 2,204 2,204
Current provisions 9,634 9,634 9,634 9,634
Other bankloans and overdrafts 41,750 41,750 41,750 41,750
Trade payables 250,394 250,394 250,394 250,394
Cash deposits by market participants 1,321,049 1,321,049 1,321,049 1,321,049
Other current liabilities 12,470 12,470 12,470 12,470
Total 1,639,455 1,639,455 6,615 6,615 0 0 1,639,455 1,639,455
kEUR
LIABILITIES as at 31/12/2016Amortised acquisition
costs costs Fair Value Total
Valuation category Other liabilities Financial assets recognised at fair value through profit or loss (FVTPL)
Trading (HFT) Fair value option
Classes of financial instruments Book value Fair Value Book value Fair Value Book value Fair Value Book value Fair Value
Non-current provisions 1,316 1,316 1,316 1,316
Derivative financial instruments 41,957 41,957 41,957 41,957
Non-current liabilities 219 219 219 219
Current provisions 13,609 13,609 65 65 13,674 13,674
Other bankloans and overdrafts 17 17 17 17
Trade payables 359,459 359,459 359,459 359,459
Cash deposits by market participants 2,973,739 2,973,739 2,973,739 2,973,739
Other current liabilities 16,099 16,099 16,099 16,099
Total 3,364,459 3,364,459 42,022 42,022 0 0 3,406,481 3,406,481
130 Annual Report 2016

Management Report Visions Guest Contribution Corporate Responsibility Financial Report
Financial assets and liabilities are assigned to level 3 if the
fair value is derived from non-observable parameters.
The balance sheet value of derivative financial instruments is
measured at the price on the reporting date and, hence, has to
be allocated to level 1 of the fair value hierarchy.
During the past reporting period, the valuation category “Loans
and receivables” generated interest income of kEUR 640
(2015: kEUR 895). Furthermore, accounts receivable in the
amount of kEUR 10 (2015: kEUR 118) were impaired in the year
under review.
The following table shows the age structure of the valuation
categories:
Cash and cash equivalents as well as trade receivables are
short-term. Their book values are approximately equal to the
fair value on the reporting date.
Financial assets and liabilities which are recognised at fair
value have to be assigned to the following three hierarchy
levels:
Financial assets and liabilities have to be assigned to level 1
if there is an exchange price for identical assets and debts on
an active market.
Assets and liabilities are assigned to level 2 if the parameters
which are used as the basis for the measurement of the fair
value are derived either directly as prices or indirectly from
observable prices.
kEUR Daily Not more than 1 yearMore than 1 year,
not more than 5 years
Note 2016 2015 2016 2015 2016 2015
Trade receivables: from associates, from companies in which participating interests are held and other current assets [21–23] 341,580 244,843 49,373 46,838 0 0
Restricted bank balances [24] 2,973,739 1,321,049 0 0 0 0
Other cash and bank balances [25] 116,432 94,896 10,683 27,328 0 0
Non-derivative financial assets 3,431,751 1,660,788 60,056 74,166 0 0
Non-current liabilities [28] 219 2,204
Other bankloans and overdrafts 17 41,750 0 0 0 0
Trade payables: to associates, to companies in which participating interests are held and other current liabilities [30, 32] 341,580 244,843 33,979 18,021 0 0
Cash deposits by market participants [31] 2,973,739 1,321,049 0 0 0 0
Non-derivative financial liabilities 3,315,336 1,607,642 33,979 18,021 219 2,204
Financial assets and derivatives [20] 0 0 10,569 2,142 31,388 4,473
Financial liabilities and derivatives [20] 0 0 10,569 2,142 31,388 4,473
Consolidated Financial Statements
Notes on the Consolidated Financial Statements
Other Notes
131

36. TREASURY SHARES
Based on a resolution passed at the annual general meeting
on 11 June 2015, EEX is authorised to acquire own shares of
up to EUR 4,005,000 of the nominal capital of EEX. Together
with the other own shares which are held by the company
or are required to be attributed to it according to art. 71 a ff.
AktG, the acquired shares must not account for more than
10% of the nominal capital at any time. This authorisation
must not be used for the purpose of trading in own shares.
The corresponding resolution is valid until 31 December 2017.
In the 2015 financial year, EEX used this authorisation. As at
the reporting date (31 December 2016), EEX held own shares
in the amount of an calculated share in the nominal capital
of kEUR 58.
37. TRUST ASSETS
In accordance with the Clearing Conditions, ECC Luxembourg
keeps emission allowances surrendered by trading partici-
pants in exchange trading in EU emission allowances, in trust
in its account at the German Emissions Trading Authority. As
at 31 December 2016, these comprised 45,052,037 certifi-
cates (2015: 66,102,424 certificates) with a market value of
kEUR 205,520 (2015: kEUR 536,411). As a result, there are
trust liabilities to the corresponding amount in the form of the
beneficiaries’ rights to the recovery of the allowances.
35. FINANCIAL RISK AND CAPITAL MANAGEMENT
In accordance with the requirements defined in art. 91 para-
graph 2 AktG [German Companies Act], EEX Group has a risk
early warning system covering all business areas. This is
intended to identify and address risks early on.
The Chief Risk Officer (CRO) of EEX AG is in charge of designing
EEX Group’s risk early warning system. The individual group
companies are largely responsible for risk management on
their own. With respect to risks requiring group coordination,
minimum standards are specified by EEX’s Management Board
for all group companies. Depending on their size, the individual
group companies have their own risk management unit to this
end. The group companies report to EEX risk management on
a monthly basis.
Counterparty risk, market price risk, liquidity risk, operational
risk as well as business and compliance risk constitute poten-
tial risk categories.
For a detailed description of risk management within EEX
Group, reference is made to the explanations in the manage-
ment report.
132 Annual Report 2016
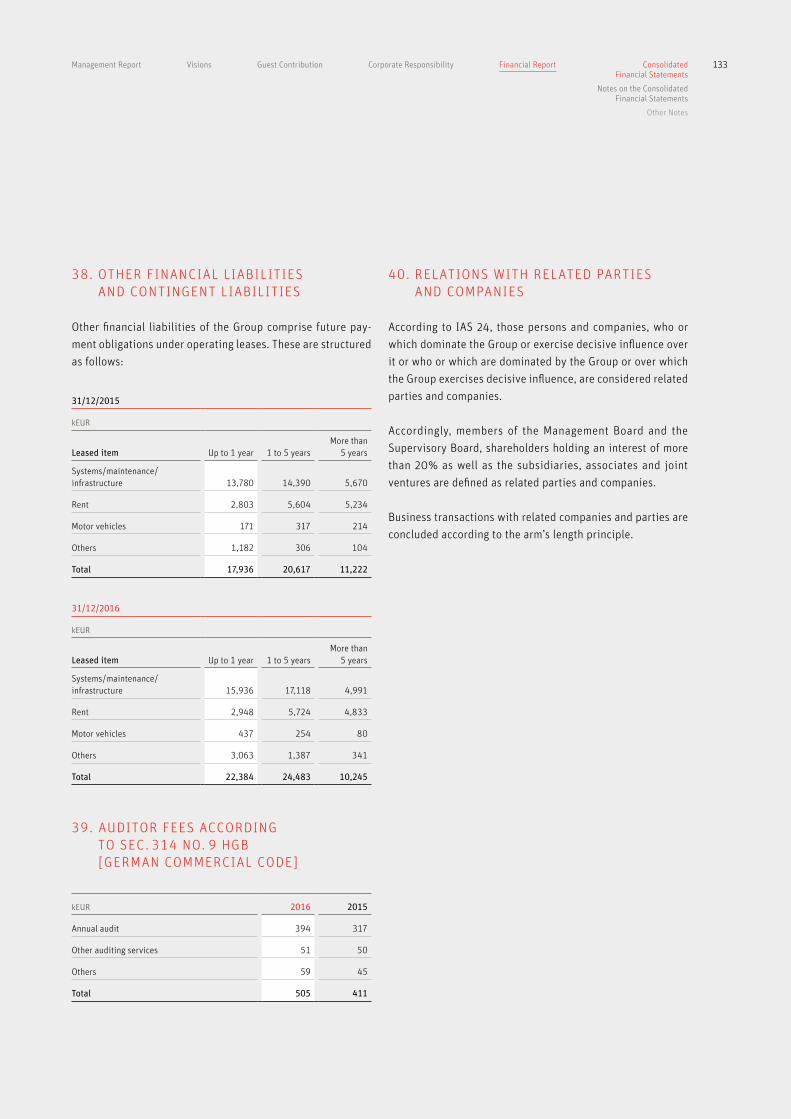
Management Report Visions Guest Contribution Corporate Responsibility Financial Report
40. RELATIONS WITH RELATED PARTIES AND COMPANIES
According to IAS 24, those persons and companies, who or
which dominate the Group or exercise decisive influence over
it or who or which are dominated by the Group or over which
the Group exercises decisive influence, are considered related
parties and companies.
Accordingly, members of the Management Board and the
Supervisory Board, shareholders holding an interest of more
than 20% as well as the subsidiaries, associates and joint
ventures are defined as related parties and companies.
Business transactions with related companies and parties are
concluded according to the arm’s length principle.
38. OTHER FINANCIAL LIABILITIES AND CONTINGENT LIABILITIES
Other financial liabilities of the Group comprise future pay-
ment obligations under operating leases. These are structured
as follows:
39. AUDITOR FEES ACCORDING TO SEC. 314 NO. 9 HGB [GERMAN COMMERCIAL CODE]
31/12/2015
kEUR
Leased item Up to 1 year 1 to 5 yearsMore than
5 years
Systems / maintenance / infrastructure 13,780 14,390 5,670
Rent 2,803 5,604 5,234
Motor vehicles 171 317 214
Others 1,182 306 104
Total 17,936 20,617 11,222
31/12/2016
kEUR
Leased item Up to 1 year 1 to 5 yearsMore than
5 years
Systems / maintenance / infrastructure 15,936 17,118 4,991
Rent 2,948 5,724 4,833
Motor vehicles 437 254 80
Others 3,063 1,387 341
Total 22,384 24,483 10,245
kEUR 2016 2015
Annual audit 394 317
Other auditing services 51 50
Others 59 45
Total 505 411
Consolidated Financial Statements
Notes on the Consolidated Financial Statements
Other Notes
133

RELATIONS WITH RELATED PERSONS
Management Board
Peter Reitz (Chief Executive Officer)Leipzig
Dr Egbert LaegeGröbenzell
Iris Weidinger Markkleeberg
Jean-François Conil-Lacoste Paris / France
Dr Dr Tobias PaulunLeipzig
Steffen KöhlerOberursel
Dr Thomas SieglEschborn
Supervisory Board
Dr Jürgen Kroneberg (Chairman)Lawyer, Cologne
Dr Nigel Hawkins (from 20 January 2016)Head of Power & Fuel Portfolio Management, Enel Trade S.p.A., Rome / Italy
Dr Michael RedanzManaging Director, EWE Trading GmbH, Bremen
Dr Hartmut Mangold (Vice-Chairman) Secretary of State, Saxon State Ministry for Economic Affairs, Labour and Transport, Dresden
Ulf HeitmüllerChairman of the Executive Board, VNG – Verbundnetz Gas Aktiengesellschaft, Leipzig
Klaus RohatschMember of the Management Team, EDF SA, Cattenom / France
Jürg Spillmann (Vice-Chairman)Member of the Executive Board, Eurex Zürich AG, Zurich / Switzerland
Burkhard JungMayor of the City of Leipzig, Leipzig
Dr Randolf Roth (until 16 June 2016)Head of Eurex Market Design, Eurex Frankfurt AG, Eschborn
Hans E. Schweickardt (Vice-Chairman)Chairman of the Supervisory Board, Polenergia S.àr.l., Warsaw / Poland
Michael LockettDirector of Power Dispatch & Real-Time Trading, Uniper Global Commodities SE, Düsseldorf
Uwe SchweickertManaging Director Market Operations & Executive Office, Deutsche Börse AG, Eschborn
Dr Hans-Joachim Arnold Head Legal / Compliance, Innogy SE, Essen
Katja Mayer Managing Partner, KM Networks GmbH, Hofheim
Marco SteegHead of Financial Accounting & Controlling, Deutsche Börse AG, Eschborn
Dr Dirk BiermannManaging Director, 50Hertz Transmission GmbH, Berlin
Prof. Harald R. PfabManaging Director, HHP Beratung GmbH, Fronreute
Heike EckertMember of the Management Board, Eurex Clearing AG, Eschborn
Andreas Preuß (from 16 June 2016)Deputy Chief Executive Officer, Deutsche Börse AG, Eschborn
The members of the Supervisory Board of EEX received emoluments of kEUR 341
for their work during the financial year. The payment will be made in 2017.
134 Annual Report 2016

Management Report Visions Guest Contribution Corporate Responsibility Financial Report
RELATIONS WITH UNCONSOLIDATED COMPANIES,
ASSOCIATES AND JOINT VENTURES
Representatives of the further shareholders of Powernext S.A.
hold key positions on the board of directors of Powernext SA.
At the same time, these representatives hold key positions
at the respective shareholding companies GRTgaz, Bois-Co-
lombes, France, parent company of 3GRT, Tarascon, France,
and EDEV SA, Courbevoie, France. In the financial year 2016,
Powernext provided services in the context of the develop-
ment and maintenance of individual software solutions for
market coupling and balancing and of an electronic trading
platform for 3GRT. In the context of these services, revenue of
kEUR 937 was generated in 2016.
RELATIONS WITH RELATED COMPANIES
On 31 December 2016, Eurex Zürich AG with registered offices
in Zurich, Switzerland, held 62.91% of the shares in EEX
(2015: 62.91%) after deduction of the own shares held by EEX.
The relations with companies belonging to Deutsche Börse
Group are as follows:
kEUR 2016 2015
Deutsche Börse Group
EEX Group as the recipient of services
Provision of trading system & IT infrastructure 7,471 10,927
Provision of services 1,331 203
Financial services 0 34
EEX Group as the provider of services
Provision of market data –275 –446
Account receivable as at 31 December 117 110
Liability as at 31 December 2,426 1,887
Financial receivable as at 31 December 0 5,007
kEUR 2016 2015
SEEPEX a.d.
EEX Group as the provider of services
Provision of services –276 0
Project costs 0 –397
Account receivable as at 31 December 313 397
Consolidated Financial Statements
Notes on the Consolidated Financial Statements
Other Notes
135
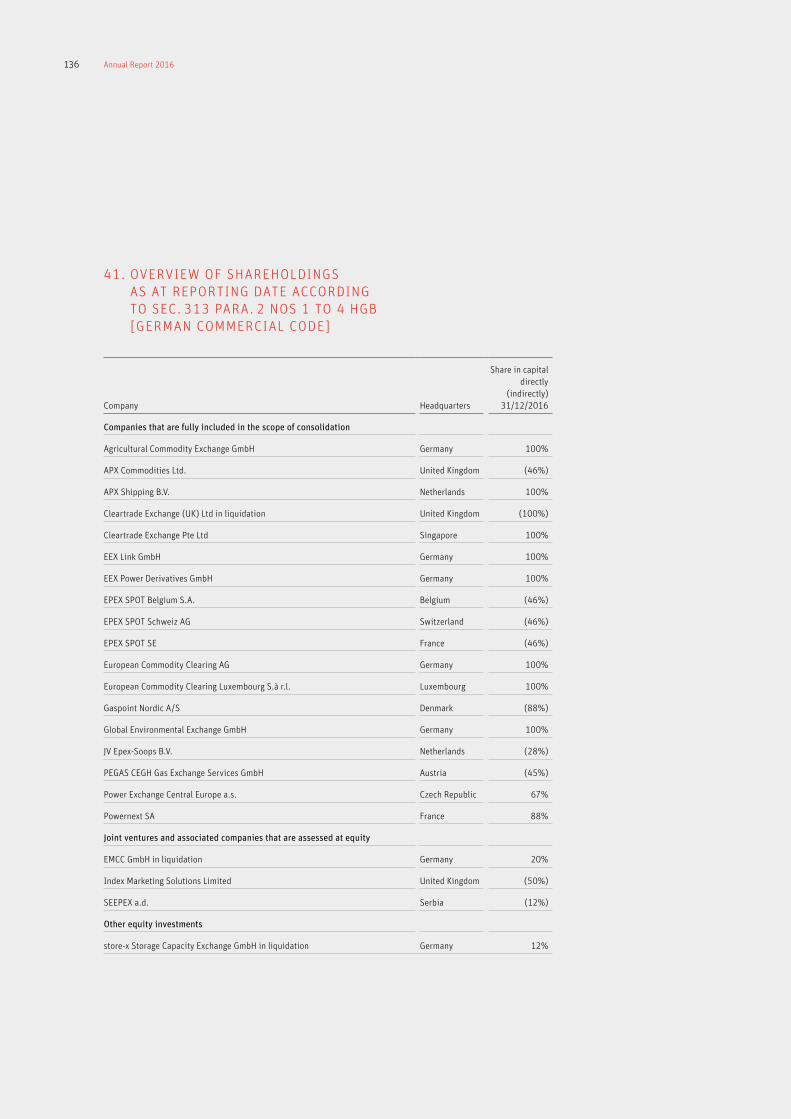
41. OVERVIEW OF SHAREHOLDINGS AS AT REPORTING DATE ACCORDING TO SEC. 313 PARA. 2 NOS 1 TO 4 HGB [GERMAN COMMERCIAL CODE]
Company Headquarters
Share in capital directly
(indirectly) 31/12/2016
Companies that are fully included in the scope of consolidation
Agricultural Commodity Exchange GmbH Germany 100%
APX Commodities Ltd. United Kingdom (46%)
APX Shipping B.V. Netherlands 100%
Cleartrade Exchange (UK) Ltd in liquidation United Kingdom (100%)
Cleartrade Exchange Pte Ltd Singapore 100%
EEX Link GmbH Germany 100%
EEX Power Derivatives GmbH Germany 100%
EPEX SPOT Belgium S.A. Belgium (46%)
EPEX SPOT Schweiz AG Switzerland (46%)
EPEX SPOT SE France (46%)
European Commodity Clearing AG Germany 100%
European Commodity Clearing Luxembourg S.à r.l. Luxembourg 100%
Gaspoint Nordic A / S Denmark (88%)
Global Environmental Exchange GmbH Germany 100%
JV Epex-Soops B.V. Netherlands (28%)
PEGAS CEGH Gas Exchange Services GmbH Austria (45%)
Power Exchange Central Europe a.s. Czech Republic 67%
Powernext SA France 88%
Joint ventures and associated companies that are assessed at equity
EMCC GmbH in liquidation Germany 20%
Index Marketing Solutions Limited United Kingdom (50%)
SEEPEX a.d. Serbia (12%)
Other equity investments
store-x Storage Capacity Exchange GmbH in liquidation Germany 12%
136 Annual Report 2016

Management Report Visions Guest Contribution Corporate Responsibility Financial Report
43. ESSENTIAL EVENTS AFTER THE REPORTING DATE
There were no essential events after the reporting date.
42. WAIVER ACCORDING TO SEC. 264 PARA. 3 HGB AND SEC. 264B HGB [GERMAN COMMERCIAL CODE]
In accordance with section 264 paragraph 3 or section 264b
HGB, the option of a waiver from the obligation to prepare
annual financial statements and a management report in
accordance with the provisions for corporations, to have same
audited and to disclose same was used for the subsidiary:
EEX Power Derivatives GmbH, Leipzig
Consolidated Financial Statements
Notes on the Consolidated Financial Statements
Other Notes
137

Steffen Köhler
Chief Operating Officer (COO)
Dr Dr Tobias Paulun
Chief Strategy Officer (CSO)
Iris Weidinger
Chief Financial Officer (CFO)
Leipzig, 3 March 2017
Peter Reitz
Chief Executive Officer (CEO)
Jean-François Conil-Lacoste
Executive
Director Power Spot Markets
Dr Egbert Laege
Executive
Director Gas Markets
Dr Thomas Siegl
Chief Risk Officer (CRO)
138 Annual Report 2016

Management Report Visions Guest Contribution Corporate Responsibility Financial Report
AUDIT REPORT
We have expressed our unqualified opinion as follows:
“We have audited the consolidated financial statements prepared by the European Energy Exchange AG,
Leipzig–comprising the consolidated statement of profit or loss and other comprehensive income,
the consolidated statement of financial position, the consolidated statement of changes in equity,
the consolidated statement of cash flows and the notes on the consolidated financial statements–
and its report on the position of the Company and the Group for the business year from January 1,
2016 to December 31, 2016. The preparation of the consolidated financial statements and the group
management report in accordance with IFRSs, as adopted by the EU, and the additional requirements
of German commercial law pursuant to § 315a Abs. 1 HGB [Handelsgesetzbuch “German Commercial
Code”] are the responsibility of the parent company’s management. Our responsibility is to express
an opinion on the consolidated financial statements and on the group management report based
on our audit.
We conducted our audit of the consolidated financial statements in accordance with § 317 HGB
[Handelsgesetzbuch “German Commercial Code”] and German generally accepted standards for the
audit of financial statements promulgated by the Institut der Wirtschaftsprüfer [Institute of Public
Auditors in Germany] (IDW). Those standards require that we plan and perform the audit such that
misstatements materially affecting the presentation of the net assets, financial position and results
of operations in the consolidated financial statements in accordance with the applicable financial
reporting framework and in the group management report are detected with reasonable assurance.
Knowledge of the business activities and the economic and legal environment of the Group and
expectations as to possible misstatements are taken into account in the determination of audit
procedures. The effectiveness of the accounting-related internal control system and the evidence
supporting the disclosures in the consolidated financial statements and the group management
report are examined primarily on a test basis within the framework of the audit. The audit includes
assessing the annual financial statements of those entities included in consolidation, the determina -
tion of entities to be included in consolidation, the accounting and consolidation principles used
and significant estimates made by management, as well as evaluating the overall presentation of
the consolidated financial statements and group management report. We believe that our audit
provides a reasonable basis for our opinion.
Consolidated Financial Statements
Audit Report
139

Our audit has not led to any reservations.
In our opinion, based on the findings of our audit, the consolidated financial statements comply
with IFRSs, as adopted by the EU, and the additional requirements of German commercial law
pursuant to § 315a Abs. 1 HGB and give a true and fair view of the net assets, financial position
and results of operations of the Group in accordance with these requirements. The group manage-
ment report is consistent with the consolidated financial statements, complies with the German
statutory require ments, and as a whole provides a suitable view of the Group’s position and
suitably presents the opportunities and risks of future development.”
Frankfurt / Main, March 3, 2017
KPMG AG
Wirtschaftsprüfungsgesellschaft
Dielehner Jung
Auditor Auditor
140 Annual Report 2016

Imprint
Published by European Energy Exchange AG Augustusplatz 9 04109 Leipzig Germany www.eex.com
Concept and layout wirDesign Berlin Braunschweig
Photographs Jeibmann Photographik (Title, p. 4, 9, 11, 23, 30, 35) Getty Images / Michael Utech (p. 20/21) iStockphoto/nightman1965 (p. 26/27) Getty Images/shaunl (p. 32/33) University of Applied Sciences Kiel (p. 39) BMUB/Thomas Imo (p. 41) EEX (p. 37, 44–47)
Printed by Gutenberg Beuys Feindruckerei GmbH, Langenhagen
LOCATIONS
LEIPZIG (Headquarters)
AMSTERDAMBERLINBERN
BRUSSELSCOPENHAGEN
LONDONLUXEMBOURG
MADRIDMILANPARIS
PRAGUEOSLO
SINGAPOREVIENNA
This Annual Report was published on 27 April 2017 and is also available on EEX’s website.

GLOSSARYAuction
Trading form for pricing and matching
of bid and ask orders into trades. In
auctions, all orders in the order book
are matched to form transactions at a
given point in time.
Back-end
The central trading system is called
the back-end of the exchange. This
system is responsible for matching
supply and demand and processes
these in accordance with specific
execution rules.
Broker
This is a term for companies that do
not conclude transactions for their
own account but on behalf of a third
party. On EEX, brokers assume the
arrangement of transactions concluded
over the counter (OTC trades).
Clearing house
This is a body which steps into the
process chain between the buyer
and seller in the capacity of a central
counterparty. The clearing house settles
the transactions with the buyer and
seller, carries out the delivery of trans-
actions with these and collateralises
the transactions.
Continuous trading
This is a form of trading in which all
orders in the order book (bid and ask)
are constantly checked as to whether
they are executable. As soon as there
are two matching executable orders,
these are immediately combined into
a trade.
Cross-Margining
Cross-margining refers to the offsetting
of opposite risks. Offsetting becomes
possible as a result of a high correlation
in price movements. Cross-margining
permits the reduction of margins paid
by trading participants who are actively
trading various products on various
markets.
Day-ahead market
This is a sub-market of the spot market
on which products can be traded up
until one day before delivery.
Derivatives market
Trading transactions concluded on the
derivatives market are settled physically
or financially at a later time which is
agreed in advance. Trading on the deri-
vatives market permits portfolio opti mi-
sation in the medium to long term.
On the EEX derivatives market, trading
participants can hedge against price
risks up to nine years in the future.
EU ETS
EU Emission Trading System — The
emissions trading scheme of the Euro-
pean Union, which was launched as
the first multinational emissions trading
system in 2005. The first trading period
of the EU ETS was from 2005 to 2007
and the second trading period was from
2008 to 2012. The third EU ETS period
began in 2013 and will end in 2020.
EUA
EU Allowance — One EUA confers the right
to emit one tonne of CO2 equivalent.
An EUA is the smallest tradable unit in
EU emissions trading.
Front-end
This term refers to the user interface of
a trading system for the participants
which permits the exchange of data with
the back-end. The trading participants
have the possibility to use individual
front-ends or ISV software.
Future
A future is the contractual obligation to
buy (buyer of a future) or sell (seller of
a future) a specified quantity of an under-
lying security at a specified price during
a specified future period (delivery period).
Futures contracts are exclusively traded
on regulated exchanges and settled on a
daily basis at the current market price.
ISV
Independent Software Vendor —
An ISV offers solutions for trading.
EEX cooperates with a large number
of ISVs.
Market coupling
This is a process employed to efficiently
manage grid congestion between adja-
cent power spot markets. This is done
with the help of implicit auctions of grid
capacities. In order to achieve this, the
spot auctions of the exchanges taking
part must be coordinated.
Market maker
A market maker is a trading participant
who holds both a buy and a sell order
(quote) in the order book for a minimum
period during the trading day. Market
makers help to ensure basic liquidity in
the order book.

Open Interest
The Open Interest refers to the total of
all derivatives contracts which are open
(i.e. not yet settled) at a given point in
time. It corresponds to the total number
of derivatives contracts in a given mar-
ket that have not yet been closed out,
fulfilled by means of the physical deliv-
ery of the underlying asset or executed
via cash settlement.
Option
An option is the contractual right to buy
(buy or call option) or sell (sell or put
option) a specified volume of an under-
lying security at a specified price and
a predetermined future time.
Primary market auction
In the framework of primary market
auctions, CO2 emission allowances are
issued to the market for the first time.
EEX has carried out these auctions as a
service provider since 2010. At present,
auctions are carried out on the EEX
spot market on behalf of 27 EU Member
States.
Secondary market
Continuous trading of CO2 emission
allowances takes place on the second-
ary market. EEX operates the secondary
market for EU Allowances (EUA), EU
Aviation Allowances (EUAA) and Certified
Emission Reductions (CER).
Settlement price
Daily market price for a futures or
options contract which is established
by the exchange and used for its daily
settlement.
Spot market
Trading transactions concluded on the
spot market are settled physically at the
latest two days after the conclusion of
the trade. The spot market is used for
the short-term optimisation of procure-
ment and sales on the market.
Spread
A spread is the difference between the
best buy and the best sell offer. It can
further be differentiated into location
and time spreads. The location spread is
the price difference between two futures
with the same maturity and expiry, but
different delivery areas. A time spread
depicts the price range between two
futures with the same delivery area and
maturity, but different expiry dates.
Trade registration
A service which enables the trading
participants to register transactions
concluded over the counter (OTC trans-
actions) on the exchange, as a result
of which clearing and settlement are
provided by the clearing house.
Trade reporting service (TRS)
With this service, participants use the
exchange infrastructure to report trad-
ing data and thus implement regulatory
reporting requirements.

European Energy Exchange AG
Augustusplatz 9
04109 Leipzig
Germany
www.eex.com
![MAPPING GROUP STRUCTURAL BRAIN - uni-jena.dedbm.neuro.uni-jena.de/HBM2010/SBMG_HBM2010_Flyer.pdf · index [1459 WTh-AM], fractal dimension [1341 WTh-AM], ... of methods for structural](https://img.pdfslide.us/doc/110x75/5ae8059f7f8b9ae1578fd8e5/mapping-group-structural-brain-uni-jenadedbmneurouni-jenadehbm2010sbmghbm2010flyerpdfindex.jpg)