Embed Size (px)
Citation preview
SEPAEPA Region 5 Records Ctr.
241682
U.S. ENVIRONMENTAL PROTECTION AGENCY
Contract No. 68-01 -7367
OOH056
TECHNICAL
\
\
I
I
I
I
ASSISTANCETEAM
FOR
SUMMIT EQUIPMENT AND SUPPLIES
AKRON, OHIO
Region V
ROY F. WESTON, INC.Spill Prevention & Emergency Response Division
In Association with ICF Technology Inc., C.C. Johnson & Malhotra, P.C.,Resource Applications, Inc., Geo/Resource Consultants, Inc., and
- 'Environmental Toxicology International, Inc.
OCSIGNEAS
rt
EXTENT OF CONTAMINATION
FOR
SUMMIT EQUIPMENT AND SUPPLIES
AKRON, OHIO
Prepared For:
U. S. Environmental Protection AgencyRegion v
230 South Dearborn StreetChicago, Illinois
" " CONTRACT NO. 68-01-7367
^ TAT-05-N-00068
TDD# 5-8703-15
5Prepared By:
J WESTON-SPERTechnical Assistance Team
Region Va<
April 1988
r ••=-
j TABLE OF CONTENTS
* " PAGE
• LIST OF FIGURES iii
LIST OF TABLES iv
| 1.0 INTRODUCTION 1
2 . 0 SAMPLE LOCATIONS 6
» 3.0 SAMPLING METHODS 30
U 4.0 ANALYTICAL RESULTS ..-r«
5 . 0 RECOMMENDATIONS .-. .^8
£ BIBLIOGRAPHY 60
ATTACHMENT A - 61
1 ATTACHMENT B - .62
^ ATTACHMENT C - 631
ATTACHMENT D - , 64
Jj ATTACHMENT E - " 65"
ATTACHMENT F - 66
ii
LIST OF FIGURES
PAGE
1. LOCATION MAP 2
2 . SITE LOCATION MAP 3
3. SITE MAP 4
4 . CASTLE APARTMENTS FIELD SAMPLING MAP 11
4A. CASTLE APARTMENTS FIELD TEST PITS & SAMPLE EXCAVATIONS 12
5. LAKE NESMITH BEACH SAMPLE LOCATIONS T.13•=•
6. LAKE NESMITH SHALLOW SEDIMENT SAMPLE LOCATIONS .".Tl6-
7 . LAKE NESMITH DEEP SEDIMENT SAMPLE LOCATIONS 17
8 . LAKE NESMITH SURFACE WATER 18
9 . AIR SAMPLING LOCATIONS 19
10. ON-SITE PCS SAMPLE LOCATIONS 21
11. ON-SITE TEST PIT LOCATIONS 22
12 . PRIORITY POLLUTANT METALS SOIL SAMPLE LOCATIONS 24
13 . DIOXIN/FURAN SAMPLE LOCATIONS 25
14 . WELL LOCATION MAP 26
15 . SWIPE SAMPLE LOCATIONS 29
ill
LIST OP TABLES - .
PAGE
tg 1. SAMPLE MATRICES AND PARAMETERS 7
J2 . MONITOR WELL WATER TABLE ELEVATIONS 27
[J 3. SUPPORT AREA PCS SAMPLE RESULTS 35
4 . OFF-SITE TEST PIT ANALYSIS FOR PCBs 37
^4 5. LAKE NESMITH BEACH PCS SAMPLE RESULTS 38
s- 6. PCB AIR MONITORING RESULTS, MAY 1987 T.1.1II
7 . ON-SITE SURFACE SOIL PCB SAMPLE RESULTS : . . 43
IJ 8. ON-SITE TEST PIT ANALYSIS FOR PCBs 48
9 . SOIL BORING ANALYSIS FOR PCBs 49
H 10. PRIORITY POLLUTANT METALS (TOTAL) SOIL SAMPLE RESULTS 50
11. 2,3,7,8 DIOXIN/FURAN ANALYSIS RESULTS 53
12 . DIOXIN/FURAN ANALYTICAL RESULTS 54
•rd 13 . GROUND WATER 55
14. SWIPE ANALYSIS ON METAL (100 cm2) FOR PCBs 57
0
da

1.0 INTRODUCTION
1.1 Site Location and Description
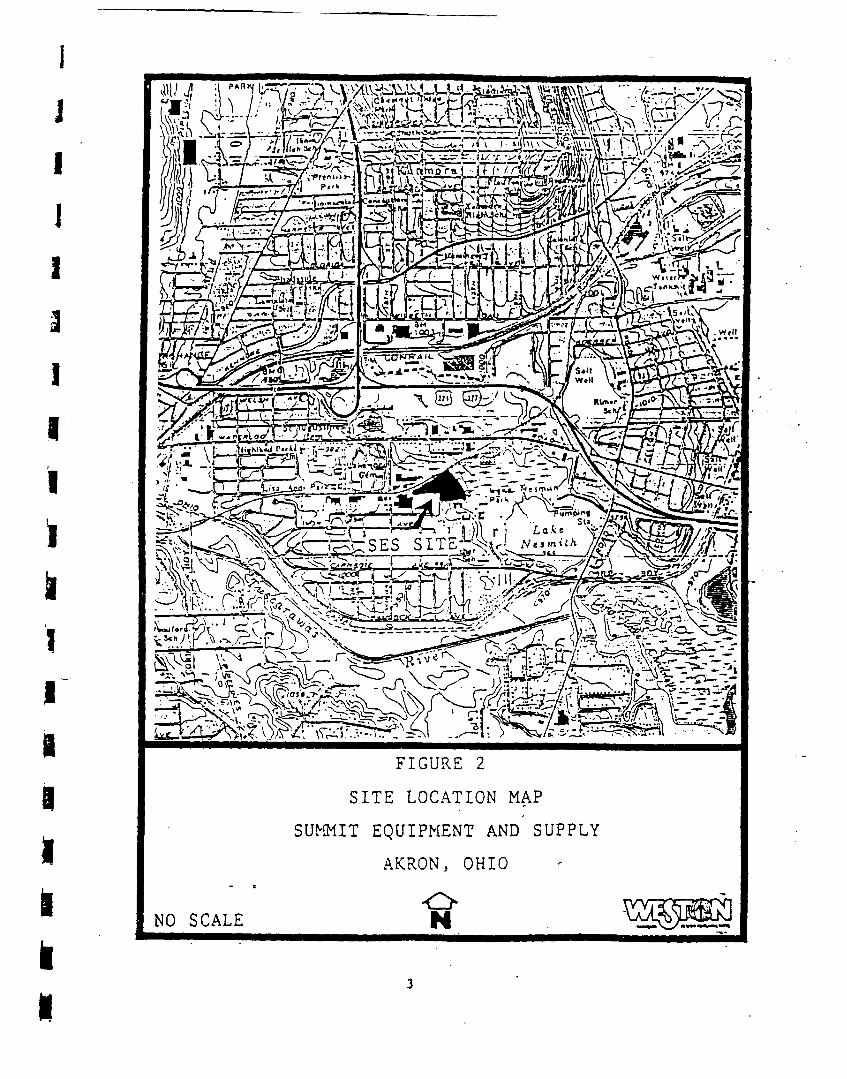
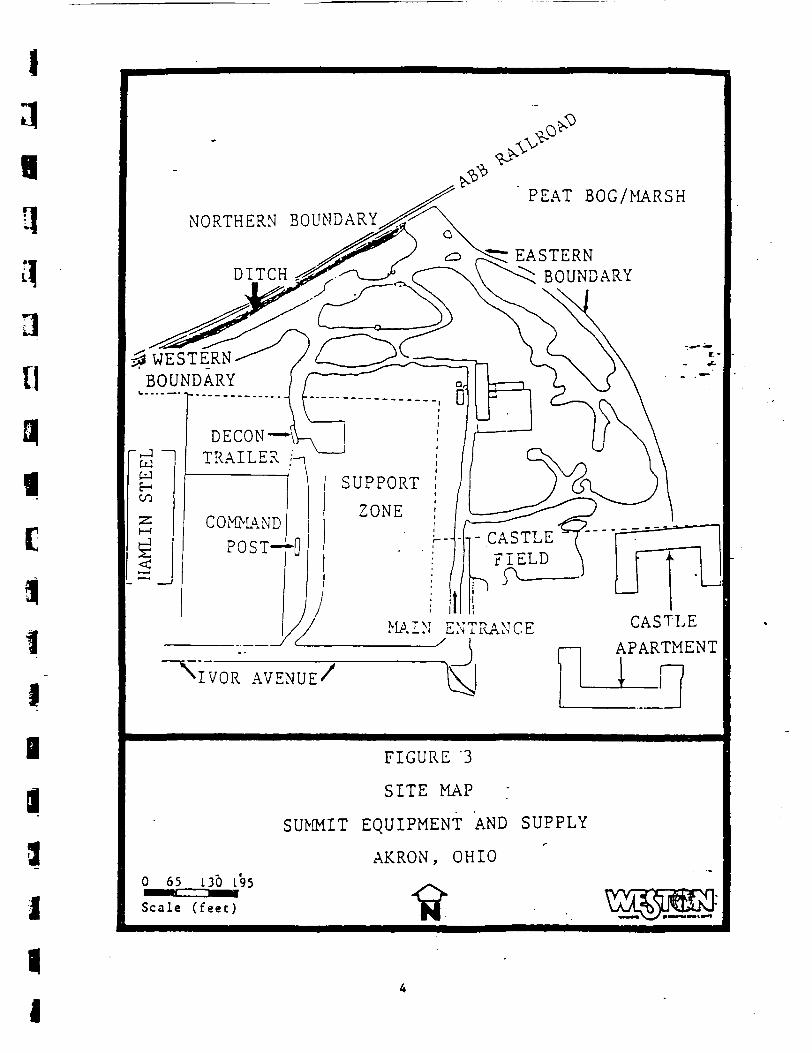
Summit Equipment and Supplies (SES) is located at 875 IvorAvenue, Akron, Ohio, 1/2 mile south of the 1-77 & 1-277 inter-change (Figures 1 and 2) . The 6-acre site is bordered by theAkron-Barberton Beltway Railroad tracks to the north; a marsh tothe east; a residential area on Ivor Avenue, to the south; and, alight industrial area to the west (Figure 3). SES's location ishydrologically up-gradient from a marsh and Lake Nesmith, a localrecreational area.
SES is an operating scrap metal processing facility. The site iscovered over most of its surface with continuous piles of scrapand debris, some as high as 20 to 30 ft. The piles were notobserved to be sorted or segregated in any particular order~Rather, they are aggregate heaps of sheet metal, structuralsteel, wire, tires, electrical equipment, batteries, and othermiscellaneous debris. Access is limited by lack of access roads.
The site overlays a portion of the Akron River buried valley, aprolific ground water producer. The valley is filled in placesto depths greater than 300 ft, .with interlensing layers of coarseto fine alluvium, silts, clays and tills. Immediately east ofthe site is a peat bog bordering Lake Nesmith. Lake Nesmithempties into the Ohio Canal, which in turn leads to theTuscarawas River, forming the headwaters of the Portage Lakes, anOhio State Park. The site is located on a sand ridge; beneaththis, the sand coarsens to include" gravels, with a thin gray siltlayer found at depths of 10 to 20 ft.
The subsurface geology, as verified by the monitoring wells,consists of interbedded sands, gravels and silts. The watertable indicated from these wells is 7 to 16 ft below grade, withground water flowing to the east and south east. The sands atthe surface of the site are generally highly permeable, thoughlow lying areas exhibit ponding as a result of the migration offiner materials to these areas via overland flow.
1.2 Site History
The site had been in operation since the 1950s. The site opera-tors have reportedly been acquiring and processing electricaltransformers since the late 1960s. Metals reclaimed from wire inelectrical equipment were smelted on .site ' in a small furnaceadjacent to the SES office; oils reclaimed from transformers thatwere being scrapped provided the fuel for this furnace.
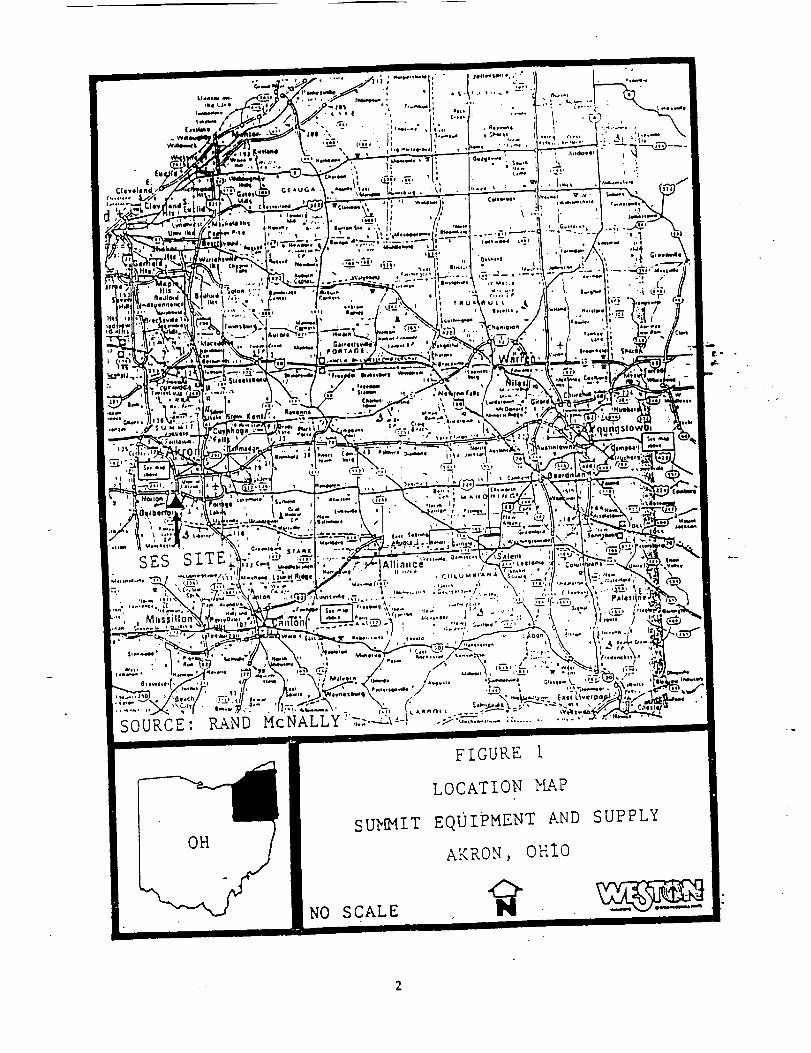
SOURCE:' RAND McNALLY
FIGURE 1
LOCATION MAP
SUMMIT EQUIPMENT AND SUPPLY
AKRON, OHIO
NO SCALE
JI
1
1I1II\Ia
ftII
•^iV*_^J** ^T^'^T-'j]_i'_i_ t"rMT^JSnVfra1 • jl [: /"
kkS^Gg^i C_f»"J r T \ <x>rT~*r*UiWn -»r-4i=Jy r\A"<\^Skiy. 7. --J SS5'*"''v-C• ••' r 4 il w ' «^^OilV_l, i. i • • vTN
ffin Tl 'is&pu*.(|j /^^yrjII r / ^^S^-i7 / / i'.'... v/^^i^zr^u?.sV isS&mi
r vj cJn A • vv'i. • >y^
^g,gj| ^
^^f ' m'j^k^E5^^^^S^S, fe^3^vMk^/;^iP^UTI^^i^TTyse^tLt^rJ^iaM^---^^
<^T~" v-JT—v" i '1^-jC»- 'I ''JM C^fc«-'c •/ • ^jSftinf ;Sr
X >T _\JTCXS JirAWWP^r^^sr- -U.-l 'i/,f> 'CH^-^L^-sS^^'---/^IJ • -Jij J^-»ri!J-JJfl.' ^ '7yst:»-^l_W.Jr-S^I^^^ .-" 1 )7 . TieirnarrJ^^rV
SSs^T^X^^g>:SES SITEp^y-j^N*\™*th /$
^^T^^^^^^hi ,-^^^^^^ ' ^ .^-SSj^-^ffa'<^iil-^5^gvfea&^ > i' »^v%55tes—^T>. ^-T.MI
•-• *\\^^. v. x^*«« - -c» ^ x *v •* \
^d'fr'" r-s.^vV--i;-. •• -••'••••yl^^^ya
'W^^-^^
FIGURE 2
SITE LOCATION MAP
SUMMIT EQUIPMENT AND SUPPLY
AKRON, OHIO
NO SCALE
I3I
gci1iB
iii
NORTHERN BOUNDARYPEAT BOG/MARSH
EASTERNBOUNDARY
WESTE_RNBOUNDARY
DECON—\TRAILER /
•: \ SUPPORT
ZONE
T-CASTLEFIELD
CASTLE
APARTMENTMAIN ENTRANCE
•IVOR AVENUE/
FIGURE '3
SITE MAP
SUMMIT EQUIPMENT AND SUPPLY
AKRON, OHIO0 65 130 195
Scale (feec)
i

Tn July 1986, the Ohio Environmental Protection Agency Office of.mergency Response (OEPA/pER) received a complaint from the AkronPolice Department regarding inappropriate handling of transfor-mers at.the sit*. A compliance inspection was subsequently per-formed by the OEPA/OER, pursuant to the U.S. EnvironmentalProtection Agency (U.S. EPA) Pilot Toxic Substance Control Act(TSCA) Cooperative Enforcement Program. During the July 1986,inspection, the OEPA/OER inspectors reported an "estimated 2,000transformer carcasses, several capacitors and numerous areaswhere spills were suspected to have occurred on the site. Fivesoil samples were collected on site. PCBs were detected in allof these samples at levels ranging from 180 parts per million(ppm) to 74,000 ppm. In an October 1986 letter, OEPA/OER advisedthe owners of the facility of the PCB contamination and suggestedthat the company retain a consultant to further evaluate andremediate the problem.
On February 3, 1987, the U.S. EPA Region V Emergency Response *Section (ERS) was notified by the Region V TSCA Section of the —high levels of PCBs present at the site. TSCA requested that theERS evaluate the site with respect to potential off-site migra-tion of PCBs.
1.3 Site Inspection
On February 5, 1987, ERS and Technical Assistance Team (TAT)personnel performed a site investigation at SES. The site wasobserved to be in the condition reported by the OEPA/OER.
The TAT collected 25 soil samples in potential off-site receptorlocations. Results of sample analyses, received on February 12,1987, demonstrated low levels of PCBs (less than 20 ppm) in resi-dential areas to the south of the site. Samples collected fromdrainage ditches along the site's northern perimeter showed PCBspresent at levels ranging from 550 to 8,700 ppm. The ditchesdrain into a large marsh area to the east of the site, whichdrains to Lake Nesmith, further to the southeast.
On February 19, 1987, TAT collected eight additional samples tofurther define the contaminated off-site areas northwest andnortheast of the site. Results of these samples indicated thatno up-gradient source existed and that the contamination waslimited to the ditch.
Subsequent to notification by the ERS, U.S.; Occupational Safetyand Health Administration (OSHA) personnel inspected the SESfacility on February 17, 1987.

II
IIil
The results of the sampling efforts will be evaluated and recom-mendations for further actions with respect to removal actions
I and continued sampling will be presented. '"' e-• - •*•
1.5 Scope of Sampling
I The SES sample plan consisted of the collection of samples on-site and adjacent the site boundaries to delineate migration oftcontaminants and to establish off-site levels of contamination.
! The on-site samples consisted of surface samples to delineatelateral extent, and test pits sampled to a depth of 4 ft inspecific areas to delineate vertical extent of contamination.Three monitoring wells were installed on site to facilitateground water sampling with the borings utilized for deep soilsampling.
1.4 Purpose and Objective .. .
This project was conducted in conjunction with the OSC SupportTechnical Direction Document (TDD) #5-8703-14 for a removalaction at th« SES site. The main objective of the extent ofcontamination (HOC) study was to delineate areas of PCS contamin-ation, through sampling and observation, associated with theactivities carried out during operations at SES. Obtaining rapidanalytical results was essential in minimizing costs on the Emer-gency Response Cleanup Service (ERGS) contract, because the ERGScontractor was mobilized and capable of performing work essentialto stabilizing the site and mitigating threats to the populaceand the environment as areas of contamination were determined.
The sampling of the site perimeter was conducted to allow forrapid detection of contaminated areas off site, with provisionsfor follow-up sampling in areas which appeared to be contamin-ated. The original off-site sampling had to be expanded when itwas discovered that soil material was removed from a contaminatedoff-site area and used as beach sand on an adjacent property.
!A11 areas off site where soil removal occurred were re-sampledfollowing the soil removal.
A strict quality assurance/quality control (QA/QC) program wasI maintained throughout the entire project. Sample matrices
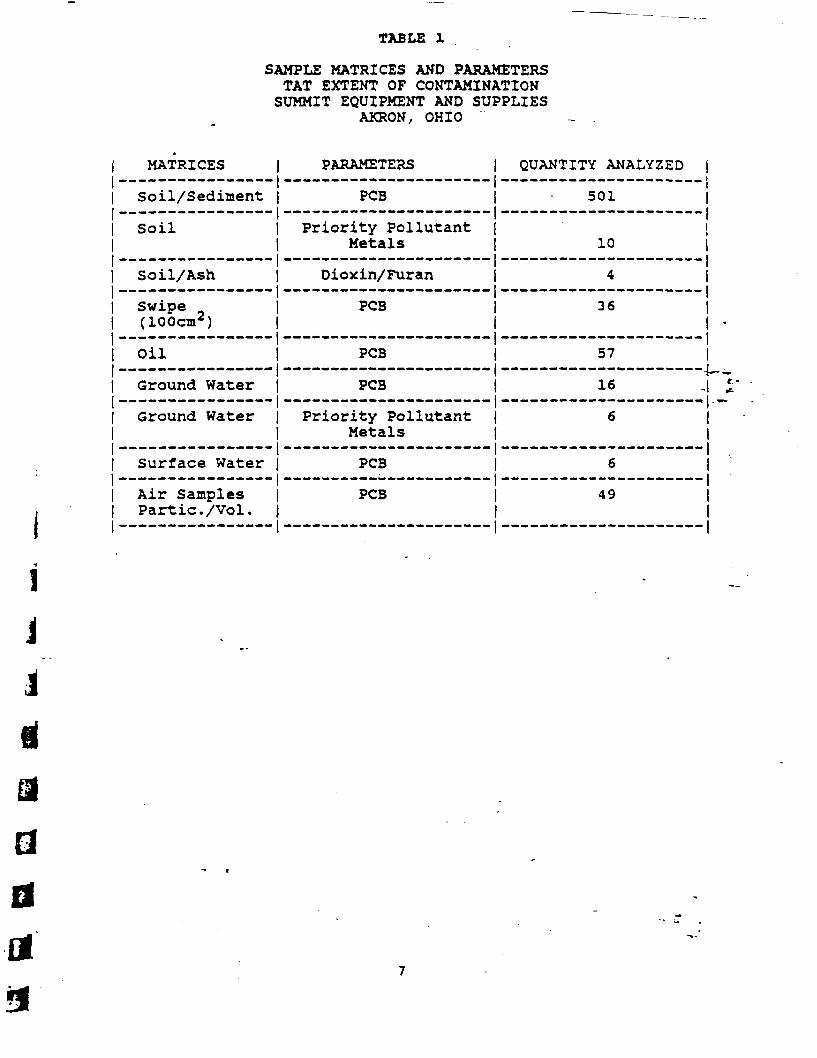
parameters and total number of samples analyzed throughout theinvestigation are summarized in Table 1.
• 2.0 SAMPLE LOCATIONS
t 2.1 Off-Site Samples
During initial emergency actions at SES, a 7-ft high chain linkfence was installed around the area considered to be the "site.!'(Figure 3). The fence enclosed approximately 6 acres,, containing
^
II
TABLE 1
SAMPLE MATRICES AND PARAMETERSTAT EXTENT OF CONTAMINATIONSUMMIT EQUIPMENT AND SUPPLIES
AKRON, OHIO
MATRICES
Soil/Sediment
Soil
Soil/Ash
Swipe(lOOcar)
Oil
Ground Water
Ground Water
Surface Water~*Air SamplesPart ic. /Vol.
PARAMETERS
PCS
Priority PollutantMetals
Dioxin/Furan
PCB
PCB
PCB
Priority PollutantMetals
PCB
PCB
QUANTITY ANALYZED
501
10
-4
36
57
16
6
6
49

Ii
1
i
a3
aEJ
the majority of the scrap steel, transformers and capacitors.Samples considered "off site" were anything outside of thisfenced area.'
2.1.1 Perimeter
The perimeter of the site, shown in Figure 3, can be divided intofive separate regions:
o North boundary, including the drainage ditch;
o West boundary, including the Hamlin Steel property andoutfalls;
o East boundary, including the wetland immediately east ofthe site fence;
o Support Area, including the eastern portion of IvoYAvenue; and, - _
o Castle Apartment property immediately south of thesite.
2.1.1.1 North Boundary
The north boundary, which was sampled for the site assessment,was re-sampled following excavation to verify that PCS levelsabove the action level were no longer present. Initially, onecomposite sample and two grab samples were collected along therailroad drainage ditch north of the site. When these sampleswere determined to contain significantly high levels of PCBs, thesoil was removed from this ditch and placed on site. The postsampling of this ditch consisted of two composite samples extend-ing from west to east along the ditch and the southern bank ofthe ditch. .In addition to these composite samples. 19 grabsamples were collected linearly along the ditch and the southernbank. These 19 samples were collected at 9 stations positionedapproximately 40 ft apart, with each station consisting of asample collected within the ditch and above the ditch on thesouth bank. One duplicate sample was also collected along theditch.
2.1.1.2 W««t Boundary
Samples were collected along the western edge of the site onproperty owned by Hamlin Steel and along the railroad right-of-way. The samples were collected to substantiate the presence orabsence of an up-gradient source of PCS contamination. Sampleswere collected at points where contamination potentially migratedfrom an off-site location. These areas included the western andfar western extent of the railroad ditch, before it cross.es

II
1
I
dau
Wingate Avenue, and all of the soils at outfalls from the northside of the Kami in Steel Products building. ~ These outfallsincluded residue from floor drains within the plant, roof drains,parking. Lot storm water drains and steam cleaning waste water.Samples were also collected of material around storm water gratesand stained soil areas outside of the entrance to Hamlin Steel.
2.1.1.3 East Boundary
The eastern extent of sampling pertains to samples collected eastof the site boundary fence with the railroad property to thenorth and the Castle Apartment property to the south as thedesignated sampling boundaries. Soil samples were collectedalong Kohler Ditch south of the railroad to substantiate if over-land flow had carried PCBs to the waterway leading to LakeNesmith.
Investigations of historic photos revealed a discernibleage-way among the hardwood trees in the marshy area, between tsite boundary, Kohler Ditch, and Lake Nesmith. The drainageswale did not have actual flow, and five samples of organicdetritus were collected along its extent. Samples of the soilwere also collected between this swale and the site's eastern,boundary from areas where transformers had been removed and alongfoot paths through the woods.
* 2.1.1.4 Support Area
The support area, consisting of the property immediately south ofthe site yet west of the entra'nce to the site, includes: IvorAvenue, the parking area north of Ivor Avenue, the old ball field-(empty lot), the south gate and auxiliary road to the site (deconarea), and the driveway to the main entrance of SES. The soilswere sampled for PCBs in these areas, near site access points, todetermine the impact from pedestrian and vehicle tracking fromthe site. The samples included composites collected of thematerial which accumulated along the Ivor Avenue curb and a grabsample collected from the catch basin on Ivor Avenue. IvorAvenue was divided into five sections extending east from thewest curb of Pike Street to the point where Ivor Avenue termin-ates at the driveway to SES. The street itself was sampled asthree sections, with each 60 ft section composited from thematerial observed along both curbs and the middle of the street.Aliquots from the north tree lawn and south tree lawn along thisentire portion were also composited separately.
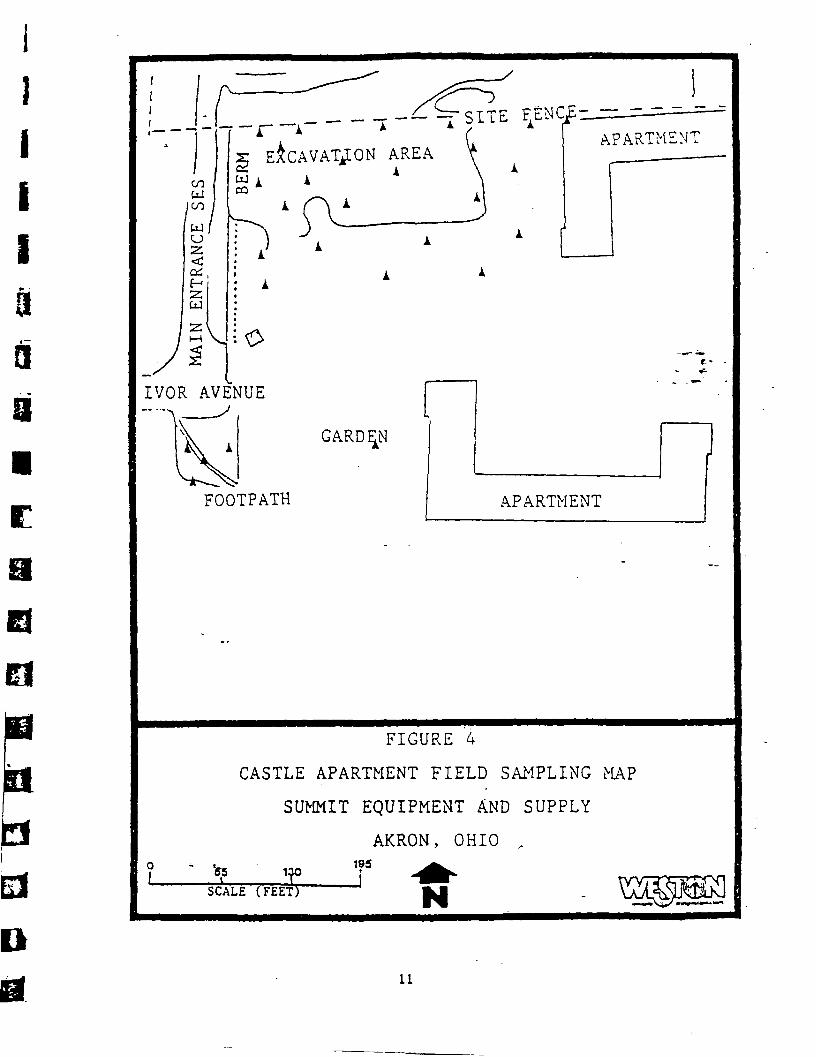
2.1.1.5 Castle Apartment Field
As sampling progressed around the perimeter of the SES site,samples were collected in the. field east of the main entrance toSES. On March 16, 1987, six samples were collected between the

i
1
I
i
1
9
aain
southeast portion of the site and the apartment -building, as wellas along the existing site fence on the north edge of the openfield. To verify the results of these samples, 13 soil sampleswere collected along this same area and extended back 50 ft fromthe fence. Upon receipt of these results it was determined thatfurther sampling of the field was necessary. . The sampling gridcordoned the field into 6 rows spaced 25 ft apart, beginning atthe fence at the north and proceeding south. The samples werecollected from the surface to a 3 inch depth and were staggeredat approximately 25 ft intervals from one row to another,effectively providing a sample every 50 ft per row (Figure 4).The results of this sampling led to the excavation of an area 220ft by 90 ft to a depth of 0.5 to 1 ft.
After the excavation of the contaminated soil, 12 additionalsamples were collected from an area parallel to the fence and
( extending 50 ft south. These samples indicated further excav«~tion was necessary. After the second soil removal took place-ofran area 120 ft by 70 ft and averaging 2 ft in depth, two sampleswere collected in this area. These samples led to the excavation
| of four test pits which were sampled at 1 ft intervals to a depthof 4 ft, with one test pit sampled to 5 ft (Figure 4A) . Thedepths sampled were from the open excavation depth and did not
1 account for the soil which had previously been removed from theselocations.
Soil was removed three additional times in this area, withsamples collected after each removal. Further interviews withthe property owner revealed that there was, at one time, a shal-low gully or washout leading from the site at the point whichindicated evidence of contamination. After receiving this infor-mation, a series of 16 excavations were initiated May 5, 1987south of the area in which prior removal actions had beenexecuted (Figure 4A). These excavations were sampled at 1 and 3ft depths with .25 of the 32 samples undergoing analysis.
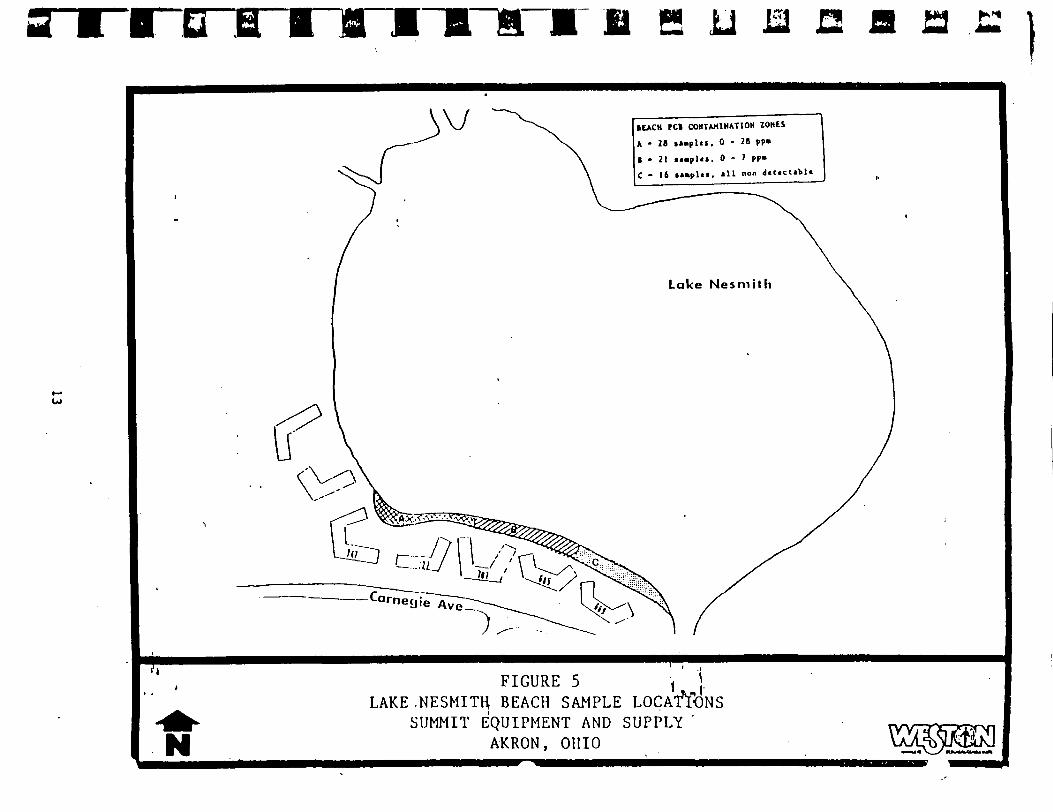
2.1.2 Lake Nesmith Beach Sampling
Sampling was initiated along the beach on the south shore of LakeNesmith (Figure 5) after the investigation and sampling along thesouth perimeter of the Summit Equipment Site revealed significantoff-site contamination in a borrow area used to replace sandwhich had eroded from the beach.
After speaking with the contractor who had performed the place-ment and grading work at the beach, the TAT was able to designatepreliminary areas to be sampled for potential PCB contaminationon the beach. Samples were initially collected in the area thatreceived the majority of the fill. These six initial samples,from the west 'end of the beach at the southwest corner of LakeNesmith, were collected from the surface to a depth of 4 inches,
10
11
1ii•aaa•
ai
If
a3^^*?\J
' A -""'"' — " ^^m~ "^ 1
'~ ^T1 ^ * (. f APARTMENTr- F^r^VMiION A P P - A rcs A \ A
^ S1 A \£ i Ov i Al
Juj / \ j . Ju ) i A A2 i L \a , A AH AU3
S\ ^i e. - -
*-
IVOR AVE'NUE f
\ 4 GARDE.N 1
I Xv j
FOOTPATH APARTMENT
-•
FIGURE 4
CASTLE APARTMENT FIELD SAMPLING MAP
SUMMIT EQUIPMENT AND SUPPLY
AKRON, OHIO f
\ ^ i i ^TB^^^ TY"^ i w / "* ' ^ "^ ^OSCALE (FEET) B^ . \juiAL)Li^Ki-KJ
11
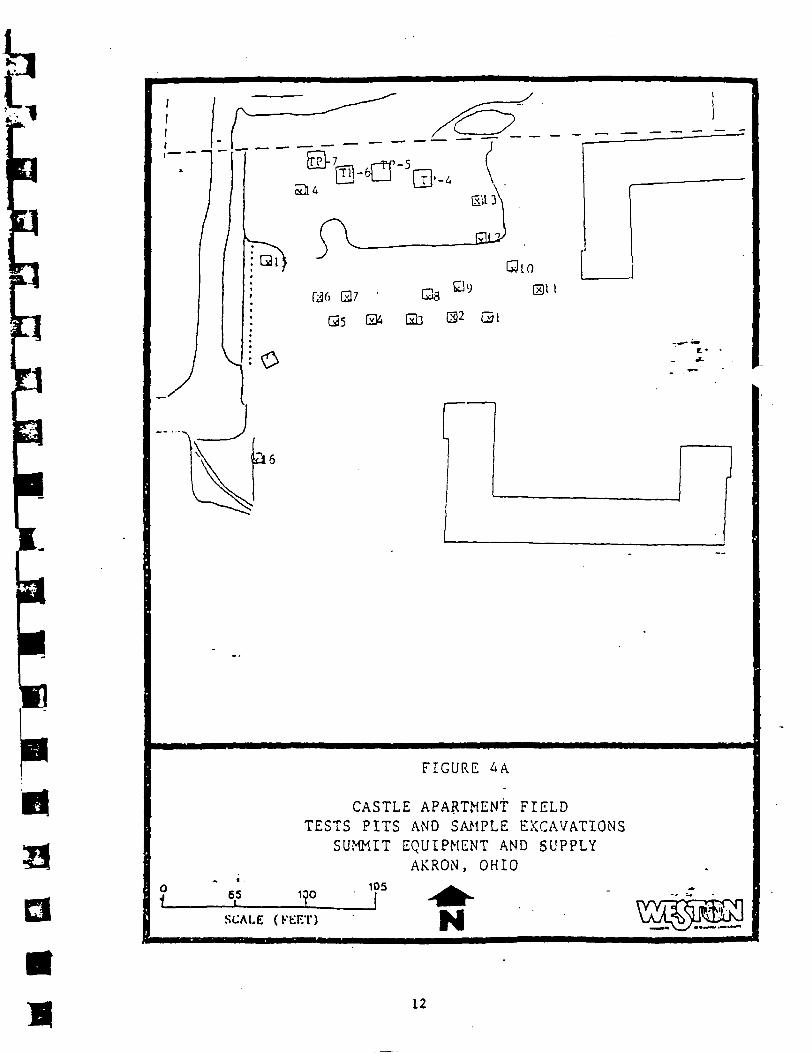
FIGURE 4A
0t_
CASTLE APARTMENT FIELDTESTS PITS AND SAMPLE EXCAVATIONS
SUMMIT EQUIPMENT AND SUPPLYAKRON, OHIO
65
SCALE (KKF.T)
12
a LI 11 a h1** \
~ \
REACH TCI COKTAMIMATIOM ZONES
A - 28 nmf l t t , 0 - 2 8 pp*
1 - 2 1 tiiplti. 0 - J pp»
C - 16
FIGURE 5 ', ].LAKE .NESMITH BEACH SAMPLE LOCATIONS
SUMMIT EQUIPMENT AND SUPPLY 'AKRON, OHIO
n
•a
aa
a
approximately 12 ft from the sand/grass contact. After receipt ofanalytical results, it was determined that sampling should beextended east of this initial area to a point approximately mid-way down the beach, believed to be the furthest eastern extent offill placement.
The next stage of sampling proceeded west from a point 30 ft eastof a roof drain emptying into the lake, immediately in front ofthe western wing of the apartment at 707 Carnegie Avenue. Thiswas believed to be the furthest point east on the beach wherefill material had been placed. The majority of the 25 sampleswere collected from the surface to 3 inches with 5 samples beingcollected from depths of 8 to 10 inches. The stations were 10 ftapart, with locations alternating from 2 ft in from the grass to1 ft in from the water's edge; the stations proceeded west on thebeach to the point of the initial sampling's eastern extent..--5wosamples were then collected at depths of 8 and 9 inches in taihe'area of the initial samples. - —
The third stage of beach samples consisted of 23 samples,collected May 18, 1987. The samples were collected from theprevious eastern-most sample point to the eastern end of thebeach, with samples collected every 33 ft, from the surface to 4inches in depth. The samples were collected from the center lineof the beach, as dictated by the water level, equidistant fromthe shoreline and lawn.
The fourth stage of sampling on the Lake Nesmith beach consistedof the collection of 22 samples on May 27, with 15. of thosesamples collected submitted for analysis. The samples were col-lected beginning at the far eastern portion of the beach andoverlapped the third stage of sampling. The samples were collec-ted alternating above and below the center line of the beach,between the third stage samples. Essentially, the samplingeffort gave the eastern portion of the beach a zig-zag samplepattern which included: the beach just above the water line, thecenter of the beach, and the upper beach just in front of thelawn. The samples were collected from the surface to a 3 inchdepth and were spaced linearly at 33 ft, between each of thethird stage samples.
The sampling of the beach, after the excavation of PCS contamina-ted sands, from the west edge to a point approximately 600 fteast consisted of eight samples. The samples were collected atthe surface to 3 inches, after 6 to 9 "inch layer of sand wasremoved. All of the samples were collected from the center ofthe beach and spaced at 80 ft, with one sample being a duplicate.
There were a, total of 86 samples collected along the 950 ftbeach, 78 of which were analyzed.
14
n
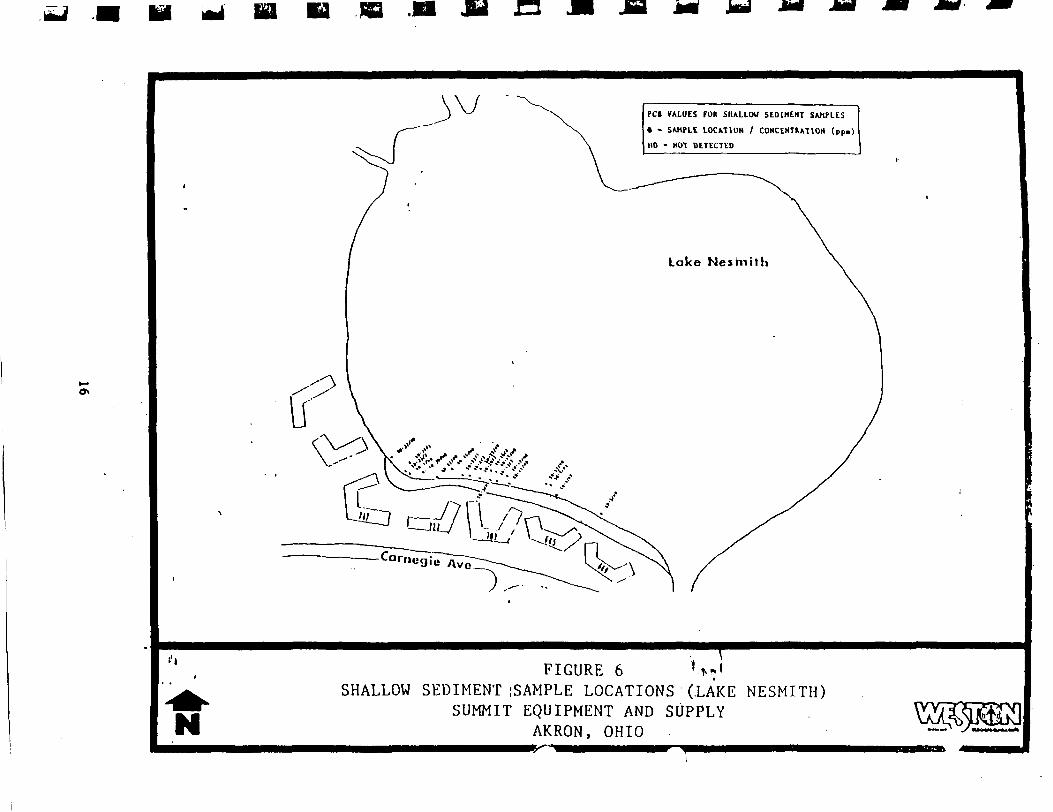
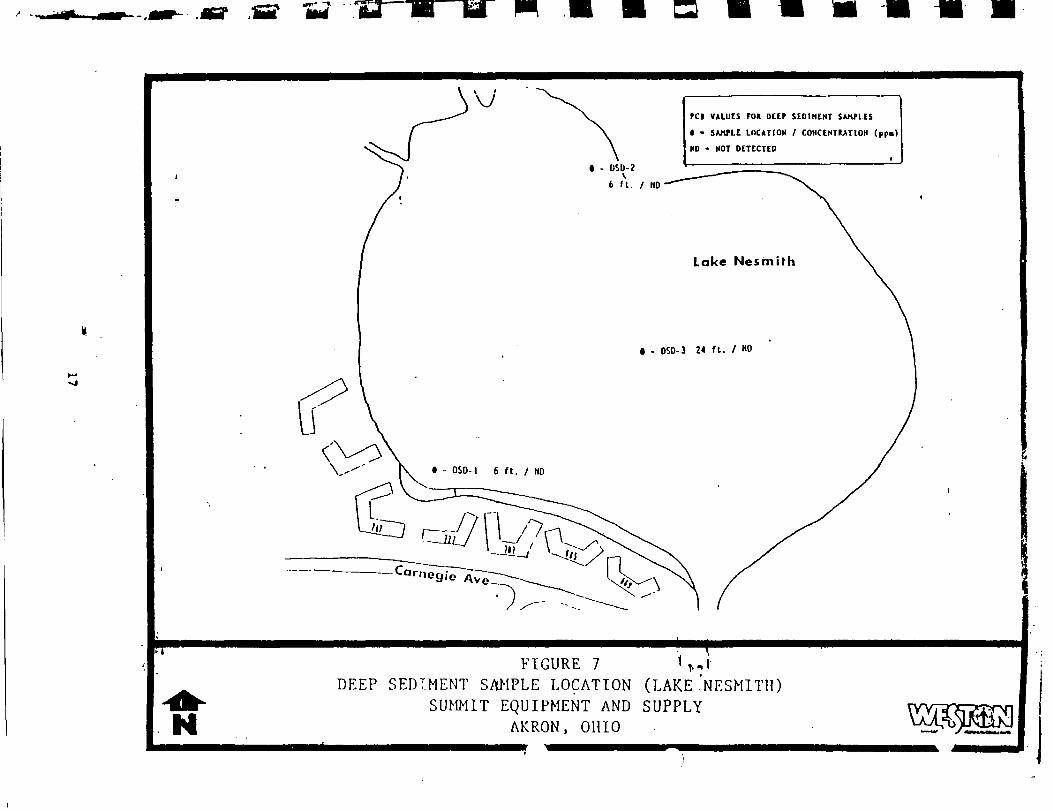
2.1.3 Lake Nesmith Sediments
Samples were collected of sediments in Lake Net,analysis. There were 37 samples collected immediasouth shore beach, 24 of which were analyzed. These s.collected in 2 to 3 ft of water, 8 to 20 ft from thvshown in Figure 6. An additional three samples werefrom deep water sediments: one directly off the western6 ft of water, 40 ft from shore; one at the center of the24 ft of water; and one across the lake at a similar dep>distance from the shore as the sample collected near the -.(Figure 7).
2.1.4 Lake Nesmith Surface Water
A total of six water samples from Lake Nesmith were collected"and.analyzed for PCBs in this investigation. As the contaminatedbeach appeared to be the sole source of PCS contamination, watersamples were collected immediately off-shore in the wading zonealong the beach (Figure 8). Five samples were collected by wad-ing into the lake from the shore, while the sixth sample wascollected from a boat in the shallows, to minimize turbidity.
2.1.5 Air Samples
During the excavation of soils from the off-site area near CastleApartments and placement of this material on site, Gillian pumpswere used near the excavation area and along the site perimeterto monitor levels of particulate and volatile PCBs "in the air.Five pumps were mounted at a height of 6 ft and situated aroundthe site to monitor for PCBs, which may have been released duringthe removal action. As indicated in Figure 9, four of thestations were placed between the site and nearby residents whilea fifth station was placed at the northeast portion of the siteto act as ~a .downwind sample. The Gillian pumps were not used atthe northern perimeter along the railroad or along the easternportion of the fence immediately north of the apartments due tothe likelihood of vandalism in these areas.
2.2 On-Site Samples
2.2.1 Soil
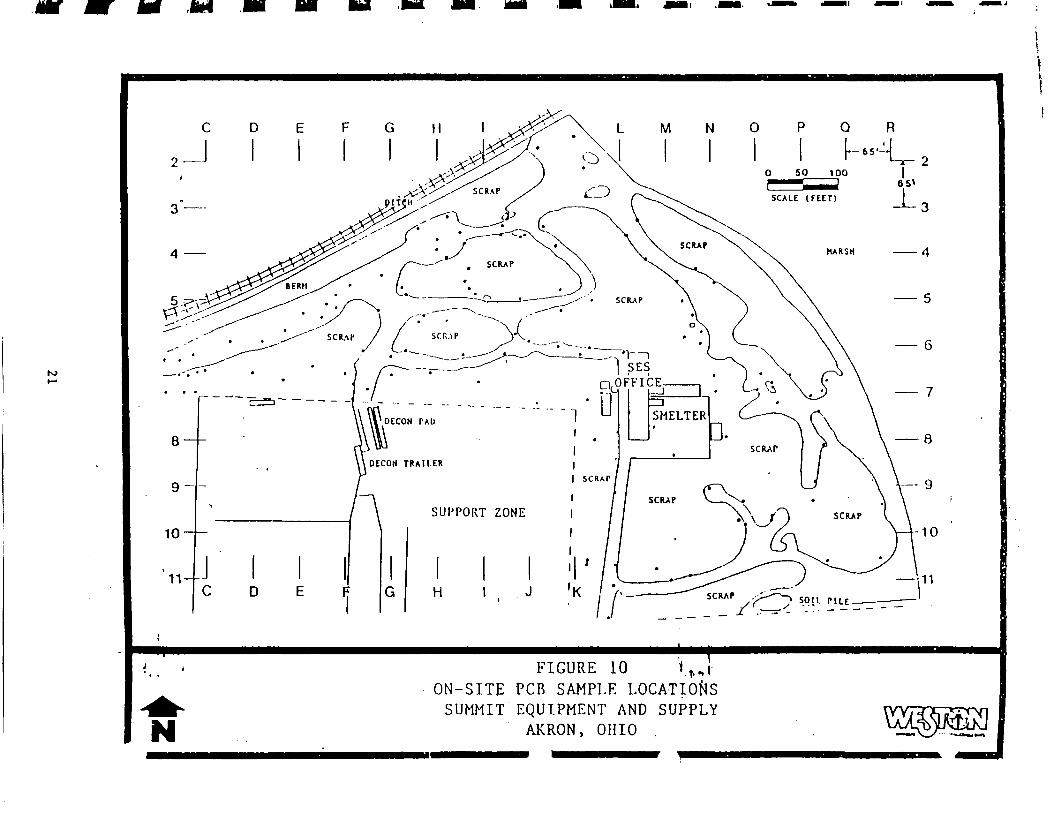
2.2.1.1 Surface - PCBs
The SES site consisted of approximately 6 acres of scrap steel,electrical equipment and miscellaneous debris overlying glacialsand and gravel deposits. Soil development on the site was prac-tically nonexistent, as fine sand was the predominant materialfound at the surface of the site. The clutter of- materials . onsite made it impossible to formulate a workable random sampl-ing
\
m m ra
PC» VALUES FOR SHALLOW SEDIMENT SAMPLES
• - SAMTLE LOCATION / CONCEMTHAT10H (pp.)
«0 - MOT DETECTED
FIGURE 6 Vi.:»SHALLOW SEDIMENT (SAMPLE LOCATIONS (LAKE NESMITH)
SUMMIT EQUIPMENT AND SUPPLYAKRON, OHIO .
• • n •
rCI VALUES FOR DEEP SEDIMENT SAMPLES
» ' SAMPLE LOCATION / CONCENTRATION (pp.)
ND - HOT DETECTED
N
FIGURE 7 V,.DEEP SEDIMENT SAMPLE LOCATION (LAKE ,'NESMITH)
SUMMIT EQUIPMENT AND SUPPLYAKRON, OHIO

H U A H M
PCI VALUES F0« LA" MATE* SAMPLES
• - SAMPLE LOCATION / CONCENTRATION <ppb]
HD - HOT DETECTED
FIGURE 8 . .'LAKE NESMITH SURFACE WATERSUMMIT EQUIPMENT AND SUPPLY
, OHIO
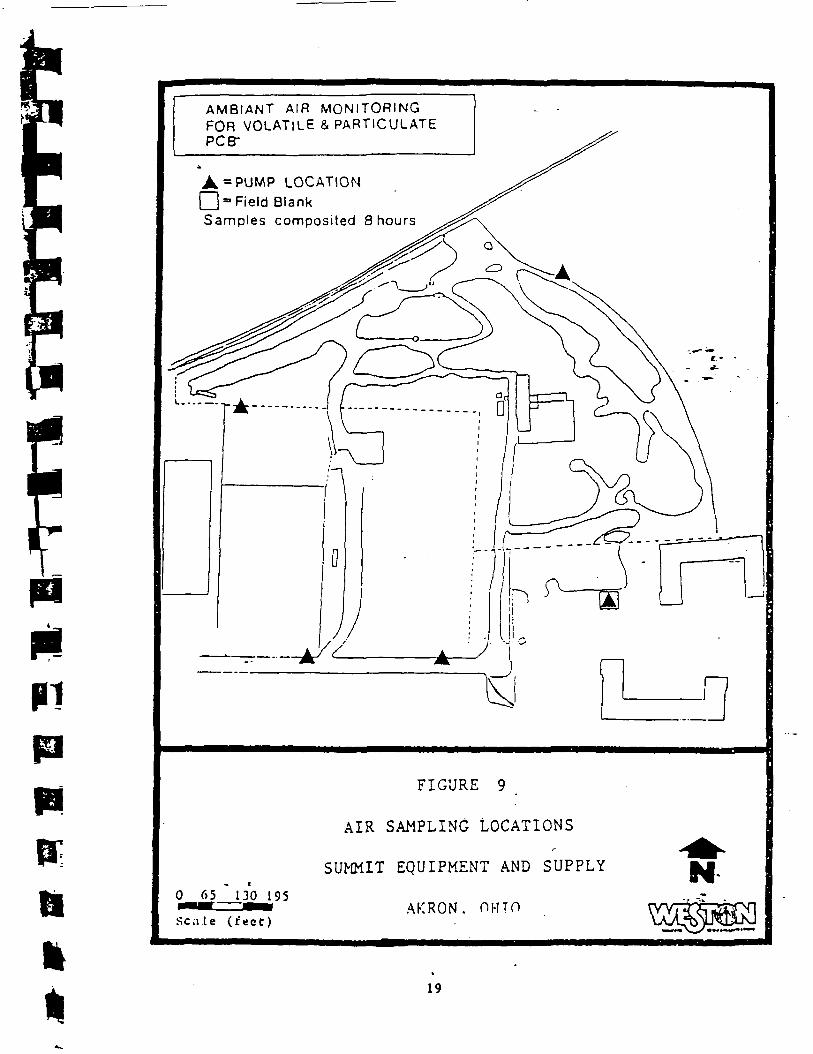
AMBIANT AIR MONITORINGFOR VOLATILE & PARTICIPATEPCB-
=PUMP LOCATION= Field Blank
Samples composited 8 hours
0 65 1.30195
Scale ( f e e t )
AIR SAMPLING LOCATIONS
SUMMIT EQUIPMENT AND SUPPLY
AKRON. OHIO
N
*
*
19

I3Ia
pattern; therefore sampling of the "soils" necessitated estab-lishing a sample collection plan in the field, after preliminaryconcepts were derived in the office. The sample plans werefinalized after consulting with the OSC to establish the numberof samples to be collected from any one location.
Locations to be sampled on site were determined by accessibilityto bare soil and the type of scrap and debris which had beenremoved from the area. Samples were collected where transformers
*| or large electrical devices with capacitors were observed, in^] areas of observed soil staining, or where there was additional
evidence of tampered transformers. Samples were also collectedin both channeled and ponded run-off water areas.
*^ Each sample was recorded on a map with an alpha-numeric gridsystem capable of recording the sample within a 6.5 ft sqtTalre .
f»i (Figure 10) . The collection of over 130 samples in this manntfer*•! was limited mostly to open roadways and foot paths through" the
debris.
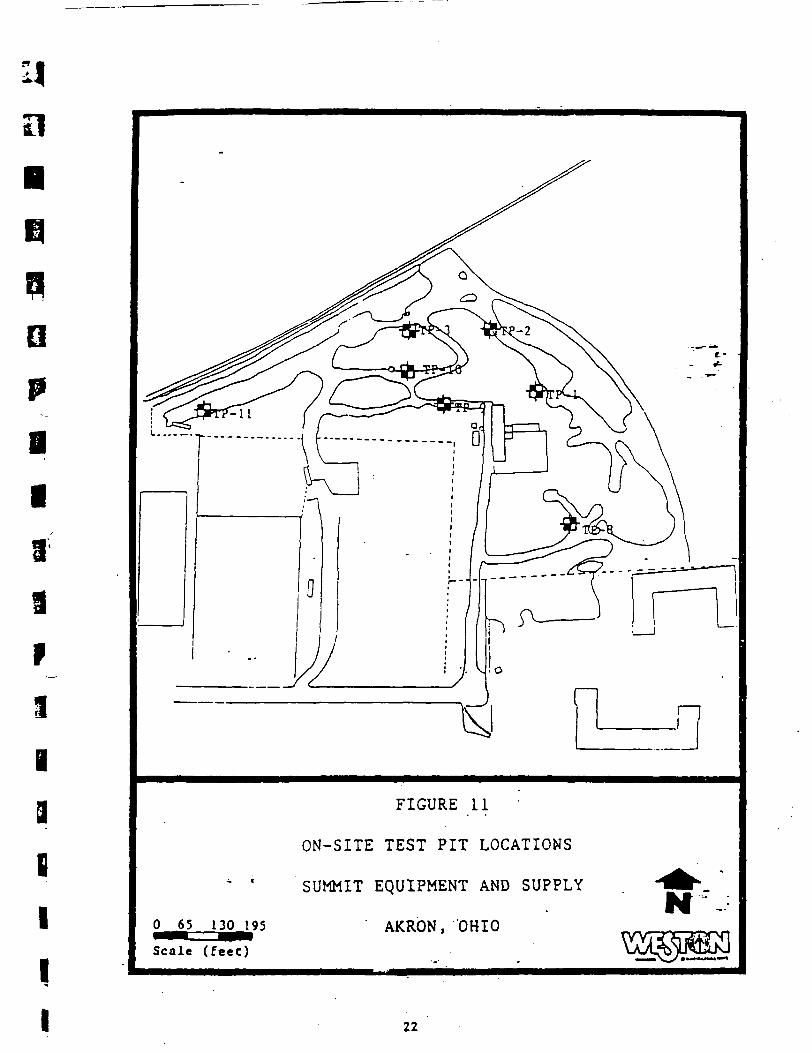
£| 2.2.1.2 Subsurface - PCBs
Seven test pits on site were sampled for PCBs, with each test pit•I having a minimum of three samples collected. The test pits were^ located in areas which showed heavy surface soil contamination or
exhibited other evidence of transformer salvaging (Figure 11) .Three test pits were sampled to a depth of 4 ft, while the otherswere sampled to a depth of 3 ft. The depths were determined bothby the type of equipment used to excavate the test pit as well as.depth to which a test pit would stay open in the loose sand.Each test pit was also located alpha-numerically on the base mapused for on-site sample locations.
ad
1Borings were placed along the eastern perimeter of the sire tofacilitate the- installation of ground water monitor wells. Thewells were placed along this perimeter, as the ground water flowfrom beneath the site was believed to flow in an easterly direc-tion and the road along the perimeter allowed the best access fordown-gradient monitoring. Ten soil samples from the soil boringswere analyzed for PCBs. Each of the three borings had samplesanalyzed from near the surface, 1 to 3 ft, and at the water table(6 to 10 ft) . A sample was also collected from the first portionof the soil column which exhibited fine material (silts orclays). It was thought that if the PCBs oils had infiltrated theground near any of the borings they would have concentrated inany or all of these locations.
2.2.1.3 Surface - Priority Pollutant Metals•• * - -»
The SES site also operated a small battery recycling area andcopper and lead reclaiming smelter. Due to mishandling of-these
20
J
D M N O Q R
0 50 100
SCALE (FEET)
HARSH
J..
6
11
FIGURE 10 !,.„!ON-SITE PCB SAMPLE LOCATIONSSUMMIT EQUIPMENT AND SUPPLY
AKRON, OHIO
a
IIaiF
1
aB
I
I
I
0 65 130 195
Scale (f«ec)
FIGURE 11
ON-SITE TEST PIT LOCATIONS
SUMMIT EQUIPMENT AND SUPPLY
AKRON, 'OHION
22
I
a
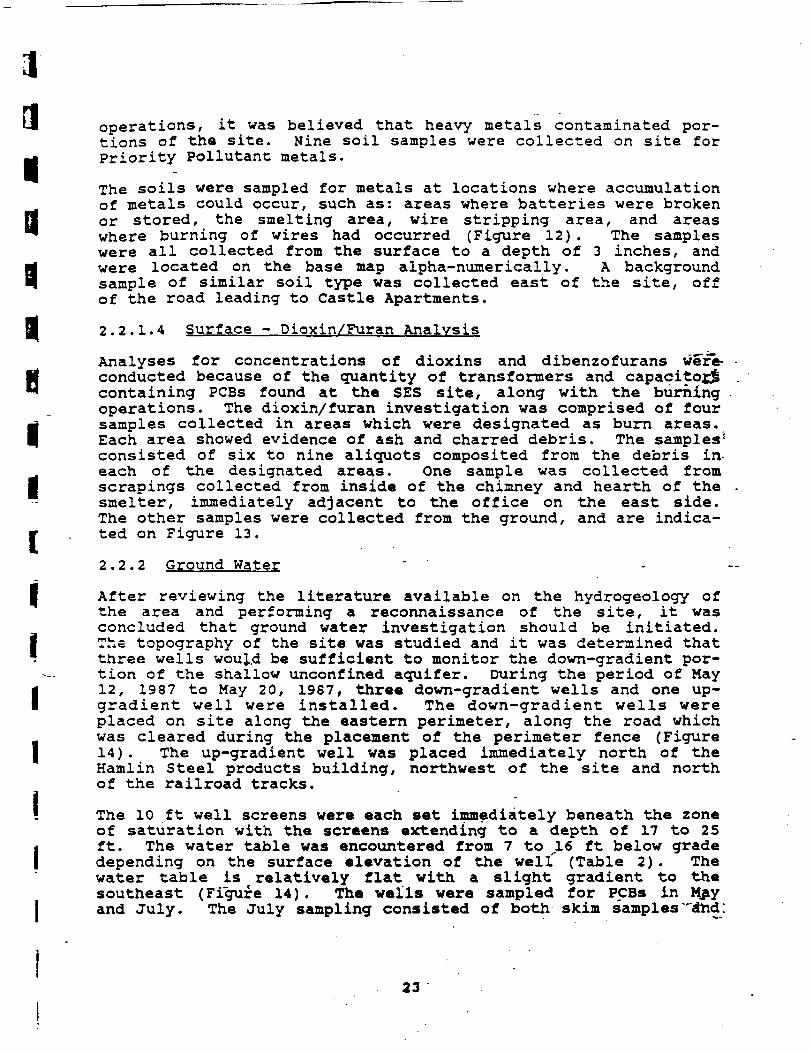
operations, it was believed that heavy metals contaminated por-tions of the site. Nine soil samples were collected on site forPriority Pollutant metals.
The soils were sampled for metals at locations where accumulationof metals could occur, such as: areas where batteries were brokenor stored, the smelting area, wire stripping area, and areaswhere burning of wires had occurred (Figure 12) . The sampleswere all collected from the surface to a depth of 3 inches, andwere located on the base map alpha-numerically. A backgroundsample of similar soil type was collected east of the site, offof the road leading to Castle Apartments.
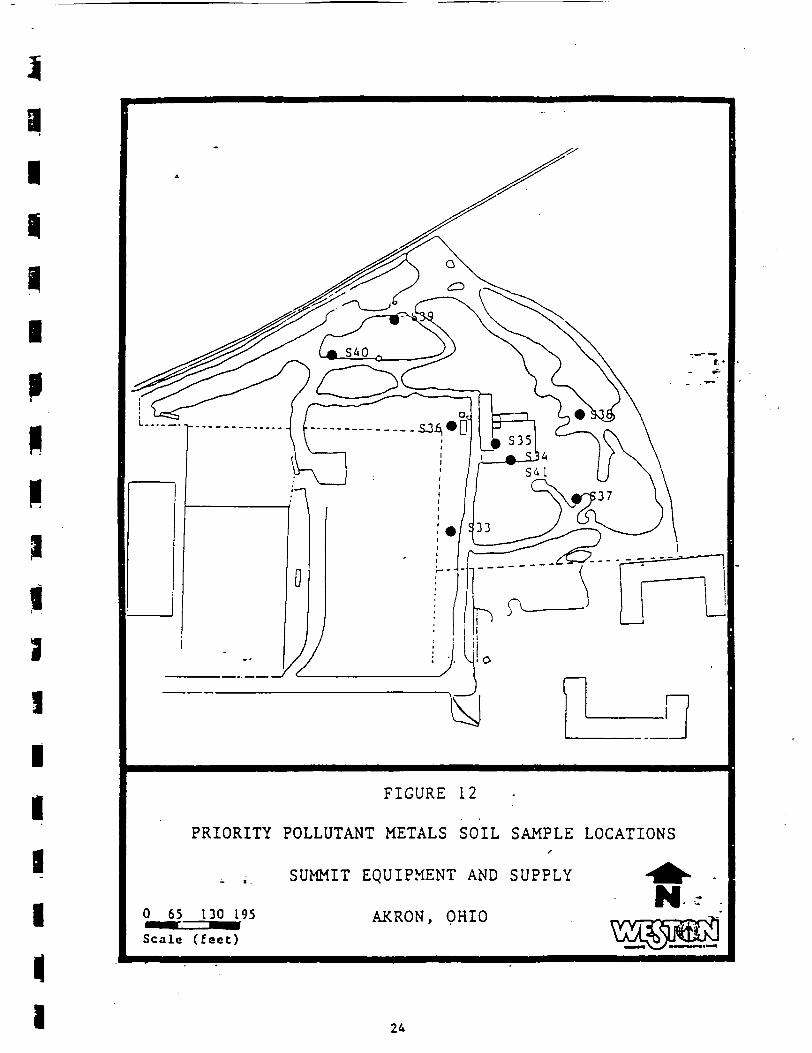
2.2.1.4 Surface - Dioxin/Furan Analysis
Analyses for concentrations of dioxins and dibenzofurans were-conducted because of the quantity of transformers and capacitor^containing PCBs found at the SES site, along with the burningoperations. The dioxin/furan investigation was comprised of foursamples collected in areas which were designated as burn areas.Each area showed evidence of ash and charred debris. The samples''consisted of six to nine aliquots composited from the debris in-each of the designated areas. One sample was collected fromscrapings collected from inside of the chimney and hearth of thesmelter, immediately adjacent to the office on the east side.The other samples were collected from the ground, and are indica-
r , ted on Figure 13.
2.2.2 Ground Water ' -
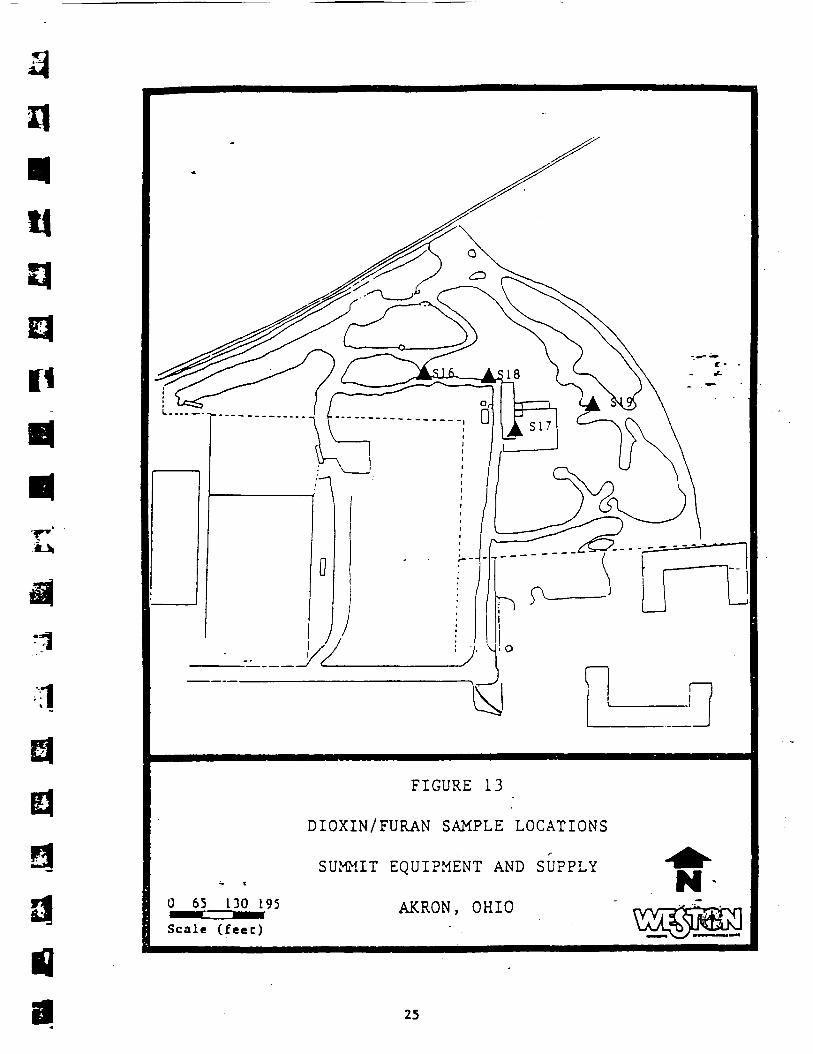
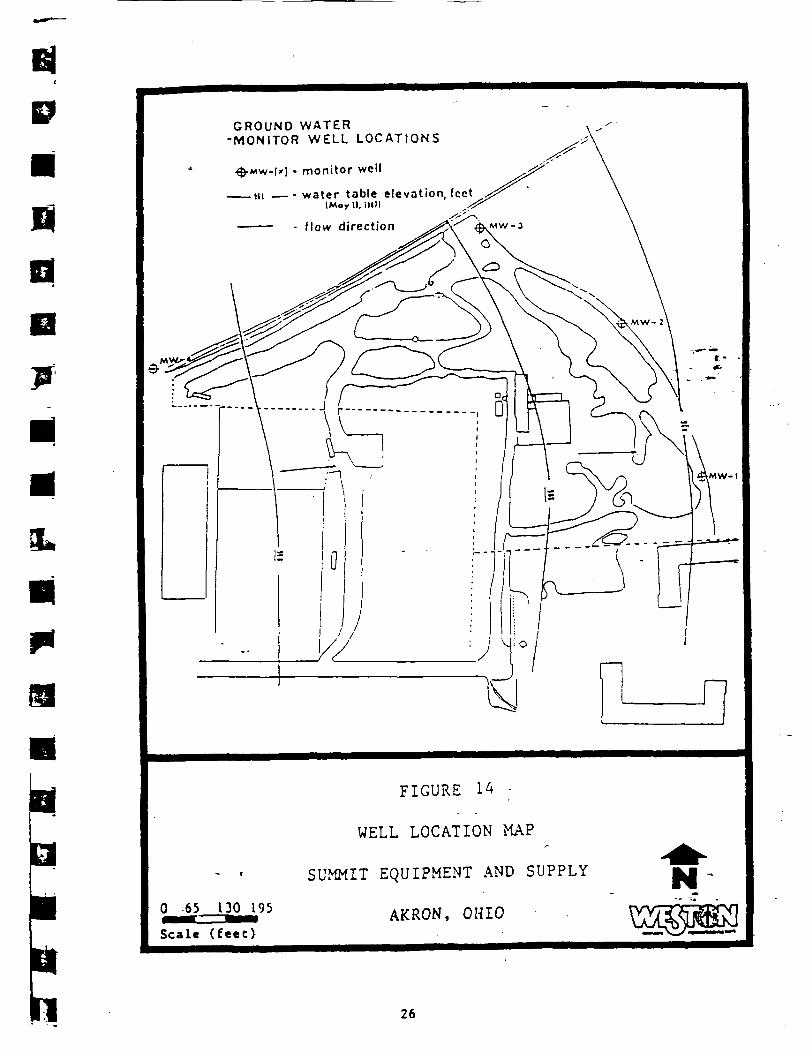
| After reviewing the literature available on the hydrogeology ofthe area and performing a reconnaissance of the site, it wasconcluded that ground water investigation should be initiated.
I The topography of the site was studied and it was determined that* three wells would be sufficient to monitor the down-gradient por--- tion of the shallow unconfined aquifer. During the period of May
1 12, 1987 to May 20, 1987, three down-gradient wells and one up-gradient well were installed. The down-gradient wells wereplaced on site along the eastern perimeter, along the road whichwas cleared during the placement of the perimeter fence (Figure
I 14) . The up-gradient well was placed immediately north of theHamlin Steel products building, northwest of the site and northof the railroad tracks.
iHfi
i The 10 ft well screens were each set immediately beneath the zoneof saturation with the screens extending to a depth of 17 to 25
I ft. The water table was encountered from 7 to 1.6 ft below gradedepending on the surface elevation of the well" (Table 2) . Thewater table is t relatively flat with a slight gradient to thesoutheast (Figure 14) . The wells were sampled for PCBs in May
I and July. The July sampling consisted of both skim samples"
23
11IIRI
III
1
I
1
ai1i
FIGURE 12
PRIORITY POLLUTANT METALS SOIL SAMPLE LOCATIONS
0 65 130 195
Scale ( face)
SUMMIT EQUIPMENT AND SUPPLY
AKRON, OHIO
24
n
t]
n
ti
0 65 130 195
Scale (fee:)
FIGURE 13
DIOXIN/FURAN SAMPLE LOCATIONS
SUMMIT EQUIPMENT AND SUPPLY
AKRON, OHIO
25
GROUND WATER-MONITOR WELL LOCATIONS
•$.Mw-f»] - monitor well
Hi — - w a t e r table elevation, feet(May II, 111)1
- f low direction
FIGURE 14
WELL LOCATION MAP
SUMMIT EQUIPMENT AND SUPPLY
26
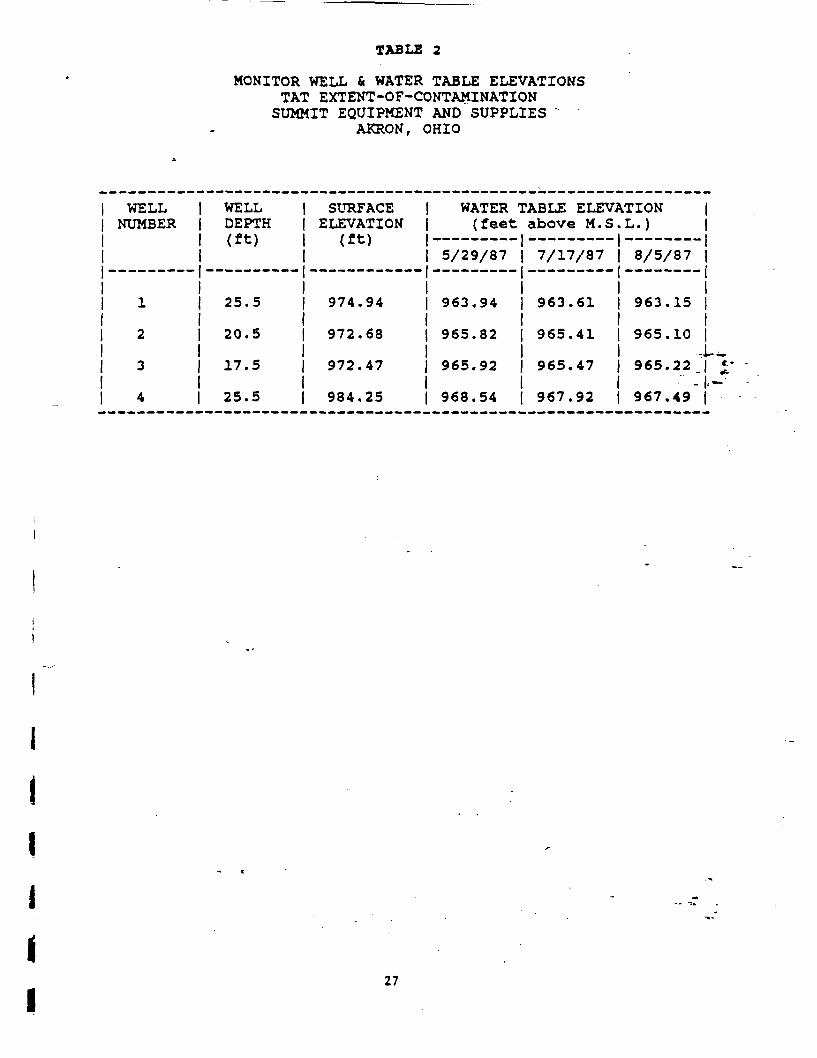
TABLE 2
MONITOR WELL & WATER TABLE ELEVATIONSTAT EXTENT-OF-CONTAMINATIONSUMMIT EQUIPMENT AND SUPPLIES ~
AKRON, OHIO
WELLNUMBER
1
2
3
4
WELLDEPTH/ -f •h \(It)
--— — ———
25.5
20.5
17.5
25.5
SURFACEELEVATION
1 f+ \( Z & )
974.94
972.68
972.47
984.25
WATER :(feet
5/29/87
963.94
965.82
965.92
968.54
CABLE ELEVJabove M.S_ _ _ _ _ _ _ _ _
7/17/87
963.61
965.41
965.47
967.92
VTION.L.)
8/5/87
963.15
965.10
965.22 .
967.49
i 27
1
I
purged samples. The wells were also sampled and analyzed forPriority Pollutant metals in the July/August sampling. A fifthwell, used for the SES office, was also sampled for both PCBs andPriority Pollutant metals in August. The well was historicallyused as the sole source of water for the SES building, and islocated 20 ft south of the building.
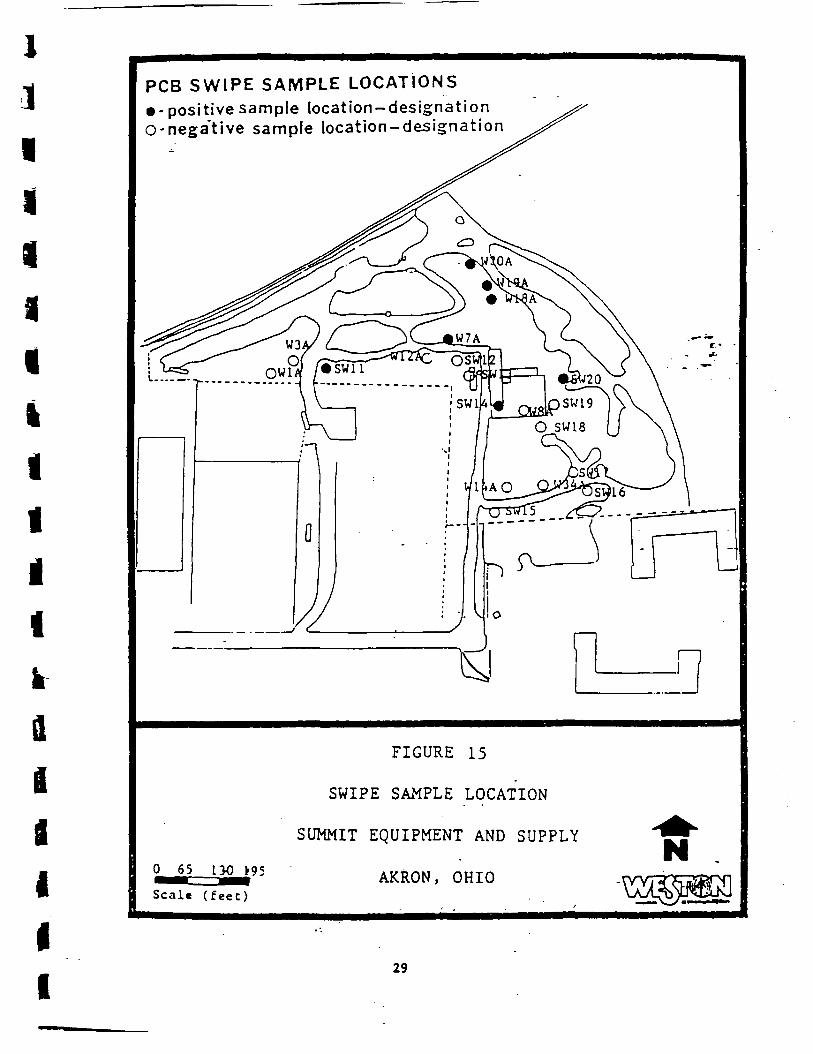
2.2.3 Swipe Samples - PCBs
Twenty swipe samples of residue and oils on metal scrap werecollected and analyzed for PCBs, Surfaces sampled were selectedon the basis of economic value of the metal or proximity to areasof highly contaminated soils (Figure 15) . After speaking withthe site operator, the TAT was able to designate areas containingmaterial of economic value which could be removed from the site.Swipe samples were also collected from equipment which had been;,abandoned on site when the Removal Action began. These samples*1
were collected within 3 ft of the ground, immediately adjacent toroadways and paths, on surfaces that were in direct contact with
• the soil.
Swipe samples were collected from the inside of transformers.- which did not contain oils at the time of staging. A total of 16I transformers were sampled with the type, approximate size and
pertinent information being recorded. The main objective was toestablish the level of contamination on "dry" transformers.
^ 2.2.4 Oil/Emulsion Samples - PCS
* During the staging of transformers at the SES site, 57 trans-^ former liquid samples were collected and analyzed for PCBs. The
purpose of this sampling was to identify the quantity and concen-trations of PCB-contaminated liquids on site requiring disposal.
• The transformers containing liquid were sampled prior to stagingso that liquid" of similar PCS concentrations could be combinedinto 55-gallon drums for disposal.
4
IIfl
2.3 Documentation of Sample Location
As each sample in the investigation was collected by the TAT, a"Field Data Sheet" was completed (Attachment A) . The form inaddition to providing an accurate record of the sample locationon a pre-made map, allowed for pertinent information concerningthe sampling event to be retained. ;
In addition to this form, a master map was updated to documentthe sample locations alpha-numerically. All jsample points weremarked in the field through the use of surveyor's ribbon, stakes,spray paint-or any combination of these methods. In most casesthe sample number was marked at the location of collection by oneof these means and left in place as a reference point during-tbe
28
iiiiiiiiil
PCB SWIPE SAMPLE LOCATIONS• -positive sample location-designationO-nega"tive sample location-designation
i
III
L0 65 130 >
Scale ( f e e c )
FIGURE 15
SWIPE SAMPLE LOCATION
SUMMIT EQUIPMENT AND SUPPLY
AKRON, OHIO
29
investigation. Areas sampled off-site were also documentedthrough photos taken to illustrate location and depth.
3 . 0 SAMPLING METHODS
A Standard Operating Procedure (SOP) (Attachment B) for samplecollection at the SES site was established to aid in sample docu-mentation, quality control, and expeditious work.
3.1 Soil Sampling
The soil at the SES site was generally sandy loam or uniform sandwith very little clay or organic material present. This homogen-eity in the soil horizon allowed consistent soil sample collec-tion methods throughout the investigation.
e. - •3.1.1 Surface Soils - j*-
All surface soils (surface to 5 inch depth) were collected util-izing sterile wooden tongue depressors and clean, unused dispos-able sampling gloves. The tongue depressors and sample gloveswere disposed of after each sample to ensure that samples wouldnot become cross contaminated.
Because representative in situ soils were desired for the inves-tigation, samples were collected, for the most part, in undis-turbed areas. When this was not possible, the initial 1 inch ofloose material was removed with a tongue depressor, and a cleantongue depressor was then used' for sample collection. .
3.1.2 Test Pit Soils
Test pits were implemented both on-site and off-site as a meansof investigating the possibility of PCB contamination at depthsto 5 ft. The- test pits were excavated by means of heavy equip-ment and included the use of a large track mounted backhoe, asmall backhoe, and a large front-end loader. The equipment usedwas based solely on availability to the task and no preferencewas established as to method of excavation of test pits.
Once a test pit had been excavated, a sample could be obtained ata specific depth by yardstick measurements. Two tongue depres-sors were utilized, as previously stated. Test pits on site wereclosed immediately after sampling while off-site test pits wereleft open until results from the samples were obtained. Thiseliminated the need for double excavations.
3.1.3 Deep Boring Soils- i . „
Soils were collected for the continuous length of the boringduring drilling of the on-site and off-site monitoring -veils.
30
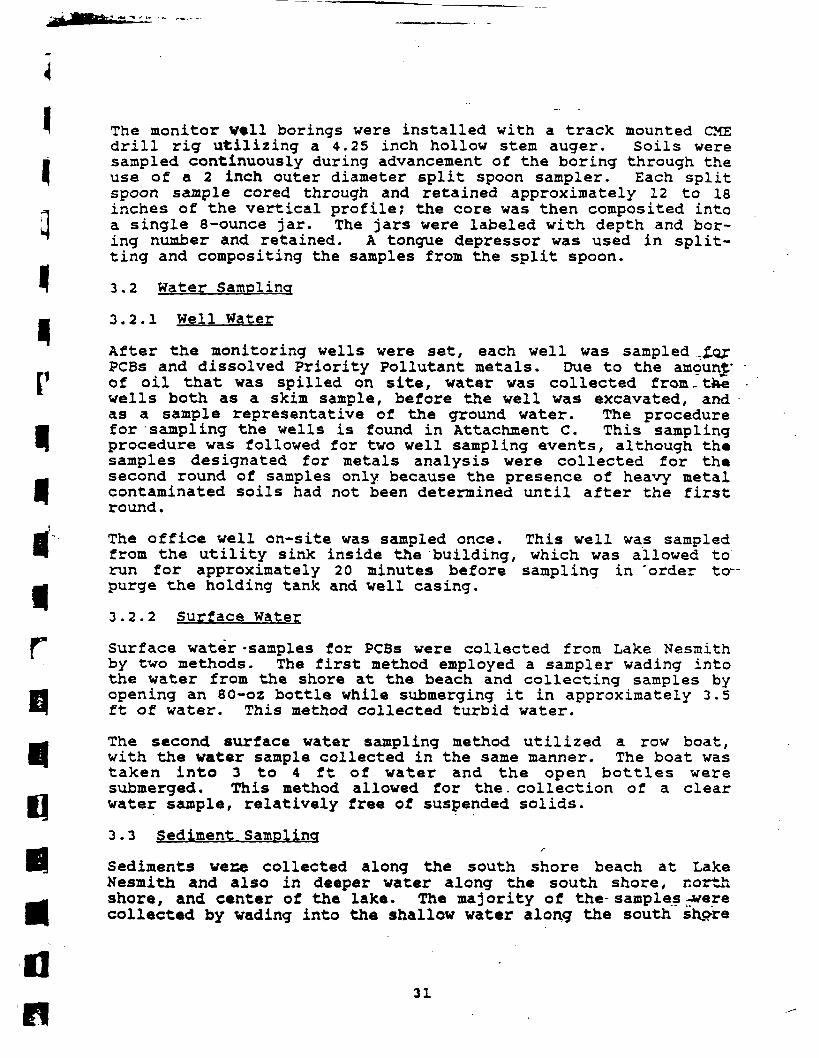
II
The monitor well borings were installed with a track mounted CMEdrill rig utilizing a 4.25 inch hollow stem auger. Soils weresampled continuously during advancement of the boring through theuse of a 2 inch outer diameter split spoon sampler. Each splitspoon sample cored through and retained approximately 12 to 18inches of the vertical profile; the core was then composited intoa single 8-ounce jar. The jars were labeled with depth and bor-ing number and retained. A tongue depressor was used in split-ting and compositing the samples from the split spoon.
3.2 Water Sampling
3.2.1 Well Water
After the monitoring wells were set, each well was sampled .JtorPCBs and dissolved Priority Pollutant metals. Due to the amounj*of oil that was spilled on site, water was collected from-thewells both as a skim sample, before the well was excavated, andas a sample representative of the ground water. The procedurefor -sampling the wells is found in Attachment C. This samplingprocedure was followed for two well sampling events, although thesamples designated for metals analysis were collected for thesecond round of samples only because the presence of heavy metalcontaminated soils had not been determined until after the firstround.
The office well on-site was sampled once. This well was sampledfrom the utility sink inside the building, which was allowed torun for approximately 20 minutes before sampling in 'order to~purge the holding tank and well casing.
3.2.2 Surface water
Surface water -samples for PCBs were collected from Lake Nesmithby two methods. The first method employed a sampler wading intothe water from the shore at the beach and collecting samples by
•4 opening an 80-oz bottle while submerging it in approximately 3.5•I ft of water. This method collected turbid water.
•
The second surface water sampling method utilized a row boat,with the water sample collected in the same manner. The boat wastaken into 3 to 4 ft of water and the open bottles weresubmerged. This method allowed for the. collection of a clear
tfl water sample, relatively free of suspended solids.
3.3 Sediment Sampling
H| Sediments wece collected along the south shore beach at LakeNesmith and also in deeper water along the south shore, northshore, and center of the lake. The majority of the- samples ..werecollected by vading into the shallow water along the south shore
31
IIp_IIair
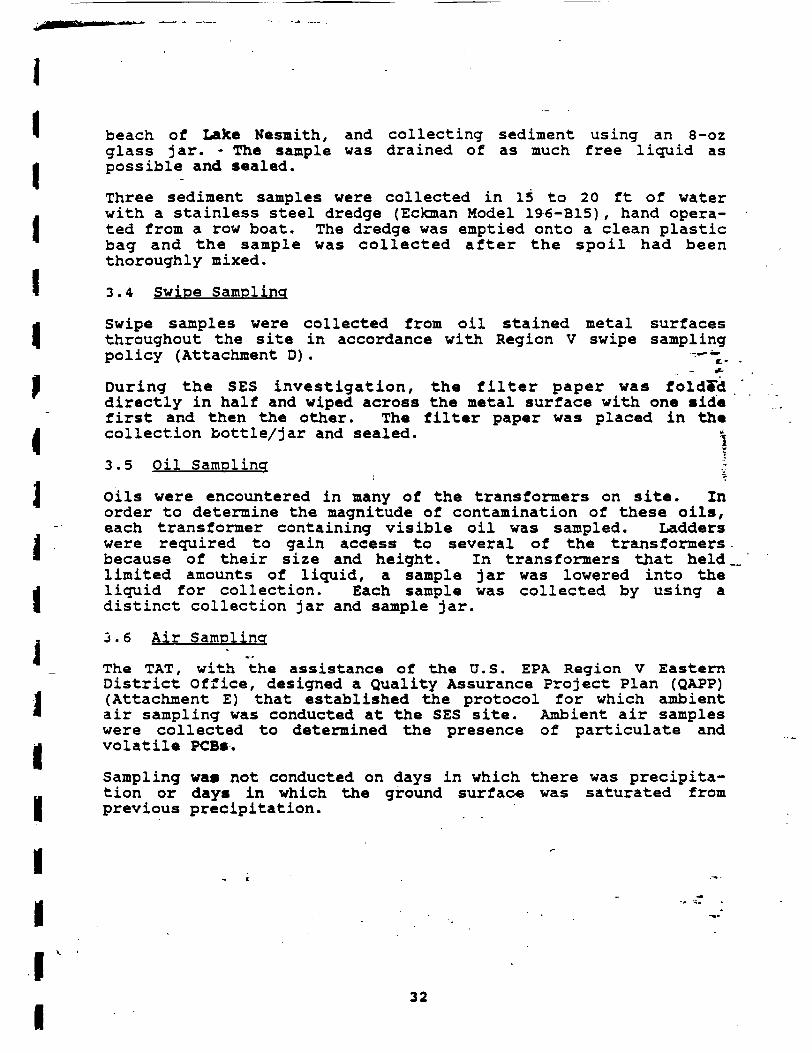
1* beach of Lake Nesmith, and collecting sediment using an 8-02
glass jar. - The sample was drained of as much free liquid asi possible and sealed.
Three sediment samples were collected in 15 to 20 ft of waterI with a stainless steel dredge (Eckman Model 19 6-B15) , hand opera-I ted from a row boat. The dredge was emptied onto a clean plastic
bag and the sample was collected after the spoil had beenthoroughly mixed.
1 3.4 Swipe Sampling
1 Swipe samples were collected from oil stained metal surfacesthroughout the site in accordance with Region V swipe samplingpolicy (Attachment D) . ~"~i"L.
I During the SES investigation, the filter paper was foldFddirectly in half and wiped across the metal surface with one sidefirst and then the other. The filter paper was placed in the
I collection bottle/jar and sealed. t
3.5 Oil Sampling .;
I Oils were encountered in many of the transformers on site. Inorder to determine the magnitude of contamination of these oils,each transformer containing visible oil was sampled. Ladders
| were required to gain access to several of the transformers• because of their size and height. In transformers that held,
limited amounts of liquid, a sample jar was lowered into thef liquid for collection. Each sample was collected by using aI distinct collection jar and sample jar.
j
I
„I
I
I
3.6 Air Sampling
The TAT, with the assistance of the U.S. EPA Region V EasternDistrict Office, designed a Quality Assurance Project Plan (QAPP)(Attachment E) that established the protocol for which ambientair sampling was conducted at the SES site. Ambient air sampleswere collected to determined the presence of particulate andvolatile PCBs.
Sampling wa» not conducted on days in which there was precipita-tion or days in which the ground surface was saturated fromprevious precipitation.
32
IT
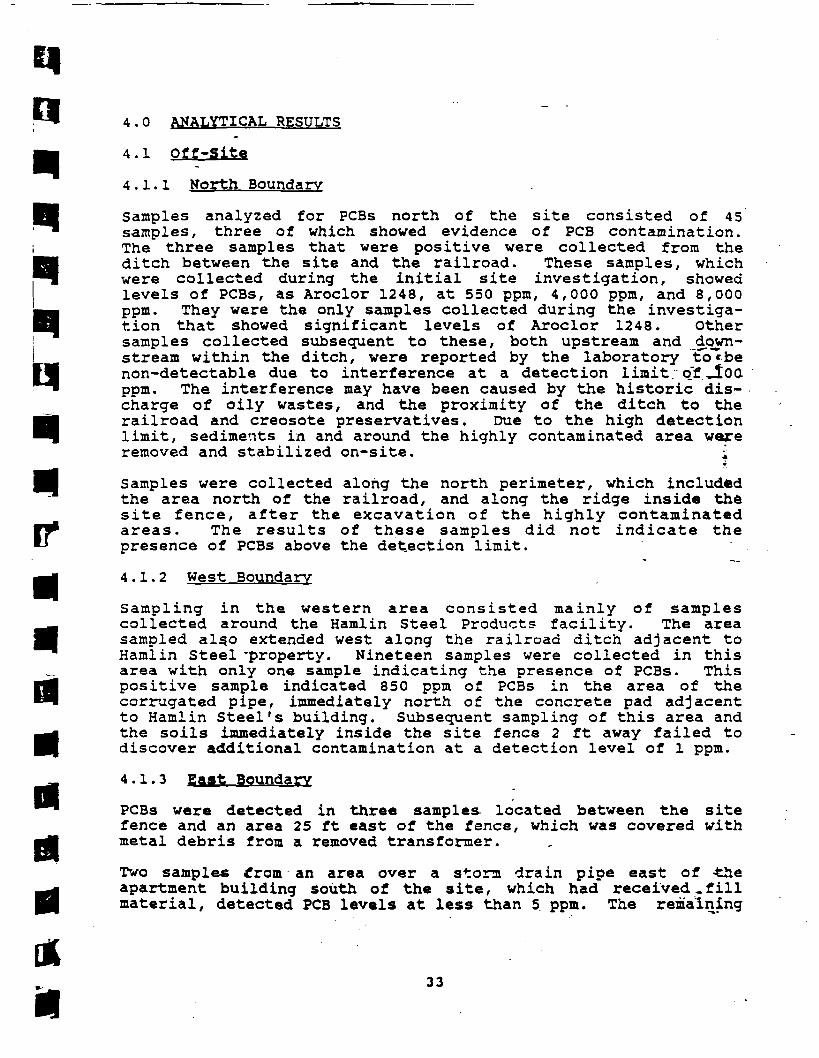
4.0 ANALYTICAL RESULTS
4.1 Off-Site
4.1.1 North Boundary
Samples analyzed for PCBs north of the site consisted of 45samples, three of which showed evidence of PCS contamination.The three samples that were positive were collected from theditch between the site and the railroad. These samples, whichwere collected during the initial site investigation, showedlevels of PCBs, as Aroclor 1248, at 550 ppm, 4,000 ppm, and 8,000ppm. They were the only samples collected during the investiga-tion that showed significant levels of Aroclor 1248. Othersamples collected subsequent to these, both upstream and down-stream within the ditch, were reported by the laboratory to"'benon-detectable due to interference at a detection limit, of-Ioappm. The interference may have been caused by the historic dis-charge of oily wastes, and the proximity of the ditch to therailroad and creosote preservatives. Due to the high detectionlimit, sediments in and around the highly contaminated area wexeremoved and stabilized on-site. 4
Samples were collected along the north perimeter, which includedthe area north of the railroad, and along the ridge inside thesite fence, after the excavation of the highly contaminatedareas. The results of these samples did not indicate thepresence of PCBs above the detection limit.
4.1.2 West Boundary
Sampling in the western area consisted mainly of samplescollected around the Hamlin Steel Products facility. The areasampled als.o extended west along the railroad ditch adjacent toHamlin Steel 'property. Nineteen samples were collected in thisarea with only one sample indicating the presence of PCBs. Thispositive sample indicated 850 ppm of PCBs in the area of thecorrugated pipe, immediately north of the concrete pad adjacentto Hamlin Steel's building. Subsequent sampling of this area andthe soils immediately inside the site fence 2 ft away failed todiscover additional contamination at a detection level of 1 ppm.
4.1.3 East Boundary
PCBs were detected in three samples located between the sitefence and an area 25 ft east of the fence, which was covered withmetal debris from a removed transformer.
Two samples from an area over a storm drain pipe east of -theapartment building south of the site, which had received .fillmaterial, detected PCB levels at less than 5. ppm. The remaining
33
0 { River Center, 111 North CanafStreet, 8th Floor, Suite 855,J\X Chicago, IL 60606 • (312) 993-1067
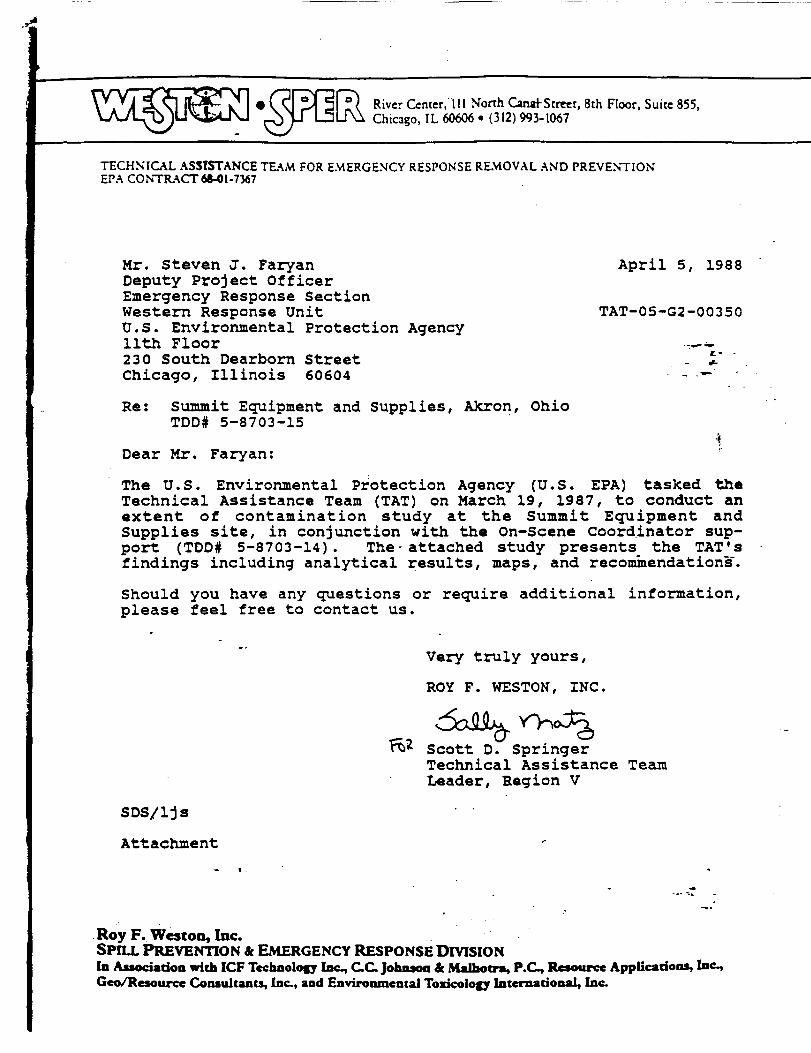
TECHNICAL ASSISTANCE TEAM FOR EMERGENCY RESPONSE REMOVAL AND PREVENTIONEPA CONTRACT 68-01-7367
Mr. Steven J. Faryan April 5, 1988Deputy Project OfficerEmergency Response SectionWestern Response Unit TAT-05-G2-00350U.S. Environmental Protection Agencyllth Floor ,--230 South Dearborn Street . £"Chicago, Illinois 60604 - - •— '
Re: Summit Equipment and Supplies, Akron, OhioTDDI 5-8703-15
•ifDear Mr. Faryan:
The U.S. Environmental Protection Agency (U.S. EPA) tasked theTechnical Assistance Team (TAT) on March 19, 1987, to conduct anextent of contamination study at the Summit Equipment andSupplies site, in conjunction with the On-Scene Coordinator sup-port (TDD# 5-8703-14). The - attached study presents^ the TAT'sfindings including analytical results, maps, and recommendations'.
Should you have any questions or require additional information,please feel free to contact us.
• ,
Very truly yours,
ROY F. WESTON, INC.
Scott D. SpringerTechnical Assistance TeamLeader, Region V
SDS/ljs
Attachment
Roy F. Weston, Inc.SPILL PREVENTION & EMERGENCY RESPONSE DIVISIONIn Association with ICF Technology Inc^ C.C. Johnson & Malbotra, P.C, Resource Applications, Inc,Geo/Resource Consultants, Inc., and Environmental Toxicology International, Inc.
iII
I
fli
areas (banks of Kohler ditch, the trace of the ditch along therailroad track east of the site, foot paths, and an old drainageswale in the peat bog) , when sampled tested negative at thedetection limit of l ppm.
4.1.4 Support Area
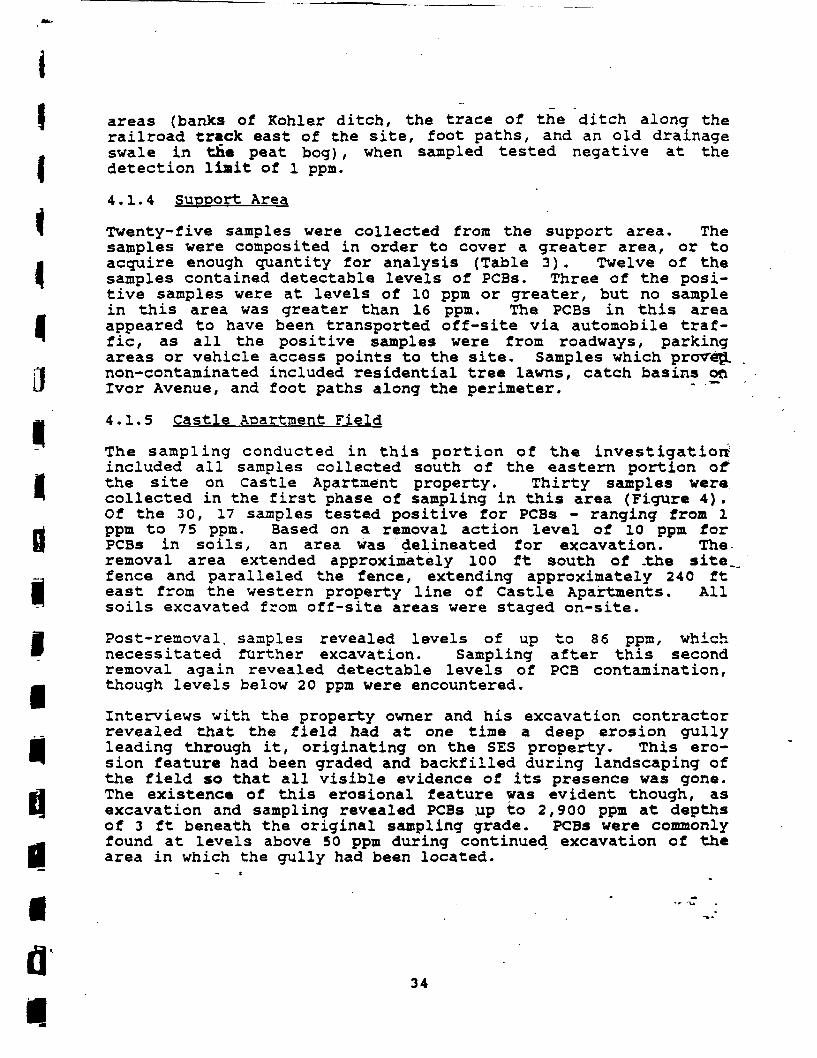
Twenty-five samples were collected from the support area. Thesamples were composited in order to cover a greater area, or toacquire enough quantity for analysis (Table 3) . Twelve of thesamples contained detectable levels of PCBs. Three of the posi-tive samples were at levels of 10 ppm or greater, but no samplein this area was greater than 16 ppm. The PCBs in this areaappeared to have been transported off-site via automobile traf-fic, as all the positive samples were from roadways, parkingareas or vehicle access points to the site. Samples which proves!non-contaminated included residential tree lawns, catch basins onIvor Avenue, and foot paths along the perimeter. " ~
4.1.5 Castle Apartment Field
The sampling conducted in this portion of the investigation^included all samples collected south of the eastern portion of"the site on Castle Apartment property. Thirty samples werecollected in the first phase of sampling in this area (Figure 4).Of the 30, 17 samples tested positive for PCBs - ranging from 1ppm to 75 ppm. Based on a removal action level of 10 ppm forPCBs in soils, an area was delineated for excavation. The-removal area extended approximately 100 ft south of .the site,fence and paralleled the fence, extending approximately 240 fteast from the western property line of Castle Apartments. Allsoils excavated from off-site areas were staged on-site.
Post-removal, samples revealed levels of up to 86 ppm, whichnecessitated further excavation. Sampling after this secondremoval again revealed detectable levels of PCS contamination,though levels below 20 ppm were encountered.
I3
I
IB
I1
Interviews with the property owner and his excavation contractorrevealed that the field had at one time a deep erosion gully
• leading through it, originating on the SES property. This ero-^ sion feature had been graded and backfilled during landscaping of
the field so that all visible evidence of its presence was gone.« The existence of this erosional feature was evident though, asexcavation and sampling revealed PCBs up to 2,900 ppm at depthsof 3 ft beneath the original sampling grade. PCBs were commonly
•
found at levels above 50 ppm during continued excavation of thearea in which the gully had been located.
34
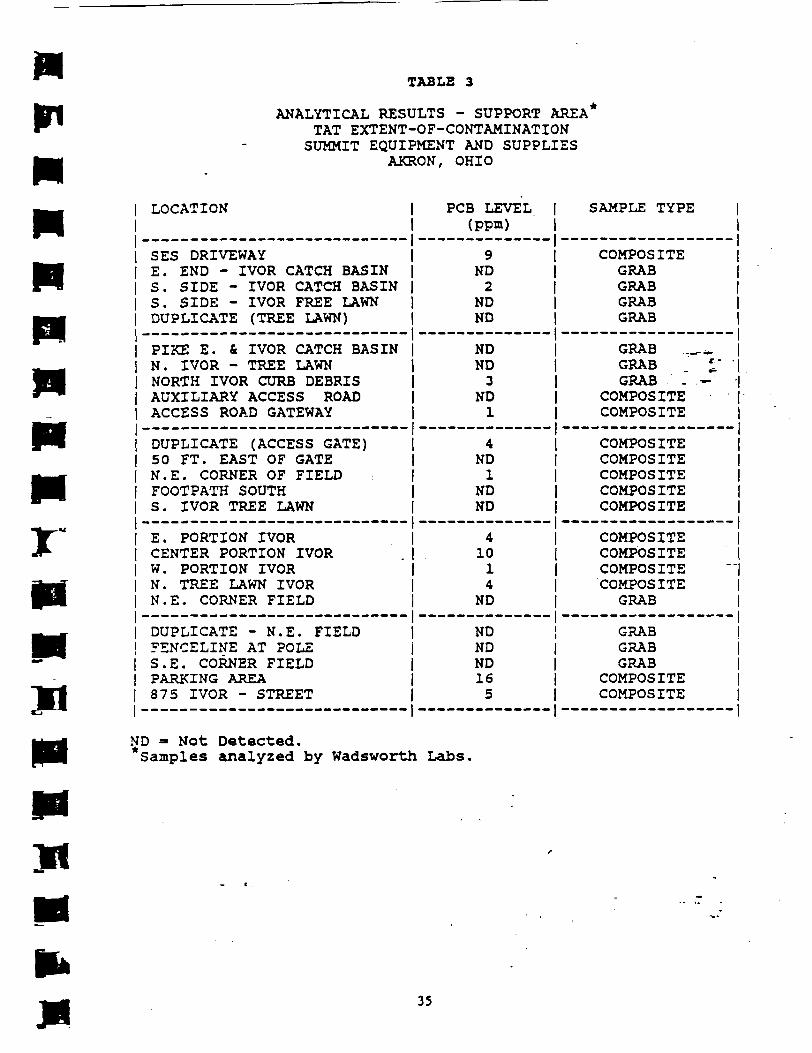
TABLE 3
ANALYTICAL RESULTS - SUPPORT AREA*TAT EXTENT-OF-CONTAMINATIONSUMMIT EQUIPMENT AND SUPPLIES
AKRON, OHIO
..-• -
LOCATION
SES DRIVEWAYE. END - IVOR CATCH BASINS. SIDE - IVOR CATCH BASINS. SIDE - IVOR FREE LAWNDUPLICATE (TREE LAWN)
PIKE E. & IVOR CATCH BASINN. IVOR - TREE LAWNNORTH IVOR CURB DEBRISAUXILIARY ACCESS ROADACCESS ROAD GATEWAY
DUPLICATE (ACCESS GATE)50 FT. EAST OF GATEN.E. CORNER OF FIELDFOOTPATH SOUTHS. IVOR TREE LAWN_ _________________________
E. PORTION IVORCENTER PORTION IVORW. PORTION IVORN. TREE LAWN IVORN.E. CORNER FIELD
DUPLICATE - N.E. FIELDFENCELINE AT POLES.E. CORNER FIELDPARKING AREA875 IVOR - STREET
PCB LEVEL(ppm)______ — ___
9ND2
NDND
NDND3
ND1____ — ________
4ND1
NDND___ __________
41014
ND
NDNDND165
SAMPLE TYPE
COMPOSITEGRABGRABGRABGRAB
GRAB .__*.GRAB *• •GRAB - -
COMPOSITECOMPOSITE
COMPOSITECOMPOSITECOMPOSITECOMPOSITECOMPOSITE
COMPOSITECOMPOSITECOMPOSITECOMPOSITEGRAB
GRABGRABGRAB
COMPOSITECOMPOSITE
ND = Not Detected.*Samples analyzed by Wadsworth Lais.
35

II[1BQr
L
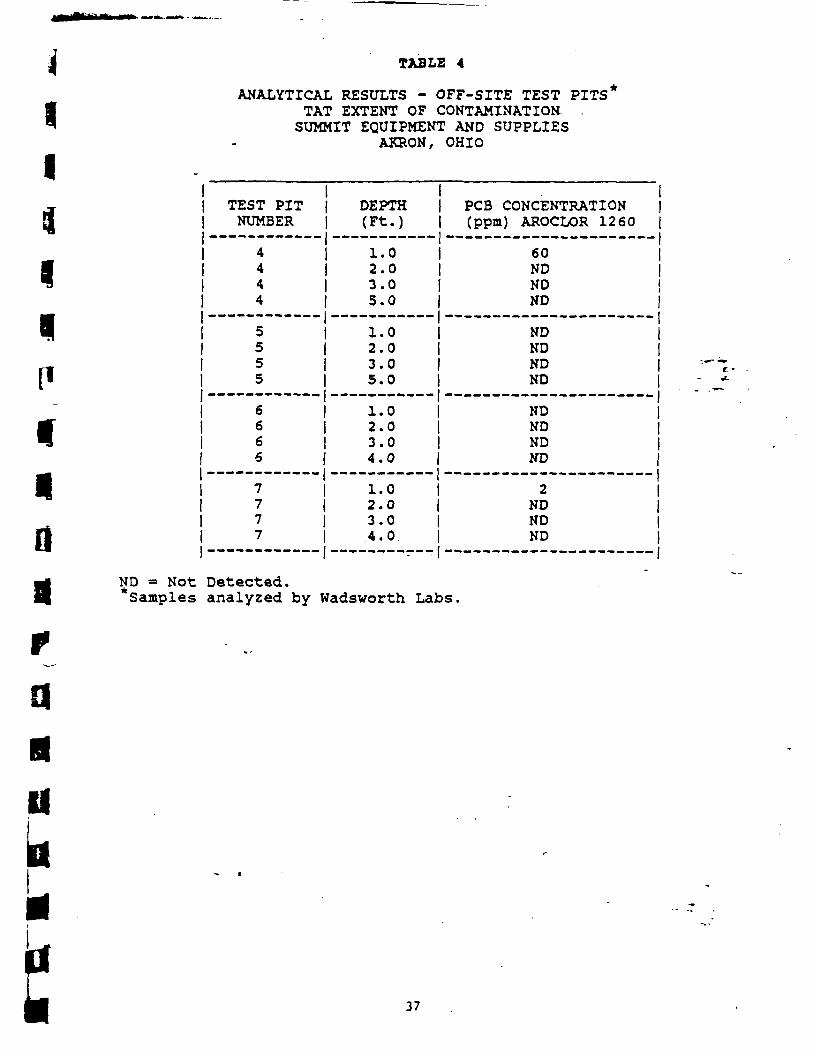
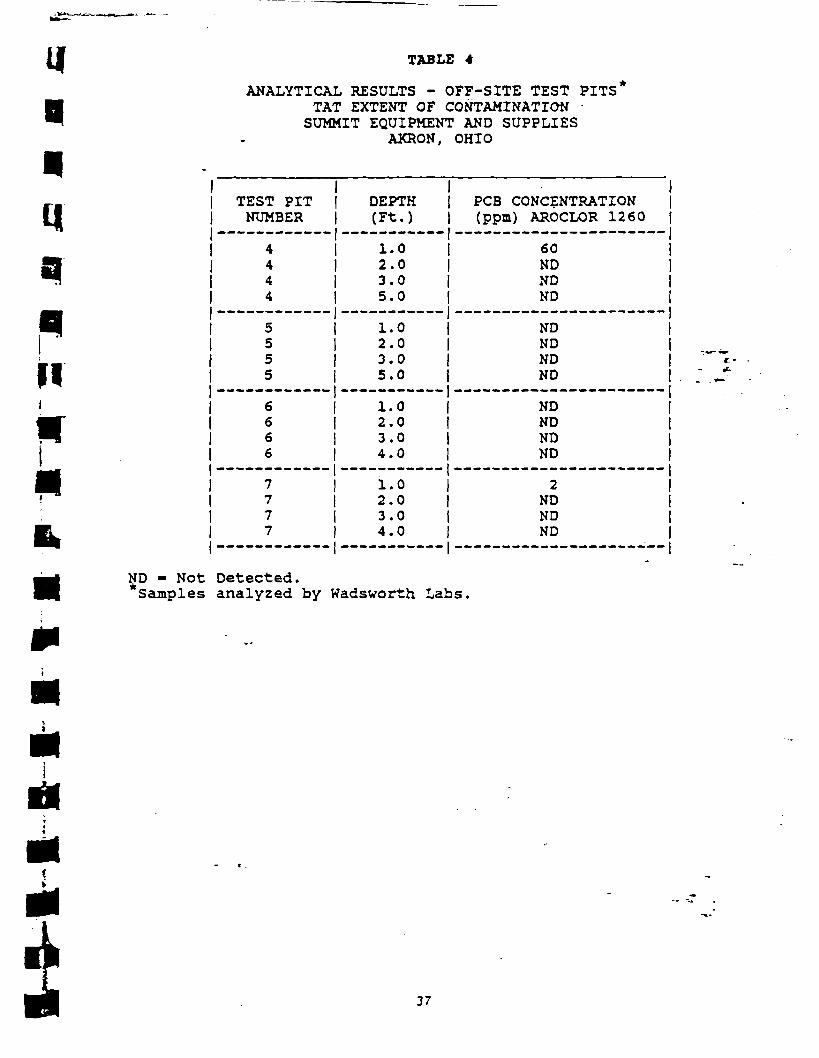
Test pits in the excavated area revealed little to no contamina-tion at deaths of 3 ft below the excavated grade (6 ft beloworiginal grade) (Table 4 and Figure 4A). Sixteen sample excava-tions were installed south and west of the area that had showedcontamination. These excavations extended 3 ft deep, with eachpit sampled at depths of 1 and 3 ft. This sampling revealed onlyone positive result (<10 ppm), at a depth of 1 ft from excavationnumber four. The lack of contamination in these pits substan-tiates the hypothesis that a channel carried PCB-contaminatedliquid from the site.
The final sampling of the old channel area, after approximately60 cubic yards of material had been removed, revealed levels ofPCBs up to 25 ppm remaining. This area was backfilled and gradedwith a clean material.
r. - -It is believed, based on historical information and the resultsof the sampling effort, that the soil beneath the old channel wasthe only portion of the field that contained PCBs in levelsgreater that 10 ppm.
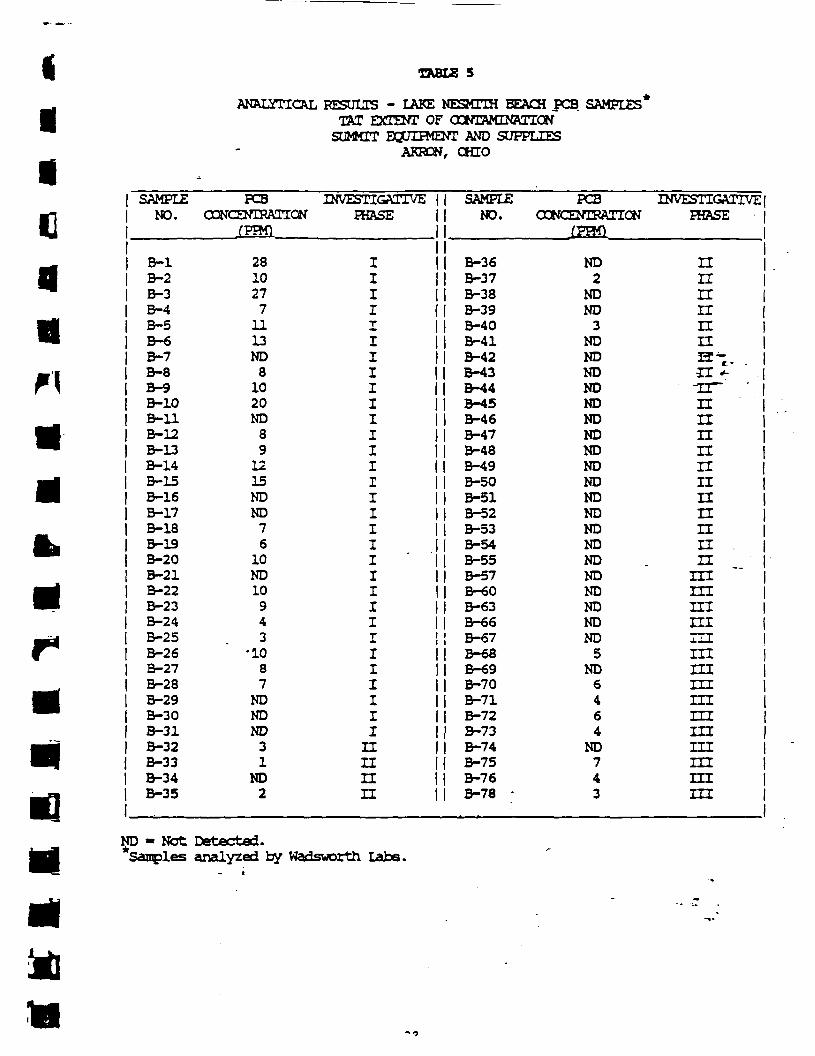
4.1.6 Lake Nesmith Beach
The Lake Nesmith Beach sampling consisted of four phases, witheach of the first three phases successively moving east from thewestern corner of the beach to the eastern end. Sampling wasinitiated at the western end. of the beach because this area wasbelieved to have received the majority of the PCB-contaminatedfill material; several small areas near the center of-the beachalso received fill material.
™ The first phase, consisting of 31 samples, was conducted in thewestern third of the beach. Twenty-three of the samples testedpositive for .PCBs (Table 5) , with the highest being 28 ppm.
The second phase continued west after the results were receivedon the first phase. This phase consisted of 24 samples collectedat 33 ft intervals from the eastern-most point of phase one tothe eastern end of the beach. Only four samples, which were inthe middle third of the beach, had detectable levels of PCBs (<Sppm) .
The third phase consisted of 12 samples, which were spacedbetween the second phase samples in the center third of thebeach, and 3 additional samples in- the eastern third. No PCBswere detected in the eastern third of the beach, while six of thesamples in the center third indicated PCBs at levels less than 7ppm (Figure 5).
— i ^
The beach was subsequently excavated to a 1 ft d_epth over itsentire western two-thirds, with the material being pi arced; on
36
IIS*
VI
TABLE 4
ANALYTICAL RESULTS - OFF-SITE TEST PITS1
TAT EXTENT OF CONTAMINATION .SUMMIT EQUIPMENT AND SUPPLIES
AKRON, OHIO
TEST PITNUMBER
4444
5555
6665
7777
—
DEPTH(Ft.)
1.02.03.05.0
1.02.03.05.0
1.02.03.04.0
1.02.03.04.0__
PCS CONCENTRATION(ppm) AROCLOR 1260
60NDNDND
NDNDNDND
NDNDNDND
2ND |ND |ND |
1
ND - Not Detected.*Samples analyzed by Wadsworth Labs.
f
37
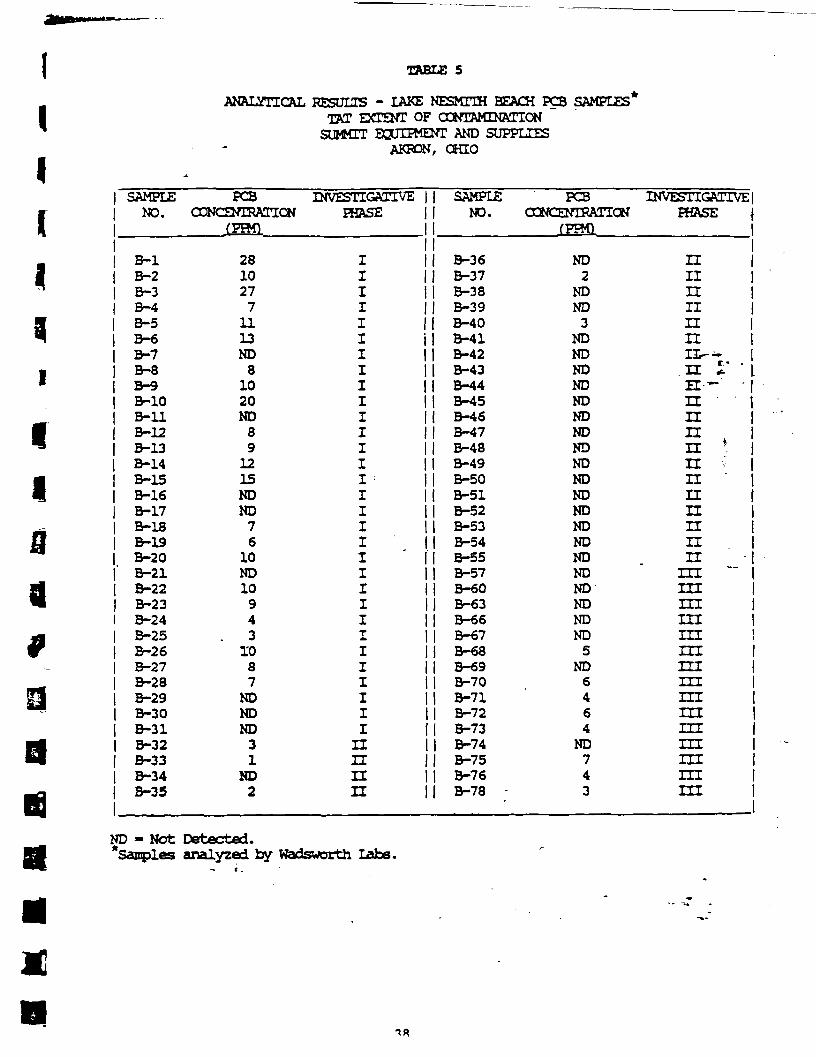
TABLE 5
II
ANALYTICAL RESULTS - LAKE NESMITH BEACH PCS SAMPLESTAT EXTENT OF CONTAMINATIONSUMMIT EQUIPMENT AND SUPPLIES
AKPON, OHIO
ia
ii
a9
Q
a
SAMPLENO.
B-lB-2B-3B-4B-5B-6B-7B-8B-9B-10B-llB-12B-13B-14B-15B-16B-17B-18B-19B-20B-21B-22B-23B-24B-25B-26B-27B-28B-29B-30B-31B-32B-33B-34B-35
PCSCONCENTRATION
(PPM1
2810277n13ND81020ND891215NDND7610ND109431087NDNDND31ND2
rNVESTIGATIVEPHASE
IIIIIIIIIIIIIII •'IIIIIIIIIIIIIIIIHHHH
| SAMPLE| NO.
B-36B-37B-38B-39B-40B-41B-42B-43B-44B-45B-46B-47B-48B-49B-50B-51B-52B-53B-54B-55B-57B-60B-63B-66B-67B-68B-69B-70B-71B-72B-73B-74B-75B-76B-78 -
PCSCONCENTRATION
(PPM)
ND2NDND3NDNDNDNDNDNDNDNDNDNDNDNDNDNDNDNDNDNDNDND5ND6464ND743
INVESTlCiATlVElPHASE j
HIIHIIHHH--H r •ZE-- 'HHHH *H vH "HHHHHHIHIHIHIIHHIHIHIHIHIHIHIHIHIHI
JD - Not Detected.*Sanples analyzed by Wadsworth Labs.
•iitiiiiE,
TABLE 4
ANALYTICAL RESULTS - OFF-SITE TEST PITS'TAT EXTENT OF CONTAMINATIONSUMMIT EQUIPMENT AND SUPPLIES
AKRON, OHIO
TEST PITNUMBER
4444
5555
6666
7777
DEPTH(Ft.)
1.02.03.05.0
1.02.03.05.0
1.02.03.04.0
1.02.03.04.0___________
PCS CONCENTRATION(ppm) AROCLOR 1260
60NDNDND
NDNDNDND
NDNDNDND
2NDNDND
r-•r-
ND - Not Detected.*Samples analyzed by Wadsworth Labs.
37
IIic4a
TABLE 5
ANAIYTICAL RESULTS - LAKE NESMTTH BEACH PCS SAMPLES*TAT EXTENT OF OCNTAMINATICNSUMMIT EQUIPMENT AND SUPPLIES
AKRON, OHIO
SAMPLENO.
B-lB-2B-3B-4B-5B-6B-7B-8B-9B-10B-llB-12B-13B-14B-15B-16B-17B-18B-19B-20B-21B-22B-23B-24B-25B-26B-27B-28B-29B-30B-31B-32B-33B-34B-35
PCSCONCENTRATION
(PPM)
2810277n13ND8
1020ND89
1215NDND76
10ND10943
-1087
NDNDND
31
ND2
INVESTIGATIVEPHASE
IIIIT
I
I
I
I
I
I
I
I
I
I
I
I
I
I
I
I
I
I
I
I
I
I
I
I
I
I
nnnn
SAMPLENO.
B-36B-37B-38B-39B-40B-41B-42B-43B-44B-45B-46B-47B-48B-49B-50B-51B-52B-53B-54B-55B-57B-60B-63B-66B-67B-68B-69B-70B-71B-72B-73B-74B-75
| B-76B-78 -
PCSCONCENTRATION
fPFtt
ND2
NDND
3NDNDNDNDNDNDNDNDNDNDNDNDNDNDNDNDNDNDNDND
5ND
6464
ND743
INVESTIGATIVE |PHASE
nIInnnn33 i-n £"-ir~ 'nnnnnnnnnn .n
mmniniminmmHIminmmmm
ND « Not Detected.*Sanples analyzed by Wadsuorth Labs.
1ijIi
r
site. Th« post-excavation samples over this area were spacedover the entire length of the excavated area and collected inareas that were expected to receive PCB-contaminated fillmaterial. Bight samples were collected in the post-excavationsampling phase, with one sample indicating PCBs at 1 ppm. Theremaining PCB-contaminated area was located around a roof drainpipe leading to the water, and was subsequently excavated.
Based on the available analytical data and the information provi-ded on the backfill of the beach, it is believed that PCBs hadnot migrated deeper than 12 inches on the beach. The removal of12 inches of sand over the majority of the beach and up to 2 ftof sand at the western end was deemed to be adequate to removethe low levels of PCB-contaminated material.
,— 4.1.7 Lake Nesmith Sediments '" *.r
Because of the discovery of PCS contamination along the south,shore beach of Lake Nesmith, the sampling of near shore sediments
•was conducted to determine if PCB-contaminated sands had migratedfrom the beach to the water. Twenty-four sediment samples werecollected along the south shore of Lake Nesmith, seven of which
g» contained detectable levels of PCBs (Figure 6). No removal wasmi initiated because the PCB contamination was limited to 3 ppm or
less, and the sediments were randomly distributed along theshore.
Three samples of 15 to 20 ft depth sediments were collected forPCB analysis within Lake Nesmith. No PCBs were detected in these.
mA samples (Figure 7).
4.1.8 Lake Nesmith Surface Water
ft
tt
The water samples collected from Lake Nesmith for PCB analysiswere collected off-shore of the contaminated portion of thebeach. Four of the five samples indicated PCBs above the detec-tion limit of 0.5 parts per billion (ppb), with results rangingfrom 0.8 ppb to 2.4 ppb (Figure 8). The method of collection forthese five samples allowed for sediment to be collected with eachsample, it is believed that contamination levels noted were fromPCB-contaainated sediments suspended in the water sample. Thesixth sample collected from a rowboat contained no detectablelevels of PCBs. No further action was taken on the presence ofPCBs in the wading zone off the south shore of Lake Nesmith.
tiI 4.1.9 Air Samples
•
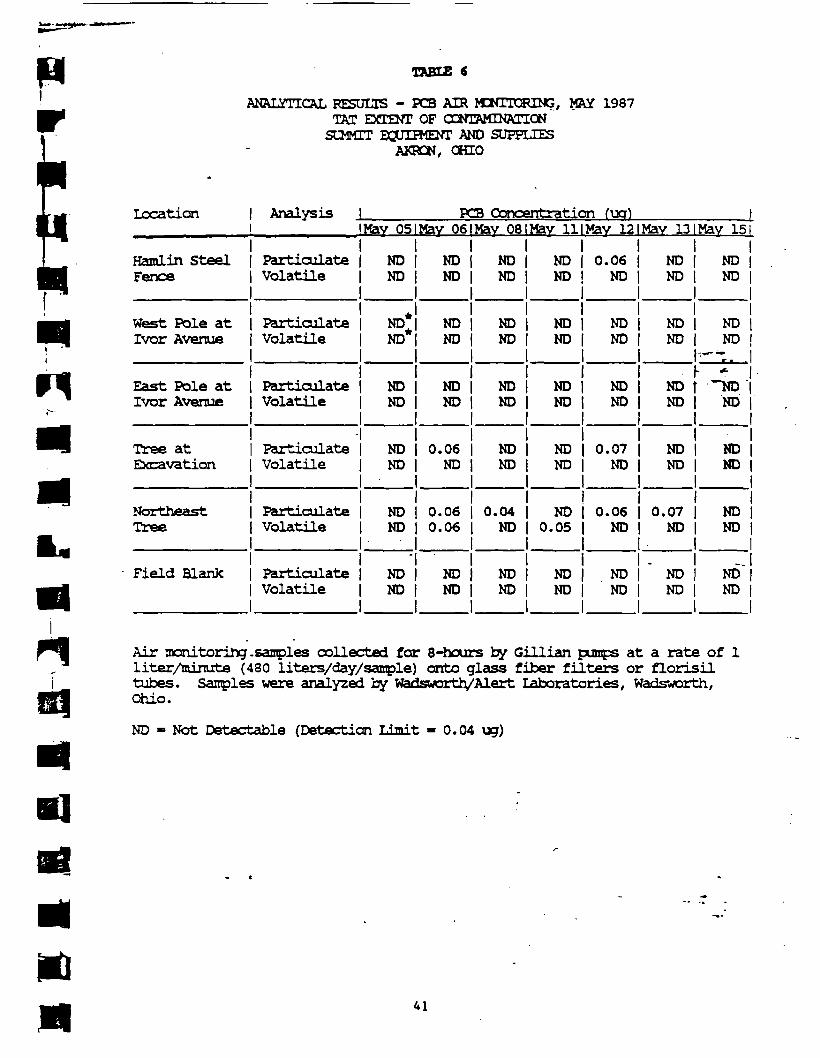
Results of air sampling along the perimeter of the SES site issummarized in Table 6 and represents the total amount of PCBsdetected in 480 liters of air, with a detection limit of 0.04 ug.Of the 35 "actively" collected samples, 8 were found positive for
IJ PCBs,
Detectable levels of PCBs were observed most frequently from the
•station on the tree at the northeast perimeter; PCBs weredetected five out of the seven days monitored, with particulatePCBs being present on four of these occasions. Particulate PCB
•
concentrations exhibited the greatest range at this station; thelowest level recorded was the detection limit of 0.04 ug and thehighest level was 0.07 ug. This station was also the only loca-tion where volatile PCBs were detected. Two samples tested posi-
|~1 tively for volatile PCBs, but only one of the positive volatile'*"^ samples occurred simultaneously with a positive particutate-
sample.
The station at the tree at the Castle Apartment field excavationrecorded two samples with detectable levels of PCBs (0.06 ug and0.07 ug). The other station to record a positive result was thewestern station at the Hamlin Steel fence. It coincided withpositive results observed at the northeast tree station and theexcavation station. The results may be attributed to dry condi-tions with an almost steady wind from the north, a conditionwhich was not duplicated during any other sampling event.
No PCBs were detected at the stations along Ivor Avenue. Thepattern of positive results can most likely be attributed to theproximity of the stations to a source of PCBs. The northeasttree was 3 ft from the site fence near a location of documentedhigh soil contamination, the excavation station was largely sur-rounded by ?CB-contaminated soils, and the Hamlin Steel stationwas located on the site fence.
The action level for ambient air was established as 0.001 mg/m3which is the National Institute of Occupational Safety and Health(NIOSH) Permissible Exposure Limit. The results of the 7-daysampling effort indicated levels of PCBs in the air an order ofmagnitude below this action level.
4.2 On-Site
4.2.1 Soil
4.2.1.1 Surface - PCBsc .
The SES site was sampled extensively for the presence of PCBs inthe surface soils. ~ .. .?
40
I
P
TRBIZ «
ANALYTICAL RESULTS - PCS AIR HKETQRING, MAY 1987TAT EXTENT OF CONTAMINATIONSUMMIT EQUIPMENT AND SUPPLIES
AKPCN, OHIO
ft.
Location
Haralin SteelFence
West Pole atIvor Avenue
East Pole atIvor Avenue
Tree atExcavation
NortheastTree
Field Blank
Analysis PCS Concentration (ucr) \IMav OSIMav OSIMav OSIMav HIMav 12IMav 13IMav 15
ParticulateVolatile
ParticulateVolatile
ParticulateVolatile
ParticulateVolatile
ParticulateVolatile
ParticulateVolatile
NDND
ND*ND
NDND
NDND
NDND
NDND
NDND
NDND
NDND
0.06ND
0.060.06
NDND
NDND
NDND
NDND
NDND
0.04ND
NDND
NDND
NDND
NDND
NDND
ND0.05
NDND
0.06ND
NDND
NDND
0.07ND
0.06ND
NDND
NDND
NDND
NDND
NDND
0.07ND
NDND
NDND
NDND
•;•*•" "
h *~ND 'ND
NDND
NDND
ND"ND
-TI
Air monitoring.samples collected for 8-hours by Gillian pumps at a rate of 1liter/minute (480 liters/day/sanple) onto glass fiber filters or florisiltubes. Samples were analyzed by Wadsworth/Alert laboratories, Wadsworth,Ohio.
ND - Not Detectable (Detection Limit - 0.04 ug)

uamtia
The OEPA had previously collected five soil samples from on site,with levels "of PCBs detected ranging from 180 ppm to 74,000 ppm.The initial eight samples collected on-site by the TAT indicatedlevels of PCBs ranging from not detectable to 1,350 ppm.
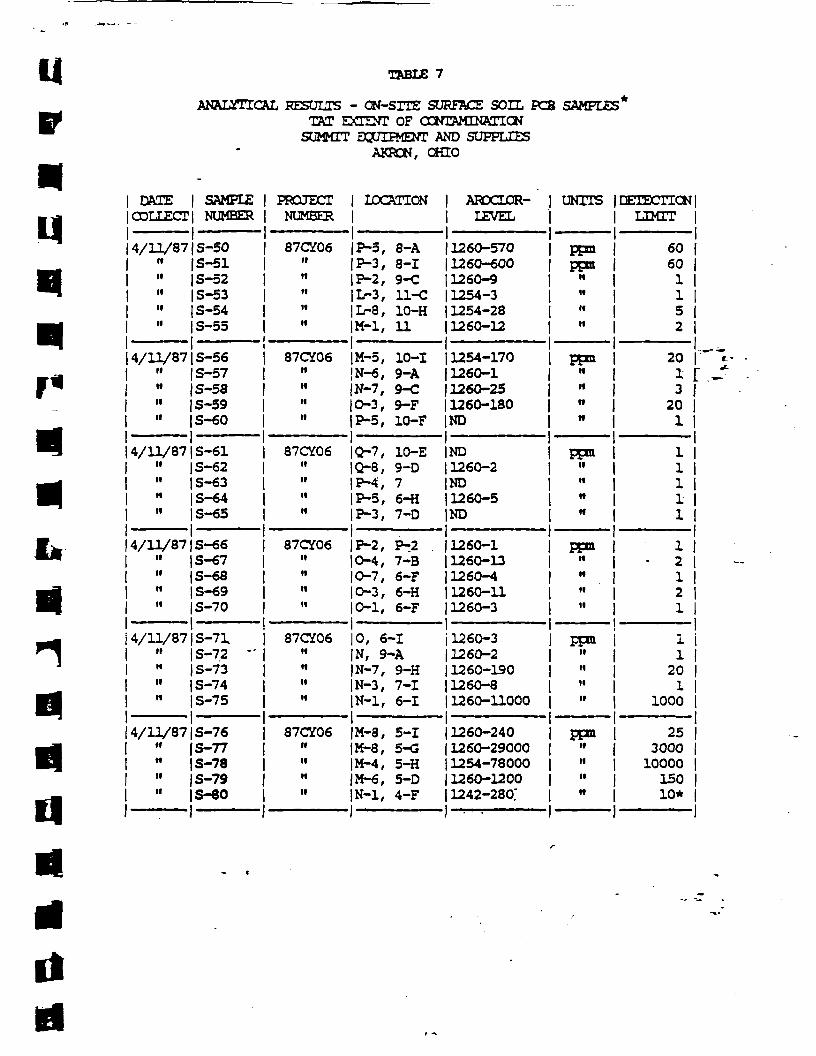
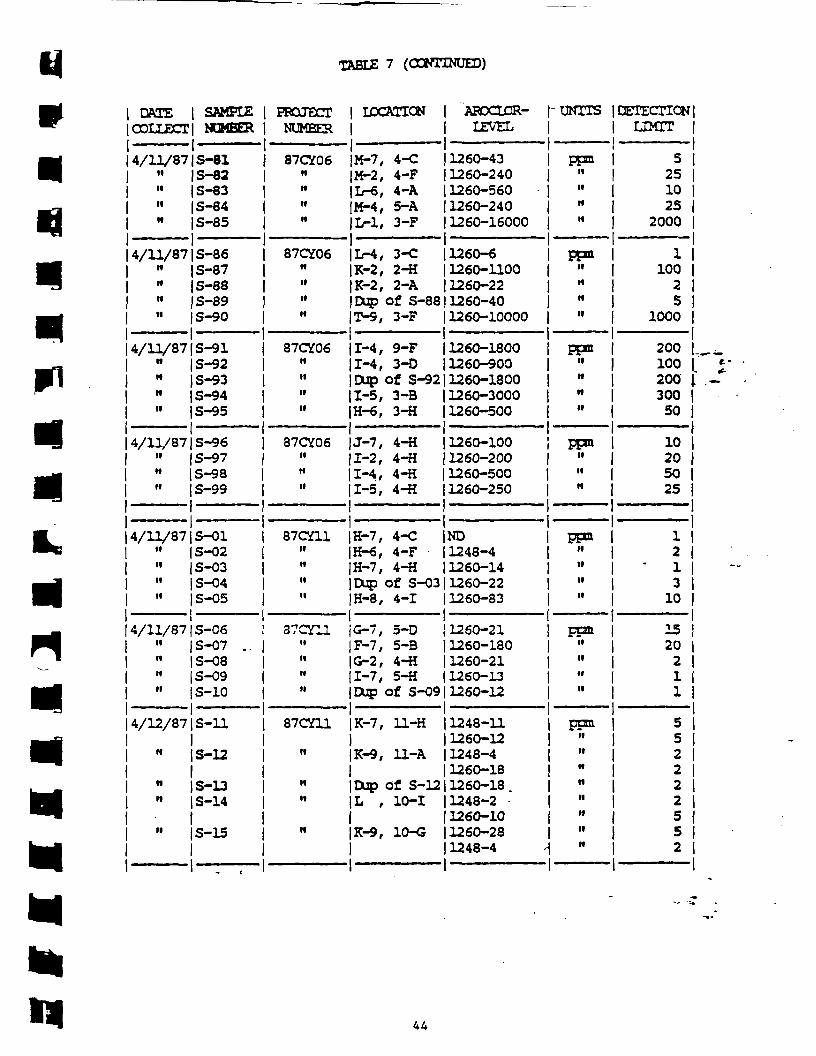
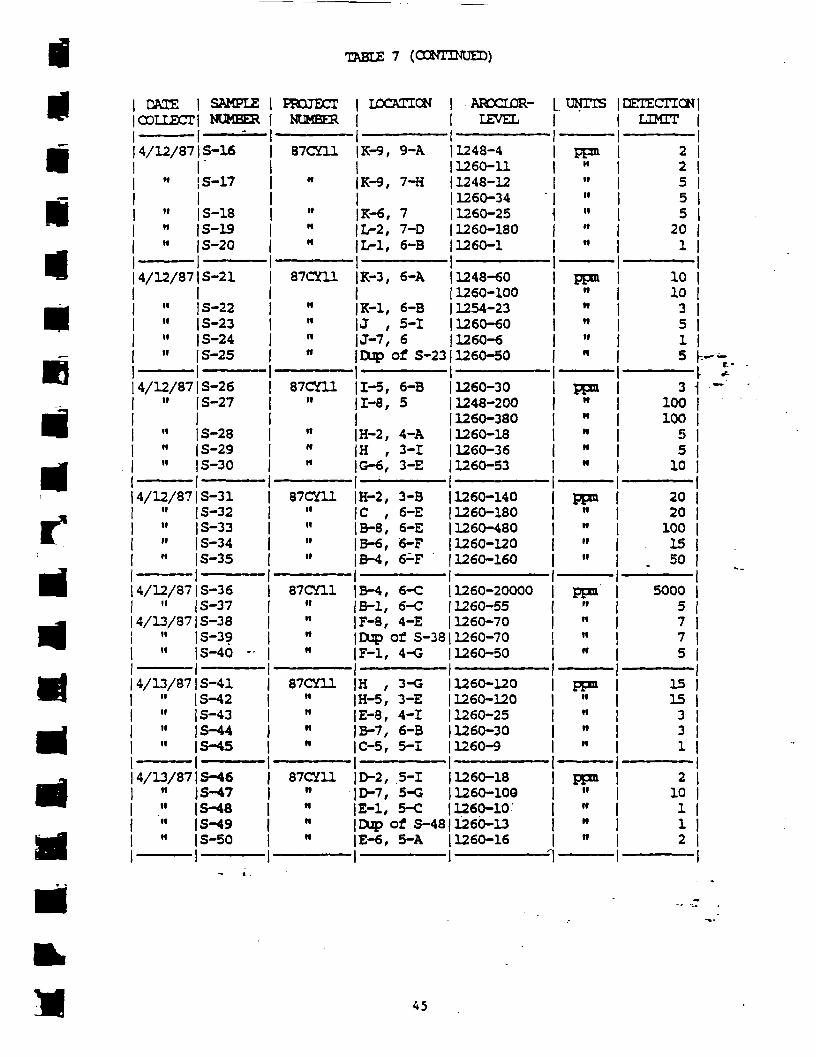
The 127 ensuing samples collected during the HOC study (Table 7)indicated that the soils on-site at SES were extensively contam-inated by PCBs. Of the samples analyzed during the extent ofcontamination study, 53 were found to contain PCBs at 50 ppm orgreater; 43 of these were greater than 100 ppm. Eighteen sampleshad concentrations of PCBs greater than 500 ppm; 12 of theseexceeded 1,000 ppm, and 6 of the 12 exceeded 10,000. Only sixsamples collected on-site did not show detectable levels of PCBs.The TSCA policy on PCBs establishes a level of 25 ppm for cleanupin soils though U.S. EPA can impose stricter levels if a threatto ground water is perceived. - *
Samples were collected with fairly uniform frequency across thesite. Sample locations were dictated by access to the soil; mostof the samples were collected along the edges of open roadwaysand in open work areas. As the majority of the site consists ofmetal scrap and debris piles which cover and minimize access tothe soil, no accurate estimate of the extent of surface contamin-ation can be made until the soils beneath the scrap piles can beinvestigated further. Given the characteristics of the pastoperations on-site and the typical soil conditions, it can beassumed that PCB contamination in the soil is not limited to onlythe open areas on site.
The highest concentration of PCBs in soils may have come from theleakage of capacitor fluids from electrical equipment observedthroughout the site. The majority of the PCB contamination canbe attributed to transformer spills and tracking of materialsthrough spill'areas which expanded the aerial extent. During theremoval action, approximately 300 capacitors and 1,300 transfor-mer carcasses were removed from the site. Additional transfor-mers and capacitors will most likely be discovered on-site whenthe metal scrap and debris are removed.
The possibility for additional migration of contaminants isincreased after the scrap and debris are removed and the soil isexposed. PCB-contaminated soils may be easily transported acrossthe site because of the sandy consistency of the soils, whichsupports Very little vegetation. Because site soils consisted ofhomogenous sands, it was difficult to differentiate freshly exca-vated soil from soil which had been in place indefinitely.
42
M
muH
TABUS 7
ANALYTICAL RESULTS - ON-STTE SURFACE SOIL PCS SAMPLES*TAT EXTEOT OF (ZNIMCINATTQN
SUMMIT EQUIPMENT AND SUPPLIESAKRON, OHO
mm
DATE SAMPLE[COLLECT] NUMBER
| 4/11/87 |S-50" JS-51itn
n
S-52S-53S-54S-55
|4/lV87|S-56n S-5711 JS-58
| " |S-59" |S-60
4/U/87 1 S-6111 |S-6211 | S-63itn
S-64S-65
4/11/87 1 S-66it S-67" |S-68itn
S-69S-70
4/11/87 |S-7Xii S-72 -11 S-73" |S-74n S-75
[ 4/11/87 |S-76" JS-77
I " |S-78n S-79" |S-80
i i
PROJECTNUMBER
87CY06nitnnn
| LOCATION AROCLOR-| LEVEL
P-5, 8-A (1260-570P-3, 8-1P-2, 9-CL-3, 11-CL-8, 10-H
1260-6001260-91254-31254-28
M-l, 11 (1260-12
87CY06 |M-5, 10-1 1254-170" 'N-6, 9-A (1260-1" |N-7, 9-C (1260-25n11
0-3, 9-F 1260-180p-5, IO-F IND
1 i87CY06 |Q-7, 10-E |ND
itnii
"
37CY06
0-8, 9-D 1260-2p-4, 7 INDP-5, 6-H 1260-5p-3, 7-D IND
P-2, P-2 . 1260-1" |0-4, 7-B [1260-13" (0-7, 6-Fn 0-3, 6-H11 |0-1, 6-F
87CY06
1260-41260-111260-3
0, 6-1 1260-3|N, 9-A
it1260-2
N-7, 9-H [1260-19011 |N-3, 7-1 (1260-8n
87CY06
N-l, 6-1 1260-11000
M-8, 5-1 |1260-240" |M-8, 5-G (1260-29000" |M-4, 5-H" |M-6, 5-D
1254-780001260-1200
11 |N-1, 4-F 1 1242-280."i . i
UNITS | DETECTION
ppnppn
nititn
ppnnnnit
ppn"nnN
ppnnN
II
II
ppnii11
iin
ppnit11
itn
LIMIT
60601152
2013
201
- - •11111
1- 2
121
11
201
1000
253000
1000015010*
IIIX
m
1ABLE 7 (CONTINUED)
mm
| DATE | SAMPLE| COLLECT] NOMEER
| 4/11/87(5-81" (S-82" S-8311 S-84" (S-85
4/ll/87|S-86" (S-87" (S-88n S-8911 | S-90
4/11/87(3-91" S-92" |S-93" |S-94" | S-95
4/11/87 | S-96" (S-97" S-98" S-99
4/1V87JS-01" S-0211 |S-03" S-04" S-05
4/11/87 | S-C611 |S-07 .." S-0811 S-09" S-10
4/12/87)3-11
11 (3-121
" S-1311 )S-14
1" S-15
PROJECT LOCATION APDCLOR-NUMBER LEVEL
87CY06 |M-7, 4-C 1260-43" |M-2, 4-F 1260-240" L-6, 4-A |1260-560 •" |M-4, 5-A 1260-240" L-l, 3-F 1260-16000
-87CY06 |L-4, 3-C | 1260-6
" |K-2, 2-H 1260-1100" |K-2, 2-A (1260-2211 | Dup Of S-88 1260-40" |T-9, 3-F 1260-10000
87CY06 (1-4, 9-F (1260-180011 1-4, 3-D 1260-900" Dup of S-92 1260-1800" 1-5, 3-B (1260-300011 (H-6, 3-H (1260-500
87OT06 |J-7, 4-H 1260-10011 (1-2, 4-H 1260-20011 |I-4, 4-H 1260-500" |I-5, 4-H 1260-250
87CQ1 |H-7, 4-C |ND11 |H-6, 4-F 1248-4" |H-7, 4-H 1260-14" ) Dup Of S-03 1260-2211 |H-8, 4-1 1260-83
37CY11 JG-7, 3-D 1260-2111 F-7, 5-B 1260-18011 |G-2, 4-H 1260-21" 1-7, 5-H 1260-13" | Dup of S-09 1260-12
- -87CY11 |K-7, 11-H 1248-11
1260-12" K-9, 11-A 1248-4
| 1260-1811 Dup Of S-12 1 1260-18 ." |L , 10-1 (1248-2
| 1260-10" |K-9, 10-G (1260-28
1248-41
-UNITS
ppm
nnn
ppm
n
n
ppmn
N
II
ppm
n
-ppm
ppmii
n
ppm
nn
n
"1
DETECTIONLU-OT
5251025
2000
1100
25
1000
200100 I200 130050
10205025
1213
10
1520
211
552222552
I*
Ei TABIZ 7 (CUNl'lNUED)
| DATE SAMPLE| COLLECTI NUMBER
| 4/12/87|S-16r
" |S-17
" S-18'• |S-19•• |S-20
4/12/87 |S-21
11 S-2211 S-23" |S-24" S-25
4/12/87 |S-26" S-27
11 S-28" (S-2911 S-30
4/12/87 |S-31" |S-32" S-33" S-34" S-35
4/12/87 S-36" [S-37
4/13/87 |S-38" S-39n s_4o -
4/13/87 |S-41" S-42" |S-43" | S-44" S-45
1| 4/13/87 |S-46| " |S-47
11 S-48| " S-49
« s-50, _______
PROJECT | IDCATION ARDGLOR-NUMEER LEVEL
87CY11 |K-9, 9-A 1248-411260-11
" |K-9, 7-H (1248-121260-34
11 |K-6, 7 1260-25H L-2, 7-D 11260-180" |L-1, 6-B |1260-1
87CY11 |K-3, 6-A 1248-60| 1260-100
" |K-1, 6-B 11254-23" |J , 5-1 |1260-60" |J-7, 6 1260-6" |Dup Of S-23 1260-50
87CY11 |I-5, 6-B 1260-30" |I-8, 5 1248-200
| 1260-38011 |H-2, 4-A (1260-1811 |H , 3-1 1260-36" |06, 3-E (1260-53
87CY11 |H-2, 3-B 1260-14011 |C , 6-E 1260-18011 |B-8, 6-E 1260-480" |B-6, 6-F 1260-120" B-4, 6-F 1260-160
87Cm |B-4, 6-C 11260-20000" B-l, 6-C 1260-5511 |F-8, 4-E 1260-70" |Dup Of S-38 1260-70" |F-1, 4-G 11260-50
87CO1 |H , 3-G |1260-12011 |H-5, 3-E 1260-12011 |E-8, 4-1 1260-25" B-7, 6-B |1260-30" C-5, 5-1 1260-9
-87CO1 D-2, 5-1 (1260-18
11 |D-7, 5-G 1260-10011 |E-1, 5-C 1260-1011 |Dup of S-48 11260-13" |E-6, 5-A |1260-16__________ i r
L UNITS
ppa11
nn"«tn
ppn"H
II
II
If
ppmnN
nnM
' " ••
It
It
II
II
ppnitnnH
ppnnn11
H
pjpmnitNn_______
uc.'i'JK.'i'j.ON 'LIMIT
22555
201
1010
3515 \
3 1100100
55
10
2020
1001550
50005775
1515331
-2
10112
i1IiI4
1
ri
TABLE 7 (CONTINUED)
1I
Ii8I
ND = Not Detected.*Saaples analyzed by WadswDrth Labs.
1 DATECOLLECT
4/13/87it
4/20/87iiit
4/20/87N
N
If
II
SAMPLENUMBER
S-51S-52S-58S-59S-60
S-61S-62S-63S-64S-65
| 4/20/87 |S-€6" |S-67» |S-68" |S-69'• |S-70
4/20/87iii»ii
"
4/20/87ii11
"11
S-71S-72S-73S-74S-75
S-76S-77S-78S-79S-80
[4/2 0/87 IS-81
PROTECTNUMBER
87CY11N
"it
"
87CY11itnnn
LOCATION
E-5, 5-DE-8, 5-BD , 6-FD-7, 6-GE-3, 6-D
Dup Of S-59F , 6-FF-9, 7-AF-2, 6-HF-5, 6-1
AROCLOR-LEVEL
-1260-81260-151260-41260-161260-30
1260-151260-151260-191260-61260-16
87CY11 |6 , 6-F |1260-211 |F-4, 6-A |1260-33" |G-3, 6-A |1260-2" |H-9, 6-G 11260-52" |H-6, 6-B |1260-120
87CY11 G-8, 6-E" |6 , 6-B11 |Dup of S-71
|G-6,:5-E1H-2, 5-EI
1260-191260-121260-281260-3ND
87CY11 |J-7, 5-C |1260-190" |K-4, 5-A. |1260-47" |J-8, 3-fl |1260-250011 J-3, 3-D |1260-30011 |J-2, I-G |1260-33
87CY11 |K , I-D |1260-3
-UNi'IS
ppmnHn
if
k i r n i ^
If
N
N
If
ppnH
N
ppnitnHn
ppannitit
utiBcrioN |LIMIT
12125
21512
1151.
2560
55
1011
5025
10005025
ppm ! 2
I 46
r
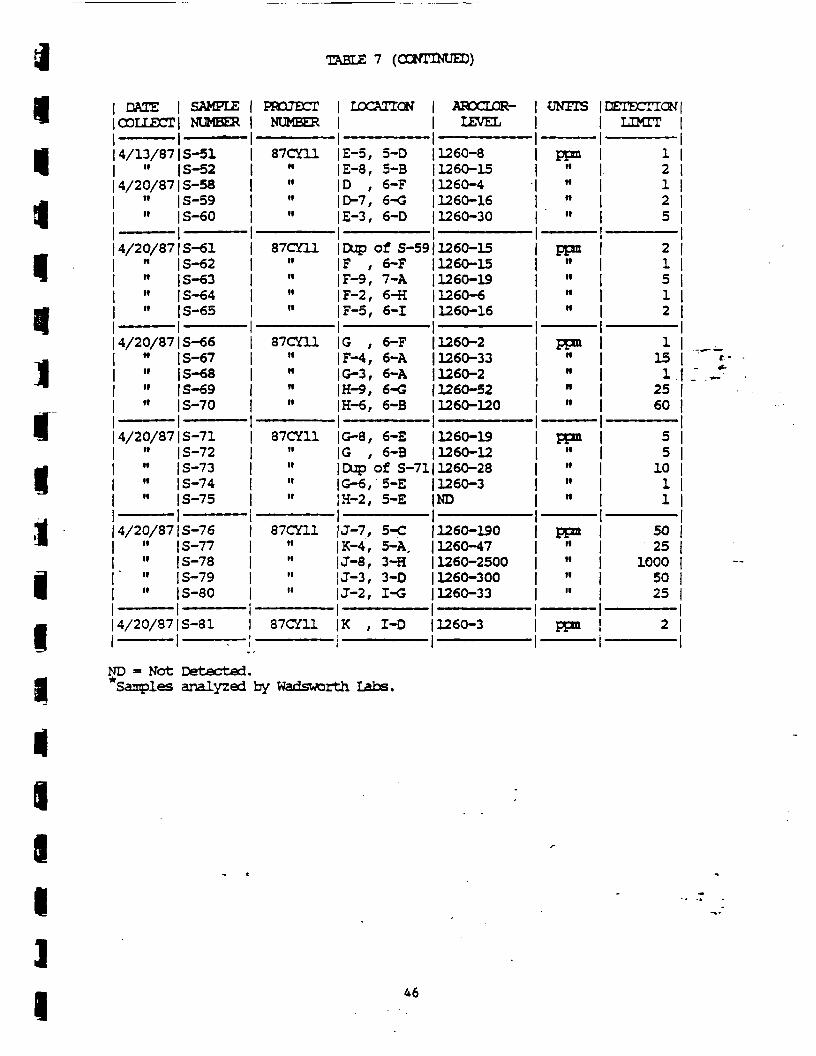
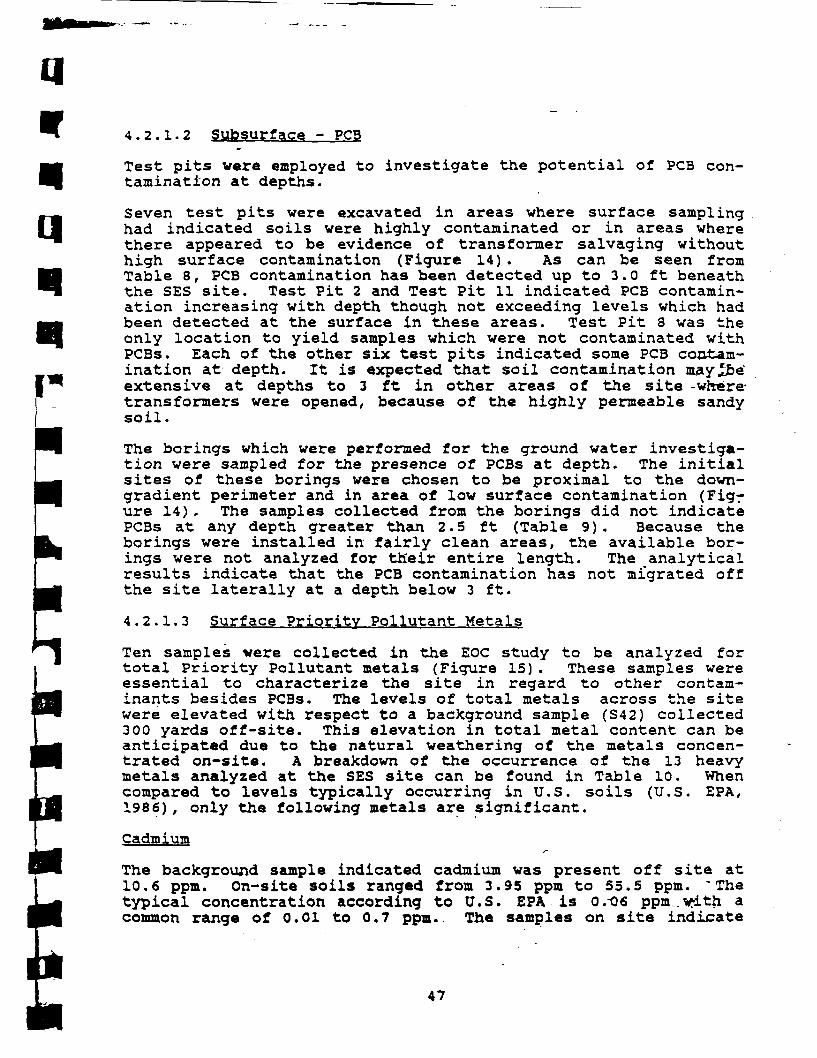
4.2.1.2 Subsurface - PCB
Test pits were employed to investigate the potential of PCB con-tamination at depths.
Seven test pits were excavated in areas where surface samplinghad indicated soils were highly contaminated or in areas wherethere appeared to be evidence of transformer salvaging withouthigh surface contamination (Figure 14) . As can be seen from
4 Table 8, PCB contamination has been detected up to 3.0 ft beneaththe SES site. Test Pit 2 and Test Pit 11 indicated PCB contamin-ation increasing with depth though not exceeding levels which hadbeen detected at the surface in these areas. Test Pit 3 was theonly location to yield samples which were not contaminated withPCBs. Each of the other six test pits indicated some PCB ccmtam-ination at depth. It is expected that soil contamination may^Jbe"extensive at depths to 3 ft in other areas of the site -wheretransformers were opened, because of the highly permeable sandysoil.
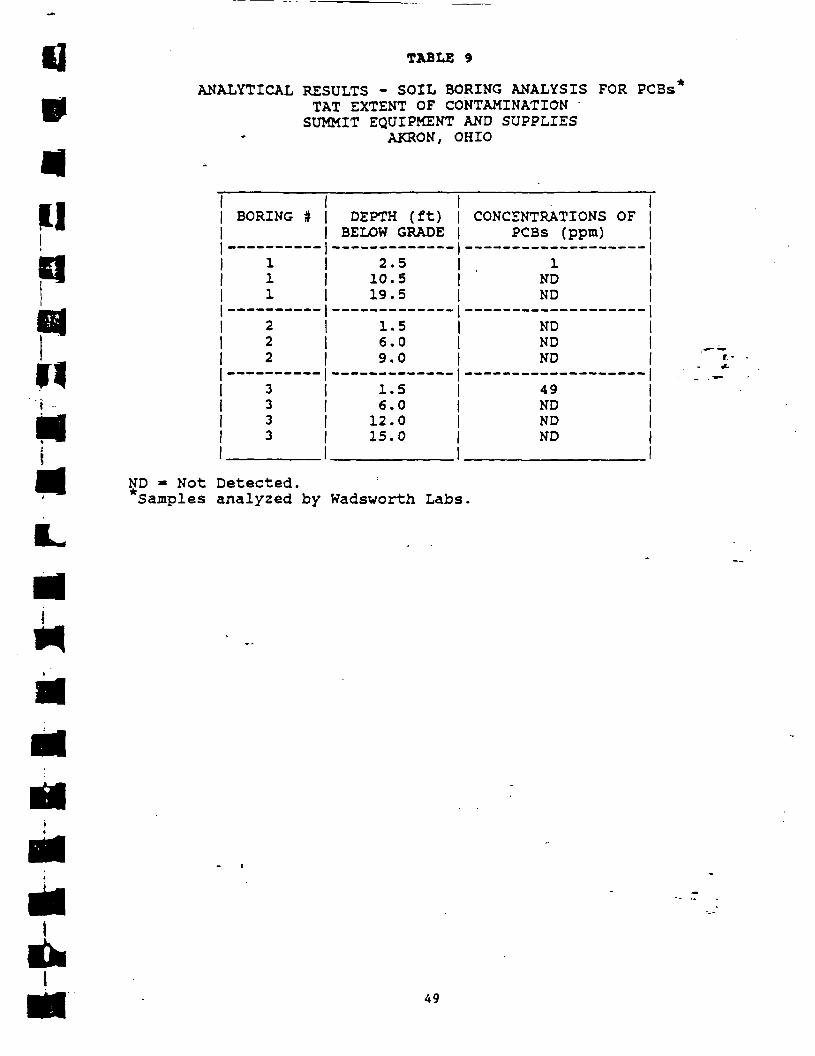
The borings which were performed for the ground water investiga-tion were sampled for the presence of PCBs at depth. The initialsites of these borings were chosen to be proximal to the down-gradient perimeter and in area of low surface contamination (Figrlire 14) . The samples collected from the borings did not indicatePCBs at any depth greater than 2.5 ft (Table 9). Because theborings were installed in fairly clean areas, the available bor-ings were not analyzed for ttieir entire length. The _analyticalresults indicate that the PCB contamination has not migrated offthe site laterally at a depth below 3 ft.
4.2.1.3 Surface Priority,Pollutant Metals
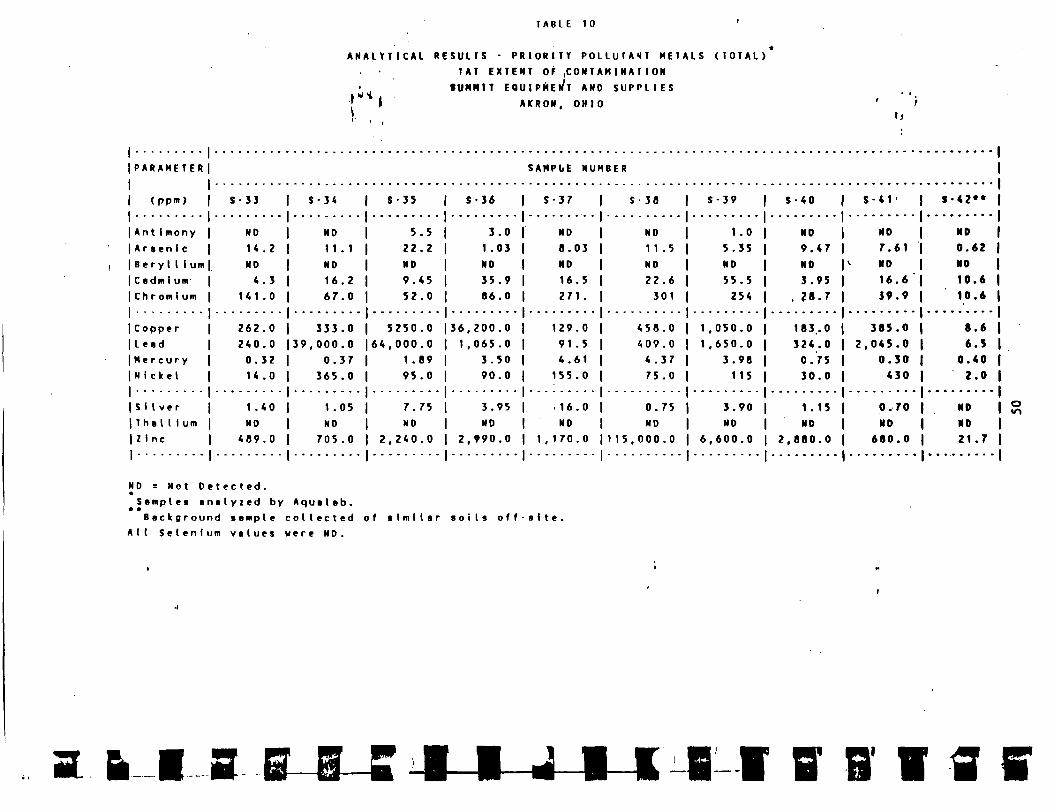
Ten samples were collected in the EOC study to be analyzed fortotal Priority Pollutant metals (Figure 15). These samples wereessential to characterize the site in regard to other contam-inants besides PCBs. The levels of total metals across the sitewere elevated with respect to a background sample (S42) collected300 yards off-site. This elevation in total metal content can beanticipated due to the natural weathering of the metals concen-trated on-site. A breakdown of the occurrence of the 13 heavymetals analyzed at the SES site can be found in Table 10. Whencompared to levels typically occurring in U.S. soils (U.S. EPA,1986), only the following metals are significant.
Cadmium
The background sample indicated cadmium was present off site at10.6 ppm. On-site soils ranged from 3.95 ppm to 55.5 ppm. * Thetypical concentration according to U.S. EPA is 0.-06 ppm..with acommon range of 0.01 to 0.7 ppm.. The samples on site indicate
47

u
tiua
TABLE 8
ANALYTICAL RESULTS - ON-SITE TEST PITS FOR PCBS*TAT EXTENT OF CONTAMINATION -SUMMIT EQUIPMENT AND SUPPLIES
AKRON, OHIO
TEST PITNUMBER
1111
2222
3333
888
999
101<X10 "
111111
DEPTH(Ft.)
0.51.02.04.0
0.51.02.04.0
0.51.02.04.0
1.02.03.0
1.02.03.0
1.02.03.0______________ ____
1.02.03.0
PCS CONCENTRATION(ppm) AROCLOR 1260
140NDNDND
2600 J31004900ND
32
NDND
NDNDND
170NDND
14023ND
100021002300
ND * Not Detected.^Samples analyzed by Wadsworth Labs.
i]
miiiq
TABLE 9
ANALYTICAL RESULTS - SOIL BORING ANALYSIS FOR PCBs'TAT EXTENT OF CONTAMINATION 'SUMMIT EQUIPMENT AND SUPPLIES
AKRON, OHIO
H
BORING #
111
222
3333
1
DEPTH (ft)BELOW GRADE
— — — —2.510.519.5
------1.56.09.0
— 1.56.012.015.0
CONCENTRATIONS OFPCBs (ppm)
1NDND
NDNDND
49NDNDND
ND =» Not Detected.*Samples analyzed by Wadsworth Labs,
•I
49
T A B L E 10
A N A L Y T I C A L R E S U L T S - P R I O R I T Y P O L I U T A M T M E T A L S (TOTAL)
TAT E X T E N T OF . C O N T A M I N A T I O N
SUHNIT EQUIPMENT AND S U P P L I E S
I AKRON, OHIO.,«*•
\
P A R A M E T E R
(ppnt)
An t 1 mony
A r s e n i c
Beryl 1 1 urn
C adm 1 urnCh r ont i um
Copper
Lead
M e r c u r y
N i c k e l
S i l v e r
T h a i I i um
Z 1 nc
S-33
ND
14.2ND
4.3
U1 .0
262.0
240.0
0. 32
U.O
1 .40
NO
489.0
S-34
ND
1 1 . 1
NO
16.2
67.0
333.0
39,000.0
0.37365.0
1 .05
ND705.0
S-35
5.522.2ND
9.45
52.0
5250.0
64,000.0
1 .89
95.0
7.75
ND
2.240.0
S-36. .
3.01.03ND
35.9
86.0
36.200.0
1,065.0
3.50
90.0
3.95
ND2,990.0
SAMPLE NUf
S-37
ND
8.03
ND
16.5
271 .
129.0
91 .5
4.61
155.0
. 16.0
ND1.170.0
IBER
S 38
NO
11.5
ND
22.6
301
458.0
409.0
4.37
75.0
0.75
ND1 1 5 , 000.0
S-39
1 .0
5.35ND
55.5254
1 .050.0
1,650.0
3.98115
3.90ND
6,600.0
S-40
ND9.47ND
3.95. 28.7
183.0324.0
0.7530.0
1 . 15
ND2,880.0
S-41'
ND
7.61
<• ND
16.639.9
385.0
2,045.0
0.30430
0.70ND680.0
S-42**
ND
0.62ND
10.610.6
8.66.50.402.0
NOND21.7
ND = Not D e t e c t e d .*Samples a n a l y z e d by Aqualab.
Background sample c o l l e c t e d o f s i m i l a r s o i l s o f f - s i t e ,
All S e l e n i u m values were ND.
B • • a
SP
nsi
that there are portions of the site which have elevated concen-trations of "cadmium.
Copper
The background sample contained 8.6 ppm copper. The maximum-concentration for copper on-site exceeds 36,000 ppm for sampleS - 36. Samples on site ranged from 129 ppm to 36,200 ppm. TheU.S. EPA gives a common range of 2 to 100 ppm, a range which isexceeded by all of the samples collected on site. Given thebackground sample, it can be deducted that copper is a commoncontaminant on site, as a direct result of the site activities.
Lead
Lead was determined to be present in the background sample at Ji". 5ppm, four orders of magnitude less than the highest result -forlead obtained on site. The concentration of lead in samplesobtained on site range from 91.5 to 64,000 ppm. Only one samplefalls within the common range given by the U.S. EPA as 2 to 200ppm. The site exhibits an impact from past operations involvingbattery reclamation which may pose a threat to human healththrough inhalation or inges'tion of lead particulates. Typically,lead contaminated soils greater the 500 ppm have been removedfrom sites.
Mercury
'The background for mercury at the SES site was established at0.40 ppm while the on-site concentrations ranged from 0.3 to 4.61ppm. The U.S. EPA designated the eastern U.S. as having a meanvalue of 0.15 ppm while exhibiting a range of 0.01 to 4.6 forsoils in the western U.S. It is not believed that the SES opera-tion has created a significant impact on the levels of mercuryfound on the site.
Silver
In the background sample collected, silver was not detectedabove the detection limit of 0.05 ppm. The site held a range ofconcentrations from 0.70 to 16 ppm which exceeds the common rangeof 0.01 to 5 ppm (Lindsay, 1979). Only two of the nine samplescollected were beyond the common range and do not appear to pre-sent a great anomaly.
Zinc
The background concentration of zinc was established to be 2.17ppm. Each sample collected on-site had levels of zinc higherthan background, with values ranging from 489 to- 115,00.0-:: ppm.These values on-site may.be attributed to the amount of galvan-
51
7-1& ized steel products on-site which have been weathered to form
zinc oxides: The higher levels can be attributed to the batteryreclamation areas.
Concentrations of heavy metals can be expected to vary across theSES site due in part to the activities which were conducted andto the decomposition of a varied collection of metals. As anexample, the areas of battery reclamation exhibit the greatestamount of zinc while the areas surrounding the smelter containextremely high concentrations of lead, and the wire strippingareas contains copper at levels of four times the magnitude ofbackground samples.
4.2.1.4 Dioxin/Furan
Samples were collected for dioxin/furan analysis at four~~i*ca-tions across the site due to the extensive presence of PCBsJ andthe burning which took place on-site. The results are summarizedin Tables 11, 12A, and 12B.
The initial (isomer specific 2,3,7,8-tetrachlorodibenzodioxin andtetrachlorodibenzofuran [TCDD/TCDF]) sample analyses, wasperformed by Hazelton Laboratories. The results indicated posi-tive for 2,3,7,8-TCDD in the ash pile, Location S-18. Two loca-tions, the burn barrel area (S-16) and the firebrick and debrisarea (S-19), were positive for 2,3,7,8-TCDF.
Subsequent re-analysis of .the extract at TMS for the tetrathrough octa isomer classes of chlorinated dibenzodioxin andchlorinated dibenzofurans (CDD/CDF) and 2, 3,7,8-TCDD/TCDF isomerspecific, resulted positive for 2,3,7,8-TCDD in the burn barrelarea and the firebrick debris pile. These results, reported as1.0 and 1.1 ppb respectively, are the maximum 2,3,7,8-TCDD expec-ted in the_ analysis with the column used. If analysis isperformed with a longer polar capillary column, any value,including zero, below the reported value may be obtained from theextract. This allows for the possibility of three of the foursamples having some quantity of 2,3,7,8-TCDD or just one. Theone sample found positive for 2,3,7,8-TCDD by Hazelton Laborator-ies was below the detection limit of TMS' analysis.
The analysis performed by TMS also indicated the presence ofisomer classes of CDD and CDF in the burn barrel area and thefirebrick debris areas seen in Table 123.
4.2.2 Ground Water - PCBs and Priority Pollutant Metal/-
Two sampling events of the wells installed at the SES site wereperformed for the EOC study* Both well sampling analyses indica-ted a slight PCS contamination of monitoring well. 3 with _a con-centration of 3.8 ppb as shown in Table 13. Initial sampliag of
52
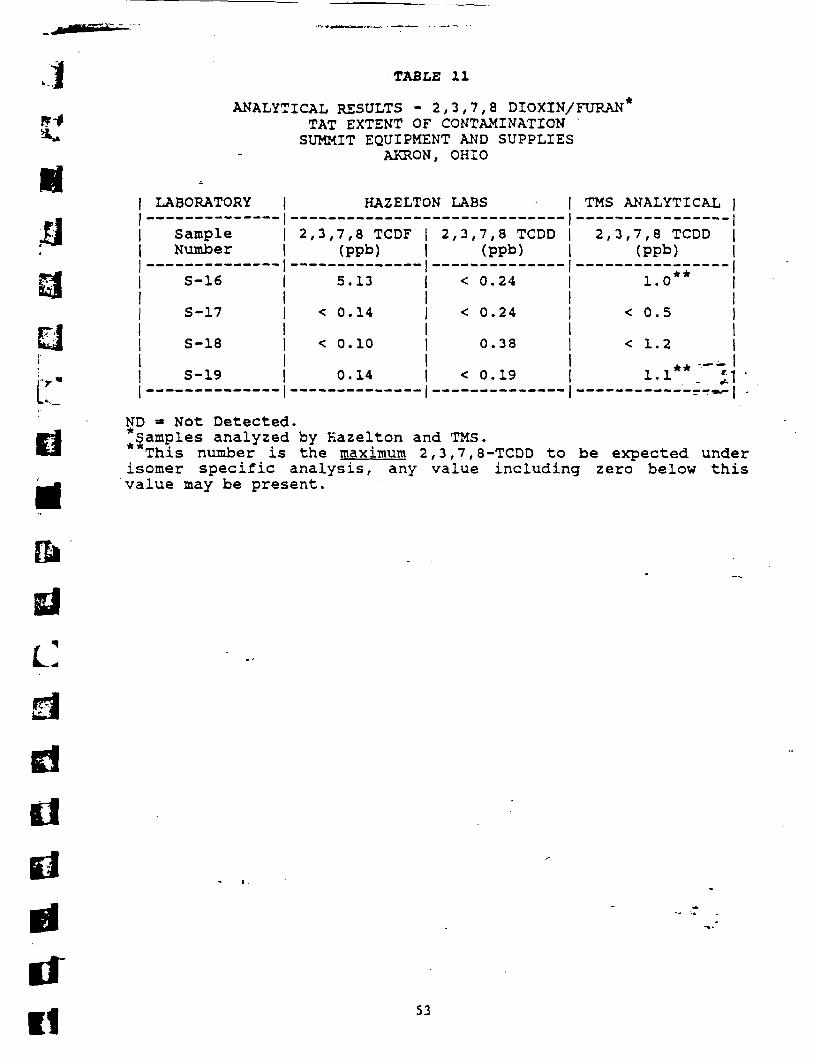
1
HII
TABLE 11
ANALYTICAL RESULTS - 2,3,7,8 DIOXIN/FURAN''TAT EXTENT OF CONTAMINATION "SUMMIT EQUIPMENT AND SUPPLIES
AKRON, OHIO
LABORATORY
SampleNumber
S-16
S-17
S-18
S-19
HAZELTON LABS
2,3,7,8 TCDF(PPb)
5.13
< 0.14
< 0.10
0.14
2,3,7,8 TCDD(PPb)
< 0.24
< 0.24
0.38
< 0.19__ _________
TMS ANALYTICAL
2,3,7,8 TCDD(PPb)
1.0**
< 0.5
< 1.2
i.i** riND » Not Detected.*Samples analyzed by Kazelton and TMS.This number is the maximum 2,3,7,8-TCDD to be expected under
isomer specific analysis, any value including zero below thisvalue may be present.
If
1153

-f"3 TABLE 12A
ANALYTICAL RESULTS - DIOXIN*TAT EXTENT OF CONTAMINATIONSUMMIT EQUIPMENT AND SUPPLIES
AKRON, OHIO
SISAMPLE | LOCATIONNUMBER)______ | ______________ _ _
1S16 | Burn Bbl. AreaS17 j IncineratorS18 | Ash PileS19 | Fire Brick/Debris
1
| DIBENZO-P-DIOX2TCDD PCDD IHXCDD______ ______ 1 ____
1< 40.6 < 1.6J < 0.6< 0.5 < 0.3 | < 0.6< 1.2 < 0.9| < 1.2< 3.6 < 2.4| < 1.4
I i
CN (PPB)HPCDD | OCDD_ __ i ___ _
11.3| < 2.6
< 1.2 j < 1.9< 2.4| < 4.1< 2.4| < 1.7
i i
U TABLE 12B
ANALYTICAL RESULTS - FURAN*TAT EXTENT OF CONTAMINATIONSUMMIT EQUIPMENT AND SUPPLY
AKRON, OHIO
LJJ
| SAMPLE[NUMBERi ______1
| S16| S17| S18| S19I
LOCATION [ CHLORODIBENZOFUI| TCDF PCDF IHXCDF1
Burn Bbl . Area | 8.5Incinerator |< 0.3Ash Pile |< 0.9Fire Brick/Debris] < 0.8
1
i17.2 | 6.3
< 0.3 |< 0.5< 0.8 |< 1.0
6.1 |< 1.2i
IAN (PP1HPCDF
10.5-< 1.0< 2.1< 2.1
3)OCDF
14.9< 2.0< 4.33.2__
ND = Not Detected.
Detection Limit based on concentration of interfering compounds.
Samples analyzed for isomer and cogener specific parameters atTMS from extractions performed at Hazelton Laboratories.
•1
Bf
I*54
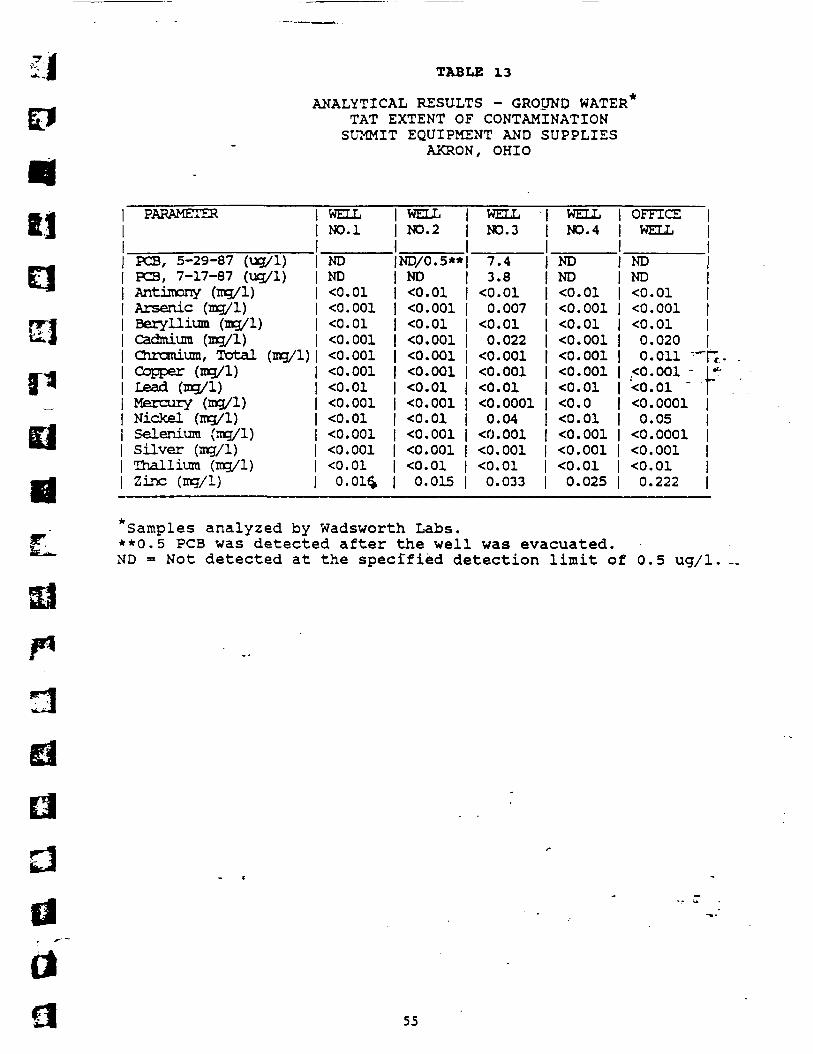
TABLE 13
ANALYTICAL RESULTS - GROUND WATER*TAT EXTENT OF CONTAMINATIONSUMMIT EQUIPMENT AND SUPPLIES
AKRON, OHIO
tl
£1
PARAMETER
PCS, 5-29-87 (ug/1)PCS, 7-17-87 (ug/1)Antimony (mg/1)Arsenic (mg/1)Beryllium (mg/1)Cadmium (mg/1)Chromium, Total (mg/1)Copper (mg/1)Lpad (mg/1)Mercury (mg/1)Nickel (mg/1)Selenium (mg/1)Silver (mg/1)Thallium (mg/1)Zinc (mg/1)
WELLNO.l
NDND<0.01<0.001<0.01<0.001<0.001<0.001<0.01<0.001<0.01<0.001<0.001<0.010.01$
WELLNO.2
ND/0.5**ND<0.01<0.001<0.01<0.001<0.001<0.001<0.01<0.001<0.01<0.001<0.001<0.010.015
WELL -N0.3
7.43.8<0.010.007<0.010.022<0.001<0.001<0.01<0.00010.04<0.001<0.001<0.010.033
WELLNO. 4
NDND<0.01<0.001<0.01<0.001<0.001<0.001<0.01<0.0<0.01<0.001<0.001<0.010.025
OFFICEWELL
NDND<0.01<0.001<0.010.0200.011 ~<o.ooi -<0.01 '<0.00010.05<0.0001<0.001<0.010.222
f
^Samples analyzed by Wadsworth Labs.**0.5 PCS was detected after the well was evacuated.ND = Not detected at the specified detection limit of 0.5 ug/1
a
d55
nmonitoring well 2 indicated the presence of PCBs at the detectionlevel of 0.5 ppb. This result was not duplicated in subsequentsampling. Monitoring well 3 was installed closest to a documen-ted surface contaminated area and had concentrations of 49 ppm ofPCBs detected 1.5 ft below grade during soil boring sampleanalysis. The contamination of 11.2 ppb which is present inmonitoring well 3 may be the result of particles of PCB-contamin-ated sand entering the well and sample during collection of thesample.
Monitoring wells 1, 2 and 4 showed no impact from the 13 PriorityPollutant metals as indicated in Table 13. Levels of zinc werepresent in all of the samples at levels below the drinking waterstandard. Zinc was also observed in the sample field blank sub-mitted with the samples. The office well and monitoring weJ-L 3showed elevated levels of nickel and cadmium both surpassing 1Jfte~drinking water quality standards. - .—
Arsenic was detected in monitoring well 3 at a level of 7 ppb,below the primary drinking water standard of 50 ppm. The officewell contained 11 ppb of chromium, a level which is also belowwater quality standards of 50 ppb.
4.2.3 Swipe Samples - PCBs
Swipe samples were performed on metals throughout the SES sitewithout any significant detection of PCBs. Twenty samples werecollected from metal debris on-site. Seven of these samples were
• found positive for PCBs with all these results being less than 2~5ug/wipe (Table 14).
Initially, swipe samples were collected of transformer carcassesto aid in the process of establishing disposal criteria. Sixtacr.samples collected from transformers of various makes and sizes toestablish the contamination levels of the carcasses. These swipe
i- _ samples indicated that the transformers were contaminated with upto 126,000 ug/100 cm2 PCBs.
4.2.4 Oil Samples - PCBs
As the transformers on-site were being staged for disposal, thosej which contained fluids were sampled to determine which of the
following waste systems to bulk the oil:.
o Non-detectable levels of PCBs;
o Less than 50 ppm PCB;- t .
o Greater than 50 ppm/ but less than 500 ppm PCB; or/ *
o Greater than 500 ppm PCB..
56
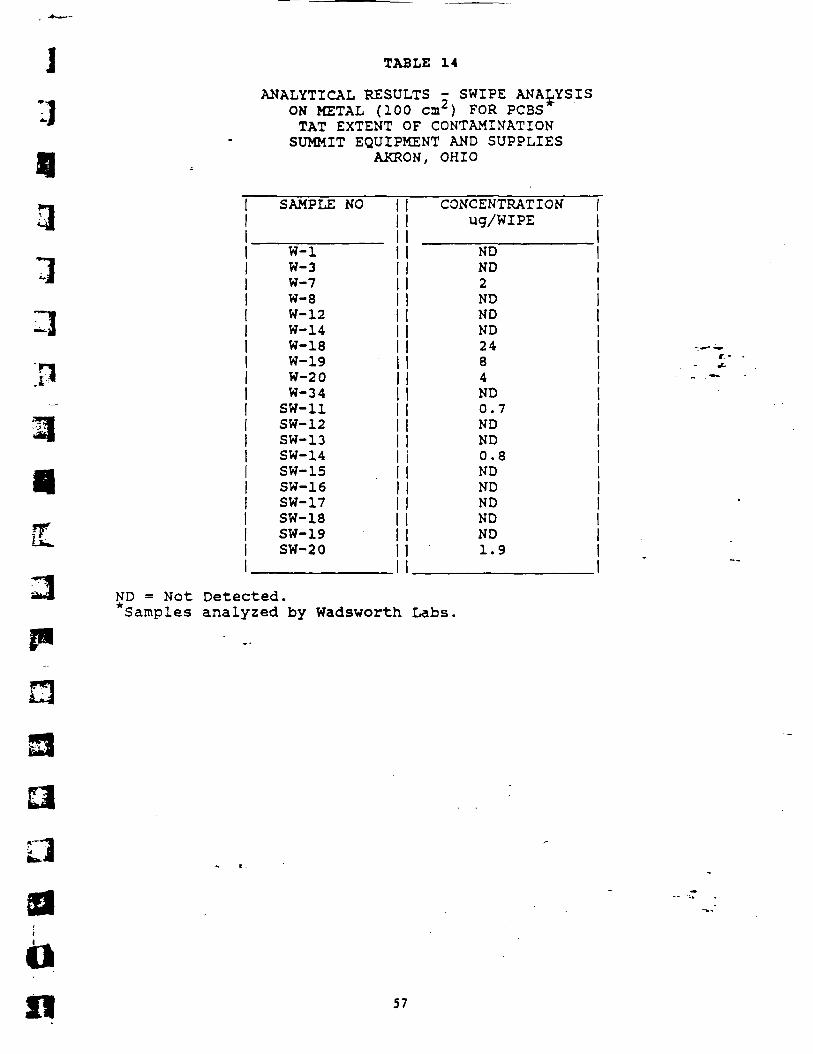
TABLE 14
ANALYTICAL RESULTS - SWIPE ANALYSISON METAL (100 ca2) FOR PCBSTAT EXTENT OF CONTAMINATIONSUMMIT EQUIPMENT AND SUPPLIES
AKRON, OHIO
1
m
a
SAMPLE NO
W-lW-3W-7W-8W-12W-14W-18W-19W-20W-34SW-11SW-12SW-13SW-14SW-15SW-16SW-17SW-18SW-19SW-20
CONCENTRATIONug/WIPE
NDND2NDNDND2484ND0.7NDND0.8NDNDNDNDND1.9
ND = Not Detected.*Samples analyzed by Wadsworth Labs.
13
ar|
0n 57
Fifty-two samples were collected from transformer liquids fordisposal characterization of these liquids. Two samples oftransformer fluids contained over 500 ppm, while two other trans-formers with fluids contained over 50 ppm but less than 500 ppm.Seventeen of the 52 transformers tested had detectable concentra-tions less than 50 ppm. The remaining 31 transformers had fluidsor water which contained nondetectable concentrations of PCBs ata detection limit of 1 ppm.
4.3 Quality Assurance/Quality Control
All QA/QC procedures implemented at the SES site were carried outin accordance with the QA/QC plan for the site (Attachment F).
All laboratories utilized in the project, were members of theNational Contract Laboratory Program or are U.S. EPA approved forthe specific analysis they performed.
5.0 RECOMMENDATIONS
Due to the extensive PCB contamination which has been documentedat the SES site, it is essential that the total problems associa-ted with the site be understood before further actions are under-taken. Threats posed by the site included the potential forairborne contaminant migration and the possibility of a deepmigration of PCBs in the ground water beneath the site.
In order to mitigate the threats, more actions are required bythe U.S. EPA. A Remedial Investigation/Feasibility Study (RI/FS)or Engineering Evaluation Cost Analysis (EECA) should beperformed to document the most feasible alternative applicable tothe site. Further actions without this documentation should belimited, and should be performed in accordance with objectives ofthe EECA or RI/FS in mind.
58
Technologies availableinclude:
Category
Waste Destruction
Chemical Treatment
Waste ContainmentOn-Site
Waste ContainmentOff-Site
for remediation of this site could
Applicable Technology
Rotary Kiln, Infrared System.Circulating Bed Corabustor.Advanced Electrical Reactor andIn Situ Vitrification.
Chemical Reduction Oxidation(REDOX).
Solidification and Multi-LayeredCapping Over Waste Material^— ~_
.=-Off-Site RCRA/TSCA Landfill-. ~ '
It is essential that the site be cleared totally of metal scrapand debris prior to any long term or permanent remediation. Thiswill allow for access to all portions of the site for necessarydepth of contamination characterization.
Subsequent to removal of scrap and debris, the surface of thesite should be mapped. The mapping should entail surface toground water isopacks to establish whether the depth of materialabove the water table. Borings should be initiated on site toestablish if any contamination occurs in the soil at depthsgreater than 5 ft. Positive drainage measures should be providedat the perimeter to prevent erosion from transporting contamin-ated materials off-site after the debris and scrap are removed.
Kf59
JBIBLIOGRAPHY
daCl
U.S. EPA, Reclamation and Redevelopment of Contaminated Land:Vol. 1, U.S. Case Studies, August 1986.
Lindsay, W.L., Chemical Equilibria in Soils, 1979.
•i
60
1
I!q
1*1
ua
ATTACHMENT A
FIELD DATA SHEET
e. ••=-
61
nATTACHMENT B
SAMPLING SOP
I!
U
01n 62

ISAMPLING SOP
1
Formulation of a sample plan (number of samples, tentative loca-tion and number of duplicate samples);
Generating a standard map to plot sample locations;
Completing all pertinent paperwork as completely as possibleprior to collection of a sample, including:
Field data sheetChain of custody ____Sample tags ~~~~*' •Individual sample containers _" T .
Notification of the laboratory (where applicable).
01
n
nATTACHMENT C
WELL SAMPLING SOP
€. •f-
63

WELL SAMPLING SOP
1. Measured the depth to the water table- from the top of thesteel casing and recorded the depth to the water table minusthe height of the steel casing.
2. Calculated the amount of water present in the well by sub-tracting the depth to water from the total depth of the welland used as "h" in the following formula:
Volume = (3.14)r2hwhere r = 0.0833 ft
This formula gave the total volume of water contained irTtrtie-well in cubic ft. ." .,* .
3. The well was then sampled with a bailer that had been decon-taminated and sealed at the check valve so as to fill fromthe top. This sample was for a skim sample only.
4. After collecting the :skim sample, three well volumes wereevacuated from the well to ensure a representative samplefrom the ground water.
5. After three well volumes were evacuated from the well, asample was collected in a HOPE bottle. The sample was thenfiltered in the field through a 0.45 micron filter to remov*any suspended solids. After filtering, the sample was acid-ified with 5 ml of nitric acid. This sample was analyzedfor Priority Pollutant metals.
6. The PCB--samples were then collected, with a minimum of 2liters being collected in amber glass containers.
ATTACHMENT D
SWIPE SAMPLING PROTOCOL
64
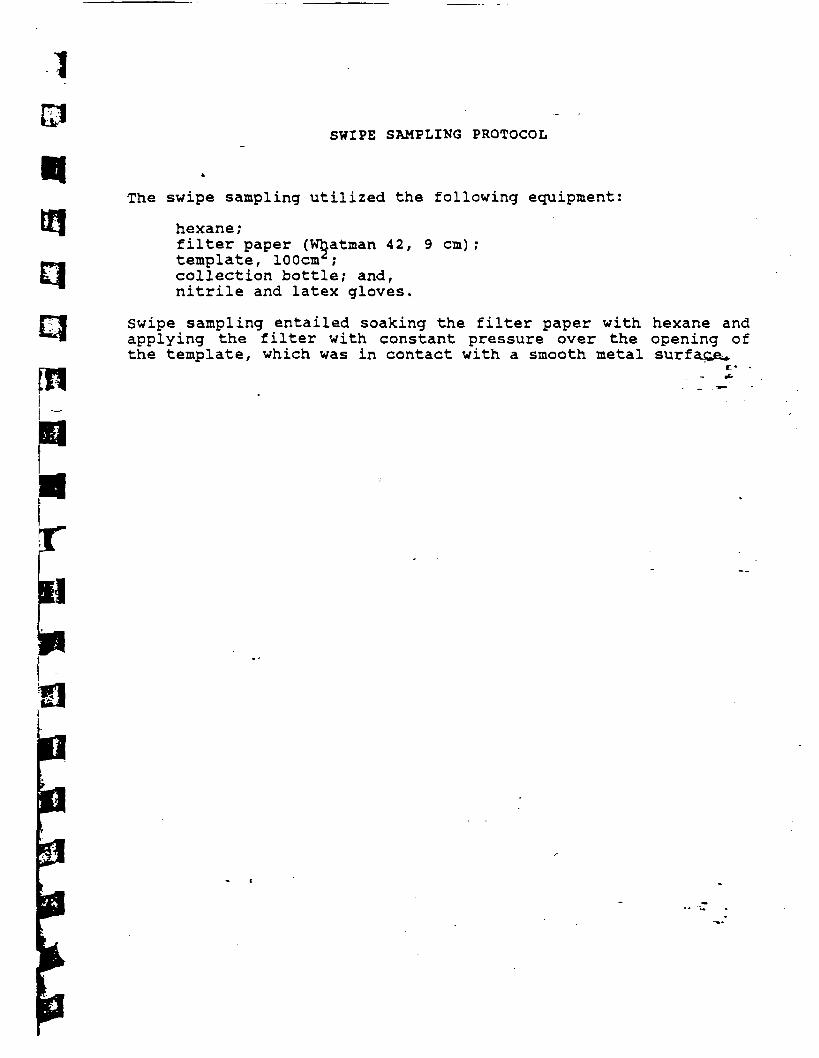
•ISWIPE SAMPLING PROTOCOL
The swipe sampling utilized the following equipment:
hexane;filter paper (Whatman 42, 9 cm);template, 100cm2;collection bottle; and,nitrile and latex gloves.
Swipe sampling entailed soaking the filter paper with hexane andapplying the filter with constant pressure over the opening ofthe template, which was in contact with a smooth metal surface*

ATTACHMENT E
AIR MONITORING - QUAP
65

QUALITY ASSURANCE PROJECT PLAN
AMBIENT AIR MONITORING AROUNDSUMMIT EQUIPMENT AND SUPPLY COMPANY
AKRON, OHIO
1.0 BACKGROUND AND PROJECT DESCRIPTION
Emergency removal of PCS-contaminated electrical equipment has occurred onthe property of the Summit Equipment and Supply Company in Akron, Ohio, betweenMarch 10, 1987, and continues as of this writing. Out of concern about localimpacts of volatilized or particulate-bound PCS emissions to ambient air aroundthis facil i ty, EPA, through its Technical Assistance Team (TAT, Roy r-F:; .Weston,Inc.) is to conduct air monitoring for seven days at f ive sites near tjjfe Summitfacil ity. The exact location of each sampling site is to be determined day byday depending upon local weather conditions and activit ies occurring within thefacility.
2.0 PROJECT ORGANIZATION AND RESPONSIBILITY
Project Manager: Ralph Oollhopf, EPA Region V WMD, EERU
As On-Scene Coordinator, responsible for oversight or remedial activity atthe Summit site, preparation of O'verall assessments of the effectiveness .ofcleanup, and evaluat ion of impacts of past and.current activities on surroundingenvi ronmental ' features and population.
F ie ld Sampl ing and Field Quality Assurance: Larry Mencin, WestonJerry Klein, Weston
Responsible for collection of environmental samples; developing andimplementing a field quality assurance program; shipping samples from the fieldto the selected analytical laboratory; maintaining sampling and custody records;and preparing reports of field activities and quality assurance for the projectmanager.
Laboratory Analysis and Laboratory Quality Assurance: Sally Matz, Weston
Responsible for selection of suitable; laboratory to conduct analysesaccording to established procedures and employing appropriate quality assurancechecks; delineating conditions for precision, accuracy, blanks recovery effici-ency, and other parameters necessary to evaluate data quality; oversight ofcontractor laboratory performance; and final evaluation of the analyticalreport provided by the selected contractor laboratory.
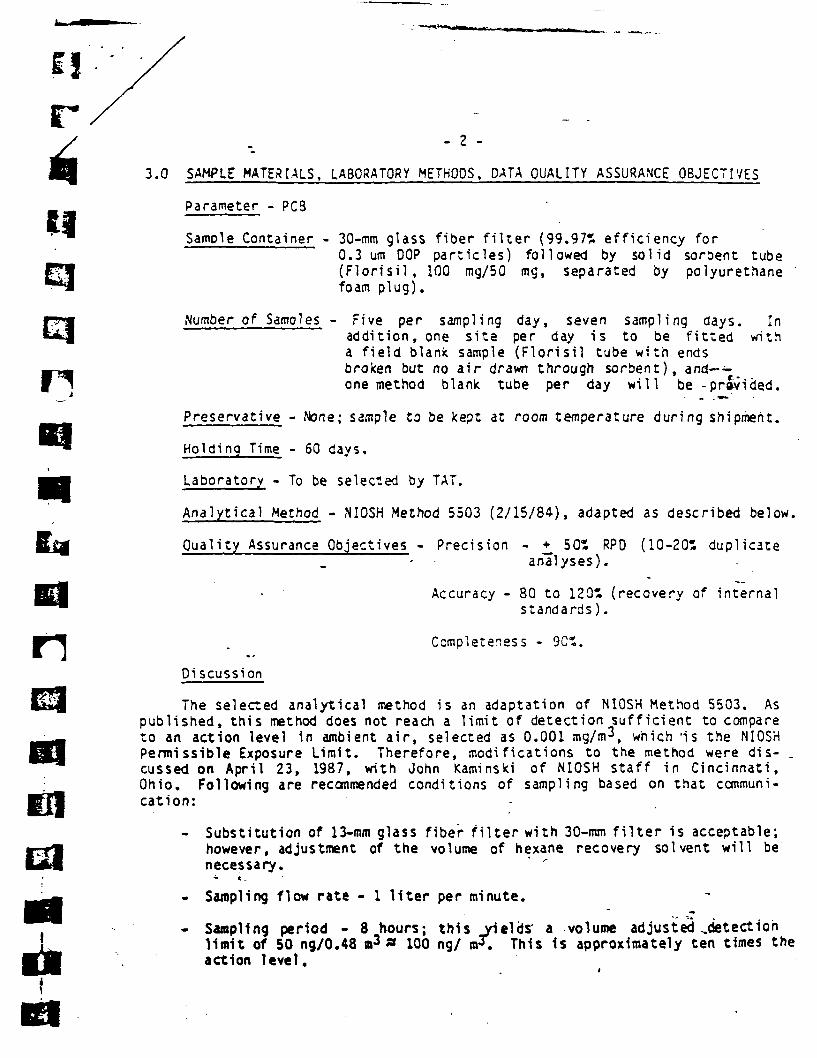
n
- 2 -
3.0 SAMPLE MATERIALS, LABORATORY METHODS. DATA QUALITY ASSURANCE OBJECTIVES
Parameter - PCS
Sample Container - 30-mm glass fiber filter (99.97% eff iciency for0.3 urn OOP particles) followed by solid sorbent tube(Florisil, 100 mg/50 mg, separated by polyurethane 'foam plug).
Number of Samples - Five per sampling day, seven sampling days. Inaddition, one site per day is to be fitted witha field blank sample (Florisil tube wi th endsbroken but no air drawn through sorbent), and— —one method blank tube per day will be -provided.
Preservative - None; sample to be kept at room temperature during shipment.
Holding Time - 60 days.
Laboratory - To be selected by TAT.
Analytical Method - NIOSH Method 5503 (2/15/84), adapted as described below.
Quali ty Assurance Objectives - Precision - ^ 50% RPO (10-20% duplicateanalyses).
Accuracy - 80 to 120% (recovery of internalstandards).
Completeness - 9C%.
Discussion
The selected analytical method is an adaptation of NIOSH Method 5503. Aspublished, this method does not reach a limit of detection suff icient to compareto an action level in ambient air, selected as 0.001 mg/m3, which 'is the NIOSHPermissible Exposure Limit. Therefore, modifications to the method were dis- _cussed on April 23, 1987, with John Kaminski of NIOSH staf f in Cincinnati,Ohio. Following are recommended conditions of sampling based on that communi-cation:
- Substitution of 13-mm glass fiber filter with 30-mm filter is acceptable;however, adjustment of the volume of hexane recovery solvent will benecessary. ' "
~ K _
- Sampling flow rate - 1 liter per minute.
- Sampling period - 8 hours; this yields' a volume adjusted ^detectionlimit of 50 ng/0.48 m3 » 100 ng/ nH. This is approximately ten times theaction level.
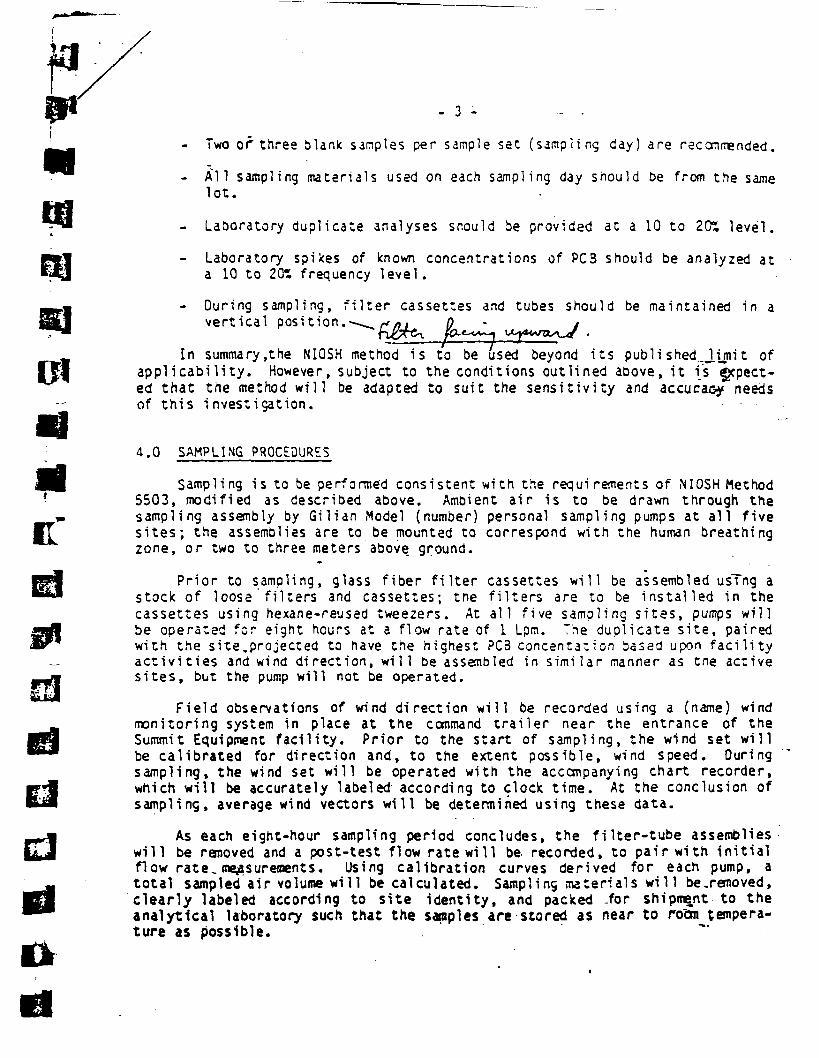
- 3 -
- Two 01* three blank samples per sample sec (sampl ing day) are recommended.
All sampling mater ials used on each sampling day should be from the samelot.
- Laboratory dupl icate analyses sr.ould be provided at a 10 to 20% level.
- Laboratory spikes of known concentrations of PC3 should be analyzed ata 10 to 20t frequency level.
- During sampling, filter cassettes and tubes should be maintained in avertical position.->
In summary, the NIOSH method is to be used beyond its pub li shed Jhjnit ofapplicability. However, subject to the conditions outlined above, it fs e^cpect-ed that the method will be adapted to suit the sensitivity and accuracy needsof this investigation.
4.0 SAMPLING PROCEDURES
Sampling is to be performed consistent wi th the requirements of NIOSH Method5503, modified as described above. Ambient air is to be drawn through thesampling assembly by Gi l ian Model (number) personal sampling pumps at all f ivesites; the assemblies are to be mounted to correspond with the human breathingzone, or two to three meters above, ground.
Prior to sampling, glass fiber filter cassettes wi l l be assembled usTng astock of loose f i l ters and casse t tes ; the f i l ters are to be installed in thecassettes using hexane-reused tweezers. At all f ive sampling sites, pumps willbe operated for eight hours at a flow rate of 1 Lpm. The duplicate site, pairedwith the site. projected to have the highest PC3 concentat ion basad upon facil ityactivities and wind direction, will be assembled in similar manner as tne activesites, but the pump will not be operated.
Field observations of wind direction will be recorded using a (name) windmonitoring system in place at the command trailer near the entrance of theSummit Equi potent facility. Prior to the start of sampling, the wind set willbe calibrated for direction and, to the extent possible, wind speed. Duringsampling, the wind set will be operated with the accompanying chart recorder,which will be accurately labeled according to clock time. At the conclusion ofsampling, average wind vectors will be determined using these data.
As each eight-hour sampling period concludes, the filter-tube assemblieswill be removed and a post-test flow rate will be recorded, to pair with initialflow rate, measurements. Using calibration curves derived for each pump, atotal sampled air volume will be calculated. Sampling materials will be^removed,clearly labeled according to site identity, and packed -for shipment to theanalytical laboratory such that the samples are stored as near to room tempera-ture as possible.
utl
- 4 -
5.0 SAMPLE CUSTODY
Environmental samples are to be maintained under custody (secur i ty) by thefield sampling team at all times from collection through shipment to thelaboratory. In the field, this will require frequent survei l lance of eachsampling site to guard against tampering by outside parties; where applicable,samples will be taken from areas in which the sampling assemblies can bemaintained in a secure, locked area.
Shipping of samples will be accomplished using standard EPA custodydocuments, appropriately completed and signed, and shipping containers are tobe secured with suitable locks or breakable seals.
6.0 CALIBRATION PROCEDURES AND FREQUENCY .'.'.-* -
Each sampling pump will be calibrated before and after each sampling day,and a log of daily calibration curves will be maintained by the field samplingteam. The wind set wi l l be calibrated for w ind direction and speed before andafter tne study, or as necessary if apparent damage occurs to the shipment.
In the laboratory, calibration of analyt ical equipment is to follow therequirements of NIQSH Method 5503, appropriately modified in view of the alteredsampling f low rate and time described aoove. Modif icat ion to Method 5503 shallbe recommended by the laboratory quality assurance contact, and adopted afterconsultation with the EPA quality "assurance coordinator.
7.0 ANALYTICAL PROCEDURES
The analytical laboratory wi l l adapt NICSH Me'roc 5503 to the needs ofthis investigation, in consultation with the EPA quali ty assurance coordinator.
8.0 DATA REDUCTION, VALIDATION. AND REPORTING
Prior to the start of sampling, a set of data forms will b6 adopted torecord the following:
- Sampling location, date, and time of start and end.
- Overall wind conditions, temperature, barometric pressure.
Identity of sampling equipment - pump serial number, filter, andglass tube serial number.
— i .
- Sampling personnel identity.
- Miscellaneous observations such as unusual activities within theSummit facility.

f y''
The analytical laboratory will report each analyzed sample in terms ofdetected concentration of PCS and detection limit, and all pertinent qualityassurance data including internal standard recovery ef f ic iency, results, ofduplicate analyses, analyses of known spikes, and the like. Each analysis forwhich the established quality assurance criteria are not met will be clearlylabeled by the laboratory.
9.0 INTERNAL QUALITY CONTROL CHECKS
As described above, the laboratory will follow prescribed procedures.Field audits are not anticipated owing to the brevity of the study, the-p^visionof daily sampling pump calibrations, and the level of blank samples.- *
10.0 PERFORMANCE AND SYSTEM AUDITS
See 9.0 above.
11.0 PREVENTIVE MAINTENANCE
The condition of field sampling equipment will be checked and repaired asnecessary before and after each sampling period. The laboratory will followestablished preventive, maintenance procedures, with deviations cleared throughthe EPA quality assurance coordinator prior to execution.
12.0 SPECIFIC ROUTINE PROCEDURES TO ASSESS DATA PRECISION, ACCURACY. AND
See Sections 3.0 and 8.0.
13.0 CORRECTIVE ACTION
The field and laboratory contacts will be responsible for identifying andcommunicating needs for corrective action to the project manager.- The projectmanager will then execute the corrective actions in consultation with the EPAquality assurance coordinator.
14.0 QUALITY ASSURANCE REPORTS TO MANAGEMENT
The presentation of quality assurance-related data to the project managershall be in a. form sufficient to enable informed judgments as to the suitabilityof each data point in this investigation, including the completeness of theentire data set. " ., -r .
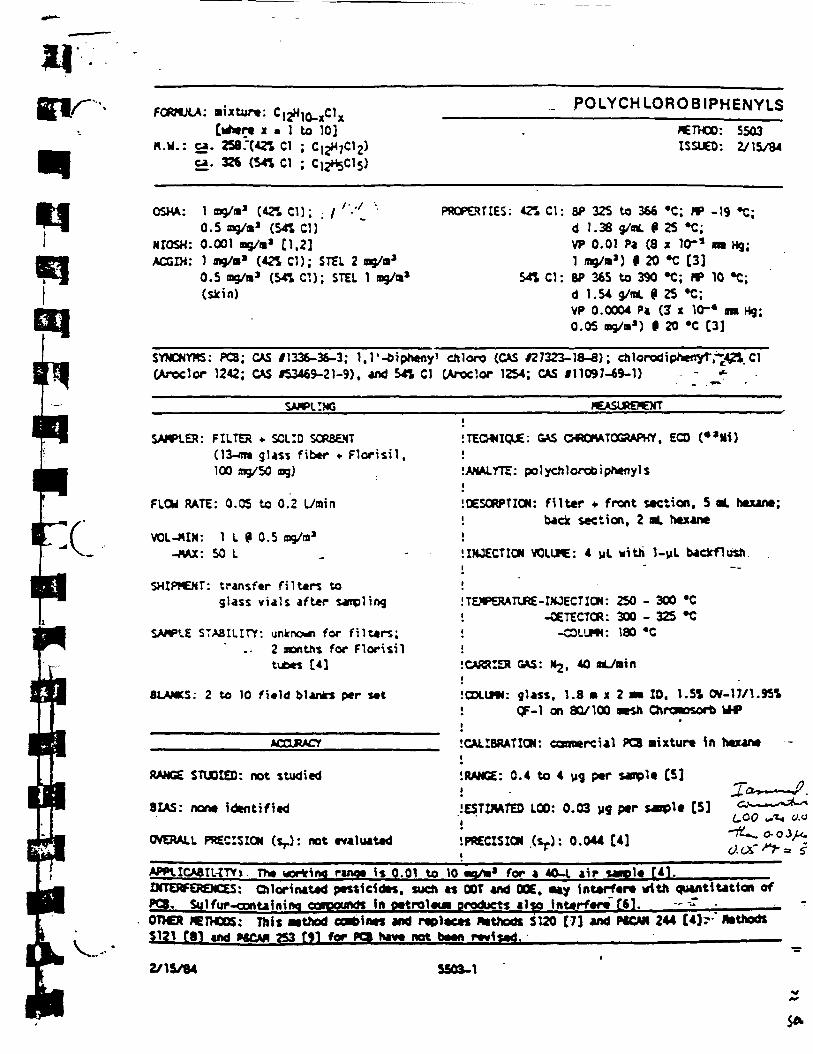
IISir
M
FCRHJLA: •ixture:[where i « 1 to 10]
«.«.: cj. 2S8?(42l d ;«. 3» (54* C1 ;
POLYCHLOROBIPHENYLS
HETWCO: 5503ISSUED: 2/15/84
OSHA: 1 o>9/»J (421 CD; . / ''•''0.5 ng/a* (541 CD
HIOSH: 0.001 «g/m» [1.2]ACGIH: 1 mg/B1 (421 CD; STEL 2 ng/»3
0.5 ng/m3 (541 CD; STEL 1 ng/ma
(skin)
PROPERTIES: *?. Cl: BP 325 to 366 »C; HP -19 «C;d 1.38 9/nL 9 25 »C;VP 0.01 Pa (8 x 10-* m Hg;1 mg/rn3) « 20 »C [3]
541 Cl: BP 365 to 390 «C; flP 10 «C;d 1.54 9/m 9 25 »C;VP 0.0004 P» (3* x 10-* m Hg;0.05 wg/m1) I 20 «C [3]
SYNCMYXS: PCS; CAS / 1336-36-3; l,1'-£)ipfteny' cftloro (CAS *27323- 18-8) ;CAroclop 1242; CAS 153469-21-9) . and 541 Cl (Anx!or 1254; CAS »1109 7-69-1)
,-. Cl
SAMPLING (CASUREJOTT
SAWDER: FILTER * SOLID SCR8EHT(13-nn glass fiber * Florisil,100 oig/SO o>g)
FLQy RATE: 0.05 to 0.2 L/min
VOL-HIN: 1 L 9 0.5 og/n1
-«AX: 50 L
SHIPtCHT: transfer filters toglass vials after sarrpling
SAMPLE STABILITY: unknown for filters;2 aontns for Florisiltubes [4]
BLANKS: 2 to 10 field blank* per set
ACCLRACY
RANGE STUDIED: not studied
BIAS: none identified
OVERALL PRECISION (*,.): not evaluated
STEOWIQUE: GAS Q*C*ATCCRAPHY, ECO (*"Mi)i
IANAJ.YTE: polychlorobiphenylsi
iOESCRPTICN: filter + front section, S «L hexane;1 back section, 2 wL hcxanei
! INJECT ION VOLUME: 4 yL with 1-yL backflush
!TEMPERATURE-INJECTION: 250 - 300 «C! -OETECTCR: 300 - 325 «Ci -C3LLW: 180 "CI
!CARRIER GAS: Hj. 40 «UminI
<OXUm: glass. 1.8 • x 2 •• ID. 1.51 0V-17/1.951< CF-1 on 80/100 aesh QtrcMOSorb wH>
CALIBRATION: connercial PCS Mixture In hexane
RANGE: 0.4 to 4 yg per sample [5]
ES7IMTED LCD: 0.03 yg per sample [S]
'PRECISION .(S-): 0.044 [4]
rinqe U 0.01 to 10 «q/»» for a 4Q-L air sarole f4l.APPtICABIHTV> The .INTERFERENCES: Chlorinated pestle low, sucft as DOT and 006. aty interfere with quaittlutlon ofPC8. S«1 fur -containing compound* in petrolem products also interfere f 61. *OTtCR HETHXS: This Mttod cari»ints and repleces Methods 5120 [7] and PICM 244 (4]r Ntthods
rai and P«CAH 2S3 f9l for PO have not been revised. ;
2/15/84 5503-1
ATTACHMENT F
QA/QC PLAN
j*66

QUALITY ASSURANCE/QUALITY "CONTROL PLAN
SUMMIT "EQUIPMENT tAND SUPPLIESAKRON, 23HIO
Roy. f. W«ston. Inc.SPILL PREVENTION « EMERGENCY RESPONSE DIVISION
In association with ICF. Inc., Jacobs Engineering. Inc. A Tetra Tech. Inc.
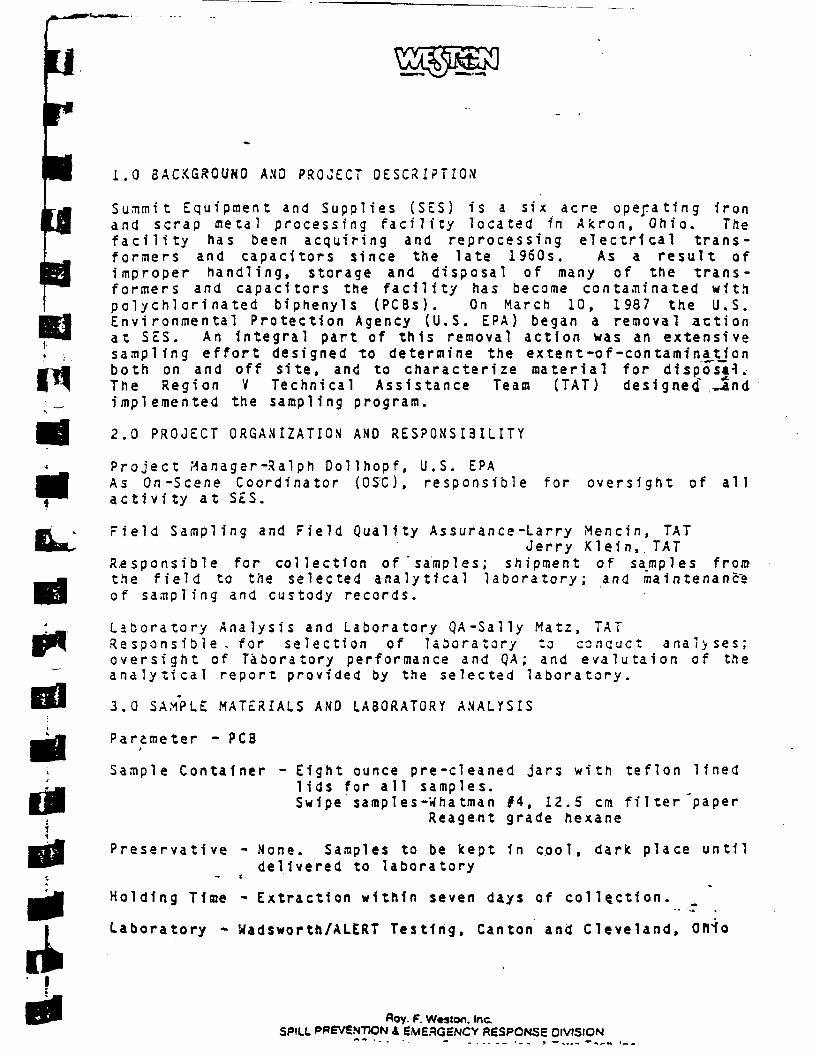
ifat
1.0 BACKGROUND AND PROJECT DESCRIPTION
Submit E q u i p m e n t and S u p p l i e s (SES) is a six acre operating fronand scrap metal processing facility located in Akron, Ohio. Thef a c i l i t y has been acquiring and reprocessing electrical trans-formers and capacitors since the late 1960s. As a result ofimproper handling, storage and disposal of many of the trans-formers and capacitors the facility has become contaminated withpolychlorinated biphenyls (PCBs). On March 10. 1987 the U.S.Environmental Protection Agency (U.S. EPA) began a removal actionat SES. An Integral part of this removal action was an extensivesampling effort designed to determine the extent-of-contaminatjonboth on and off site, and to characterize material for dlsp'ostl.-The Region V Technical Assistance Team (TAT) designedI ~andimplemented the sampling program.
2.0 PROJECT ORGANIZATION AND RESPONSIBILITY
Project Manager-Ralph Dollhopf, U.S. EPAAs On-Scene Coordinator (OSC), responsible for oversight of alla c t i v i ty at SES.
F ie ld S a m p l i n g and F ie ld Qua l i t y A s s u r a n c e - L a r r y Menc in , TATJerry Kle in, TAT
R e s p o n s i b l e for co l lec t ion of " s a m p l e s ; sh ipment o f samples f romthe f i e l d to the s e l e c t e d ana l y t i ca l l abo ra to ry ; and ma in tenanceo f s a m p l i n g and cus tody reco rds .
L a b o r a t o r y A n a l y s i s a n d L a b o r a t o r y Q A - S a l l y Matz , T A TR e s p o n s i b l e , f o r s e l e c t i o n o f l a b o r a t o r y t o c o n c j c t a n a l y s e s ;o v e r s i g h t o f T a b o r a t o r y p e r f o r m a n c e and QA; and e v a l u t a i o n o f thea n a l y t i c a l repo r t p r o v i d e d by the s e l e c t e d labora to ry .
3 . 0 S A M P L E M A T E R I A L S A M D L A B O R A T O R Y A N A L Y S I S
Pa rame te r - PCS
S a m p l e Conta iner - Eight ounce p r e - c l e a n e d jars w i th te f l on l inedl i d s f o r a l l s a m p l e s .Swipe s a m p l e s - W h a t m a n #4, 12.5 cm f i l ter 'paper
Reagen t grade hexane
P r e s e r v a t i v e - None . S a m p l e s to be kept In cool , dark p lace untilde l ivered to labora tory
- «
Holding Tine - Extraction wltnln seven days of collection.
Laboratory - Wadsworth/ALERT Testing, Canton and Cleveland, Onio
Roy. F. Weaton. Inc.SPILL PREVENTION A EMERGENCY RESPONSE DIVISION
7 . 0 A N A L Y T I C A L P R O C E D U R E S
W a d s w o r t h was r e q u e s t e d to and c a r r i e d ou t the r e q u e s t e d a n a l y s i su s i n g E ? A - a p p r o v e d p r o t o c o l f o r p r e p a r a t i o n , a n a l y s j - s , s to rageand p r e s e r v a t i o n o f the s a m p l e s . U .S . EPA Method 3080 was used toana l yze the s o l i d s and o i ls w h i l e Method 608 was used fo r wa te r .The labora tory routinely per fo rmed a l l the Q A / Q C that W a d s w o r t hrequ i res in their Q A / Q C Statement inc luding b l a n k s , m a t r i x s p i k e s ,and natrix s p i k e dup l i ca tes . A l l ca l cu la t i ons and Q A / Q C was ve r i -f i ed by the Labo ra to ry Q A / Q C Coord ina tor at W a d s w o r t h prior to thereport submisss ion. The soil samples were ana lyzed on a drywe igh t bas i s and homogen ized by the lab pr ior to a n a l y s i s .Detec t ion limits were set at 1 ppm barr ing matr ix interference.*.
r - -
8.0 DATA VALIDATION AND REPORTING ."_"..-* '-
Wadsworth reported each analyzed sample in terms of detectableconcentration of PCS and detection limits. A summary of QA datawas reported and included results of blanks, matrix spikes, matrixspike d u p l i c a t e s and internal standard recovery. Verbal data wasreported by Wadsworth within 24 hours of sample receipt to aid inthe removal action activities at SES but this data was utilizedonly with the knowledge that it was verbal data and had not beensubject to the final QA/QC review. The analytical reports andQA/QC summary were subject to QA/QC review by the TAT to ensurethat the data met all the requfreinents of the project.
9.0 QUALITY CONTROL CHECKS
As an additional check on the labs QA/QC theQC samples along with the routine samples.QC samples we're sent into the lab "blind",utilized by the TAT included:
TAT i n c l u d e d its ownTne ma jcri ty of the
The QA/QC samples
Field blank - sample transported to the s a m p l i n g location andback, carried throught the entire sampling procedure and stored
that no contamination was introducedof samples. Also allows a limitedAt the time of sampling, a universal
so a soil blank was not submitted to
wit.l the samples. Verifiesduring sampling or storagecheck for lab contaminants,soil blank was u n a v a i l a b l ethe- laboratory.
Field Duplicates - a second sample of one location submitted tothe lab "blind". Verifies the lab's analytical precision byacting as an external check. Also provides an indication of thevariation fn 'sample collcection procedures. Approximately 5.-10Sof the samples collected were duplicates. Attachment B containsthe S£S Duplicate Log. . "'"' :
Resultsqualitythe TAT 1
of the QCanalyticals sampling
samples Indicated that the labdata. The samples also gave anprocedures.
was providingIndication of
Roy. P. W«aton. Inc.SP'U. PREVENTION & EMERGENCY RESPONSE DIVISION
*3kTTACHMEirr A
"SEAT ISAHPLE HANDLING PROTOCOL
I
\
•tf
ATTACHMENT 3
DUPLICATE LOG
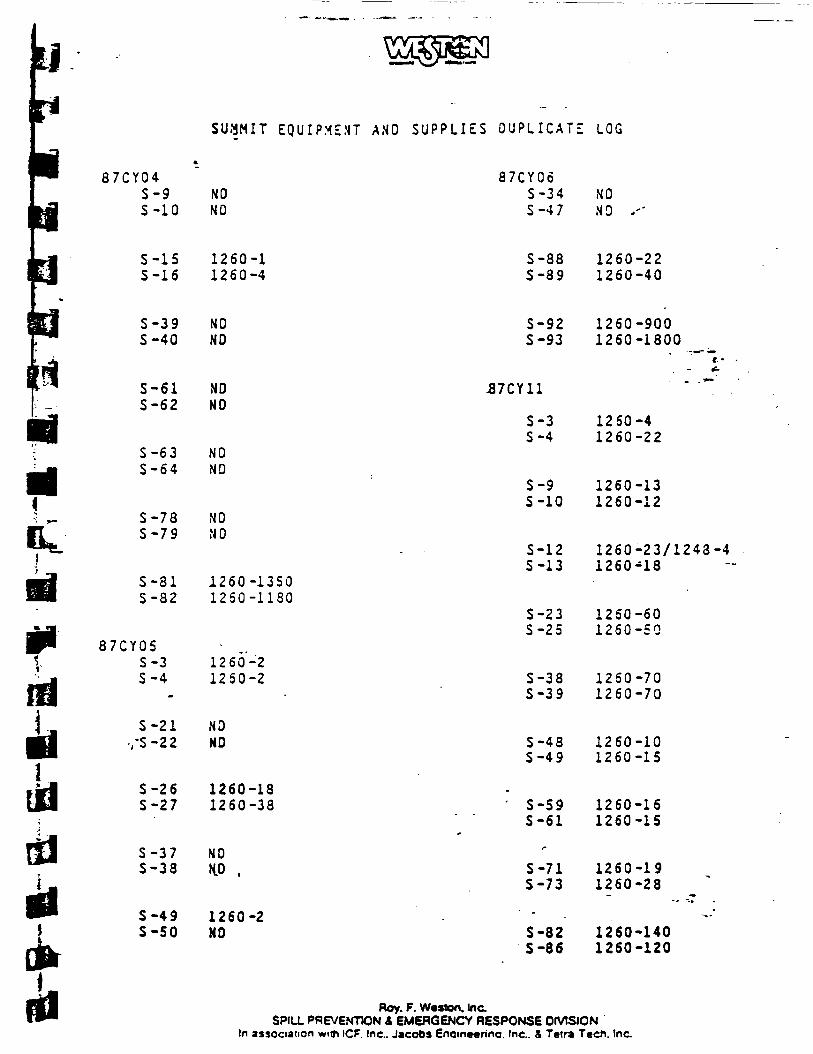
SUMMIT EQUIPMENT AND SUPPLIES DUPLICATE LOG
8 7 C Y 0 4S-9S-10
NDNO
8 7 C Y 0 6S-34 NOS -4 7 MD
S-15S-16
1260-11260-4
S-88S-89
1260-221260-40
ft
fld.<ti!
S-39S-40
S-61S-62
S-63S - 6 4
S-78S - 7 9
S-81S-82
8 7 C Y 0 5S-3S-4
S-21,'S-22
S-26S-27
N ONO
NON O
N ON D
NDND
1260-13501250-1130
1260-21250-2
N ONO
1260-181260-38
S-92S-93
-87CY11
S-3S-4
S-9S-10
S-12S-13
S-23S-25
S-38S-39
S-48S-49
S-59S-61
1260-9001260-1800
r-•=•
1260-41260-22
1260-131260-12
1260-23/1243-41260-18
1250-601260-50
1250-701260-70
1260-101260-15
1260-161260-15
S - 3 7S-38
S-49S-50
N ONO ,
1260-2NO
S-71S-73
S-82S-86
1260-191260-28
1260-1401260-120
Roy. F. Wcston. inc.SPILL PREVENTION A EMERGENCY RESPONSE OMSJON
In association with ICF. Inc.. Jacobs Enom*«rina. inc.. & Terra Teen. Inc.

SUMMIT EQUIPMENT AND SUPPLIES DUPLICATE LOG
8 7 C Y 1 1S-93 1260-2S-95 1260-3
S-99 ND
8 7 C Y 1 2S-l NO
S-8 KDS-l 2 ND
1*I, Roy. F. Wcston. Inc.
SP1U. PREVENTION & EMERGENCY RESPONSE DIVISION
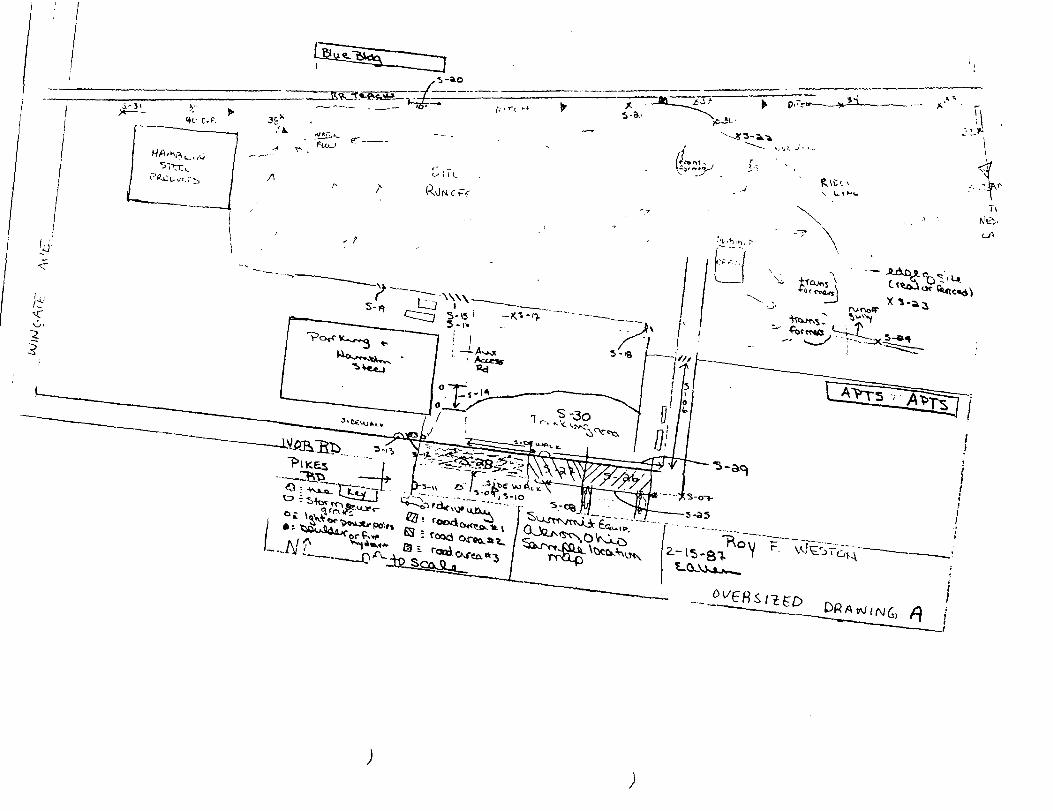
[u
^
te<
1 ^L1 <K> C.P.
/
1 /
~
^"ld .,,0"••"rcTr^
I'l^C.ui.Vx.
w — *" «>• "~ ,..r,n ^ X. ~
* 3£x - ' *•*','A. — '—~ I ' ** ^/A- t.| '-^ or
; ^ _^ FuuJ ^j _.? ^ .
f f'
\ A ^IM_ .
/ " ? ROPJCFF
.^ ^ p,1>Jt-
0±
-Jf3.-a.-a
; : y _ .'.= ' ^ ,_/ ~~- . .vl -
[*n>ii.V"r>
R \ C c >v U » *"*-
r .T--\\\\."" c^i., ^^-'1
I V
Mft.eft
rury>«r
f^VJ.uCt^«?8u,c^^X "i-aa