Embed Size (px)
Citation preview
for State & Local Government Fall 2014
Esri News
continued on page 3
Maryland is a progressive state that has been opening data to the public since 2009. Recently, the Department of Information Technology created the GIS Data Catalog with ArcGIS Open Data to simplify publishing and consuming open GIS data (data.imap.maryland.gov). The GIS Data Catalog was launched just after Governor Martin O’Malley signed legislation requiring open data to be machine readable and released to the public in ways that make the data easy to find, access, and use. “We’ve published map services for years, but the data was hard for users to access and query,” said Barney Krucoff, geographic information officer, State of Maryland. “We’re using ArcGIS Open Data to make our data much more open than it has been. It wasn’t that we didn’t want to do it before—we just didn’t have a good way to manage it.” The GIS Data Catalog is designed to serve the needs of the general public and sophisticated GIS users including staff in state agencies and architecture, engineer-ing, and environmental professionals. The improved search capabilities with ArcGIS Open Data were a big draw for the state. They include searchable layers and searching within the map. “By having searchable layers, it allows us to consolidate the way we publish our data, makes the process more efficient, and offers a better way of presenting the data
Maryland Makes Open Data Easier to Find and UseArcGIS Open Data Supports State’s Open Data Initiatives
compared to what we were doing before,” said Krucoff. ArcGIS Open Data also fits the way the state manages its geospatial data. GIS data stored in a geodatabase is tied directly to the GIS Data Catalog, which simplifies publishing it. The data never has to be moved. The GIS Data Catalog
features up-to-date, authoritative data available in a variety of formats including spreadsheets and shapefiles. Developers also have the ability to build applications using the ArcGIS Open Data API. Users can subscribe to get notified of updates on a particular dataset.
Maryland is using ArcGIS Open Data to make GIS data available to citizens, staff in government agencies, and developers who build applications.
2 Esri News for State & Local Government Fall 2014
Fall 2014
The information contained in this work is the exclusive property of Esri or its licensors. This work is protected under United States copyright law and other international copyright treaties and conventions. No part of this work may be reproduced or transmitted in any form or by any means, electronic or mechanical, including photocopying and recording, or by any information storage or retrieval system, except as expressly permitted in writing by Esri. All requests should be sent to Attention: Contracts and Legal Services Manager, Esri, 380 New York Street, Redlands, CA 92373-8100 USA.
The information contained in this work is subject to change without notice.
The Geographic Advantage, Esri, the Esri globe logo, 3D Analyst, ArcAtlas, ArcCatalog, ArcData, ArcDoc, ArcEditor, ArcExplorer, ArcGIS, the ArcGIS logo, ArcGlobe, ArcIMS, ARC/INFO, ArcInfo, ArcLogistics, ArcMap, ArcNetwork, ArcNews, ArcObjects, ArcPad, ArcPress, ArcReader, ArcSDE, ArcSurvey, ArcToolbox, ArcTools, ArcUser, ArcView, ArcVoyager, ArcWatch, ArcWeb, ArcWorld, ArcXML, Business Analyst Online, BusinessMAP, Community Analyst, CommunityInfo, Community Maps, EDN, Geography Network, GIS Day, MapData, Maplex, MapObjects, MapStudio, ModelBuilder, MOLE, NetEngine, RouteMAP, SDE, Sourcebook•America, StreetMap, Tapestry, @esri.com, esri.com, arcgis.com, geographynetwork.com, gis.com, and gisday.com are trademarks, service marks, or registered marks of Esri in the United States, the European Community, or certain other jurisdictions.
Other companies and products or services mentioned herein may be trademarks, service marks, or registered marks of their respective mark owners.
Esri News for State & Local Government is a publication of the State and Local Government Solutions Group of Esri.To contact the Esri Desktop Order Center, call 1-800-447-9778 within the United States or 909-793-2853, ext. 1-1235, outside the United States.
Visit the Esri website at esri.com.
View Esri News for State & Local Government online at esri.com/statelocalnews or scan the QR code below with your smartphone.
Advertise with UsE-mail [email protected].
Submit ContentTo submit articles for publication in Esri News for State & Local Government, contact Christopher Thomas at [email protected] or Emily Pierce at [email protected].
Manage Your SubscriptionTo update your mailing address or subscribe or unsubscribe to Esri publications, visit esri.com/publications.
International customers should contact an Esri distributor to manage their subscriptions.
For a directory of distributors, visit esri.com/distributors.
Circulation ServicesFor back issues, missed issues, and other circulation services, e-mail [email protected]; call 909-793-2853, ext. 2778; or fax 909-798-0560.
Contents
Cover
1 Maryland Makes Open Data Easier to Find and Use
Case Study
3 Esri Launches Small Government Departmental Platform Agreement Program
4 Bexar County Grows Business and Develops Tourism
5 Unlocking Smarter Health
5 Partners in Resilience
6 Alachua County Is Thriving with ArcGIS in the Amazon Cloud
8 Multigenerational Households Offer Challenges and Opportunities
10 Meet Este Geraghty
12 Better Than Ever
14 GIS Climate Model Improves Water Management
16 How Do You Get Citizens to Participate in Drought Management?
Smart Communities
18 Roanoke County, Virginia, Builds a Smart Community
Copyright © 2014 Esri.All rights reserved. Printed in the United States of America.
3Fall 2014 esri.com/localgov
Maryland Makes Open Data Easier to Find and Use continued from cover
“When data is open, everything flows faster,” said Krucoff. “It eliminates bu-reaucracy and stovepipes. People don’t need to submit data requests to get what they need. Operational government activities, decision making, and policy making should all be better when we have open data.” Twenty GIS data categories are listed on the home page including agriculture, business economy, health, imagery, transportation, and weather. These are the categories the state has been using for its data for years, based on guidelines from the International Organization for Standardization. “Our users have grown accustomed to seeing our data grouped in these categories, so we wanted to keep that consistent from our old system to our new system,” said Julia Fischer, senior GIS analyst, Maryland Department of Information Technology. To draw attention to high-profile datasets, the state features several on the page including six-inch resolution imagery,
road centerlines, and shaded relief eleva-tion (primarily collected with lidar). “We are featuring lidar, which is a new acquisition for us,” noted Fischer.
“Having it in-house saves us a lot of money. We wanted to centralize it, then communicate its availability to our entire user base.” The state recently hosted a hackathon, DataBay Reclaim the Bay Innovation Challenge, to encourage developers to create apps with open GIS data that will increase public engagement and aid in restoring Chesapeake Bay. Four finalists were selected, and their apps included a crowdsourcing app for tracking Algae blooms and an app that rewards
“When data is open, everything flows faster. . . . Operational government activities, decision making, and policy making should all be better when we have open data.”Barney Krucoff, Geographic Information Officer, State of Maryland
environmentally friendly acts with cou-pons to local businesses. “We are trying to lead the charge in data sharing among the GIS community,” said Fischer. “We want to break down silos and get information flowing across different user communities.”
For more information, contact Julia Fischer, senior GIS analyst, Maryland Department of Information Technology, at [email protected].
Esri’s new Small Government Departmental Platform Agreement program allows unlim-ited deployments of core ArcGIS software within one governmental department. Departments that have plans to integrate GIS in multiple workflows, such as assessors, health and human services, public works, fire, and planning departments, can use this program to rapidly achieve their goals. “Esri is always seeking to support departments that have a real vision for using GIS throughout their operations,” said Christopher Thomas, director of government markets, Esri. “This program
Esri Launches Small Government Departmental Platform Agreement ProgramEffort Aimed to Overcome Budgeting Barriers
helps them get there faster.” This program is ideal for departments that want to • Increase ArcGIS software and software
as a service (SaaS) deployments. • Have flexibility when deploying GIS to
desktops, servers, and mobile devices. • Have a predictable annual licensing
model.The County of Tazewell, Virginia (popula-tion 45,936), was the first to participate.
“This program has given the Tazewell County Engineering Department access to more tools and programs to help
create and maintain better GIS data,” said Kenneth Dunford, assistant county engineer. The Small Government Departmental Platform Agreement program is open to all governments in the United States with populations of 100,000 or fewer.
For more information, call Esri at 800-447-9778.
4 Esri News for State & Local Government Fall 2014
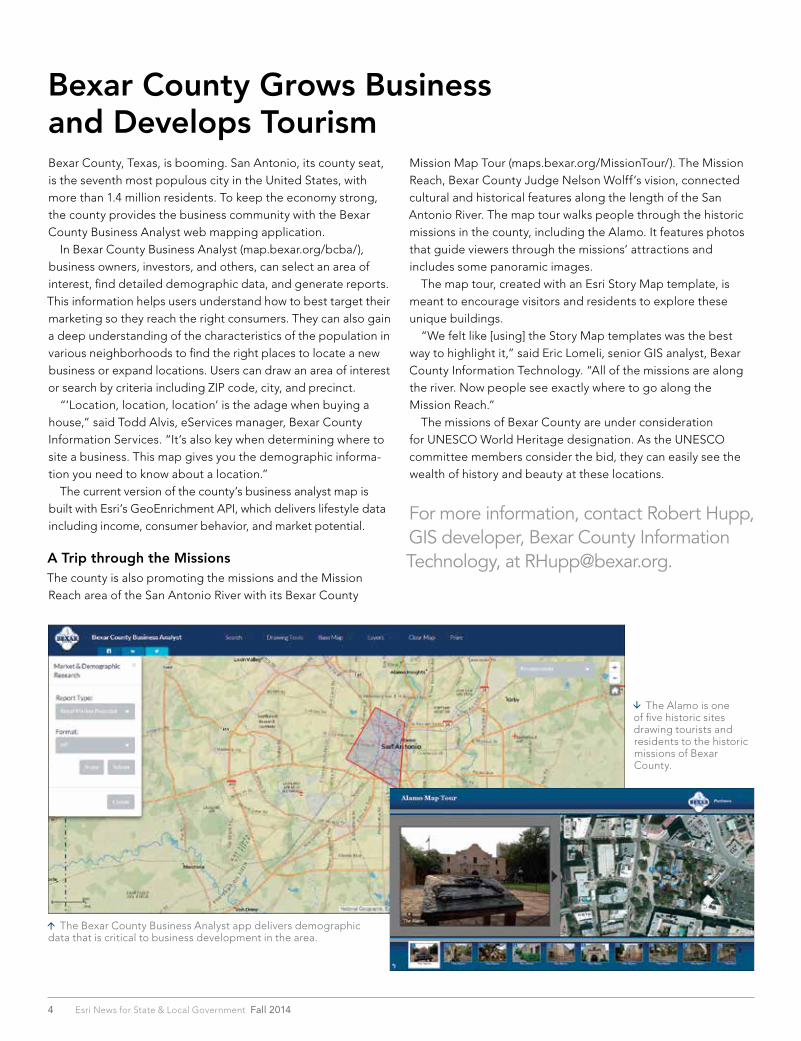
Bexar County, Texas, is booming. San Antonio, its county seat, is the seventh most populous city in the United States, with more than 1.4 million residents. To keep the economy strong, the county provides the business community with the Bexar County Business Analyst web mapping application. In Bexar County Business Analyst (map.bexar.org/bcba/), business owners, investors, and others, can select an area of interest, find detailed demographic data, and generate reports. This information helps users understand how to best target their marketing so they reach the right consumers. They can also gain a deep understanding of the characteristics of the population in various neighborhoods to find the right places to locate a new business or expand locations. Users can draw an area of interest or search by criteria including ZIP code, city, and precinct. “‘Location, location, location’ is the adage when buying a house,” said Todd Alvis, eServices manager, Bexar County Information Services. “It’s also key when determining where to site a business. This map gives you the demographic informa-tion you need to know about a location.” The current version of the county’s business analyst map is built with Esri’s GeoEnrichment API, which delivers lifestyle data including income, consumer behavior, and market potential.
A Trip through the MissionsThe county is also promoting the missions and the Mission Reach area of the San Antonio River with its Bexar County
Bexar County Grows Business and Develops Tourism
Mission Map Tour (maps.bexar.org/MissionTour/). The Mission Reach, Bexar County Judge Nelson Wolff’s vision, connected cultural and historical features along the length of the San Antonio River. The map tour walks people through the historic missions in the county, including the Alamo. It features photos that guide viewers through the missions’ attractions and includes some panoramic images. The map tour, created with an Esri Story Map template, is meant to encourage visitors and residents to explore these unique buildings. “We felt like [using] the Story Map templates was the best way to highlight it,” said Eric Lomeli, senior GIS analyst, Bexar County Information Technology. “All of the missions are along the river. Now people see exactly where to go along the Mission Reach.” The missions of Bexar County are under consideration for UNESCO World Heritage designation. As the UNESCO committee members consider the bid, they can easily see the wealth of history and beauty at these locations.
For more information, contact Robert Hupp, GIS developer, Bexar County Information Technology, at [email protected].
The Bexar County Business Analyst app delivers demographic data that is critical to business development in the area.
The Alamo is one of five historic sites drawing tourists and residents to the historic missions of Bexar County.
5Fall 2014 esri.com/localgov
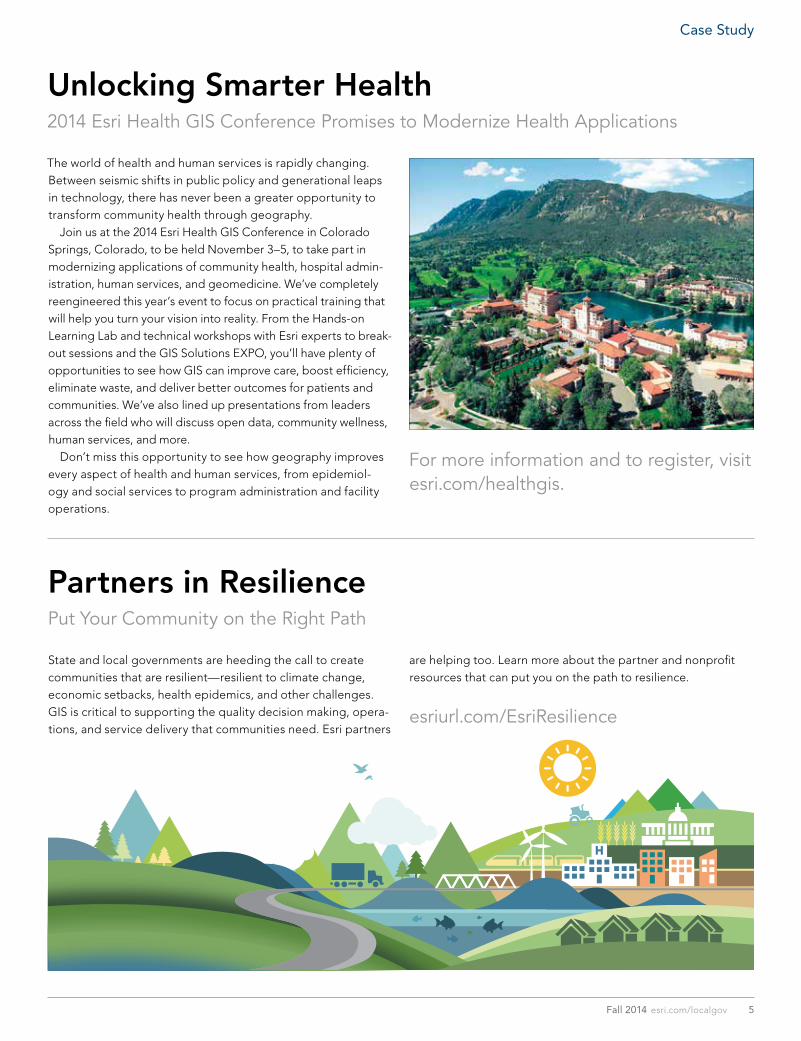
The world of health and human services is rapidly changing. Between seismic shifts in public policy and generational leaps in technology, there has never been a greater opportunity to transform community health through geography. Join us at the 2014 Esri Health GIS Conference in Colorado Springs, Colorado, to be held November 3–5, to take part in modernizing applications of community health, hospital admin-istration, human services, and geomedicine. We’ve completely reengineered this year’s event to focus on practical training that will help you turn your vision into reality. From the Hands-on Learning Lab and technical workshops with Esri experts to break-out sessions and the GIS Solutions EXPO, you’ll have plenty of opportunities to see how GIS can improve care, boost efficiency, eliminate waste, and deliver better outcomes for patients and communities. We’ve also lined up presentations from leaders across the field who will discuss open data, community wellness, human services, and more. Don’t miss this opportunity to see how geography improves every aspect of health and human services, from epidemiol-ogy and social services to program administration and facility operations.
Unlocking Smarter Health2014 Esri Health GIS Conference Promises to Modernize Health Applications
For more information and to register, visit esri.com/healthgis.
Partners in ResiliencePut Your Community on the Right Path
ArcGIS for Agriculture
State and local governments are heeding the call to create communities that are resilient—resilient to climate change, economic setbacks, health epidemics, and other challenges. GIS is critical to supporting the quality decision making, opera-tions, and service delivery that communities need. Esri partners
are helping too. Learn more about the partner and nonprofit resources that can put you on the path to resilience.
esriurl.com/EsriResilience
Case Study
6 Esri News for State & Local Government Fall 2014
Alachua County, Florida, may be best known for the University of Florida in the city of Gainesville. The university has been on a national stage three times in the past 20 years when its football team won national championship titles. The GIS Department in the Alachua County Property Appraiser’s Office has an impressive record too. For the past 20 years, staff have been delivering GIS data and services to all the county’s departments and nine cities. That record was broken recently when power interruptions started to compromise the department’s ability to provide reliable GIS support. When the power went out, it meant county and city staff, including E-911 and Emergency Services, didn’t have the GIS resources they needed. It sometimes took days to get servers back online and the system functioning normally. The Property Appraiser’s Office staff began to consider putting their GIS data and ArcGIS for Server applications in the cloud with Amazon Web Services. “I had concerns about security and how much confidence I could have in putting our data in the cloud, but we were frustrat-ed and felt like we had nothing to lose from a trial of Amazon Web Services,” said Ed Crapo, Alachua County property appraiser.
Alachua County Is Thriving with ArcGIS in the Amazon Cloud
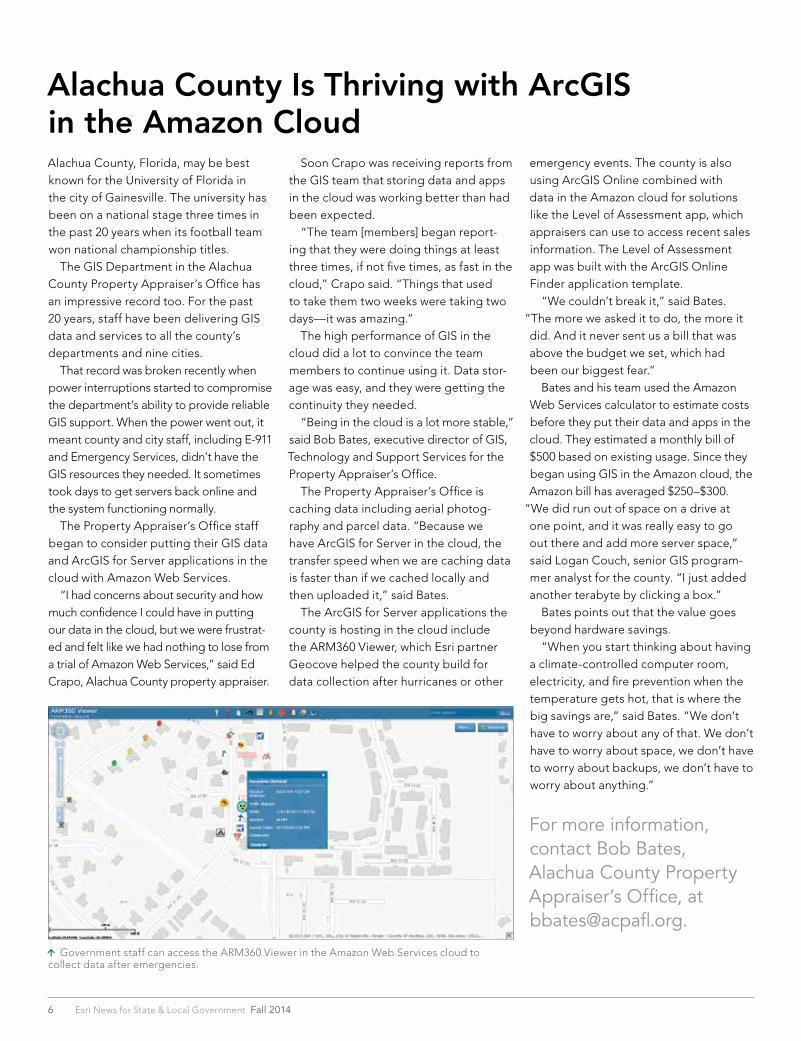
Government staff can access the ARM360 Viewer in the Amazon Web Services cloud to collect data after emergencies.
Soon Crapo was receiving reports from the GIS team that storing data and apps in the cloud was working better than had been expected. “The team [members] began report-ing that they were doing things at least three times, if not five times, as fast in the cloud,” Crapo said. “Things that used to take them two weeks were taking two days—it was amazing.” The high performance of GIS in the cloud did a lot to convince the team members to continue using it. Data stor-age was easy, and they were getting the continuity they needed. “Being in the cloud is a lot more stable,” said Bob Bates, executive director of GIS, Technology and Support Services for the Property Appraiser’s Office. The Property Appraiser’s Office is caching data including aerial photog-raphy and parcel data. “Because we have ArcGIS for Server in the cloud, the transfer speed when we are caching data is faster than if we cached locally and then uploaded it,” said Bates. The ArcGIS for Server applications the county is hosting in the cloud include the ARM360 Viewer, which Esri partner Geocove helped the county build for data collection after hurricanes or other
emergency events. The county is also using ArcGIS Online combined with data in the Amazon cloud for solutions like the Level of Assessment app, which appraisers can use to access recent sales information. The Level of Assessment app was built with the ArcGIS Online Finder application template. “We couldn’t break it,” said Bates.
“The more we asked it to do, the more it did. And it never sent us a bill that was above the budget we set, which had been our biggest fear.” Bates and his team used the Amazon Web Services calculator to estimate costs before they put their data and apps in the cloud. They estimated a monthly bill of $500 based on existing usage. Since they began using GIS in the Amazon cloud, the Amazon bill has averaged $250–$300.
“We did run out of space on a drive at one point, and it was really easy to go out there and add more server space,” said Logan Couch, senior GIS program-mer analyst for the county. “I just added another terabyte by clicking a box.” Bates points out that the value goes beyond hardware savings. “When you start thinking about having a climate-controlled computer room, electricity, and fire prevention when the temperature gets hot, that is where the big savings are,” said Bates. “We don’t have to worry about any of that. We don’t have to worry about space, we don’t have to worry about backups, we don’t have to worry about anything.”
For more information, contact Bob Bates, Alachua County Property Appraiser’s Office, at [email protected].
You know the power of Esri® GIS to improve government decisions and planning. When you add OnBase enterprise content management, vital information in documents, audio, video and other content files is easily accessible from your GIS applications – which means you have the whole picture, in the office and in the field.
Discover how you can use OnBase and Esri to make smarter decisions and achieve better results.
Learn More at OnBase.com/Esri »
Is something missing from your GIS applications?
8 Esri News for State & Local Government Fall 2014
Change has been the constant for the US demographic land-scape recently. One major difference from 2000 to 2010 is the 30 percent increase in multigenerational households. The US Census Bureau defines multigenerational families as those con-sisting of more than two generations living under the same roof. According to Generations United, an organization that focuses on intergenerational issues, one in six Americans currently lives in a multigenerational household. Generations United also notes that this number rose from 46.5 million in 2007 to 51.4 million by the end of 2009—a 10.5 percent increase in just three years. Changes that contributed to this growth include an increasingly diverse population, aging, and lingering effects of the Great Recession. Household size tended to increase in areas that gained population from immigration. For example, multigenerational households are part of the tradition in Hispanic and Asian neighborhoods. Parents go out to work while grandparents stay home to care for the little ones. These seniors may be language-isolated with low cultural assimilation rates. The growth of multigenerational households may also be attributed to the Great Recession. Young people and some married couples with children had to move back home when they either lost jobs or couldn’t find employment, or when their homes were foreclosed. Some early retirees ran through their savings and had to move in with their children. In addition to the effects of immigration and the recession, many frail seniors need constant care and are now living with their children and grandchildren. Because they waited to have kids, many baby boomers are now part of the “sandwich genera-tion,” raising their children while also caring for elderly parents. This household composition change presents myriad chal-lenges and opportunities for government agencies. To provide the right types of services, departments should learn about the demographics and lifestyles of multigenerational households in their jurisdictions. Esri’s Updated Demographics data—age, income, education, employment, race/ethnicity, and other vari-ables—can provide valuable insight. When information about product, service, and media preferences from Esri’s Tapestry Segmentation lifestyle data is added, departments will have a complete picture of these households. How can departments use this type of information? Health departments can study population segments to determine which activities will benefit the most residents. Activities such as diet and exercise classes, flu vaccine campaigns, health screenings, and senior day care can be targeted to local populations. Senior centers can add multicultural activities to encourage participation by seniors of particular ethnic groups. Knowing how to reach differ-ent populations with effective messaging will increase participation.
Multigenerational Households Offer Challenges and Opportunities
Local libraries can determine where to provide programs such as English classes for adults, cultural studies, Internet access, tutoring, and book clubs. Housing departments must consider that large, multigen-erational households may require dwellings with architectural features that can accommodate each generation. Homes may include senior-friendly features such as one-story floor plans, wide doorways, or grab bars for easier mobility. Many house-holds have added space for an elderly relative to simplify care and ensure that the senior is an active member of the household. Fire, rescue, and police departments must know where multi-generational households are located and how to communicate effectively with these residents in case of a disaster. Community outreach activities can be very effective in keeping the popula-tion safe. Savvy economic development staff can pitch the area to companies that sell products for large households. Promoting businesses that serve racially and ethnically diverse populations can also add sales revenue. Differences in household size pro-vide savvy companies with abundant opportunities to market their products to a wider, more diverse group of consumers. To provide the right services, government agencies must be able to identify, locate, reach out to, communicate with, and serve multigenerational households. Demographic and lifestyle data can help agencies do this more effectively. Esri Demographics data is available in ArcGIS Online, Business Analyst, and Community Analyst and through the location analytics products.
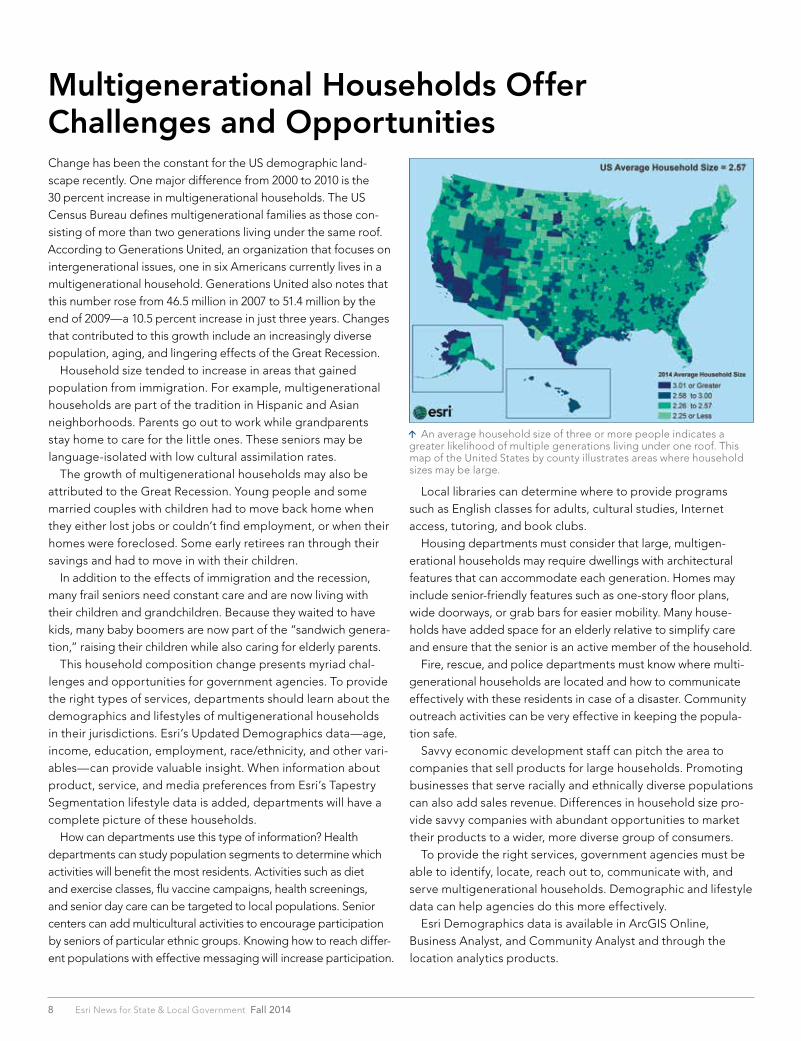
An average household size of three or more people indicates a greater likelihood of multiple generations living under one roof. This map of the United States by county illustrates areas where household sizes may be large.
9Fall 2014 esri.com/localgov 17Spring 2014 esri.com/localgov
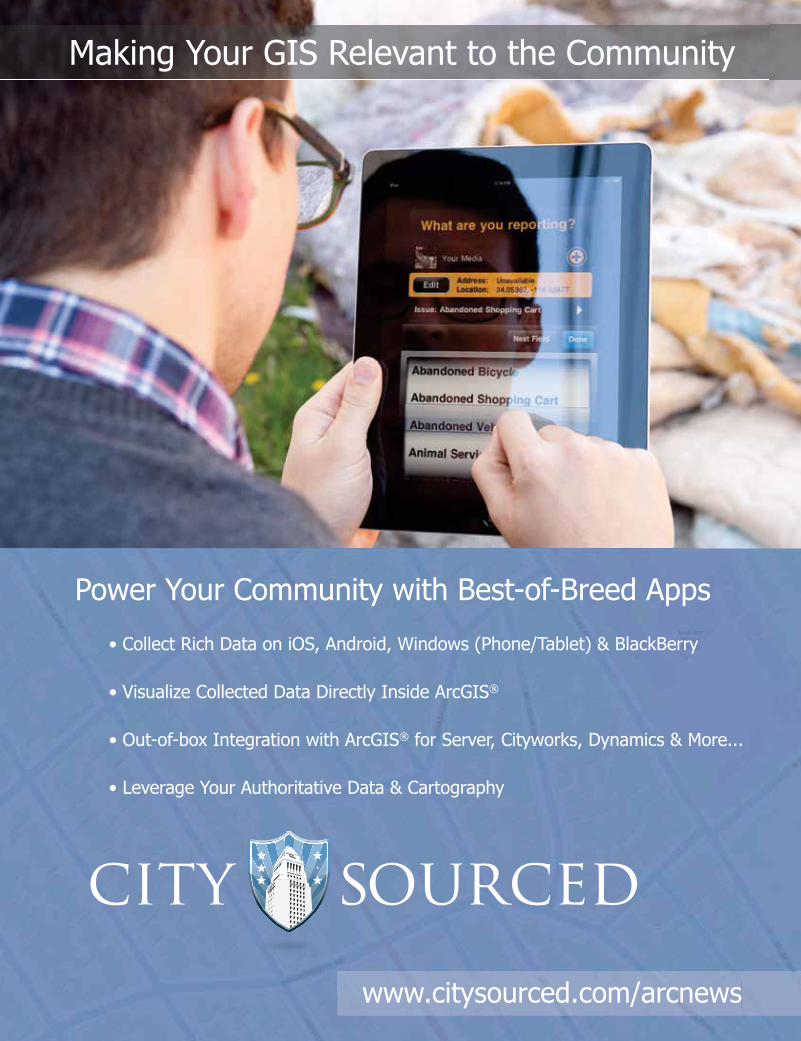
Election Results in Single-Member Constituencies Power Your Community with Best-of-Breed Apps
www.citysourced.com/arcnews
• Collect Rich Data on iOS, Android, Windows (Phone/Tablet) & BlackBerry
• Visualize Collected Data Directly Inside ArcGIS®
• Out-of-box Integration with ArcGIS® for Server, Cityworks, Dynamics & More...
• Leverage Your Authoritative Data & Cartography
Making Your GIS Relevant to the Community
G62525_StateGov_140055_Spring_3-14.indd 17 2/25/14 4:36 PM
10 Esri News for State & Local Government Fall 2014
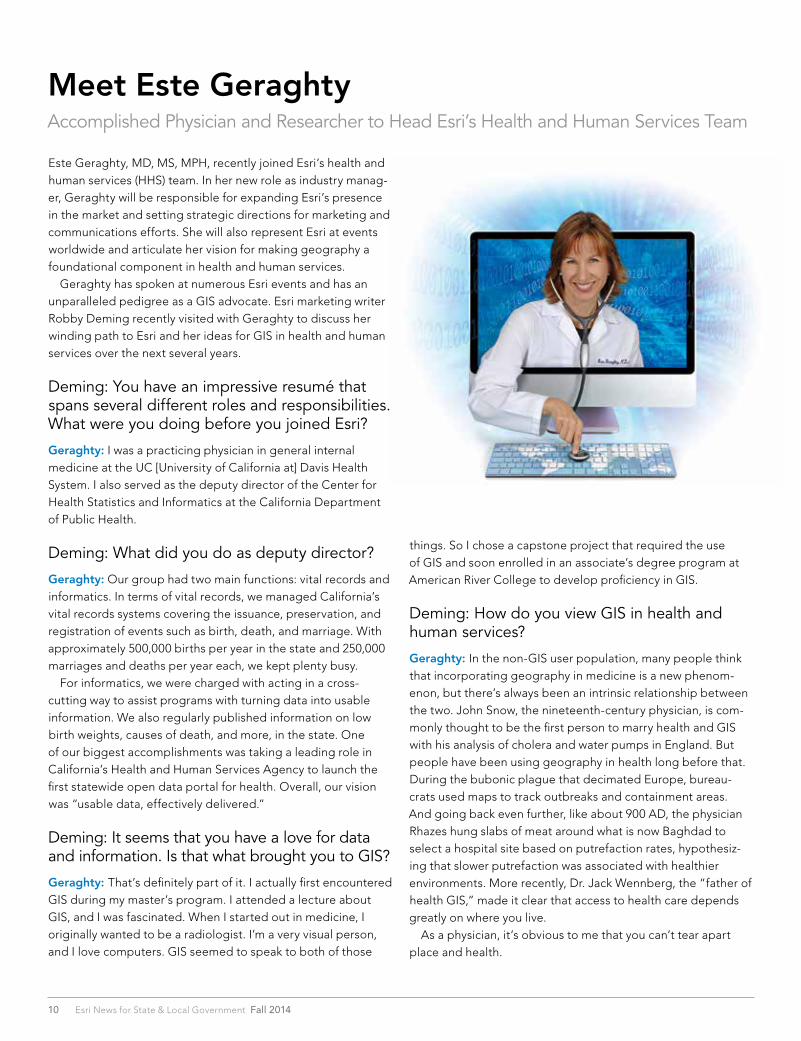
Este Geraghty, MD, MS, MPH, recently joined Esri’s health and human services (HHS) team. In her new role as industry manag-er, Geraghty will be responsible for expanding Esri’s presence in the market and setting strategic directions for marketing and communications efforts. She will also represent Esri at events worldwide and articulate her vision for making geography a foundational component in health and human services. Geraghty has spoken at numerous Esri events and has an unparalleled pedigree as a GIS advocate. Esri marketing writer Robby Deming recently visited with Geraghty to discuss her winding path to Esri and her ideas for GIS in health and human services over the next several years.
Deming: You have an impressive resumé that spans several different roles and responsibilities. What were you doing before you joined Esri?
Geraghty: I was a practicing physician in general internal medicine at the UC [University of California at] Davis Health System. I also served as the deputy director of the Center for Health Statistics and Informatics at the California Department of Public Health.
Deming: What did you do as deputy director?
Geraghty: Our group had two main functions: vital records and informatics. In terms of vital records, we managed California’s vital records systems covering the issuance, preservation, and registration of events such as birth, death, and marriage. With approximately 500,000 births per year in the state and 250,000 marriages and deaths per year each, we kept plenty busy. For informatics, we were charged with acting in a cross-cutting way to assist programs with turning data into usable information. We also regularly published information on low birth weights, causes of death, and more, in the state. One of our biggest accomplishments was taking a leading role in California’s Health and Human Services Agency to launch the first statewide open data portal for health. Overall, our vision was “usable data, effectively delivered.”
Deming: It seems that you have a love for data and information. Is that what brought you to GIS?
Geraghty: That’s definitely part of it. I actually first encountered GIS during my master’s program. I attended a lecture about GIS, and I was fascinated. When I started out in medicine, I originally wanted to be a radiologist. I’m a very visual person, and I love computers. GIS seemed to speak to both of those
Meet Este GeraghtyAccomplished Physician and Researcher to Head Esri’s Health and Human Services Team
things. So I chose a capstone project that required the use of GIS and soon enrolled in an associate’s degree program at American River College to develop proficiency in GIS.
Deming: How do you view GIS in health and human services?
Geraghty: In the non-GIS user population, many people think that incorporating geography in medicine is a new phenom-enon, but there’s always been an intrinsic relationship between the two. John Snow, the nineteenth-century physician, is com-monly thought to be the first person to marry health and GIS with his analysis of cholera and water pumps in England. But people have been using geography in health long before that. During the bubonic plague that decimated Europe, bureau-crats used maps to track outbreaks and containment areas. And going back even further, like about 900 AD, the physician Rhazes hung slabs of meat around what is now Baghdad to select a hospital site based on putrefaction rates, hypothesiz-ing that slower putrefaction was associated with healthier environments. More recently, Dr. Jack Wennberg, the “father of health GIS,” made it clear that access to health care depends greatly on where you live. As a physician, it’s obvious to me that you can’t tear apart place and health.

11Fall 2014 esri.com/localgov
Deming: The recent Ebola outbreak in Africa has put disease tracking to the front of everyone’s mind. How can GIS make a difference in tracking and analyzing diseases such as Ebola?
Geraghty: GIS is a critical tool for epidemiologists and other health professionals focused on tracking and analyzing infec-tious diseases. Place is intrinsically tied to disease surveillance and transmission. We tend to quantify and communicate disease incidence and prevalence rates by place, and we use spatial analysis to understand the risk factors associated with disease. When emergencies arise, such as the Ebola outbreak in West Africa, using GIS for disease modeling can combine his-torical and current disease and environmental information. This helps us predict transmission patterns, analyze the environmen-tal factors that encourage disease, and plan interventions.
Deming: What do you want to focus on at Esri?
Geraghty: There’s a growing movement, the quantified self, where people are measuring their interaction with their environ-ments, and we absolutely want to support that. We want to help people collect and map things like walkability. We’ll continue supporting efforts like epidemiology and geomedicine, and we’re increasingly going to focus on helping people and communities map their health resources. There are also a lot of business problems that hospitals and providers can address with GIS. I’m actually also interested in pursuing applications of GIS in veterinary science. It’s a growing field that we haven’t explored much in the past. With the One Health movement, that links animal, environmental, and human health, I think it’s an area that will become more important in the coming years.
Deming: You were a practicing physician and the deputy director of a state agency. What brings you to Esri?
Geraghty: It sounds selfish, but I wanted to improve the reach of my message. As an academic physician, you’re lucky if 100 people cite your research. When I started working with the Department of Public Health, I was able to work with federal HHS partners, which helped me extend the reach of my work a little farther. I truly feel like Esri gives me the opportunity to make a difference and effect greater change. At Esri, I get to be creative. I get to communicate. And I get to help shape the future vision for GIS in health while optimizing the way it’s currently used.
Looking back at my career, it seems clear to me that I was always on my way to Esri. It couldn’t be a better fit.
Deming: What is your overall goal at Esri?
Geraghty: My broad goal is that when I’m done, I won’t have to explain what GIS is to health and human services organizations. My hope is that one day, it will just be an integral part of the landscape. I want people to expect to find geography in health.
Geodesign SummitJanuary 22–23, 2015 Esri Headquarters, Redlands, California
The Geodesign Summit is an annual gathering of profes-sionals—including designers, planners, scientists, and architects—interested in using geospatial technologies to arrive at the best and most sustainable design solutions. The two-day summit focuses on geodesign frameworks and concepts, geospatial technologies that support geodesign, and sharing real-world examples of geodesign in practice. The Geodesign Summit helps people find inno-vative solutions to the most pressing challenges by fusing design processes with geospatial technologies. geodesignsummit.com
Esri Public Sector CIO SummitMarch 25–26, 2015Esri Headquarters, Redlands, California
Esri is hosting its second annual Public Sector CIO Summit this spring. This two-day event provides an opportunity for state and local government CIOs to learn about new technol-ogy for state and local governments, meet with peers, and learn tips and tricks on promoting innovation from within their organizations. Hear from government and technology leaders who are paving the way through today’s changing world.Esri.com/cio-summit
Save the Date for Upcoming Esri Events
Case Study
12 Esri News for State & Local Government Fall 2014
Located a few miles southwest of Washington, DC, Fairfax County, Virginia, is home to more than one million residents. Centered in a dynamic region near other densely populated areas, the county needed a basemap that would support multiple web applications and provide regional map data for service delivery and coordinated efforts with other jurisdictions. Since 2010, Fairfax County has con-tributed content to Esri’s Community Maps Program. That makes the county’s data available in the World Topographic Map in ArcGIS Online. Before joining the Community Maps Program, the county’s GIS team members spent many hours de-veloping basemap content for their web applications. Because basemap cartog-raphy is so subjective, the team started from scratch on symbols and label fonts and struggled to develop a consistent basemap that could be used by multiple applications. Brendan Ford, the county’s GIS applications manager, decided to use the high-quality cartography of the World Topographic Map instead of continuing to build the county’s own basemaps to support new web mapping applications. “Prior to the release of the Community Maps basemap in ArcGIS Online, we had no way of quickly developing business-specific apps to meet targeted needs,” said Ford. “We spent time developing a completely new basemap just to serve one or two layers. When we saw the option to use our data in the ArcGIS Online basemap style, we immediately saw the benefit. Now we can quickly produce web maps and applications with no basemap issues.” Emergency management operations is another area where the county has experienced immediate returns on its investment. During Hurricane Sandy in 2012, the GIS team posted an interactive map of road closures. Since then, the GIS
Better Than EverFairfax County Saves Time with World Topographic MapBy Seth Sarakaitis, Esri
team has used the World Topographic basemap to show flooded locations, snow emergency routes, shelters, and many other datasets. The county also needed a basemap that would show detailed information about neighboring jurisdictions.
“While our responsibility to maintain geographic data clearly ends at our jurisdiction’s boundaries, the delivery of services often extends beyond those boundaries,” said Ford. “It is imperative that web maps extend into other jurisdic-tions. To that end, it makes complete sense for all these government agencies to provide their data and contribute to the Community Maps basemap program so we can all get a consistent map built with locally maintained data.” After joining the Community Maps Program, the county decided to improve several of its data layers. The county initially only managed to place its build-ing footprint layer into five categories: Residential, Commercial, Public, Industrial, and Other. While still able to perform analyses and make interesting maps with the five existing themes, the Fairfax County GIS team took on the challenge to extend these classifications to the 12 layers used in the World Topographic Map.
More themes allow further analytics and add extra detail when used in the basemap. Additionally, with the help of college interns, the county developed an extensive Landmarks layer from real estate data, field research, and its own local knowledge. Now the county main-tains a highly detailed polygon feature class with more than 275 education insti-tutions, 133 retail centers, 423 industrial areas, and 25 golf courses, to name a few. “The initial effort to develop the Landmarks layer and reclassify our building footprints was extensive, but it turned out to be well worth it,” said Ford. Fairfax County is reaching a broad audience by participating in Esri’s Community Maps Program. The county’s data is an authoritative local ingredient in basemaps that are available around the globe and helping to build the Living Atlas of the World. To see examples of Fairfax County apps that use the Community Maps basemap, visit the Fairfax County Geoportal page, which provides streamlined access to the county’s interactive mapping applications: www.fairfaxcounty.gov/maps/geoportal.htm.For more information about joining the Community Maps Program, contact [email protected].
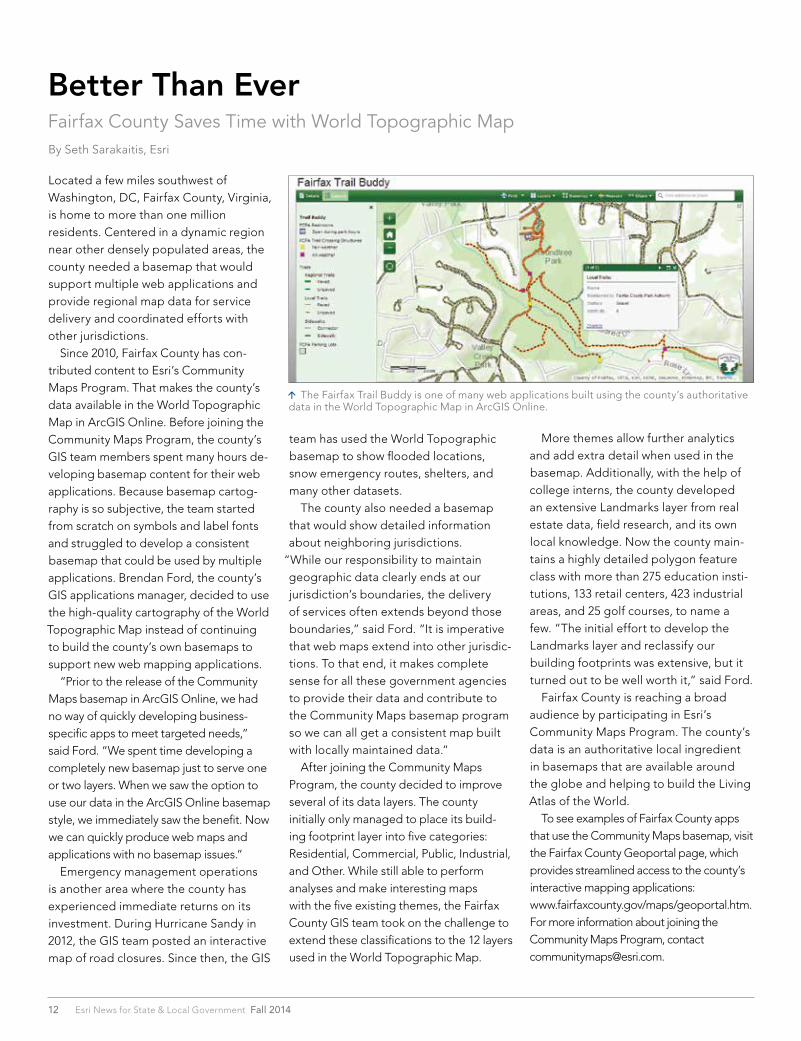
The Fairfax Trail Buddy is one of many web applications built using the county’s authoritative data in the World Topographic Map in ArcGIS Online.
With CycloMedia’s 360° street level Cycloramas you can easily collect information about anything located outdoors. Cycloramas are collected every 15 feet and have a unique image identification, date and time stamp with precise location & orientation built in. As a result of this geometric precision, it’s possible to take measurements within a Cyclorama without going out to the field. You can determine the height of an acoustic barrier, a lamppost or a building or the width of a sidewalk or a road, all without leaving the office - or putting on a pair of work boots.
The only reason you might still need to take
measurements in the field is ifyou were growing corn in Iowa.
CycloMedia’s Benefits:
• Spatial Planning• Virtual Tours• Sign Inventories• Online Collaboration• Data Overlays• Visual Validations• Inspection & Viewing
Please visit us onlinewww.cyclomedia.com
Contact us via [email protected]
Or give us a call 1.800.790. 3652
14 Esri News for State & Local Government Fall 2014
GIS Climate Model Improves Water ManagementLong-Term Forecast Helps Council Design Resiliency Plan
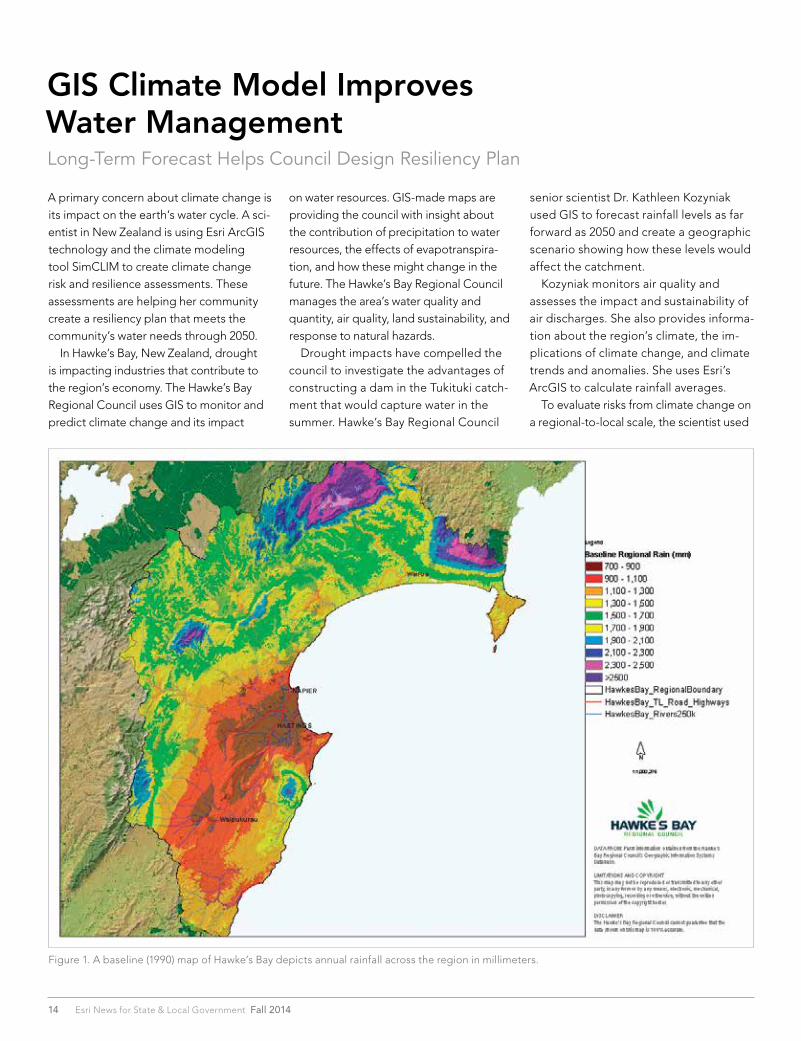
Figure 1. A baseline (1990) map of Hawke’s Bay depicts annual rainfall across the region in millimeters.
A primary concern about climate change is its impact on the earth’s water cycle. A sci-entist in New Zealand is using Esri ArcGIS technology and the climate modeling tool SimCLIM to create climate change risk and resilience assessments. These assessments are helping her community create a resiliency plan that meets the community’s water needs through 2050. In Hawke’s Bay, New Zealand, drought is impacting industries that contribute to the region’s economy. The Hawke’s Bay Regional Council uses GIS to monitor and predict climate change and its impact
on water resources. GIS-made maps are providing the council with insight about the contribution of precipitation to water resources, the effects of evapotranspira-tion, and how these might change in the future. The Hawke’s Bay Regional Council manages the area’s water quality and quantity, air quality, land sustainability, and response to natural hazards. Drought impacts have compelled the council to investigate the advantages of constructing a dam in the Tukituki catch-ment that would capture water in the summer. Hawke’s Bay Regional Council
senior scientist Dr. Kathleen Kozyniak used GIS to forecast rainfall levels as far forward as 2050 and create a geographic scenario showing how these levels would affect the catchment. Kozyniak monitors air quality and assesses the impact and sustainability of air discharges. She also provides informa-tion about the region’s climate, the im-plications of climate change, and climate trends and anomalies. She uses Esri’s ArcGIS to calculate rainfall averages. To evaluate risks from climate change on a regional-to-local scale, the scientist used
15Fall 2014 esri.com/localgov
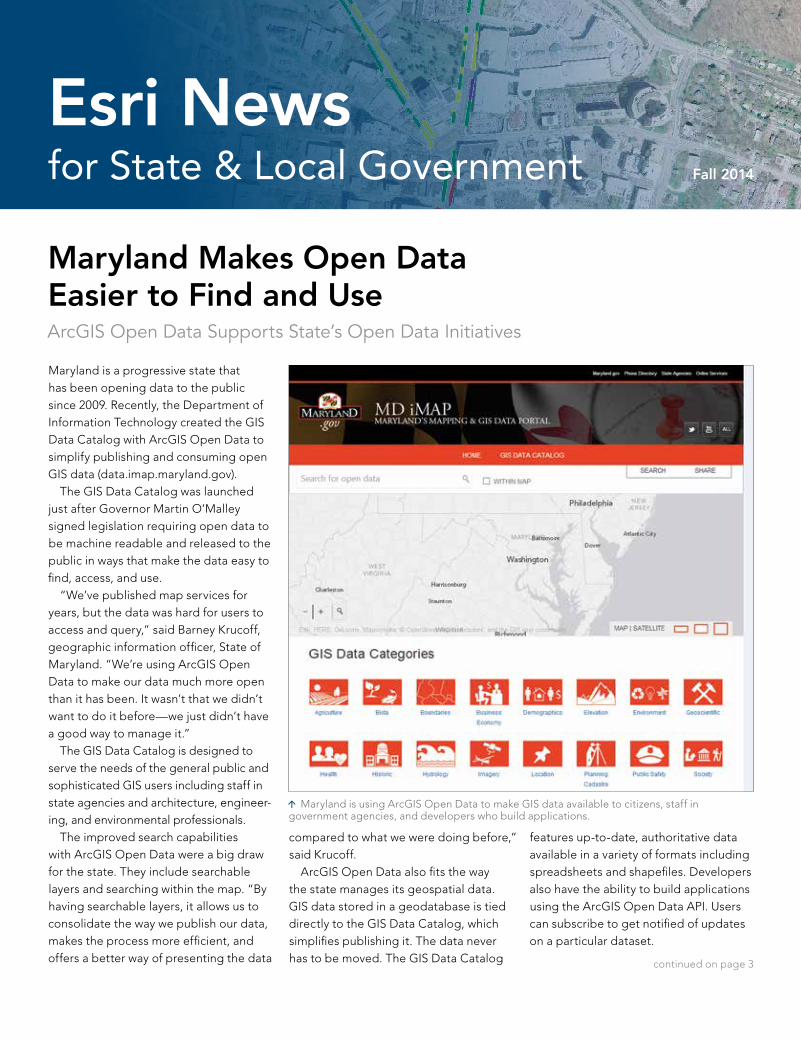
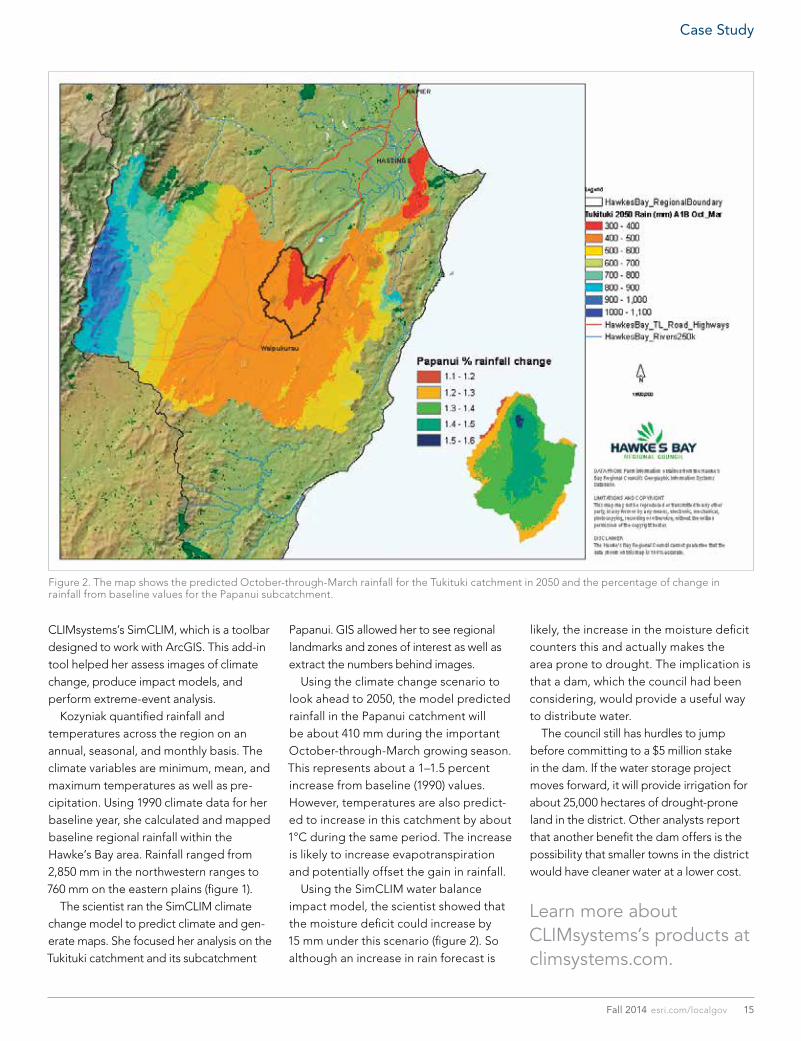
Figure 2. The map shows the predicted October-through-March rainfall for the Tukituki catchment in 2050 and the percentage of change in rainfall from baseline values for the Papanui subcatchment.
CLIMsystems’s SimCLIM, which is a toolbar designed to work with ArcGIS. This add-in tool helped her assess images of climate change, produce impact models, and perform extreme-event analysis. Kozyniak quantified rainfall and temperatures across the region on an annual, seasonal, and monthly basis. The climate variables are minimum, mean, and maximum temperatures as well as pre-cipitation. Using 1990 climate data for her baseline year, she calculated and mapped baseline regional rainfall within the Hawke’s Bay area. Rainfall ranged from 2,850 mm in the northwestern ranges to 760 mm on the eastern plains (figure 1). The scientist ran the SimCLIM climate change model to predict climate and gen-erate maps. She focused her analysis on the Tukituki catchment and its subcatchment
Papanui. GIS allowed her to see regional landmarks and zones of interest as well as extract the numbers behind images. Using the climate change scenario to look ahead to 2050, the model predicted rainfall in the Papanui catchment will be about 410 mm during the important October-through-March growing season. This represents about a 1–1.5 percent increase from baseline (1990) values. However, temperatures are also predict-ed to increase in this catchment by about 1°C during the same period. The increase is likely to increase evapotranspiration and potentially offset the gain in rainfall. Using the SimCLIM water balance impact model, the scientist showed that the moisture deficit could increase by 15 mm under this scenario (figure 2). So although an increase in rain forecast is
likely, the increase in the moisture deficit counters this and actually makes the area prone to drought. The implication is that a dam, which the council had been considering, would provide a useful way to distribute water. The council still has hurdles to jump before committing to a $5 million stake in the dam. If the water storage project moves forward, it will provide irrigation for about 25,000 hectares of drought-prone land in the district. Other analysts report that another benefit the dam offers is the possibility that smaller towns in the district would have cleaner water at a lower cost.
Learn more about CLIMsystems’s products at climsystems.com.
Case Study
16 Esri News for State & Local Government Fall 2014
The southwestern United States, particularly California, is experiencing serious drought conditions and is in desperate need of rain. According to the National Weather Service, 2013 was the driest calendar year on record since 1877. The dry conditions are not merely an inconvenience; they have drastic ramifications on natural resources and living conditions. Without adequate precipitation, dry brush and arid conditions greatly increase the risk of wildfires. In addition, farmers in California Central Valley, who are responsible for the fruits, vegetables, nuts, and dairy that feed much of the country, have seen reduced production as a result of diminishing water supplies. As their resources become strained, the US Department of Agriculture (USDA) and consum-ers are becoming increasingly concerned about the impact on food supply and the resultant increase in grocery store prices. The primary intervention strategy for water agen-cies in combatting these problems is to reduce water consumption and waste. Daily usage can be reduced through targeted marketing campaigns, which encour-age the public to cut back on total water usage and restrict unnecessary watering patterns. For example, lawn watering and car washing are nonessential activi-ties that result in water loss and need to be greatly restricted during times of drought. However, reducing waste can be a difficult task for water agencies to ac-complish. Their concerns over water waste are no trivial matter, either. Wasting as little as one drop per minute (such as with a leaky faucet) equates to over 2,000 gal-lons of water wasted per year. While water agencies have field crews to combat instances of water waste, they can only tackle issues when they are made aware of the loss. By turning to the public at large and enabling the citizenry to report water waste, agencies can use the power of the crowd, commonly termed “crowdsourcing,” to create awareness of more waste issues and in a shorter time frame. Sadly, many citizens are simply uninformed on the matter. Not knowing who to call or how to report water loss more often than not results in disengagement, apathy, and frustration. Fortunately, public-facing reporting tools, such as smartphone apps, have emerged. These tools greatly simplify citizens’ ability to identify and report instances of water waste. Most importantly, these reports go straight to the water agencies that can address these problems.
How Do You Get Citizens to Participate in Drought Management?
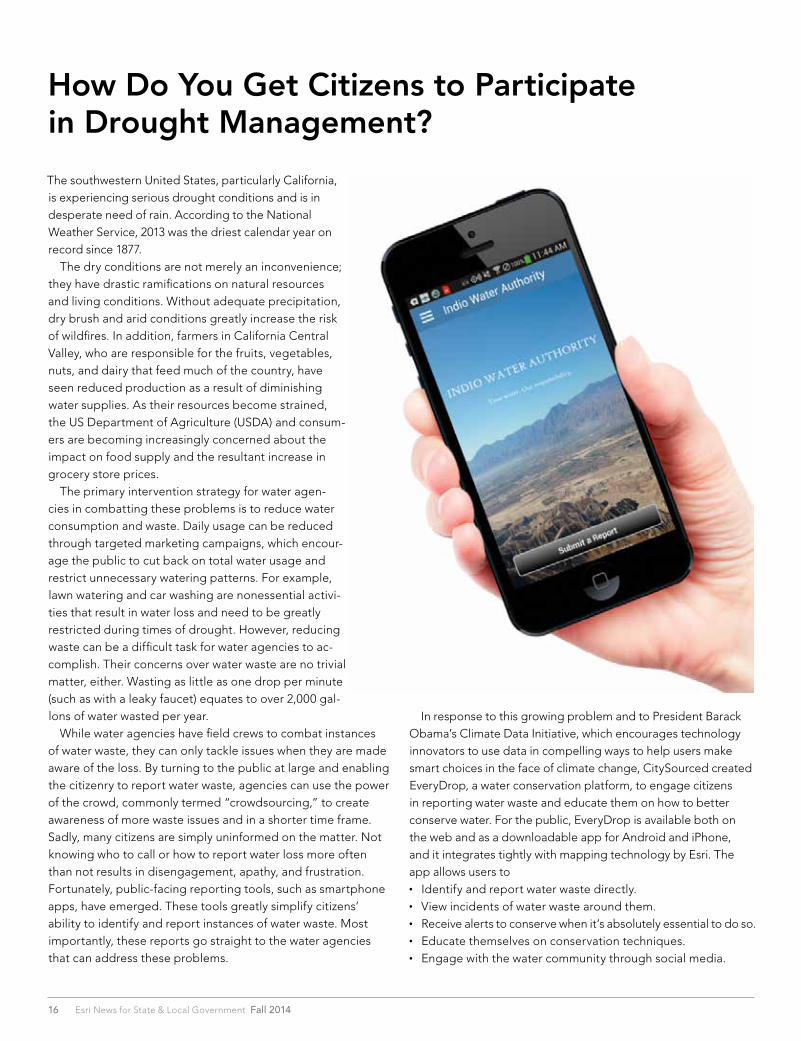
In response to this growing problem and to President Barack Obama’s Climate Data Initiative, which encourages technology innovators to use data in compelling ways to help users make smart choices in the face of climate change, CitySourced created EveryDrop, a water conservation platform, to engage citizens in reporting water waste and educate them on how to better conserve water. For the public, EveryDrop is available both on the web and as a downloadable app for Android and iPhone, and it integrates tightly with mapping technology by Esri. The app allows users to • Identify and report water waste directly. • View incidents of water waste around them. • Receive alerts to conserve when it’s absolutely essential to do so. • Educate themselves on conservation techniques. • Engage with the water community through social media.
17Fall 2014 esri.com/localgov
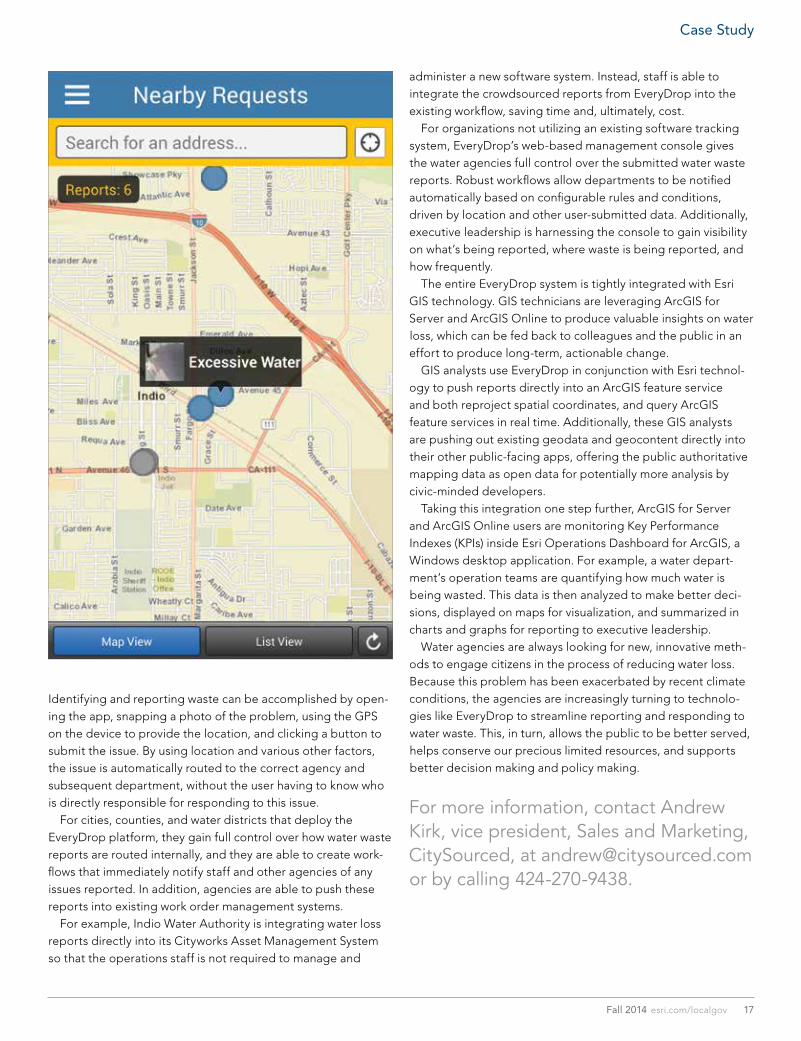
Identifying and reporting waste can be accomplished by open-ing the app, snapping a photo of the problem, using the GPS on the device to provide the location, and clicking a button to submit the issue. By using location and various other factors, the issue is automatically routed to the correct agency and subsequent department, without the user having to know who is directly responsible for responding to this issue. For cities, counties, and water districts that deploy the EveryDrop platform, they gain full control over how water waste reports are routed internally, and they are able to create work-flows that immediately notify staff and other agencies of any issues reported. In addition, agencies are able to push these reports into existing work order management systems. For example, Indio Water Authority is integrating water loss reports directly into its Cityworks Asset Management System so that the operations staff is not required to manage and
administer a new software system. Instead, staff is able to integrate the crowdsourced reports from EveryDrop into the existing workflow, saving time and, ultimately, cost. For organizations not utilizing an existing software tracking system, EveryDrop’s web-based management console gives the water agencies full control over the submitted water waste reports. Robust workflows allow departments to be notified automatically based on configurable rules and conditions, driven by location and other user-submitted data. Additionally, executive leadership is harnessing the console to gain visibility on what’s being reported, where waste is being reported, and how frequently. The entire EveryDrop system is tightly integrated with Esri GIS technology. GIS technicians are leveraging ArcGIS for Server and ArcGIS Online to produce valuable insights on water loss, which can be fed back to colleagues and the public in an effort to produce long-term, actionable change. GIS analysts use EveryDrop in conjunction with Esri technol-ogy to push reports directly into an ArcGIS feature service and both reproject spatial coordinates, and query ArcGIS feature services in real time. Additionally, these GIS analysts are pushing out existing geodata and geocontent directly into their other public-facing apps, offering the public authoritative mapping data as open data for potentially more analysis by civic-minded developers. Taking this integration one step further, ArcGIS for Server and ArcGIS Online users are monitoring Key Performance Indexes (KPIs) inside Esri Operations Dashboard for ArcGIS, a Windows desktop application. For example, a water depart-ment’s operation teams are quantifying how much water is being wasted. This data is then analyzed to make better deci-sions, displayed on maps for visualization, and summarized in charts and graphs for reporting to executive leadership. Water agencies are always looking for new, innovative meth-ods to engage citizens in the process of reducing water loss. Because this problem has been exacerbated by recent climate conditions, the agencies are increasingly turning to technolo-gies like EveryDrop to streamline reporting and responding to water waste. This, in turn, allows the public to be better served, helps conserve our precious limited resources, and supports better decision making and policy making.
For more information, contact Andrew Kirk, vice president, Sales and Marketing, CitySourced, at [email protected] or by calling 424-270-9438.
Case Study
18 Esri News for State & Local Government Fall 2014
Leaders in Roanoke County, Virginia, wanted a good way to give staff and citizens access to the geographic infor-mation they need on any device. The out-dated ArcIMS site they were using was slow and frustrating. County GIS man-ager David Wray decided to use ArcGIS for Local Government app templates to build the apps the community needs. The new GIS Maps and Apps Gallery (http://gis.roanokecountyva.gov/) is based on the Local Government Maps and Apps Gallery template and provides one place where citizens and staff can find geographic data. It hosts TaxView, built with the Tax Parcel Viewer template; GovView, using the My Government Services template; and the VoterView app, adapted from the Election Polling Places template. These three apps can be used on a PC, mobile phone, or tablet. “We wanted to build platform- and device-agnostic apps so they work regardless of which mobile devices or browsers someone uses. We want apps that everyone can access, and this platform helps us do that,” said Roanoke County director of communications and information technology Bill Hunter. Esri partner GISi customized the search feature to include auto-complete for addresses, parcels, and points of interest. Start typing “Jones,” for example, and by the time you’ve typed in “jone,” a list of possible matches will have appeared. Search for “library” and a full list will appear. GISi also created an accordion view of information to allow menus to expand and collapse. The data for these apps is in the ArcGIS for Local Government Information Model. “Putting our data into the model gives us the flexibility to develop apps we need when a business case arises,” said Wray.
Roanoke County, Virginia, Builds a Smart CommunityArcGIS for Local Government Apps and Esri Partner GISi Make It Easy to Find Information
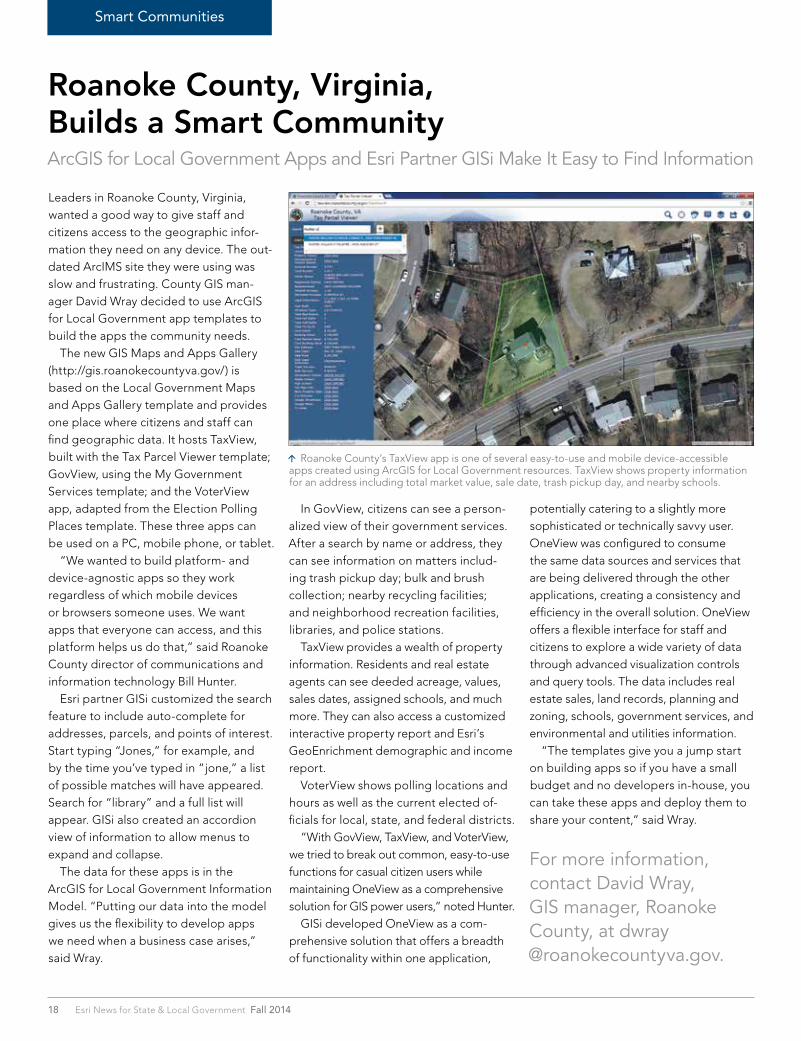
In GovView, citizens can see a person-alized view of their government services. After a search by name or address, they can see information on matters includ-ing trash pickup day; bulk and brush collection; nearby recycling facilities; and neighborhood recreation facilities, libraries, and police stations. TaxView provides a wealth of property information. Residents and real estate agents can see deeded acreage, values, sales dates, assigned schools, and much more. They can also access a customized interactive property report and Esri’s GeoEnrichment demographic and income report. VoterView shows polling locations and hours as well as the current elected of-ficials for local, state, and federal districts. “With GovView, TaxView, and VoterView, we tried to break out common, easy-to-use functions for casual citizen users while maintaining OneView as a comprehensive solution for GIS power users,” noted Hunter. GISi developed OneView as a com-prehensive solution that offers a breadth of functionality within one application,
potentially catering to a slightly more sophisticated or technically savvy user. OneView was configured to consume the same data sources and services that are being delivered through the other applications, creating a consistency and efficiency in the overall solution. OneView offers a flexible interface for staff and citizens to explore a wide variety of data through advanced visualization controls and query tools. The data includes real estate sales, land records, planning and zoning, schools, government services, and environmental and utilities information. “The templates give you a jump start on building apps so if you have a small budget and no developers in-house, you can take these apps and deploy them to share your content,” said Wray.
For more information, contact David Wray, GIS manager, Roanoke County, at dwray @roanokecountyva.gov.
Roanoke County’s TaxView app is one of several easy-to-use and mobile device-accessible apps created using ArcGIS for Local Government resources. TaxView shows property information for an address including total market value, sale date, trash pickup day, and nearby schools.
Smart Communities
www.cityworks.com | 801.523.2751

www.cityworks.com | 801.523.2751
Presorted Standard
US Postage Paid Esri
380 New York Street Redlands, California 92373-8100 usa
143097 QUAD170M10/14sp
A New Era of Health Analytics2014 Esri Health GIS ConferenceNovember 3–5, 2014 Broadmoor HotelColorado Springs, Colorado
Come to the 2014 Esri Health GIS Conference to see how geography empowers the science, application, and administration of health. This is an unrivaled opportunity to learn cutting-edge Esri® software from world-class experts, sharpen your geographic information systems (GIS) skills, witness how others solve tough technical problems, and collaborate with peers from across the globe.
For more information and to register, visit esri.com/healthgis
Copyright © 2014 Esri. All rights reserved.
G62593_HealthConference_ad_2-14.indd 1 2/25/14 4:15 PM