Embed Size (px)
Citation preview
1
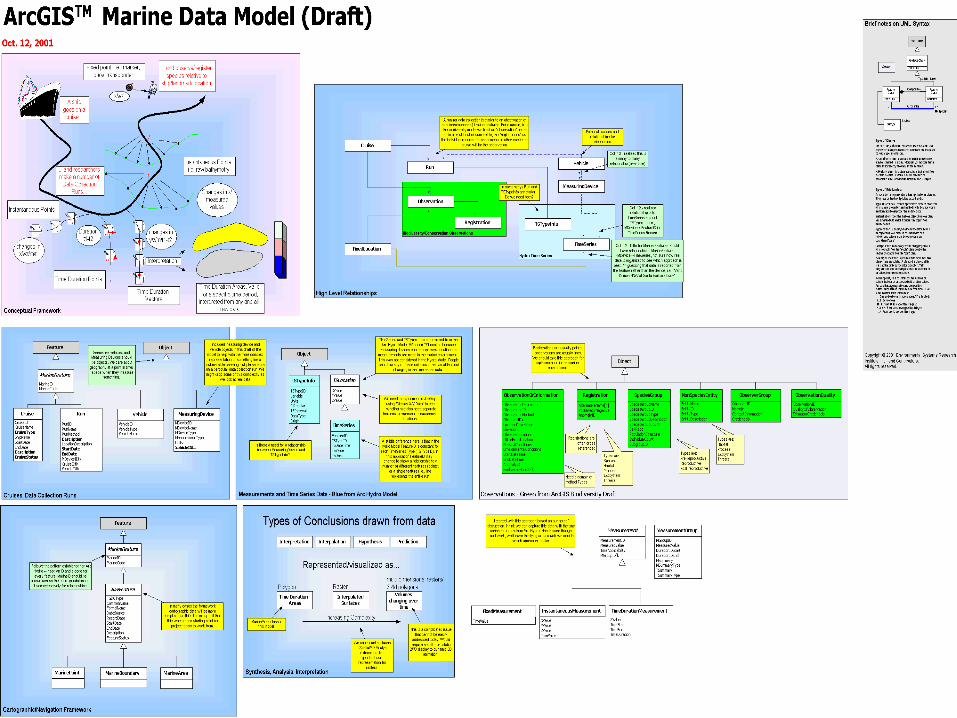
ArcGIS Marine Data Model
Project IntroductionConceptual Framework
Dawn Wright, Oregon State University
Joe Breman, ESRI
Review Team WorkshopESRI Headquarters, Redlands, CAJune 7-8, 2002
dusk.geo.orst.edu/djl/arcgis
2
Workshop Goals
• Overview of process• Refine the initial concepts and technical
structure of the model • Test model's initial application to real
data• Discussion of case studies, SIG meeting,
further steps• Agenda and handouts
3
Project Overview
• Steps in Process• Conceptual Framework
– 50 pg. draft at dusk.geo.orst.edu/djl/arcgis
• Lead in to demos and discussion
4
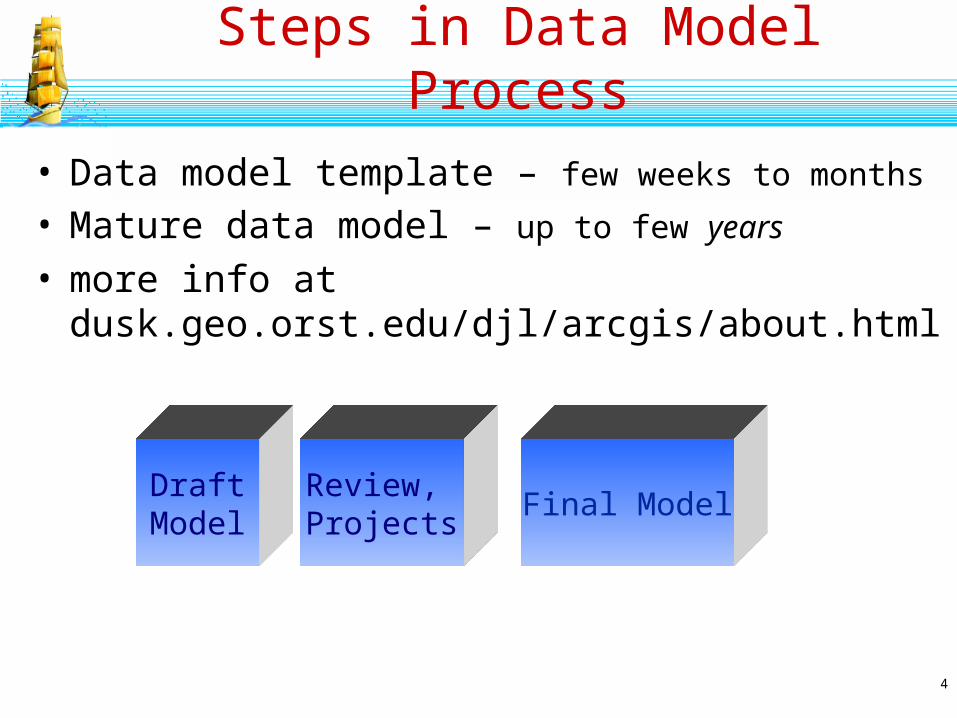
Steps in Data Model Process
• Data model template – few weeks to months
• Mature data model – up to few years
• more info at dusk.geo.orst.edu/djl/arcgis/about.html
DraftModel
Review, Projects
Final Model
5
Project Milestones
• Initial Working Group - Oct. 4-5, 2001– Steve Grisé, Joe Breman, Simon Evans– Dawn Wright, Jason Marshall, Pat Halpin, Eric
Treml– Analysis Diagram, UMLs, Data Structures
• Draft Conceptual FW Document – Nov. 2001
• Review Team, Case Studies, and Interested Participants
• This workshop – Jun. 7-8, 2002• Marine SIG Meeting at ESRI UC,July 9, 2002
6
• basic template for implementing GIS projects– input, formatting, geoprocessing, creating
maps, performing analyses
• basic framework for writing program code and maintaining applications– development of tools for the community
• promote networking and data sharing through established standards
• Learning,understanding ArcGIS!
Purpose of Marine Data Model
7
Georelational to Geodatabase Model
• coverage and shapefile data structures• features are aggregated into
homogenous collections of points, lines, and polygons with generic, 1- and 2-dimensional "behavior"
• can’t distinguish behaviors– Point for a marker buoy, same as point for
OBS
• “smart features” in a geodatabase
8
Geodatabase Concepts
• ESRI's new data object-oriented data model – objects, features, behaviors
• Object– in ArcGIS an object is non-spatial
• it is NOT a point, line, or area • it has no geographic location
– it has no shape attribute in its table– ship, vehicle, … customer, lake, house
• Feature– an object that has geographic location– a point, line, area, TIN, raster
9
Geodatabase Concepts ( cont. )
• Geodatabase– collection of feature data sets, rasters, TINs– all data in relational tables – behavior is coupled with features through
rules– no more division between ARC and INFO
10
Transition to ArcGIS 8?
• how and when to do it? • How well are marine application domain
requirements met in the geodatabase structure now?
• What can we do as a group to understand the technology and identify requirements?
• What are the potential benefits?
11
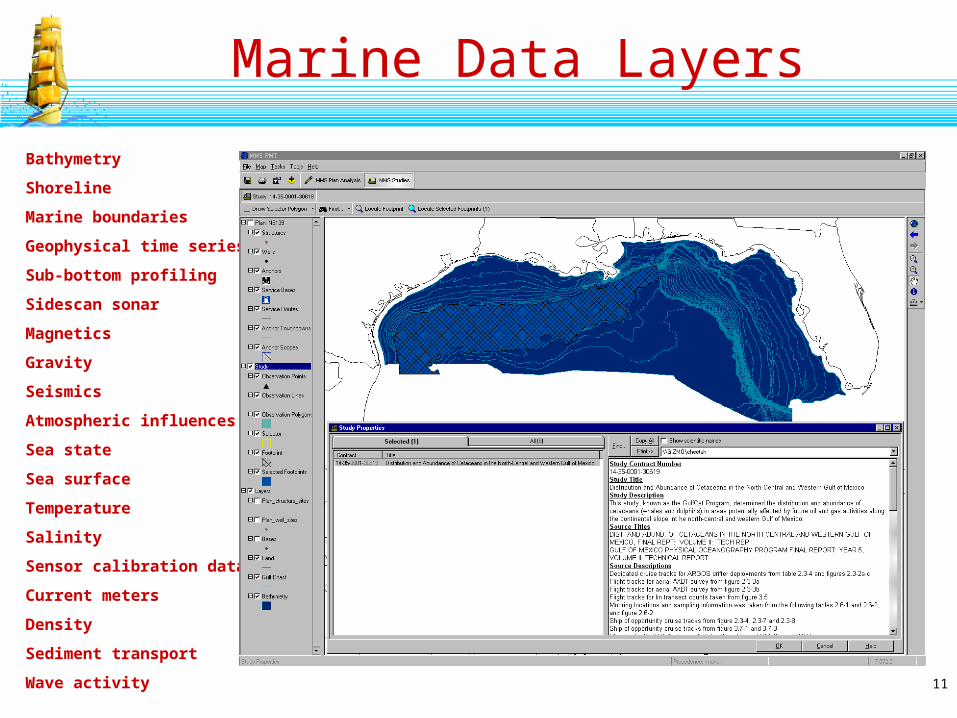
Bathymetry
Shoreline
Marine boundaries
Geophysical time series
Sub-bottom profiling
Sidescan sonar
Magnetics
Gravity
Seismics
Atmospheric influences
Sea state
Sea surface
Temperature
Salinity
Sensor calibration data
Current meters
Density
Sediment transport
Wave activity
Marine Data Layers
12
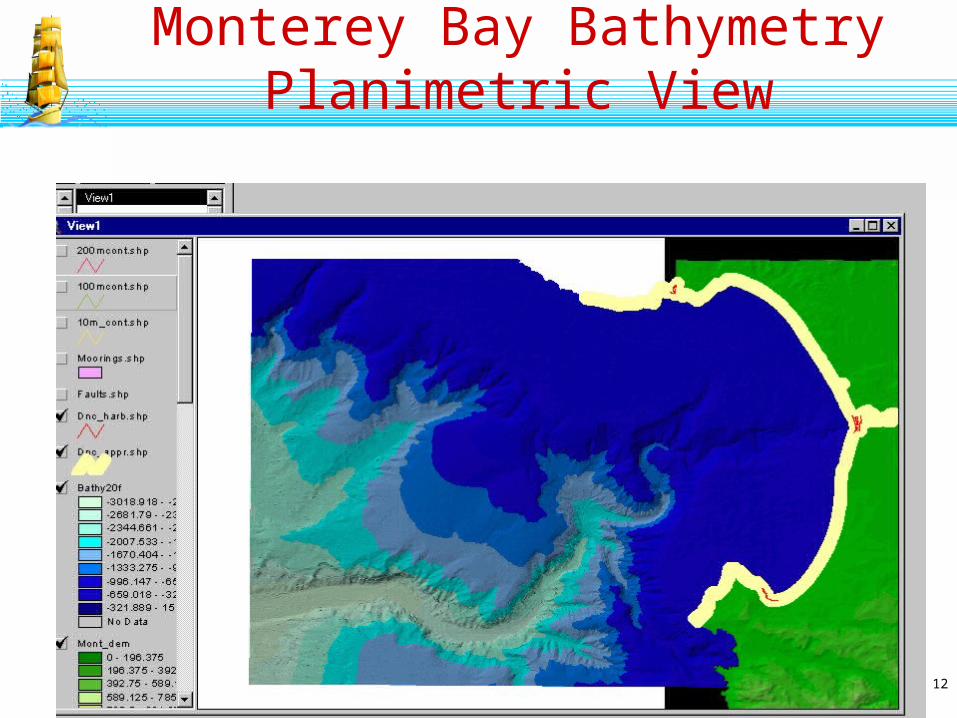
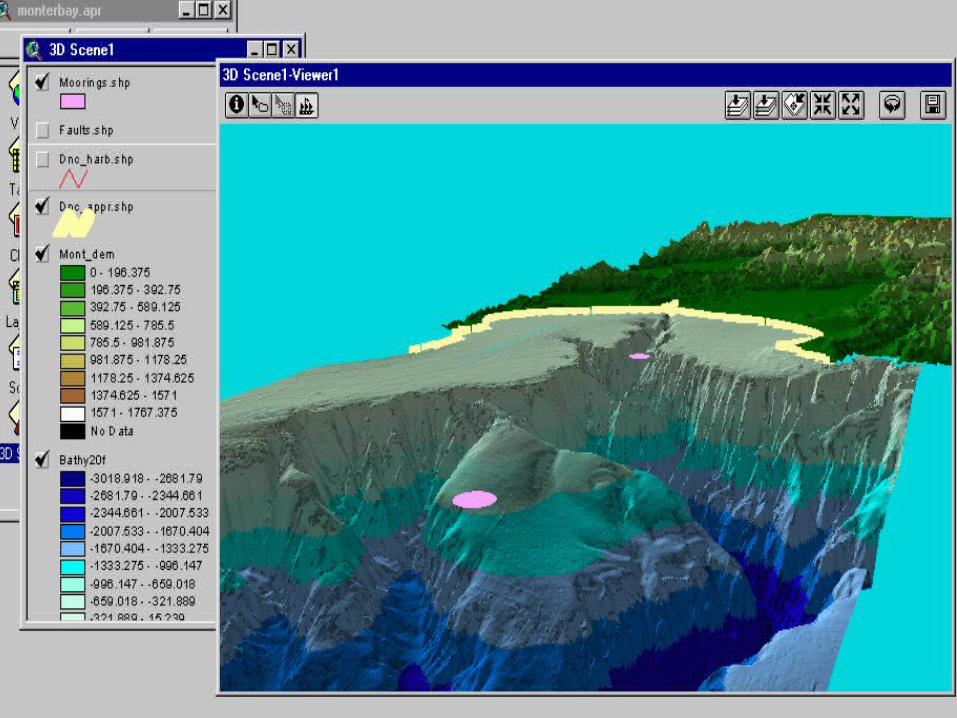
Monterey Bay BathymetryPlanimetric View
13
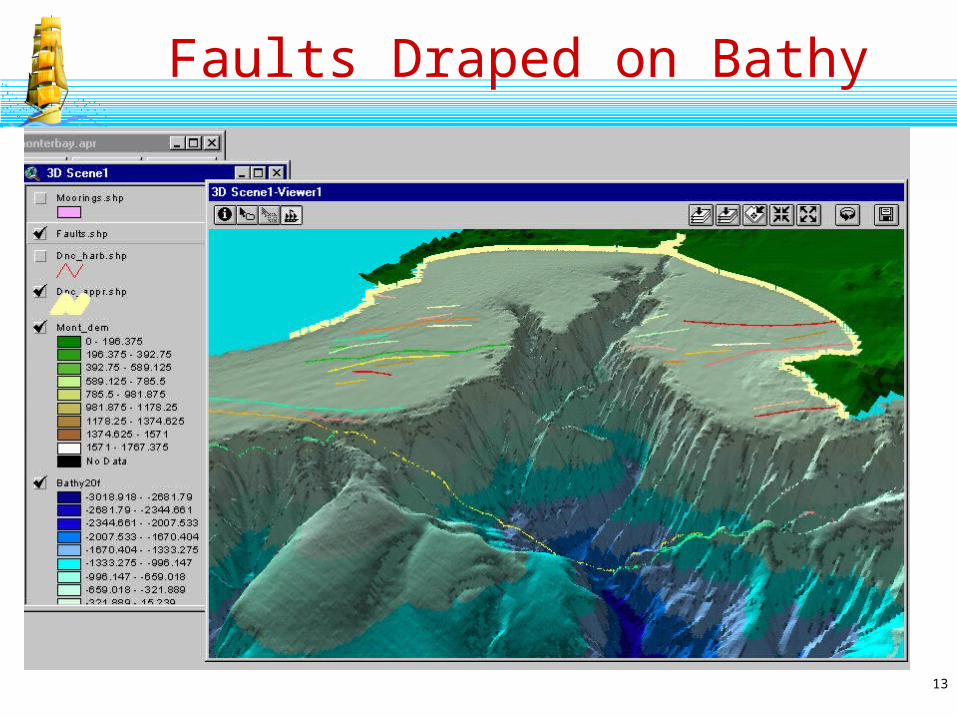
Faults Draped on Bathy
14
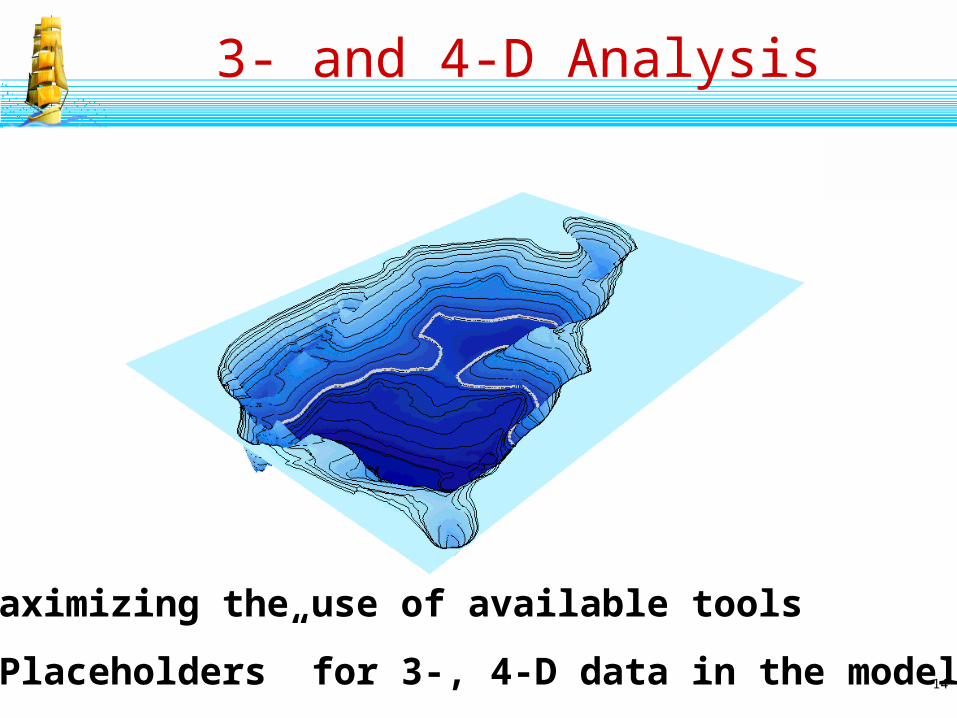
Maximizing the use of available tools
“Placeholders” for 3-, 4-D data in the model
3- and 4-D Analysis

15
Coastlines and sea level change
Raster layers with adjusted base
heights

16
17
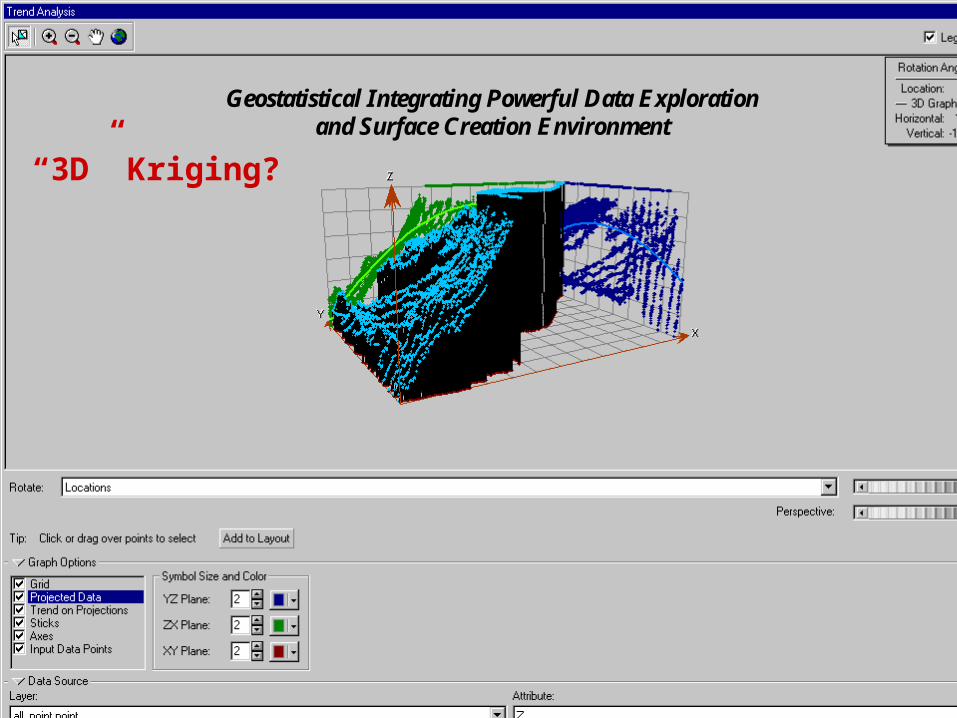
Geostatistical Integrating Powerful Data Exploration and Surface Creation Environment
“3D” Kriging?
18
19
20Image courtesy of PISCO, OSU
Marine Data Collection
21
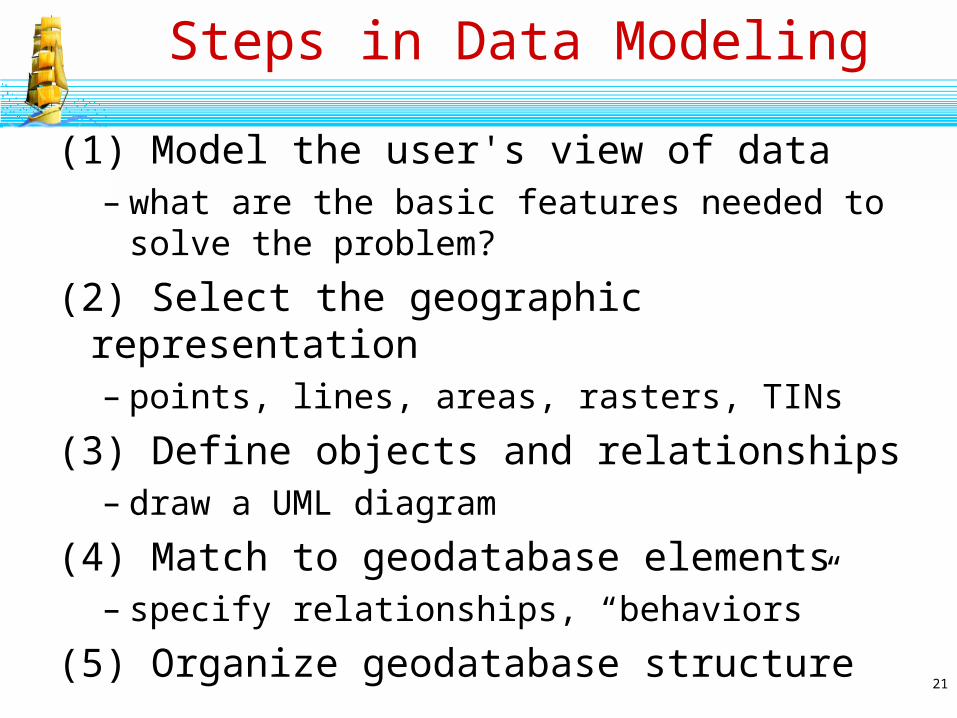
Steps in Data Modeling
(1) Model the user's view of data– what are the basic features needed to
solve the problem?
(2) Select the geographic representation – points, lines, areas, rasters, TINs
(3) Define objects and relationships – draw a UML diagram
(4) Match to geodatabase elements– specify relationships, “behaviors”
(5) Organize geodatabase structure

22
Users’s View of Data

23
• Representing dynamic marine data
• Feature locations change
• Multiple time variable data
• A dynamic and multivariable coastline
• Time duration areas
• Instantaneous points with multiple z values
• Tracking marine animal movement
• Bathymetric layers
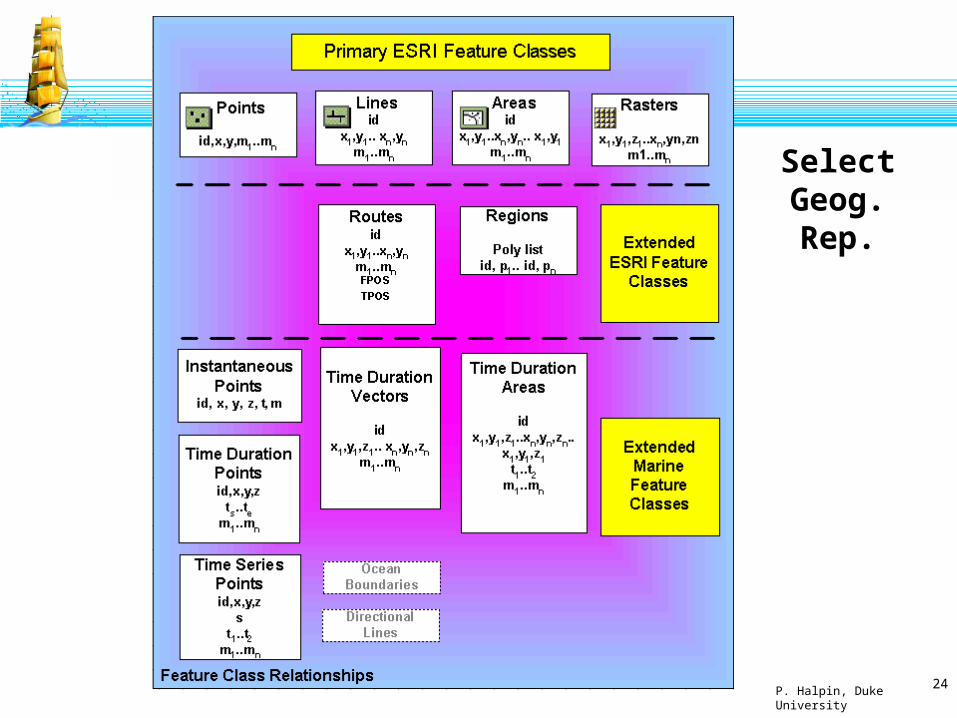
24P. Halpin, Duke University
SelectGeog.Rep.
25
26
Understanding the Design
• Won’t go through all boxes• Use ArcMap and real data• Data model a great poster?• Data maintenance app.• Programming framework
27
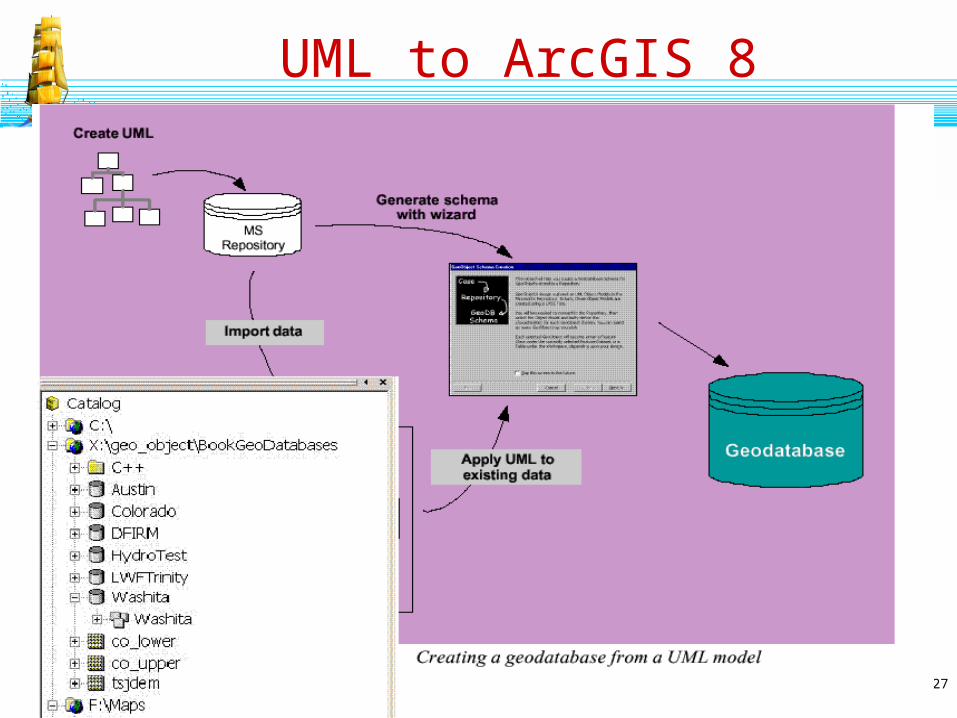
UML to ArcGIS 8
28
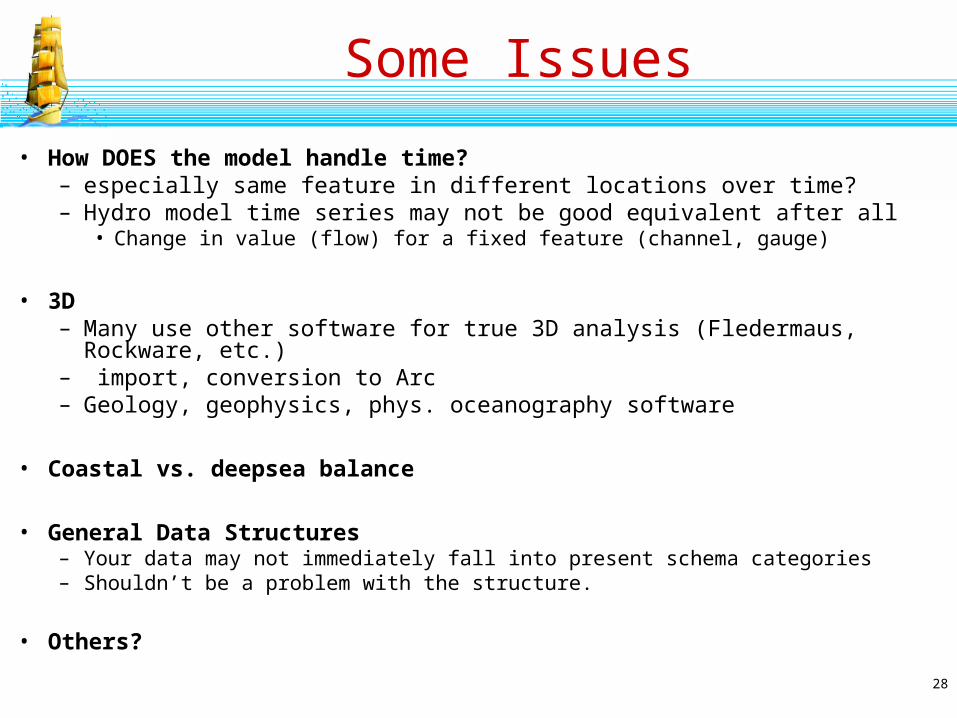
Some Issues
• How DOES the model handle time? – especially same feature in different locations over time? – Hydro model time series may not be good equivalent after all
• Change in value (flow) for a fixed feature (channel, gauge)
• 3D – Many use other software for true 3D analysis (Fledermaus,
Rockware, etc.)– import, conversion to Arc– Geology, geophysics, phys. oceanography software
• Coastal vs. deepsea balance
• General Data Structures– Your data may not immediately fall into present schema categories– Shouldn’t be a problem with the structure.
• Others?