Embed Size (px)
Citation preview
JB Hi Fi LimitedJB Hi-Fi LimitedFull Year Results Presentation30 June 201030 June 2010
9 August 2010
For
per
sona
l use
onl
y
Agenda
1 Performance1. Performance
2. Historic Performance
3 Unique JB Model3. Unique JB Model
4. Trading Performance
5 Financial Detail5. Financial Detail
6. Dividends
7 Store Update7. Store Update
8. Investment Checklist
Terry Smart Richard MurrayCEO CFO
For
per
sona
l use
onl
y
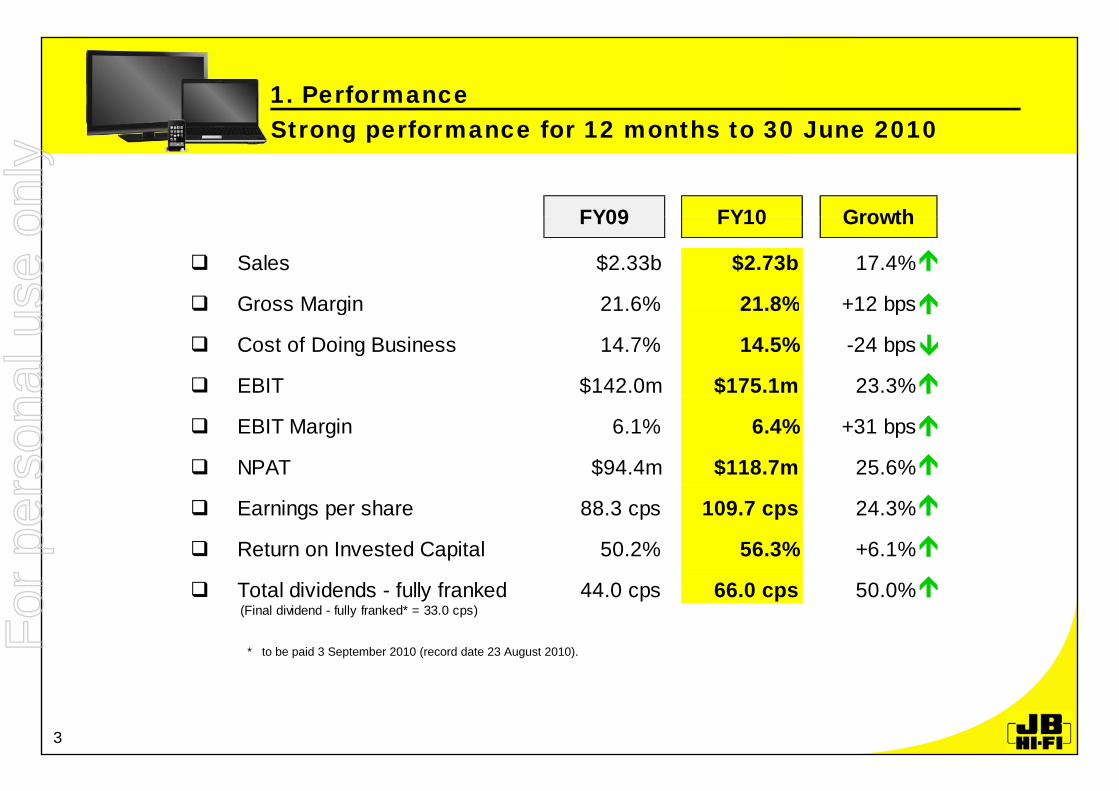
Strong performance for 12 months to 30 June 20101. PerformanceStrong performance for 12 months to 30 June 2010
FY09 FY10 Growth
Sales $2.33b $2.73b 17.4%
Gross Margin 21 6% 21 8% +12 bps
FY09 FY10 Growth
Gross Margin 21.6% 21.8% +12 bps
Cost of Doing Business 14.7% 14.5% -24 bps
EBIT $142.0m $175.1m 23.3%
EBIT Margin 6.1% 6.4% +31 bps
NPAT $94.4m $118.7m 25.6%
Earnings per share 88.3 cps 109.7 cps 24.3%
Return on Invested Capital 50.2% 56.3% +6.1%
* to be paid 3 September 2010 (record date 23 August 2010).
Total dividends - fully franked 44.0 cps 66.0 cps 50.0% (Final dividend - fully franked* = 33.0 cps)
3
For
per
sona
l use
onl
y
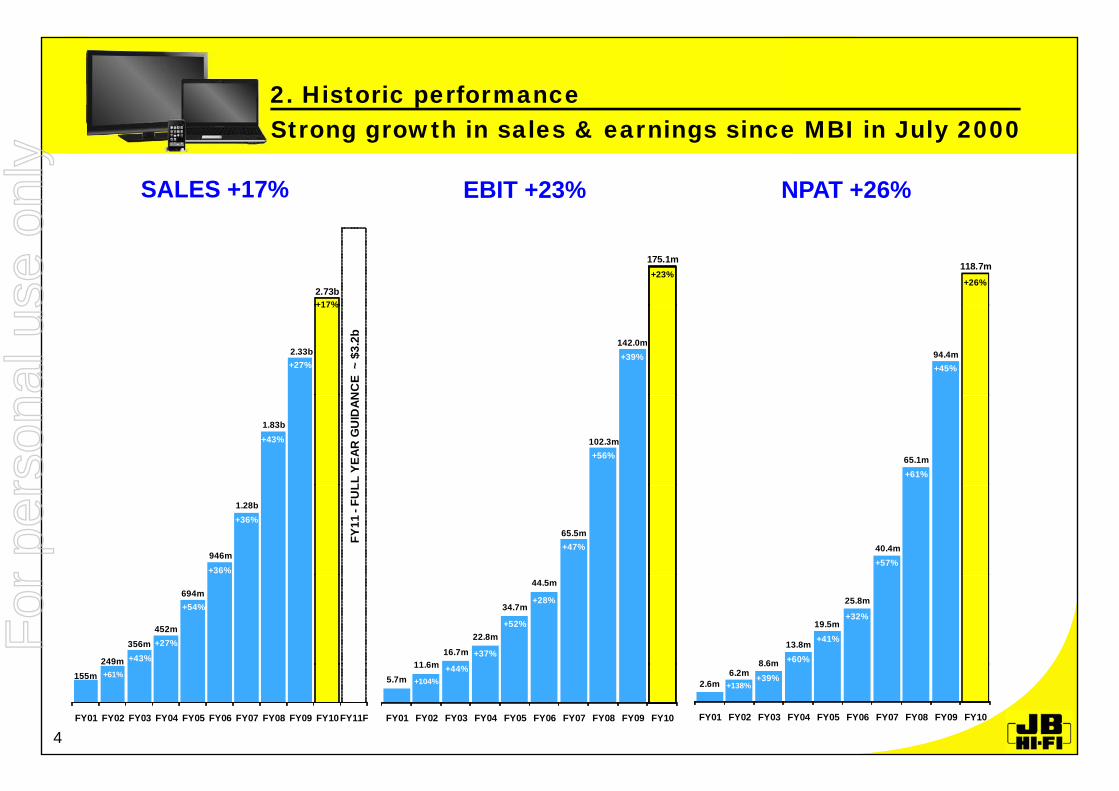
Strong growth in sales & earnings since MBI in July 20002. Historic performance
SALES +17% EBIT +23% NPAT +26%
Strong growth in sales & earnings since MBI in July 2000
118.7m+26%
175.1m+23%
2.73b+17%
94.4m+45%
142.0m+39%2.33b
+27%N
CE
~ $
3.2b
+17% +
65.1m+61%
102.3m+56%
1.83b
LL Y
EAR
GU
IDAN
+43%
40.4m+57%
65.5m+47%
946m
1.28b
+36%
+36%
FY11
-FU
L
8 6m
13.8m
19.5m
25.8m
+32%
+41%
+60%11 6m16.7m
22.8m
34.7m
44.5m
+37%
+28%
+52%
249m
356m452m
694m
+43%
+27%
+54%
2.6m6.2m
8.6m
FY01 FY02 FY03 FY04 FY05 FY06 FY07 FY08 FY09 FY10
+39%+138%
5.7m11.6m
FY01 FY02 FY03 FY04 FY05 FY06 FY07 FY08 FY09 FY10
+44%+104%155m
FY01 FY02 FY03 FY04 FY05 FY06 FY07 FY08 FY09 FY10FY11F
+61%
4
For
per
sona
l use
onl
y
3. Unique JB Model
Unique JB Model continues to resonate with customers A huge range and every day low price offering.
A unique and engaging retail environment.
A sales focused company, while proactively managing our other key performance measures of earnings, working capital ratios and return on invested capitalratios and return on invested capital.
Constant technology innovation assists in driving growth.
Genuine, passionate and knowledgeable sales staff, who connect well with our customers.
Low cost of doing business culture.
Strong organic growth as recently opened stores mature, we open new stores and expand our product offering.
5
For
per
sona
l use
onl
y
4. Trading performance
Sales Consolidated sales grew 17.4%.
Consolidated comparable store sales growth for FY10 was 4.8%.
This was a strong result, with the company trading well through what was considered a most challenging and competitive period in retailperiod in retail.
Sales in the 2nd half of FY10 were predominately impacted by 3 factors, which in combination contributed to flat comparable store growth over this period for the JB Hi-Fi branded stores. The factors were:
1. Reduced consumer confidence and spending after a number of consecutive interest rates rises and continued uncertainty in the global economy;
2. Cycling the impact of prior year government stimulus packages:
Trading in the prior year benefited from the broader cash stimulus packages (Dec 08, March/April 09);
We were particularly impacted by the Investment Allowance (May/June 09) which drove business We were particularly impacted by the Investment Allowance (May/June 09), which drove business purchases in our computer category. As a consequence we were cycling strong computer sales during that period; and
While it is difficult to quantify the impact of the above, we are confident in the strength of our underlying b i fbusiness performance.
3. Inventory shortages of the latest release/hero products in the 4th quarter, particularly 3D panels and iPad’s.
6
For
per
sona
l use
onl
y
4. Trading performance…
Gross Margin GM was 21.8%, a 12 bps increase for FY10, and a 65 bps increase in the 2nd half.
This improved gross margin result was driven by positive outcomes such as :
Increasing scale continuing to drive greater levels of supplier support;
Merchandising strategy - focussed on margin generating products; and
Continued focus on shrinkage and obsolescence.
The strength in gross margin was pleasing given the following challenges:
Continued competitive environment;Continued competitive environment;
Continued growth of low margin product categories; and
Significant price competition in the NZ market which resulted in a fall in gross margin of 129 bps. However, this is an improvement on our first half.
7
For
per
sona
l use
onl
y
4. Trading performance…
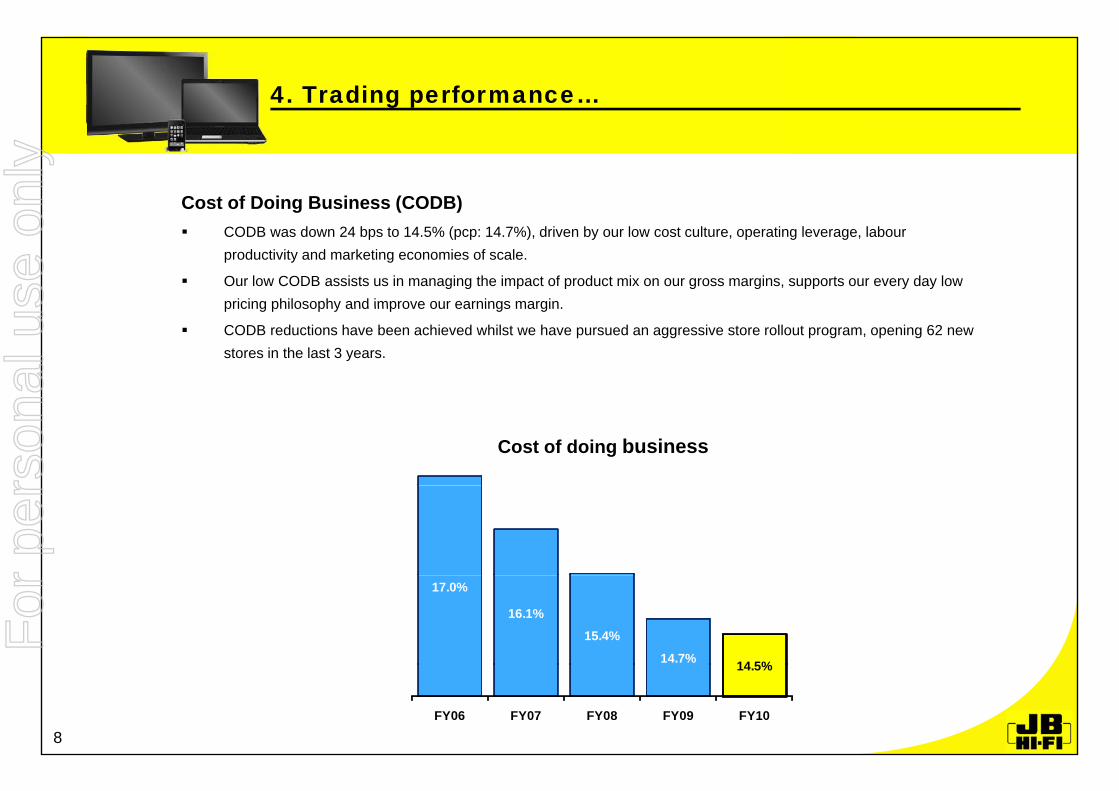
Cost of Doing Business (CODB) CODB was down 24 bps to 14.5% (pcp: 14.7%), driven by our low cost culture, operating leverage, labour
productivity and marketing economies of scale.
Our low CODB assists us in managing the impact of product mix on our gross margins, supports our every day low pricing philosophy and improve our earnings marginpricing philosophy and improve our earnings margin.
CODB reductions have been achieved whilst we have pursued an aggressive store rollout program, opening 62 new stores in the last 3 years.
Cost of doing business
17.0%
16.1%
15.4%
14.7% 14 5%14.5%
FY06 FY07 FY08 FY09 FY10
8
For
per
sona
l use
onl
y
4. Trading performance…
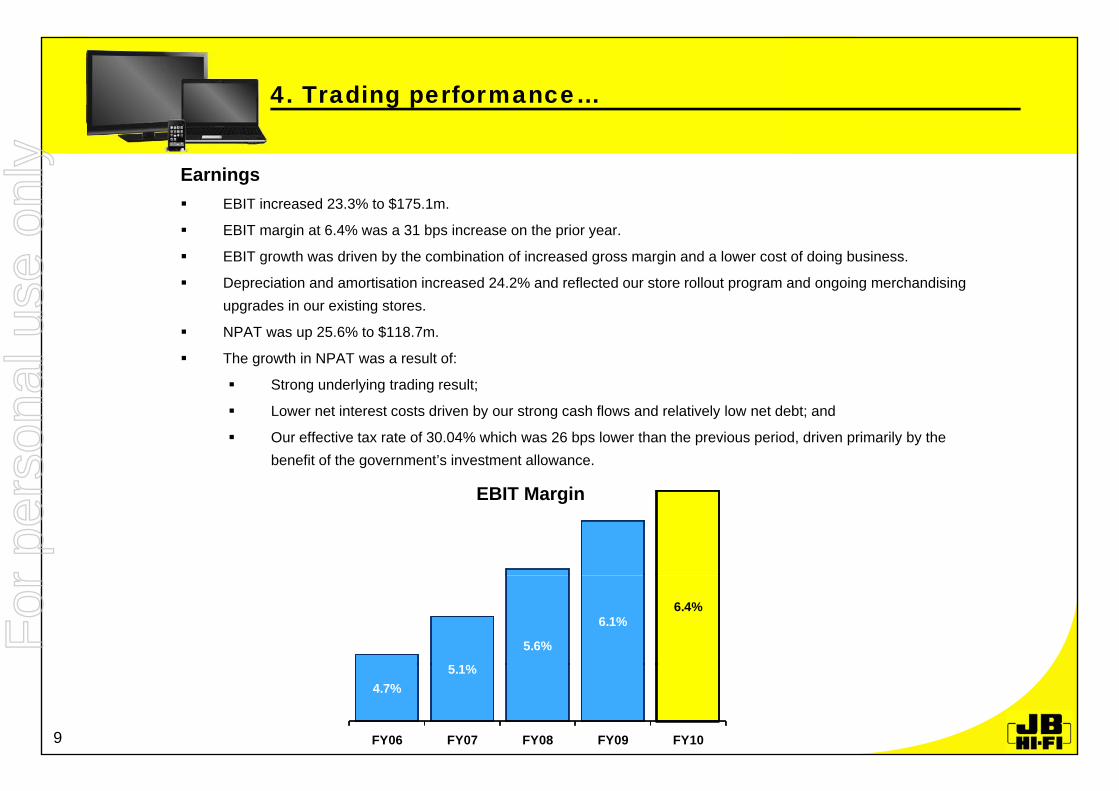
Earnings EBIT increased 23.3% to $175.1m.
EBIT margin at 6.4% was a 31 bps increase on the prior year.
EBIT growth was driven by the combination of increased gross margin and a lower cost of doing business.
Depreciation and amortisation increased 24.2% and reflected our store rollout program and ongoing merchandising upgrades in our existing storesupgrades in our existing stores.
NPAT was up 25.6% to $118.7m.
The growth in NPAT was a result of:
Strong underlying trading result;
Lower net interest costs driven by our strong cash flows and relatively low net debt; and
Our effective tax rate of 30.04% which was 26 bps lower than the previous period, driven primarily by the benefit of the government’s investment allowance.
EBIT Margin
5 1%
5.6%
6.1% 6.4%
4.7% 5.1%
FY06 FY07 FY08 FY09 FY109
For
per
sona
l use
onl
y
4. Trading performance…
Australia Sales grew 17.8% to $2.6b with comparable store sales up 4.5%. Gross margin increased by 17 bps to 22.1%. Cost of doing business was down 18 bps to 14.4%.
EBIT increased 23.3% to $178.6m.$
EBIT margin at 6.9% was a 30 bps increase on the prior year. Opened 22 JB Hi-Fi stores.
New Zealand JB branded store sales grew 34.7% to NZ$147.0m. Overall sales growth, including closed H&S branded stores was 11.3%. Comparable store sales were up 13.4% (JB Hi-Fi only).
EBIT decreased to a loss of NZ$4 4m/AU$3 5m with an EBIT margin at -2 6% EBIT decreased to a loss of NZ$4.4m/AU$3.5m, with an EBIT margin at -2.6%.
On a normalised basis (ie JB stores and support office), the FY10 EBIT loss would have been NZD$2.5m/AU$2.0m. Opened 1 JB Hi-Fi store and rebranded 1 H&S store. Finalised exit of H&S branded stores, with a total of 5 H&S stores closed in FY10. Refer Appendix II(d) for further discussion.
A i dditi l l ti i t i i t fit bilit i NZ d i FY11 As we gain additional scale, we anticipate moving into profitability in NZ during FY11.
10
For
per
sona
l use
onl
y
4. Trading performance…
Trading Outlook We anticipate opening 18 new JB Hi-Fi stores in FY11 (Aust: 15, NZ: 3). Maintain our target of 210 JB branded stores (160 Tier 1* and 50 Tier 2* format) in Australia and New Zealand. The recently opened Tier 2 stores, while still in their ramp up phase, are performing inline with internal expectations, and we
maintain our target of 50 Tier 2 stores. FY11 YTD Trading Update:
Total sales growth for July was positive; and Whilst comparable store sales growth was slightly negative, it was a positive trend on previous month’s trading.
Confident of continued growth in most product categories and market share gains in all. We expect the first half of FY11 to be challenging, with consumer spending remaining subdued. Our proven unique retail model is best equipped to take advantage of the expected increase in consumer spending in the
lead up to the critical Christmas trading period. Overall we expect FY11 to be another good year of sales and earnings growth. Expect sales in FY11 of circa $3.2b, a 17% increase over the pcp.
* refer to explanation in Appendix II(c).
11
For
per
sona
l use
onl
y
4. Trading performance…
Industry Outlook All categories expected to remain very competitive - specialist players like JB with a unique offering will continue to take
market share. Constant technology innovation will drive continued industry growth. Visual:
Digital TV switch over; and 3DTV and IPTV.
Computers: Establishment of new sub product category of tablet pc’s driven by launch of iPad.
Telecommunications: iPhone 4 - strong sales in Australia over first week of release; Continued strong growth in the Smart Phone category; and Telstra now has competitive Mobile Plans to enable us to maximise the opportunity.
Games: Key games console manufacturers are launching new platform upgrades in the lead up to Christmas 2010.
12
For
per
sona
l use
onl
y
Profit and Loss Statement5. Financial detailProfit and Loss Statement
AUDm FY09 FY10 Growth FY09 FY10 Growth FY09 FY10 GrowthCONSOLIDATEDAUST NZ
AUDm FY09 FY10 Growth FY09 FY10 Growth FY09 FY10 Growth
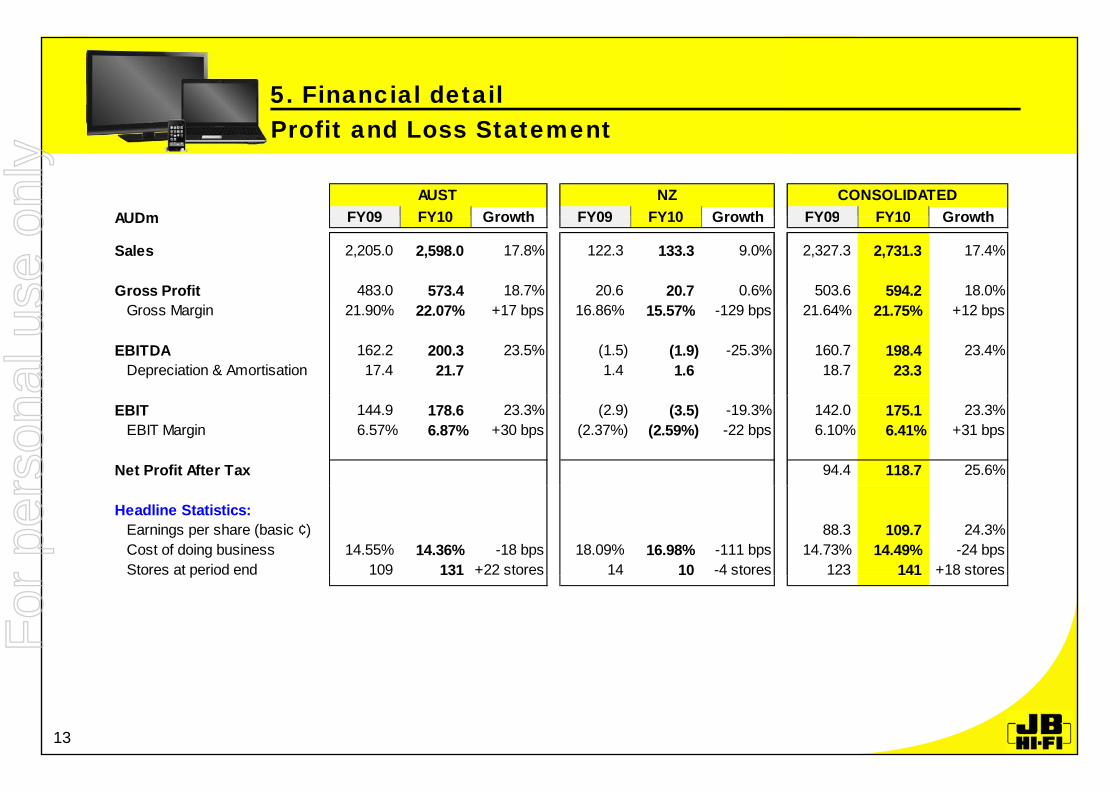
Sales 2,205.0 2,598.0 17.8% 122.3 133.3 9.0% 2,327.3 2,731.3 17.4%
Gross Profit 483.0 573.4 18.7% 20.6 20.7 0.6% 503.6 594.2 18.0%G M i 21 90% 22 07% 17 b 16 86% 15 57% 129 b 21 64% 21 75% 12 bGross Margin 21.90% 22.07% +17 bps 16.86% 15.57% -129 bps 21.64% 21.75% +12 bps
EBITDA 162.2 200.3 23.5% (1.5) (1.9) -25.3% 160.7 198.4 23.4%Depreciation & Amortisation 17.4 21.7 1.4 1.6 18.7 23.3
EBIT 144.9 178.6 23.3% (2.9) (3.5) -19.3% 142.0 175.1 23.3%EBIT Margin 6.57% 6.87% +30 bps (2.37%) (2.59%) -22 bps 6.10% 6.41% +31 bps
Net Profit After Tax 94.4 118.7 25.6%
Headline Statistics:Earnings per share (basic ¢) 88.3 109.7 24.3%Cost of doing business 14.55% 14.36% -18 bps 18.09% 16.98% -111 bps 14.73% 14.49% -24 bpsStores at period end 109 131 +22 stores 14 10 -4 stores 123 141 +18 storesp 3 0
13
For
per
sona
l use
onl
y
Balance Sheet5. Financial detail…
AUDm FY09 FY10 Mvt
C h 35 8 51 7
Balance Sheet
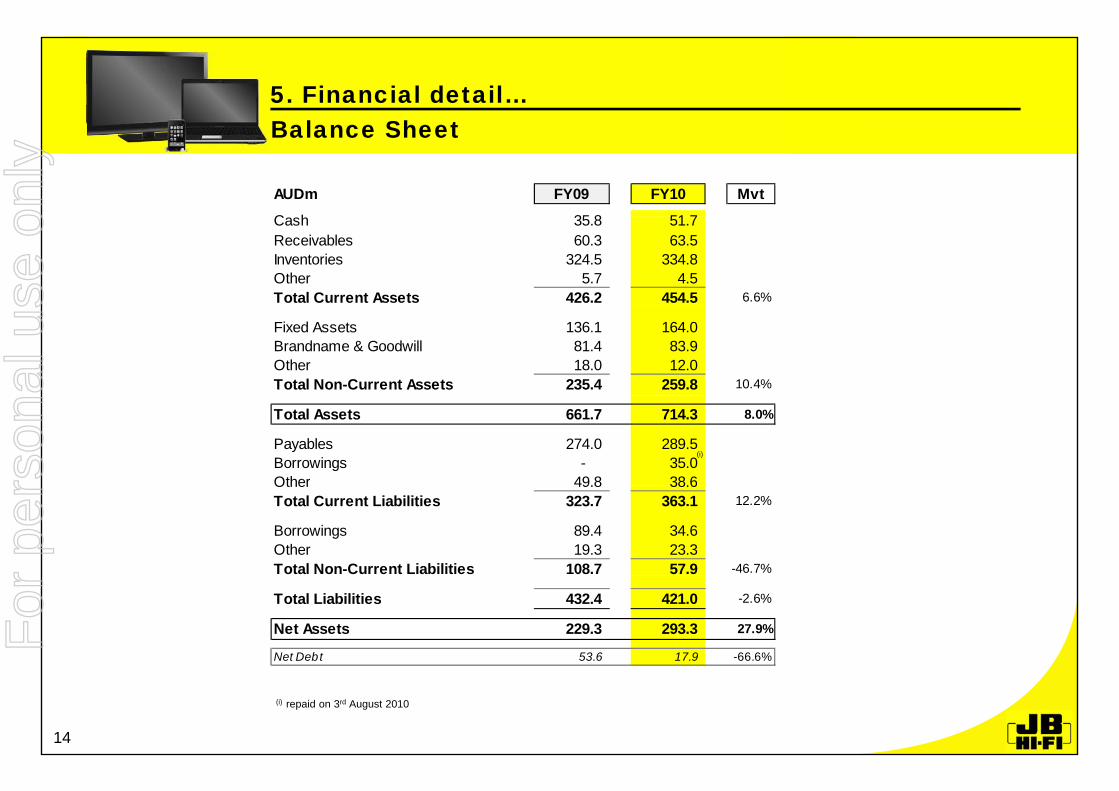
Cash 35.8 51.7 Receivables 60.3 63.5 Inventories 324.5 334.8 Other 5.7 4.5 Total Current Assets 426.2 454.5 6.6%
Fixed Assets 136.1 164.0 Brandname & Goodwill 81.4 83.9 Other 18.0 12.0 Total Non-Current Assets 235.4 259.8 10.4%
Total Assets 661.7 714.3 8.0%
Payables 274.0 289.5 Borrowings - 35.0 Other 49.8 38.6
(i)
Other 49.8 38.6 Total Current Liabilities 323.7 363.1 12.2%
Borrowings 89.4 34.6 Other 19.3 23.3 Total Non-Current Liabilities 108.7 57.9 -46.7%
Total Liabilities 432.4 421.0 -2.6%
Net Assets 229.3 293.3 27.9%
Net Debt 53.6 17.9 -66.6%
14
(i) repaid on 3rd August 2010
For
per
sona
l use
onl
y
Cash Flow Statement5. Financial detail…
AUDm FY09 FY10 Mvt
EBITDA 160 7 198 4 23 4%
Cash Flow Statement
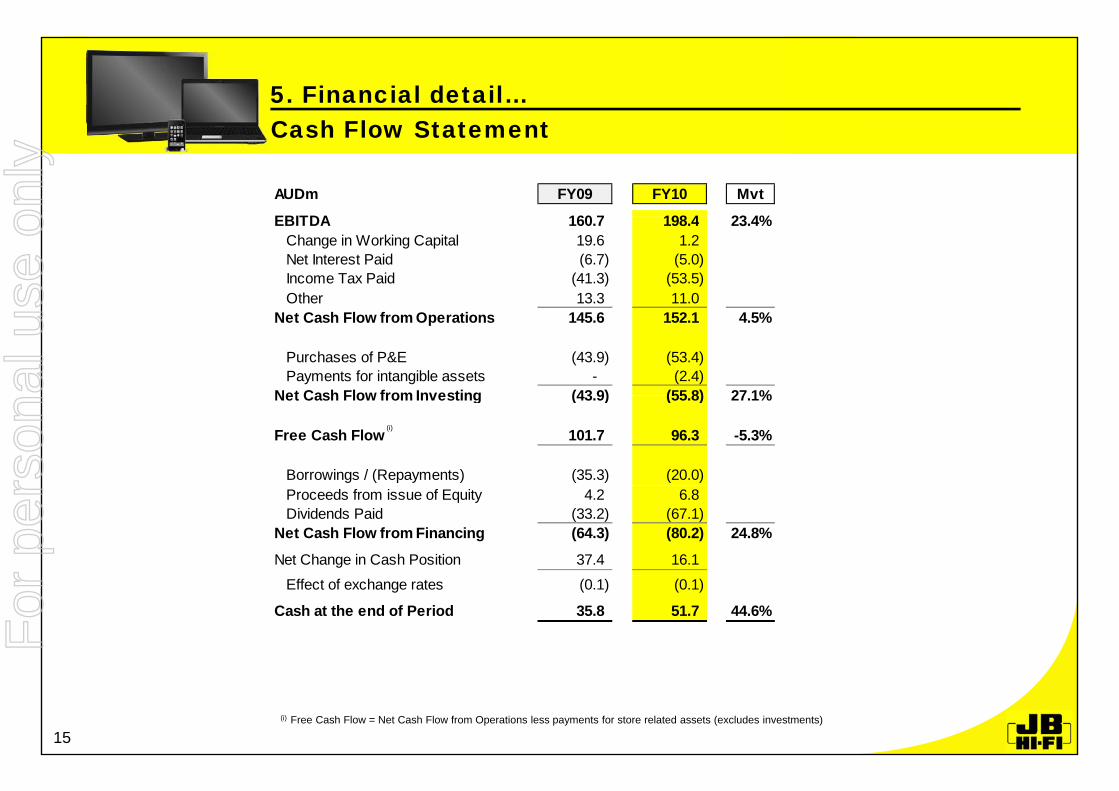
EBITDA 160.7 198.4 23.4%Change in Working Capital 19.6 1.2 Net Interest Paid (6.7) (5.0)Income Tax Paid (41.3) (53.5)Other 13.3 11.0
Net Cash Flow from Operations 145.6 152.1 4.5%
Purchases of P&E (43.9) (53.4)Payments for intangible assets - (2.4)
Net Cash Flow from Investing (43 9) (55 8) 27 1%Net Cash Flow from Investing (43.9) (55.8) 27.1%
Free Cash Flow 101.7 96.3 -5.3%
Borrowings / (Repayments) (35.3) (20.0)
(i)
Proceeds from issue of Equity 4.2 6.8 Dividends Paid (33.2) (67.1)
Net Cash Flow from Financing (64.3) (80.2) 24.8%
Net Change in Cash Position 37.4 16.1
Effect of exchange rates (0.1) (0.1)
Cash at the end of Period 35.8 51.7 44.6%
15(i) Free Cash Flow = Net Cash Flow from Operations less payments for store related assets (excludes investments)
For
per
sona
l use
onl
y
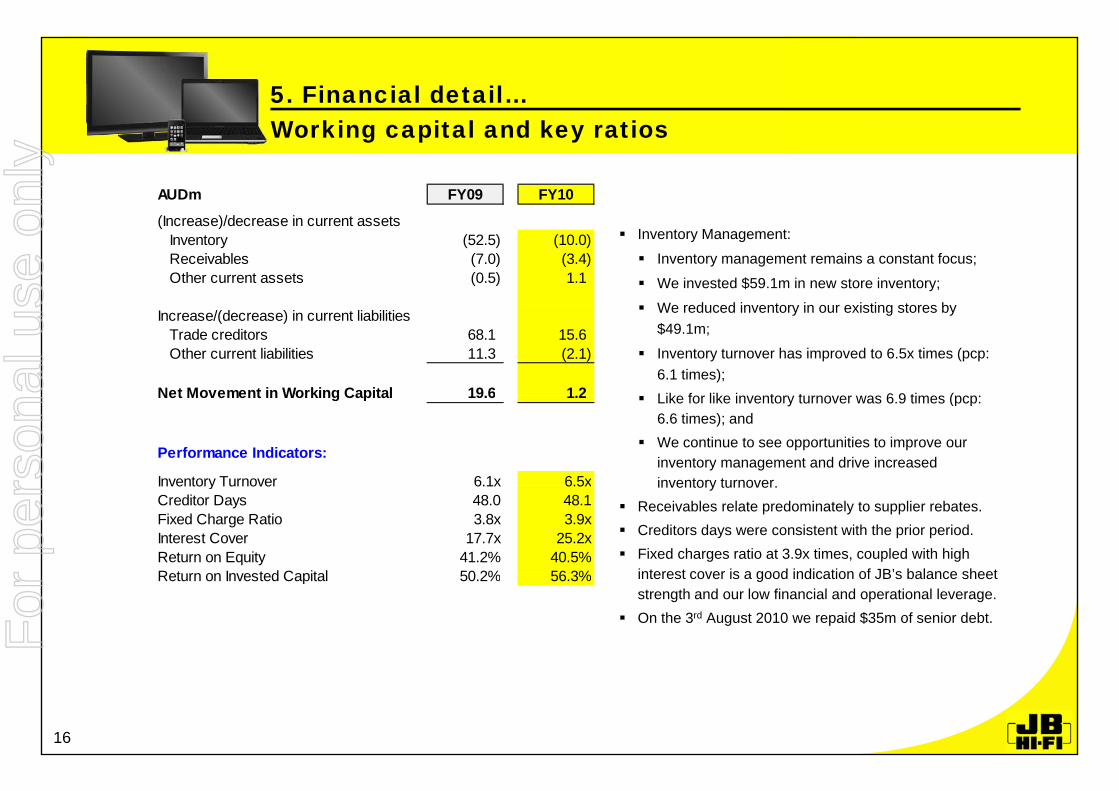
Working capital and key ratios5. Financial detail…Working capital and key ratios
AUDm FY09 FY10
(I )/d i t t Inventory Management:
Inventory management remains a constant focus;
We invested $59.1m in new store inventory;
We reduced inventory in our existing stores by
(Increase)/decrease in current assetsInventory (52.5) (10.0)Receivables (7.0) (3.4)Other current assets (0.5) 1.1
We reduced inventory in our existing stores by $49.1m;
Inventory turnover has improved to 6.5x times (pcp: 6.1 times); Like for like in entor t rno er as 6 9 times (pcp
Increase/(decrease) in current liabilitiesTrade creditors 68.1 15.6 Other current liabilities 11.3 (2.1)
Net Movement in Working Capital 19 6 1 2 Like for like inventory turnover was 6.9 times (pcp: 6.6 times); and
We continue to see opportunities to improve our inventory management and drive increased inventory turnover
Net Movement in Working Capital 19.6 1.2
Performance Indicators:
Inventory Turnover 6.1x 6.5x inventory turnover. Receivables relate predominately to supplier rebates. Creditors days were consistent with the prior period. Fixed charges ratio at 3.9x times, coupled with high
interest cover is a good indication of JB’s balance sheet
Inventory Turnover 6.1x 6.5xCreditor Days 48.0 48.1Fixed Charge Ratio 3.8x 3.9xInterest Cover 17.7x 25.2xReturn on Equity 41.2% 40.5%Return on Invested Capital 50 2% 56 3% interest cover is a good indication of JB s balance sheet
strength and our low financial and operational leverage. On the 3rd August 2010 we repaid $35m of senior debt.
Return on Invested Capital 50.2% 56.3%
16
For
per
sona
l use
onl
y
6. Dividends
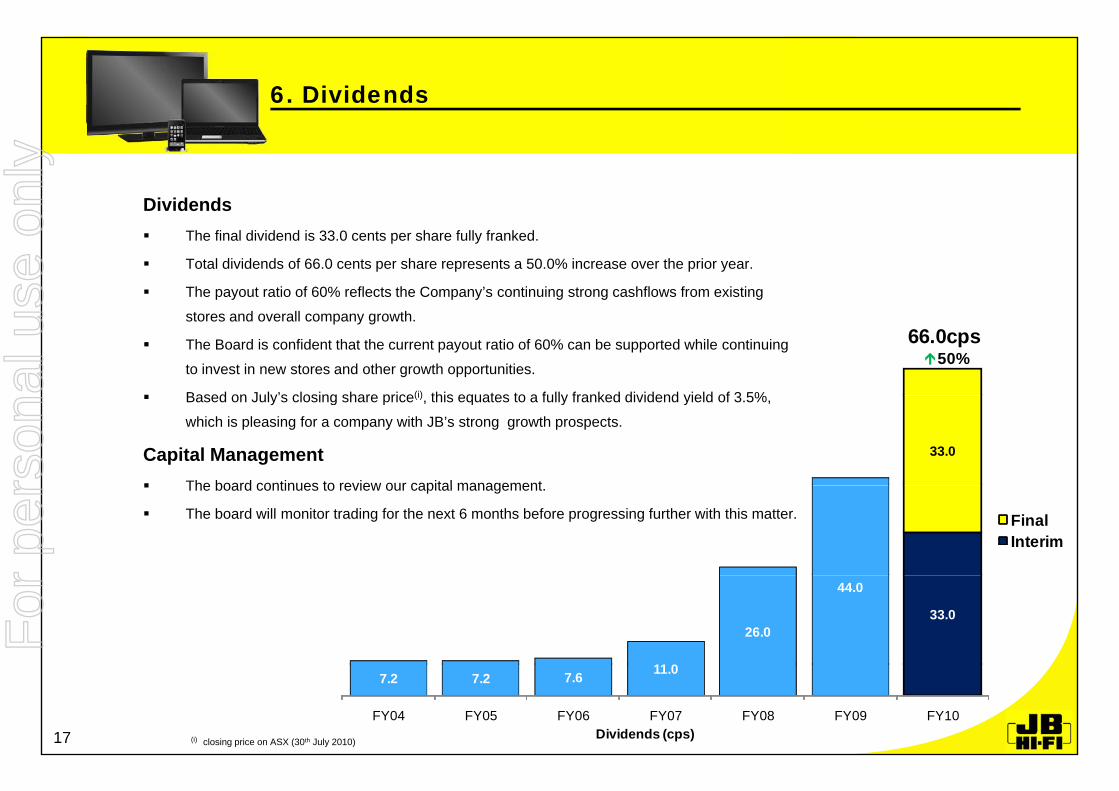
Dividends The final dividend is 33.0 cents per share fully franked.
Total dividends of 66.0 cents per share represents a 50.0% increase over the prior year.
The payout ratio of 60% reflects the Company’s continuing strong cashflows from existing
66.0cps50%
stores and overall company growth.
The Board is confident that the current payout ratio of 60% can be supported while continuing
to invest in new stores and other growth opportunities.
Based on July’s closing share price(i) this equates to a fully franked dividend yield of 3 5%
33.0
Based on July s closing share price(i), this equates to a fully franked dividend yield of 3.5%,
which is pleasing for a company with JB’s strong growth prospects.
Capital Management The board continues to review our capital management
FinalInterim
The board continues to review our capital management.
The board will monitor trading for the next 6 months before progressing further with this matter.
33.0
11 0
26.0
44.0
7.2 7.2 7.6 11.0
FY04 FY05 FY06 FY07 FY08 FY09 FY10Dividends (cps)17 (i) closing price on ASX (30th July 2010)
For
per
sona
l use
onl
y
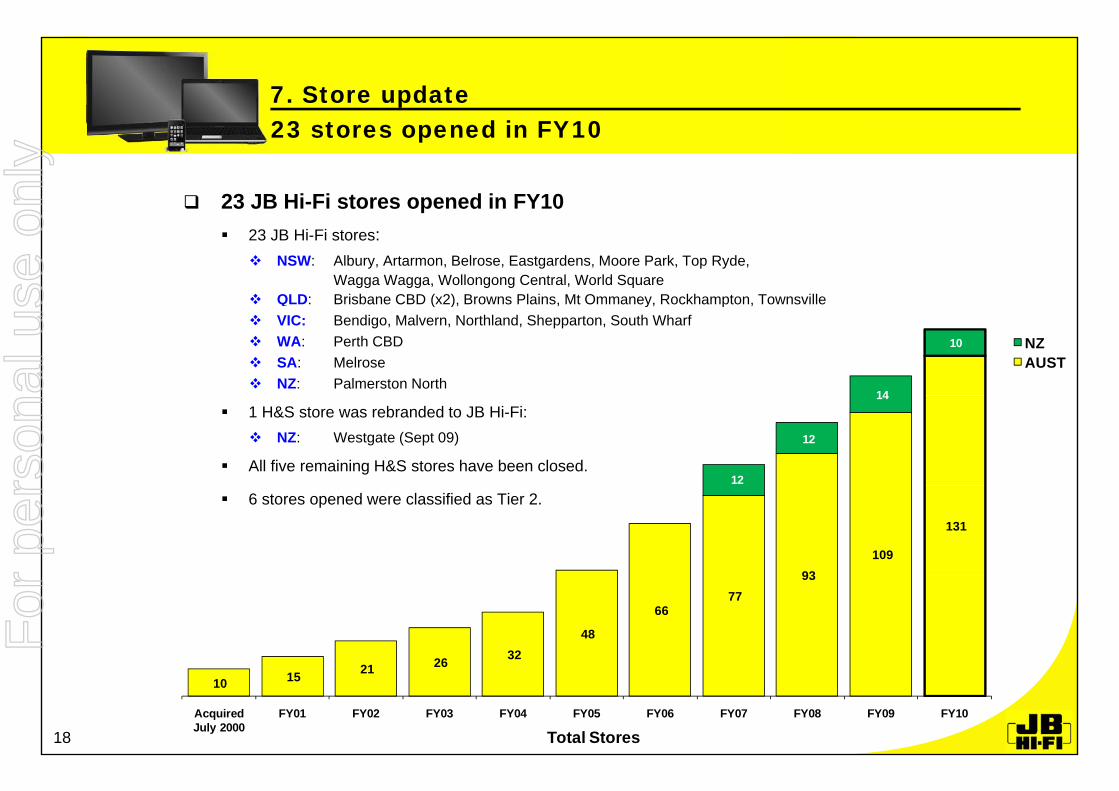
23 stores opened in FY10 7. Store update
23 JB Hi-Fi stores opened in FY10
23 stores opened in FY10
23 JB Hi-Fi stores: NSW: Albury, Artarmon, Belrose, Eastgardens, Moore Park, Top Ryde,
Wagga Wagga, Wollongong Central, World Square QLD: Brisbane CBD (x2), Browns Plains, Mt Ommaney, Rockhampton, Townsville
14
10 NZAUST
( ), , y, p , VIC: Bendigo, Malvern, Northland, Shepparton, South Wharf WA: Perth CBD SA: Melrose NZ: Palmerston North
12
12
14 1 H&S store was rebranded to JB Hi-Fi:
NZ: Westgate (Sept 09)
All five remaining H&S stores have been closed.
93109
131
6 stores opened were classified as Tier 2.
21 26 32 48
66 77
93
10 15 21 26
Acquired July 2000
FY01 FY02 FY03 FY04 FY05 FY06 FY07 FY08 FY09 FY10
Total Stores18
For
per
sona
l use
onl
y
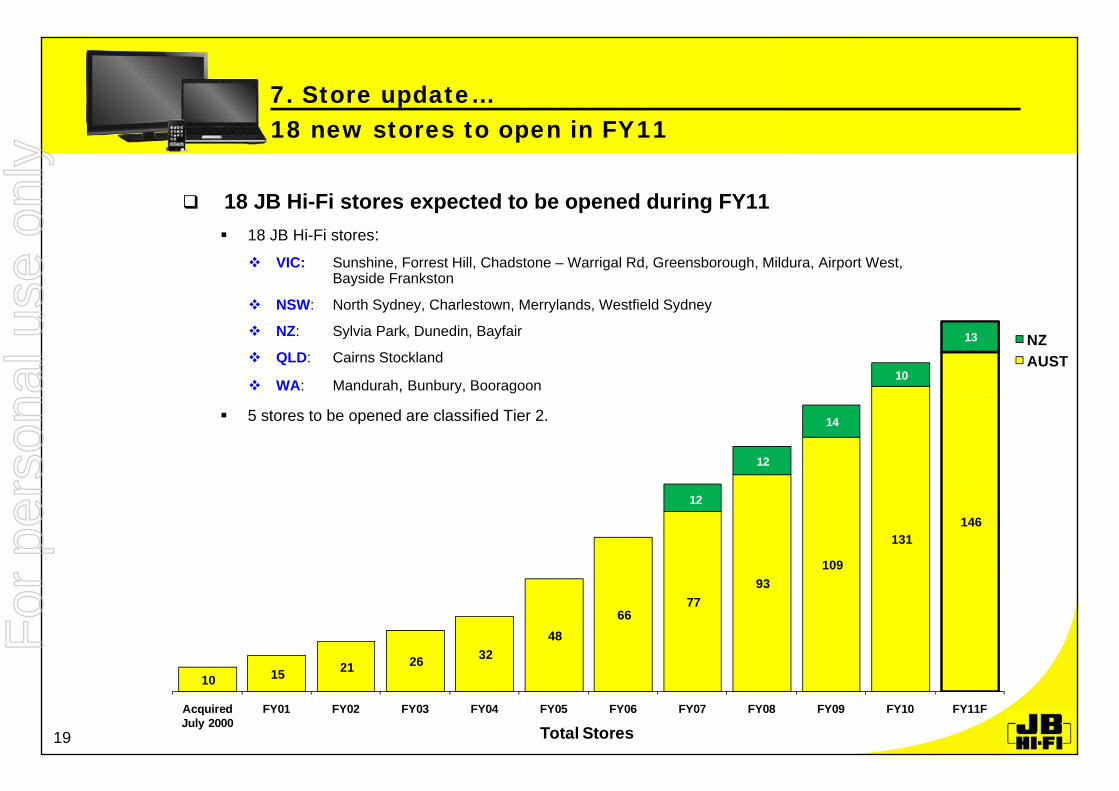
18 new stores to open in FY117. Store update…
18 JB Hi-Fi stores expected to be opened during FY11
18 new stores to open in FY11
18 JB Hi-Fi stores: VIC: Sunshine, Forrest Hill, Chadstone – Warrigal Rd, Greensborough, Mildura, Airport West,
Bayside Frankston
NSW: North Sydney Charlestown Merrylands Westfield Sydney
10
13 NZAUST
NSW: North Sydney, Charlestown, Merrylands, Westfield Sydney
NZ: Sylvia Park, Dunedin, Bayfair
QLD: Cairns Stockland
WA: Mandurah, Bunbury, Booragoon
12
14 5 stores to be opened are classified Tier 2.
109
131 146
12
21 26 32 48
66 77
93
10 15 21 26
Acquired July 2000
FY01 FY02 FY03 FY04 FY05 FY06 FY07 FY08 FY09 FY10 FY11F
Total Stores19
For
per
sona
l use
onl
y
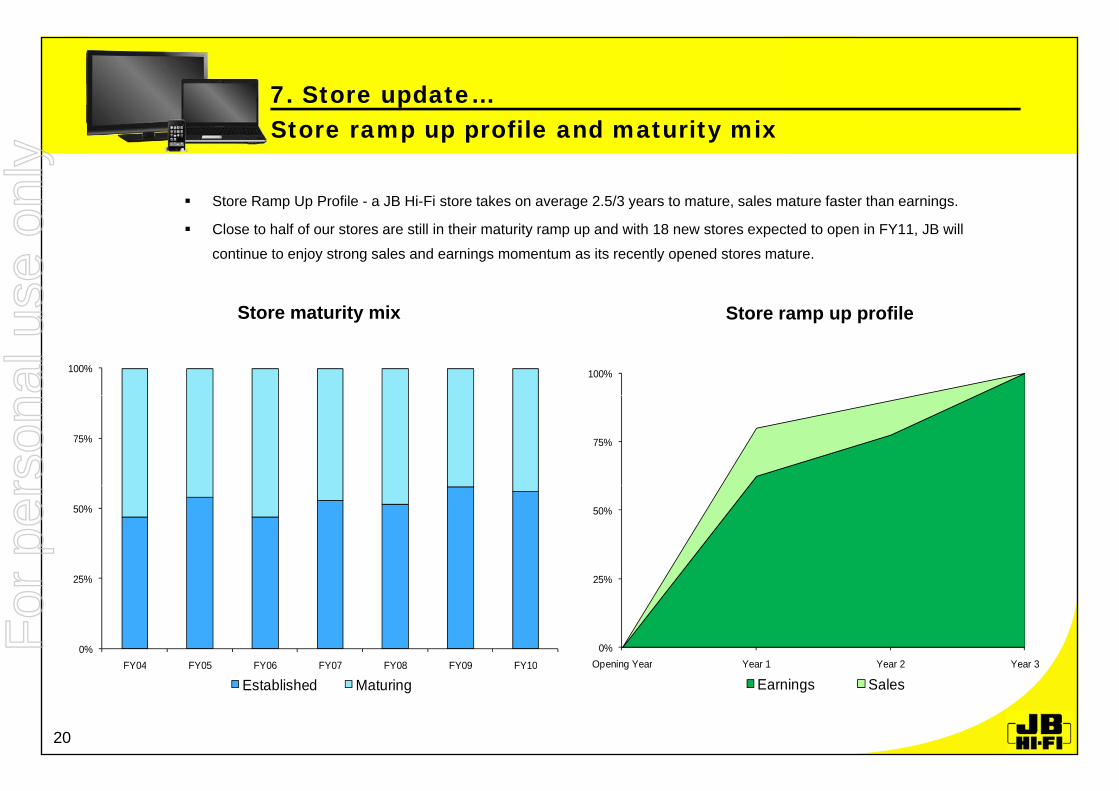
Store ramp up profile and maturity mix7. Store update…
Store Ramp Up Profile - a JB Hi-Fi store takes on average 2.5/3 years to mature, sales mature faster than earnings.
Store ramp up profile and maturity mix
St t it i
Close to half of our stores are still in their maturity ramp up and with 18 new stores expected to open in FY11, JB will
continue to enjoy strong sales and earnings momentum as its recently opened stores mature.
100% 100%
Store ramp up profileStore maturity mix
75% 75%
50% 50%
0%
25%
FY04 FY05 FY06 FY07 FY08 FY09 FY10
0%
25%
Opening Year Year 1 Year 2 Year 3FY04 FY05 FY06 FY07 FY08 FY09 FY10
Established MaturingOpening Year Year 1 Year 2 Year 3
Earnings Sales
20
For
per
sona
l use
onl
y
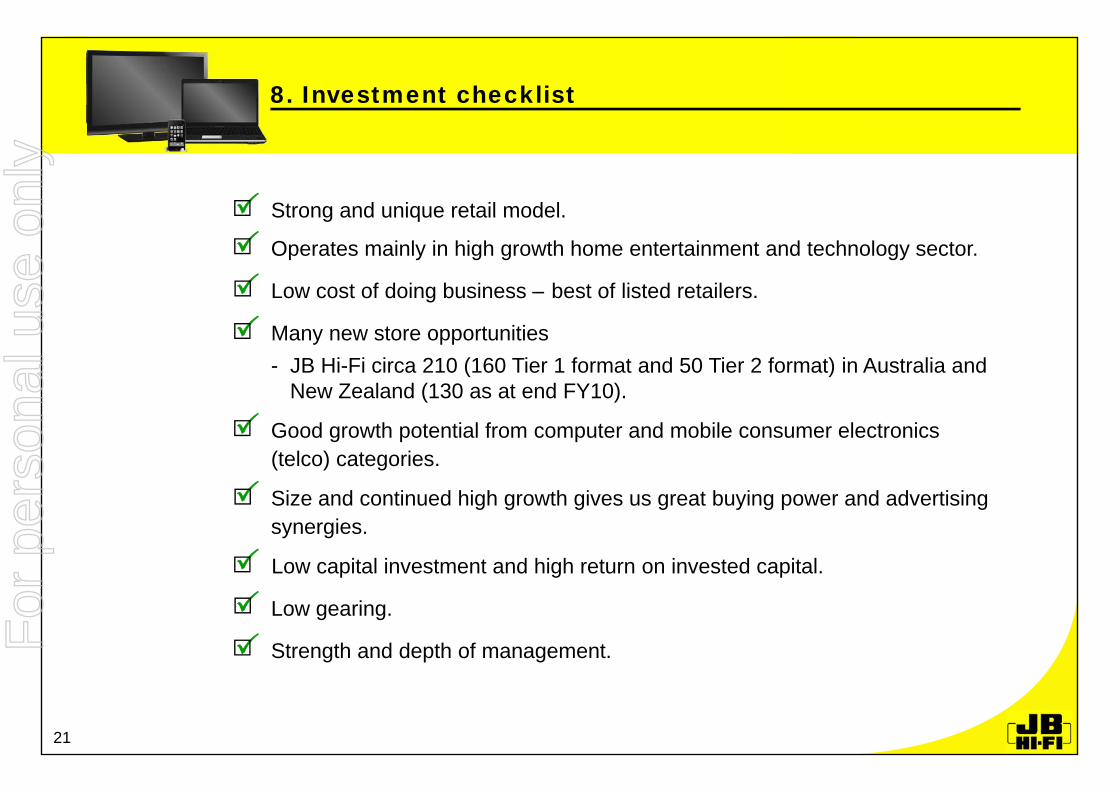
8. Investment checklist
Strong and unique retail model.Strong and unique retail model.
Operates mainly in high growth home entertainment and technology sector.
Low cost of doing business – best of listed retailers.
Many new store opportunities- JB Hi-Fi circa 210 (160 Tier 1 format and 50 Tier 2 format) in Australia and
New Zealand (130 as at end FY10)New Zealand (130 as at end FY10).
Good growth potential from computer and mobile consumer electronics (telco) categories.
Size and continued high growth gives us great buying power and advertising synergies.
Low capital investment and high return on invested capital.p g p
Low gearing.
Strength and depth of management.
21
For
per
sona
l use
onl
y
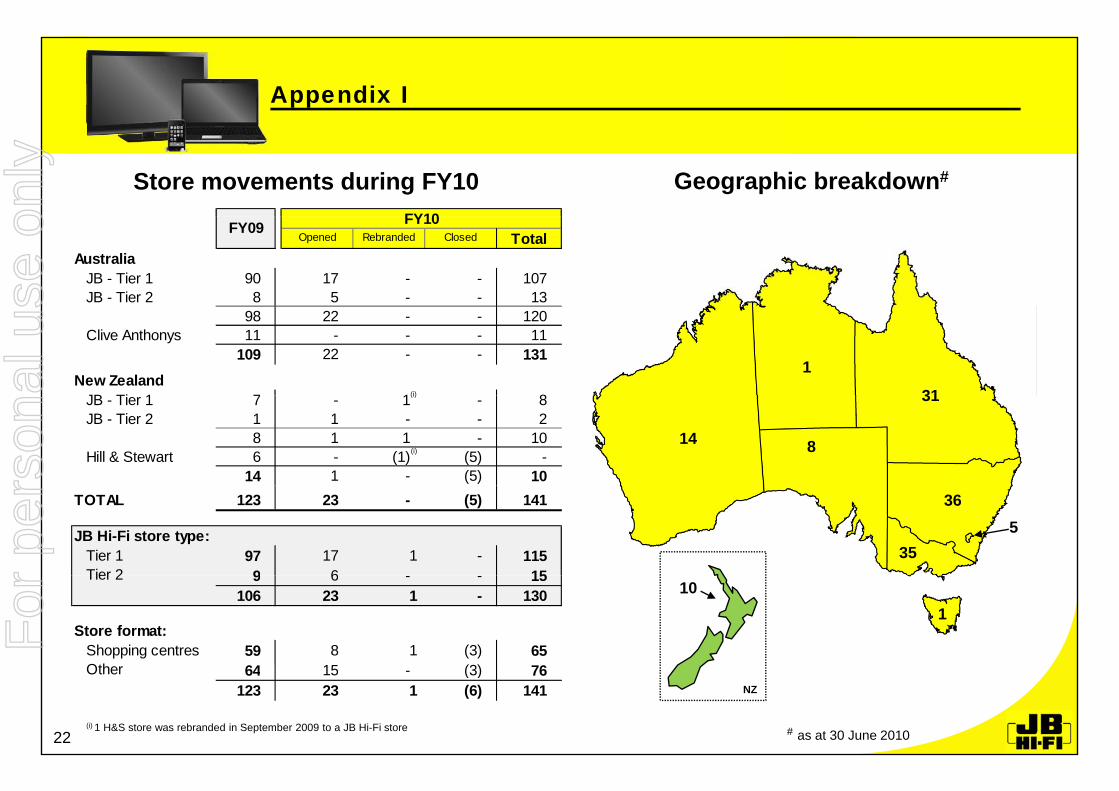
Appendix I
Geographic breakdown#Store movements during FY10 FY10
Opened Rebranded Closed TotalAustralia JB - Tier 1 90 17 - - 107 JB - Tier 2 8 5 - - 13
FY09 FY10
1
31(i)
98 22 - - 120 Clive Anthonys 11 - - - 11
109 22 - - 131New Zealand
JB Ti 1 7 1 8 31
814
(i)
(i)
JB - Tier 1 7 - 1 - 8 JB - Tier 2 1 1 - - 2
8 1 1 - 10 Hill & Stewart 6 - (1) (5) -
14 1 - (5) 1036
355
TOTAL 123 23 - (5) 141
JB Hi-Fi store type: Tier 1 97 17 1 - 115
Tier 2 9 6 1510
1
Tier 2 9 6 - - 15106 23 1 - 130
Store format: Shopping centres 59 8 1 (3) 65
Oth 64 15 (3) 6
# as at 30 June 201022(i) 1 H&S store was rebranded in September 2009 to a JB Hi-Fi store
NZ
Other 64 15 - (3) 76123 23 1 (6) 141
For
per
sona
l use
onl
y
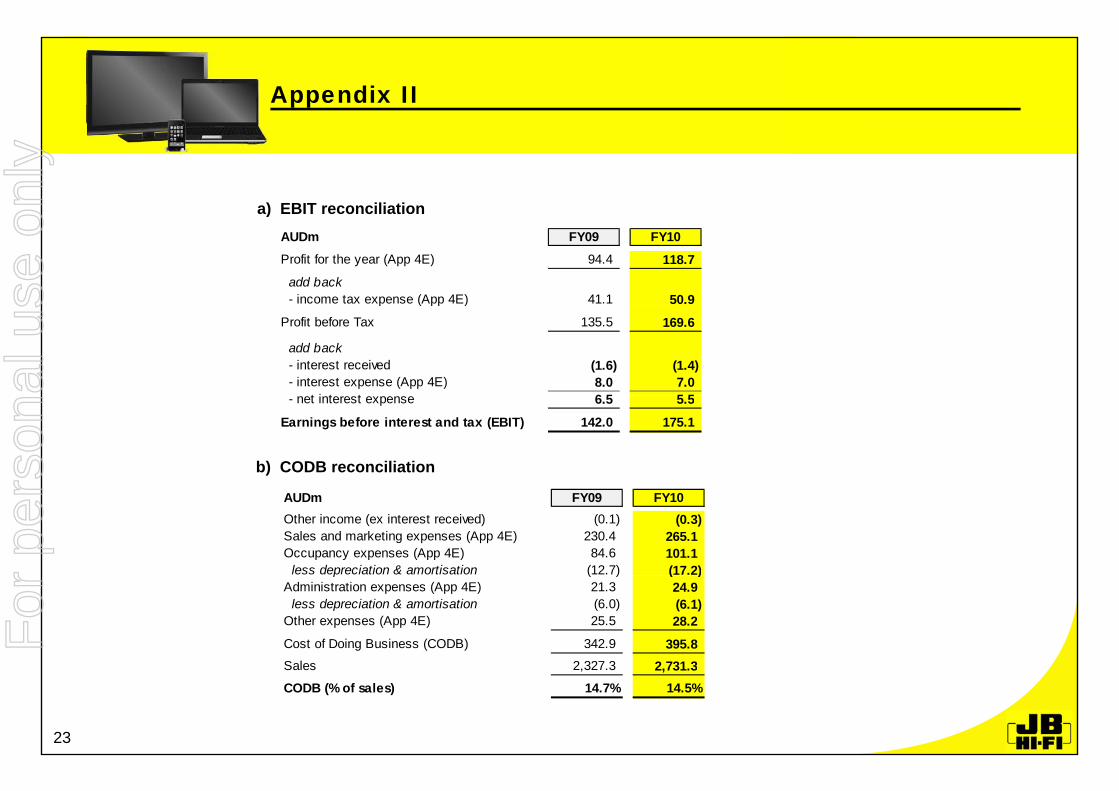
Appendix II
a) EBIT reconciliation)AUDm FY09 FY10Profit for the year (App 4E) 94.4 118.7 add back - income tax expense (App 4E) 41.1 50.9 p ( pp )
Profit before Tax 135.5 169.6
add back - interest received (1.6) (1.4) - interest expense (App 4E) 8.0 7.0
t i t t 6 5 5 5
b) CODB reconciliation
- net interest expense 6.5 5.5
Earnings before interest and tax (EBIT) 142.0 175.1
AUDm FY09 FY10Other income (ex interest received) (0.1) (0.3) Sales and marketing expenses (App 4E) 230.4 265.1 Occupancy expenses (App 4E) 84.6 101.1 less depreciation & amortisation (12.7) (17.2) p ( ) ( )Administration expenses (App 4E) 21.3 24.9 less depreciation & amortisation (6.0) (6.1) Other expenses (App 4E) 25.5 28.2 Cost of Doing Business (CODB) 342.9 395.8 Sales 2 327 3 2 731 3
23
Sales 2,327.3 2,731.3 CODB (% of sales) 14.7% 14.5%
For
per
sona
l use
onl
y
Appendix II…
c) Store typesJB Hi-Fi is currently targeting 210 stores in Australia and New Zealand. This target is split between Tier 1 (160 stores) and Tier 2 (50 stores). While each store is different, broadly the stores can be defined as follows:
Tier 1: approximately 1,100 to 1,300 sqm of which circa 80% is retail space. The investment in a new Tier 1 store is approximately $2 5m ($1 5m in capital expenditure and $1 0m in workingnew Tier 1 store is approximately $2.5m ($1.5m in capital expenditure and $1.0m in working capital); and
Tier 2: these stores are likely to be approximately 70% of a Tier 1 store in size and/or turnover. The investment in a new Tier 2 store is approximately $2.0m ($1.2m in capital expenditure and $0.8m in working capital).
d) Closure of H&S Chain – financial implications We closed our 5 remaining H&S stores in FY10. 1 store was rebranded to JB Hi-Fi.
$ $ The H&S stores contributed NZ$20.3m/AU$16.2m in sales, representing less than 15% of our NZ turnover;
The cost of exiting the H&S business was circa AU$2.5m, mainly relating to asset write-offs. The P&L impact of these costs was offset by the release of provisions raised in the FY09
lid t d fi i l lt A lt th i t FY10 lid t d iconsolidated financial results. As a result, there was no impact on FY10 consolidated earnings. The H&S stores operating loss in FY10 was circa AU$1.5m.
24
For
per
sona
l use
onl
y
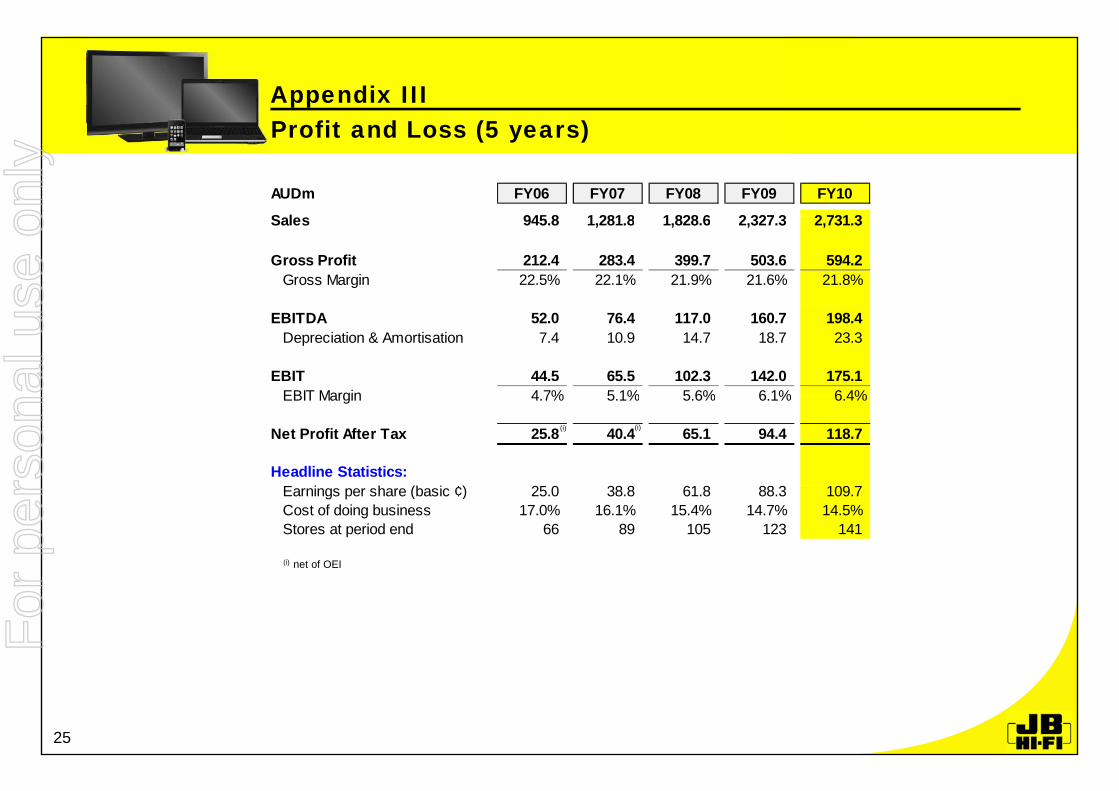
Profit and Loss (5 years)Appendix III
AUDm FY06 FY07 FY08 FY09 FY10
S l 945 8 1 281 8 1 828 6 2 327 3 2 731 3
Profit and Loss (5 years)
Sales 945.8 1,281.8 1,828.6 2,327.3 2,731.3
Gross Profit 212.4 283.4 399.7 503.6 594.2 Gross Margin 22.5% 22.1% 21.9% 21.6% 21.8%
EBITDA 52.0 76.4 117.0 160.7 198.4 Depreciation & Amortisation 7.4 10.9 14.7 18.7 23.3
EBIT 44.5 65.5 102.3 142.0 175.1 EBIT Margin 4 7% 5 1% 5 6% 6 1% 6 4%EBIT Margin 4.7% 5.1% 5.6% 6.1% 6.4%
Net Profit After Tax 25.8 40.4 65.1 94.4 118.7
Headline Statistics:( )
(i) (i)
Earnings per share (basic ¢) 25.0 38.8 61.8 88.3 109.7 Cost of doing business 17.0% 16.1% 15.4% 14.7% 14.5% Stores at period end 66 89 105 123 141
(i) net of OEI
25
For
per
sona
l use
onl
y
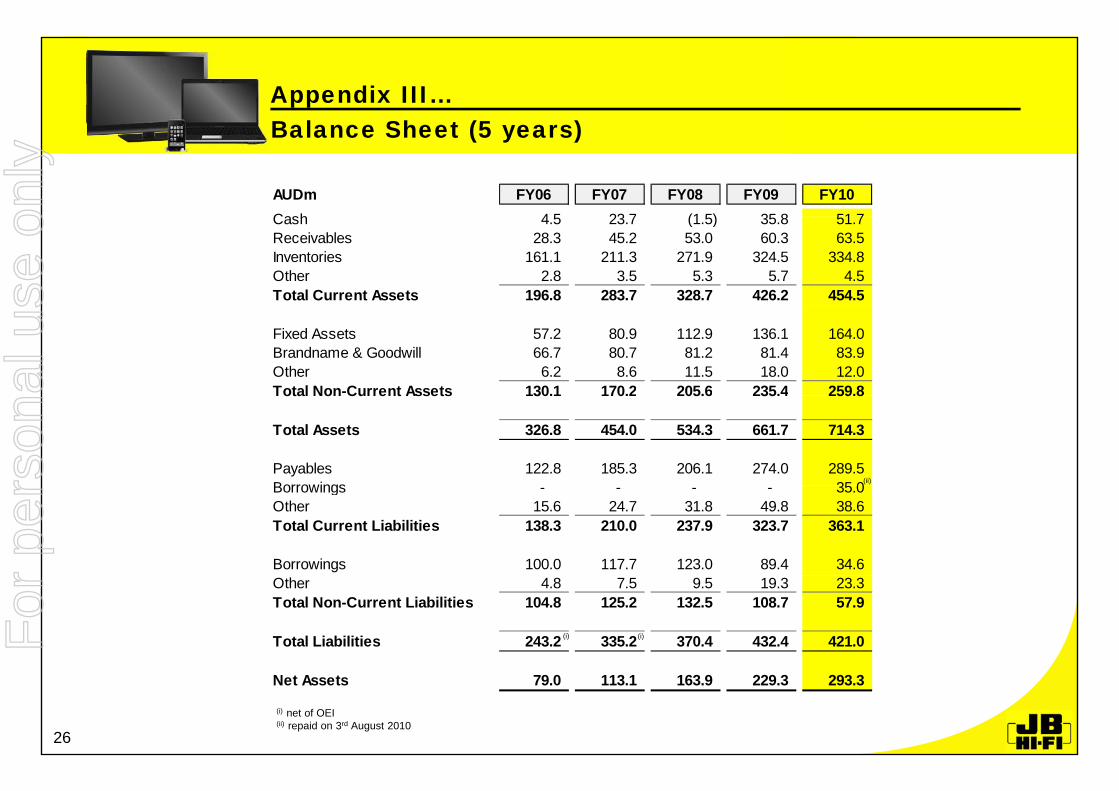
Balance Sheet (5 years)Appendix III…
AUDm FY06 FY07 FY08 FY09 FY10C h 4 5 23 7 (1 5) 35 8 51 7
Balance Sheet (5 years)
Cash 4.5 23.7 (1.5) 35.8 51.7 Receivables 28.3 45.2 53.0 60.3 63.5 Inventories 161.1 211.3 271.9 324.5 334.8 Other 2.8 3.5 5.3 5.7 4.5 Total Current Assets 196.8 283.7 328.7 426.2 454.5
Fixed Assets 57.2 80.9 112.9 136.1 164.0 Brandname & Goodwill 66.7 80.7 81.2 81.4 83.9 Other 6.2 8.6 11.5 18.0 12.0 Total Non-Current Assets 130.1 170.2 205.6 235.4 259.8Total Non Current Assets 130.1 170.2 205.6 235.4 259.8
Total Assets 326.8 454.0 534.3 661.7 714.3
Payables 122.8 185.3 206.1 274.0 289.5 Borrowings 35 0(ii) Borrowings - - - - 35.0 Other 15.6 24.7 31.8 49.8 38.6 Total Current Liabilities 138.3 210.0 237.9 323.7 363.1
Borrowings 100.0 117.7 123.0 89.4 34.6 Other 4.8 7.5 9.5 19.3 23.3 Total Non-Current Liabilities 104.8 125.2 132.5 108.7 57.9
Total Liabilities 243.2 335.2 370.4 432.4 421.0 (i) (i)
Net Assets 79.0 113.1 163.9 229.3 293.3
26
(i) net of OEI(ii) repaid on 3rd August 2010
For
per
sona
l use
onl
y
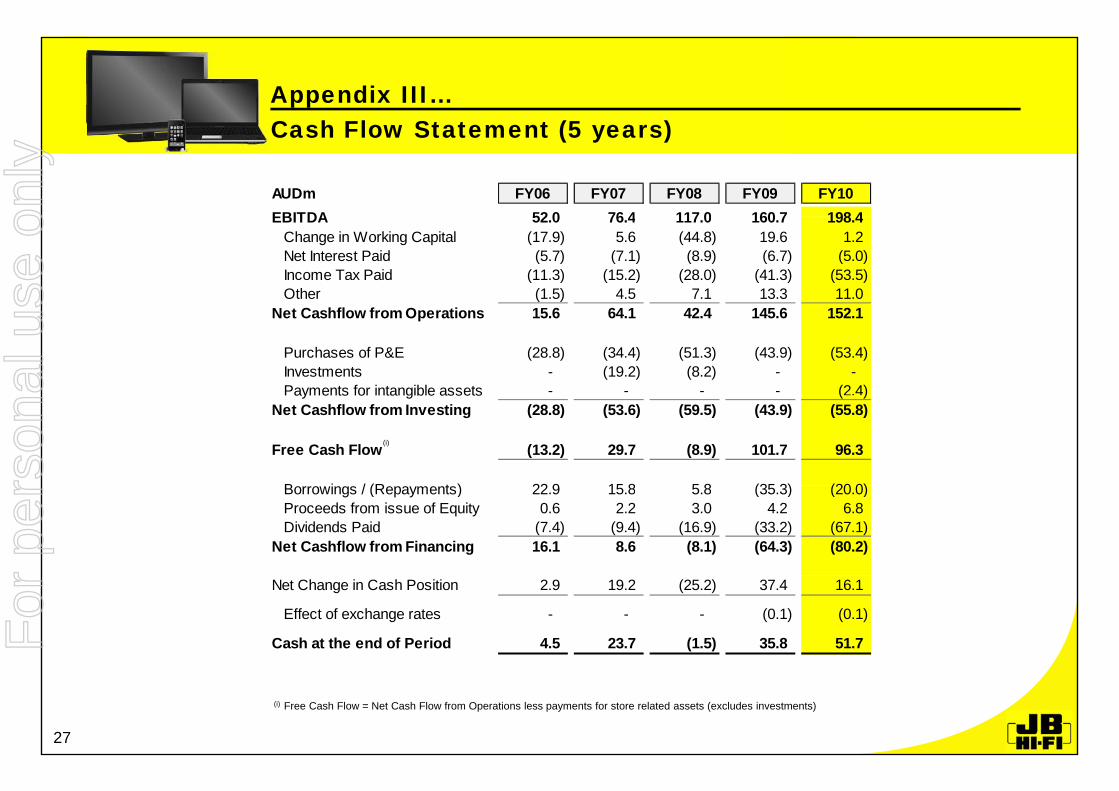
Cash Flow Statement (5 years)Appendix III…
AUDm FY06 FY07 FY08 FY09 FY10EBITDA 52 0 76 4 117 0 160 7 198 4
Cash Flow Statement (5 years)
EBITDA 52.0 76.4 117.0 160.7 198.4 Change in Working Capital (17.9) 5.6 (44.8) 19.6 1.2 Net Interest Paid (5.7) (7.1) (8.9) (6.7) (5.0)Income Tax Paid (11.3) (15.2) (28.0) (41.3) (53.5)Other (1.5) 4.5 7.1 13.3 11.0
Net Cashflow from Operations 15.6 64.1 42.4 145.6 152.1
Purchases of P&E (28.8) (34.4) (51.3) (43.9) (53.4)Investments - (19.2) (8.2) - -Payments for intangible assets - - - - (2.4)ay e ts o ta g b e assets ( )
Net Cashflow from Investing (28.8) (53.6) (59.5) (43.9) (55.8)
Free Cash Flow (13.2) 29.7 (8.9) 101.7 96.3
B i / (R t ) 22 9 15 8 5 8 (35 3) (20 0)
(i)
Borrowings / (Repayments) 22.9 15.8 5.8 (35.3) (20.0)Proceeds from issue of Equity 0.6 2.2 3.0 4.2 6.8 Dividends Paid (7.4) (9.4) (16.9) (33.2) (67.1)
Net Cashflow from Financing 16.1 8.6 (8.1) (64.3) (80.2)
Net Change in Cash Position 2.9 19.2 (25.2) 37.4 16.1
Effect of exchange rates - - - (0.1) (0.1)
Cash at the end of Period 4.5 23.7 (1.5) 35.8 51.7
27
(i) Free Cash Flow = Net Cash Flow from Operations less payments for store related assets (excludes investments)
For
per
sona
l use
onl
y