Embed Size (px)
Citation preview
ABN 39 069 141 546
For
per
sona
l use
onl
y
C o r p o r a t e D i r e c t o r y
DIRECTORS
Reginald Webb Chairman
Peter Cumins Managing Director
John Yeudall Non-Executive Director
William Love Non-Executive Director
Joseph Beal Non-Executive Director
COMPANY SECRETARY
Ralph Groom
REGISTERED OFFICE
Level 18, Citibank House
37 St George’s Terrace
Perth Western Australia 6000
WEBSITE
www.cashconverters.com
SHARE REGISTRARS
IN AUSTRALIA:
Computershare Investor Services Pty Limited
Level 2, Reserve Bank Building
45 St George’s Terrace
Perth Western Australia 6000
IN UNITED KINGDOM:
Computershare Investor Services PLC
PO Box 82
The Pavilions
Bridgewater Road
Bristol BS 99 7NH
AUDITORS
Deloitte Touche Tohmatsu
Level 14, Woodside Plaza
240 St George’s Terrace
Perth Western Australia 6000
SOLICITORS
Cooke & Co
50 Eora Creek Terrace
Dianella Western Australia 6059
BANKERS
IN AUSTRALIA:
Westpac Business Bank
109 St George’s Terrace
Perth Western Australia 6000
IN UNITED KINGDOM:
HSBC
8 Canada Square
London
United Kingdom E14 5HQ
STOCK EXCHANGE
IN AUSTRALIA:
Australian Stock Exchange
Exchange Plaza, 2 The Esplanade
Perth Western Australia 6000
IN UNITED KINGDOM:
London Stock Exchange Limited
London United Kingdom
EC2N 1HP
For
per
sona
l use
onl
y
1
Chairman and Managing Director’s Review 2
Review of the Year 8
Historical Performance 9
History 10
Group Structure 11
Corporate Objectives 12
Core Business 12
Directors’ Profiles 13
Financial Report Contents 14
Directors’ Report 15
Corporate Governance 26
Consolidated Statement of Comprehensive Income 29
Consolidated Statement of Financial Position 30
Consolidated Statement of Changes in Equity 31
Consolidated Statement of Cash Flows 32
Notes to the Consolidated Financial Statements 33
Directors’ Declaration 72
Independent Audit Report to the Members 73
Independence Declaration 75
Shareholder Information 76
For
per
sona
l use
onl
y
Ch a i r m a n a n d Man a g i n g D i r e c t o r ’s R ev i ew
The directors of Cash Converters International Limited
(‘Cash Converters’) are pleased to report a record profit result of
2
This result is particularly pleasing considering the impact of the Queensland floods which
severely damaged our corporately owned store located in Goodna. Write-offs to inventory and
fixtures and fittings, combined with damage to customers’ pawned goods and the prolonged
store closure have all had a negative profit impact, resulting in a loss against budget of
approximately $1.5 million. The insurance company has refused to honour our claim in respect
to damages and losses incurred pursuant to the flood. Cash Converters intend to challenge
this decision. The store has been re-fitted and was re-opened in July. Partially compensating
the above losses is a one-off gain of approximately $1.2 million relating to a reduction in
contingent consideration associated with the acquisition of the Goodna store.
The Group has also incurred the following unbudgeted, one-off costs, during the financial year:
� Professional fees associated with the unwinding of the Dividend Access Scheme and the
issue of a catch up prospectus in relation to Cash Converter’s London Stock Exchange
listing, required by the United Kingdom Listing Authority (“UKLA”), amounted to
approximately $800,000 in fees which were charged to the income statement; and
� Professional fees associated with the transaction with the EZCORP alliance announced to
the ASX on 22 March 2011 have resulted in a charge to the income statement of
approximately $500,000.
In total these unbudgeted one-off items have had an approximate $1.6 million negative impact
on the 30 June 2011 profit before tax. Other than the gain noted above there were no
unbudgeted or one-off revenue streams.
In addition to the above costs the income statement included the following additional costs
not previously incurred:
� The Long Term Incentive plan approved at the last Annual General Meeting as part of the
remuneration package for the Managing Director has resulted in an expense of
approximately $700,000;
� An expense of approximately $460,000 in relation to stamp duty on acquisitions;
� Amortisation of re-acquired rights and customer relationships of $444,700; and
� An expense of approximately $700,000 in relation to a GST adjustment (Division 135)
related to prior year store acquisitions.
$27.6 million for the 2011 financial year,
an increase of 27.5% over the previous year.
For
per
sona
l use
onl
y
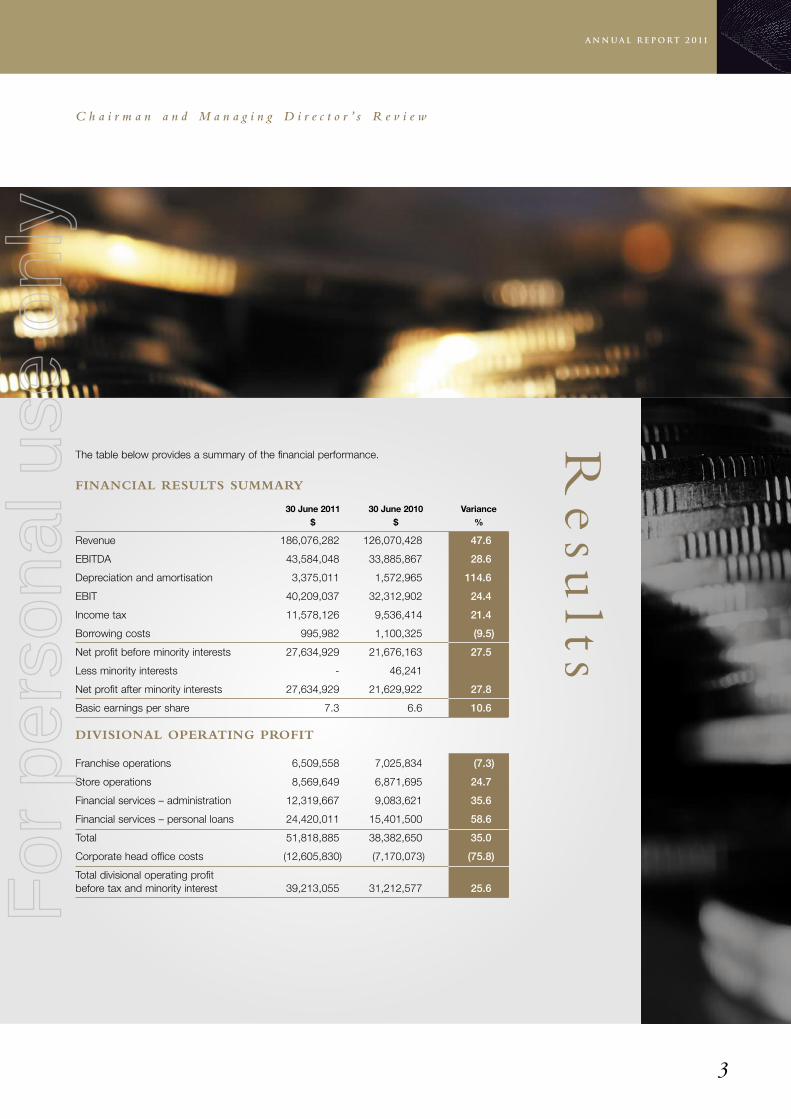
The table below provides a summary of the financial performance.
FINANCIAL RESULTS SUMMARY
30 June 2011 30 June 2010 Variance$ $ %
Revenue 186,076,282 126,070,428 47.6
EBITDA 43,584,048 33,885,867 28.6
Depreciation and amortisation 3,375,011 1,572,965 114.6
EBIT 40,209,037 32,312,902 24.4
Income tax 11,578,126 9,536,414 21.4
Borrowing costs 995,982 1,100,325 (9.5)
Net profit before minority interests 27,634,929 21,676,163 27.5
Less minority interests - 46,241
Net profit after minority interests 27,634,929 21,629,922 27.8
Basic earnings per share 7.3 6.6 10.6
DIVISIONAL OPERATING PROFIT
Franchise operations 6,509,558 7,025,834 (7.3)
Store operations 8,569,649 6,871,695 24.7
Financial services – administration 12,319,667 9,083,621 35.6
Financial services – personal loans 24,420,011 15,401,500 58.6
Total 51,818,885 38,382,650 35.0
Corporate head office costs (12,605,830) (7,170,073) (75.8)
Total divisional operating profitbefore tax and minority interest 39,213,055 31,212,577 25.6
C h a i r m a n a n d M a n a g i n g D i r e c t o r ’ s R e v i e w
3
Re
sults
For
per
sona
l use
onl
y

C h a i r m a n a n d M a n a g i n g D i r e c t o r ’ s R e v i e w
4
� The 2011 financial year has been the most successful in the Company’s
history, with a record net profit of $27.6 million, up 27.5% on the previous
year.
� Revenue growth of 47.6% to $186.1 million. The major drivers for revenue
growth over the year included an increase in personal loan interest of
$12.2 million and establishment fees of $5.0 million, an increase in
corporate store revenue of $38.3 million and an increase in financial
services commission of $4.8 million.
� The franchised store acquisition strategy maintained momentum with the
acquisition of 21 franchised stores during the financial year (six in the UK
and 15 in Australia). In addition, 14 ‘greenfield’ company owned stores
were opened in the UK and one in Australia, taking total corporate store
numbers as at 30 June 2011 to 88 – 46 in the UK and 42 in Australia.
� The corporate store network in the UK and Australia has seen revenues
grow by 61.3% to $100.9 million producing a combined EBIT of $8.6
million (up 24.7% on 2010), with only a part year contribution from 21
staggered store acquisitions.
� The personal loan book in Australia grew 36.1% to $52.7 million and the
loan book in the UK grew 746% to £5 million. The personal loans business
generated an EBIT of $24.4 million (2010 $15.4 million) which is 58.6% up
on the previous year.
� The cash advance administration platform in Australia and the UK,
generated an EBIT of $12.3 million (2010 $9.1 million) which is up 35.6%
on the previous year.
� The UK franchised business performed strongly and contributed an EBIT
of $2.1 million. Store numbers (company owned and franchised) grew by
a record 37 stores to 194 stores.
� The sub-master licence for Scotland was acquired on 2 December 2010.
There are currently ten franchised stores in Scotland contracted to pay
weekly fees which total £188,000 per annum. It is this income stream that
the company has acquired from the sub-master licence holder, plus the
rights to develop the Cash Converters store network in Scotland to its full
potential, which is anticipated to be approximately 60 stores in total.
Hig
hlig
hts
For
per
sona
l use
onl
y
C h a i r m a n a n d M a n a g i n g D i r e c t o r ’ s R e v i e w
5
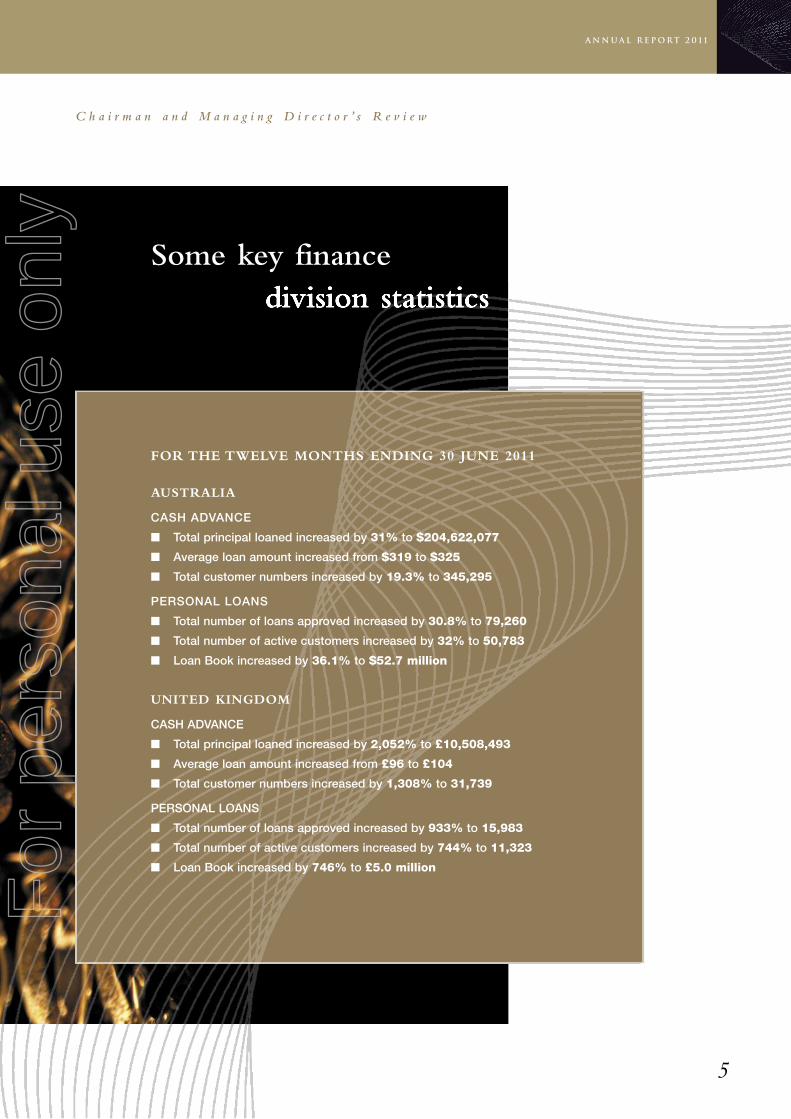
Some key financedivision statistics
FOR THE TWELVE MONTHS ENDING 30 JUNE 2011
AUSTRALIA
CASH ADVANCE
� Total principal loaned increased by 31% to $204,622,077
� Average loan amount increased from $319 to $325
� Total customer numbers increased by 19.3% to 345,295
PERSONAL LOANS
� Total number of loans approved increased by 30.8% to 79,260
� Total number of active customers increased by 32% to 50,783
� Loan Book increased by 36.1% to $52.7 million
UNITED KINGDOM
CASH ADVANCE
� Total principal loaned increased by 2,052% to £10,508,493
� Average loan amount increased from £96 to £104
� Total customer numbers increased by 1,308% to 31,739
PERSONAL LOANS
� Total number of loans approved increased by 933% to 15,983
� Total number of active customers increased by 744% to 11,323
� Loan Book increased by 746% to £5.0 million
For
per
sona
l use
onl
y
ONLINE
Cash Converters online presence allows us to present the business to a new audience of potential customers at a
low delivery cost.
We have seen new customers visit stores and purchase product after their first contact with the brand commenced
with their online search. We are also beginning to see commercial quantities of product sales, with over $2.1 million
of sales during 2011.
The Company receives a commission based on an agreed percentage of sales for providing the ‘Webshop’ online
service to its franchisees.
SOME KEY ONLINE STATISTICS:
UK Australia
Registered users 107,296 31,619
Unique visitors 2,144,386 1,157,762
Total page views 39,043,271 15,847,419
These statistics show that we now have a significant number of visitors to our UK and Australian Webshop sites. Our
strategy will be to maximise the commercial opportunities that these new customers present.
ONLINE LENDING OPPORTUNITIES
In Australia the Company launched a fully integrated online personal loan system on 1 July 2010. This allows a
customer to complete an application, sign contracts and receive funds without visiting a store. This enhances the
successful lead generation system launched the previous year.
As expected, this system lifted the conversion rate from application to loan, from a low 17%, to 31% as customers
will no longer be required to visit a store and will therefore benefit from the convenience of an end to end application.
At this stage, cash advance applications are still being forwarded to stores for completion.
KEY METRICS FROM ONLINE LEAD GENERATION CAMPAIGN:
Number of leads 24,655
Number of loans 6,480
Number new customers 4,964
% new customers 74.6%
Value of personal loans written $6,265,125
Value of cash advances written $545,859
Total value of loans written $6,810,984
GLOBAL STRATEGIC ALLIANCE
On 22 March 2011 the Company announced that it had entered into a Transaction Implementation Agreement (TIA) with
its 33% unit holder EZCORP. The TIA proposes the acquisition by EZCORP of 30% of the outstanding issued capital
that it does not already own in Cash Converters. The price being offered for the proposed acquisition of these additional
shares is A$0.91 cents cash for each share. The Transaction is to be completed by a Scheme of Arrangement.
Successful completion of the Scheme will also facilitate the implementation of two joint ventures between the
Company and EZCORP:
� To develop a business similar to Cash Converters existing business in all geographic areas outside of Australia,
the UK, North America and South America. (the Global JV). Ownership will be 50% Cash Converters and 50%
EZCORP; and
� To develop a similar joint venture for all geographic areas within North America and South America. (the
Americas JV ). Ownership will be 20% Cash Converters and 80% EZCORP.
C h a i r m a n a n d M a n a g i n g D i r e c t o r ’ s R e v i e w
6
For
per
sona
l use
onl
y
C h a i r m a n a n d M a n a g i n g D i r e c t o r ’ s R e v i e w
7
The creation of these Joint Ventures will allow the Cash Converters Brand to develop at a faster pace, in new
territories, with less capital required and reduced risk.
Please refer to note below.
DIVIDEND
The directors have declared a fully franked final dividend of 1.75 cents per share. The dividend will be paid on 30
September 2011 to those shareholders on the register at the close of business on 16 September 2011. This will take
the total dividend payment for the year to 3.5 cents per share, fully franked. This represents a payout ratio of
approximately 48.1%.
OUTLOOK
The Legislative framework within which the Company provides its financial services products is the National
Consumer Credit Protection Act 2009. When this Legislation was implemented, it was planned in two phases. Phase
one included the licensing of business operators. Phase two was planned to review the various price control
methods used by States and the determination of a consistent national approach to price control.
This review has now been completed and we are awaiting the results of this review and the Federal Government’s
response.
Please refer to note below.
Cash Converters is licensed to provide financial products pursuant to the National Consumer Protection Act and has
responsible lending processes and controls in place.
The completion of the transaction with EZCORP represents a very significant opportunity for the Company to
accelerate its international growth and create a truly worldwide brand that can be used to leverage our financial
products and online retail opportunity. EZCORP brings significant financial and human resources to the Joint
Ventures which are a perfect fit for our knowhow and innovative business approach.
Another exciting development has been the successful launch of the personal loan and cash advance products in
the UK. The UK personal loan book grew by 746% to £5.0 million at 30 June and there were 100,988 cash advances
made during the period, totalling £10.5 million. Month on month results continue to grow as the number of stores
offering both the personal loan and cash advance products in the UK increases. There are now 106 stores offering
these products and a roll out programme for the remaining 88 stores in the UK. The Company expects this rate of
growth to continue over the next 12 months.
In closing we wish to thank the staff, management and franchisees for their contributions to the strong financial result
this year.
Reg Webb Peter Cumins
Chairman Managing Director
Perth, Western Australia
Date: 23 August 2011
Note: Since the publication of this review the Australian Federal Government has released exposure drafts in relation
to the proposed National Consumer Credit Protection Amendment (Enhancements) Bill 2011. Please refer to
Subsequent Events on page 17 of this Annual Report. As a consequence of this, the Company announced on
30 August 2011, that EZCORP had elected to terminate the Transaction Implementation Agreement.
For
per
sona
l use
onl
y

� Earnings before interest, tax, depreciation and amortisation
up 28.6% to $43,584,048 (2010: $33,885,867)
� Net profit attributable to members
up 27.8% to $27,634,929 (2010: $21,629,922)
� Store operations, operating profit before tax
up 24.7% to $8,569,649 (2010: $ 6,871,695)
� Financial services - administration, operating profit before tax
up 35.6% to $12,319,667 (2010: $9,083,621)
� Financial services – personal loans, operating profit before tax
up 58.7% to $24,420,011 (2010: $15,401,500)
� Franchise operations, operating profit before tax slightly lower
at $6,509,558 down 7.3% (2010: $7,025,834)
� Fully franked dividend for the year
3.5 cents
� Corporate store network in the UK expands
to 49 stores
� Corporate store network expands to
41 stores in Australia
8
R e v i e w o f t h e Ye a r
For
per
sona
l use
onl
y
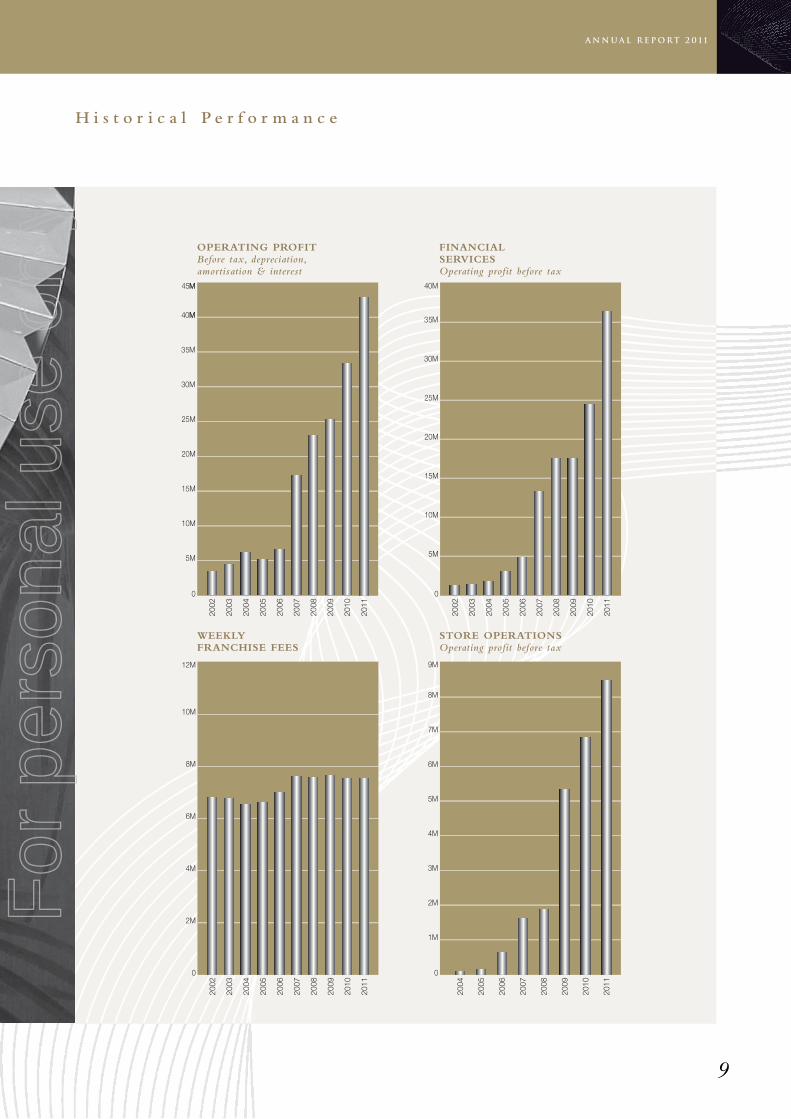
H i s t o r i c a l P e r f o r m a n c e
9
OPERATING PROFITBefore tax, depreciation,amortisation & interest
FINANCIALSERVICESOperating profit before tax
WEEKLYFRANCHISE FEES
STORE OPERATIONSOperating profit before tax
For
per
sona
l use
onl
y

H i s t o r y
The history of Cash Converters dates back to November 1984, when Brian Cumins, the
Company’s founder, began operating his first retail outlet in Perth, Western Australia.
During the next four years the merchandising formula and trading style that has underwritten
the groups success were developed and tested in the market place. A total of seven stores
were open and trading profitably before the franchising of Cash Converters began with the
opening of two franchised outlets in Perth in June 1998.
In 1990 the Group began to expand into other Australian States and now has over 130
outlets throughout Australia. The success of its Australian operations resulted in Cash
Converters seeking to expand into overseas markets.
The Company’s carefully planned entry into Europe was launched in 1991 when the first
store in the United Kingdom was opened at Gants Hill in Essex. Since then further stores
have opened in the UK taking the total to just under 200 stores.
The Company’s first non-English speaking market, commenced with the opening of its pilot
store in Vitrolles, near Marseilles in France in December 1994.
10
Since launching the concept in 1984,
Cash Converters has grown enormously
with representation in 21 countries worldwide
and to a network of over 600 stores.
For
per
sona
l use
onl
y
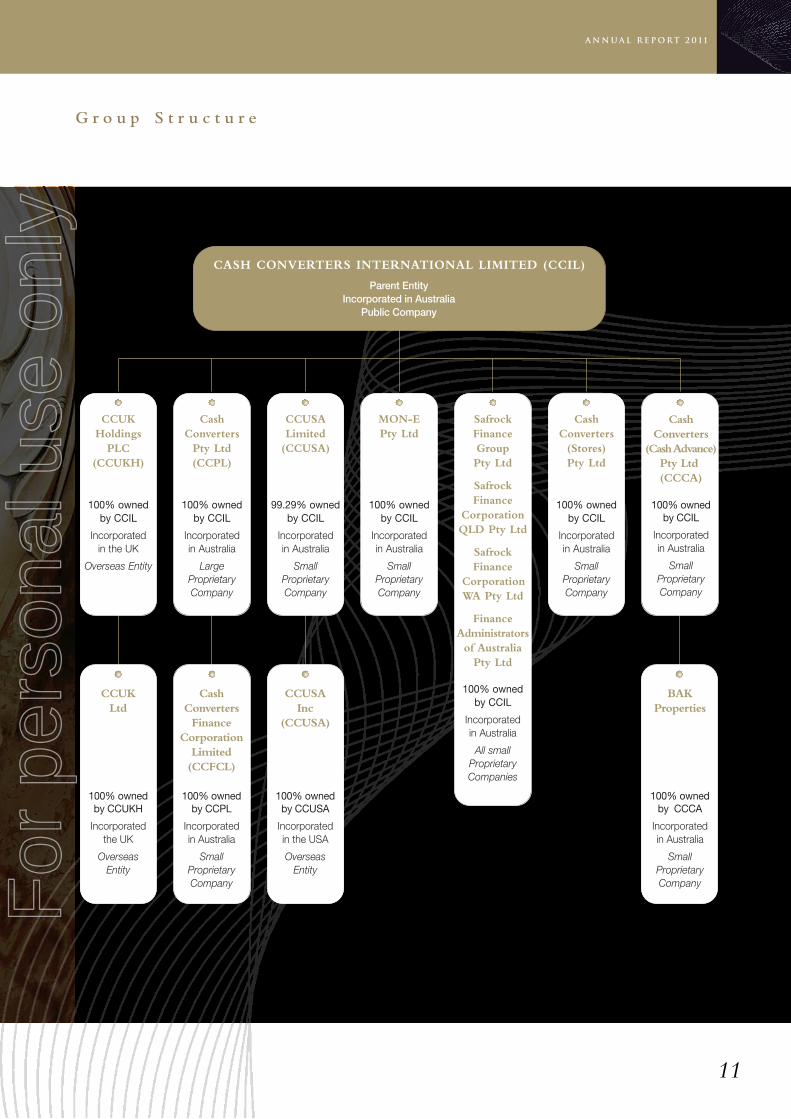
G r o u p S t r u c t u r e
11
For
per
sona
l use
onl
y
12
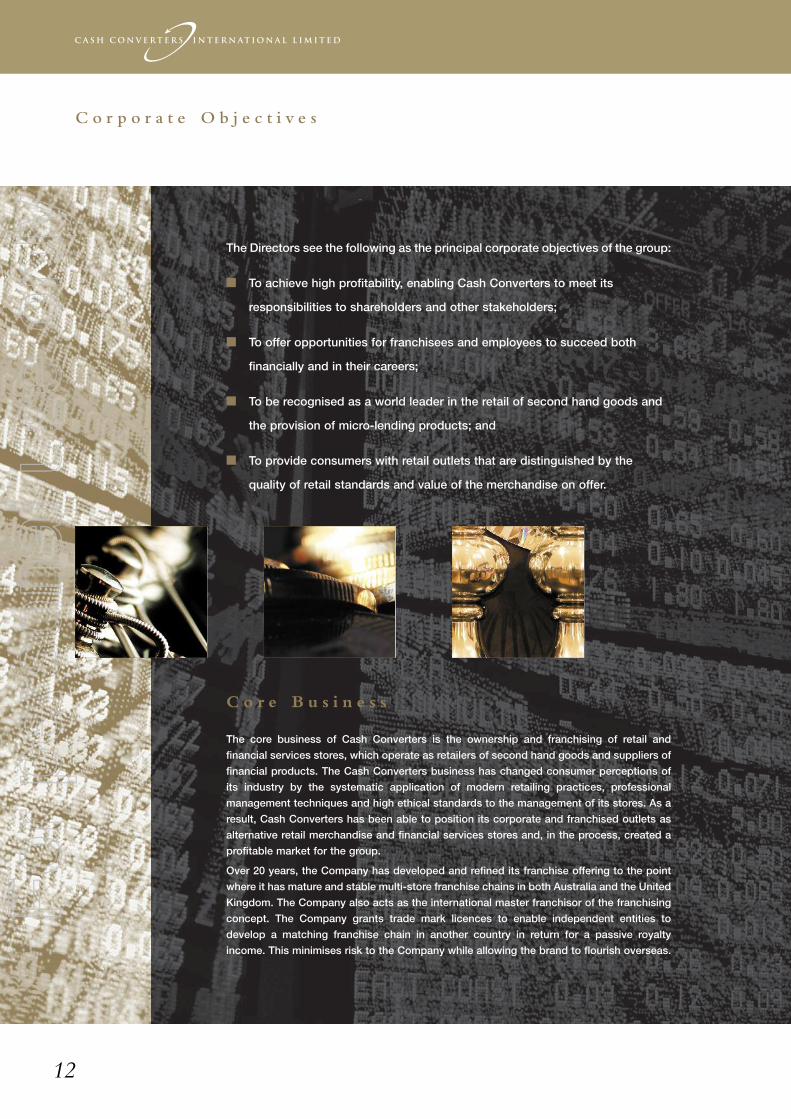
C o r p o r a t e O b j e c t i v e s
The Directors see the following as the principal corporate objectives of the group:
� To achieve high profitability, enabling Cash Converters to meet its
responsibilities to shareholders and other stakeholders;
� To offer opportunities for franchisees and employees to succeed both
financially and in their careers;
� To be recognised as a world leader in the retail of second hand goods and
the provision of micro-lending products; and
� To provide consumers with retail outlets that are distinguished by the
quality of retail standards and value of the merchandise on offer.
C o r e B u s i n e s s
The core business of Cash Converters is the ownership and franchising of retail and
financial services stores, which operate as retailers of second hand goods and suppliers of
financial products. The Cash Converters business has changed consumer perceptions of
its industry by the systematic application of modern retailing practices, professional
management techniques and high ethical standards to the management of its stores. As a
result, Cash Converters has been able to position its corporate and franchised outlets as
alternative retail merchandise and financial services stores and, in the process, created a
profitable market for the group.
Over 20 years, the Company has developed and refined its franchise offering to the point
where it has mature and stable multi-store franchise chains in both Australia and the United
Kingdom. The Company also acts as the international master franchisor of the franchising
concept. The Company grants trade mark licences to enable independent entities to
develop a matching franchise chain in another country in return for a passive royalty
income. This minimises risk to the Company while allowing the brand to flourish overseas.
For
per
sona
l use
onl
y
13
REGINALD WEBB – Non-Executive Chairman
Mr Webb was appointed Chairman in January 2005. Mr Webb has been a non-executive director for many years and has made a very
significant contribution in helping to guide the company towards the stable and successful state that it now enjoys.
He is a Fellow of the Institute of Chartered Accountants of Australia and was for many years a Partner of PricewaterhouseCoopers (previously
Price Waterhouse). In that position he worked in both North America and Europe as well as Australia. He was a partner for 20 years and
served on the Policy Board of that firm. He is currently a Director of D'Orsogna Limited.
PETER CUMINS – Managing Director
Mr Cumins is an Australian national. He is the Managing Director of Cash Converters International Limited. He joined the group in August
1990 as Finance and Administration Manager when the Company had just 23 stores, becoming General Manager in March 1992. He became
Group Managing Director in April 1995.
Mr Cumins is a qualified accountant, and has overseen the major growth in the number of franchisees in Australia as well as the international
development of the Cash Converters franchise system. His experience in the management of large organisations has included senior
executive positions in the government health sector, specifically with the Fremantle Hospital Group, where he was Finance and Human
Resources Manager.
JOHN YEUDALL (C.Eng., M.I.Struct.E.) – Non-Executive Director
Mr Yeudall is a Chartered Engineer and member of the Australian Institute of Company Directors. He was founder of the IKEA franchise in
Western Australia.
Mr Yeudall was previously Australia’s senior Trade Commissioner in the Middle East and Consul General for Dubai. He joined the board in
2002.
WILLIAM LOVE – Non-Executive Director
Mr Love has served as an independent director of EZCORP since October 2008 and has served as chairman of the Audit Committee of the
EZCORP board of directors since November 2009. He joined the board of Cash Converters International Limited in 2009.
Mr Love is a licensed Certified Public Accountant and a Certified Valuation Analyst, and since January 1993 has practised public accounting
in the Austin, Texas based William C Love accounting firm. From 1972 to 1993, Mr Love worked with the accounting firm of KPMG Peat
Marwick and its predecessors, including appointments as Partner in Charge of Audit, Partner in Charge of Tax and Managing Partner of its
Austin, Texas office.
JOSEPH BEAL – Non-Executive Director
Mr Beal has served as an independent director of EZCORP since August 2009 and serves on the Compensation Committee. Mr Beal also
joined the Cash Converters International Limited board in 2009.
Until his retirement in January 2008, Mr Beal was the General Manager and Chief Executive Officer of the Lower Colorado River Authority
(LCRA), a Texas conservation and reclamation district with over $1 billion in annual revenues, over $3 billion in assets and more than 2,200
employees. Mr Beal joined LCRA in 1995 to lead its Water Services division, and was appointed by the LCRA board in January 2000 to become
its eighth General Manager and Chief Executive Officer. Before joining LCRA, Mr Beal was Senior Vice President and Chief Operating Officer at
Espey Huston & Associates, an international engineering and environmental consulting firm based in Austin.
D i r e c t o r s ’ P r o f i l e s
For
per
sona
l use
onl
y
14
F i n a n c i a l R e p o r t
Directors’ report 15-25
Corporate governance 26-28
Consolidated statement of comprehensive income 29
Consolidated statement of financial position 30
Consolidated statement of changes in equity 31
Consolidated statement of cash flows 32
Notes to the consolidated financial statements:
1 Summary of accounting policies 33-41
2 Profit from operations 42
3 Income tax expense 43-44
4 Remuneration of auditors 44
5 Cash and cash equivalents 44
6 Trade and other receivables 45-46
7 Inventories 46
8 Other assets 46
9 Plant and equipment 46
10 Trade and other payables 47
11 Borrowings 47-48
12 Provisions 48
13 Deferred establishment fees 48
14 Other intangible assets 48-49
15 Goodwill 49-50
16 Issued capital 51
17 Reserves and retained earnings 51-52
18 Financial instruments 52-55
19 Leases 56
20 Related party transactions 57-58
21 Subsequent events 58-59
22 Subsidiaries 59-62
23 Contingent liabilities 62
24 Earnings per share 62-63
25 Notes to the statement of cash flows 63-64
26 Dividends 64
27 Employee numbers 64
28 Acquisitions of business 65-66
29 Segmental information 66-68
30 Parent entity disclosures 69
31 Share-based payment details 69-70
32 Other financial assets 71
33 Company details 71
Directors’ declaration 72
Independent audit report to the members 73
Independence declaration 75
Shareholder information 76
For
per
sona
l use
onl
y

15
In respect of the financial year ended 30 June 2011 the directors of Cash Converters International Limited submit the following report made
out in accordance with a resolution of the directors.
DIRECTORS
The following persons held office as directors of the Company during or since the end of the financial year:
� Mr Reginald Webb (non-executive director, chairman)
� Mr Peter Cumins (managing director)
� Mr John Yeudall (non-executive director)
� Mr William Love (non-executive director)
� Mr Joseph Beal (non-executive director)
PRINCIPAL ACTIVITIES
The consolidated entity’s principal activity is that of a franchisor of second hand goods and financial services stores, a provider of secured
and unsecured loans and the operator of a growing number of corporate stores, all of which trade under the Cash Converters name.
Country franchise licences are also sold to licensees to allow the development of the Cash Converters brand but without the need for support
from Cash Converters International Limited.
TRADING RESULTS
The consolidated entity’s net profit attributable to members of the parent entity for the year ended 30 June 2011 was $27,634,929 (2010:
$21,629,922) after a charge for income tax of $11,578,126 (2010: $9,536,414), and adjusting for profit attributable to Non-controlling
interests in controlled entities of $Nil (2010: $46,241 profit).
DIVIDENDS
The directors of the Company paid a fully franked interim dividend of 1.75 (one and three quarter) cents per share on 31 March 2011. The
directors have also declared a final fully franked dividend of 1.75 (one and three quarter) cents per share to be paid on 30 September 2011
to those shareholders on the register at the close of business on 16 September 2011. In addition, a fully franked dividend of 1.5 (one and a
half) cents per share declared in relation to the prior year was paid on 30 September 2010.
REVIEW OF OPERATIONS
A summary of consolidated revenues and results by significant industry segments is set out below.
Segment revenues Segment resultsYear Ended Year Ended
2011 2010 2011 2010
Franchise operations 27,440,899 22,974,687 6,509,558 7,025,834
Store operations 100,877,291 62,534,745 8,569,649 6,871,695
Financial services - administration 13,866,216 10,249,019 12,319,667 9,083,621
Financial services – personal loans 56,629,355 35,908,206 24,420,011 15,401,500
Intersegment elimination of revenues (13,424,001) (6,183,971) - -
Totals 185,389,760 125,482,686 51,818,885 38,382,650
Corporate head office income / (costs) 686,522 587,742 (12,605,830) (7,170,073)
Total revenue/operating profit 186,076,282 126,070,428 39,213,055 31,212,577
Income tax attribute to operating profits (11,578,126) (9,536,414)
Profit after income tax 27,634,929 21,676,163
(Profit) attributable to non-controlling interest - (46,241)
Profit attributable to members of Cash Converters International Limited 27,634,929 21,629,922
D i r e c t o r s ’ R e p o r t
For
per
sona
l use
onl
y
D i r e c t o r s ’ R e p o r t
Comments on the operations and the results of those operations are set out below:
FRANCHISE OPERATIONS
The profit before tax for the franchise operations was $6,509,558 (2010: $7,025,834) for the 12 month period ended 30 June 2011. The
Australian business contributed $3,967,999 (2010: $4,572,720), the UK business $2,081,677 (2010: $2,093,462) and the International
operations $459,882 (2010: $359,652) of the profit before tax.
The total number of franchised stores throughout the world now stands at 522 with 148 stores in the UK, 98 in Australia and 276 throughout
the rest of the world. Franchised stores continue to be opened, with 33 stores opening in the UK and three stores in Australia in the period
to the 30 June 2011. Internationally most growth is being experienced in Spain, South Africa and France with other countries also growing,
albeit at a slower rate.
CCUK are planning to open a further seven franchised stores in the next few months and new franchised stores are also planned to open in
Australia. The potential for franchise expansion is still large with few countries, outside of Australia, reaching saturation level.
STORE OPERATIONS
This division encompasses the corporate store network in both the UK and Australia. Currently there are 49 stores in the UK and 42 in
Australia, resulting in a total of 91 stores. Not all stores are being acquired from existing franchisees with 13 ‘greenfield’ sites opening in the
UK in the year ended 30 June 2011.
The store operations delivered a profit before tax of $8,569,649 (2010: $6,871,695) up $1,697,954 (24.7%) on the corresponding period and
demonstrates the potential of the division. The Australian business contributed $7,322,985 and the UK business $1,246,664 of the profit
before tax.
The Australian business was impacted by the flooding in Queensland which severely damaged our corporately owned store located in
Goodna, in the Brisbane region. Write-offs to inventory and fixtures and fittings, combined with damage to customers’ pawned goods and
the prolonged store closure have all had a negative profit impact, resulting in a loss against budget of approximately $1.5 million. The
insurance company has refused to honour our claim in respect to damages and losses incurred pursuant to the flood. Cash Converters intend
to challenge this decision. The store has been re-fitted and was re-opened in July. Partially compensating the above losses is a one-off gain
of approximately $1.2 million relating to a reduction in contingent consideration associated with the acquisition of the Goodna store.
Although Christmas trading in Australia, this year, was more difficult than the previous year, the stores finished largely on budget for the year
apart from the comment above. The UK corporate stores, however, finished well behind budget for the year, with difficult trading conditions
experienced during the second half of the year. This behind budget performance resulted firstly from very poor economic conditions being
experienced in the UK as a result of high unemployment and government spending cuts, and secondly, establishment of a greater number
of ‘greenfield’ stores than originally budgeted which resulted in increased losses during the store opening phase, consequently negatively
impacting UK profits.
Overall this division is performing strongly and the UK, in particular, has good opportunities currently to secure high street locations for new
stores. This coupled with the excellent potential for developing financial services augurs well for strong growth in the UK. Although the
opportunities for ‘greenfield’ sites in Australia are not as strong, certain states (New South Wales and Victoria) do offer strong growth potential.
The opportunities in Australia lie in franchise store acquisitions, with a number of franchisees willing to sell their stores.
Recent rioting in the UK (August 2011) have seriously damaged a number of our franchise and corporate stores with the Salford store being
burned to the ground.
FINANCIAL SERVICES OPERATIONS AND ADMINISTRATION
These divisions incorporate the trading results of MON-E Pty Ltd (Australia), the Safrock Finance Group Pty Ltd (Safrock - Australia) and the
UK Finance Division. MON-E Pty Ltd is responsible for providing the internet platform and administration services for the Cash Converters
network in Australia to offer small cash advance loans to their customers (average loan size of approximately $325).
Safrock provides small, largely unsecured loans through the franchise and corporate store networks in Australia.
The UK Finance Division utilises the software developed in Australia, for both cash advances and personal loans, and has formed a joint
venture with Ausgroup Pty Ltd to roll-out the finance products across both the franchise and corporate store networks in the UK.
During the period under review the net profit before tax for this division was $36,739,678 (2010: $24,485,121), representing an increase on
last year’s corresponding period of 50.0%. Safrock contributed $23,658,967, MON-E $11,878,009 and the UK Finance Division a profit of
$1,202,702.
16
For
per
sona
l use
onl
y
D i r e c t o r s ’ R e p o r t
17
The Christmas period is one of the busiest periods for the personal loan product and this year was no exception with a new record of $10.9
million (2009:$8.2 million) advanced in Australia and £0.7 million in the UK with the loan books standing at $52.7 million for Australia and £5.0
million for the UK, as at the end of June.
The Legislative framework within which the Company provides its financial services products is the National Consumer Credit Protection Act
2009. When this Legislation was implemented, it was planned in two phases. Phase one included the licensing of business operators. Phase
two was planned to review the various price control methods used by States and the determination of a consistent national approach to price
control.
This review has now been completed and the Federal Government has released a Green Paper on phase two of the national consumer credit
reforms subsequent to 30 June 2011. Refer to the “Subsequent events” note following this for further information.
Cash Converters is licensed to provide financial products pursuant to the National Consumer Protection Act and has responsible lending
processes and controls in place.
CORPORATE OFFICE COSTS
These costs represent the corporate office costs for both Australia and the UK. These costs are shown separately because it is difficult to
allocate these costs to any specific division/segment and to calculate an arbitrary split of the costs would not be appropriate in obtaining an
accurate contribution from each of the divisions.
CHANGES IN STATE OF AFFAIRS
During the financial year there were no significant changes in the state of affairs of the consolidated entity other than referred to elsewhere in
the report, the financial statements or notes thereto.
SUBSEQUENT EVENTS
In July 2010 the Australian Federal Government released a Green Paper on phase two of the national consumer credit reforms. One of the
proposals considered in the Green Paper included placing a national cap on interest rates that may be charged by payday lenders in Australia.
As announced by Cash Converters to the ASX and LSE on 25 August 2011, the Australian Federal Government has now released exposure
drafts in relation to a proposed National Consumer Credit Protection Amendment (Enhancements) Bill 2011. The exposure drafts contain
proposed amendments to the National Consumer Credit Protection Act 2009 which contain suggested reforms to introduce a national cap
on costs for ‘small amount’ contracts (defined as contracts with a credit limit of $2,000 for a term of less than two years). Under the proposed
reforms it is intended that, from 1 July 2012, small amount credit lenders (often called payday lenders or micro lenders) will be limited to
charging a maximum establishment fee of 10% of the total amount borrowed and a maximum monthly fee of 2% of the total amount borrowed
each month for the life of the loan.
Other key measures in the draft legislation include:
1. a prohibition on refinancing or increasing the credit limit of small amount contracts;
2. requirements for short term lenders to disclose the availability of other options, with internet based lenders required to have a link to the
ASIC website at moneysmart.com.au;
3. that a credit provider must not enter into a credit contract (other than a small amount credit contract) if the annual cost rate of the contract
exceeds 48%; and
4. that a licensee must not provide credit assistance to a consumer by suggesting that the consumer apply, or assisting the consumer to
apply, for a small amount credit contract with a particular credit provider if the licensee knows, or is reckless as to whether, the consumer
is a debtor under another small amount credit contract.
The proposed bill is in exposure draft form only and is still subject to consultation and further amendment. However, the Australian Federal
Government has advised that it will also release a discussion paper with more detailed proposals to improve access to alternatives to payday
loans. In relation to the draft legislation, submissions were required to be lodged with the Australian Treasury by 5 September 2011. Cash
Converters has been actively engaging with the Australian Federal Government regarding these reforms and Cash Converters has lodged a
submission in relation to the proposed legislation. Cash Converters has also been conducting a national campaign against the proposed
changes.
If passed, the reforms are expected to take effect no earlier than 1 July 2012. However, to fully implement these reforms will require co-
operation from the States and there is some prospect that several States may not accede to the proposed caps on fees and charges and
there is some prospect that the caps on fees and charges will become effective later than 1 July 2012.
For
per
sona
l use
onl
y
D i r e c t o r s ’ R e p o r t
18
Cash Converters has considered and will continue to consider a wide range of steps which it can implement to reduce the adverse impact
of these reforms on its revenue and profit. In light of the available options (which include a change of focus to other products and services, a
re-direction of resources to other jurisdictions and a re-design of current loan products) Cash Converters considers that it may be able to
substantially reduce the adverse effects. Other than in Australia, Cash Converters is not aware of similar restrictions in effect or proposed in
jurisdictions in which Cash Converters has a substantial business presence or into which it is looking to expand. Accordingly, if the proposed
reforms become law in Australia in their current form, Cash Converters may seek to shift the focus of its lending operations into other
jurisdictions (or alternative products).
FUTURE DEVELOPMENTS
There are no likely developments in the operations of the consolidated entity other than those discussed in this report.
Further information on likely developments in the operations of the consolidated entity and the expected results of operations have not been
included in this report as the directors believe it would likely result in unreasonable prejudice to the consolidated entity.
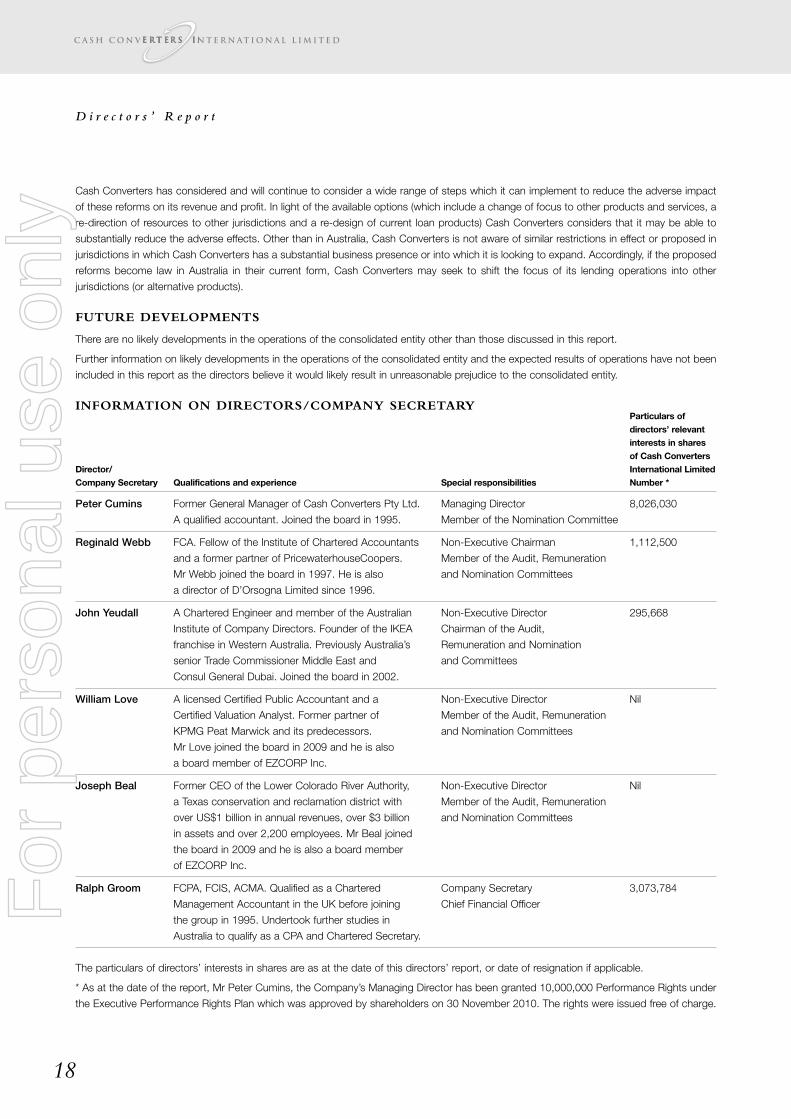
INFORMATION ON DIRECTORS/COMPANY SECRETARYParticulars ofdirectors’ relevantinterests in sharesof Cash Converters
Director/ International LimitedCompany Secretary Qualifications and experience Special responsibilities Number *
Peter Cumins Former General Manager of Cash Converters Pty Ltd. Managing Director 8,026,030
A qualified accountant. Joined the board in 1995. Member of the Nomination Committee
Reginald Webb FCA. Fellow of the Institute of Chartered Accountants Non-Executive Chairman 1,112,500
and a former partner of PricewaterhouseCoopers. Member of the Audit, Remuneration
Mr Webb joined the board in 1997. He is also and Nomination Committees
a director of D’Orsogna Limited since 1996.
John Yeudall A Chartered Engineer and member of the Australian Non-Executive Director 295,668
Institute of Company Directors. Founder of the IKEA Chairman of the Audit,
franchise in Western Australia. Previously Australia’s Remuneration and Nomination
senior Trade Commissioner Middle East and and Committees
Consul General Dubai. Joined the board in 2002.
William Love A licensed Certified Public Accountant and a Non-Executive Director Nil
Certified Valuation Analyst. Former partner of Member of the Audit, Remuneration
KPMG Peat Marwick and its predecessors. and Nomination Committees
Mr Love joined the board in 2009 and he is also
a board member of EZCORP Inc.
Joseph Beal Former CEO of the Lower Colorado River Authority, Non-Executive Director Nil
a Texas conservation and reclamation district with Member of the Audit, Remuneration
over US$1 billion in annual revenues, over $3 billion and Nomination Committees
in assets and over 2,200 employees. Mr Beal joined
the board in 2009 and he is also a board member
of EZCORP Inc.
Ralph Groom FCPA, FCIS, ACMA. Qualified as a Chartered Company Secretary 3,073,784
Management Accountant in the UK before joining Chief Financial Officer
the group in 1995. Undertook further studies in
Australia to qualify as a CPA and Chartered Secretary.
The particulars of directors’ interests in shares are as at the date of this directors’ report, or date of resignation if applicable.
* As at the date of the report, Mr Peter Cumins, the Company’s Managing Director has been granted 10,000,000 Performance Rights under
the Executive Performance Rights Plan which was approved by shareholders on 30 November 2010. The rights were issued free of charge.
For
per
sona
l use
onl
y
D i r e c t o r s ’ R e p o r t
19
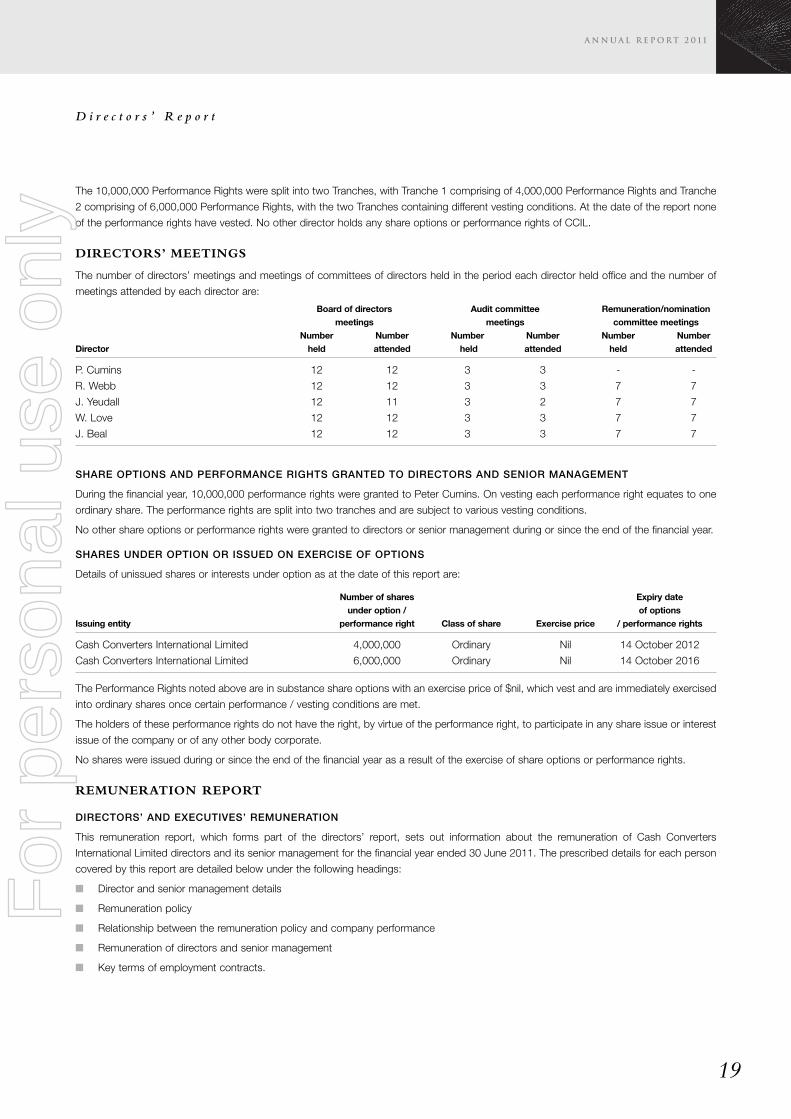
The 10,000,000 Performance Rights were split into two Tranches, with Tranche 1 comprising of 4,000,000 Performance Rights and Tranche
2 comprising of 6,000,000 Performance Rights, with the two Tranches containing different vesting conditions. At the date of the report none
of the performance rights have vested. No other director holds any share options or performance rights of CCIL.
DIRECTORS’ MEETINGS
The number of directors’ meetings and meetings of committees of directors held in the period each director held office and the number of
meetings attended by each director are:
Board of directors Audit committee Remuneration/nominationmeetings meetings committee meetings
Number Number Number Number Number NumberDirector held attended held attended held attended
P. Cumins 12 12 3 3 - -
R. Webb 12 12 3 3 7 7
J. Yeudall 12 11 3 2 7 7
W. Love 12 12 3 3 7 7
J. Beal 12 12 3 3 7 7
SHARE OPTIONS AND PERFORMANCE RIGHTS GRANTED TO DIRECTORS AND SENIOR MANAGEMENT
During the financial year, 10,000,000 performance rights were granted to Peter Cumins. On vesting each performance right equates to one
ordinary share. The performance rights are split into two tranches and are subject to various vesting conditions.
No other share options or performance rights were granted to directors or senior management during or since the end of the financial year.
SHARES UNDER OPTION OR ISSUED ON EXERCISE OF OPTIONS
Details of unissued shares or interests under option as at the date of this report are:
Number of shares Expiry dateunder option / of options
Issuing entity performance right Class of share Exercise price / performance rights
Cash Converters International Limited 4,000,000 Ordinary Nil 14 October 2012
Cash Converters International Limited 6,000,000 Ordinary Nil 14 October 2016
The Performance Rights noted above are in substance share options with an exercise price of $nil, which vest and are immediately exercised
into ordinary shares once certain performance / vesting conditions are met.
The holders of these performance rights do not have the right, by virtue of the performance right, to participate in any share issue or interest
issue of the company or of any other body corporate.
No shares were issued during or since the end of the financial year as a result of the exercise of share options or performance rights.
REMUNERATION REPORT
DIRECTORS’ AND EXECUTIVES’ REMUNERATION
This remuneration report, which forms part of the directors’ report, sets out information about the remuneration of Cash Converters
International Limited directors and its senior management for the financial year ended 30 June 2011. The prescribed details for each person
covered by this report are detailed below under the following headings:
� Director and senior management details
� Remuneration policy
� Relationship between the remuneration policy and company performance
� Remuneration of directors and senior management
� Key terms of employment contracts.
For
per
sona
l use
onl
y
D i r e c t o r s ’ R e p o r t
20
DIRECTOR AND SENIOR MANAGEMENT DETAILS
The following persons acted as directors of the company during or since the end of the financial year:
� Mr Reginald Webb (non-executive director, chairman)
� Mr Peter Cumins (managing director)
� Mr John Yeudall (non-executive director)
� Mr William Love (non-executive director)
� Mr Joseph Beal (non-executive director)
The term ‘senior management’ is used in this remuneration report to refer to the following persons. Except as noted, the named persons held
their current position for the whole of the financial year and since the end of the financial year:
� Mr Michael Cooke (group legal counsel)
� Ian Day (general manager, Australia)
� Ralph Groom (company secretary / chief financial officer)
� David Patrick (chief executive officer, UK)
� Jim Spratley (group accountant, UK – resigned 8 September 2010)
� Richard Pilgrim (operations manager, UK)
� Mike Osborne (company secretary / chief financial officer, UK – appointed 23 August 2010)
Senior management as used within this remuneration report are officers who are involved in, concerned in, or who take part in, the
management of the affairs of Cash Converters International Limited and / or related bodies corporate.
REMUNERATION POLICY
The remuneration committee, consisting of the four non-executive directors, advises the Board on remuneration policies and practices
generally, and makes specific recommendations on remuneration packages and other terms of employment for executive directors and other
senior executives.
Executive remuneration and other terms of employment are reviewed by the committee having regard to performance against goals set,
relevant comparative information and independent expert advice. As well as a base salary, remuneration packages include superannuation,
performance-related bonuses and fringe benefits.
Remuneration packages are set at levels that are intended to attract and retain executives capable of managing the consolidated entity’s
operations.
Remuneration and other terms of employment for the managing director and certain other senior executives are formalised in service
agreements (refer to the key terms of employment contracts section within the remuneration report for further information).
Remuneration of non-executive directors is determined by the remuneration committee and approved by the Board within the maximum
amount approved by the shareholders from time to time. Bonuses are not payable to non-executive directors.
Remuneration packages contain the following key elements:
a. Short-term employee benefits – salary/fees, bonuses and non-monetary benefits including the provision of motor vehicles;
b. Post-employment benefits – include superannuation and prescribed retirement benefits; and
c. Share-based payments – include share options/performance rights.
For
per
sona
l use
onl
y

D i r e c t o r s ’ R e p o r t
21
RELATIONSHIP BETWEEN THE REMUNERATION POLICY AND COMPANY PERFORMANCE
The tables below set out summary information about the consolidated entity’s earnings and movements in shareholder wealth for the five
years to June 2011:
30 June 2011 30 June 2010 30 June 2009 30 June 2008 30 June 2007
Revenue 186,076,282 126,070,428 94,803,282 74,405,882 45,979,982
Net profit before tax 39,213,055 31,212,577 23,307,232 21,598,569 16,710,114
Net profit after tax 27,634,929 21,676,163 16,154,708 15,174,586 11,631,146
Share price at start of year 55.0 42.0 24.0 71.0 45.0
Share price at end of year 72.5 55.0 42.0 24.0 71.0
Interim dividend (i) 1.75 1.50 1.50 1.50 1.50
Final dividend (i) (ii) 1.75 1.50 1.50 1.50 1.50
Basic earnings per share 7.28 6.60 6.77 6.28 5.29
Diluted earnings per share 7.23 6.58 6.66 6.12 5.14
(i) Franked to 100% at 30% corporate income tax rate.
(ii) Declared after the balance date and not reflected in the financial statements.
Other than with respect to share-based payments which are disclosed below, there is no relationship between shareholder wealth and
remuneration, however certain bonuses are paid based on performance targets set for the individual concerned as discussed further in the
following section.
During the year ended 30 June 2011, 10,000,000 performance rights were granted to the managing director.
On vesting each performance right equates to one ordinary share. The performance rights are split into two tranches and are subject to
various vesting conditions. One such vesting condition is the consolidated entity achieving budgeted profit after tax for various periods, should
any of the vesting conditions fail to be achieved the performance rights will not vest, consequently there is a direct link between the creation
of shareholder wealth and share based payment remuneration.
No share based payments / performance rights were in existence over any of the previous 4 years.
For
per
sona
l use
onl
y
D i r e c t o r s ’ R e p o r t
22
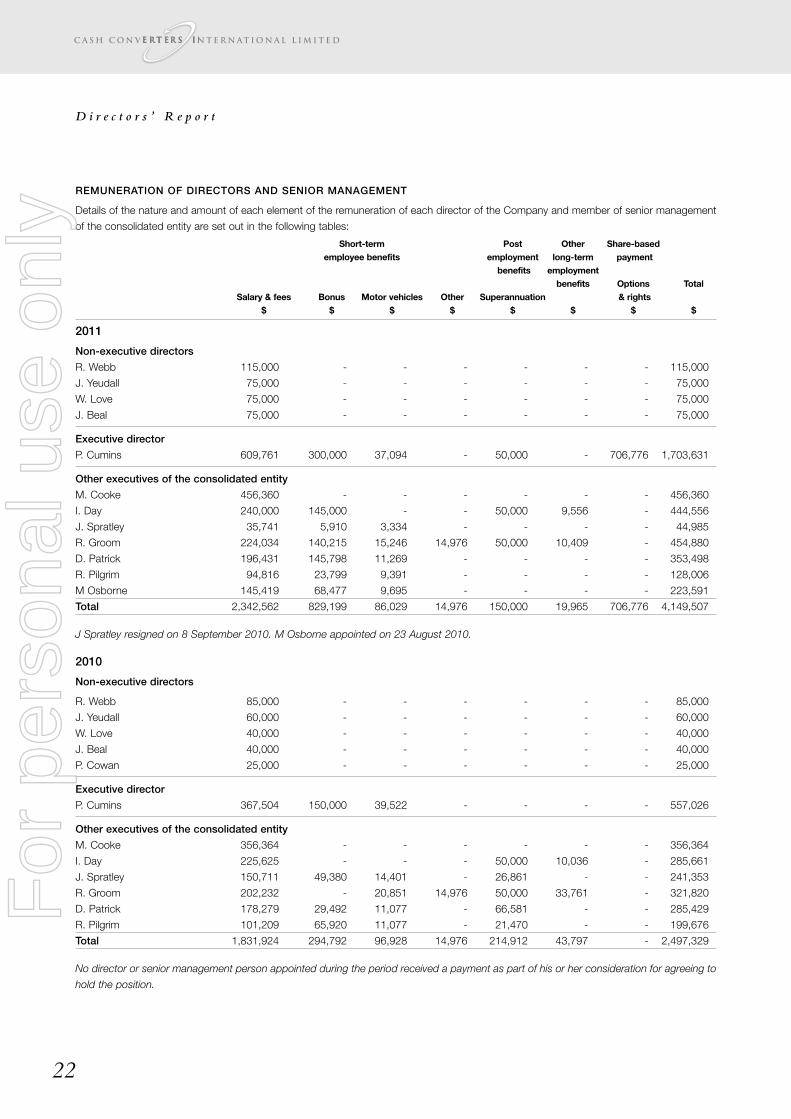
REMUNERATION OF DIRECTORS AND SENIOR MANAGEMENT
Details of the nature and amount of each element of the remuneration of each director of the Company and member of senior management
of the consolidated entity are set out in the following tables:
Short-term Post Other Share-basedemployee benefits employment long-term payment
benefits employmentbenefits Options Total
Salary & fees Bonus Motor vehicles Other Superannuation & rights$ $ $ $ $ $ $ $
2011
Non-executive directors
R. Webb 115,000 - - - - - - 115,000
J. Yeudall 75,000 - - - - - - 75,000
W. Love 75,000 - - - - - - 75,000
J. Beal 75,000 - - - - - - 75,000
Executive director
P. Cumins 609,761 300,000 37,094 - 50,000 - 706,776 1,703,631
Other executives of the consolidated entity
M. Cooke 456,360 - - - - - - 456,360
I. Day 240,000 145,000 - - 50,000 9,556 - 444,556
J. Spratley 35,741 5,910 3,334 - - - - 44,985
R. Groom 224,034 140,215 15,246 14,976 50,000 10,409 - 454,880
D. Patrick 196,431 145,798 11,269 - - - - 353,498
R. Pilgrim 94,816 23,799 9,391 - - - - 128,006
M Osborne 145,419 68,477 9,695 - - - - 223,591
Total 2,342,562 829,199 86,029 14,976 150,000 19,965 706,776 4,149,507
J Spratley resigned on 8 September 2010. M Osborne appointed on 23 August 2010.
2010
Non-executive directors
R. Webb 85,000 - - - - - - 85,000
J. Yeudall 60,000 - - - - - - 60,000
W. Love 40,000 - - - - - - 40,000
J. Beal 40,000 - - - - - - 40,000
P. Cowan 25,000 - - - - - - 25,000
Executive director
P. Cumins 367,504 150,000 39,522 - - - - 557,026
Other executives of the consolidated entity
M. Cooke 356,364 - - - - - - 356,364
I. Day 225,625 - - - 50,000 10,036 - 285,661
J. Spratley 150,711 49,380 14,401 - 26,861 - - 241,353
R. Groom 202,232 - 20,851 14,976 50,000 33,761 - 321,820
D. Patrick 178,279 29,492 11,077 - 66,581 - - 285,429
R. Pilgrim 101,209 65,920 11,077 - 21,470 - - 199,676
Total 1,831,924 294,792 96,928 14,976 214,912 43,797 - 2,497,329
No director or senior management person appointed during the period received a payment as part of his or her consideration for agreeing to
hold the position.
For
per
sona
l use
onl
y
D i r e c t o r s ’ R e p o r t
23
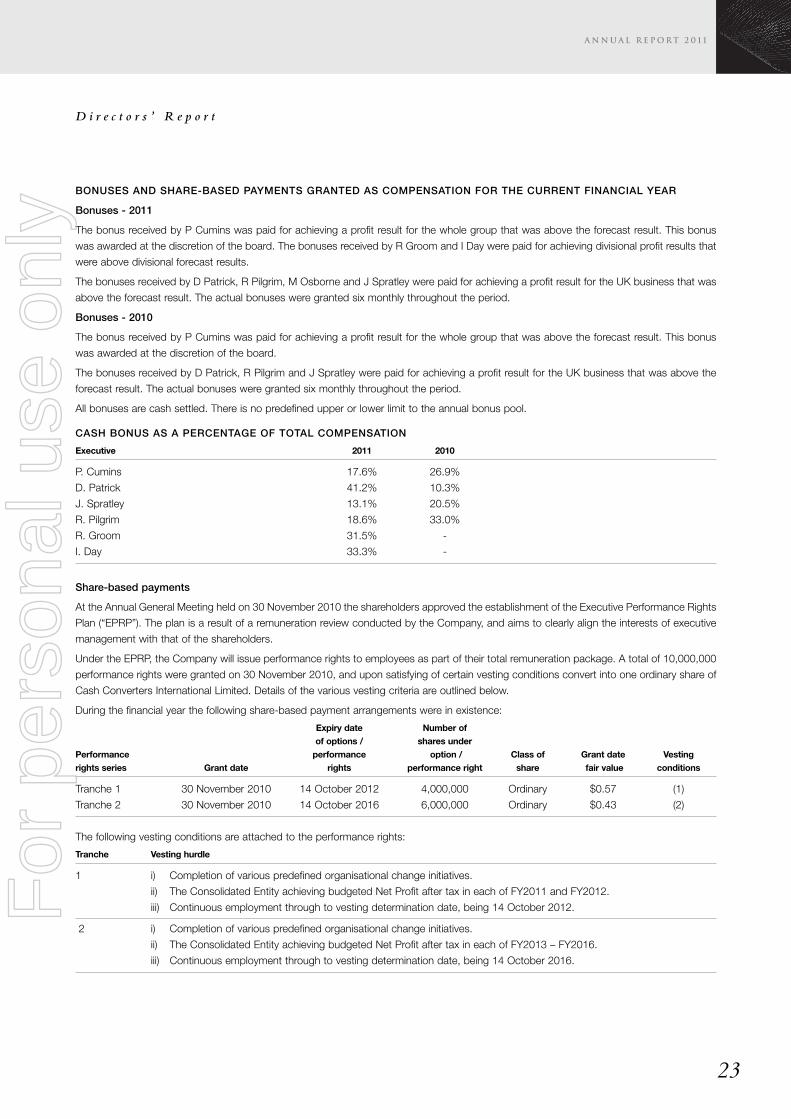
BONUSES AND SHARE-BASED PAYMENTS GRANTED AS COMPENSATION FOR THE CURRENT FINANCIAL YEAR
Bonuses - 2011
The bonus received by P Cumins was paid for achieving a profit result for the whole group that was above the forecast result. This bonus
was awarded at the discretion of the board. The bonuses received by R Groom and I Day were paid for achieving divisional profit results that
were above divisional forecast results.
The bonuses received by D Patrick, R Pilgrim, M Osborne and J Spratley were paid for achieving a profit result for the UK business that was
above the forecast result. The actual bonuses were granted six monthly throughout the period.
Bonuses - 2010
The bonus received by P Cumins was paid for achieving a profit result for the whole group that was above the forecast result. This bonus
was awarded at the discretion of the board.
The bonuses received by D Patrick, R Pilgrim and J Spratley were paid for achieving a profit result for the UK business that was above the
forecast result. The actual bonuses were granted six monthly throughout the period.
All bonuses are cash settled. There is no predefined upper or lower limit to the annual bonus pool.
CASH BONUS AS A PERCENTAGE OF TOTAL COMPENSATION
Executive 2011 2010
P. Cumins 17.6% 26.9%
D. Patrick 41.2% 10.3%
J. Spratley 13.1% 20.5%
R. Pilgrim 18.6% 33.0%
R. Groom 31.5% -
I. Day 33.3% -
Share-based payments
At the Annual General Meeting held on 30 November 2010 the shareholders approved the establishment of the Executive Performance Rights
Plan (“EPRP”). The plan is a result of a remuneration review conducted by the Company, and aims to clearly align the interests of executive
management with that of the shareholders.
Under the EPRP, the Company will issue performance rights to employees as part of their total remuneration package. A total of 10,000,000
performance rights were granted on 30 November 2010, and upon satisfying of certain vesting conditions convert into one ordinary share of
Cash Converters International Limited. Details of the various vesting criteria are outlined below.
During the financial year the following share-based payment arrangements were in existence:
Expiry date Number ofof options / shares under
Performance performance option / Class of Grant date Vestingrights series Grant date rights performance right share fair value conditions
Tranche 1 30 November 2010 14 October 2012 4,000,000 Ordinary $0.57 (1)
Tranche 2 30 November 2010 14 October 2016 6,000,000 Ordinary $0.43 (2)
The following vesting conditions are attached to the performance rights:
Tranche Vesting hurdle
1 i) Completion of various predefined organisational change initiatives.
ii) The Consolidated Entity achieving budgeted Net Profit after tax in each of FY2011 and FY2012.
iii) Continuous employment through to vesting determination date, being 14 October 2012.
2 i) Completion of various predefined organisational change initiatives.
ii) The Consolidated Entity achieving budgeted Net Profit after tax in each of FY2013 – FY2016.
iii) Continuous employment through to vesting determination date, being 14 October 2016.
For
per
sona
l use
onl
y
D i r e c t o r s ’ R e p o r t
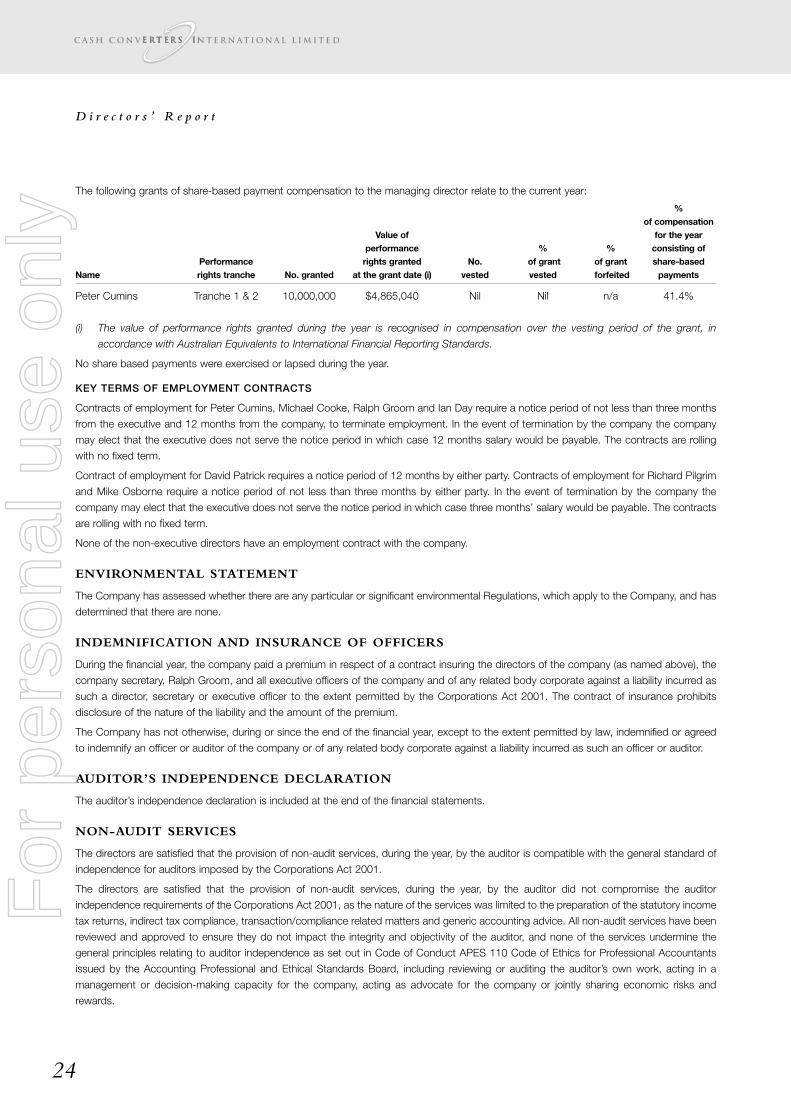
24
The following grants of share-based payment compensation to the managing director relate to the current year:
%of compensation
Value of for the yearperformance % % consisting of
Performance rights granted No. of grant of grant share-basedName rights tranche No. granted at the grant date (i) vested vested forfeited payments
Peter Cumins Tranche 1 & 2 10,000,000 $4,865,040 Nil Nil n/a 41.4%
(i) The value of performance rights granted during the year is recognised in compensation over the vesting period of the grant, in
accordance with Australian Equivalents to International Financial Reporting Standards.
No share based payments were exercised or lapsed during the year.
KEY TERMS OF EMPLOYMENT CONTRACTS
Contracts of employment for Peter Cumins, Michael Cooke, Ralph Groom and Ian Day require a notice period of not less than three months
from the executive and 12 months from the company, to terminate employment. In the event of termination by the company the company
may elect that the executive does not serve the notice period in which case 12 months salary would be payable. The contracts are rolling
with no fixed term.
Contract of employment for David Patrick requires a notice period of 12 months by either party. Contracts of employment for Richard Pilgrim
and Mike Osborne require a notice period of not less than three months by either party. In the event of termination by the company the
company may elect that the executive does not serve the notice period in which case three months’ salary would be payable. The contracts
are rolling with no fixed term.
None of the non-executive directors have an employment contract with the company.
ENVIRONMENTAL STATEMENT
The Company has assessed whether there are any particular or significant environmental Regulations, which apply to the Company, and has
determined that there are none.
INDEMNIFICATION AND INSURANCE OF OFFICERS
During the financial year, the company paid a premium in respect of a contract insuring the directors of the company (as named above), the
company secretary, Ralph Groom, and all executive officers of the company and of any related body corporate against a liability incurred as
such a director, secretary or executive officer to the extent permitted by the Corporations Act 2001. The contract of insurance prohibits
disclosure of the nature of the liability and the amount of the premium.
The Company has not otherwise, during or since the end of the financial year, except to the extent permitted by law, indemnified or agreed
to indemnify an officer or auditor of the company or of any related body corporate against a liability incurred as such an officer or auditor.
AUDITOR’S INDEPENDENCE DECLARATION
The auditor’s independence declaration is included at the end of the financial statements.
NON-AUDIT SERVICES
The directors are satisfied that the provision of non-audit services, during the year, by the auditor is compatible with the general standard of
independence for auditors imposed by the Corporations Act 2001.
The directors are satisfied that the provision of non-audit services, during the year, by the auditor did not compromise the auditor
independence requirements of the Corporations Act 2001, as the nature of the services was limited to the preparation of the statutory income
tax returns, indirect tax compliance, transaction/compliance related matters and generic accounting advice. All non-audit services have been
reviewed and approved to ensure they do not impact the integrity and objectivity of the auditor, and none of the services undermine the
general principles relating to auditor independence as set out in Code of Conduct APES 110 Code of Ethics for Professional Accountants
issued by the Accounting Professional and Ethical Standards Board, including reviewing or auditing the auditor’s own work, acting in a
management or decision-making capacity for the company, acting as advocate for the company or jointly sharing economic risks and
rewards.
For
per
sona
l use
onl
y

D i r e c t o r s ’ R e p o r t
25
Details of the amounts paid or payable to the auditor for non-audit services provided during the year by the auditor are outlined in note 4 to
the financial statements.
The directors’ report is signed in accordance with a resolution of directors made pursuant to S298(2) of the Corporations Act 2001.
For and on behalf of the Board
REGINALD WEBB
Director
Perth, Western Australia
Date: 16 September 2011
For
per
sona
l use
onl
y
C o r p o r a t e G o v e r n a n c e
26
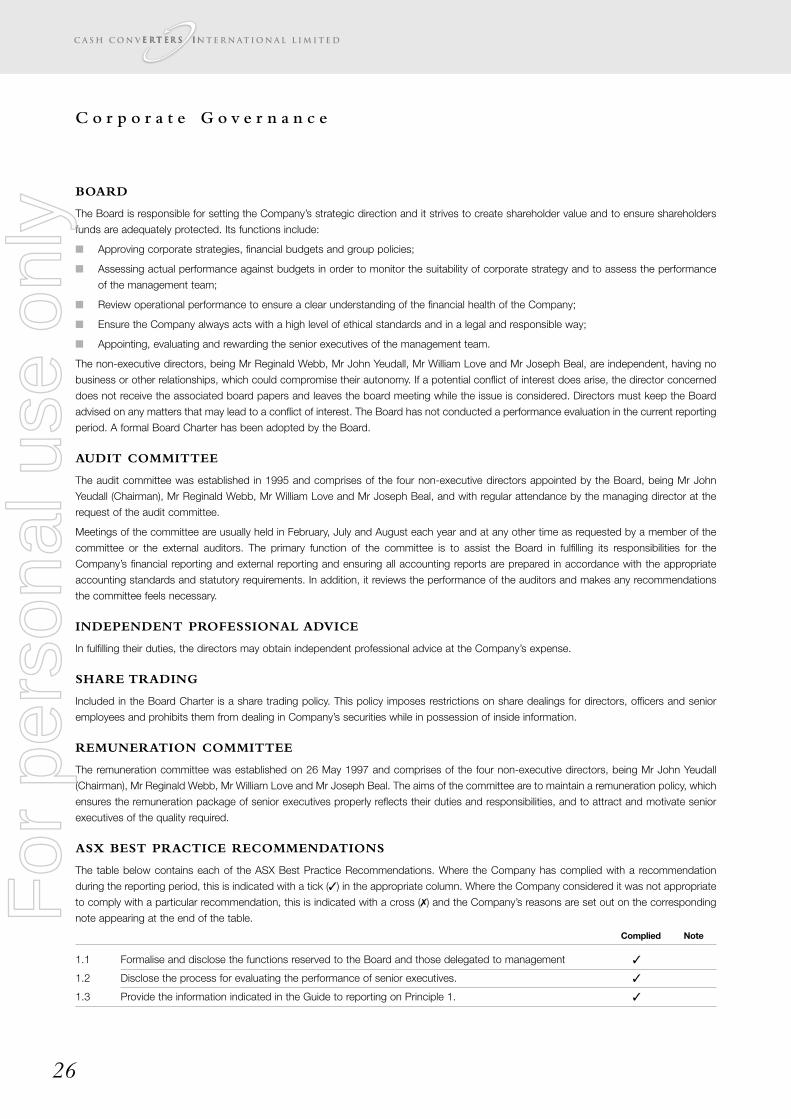
BOARD
The Board is responsible for setting the Company’s strategic direction and it strives to create shareholder value and to ensure shareholders
funds are adequately protected. Its functions include:
� Approving corporate strategies, financial budgets and group policies;
� Assessing actual performance against budgets in order to monitor the suitability of corporate strategy and to assess the performance
of the management team;
� Review operational performance to ensure a clear understanding of the financial health of the Company;
� Ensure the Company always acts with a high level of ethical standards and in a legal and responsible way;
� Appointing, evaluating and rewarding the senior executives of the management team.
The non-executive directors, being Mr Reginald Webb, Mr John Yeudall, Mr William Love and Mr Joseph Beal, are independent, having no
business or other relationships, which could compromise their autonomy. If a potential conflict of interest does arise, the director concerned
does not receive the associated board papers and leaves the board meeting while the issue is considered. Directors must keep the Board
advised on any matters that may lead to a conflict of interest. The Board has not conducted a performance evaluation in the current reporting
period. A formal Board Charter has been adopted by the Board.
AUDIT COMMITTEE
The audit committee was established in 1995 and comprises of the four non-executive directors appointed by the Board, being Mr John
Yeudall (Chairman), Mr Reginald Webb, Mr William Love and Mr Joseph Beal, and with regular attendance by the managing director at the
request of the audit committee.
Meetings of the committee are usually held in February, July and August each year and at any other time as requested by a member of the
committee or the external auditors. The primary function of the committee is to assist the Board in fulfilling its responsibilities for the
Company’s financial reporting and external reporting and ensuring all accounting reports are prepared in accordance with the appropriate
accounting standards and statutory requirements. In addition, it reviews the performance of the auditors and makes any recommendations
the committee feels necessary.
INDEPENDENT PROFESSIONAL ADVICE
In fulfilling their duties, the directors may obtain independent professional advice at the Company’s expense.
SHARE TRADING
Included in the Board Charter is a share trading policy. This policy imposes restrictions on share dealings for directors, officers and senior
employees and prohibits them from dealing in Company’s securities while in possession of inside information.
REMUNERATION COMMITTEE
The remuneration committee was established on 26 May 1997 and comprises of the four non-executive directors, being Mr John Yeudall
(Chairman), Mr Reginald Webb, Mr William Love and Mr Joseph Beal. The aims of the committee are to maintain a remuneration policy, which
ensures the remuneration package of senior executives properly reflects their duties and responsibilities, and to attract and motivate senior
executives of the quality required.
ASX BEST PRACTICE RECOMMENDATIONS
The table below contains each of the ASX Best Practice Recommendations. Where the Company has complied with a recommendation
during the reporting period, this is indicated with a tick (�) in the appropriate column. Where the Company considered it was not appropriate
to comply with a particular recommendation, this is indicated with a cross (�) and the Company’s reasons are set out on the corresponding
note appearing at the end of the table.
Complied Note
1.1 Formalise and disclose the functions reserved to the Board and those delegated to management �
1.2 Disclose the process for evaluating the performance of senior executives. �
1.3 Provide the information indicated in the Guide to reporting on Principle 1. �
For
per
sona
l use
onl
y
C o r p o r a t e G o v e r n a n c e
27
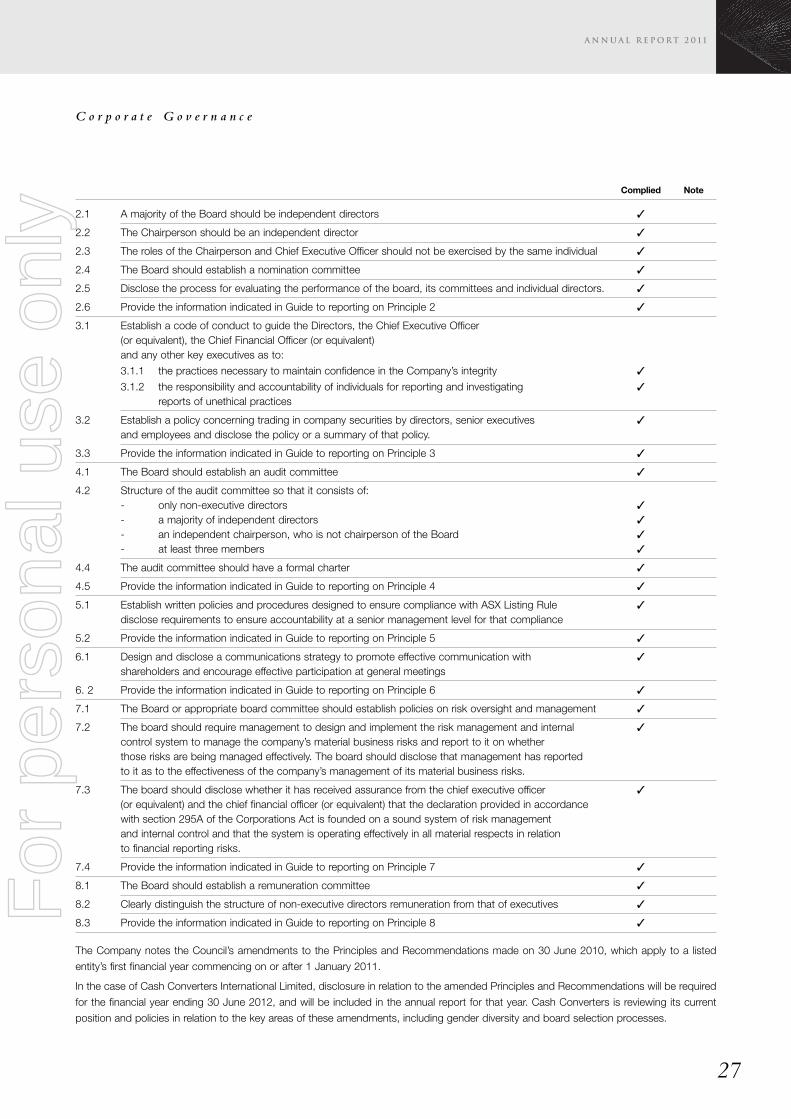
Complied Note
2.1 A majority of the Board should be independent directors �
2.2 The Chairperson should be an independent director �
2.3 The roles of the Chairperson and Chief Executive Officer should not be exercised by the same individual �
2.4 The Board should establish a nomination committee �
2.5 Disclose the process for evaluating the performance of the board, its committees and individual directors. �
2.6 Provide the information indicated in Guide to reporting on Principle 2 �
3.1 Establish a code of conduct to guide the Directors, the Chief Executive Officer(or equivalent), the Chief Financial Officer (or equivalent)and any other key executives as to:
3.1.1 the practices necessary to maintain confidence in the Company’s integrity �
3.1.2 the responsibility and accountability of individuals for reporting and investigating �
reports of unethical practices
3.2 Establish a policy concerning trading in company securities by directors, senior executives �
and employees and disclose the policy or a summary of that policy.
3.3 Provide the information indicated in Guide to reporting on Principle 3 �
4.1 The Board should establish an audit committee �
4.2 Structure of the audit committee so that it consists of:- only non-executive directors �
- a majority of independent directors �
- an independent chairperson, who is not chairperson of the Board �
- at least three members �
4.4 The audit committee should have a formal charter �
4.5 Provide the information indicated in Guide to reporting on Principle 4 �
5.1 Establish written policies and procedures designed to ensure compliance with ASX Listing Rule �
disclose requirements to ensure accountability at a senior management level for that compliance
5.2 Provide the information indicated in Guide to reporting on Principle 5 �
6.1 Design and disclose a communications strategy to promote effective communication with �
shareholders and encourage effective participation at general meetings
6. 2 Provide the information indicated in Guide to reporting on Principle 6 �
7.1 The Board or appropriate board committee should establish policies on risk oversight and management �
7.2 The board should require management to design and implement the risk management and internal �
control system to manage the company’s material business risks and report to it on whetherthose risks are being managed effectively. The board should disclose that management has reportedto it as to the effectiveness of the company’s management of its material business risks.
7.3 The board should disclose whether it has received assurance from the chief executive officer �
(or equivalent) and the chief financial officer (or equivalent) that the declaration provided in accordancewith section 295A of the Corporations Act is founded on a sound system of risk managementand internal control and that the system is operating effectively in all material respects in relationto financial reporting risks.
7.4 Provide the information indicated in Guide to reporting on Principle 7 �
8.1 The Board should establish a remuneration committee �
8.2 Clearly distinguish the structure of non-executive directors remuneration from that of executives �
8.3 Provide the information indicated in Guide to reporting on Principle 8 �
The Company notes the Council’s amendments to the Principles and Recommendations made on 30 June 2010, which apply to a listed
entity’s first financial year commencing on or after 1 January 2011.
In the case of Cash Converters International Limited, disclosure in relation to the amended Principles and Recommendations will be required
for the financial year ending 30 June 2012, and will be included in the annual report for that year. Cash Converters is reviewing its current
position and policies in relation to the key areas of these amendments, including gender diversity and board selection processes.
For
per
sona
l use
onl
y

C o r p o r a t e G o v e r n a n c e
28
London Stock Exchange plc (“LSE”)
The Company has a premium listing on the official list of the LSE. The Company has called a general meeting of shareholders to be held on
6th October 2011 to consider and if thought fit, to resolve that the Company should migrate to a standard listing. Details of this resolution
and process have been given in the relevant notice of general meeting dated 6 September 2011.
For
per
sona
l use
onl
y
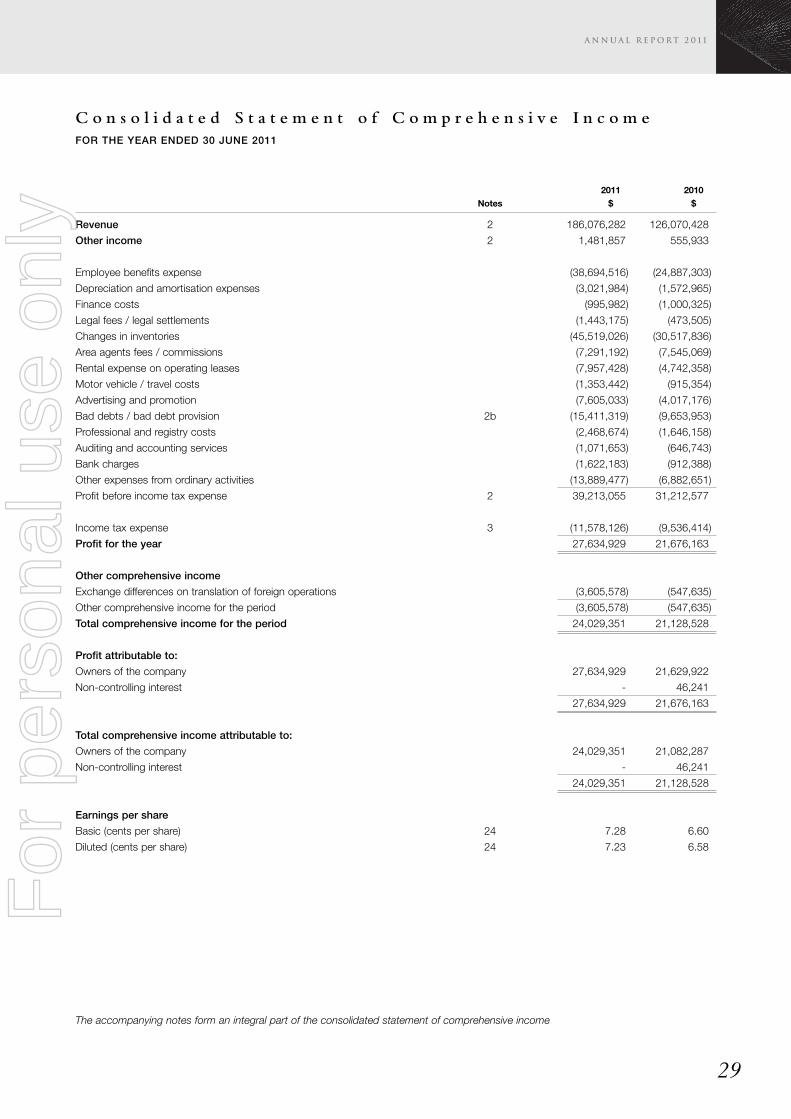
C o n s o l i d a t e d S t a t e m e n t o f C o m p r e h e n s i v e I n c o m eFOR THE YEAR ENDED 30 JUNE 2011
29
2011 2010Notes $ $
Revenue 2 186,076,282 126,070,428
Other income 2 1,481,857 555,933
Employee benefits expense (38,694,516) (24,887,303)
Depreciation and amortisation expenses (3,021,984) (1,572,965)
Finance costs (995,982) (1,000,325)
Legal fees / legal settlements (1,443,175) (473,505)
Changes in inventories (45,519,026) (30,517,836)
Area agents fees / commissions (7,291,192) (7,545,069)
Rental expense on operating leases (7,957,428) (4,742,358)
Motor vehicle / travel costs (1,353,442) (915,354)
Advertising and promotion (7,605,033) (4,017,176)
Bad debts / bad debt provision 2b (15,411,319) (9,653,953)
Professional and registry costs (2,468,674) (1,646,158)
Auditing and accounting services (1,071,653) (646,743)
Bank charges (1,622,183) (912,388)
Other expenses from ordinary activities (13,889,477) (6,882,651)
Profit before income tax expense 2 39,213,055 31,212,577
Income tax expense 3 (11,578,126) (9,536,414)
Profit for the year 27,634,929 21,676,163
Other comprehensive income
Exchange differences on translation of foreign operations (3,605,578) (547,635)
Other comprehensive income for the period (3,605,578) (547,635)
Total comprehensive income for the period 24,029,351 21,128,528
Profit attributable to:
Owners of the company 27,634,929 21,629,922
Non-controlling interest - 46,241
27,634,929 21,676,163
Total comprehensive income attributable to:
Owners of the company 24,029,351 21,082,287
Non-controlling interest - 46,241
24,029,351 21,128,528
Earnings per share
Basic (cents per share) 24 7.28 6.60
Diluted (cents per share) 24 7.23 6.58
The accompanying notes form an integral part of the consolidated statement of comprehensive income
For
per
sona
l use
onl
y
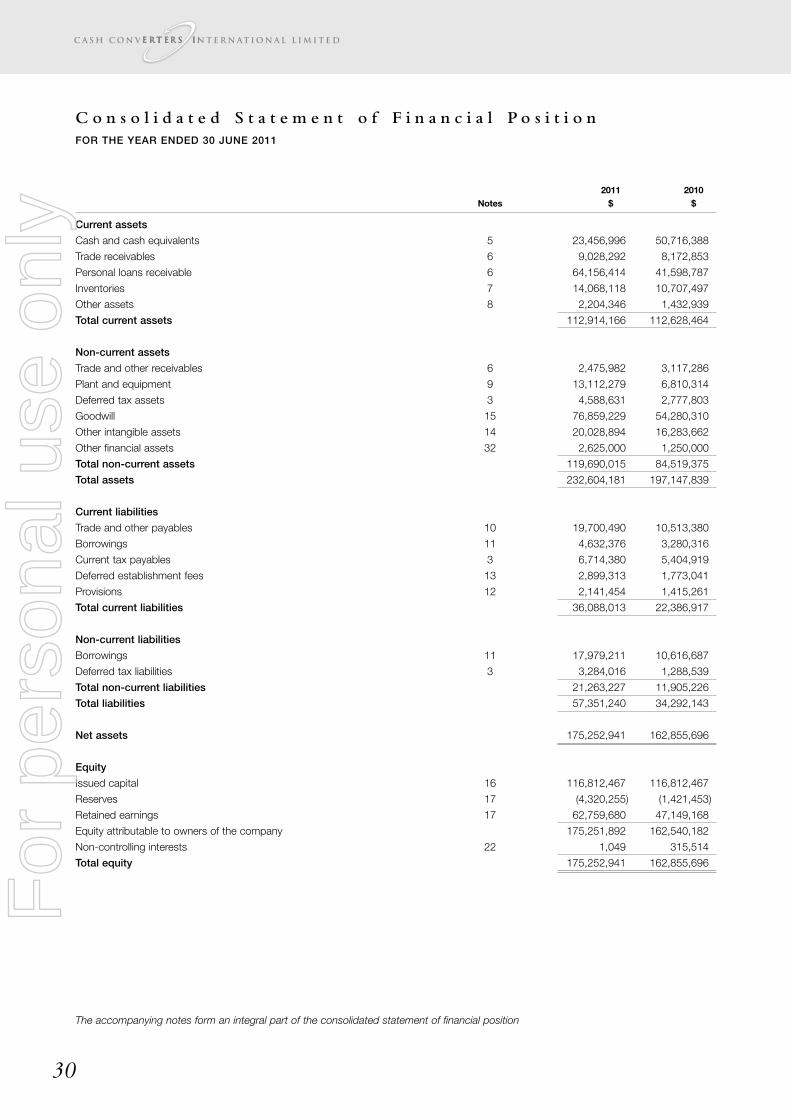
C o n s o l i d a t e d S t a t e m e n t o f F i n a n c i a l P o s i t i o nFOR THE YEAR ENDED 30 JUNE 2011
30
2011 2010Notes $ $
Current assets
Cash and cash equivalents 5 23,456,996 50,716,388
Trade receivables 6 9,028,292 8,172,853
Personal loans receivable 6 64,156,414 41,598,787
Inventories 7 14,068,118 10,707,497
Other assets 8 2,204,346 1,432,939
Total current assets 112,914,166 112,628,464
Non-current assets
Trade and other receivables 6 2,475,982 3,117,286
Plant and equipment 9 13,112,279 6,810,314
Deferred tax assets 3 4,588,631 2,777,803
Goodwill 15 76,859,229 54,280,310
Other intangible assets 14 20,028,894 16,283,662
Other financial assets 32 2,625,000 1,250,000
Total non-current assets 119,690,015 84,519,375
Total assets 232,604,181 197,147,839
Current liabilities
Trade and other payables 10 19,700,490 10,513,380
Borrowings 11 4,632,376 3,280,316
Current tax payables 3 6,714,380 5,404,919
Deferred establishment fees 13 2,899,313 1,773,041
Provisions 12 2,141,454 1,415,261
Total current liabilities 36,088,013 22,386,917
Non-current liabilities
Borrowings 11 17,979,211 10,616,687
Deferred tax liabilities 3 3,284,016 1,288,539
Total non-current liabilities 21,263,227 11,905,226
Total liabilities 57,351,240 34,292,143
Net assets 175,252,941 162,855,696
Equity
Issued capital 16 116,812,467 116,812,467
Reserves 17 (4,320,255) (1,421,453)
Retained earnings 17 62,759,680 47,149,168
Equity attributable to owners of the company 175,251,892 162,540,182
Non-controlling interests 22 1,049 315,514
Total equity 175,252,941 162,855,696
The accompanying notes form an integral part of the consolidated statement of financial position
For
per
sona
l use
onl
y
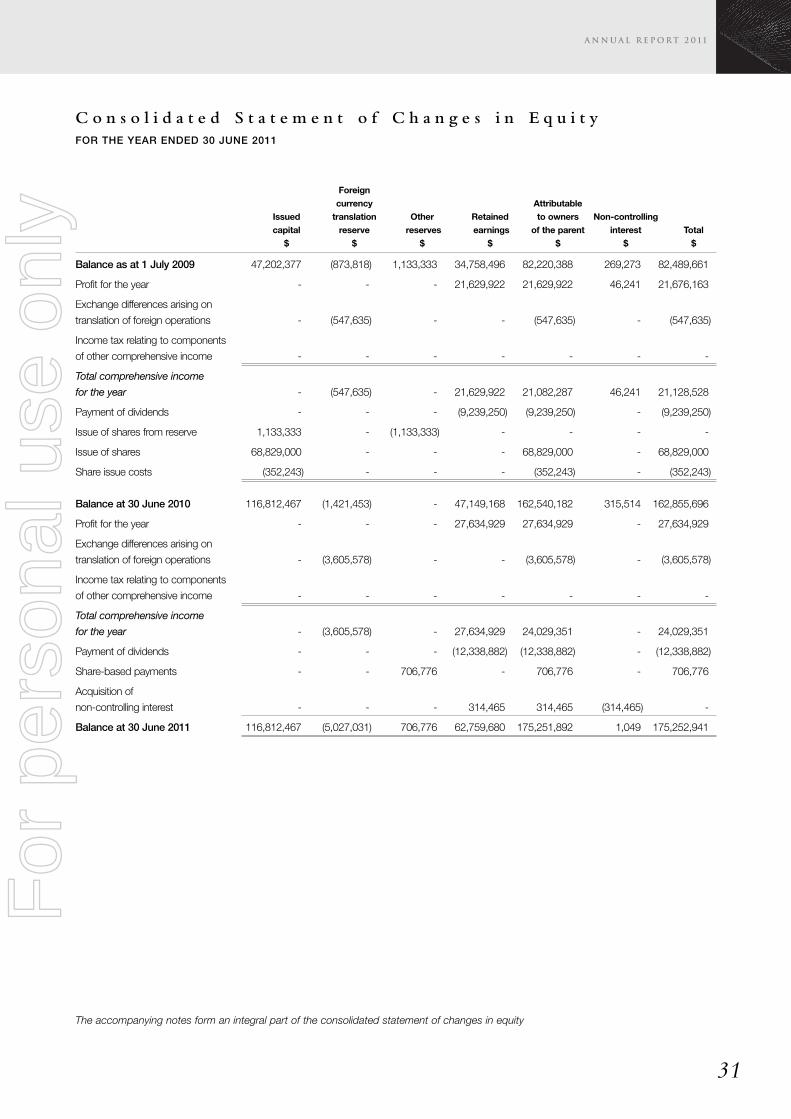
C o n s o l i d a t e d S t a t e m e n t o f C h a n g e s i n E q u i t yFOR THE YEAR ENDED 30 JUNE 2011
31
Foreigncurrency Attributable
Issued translation Other Retained to owners Non-controllingcapital reserve reserves earnings of the parent interest Total$ $ $ $ $ $ $
Balance as at 1 July 2009 47,202,377 (873,818) 1,133,333 34,758,496 82,220,388 269,273 82,489,661
Profit for the year - - - 21,629,922 21,629,922 46,241 21,676,163
Exchange differences arising on
translation of foreign operations - (547,635) - - (547,635) - (547,635)
Income tax relating to components
of other comprehensive income - - - - - - -
Total comprehensive income
for the year - (547,635) - 21,629,922 21,082,287 46,241 21,128,528
Payment of dividends - - - (9,239,250) (9,239,250) - (9,239,250)
Issue of shares from reserve 1,133,333 - (1,133,333) - - - -
Issue of shares 68,829,000 - - - 68,829,000 - 68,829,000
Share issue costs (352,243) - - - (352,243) - (352,243)
Balance at 30 June 2010 116,812,467 (1,421,453) - 47,149,168 162,540,182 315,514 162,855,696
Profit for the year - - - 27,634,929 27,634,929 - 27,634,929
Exchange differences arising on
translation of foreign operations - (3,605,578) - - (3,605,578) - (3,605,578)
Income tax relating to components
of other comprehensive income - - - - - - -
Total comprehensive income
for the year - (3,605,578) - 27,634,929 24,029,351 - 24,029,351
Payment of dividends - - - (12,338,882) (12,338,882) - (12,338,882)
Share-based payments - - 706,776 - 706,776 - 706,776
Acquisition of
non-controlling interest - - - 314,465 314,465 (314,465) -
Balance at 30 June 2011 116,812,467 (5,027,031) 706,776 62,759,680 175,251,892 1,049 175,252,941
The accompanying notes form an integral part of the consolidated statement of changes in equity
For
per
sona
l use
onl
y
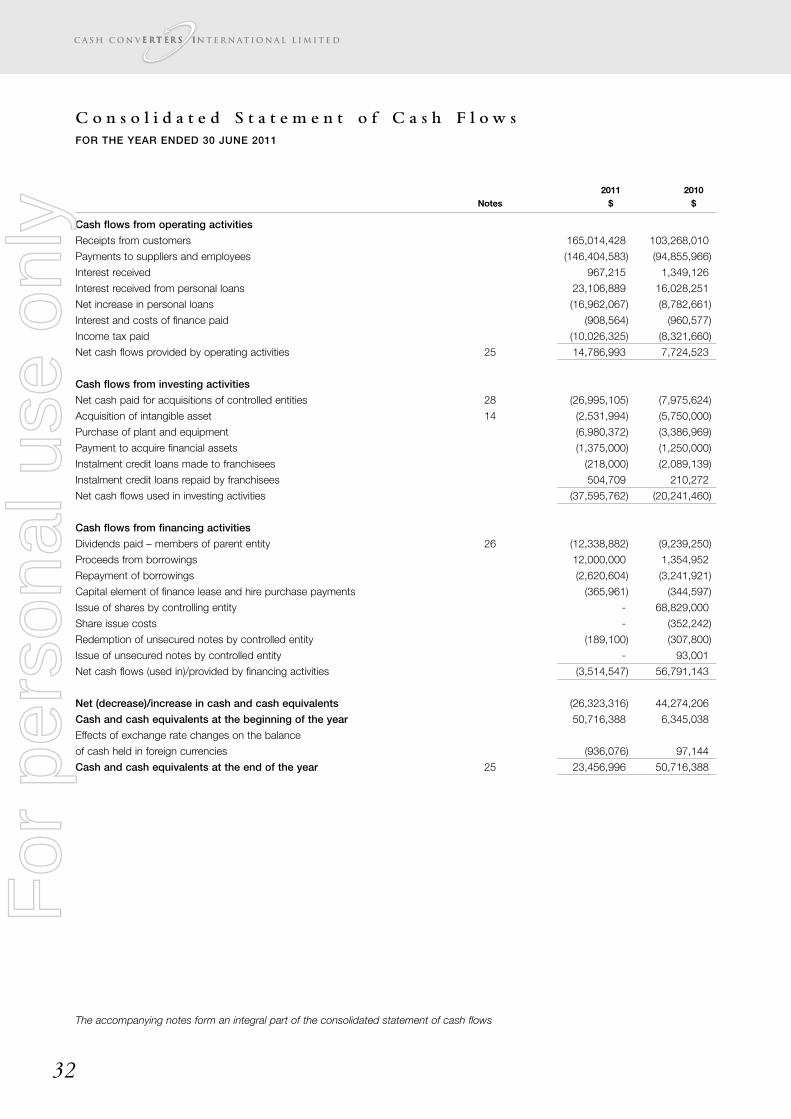
C o n s o l i d a t e d S t a t e m e n t o f C a s h F l o w sFOR THE YEAR ENDED 30 JUNE 2011
32
2011 2010Notes $ $
Cash flows from operating activities
Receipts from customers 165,014,428 103,268,010
Payments to suppliers and employees (146,404,583) (94,855,966)
Interest received 967,215 1,349,126
Interest received from personal loans 23,106,889 16,028,251
Net increase in personal loans (16,962,067) (8,782,661)
Interest and costs of finance paid (908,564) (960,577)
Income tax paid (10,026,325) (8,321,660)
Net cash flows provided by operating activities 25 14,786,993 7,724,523
Cash flows from investing activities
Net cash paid for acquisitions of controlled entities 28 (26,995,105) (7,975,624)
Acquisition of intangible asset 14 (2,531,994) (5,750,000)
Purchase of plant and equipment (6,980,372) (3,386,969)
Payment to acquire financial assets (1,375,000) (1,250,000)
Instalment credit loans made to franchisees (218,000) (2,089,139)
Instalment credit loans repaid by franchisees 504,709 210,272
Net cash flows used in investing activities (37,595,762) (20,241,460)
Cash flows from financing activities
Dividends paid – members of parent entity 26 (12,338,882) (9,239,250)
Proceeds from borrowings 12,000,000 1,354,952
Repayment of borrowings (2,620,604) (3,241,921)
Capital element of finance lease and hire purchase payments (365,961) (344,597)
Issue of shares by controlling entity - 68,829,000
Share issue costs - (352,242)
Redemption of unsecured notes by controlled entity (189,100) (307,800)
Issue of unsecured notes by controlled entity - 93,001
Net cash flows (used in)/provided by financing activities (3,514,547) 56,791,143
Net (decrease)/increase in cash and cash equivalents (26,323,316) 44,274,206
Cash and cash equivalents at the beginning of the year 50,716,388 6,345,038
Effects of exchange rate changes on the balance
of cash held in foreign currencies (936,076) 97,144
Cash and cash equivalents at the end of the year 25 23,456,996 50,716,388
The accompanying notes form an integral part of the consolidated statement of cash flows
For
per
sona
l use
onl
y
N o t e s t o t h e C o n s o l i d a t e d F i n a n c i a l S t a t e m e n t sFOR THE YEAR ENDED 30 JUNE 2011
33
1. SUMMARY OF ACCOUNTING POLICIES
STATEMENT OF COMPLIANCE
The financial report is a general purpose financial report which has been prepared in accordance with the Corporations Act 2001,
Accounting Standards and Interpretations, and complies with other requirements of the law.
The financial report comprises the consolidated financial report of the Group.
Accounting Standards include Australian equivalents to International Financial Reporting Standards (‘A-IFRS’). Compliance with the A-
IFRS ensures that the financial statements and notes of the consolidated entity comply with International Financial Reporting Standards
(‘IFRS’).
The financial statements were authorised for issue by the directors on 16 September 2011.
BASIS OF PREPARATION
The financial report has been prepared on the basis of historical cost, except for the revaluation of certain non-current assets and financial
instruments. Cost is based on the fair values of the consideration given in exchange for assets. Unless otherwise noted, all amounts are
presented in Australian dollars.
CRITICAL ACCOUNTING JUDGMENTS AND KEY SOURCES OF ESTIMATION UNCERTAINTY
In the application of the consolidated entity’s accounting policies, management is required to make judgments, estimates and
assumptions about carrying values of assets and liabilities that are not readily apparent from other sources. The estimates and associated
assumptions are based on historical experience and various other factors that are believed to be reasonable under the circumstance,
the results of which form the basis of making the judgments. Actual results may differ from these estimates.
The estimates and underlying assumptions are reviewed on an ongoing basis. Revisions to accounting estimates are recognised in the
period in which the estimate is revised if the revision affects only that period, or in the period of the revision and future periods if the
revision affects both current and future periods.
The following are the key assumptions concerning the future and other key sources of estimation uncertainty at the reporting date, that
have a significant risk of causing a material adjustment to the carrying amounts of assets and liabilities within the next financial year:
Impairment of goodwill
Determining whether goodwill is impaired requires an estimation of recoverable value of the cash-generating units to which goodwill has
been allocated. The value in use calculation requires the entity to estimate the future cash flows expected to arise from the cash-
generating unit and a suitable discount rate in order to calculate present value.
As disclosed in note 21, subsequent to year end the Australian Federal Government announced proposals to introduce strict caps on
fees and charges for micro-lenders. Because these amendments have not yet been passed, certain assumptions in relation to any
potential impact have had to be made as part of the impairment testing, refer note 15 for further information. Should these assumptions
be incorrect this could impact the recoverability of goodwill related to the personal loans and cash advance operations.
The carrying amount of goodwill at the reporting date was $76,859,229 (2010: $54,280,310) refer to note 15.
Useful lives of other intangible assets
The consolidated entity reviews the estimated useful lives of other intangible assets at the end of each annual reporting period. The
estimation of the remaining useful lives of the other intangible assets requires the entity to make significant estimates based on both past
performance and expectations of future performance.
The carrying amount of other intangible assets at the balance sheet date was $20,028,894 (2010: $16,283,662) refer to note 14.
Allowance for doubtful debts
The impairment of personal loans requires the consolidate entity to assess impairment regularly. The credit provisions raised (specific and
collective) represent management’s best estimate of the losses incurred in the loan portfolio at reporting date based on their experienced
judgment. The collective provision is estimated on the basis of historical loss experience for assets with similar credit characteristics. The
historical loss experience is adjusted based on current observable data and events. The use of such judgments and reasonable
estimates is considered by management to be an essential part of the process and does not impact on reliability.
Specific provisioning is applied when the full collectibles of one of the Group’s loans is identified as being doubtful.
For
per
sona
l use
onl
y
N o t e s t o t h e C o n s o l i d a t e d F i n a n c i a l S t a t e m e n t s
34
1. SUMMARY OF ACCOUNTING POLICIES (continued)
Comparative financial information
The following comparative financial information has been reclassified to aid comparability with the current year, and more appropriately
reflect the nature of the items concerned. None of the adjustments affect profit before or after tax or net assets.
Statement of Comprehensive income
Bad debt recoveries have been reclassified from revenue, and netted against bad debt expense. For the year-ended 30 June 2010 the
bad debt recoveries were $1,161,417, refer note 2.
Statement of Cash flows
Net cash flows from personal loans has been reclassified from cash flows from investing activities into cash flows from operating
activities. For the year ended 30 June 2010 the net increase in personal loans was $8,782,661.
SIGNIFICANT ACCOUNTING POLICIES
Accounting policies are selected and applied in a manner which ensures that the resulting financial information satisfies the concepts of
relevance and reliability, thereby ensuring that the substance of the underlying transactions or other events is reported. In the current
year, the consolidated entity has adopted all of the new and revised Standards and Interpretations issued by the Australian Accounting
Standards Board (the AASB) that are relevant to their operations and effective for the current annual reporting period. The adoption of
these new and revised Standards and Interpretations has not resulted in any changes to the consolidated entity’s accounting policies.
The following significant accounting policies have been adopted in the preparation and presentation of the financial report:
(a) BORROWINGS
Borrowings are recorded initially at fair value, net of transaction costs.
Subsequent to initial recognition, borrowings are measured at amortised cost with any difference between the initial recognised amount
and the redemption value being recognised in profit and loss over the period of the borrowing using the effective interest rate method.
(b) CASH AND CASH EQUIVALENTS
Cash and cash equivalents comprise cash on hand, cash in banks and investments in short term money market instruments, net of
outstanding bank overdrafts. Bank overdrafts are shown within borrowings in current liabilities in the statement of financial position.
(c) EMPLOYEE BENEFITS
A liability is recognised for benefits accruing to employees in respect of wages and salaries, annual leave, long service leave, and sick
leave when it is probable that settlement will be required and they are capable of being measured reliably.
Liabilities recognised in respect of short term employee benefits, are measured at their nominal values using the remuneration rate
expected to apply at the time of settlement.
Liabilities recognised in respect of employee benefits which are not expected to be settled within 12 months are measured as the present
value of the estimated future cash outflows to be made by the consolidated entity in respect of services provided by employees up to
reporting date.
Defined contribution plans
Contributions to defined contribution superannuation plans are expensed when incurred.
(d) FINANCIAL ASSETS
Investments are recognised and derecognised on trade date where purchase or sale of an investment is under a contract whose terms
require delivery of the investment within the timeframe established by the market concerned, and are initially measured at fair value, net
of transaction costs.
Subsequent to initial recognition, investments in subsidiaries are measured at cost.
Other financial assets are classified as ‘loans and receivables’.
Effective interest method
The effective interest method is a method of calculating the amortised cost of a financial asset and of allocating interest income over the
relevant period. The effective interest rate is the rate that exactly discounts estimated future cash receipts through the expected life of
the financial asset, or where appropriate, a shorter period.
For
per
sona
l use
onl
y
N o t e s t o t h e C o n s o l i d a t e d F i n a n c i a l S t a t e m e n t s
35
Loans and receivables
Trade receivables, loans, and other receivables are recorded at amortised cost using the effective interest method less impairment.
(e) FINANCIAL INSTRUMENTS ISSUED BY THE COMPANY
Debt and equity instruments
Debt and equity instruments are classified as either liabilities or as equity in accordance with the substance of the contractual
arrangement.
Transaction costs on the issue of equity instruments
Transaction costs arising on the issue of equity instruments are recognised directly in equity as a reduction of the proceeds of the equity
instruments to which the costs relate. Transaction costs are the costs that are incurred directly in connection with the issue of those
equity instruments and which would not have been incurred had those instruments not been issued.
Interest and dividends
Interest and dividends are classified as expenses or as distributions of profit consistent with the statement of financial position
classification of the related debt or equity instruments or component parts of compound instruments.
Financial guarantee contract liabilities
Financial guarantee contract liabilities are measured initially at the fair values and subsequently at the higher of the amount recognised
as a provision and the amount initially recognised less cumulative amortisation in accordance with the revenue policies.
Impairment of financial assets
Financial assets, other than those at fair value through profit or loss, are assessed for indicators of impairment at the end of each
reporting period. Financial assets are impaired where there is objective evidence that as a result of one or more events that occurred
after the initial recognition of the financial asset the estimated future cash flows of the investment have been impacted. For financial
assets carried at amortised cost, the amount of the impairment is the difference between the asset’s carrying amount and the present
value of estimated future cash flows, discounted at the original effective interest rate.
The carrying amount of the financial asset is reduced by the impairment loss directly for all financial assets with the exception of trade
receivables where the carrying amount is reduced through the use of an allowance account. When a trade receivable is uncollectible, it
is written off against the allowance account. Subsequent recoveries of amounts previously written off are credited against the allowance
account. Changes in the carrying amount of the allowance account are recognised in profit or loss.
If, in a subsequent period, the amount of the impairment loss decreases and the decrease can be related objectively to an event
occurring after the impairment was recognised, the previously recognised impairment loss is reversed through profit or loss to the extent
the carrying amount of the investment at the date the impairment is reversed does not exceed what the amortised cost would have been
had the impairment not been recognised.
(f) FOREIGN CURRENCY
Foreign currency transactions
All foreign currency transactions during the financial year are brought to account using the exchange rate in effect at the date of the
transaction. Foreign currency monetary items at reporting date are translated at the exchange rate existing at reporting date. Non-
monetary assets and liabilities carried at fair value that are denominated in foreign currencies are translated at the rates prevailing at the
date when the fair value was determined.
Exchange differences are recognised in profit or loss in the period in which they arise except for exchange differences on monetary items
receivable from or payable to a foreign operation for which settlement is neither planned or likely to occur, which form part of the net
investment in a foreign operation, are recognised in the foreign currency translation reserve and recognised in profit or loss on disposal
of the net investment.
Foreign operations
On consolidation, the assets and liabilities of the consolidated entity’s overseas operations are translated at exchange rates prevailing at
the reporting date. Income and expense items are translated at the average exchange rates for the period unless exchange rates
fluctuate significantly. Exchange differences arising, if any, are recognised in the foreign currency translation reserve, and recognised in
profit or loss on disposal of the foreign operation.
Goodwill and fair value adjustments arising on the acquisition of a foreign entity on or after the date of transition to A-IFRS are treated
as assets and liabilities of the foreign entity and translated at exchange rates prevailing at the reporting date.
For
per
sona
l use
onl
y
N o t e s t o t h e C o n s o l i d a t e d F i n a n c i a l S t a t e m e n t s
36
1. SUMMARY OF ACCOUNTING POLICIES (continued)
(g) GOODS AND SERVICES TAX
Revenues, expenses and assets are recognised net of the amount of goods and services tax (GST), except:
i. where the amount of GST incurred is not recoverable from the taxation authority, it is recognised as part of the cost of acquisition
of an asset or as part of an item of expense; or
ii. for receivables and payables which are recognised inclusive of GST.
The net amount of GST recoverable from, or payable to, the taxation authority is included as part of receivables or payables.
Cash flows are included in the cash flow statement on a gross basis. The GST component of cash flows arising from investing and
financing activities which is recoverable from, or payable to, the taxation authority is classified as operating cash flows.
(h) IMPAIRMENT OF OTHER TANGIBLE AND INTANGIBLE ASSETS
At each reporting date, the consolidated entity reviews the carrying amounts of its tangible and intangible assets to determine whether
there is any indication that those assets have suffered an impairment loss. If any such indication exists, the recoverable amount of the
asset is estimated in order to determine the extent of the impairment loss (if any). Where the asset does not generate cash flows that
are independent from other assets, the consolidated entity estimates the recoverable amount of the cash-generating unit to which the
asset belongs.
Recoverable amount is the higher of fair value less costs to sell and value in use. In assessing value in use, the estimated future cash
flows are discounted to their present value using a pre-tax discount rate that reflects current market assessments of the time value of
money and the risks specific to the asset for which the estimates of future cash flows have not been adjusted.
If the recoverable amount of an asset (or cash-generating unit) is estimated to be less than its carrying amount, the carrying amount of
the asset (cash-generating unit) is reduced to its recoverable amount. An impairment loss is recognised in profit or loss immediately.
Where an impairment loss subsequently reverses, the carrying amount of the asset (cash-generating unit) is increased to the revised
estimate of its recoverable amount, but only to the extent that the increased carrying amount does not exceed the carrying amount that
would have been determined had no impairment loss been recognised for the asset (cash-generating unit) in prior years. A reversal of
an impairment loss is recognised in profit or loss immediately.
(i) INCOME TAX
Current tax
Current tax is calculated by reference to the amount of income taxes payable or recoverable in respect of the taxable profit or tax loss
for the period. It is calculated using tax rates and tax laws that have been enacted or substantively enacted by reporting date. Current
tax for current and prior periods is recognised as a liability (or asset) to the extent that it is unpaid (or refundable).
Deferred tax
Deferred tax is accounted for using the comprehensive balance sheet liability method in respect of temporary differences arising from
differences between the carrying amount of assets and liabilities in the financial statements and the corresponding tax base of those
items.
In principle, deferred tax liabilities are recognised for all taxable temporary differences. Deferred tax assets are recognised to the extent
that it is probable that sufficient taxable amounts will be available against which deductible temporary differences or unused tax losses
and tax offsets can be utilised. However, deferred tax assets and liabilities are not recognised if the temporary differences giving rise to
them arise from the initial recognition of assets and liabilities (other than as a result of a business combination) which affects neither
taxable income nor accounting profit. Furthermore a deferred tax liability is not recognised in relation to the temporary differences arising
from the initial recognition of goodwill.
Deferred tax liabilities are recognised for taxable temporary differences arising on investments in subsidiaries, branches, associates and
joint ventures except where the consolidated entity is able to control the reversal of the temporary differences and it is probable that the
temporary differences will not reverse in the foreseeable future.
Deferred tax assets arising from deductible temporary differences associated with these investments and interests are only recognised
to the extent that it is probable that there will be sufficient taxable profits against which to utilise the benefits of the temporary differences
and they are expected to reverse in the foreseeable future.
Deferred tax assets and liabilities are measured at the tax rates that are expected to apply to the period(s) when the asset and liability
giving rise to them are realised or settled, based on tax rates (and tax laws) that have been enacted or substantively enacted by reporting
For
per
sona
l use
onl
y
N o t e s t o t h e C o n s o l i d a t e d F i n a n c i a l S t a t e m e n t s
37
date. The measurement of deferred tax liabilities and assets reflects the tax consequences that would follow from the manner in which
the consolidated entity expects, at the reporting date, to recover or settle the carrying amount of its assets and liabilities.
Deferred tax assets and liabilities are offset when they relate to income taxes levied by the same taxation authority and the
company/consolidated entity intends to settle its current tax assets and liabilities on a net basis.
Current and deferred tax for the period
Current and deferred tax is recognised as an expense or income in the statement of comprehensive income, except when it relates to
items credited or debited directly to equity, in which case the deferred tax is also recognised directly in equity, or where it arises from the
initial accounting for a business combination, in which case it is taken into account in the determination of goodwill or excess.
Tax consolidation
The company and its wholly-owned Australian resident entities are part of a tax-consolidated group under Australian taxation law. Cash
Converters International Limited is the head entity in the tax-consolidated group. Tax expense/income, deferred tax liabilities and deferred
tax assets arising from temporary differences of the members of the tax-consolidated group are recognised in the separate financial
statements of the members of the tax-consolidated group using the ‘separate taxpayer within group’ approach. Current tax liabilities and
assets and deferred tax assets arising from unused tax losses and tax credits of the members of the tax-consolidated group are
recognised by the company (as head entity in the tax-consolidated group).
Due to the existence of a tax funding arrangement between the entities in the tax-consolidated group, amounts are recognised as
payable to or receivable by the company and each member of the group in relation to the tax contribution amounts paid or payable
between the parent entity and the other members of the tax-consolidated group in accordance with the arrangement. Where the tax
contribution amount recognised by each member of the tax-consolidated group for a particular period is different to the aggregate of the
current tax liability or asset and any deferred tax asset arising from unused tax losses and tax credits in respect of that period, the
difference is recognised as a contribution from (or distribution to) equity participants.
(j) INTANGIBLE ASSETS
Trade names
Trade names are recorded at cost less accumulated amortisation and impairment. Amortisation is charged on a straight line basis over
their estimated useful lives of 100 years. The estimated useful life and amortisation method is reviewed at the end of each annual
reporting period.
Reacquired rights
Reacquired rights are recorded at fair value at acquisition date less accumulated amortisation and impairment. Reacquired rights are
recognised when franchise operations are acquired by the Consolidated Entity as required under AASB 3 Business Combinations and
AASB 138 Intangible Assets, and are amortised over the remaining life of the right concerned or the useful economic life of the asset
where the reacquired right is indefinite.
Intangible assets acquired in a business combination
All potential intangible assets including software and reacquired rights, acquired in a business combination are identified and recognised
separately from goodwill where they satisfy the definition of an intangible asset and their fair value can be measured reliably.
Web site development costs
Development expenditure incurred is recognised when it is possible that future economic benefits that are attributable to the asset will
flow to the entity.
Following initial recognition of the development expenditure, the cost model is applied requiring the asset to be carried at cost less any
accumulated amortisation and accumulated impairment losses.
Any expenditure carried forward is amortised on a straight line basis over the estimated useful life of 10 years.
Goodwill
Goodwill arising in a business combination is recognised as an asset at the date that control is acquired (the acquisition date). Goodwill
is measured as the excess of the sum of the consideration transferred, the amount of any non-controlling interests in the acquiree, and
the fair value of the acquirer’s previously held equity interest in the acquiree (if any) over the net of the acquisition-date amounts of the
identifiable assets acquired and the liabilities assumed.
If, after reassessment, the consolidated entity’s interest in the fair value of the acquiree’s identifiable net assets exceeds the sum of the
consideration transferred, the amount of any non-controlling interests in the acquiree and the fair value of the acquirer’s previously held
equity interest in the acquiree (if any), the excess is recognised immediately in profit or loss as a bargain purchase gain.
For
per
sona
l use
onl
y
N o t e s t o t h e C o n s o l i d a t e d F i n a n c i a l S t a t e m e n t s
38
1. SUMMARY OF ACCOUNTING POLICIES (continued)
(j) INTANGIBLE ASSETS (continued)
Goodwill (continued)
Goodwill is not amortised but is reviewed for impairment at least annually. For the purpose of impairment testing, goodwill is allocated
to each of the Group’s cash-generating units expected to benefit from the synergies of the combination. Cash-generating units to which
goodwill has been allocated are tested for impairment annually, or more frequently when there is an indication that the unit may be
impaired. If the recoverable amount of the cash-generating unit is less than its carrying amount, the impairment loss is allocated first to
reduce the carrying amount of any goodwill allocated to the unit and then to the other assets of the unit pro-rata on the basis of the
carrying amount of each asset in the unit. An impairment loss recognised for goodwill is not reversed in a subsequent period.
On disposal of a subsidiary, the attributable amount of goodwill is included in the determination of the profit or loss on disposal.
(k) INVENTORIES
Inventories are valued at the lower of cost and net realisable value. Costs, including purchase cost on a first in first out basis are assigned
to inventory on hand by the method most appropriate to each particular class of inventory, with the majority being valued on a first in
first out basis. Net realisable value represents the estimated selling price less all estimated costs of completion and costs necessary to
make the sale.
(l) LEASED ASSETS
Leases are classified as finance leases whenever the terms of the lease transfer substantially all the risks and rewards of ownership to
the lessee. All other leases are classified as operating leases.
Consolidated entity as lessee
Assets held under finance leases are initially recognised at their fair value or, if lower, at amounts equal to the present value of the
minimum lease payments, each determined at the inception of the lease. The corresponding liability to the lessor is included in the
balance sheet as a finance lease obligation.
Lease payments are apportioned between finance charges and reduction of the lease obligation so as to achieve a constant rate of
interest on the remaining balance of the liability. Finance charges are charged directly against income.
Finance leased assets are amortised on a straight line basis over the estimated useful life of the asset.
Operating lease payments are recognised as an expense on a straight-line basis over the lease term, except where another systematic
basis is more representative of the time pattern in which economic benefits from the leased asset are consumed.
(m) PAYABLES
Trade payables and other accounts payable are recognised when the consolidated entity becomes obliged to make future payments
resulting from the purchase of goods and services.
(n) PRINCIPLES OF CONSOLIDATION
The consolidated financial statements incorporate the financial statements of the Company and entities (including special purpose
entities) controlled by the Company (its subsidiaries). Control is achieved where the Company has the power to govern the financial and
operating policies of an entity so as to obtain benefits from its activities.
The results of subsidiaries acquired or disposed of during the year are included in the consolidated statement of comprehensive income
from the effective date of acquisition and up to the effective date of disposal, as appropriate.
Where necessary, adjustments are made to the financial statements of subsidiaries to bring their accounting policies into line with those
used by other members of the Consolidated Entity. All intra-group transactions, balances, income and expenses are eliminated in full on
consolidation.
Non-controlling interests in subsidiaries are identified separately from the consolidated entity’s equity therein. The interests of non-
controlling shareholders may be initially measured either at fair value or at the non-controlling interests’ proportionate share of the fair
value of the acquiree’s identifiable net assets. The choice of measurement basis is made on an acquisition-by-acquisition basis.
Subsequent to acquisition, the carrying amount of non-controlling interests is the amount of those interests at initial recognition plus the
non-controlling interests’ share of subsequent changes in equity. Total comprehensive income is attributed to non-controlling interests
even if this results in the non-controlling interests having a deficit balance. Changes in the consolidated entity’s interests in subsidiaries
that do not result in a loss of control are accounted for as equity transactions. The carrying amounts of the consolidated entity’s interests
For
per
sona
l use
onl
y
N o t e s t o t h e C o n s o l i d a t e d F i n a n c i a l S t a t e m e n t s
39
and the non-controlling interests are adjusted to reflect the changes in their relative interests in the subsidiaries. Any difference between
the amount by which the non-controlling interests are adjusted and the fair value of the consideration paid or received is recognised
directly in equity and attributed to owners of the Company.
When the consolidated entity loses control of a subsidiary, the profit or loss on disposal is calculated as the difference between (i) the
aggregate of the fair value of the consideration received and the fair value of any retained interest and (ii) the previous carrying amount
of the assets (including goodwill), and liabilities of the subsidiary and any non-controlling interests. Amounts previously recognised in
other comprehensive income in relation to the subsidiary are accounted for (i.e. reclassified to profit or loss or transferred directly to
retained earnings) in the same manner as would be required if the relevant assets or liabilities were disposed of. The fair value of any
investment retained in the former subsidiary at the date when control is lost is regarded as the fair value on initial recognition for
subsequent accounting under AASB 139 Financial Instruments: Recognition and Measurement or, when applicable, the cost on initial
recognition of an investment in an associate or jointly controlled entity.
(o) PLANT AND EQUIPMENT
Plant and equipment, leasehold improvements and equipment under finance lease are stated at cost less accumulated depreciation and
impairment. Cost includes expenditure that is directly attributable to the acquisition of the item. In the event that settlement of all or part
of the purchase consideration is deferred, cost is determined by discounting the amounts payable in the future to their present value as
at the date of acquisition.
Depreciation is provided on plant and equipment. Depreciation is calculated on a straight line basis so as to write off the net cost or other
re-valued amount of each asset over its expected useful life to its estimated residual value. Leasehold improvements are depreciated
over the period of the lease or estimated useful life, whichever is the shorter, using the straight line method. The estimated useful lives,
residual values and depreciation method are reviewed at the end of each annual reporting period. The following estimated useful lives
are used in the calculation of depreciation:
Leasehold improvements 8 years
Plant and equipment 5 years
Equipment under finance lease 5 years
Fixtures & fittings 8 years
(p) PROVISIONS
Provisions are recognised when the consolidated entity has a present obligation, the future sacrifice of economic benefits is probable,
and the amount of the provision can be measured reliably.
The amount recognised as a provision is the best estimate of the consideration required to settle the present obligation at reporting date,
taking into account the risks and uncertainties surrounding the obligation. Where a provision is measured using the cashflows estimated
to settle the present obligation, its carrying amount is the present value of those cashflows.
When some or all of the economic benefits required to settle a provision are expected to be recovered from a third party, the receivable
is recognised as an asset if it is virtually certain that recovery will be received and the amount of the receivable can be measured reliably.
(q) REVENUE RECOGNITION
Income from franchisees is recognised as follows:
Franchise sales/renewals
Fees in respect of the initial sale of a franchise licence and fees from the renewal of a franchise licence are recognised on an accruals
basis. Income is recognised in full upon the sale’s completion or upon the renewal of the licence as all material services and/or conditions
relating to the sale or renewal have been fully performed or satisfied by the economic entity.
Continuing franchise fees/levies
Continuing franchise fees/levies in respect of particular services, are recognised as income when they become due and receivable and
the costs in relation to the income are recognised as expenses when incurred.
Instalment credit loan interest
Interest received from franchisees in respect of instalment credit loans is recognised as income when earned. The effective interest rate
method has been used to allocate fixed interest to accounting periods.
For
per
sona
l use
onl
y
N o t e s t o t h e C o n s o l i d a t e d F i n a n c i a l S t a t e m e n t s
40
1. SUMMARY OF ACCOUNTING POLICIES (continued)
(q) REVENUE RECOGNITION (continued)
Personal loan interest
Interest revenue in relation to personal loans is accrued on a time basis by reference to the principal outstanding and at the effective
interest rate applicable, which is the rate that exactly discounts estimated future cash receipts through the expected life of the financial
asset to that asset net carrying amount.
Loan establishment fee revenue
Establishment fees are deferred and recognised over the life of the loans at the effective interest rate applicable so as to recognise
revenue at a constant rate to the underlying principal over the expected life of the loan.
Other categories of revenue
Other categories of revenue, such as retail wholesale sales, corporate store revenue, cheque cashing commission and financial services
commission, are recognised when the consolidated entity has transferred the risks and rewards of the goods to the buyer or when the
services are provided. Bank interest and rent are recognised as earned on an accruals basis.
(r) SHARE-BASED PAYMENTS
The consolidated entity provides benefits to executives of the consolidated entity in the form of share-based payment transactions,
whereby key management personnel render services in exchange for options (equity-based transactions).
The current plan to provide these benefits is the Executive Performance Rights Plan. The cost of the equity-settled transactions with
employees is measured by reference to the fair value of the equity instruments at the date at which they are granted. The fair value is
determined by using an appropriate valuation methodology.
The cost of equity-based transactions is recognised, together with a corresponding increase in equity, over the period in which the
performance and/or service conditions are fulfilled (the vesting period), ending on the date on which the relevant employees become fully
entitled to the award (vesting date).
At each subsequent reporting date until vesting, the cumulative charge to the statement of comprehensive income is the product of:
� The grant date fair value of the award.
� The current best estimate of the number of the awards that will vest, taking into account such factors as the likelihood of non-market
performance conditions being met.
� The expired portion of the vesting period.
No expense is recognised for awards that do not ultimately vest, except for awards where vesting is conditional upon a market condition.
Where the terms of an equity-settled award are modified, as a minimum, an expense is recognised as if the terms had not been modified.
In addition, an expense is recognised for any increase in the value of the transaction as a result of the modification, as measured at the
date of modification.
The dilutive effect, if any, of outstanding options is reflected as additional share dilution in the computation of earnings per share.
(s) BUSINESS COMBINATIONS
Subsequent to 1 July 2009
Acquisitions of subsidiaries and businesses are accounted for using the acquisition method. The consideration for each acquisition is
measured at the aggregate of the fair values (at the date of exchange) of assets given, liabilities incurred or assumed, and equity
instruments issued by the consolidated entity in exchange for control of the acquiree. Acquisition-related costs are recognised in profit
or loss as incurred.
Where applicable, the consideration for the acquisition includes any asset or liability resulting from a contingent consideration
arrangement, measured at its acquisition-date fair value. Subsequent changes in such fair values are adjusted against the cost of
acquisition where they qualify as measurement period adjustments (refer below). All other subsequent changes in the fair value of
contingent consideration classified as an asset or liability are accounted for in accordance with relevant Standards. Changes in the fair
value of contingent consideration classified as equity are not recognised.
Where a business combination is achieved in stages, the consolidated entity’s previously held interests in the acquired entity are
remeasured to fair value at the acquisition date (i.e. the date the consolidated entity attains control) and the resulting gain or loss, if any,
is recognised in profit or loss. Amounts arising from interests in the acquiree prior to the acquisition date that have previously been
For
per
sona
l use
onl
y
N o t e s t o t h e C o n s o l i d a t e d F i n a n c i a l S t a t e m e n t s
41
recognised in other comprehensive income are reclassified to profit or loss, where such treatment would be appropriate if that interest
were disposed of.
The acquiree’s identifiable assets, liabilities and contingent liabilities that meet the conditions for recognition under AASB 3(2008) are
recognised at their fair value at the acquisition date, except that:
� deferred tax assets or liabilities and liabilities or assets related to employee benefit arrangements are recognised and measured in
accordance with AASB 112 Income Taxes and AASB 119 Employee Benefits respectively;
� liabilities or equity instruments related to the replacement by the consolidated entity of an acquiree’s share-based payment awards
are measured in accordance with AASB 2 Share-based Payment; and
� assets (or disposal groups) that are classified as held for sale in accordance with AASB 5 Non-current Assets Held for Sale and
Discontinued Operations are measured in accordance with that Standard.
If the initial accounting for a business combination is incomplete by the end of the reporting period in which the combination occurs, the
consolidated entity reports provisional amounts for the items for which the accounting is incomplete. Those provisional amounts are
adjusted during the measurement period (see below), or additional assets or liabilities are recognised, to reflect new information obtained
about facts and circumstances that existed as of the acquisition date that, if known, would have affected the amounts recognised as of
that date. The measurement period is the period from the date of acquisition to the date the consolidated entity obtains complete
information about facts and circumstances that existed as of the acquisition date – and is subject to a maximum of one year.
Standards and Interpretations in issue not yet adopted
At the date of authorisation of the financial report, a number of Standards and Interpretations including those Standards and
Interpretations issued by the IASB/IFRIC where an Australian equivalent has not been made by the AASB, were in issue but not yet
effective.
Management is currently evaluating the impact that the initial application of the following Standards and Interpretations will have on the
financial report of the consolidated entity:
Effective for annual Expected to be initiallyreporting periods applied in the
Standard beginning on or after financial year ending
AASB 124 ‘Related Party Disclosures’ (revised December 2009), 1 January 2011 30 June 2012
AASB 2009-12 ‘Amendments to Australian Accounting Standards’
AASB 9 ‘Financial Instruments’, AASB 2009-11
‘Amendments to Australian Accounting Standards arising from AASB 9’ 1 January 2013 30 June 2014
and AASB 2010-7 ‘Amendments to Australian Accounting Standards
arising from AASB 9 (December 2010)’
AASB 2010-5 ‘Amendments to Australian Accounting Standards’ 1 January 2011 30 June 2012
AASB 2010-8 ‘Amendments to Australian Accounting Standards 1 January 2012 30 June 2013
– Deferred Tax: Recovery of Underlying Assets’
AASB 10 ‘Consolidated Financial Statements’, 1 January 2013 30 June 2014
AASB 11 'Joint Arrangements' , AASB 12 'Disclosure of Interests
in Other Entities', AASB 127 'Separate Financial Statements'(2011),
AASB 128 'Investments in Associates and Joint Ventures' (2011),
and AASB 2011-7 ‘Amendments to Australian Accounting Standards
arising from the Consolidation and Joint Arrangements Standards’.
AASB 13 ‘Fair Value Measurements’, AASB 119 ‘Employee Benefits’ (2011)
and AASB 2011-9 ‘Amendments to Presentation of Items of
Other Comprehensive Income’.For
per
sona
l use
onl
y
N o t e s t o t h e C o n s o l i d a t e d F i n a n c i a l S t a t e m e n t s
42
2. PROFIT FROM OPERATIONS
(a) REVENUE AND OTHER INCOME
2011 2010$ $
Revenue from continuing operations consisted of the following items:
Revenue
Weekly franchise fees 7,439,063 7,429,347
Initial fees 356,692 555,421
Ten-year renewals 8,273 285,818
Advertising levies 423,950 416,600
Instalment credit loan interest 186,994 273,599
Personal loan interest 29,076,102 16,856,456
Loan establishment fees 12,061,881 7,017,713
Retail wholesale sales 4,794,522 5,222,620
Cheque cashing commission 622,771 689,575
Training levies 819,373 870,294
Corporate store revenue 100,877,291 62,534,745
Computer levy 2,226,376 1,682,092
Financial services commission and brokerage 25,673,961 20,829,872
Rent received 21,510 57,151
Interest revenue 1,487,523 1,349,125
186,076,282 126,070,428
Other income
Gain in relation to reduction in contingent consideration(i) 1,173,933 -
Other 307,924 555,933
1,481,857 555,933
(i) Reduction in contingent consideration associated with earn-out payments made during the year. Please refer note 28 for further
information.
(b) PROFIT BEFORE INCOME TAX
Profit before income tax has been arrived at after charging the following expenses:
Changes in inventories 45,519,026 30,517,836
Area agents fees / commissions 7,291,192 7,545,069
Depreciation of plant and equipment 2,006,222 1,198,110
Amortisation of intangibles 1,015,762 374,855
Rental expense on operating leases 7,957,428 4,742,358
Finance costs
Interest 914,369 893,370
Finance lease charges 81,613 106,955
Total finance costs 995,982 1,000,325
Provision for employee benefits 697,375 366,863
Employee superannuation 2,816,124 1,874,246
Share-based payments – employee 706,776 -
Trade debtors/instalment loans and personal loans
- Bad debt expense (Refer noted 6) 17,475,086 10,815,370
- Bad debts recovered (2,063,767) (1,161,417)
15,411,319 9,653,953
Profit before income tax has been arrived at after crediting/(charging)
the following gains and losses from continuing operations:
Loss on disposal of plant and equipment 66,528 7,048
For
per
sona
l use
onl
y
N o t e s t o t h e C o n s o l i d a t e d F i n a n c i a l S t a t e m e n t s
43
3. INCOME TAX EXPENSE
(a) INCOME TAX RECOGNISED IN PROFIT OR LOSS
2011 2010$ $
Tax expense comprises:
Current tax expense 11,927,760 10,272,741
Adjustment recognised in the current year in relation to the current tax of prior years (436,737) 143,406
Deferred tax expense relating to the origination and reversal of temporary differences 87,103 (879,733)
Total tax expense 11,578,126 9,536,414
Attributable to:
Continuing operations 11,578,126 9,536,414
The prima facie income tax expense on pre-tax accounting profit from operations
reconciles to the income tax expense in the financial statements as follows:
Profit from continuing operations 39,213,055 31,212,577
Income tax expense calculated at 30% 11,763,917 9,363,773
Non-deductible expenses 109,185 91,460
Prior year adjustments (436,737) 143,406
Unused tax losses and tax offsets not recognised as deferred tax assets - (15,355)
Utilisation of prior year tax losses not previously recognised as deferred tax assets - -
Other 141,761 (46,870)
11,578,126 9,536,414
(b) CURRENT TAX LIABILITIES
Income tax payable attributable to:
Entities in the Australian tax-consolidated group 6,923,280 4,967,482
Overseas subsidiaries (208,900) 437,437
6,714,380 5,404,919
(c) DEFERRED TAX BALANCES
Deferred tax assets comprise:
Provisions 3,724,808 1,975,654
Deferred income 702,974 533,912
Other 160,849 268,237
4,588,631 2,777,803
Deferred tax liabilities comprise:
Plant and equipment 249,145 174,629
Intangible assets 2,913,787 1,071,461
Other 121,084 42,269
3,284,016 1,288,539
(d) INCOME TAX RECOGNISED DIRECTLY IN EQUITY
The following deferred amounts were credited directly to equity during the period:
Deferred tax
Share issue expenses deductible over 5 years - 12,240
(e) UNRECOGNISED DEFERRED TAX BALANCES
The following deferred tax assets have not been brought to account as assets:
Tax losses – revenue 166,511 151,220
Tax losses – capital 2,721,601 2,721,600
2,888,112 2,872,820
For
per
sona
l use
onl
y
N o t e s t o t h e C o n s o l i d a t e d F i n a n c i a l S t a t e m e n t s
44
3. INCOME TAX EXPENSE (continued)
(f) TAX CONSOLIDATION
Relevance of tax consolidation to the consolidated entity
The company and its wholly-owned Australian resident entities have formed a tax-consolidated group with effect from 1 July 2003 and
are therefore taxed as a single entity from that date. The head entity within the tax-consolidated group is Cash Converters International
Limited. The members of the tax-consolidated group are identified in note 22.
Nature of tax funding arrangements and tax sharing agreements
Entities within the tax-consolidated group have entered into a tax funding arrangement and a tax-sharing agreement with the head entity.
Under the terms of the tax funding arrangement, Cash Converters International Limited and each of the entities in the tax-consolidated
group has agreed to pay a tax equivalent payment to or from the head entity, based on the current tax liability or current tax asset of the
entity. Such amounts are reflected in amounts receivable from or payable to other entities in the tax-consolidated group.
The tax sharing agreement entered into between members of the tax-consolidated group provides for the determination of the allocation
of income tax liabilities between the entities should the head entity default on its tax payment obligations. No amounts have been
recognized in the financial statements in respect of this agreement as payment of any amounts under the tax sharing agreement is
considered remote.
Amendments to tax consolidation
The Australian Tax Laws Amendments (2010 Measures No.1) Act 2010 was substantively enacted on 12 May 2010. The Act introduced
a 'rights to future income' amendment which may provide a revenue deduction for certain types of rights acquired in a business
combination. This mandatory change retrospectively increases allowable deductions for certain acquired rights and similar arrangements
in business combinations occurring since the formation of the Australian tax-consolidated group (1 July 2003).
The consolidated entity believes that a potential claim may exist for certain historical business combinations where the companies
became part of the tax consolidated group following 1 July 2003. The consolidated entity has established a project team to complete
the process to determine if any valid claims exist.
2011 2010$ $
4. REMUNERATION OF AUDITORS
Auditor of the parent entity
Audit or review of the financial report 430,812 348,629
Taxation services 474,022 95,498
Other non-audit services 123,939 188,769
Related practice of the parent entity auditor
Taxation services 34,537 13,847
Other non-audit services 8,343 -
1,071,653 646,743
The auditor of Cash Converters International Limited is Deloitte Touche Tohmatsu. The auditors remuneration for Cash Converters
International Limited is borne by Cash Converters Pty Ltd.
5. CASH AND CASH EQUIVALENTS
On hand 1,332,401 1,651,071
In bank 22,124,595 49,065,317
23,456,996 50,716,388For
per
sona
l use
onl
y
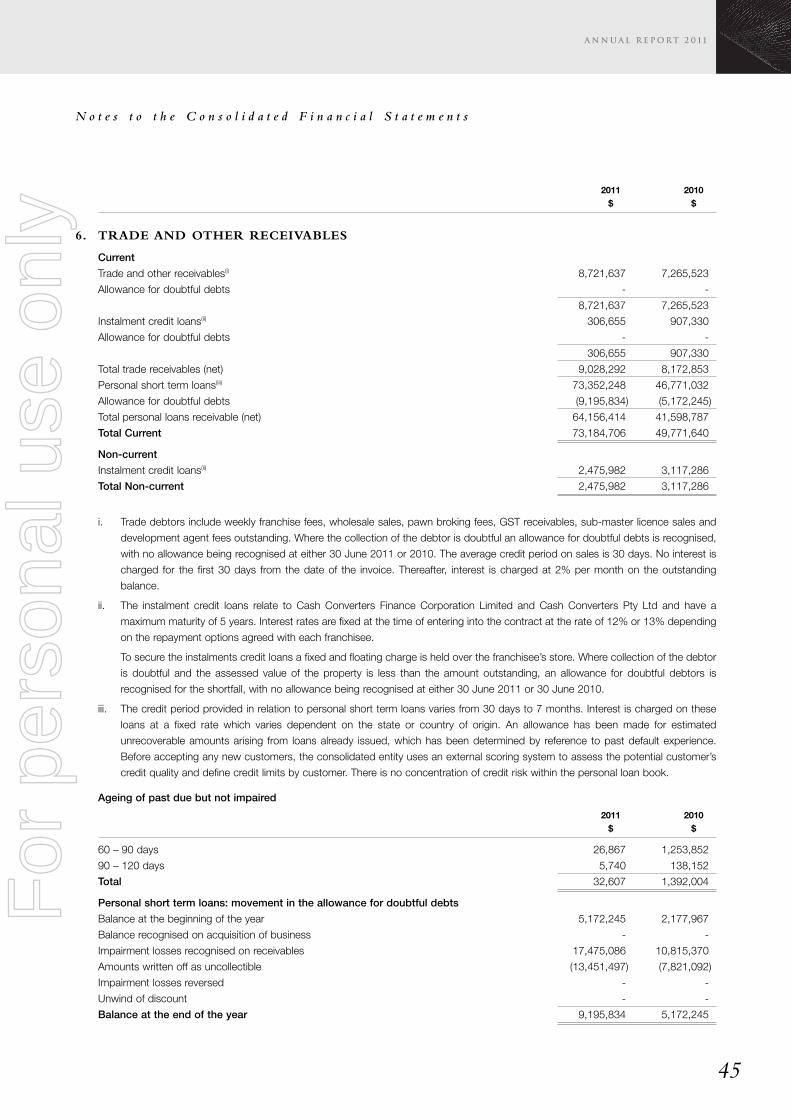
N o t e s t o t h e C o n s o l i d a t e d F i n a n c i a l S t a t e m e n t s
45
2011 2010$ $
6. TRADE AND OTHER RECEIVABLES
Current
Trade and other receivables(i) 8,721,637 7,265,523
Allowance for doubtful debts - -
8,721,637 7,265,523
Instalment credit loans(ii) 306,655 907,330
Allowance for doubtful debts - -
306,655 907,330
Total trade receivables (net) 9,028,292 8,172,853
Personal short term loans(iii) 73,352,248 46,771,032
Allowance for doubtful debts (9,195,834) (5,172,245)
Total personal loans receivable (net) 64,156,414 41,598,787
Total Current 73,184,706 49,771,640
Non-current
Instalment credit loans(ii) 2,475,982 3,117,286
Total Non-current 2,475,982 3,117,286
i. Trade debtors include weekly franchise fees, wholesale sales, pawn broking fees, GST receivables, sub-master licence sales and
development agent fees outstanding. Where the collection of the debtor is doubtful an allowance for doubtful debts is recognised,
with no allowance being recognised at either 30 June 2011 or 2010. The average credit period on sales is 30 days. No interest is
charged for the first 30 days from the date of the invoice. Thereafter, interest is charged at 2% per month on the outstanding
balance.
ii. The instalment credit loans relate to Cash Converters Finance Corporation Limited and Cash Converters Pty Ltd and have a
maximum maturity of 5 years. Interest rates are fixed at the time of entering into the contract at the rate of 12% or 13% depending
on the repayment options agreed with each franchisee.
To secure the instalments credit loans a fixed and floating charge is held over the franchisee’s store. Where collection of the debtor
is doubtful and the assessed value of the property is less than the amount outstanding, an allowance for doubtful debtors is
recognised for the shortfall, with no allowance being recognised at either 30 June 2011 or 30 June 2010.
iii. The credit period provided in relation to personal short term loans varies from 30 days to 7 months. Interest is charged on these
loans at a fixed rate which varies dependent on the state or country of origin. An allowance has been made for estimated
unrecoverable amounts arising from loans already issued, which has been determined by reference to past default experience.
Before accepting any new customers, the consolidated entity uses an external scoring system to assess the potential customer’s
credit quality and define credit limits by customer. There is no concentration of credit risk within the personal loan book.
Ageing of past due but not impaired
2011 2010$ $
60 – 90 days 26,867 1,253,852
90 – 120 days 5,740 138,152
Total 32,607 1,392,004
Personal short term loans: movement in the allowance for doubtful debts
Balance at the beginning of the year 5,172,245 2,177,967
Balance recognised on acquisition of business - -
Impairment losses recognised on receivables 17,475,086 10,815,370
Amounts written off as uncollectible (13,451,497) (7,821,092)
Impairment losses reversed - -
Unwind of discount - -
Balance at the end of the year 9,195,834 5,172,245
For
per
sona
l use
onl
y
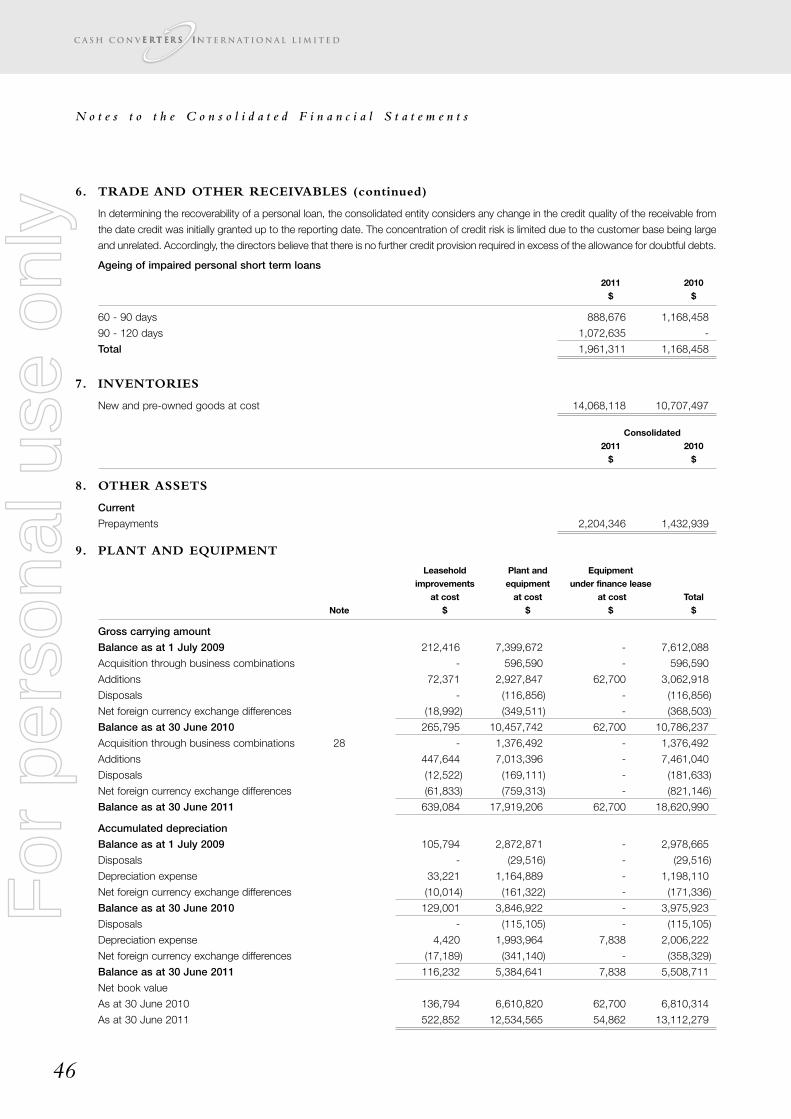
N o t e s t o t h e C o n s o l i d a t e d F i n a n c i a l S t a t e m e n t s
46
6. TRADE AND OTHER RECEIVABLES (continued)
In determining the recoverability of a personal loan, the consolidated entity considers any change in the credit quality of the receivable from
the date credit was initially granted up to the reporting date. The concentration of credit risk is limited due to the customer base being large
and unrelated. Accordingly, the directors believe that there is no further credit provision required in excess of the allowance for doubtful debts.
Ageing of impaired personal short term loans
2011 2010$ $
60 - 90 days 888,676 1,168,458
90 - 120 days 1,072,635 -
Total 1,961,311 1,168,458
7. INVENTORIES
New and pre-owned goods at cost 14,068,118 10,707,497
Consolidated2011 2010$ $
8. OTHER ASSETS
Current
Prepayments 2,204,346 1,432,939
9. PLANT AND EQUIPMENT
Leasehold Plant and Equipmentimprovements equipment under finance lease
at cost at cost at cost TotalNote $ $ $ $
Gross carrying amount
Balance as at 1 July 2009 212,416 7,399,672 - 7,612,088
Acquisition through business combinations - 596,590 - 596,590
Additions 72,371 2,927,847 62,700 3,062,918
Disposals - (116,856) - (116,856)
Net foreign currency exchange differences (18,992) (349,511) - (368,503)
Balance as at 30 June 2010 265,795 10,457,742 62,700 10,786,237
Acquisition through business combinations 28 - 1,376,492 - 1,376,492
Additions 447,644 7,013,396 - 7,461,040
Disposals (12,522) (169,111) - (181,633)
Net foreign currency exchange differences (61,833) (759,313) - (821,146)
Balance as at 30 June 2011 639,084 17,919,206 62,700 18,620,990
Accumulated depreciation
Balance as at 1 July 2009 105,794 2,872,871 - 2,978,665
Disposals - (29,516) - (29,516)
Depreciation expense 33,221 1,164,889 - 1,198,110
Net foreign currency exchange differences (10,014) (161,322) - (171,336)
Balance as at 30 June 2010 129,001 3,846,922 - 3,975,923
Disposals - (115,105) - (115,105)
Depreciation expense 4,420 1,993,964 7,838 2,006,222
Net foreign currency exchange differences (17,189) (341,140) - (358,329)
Balance as at 30 June 2011 116,232 5,384,641 7,838 5,508,711
Net book value
As at 30 June 2010 136,794 6,610,820 62,700 6,810,314
As at 30 June 2011 522,852 12,534,565 54,862 13,112,279
For
per
sona
l use
onl
y
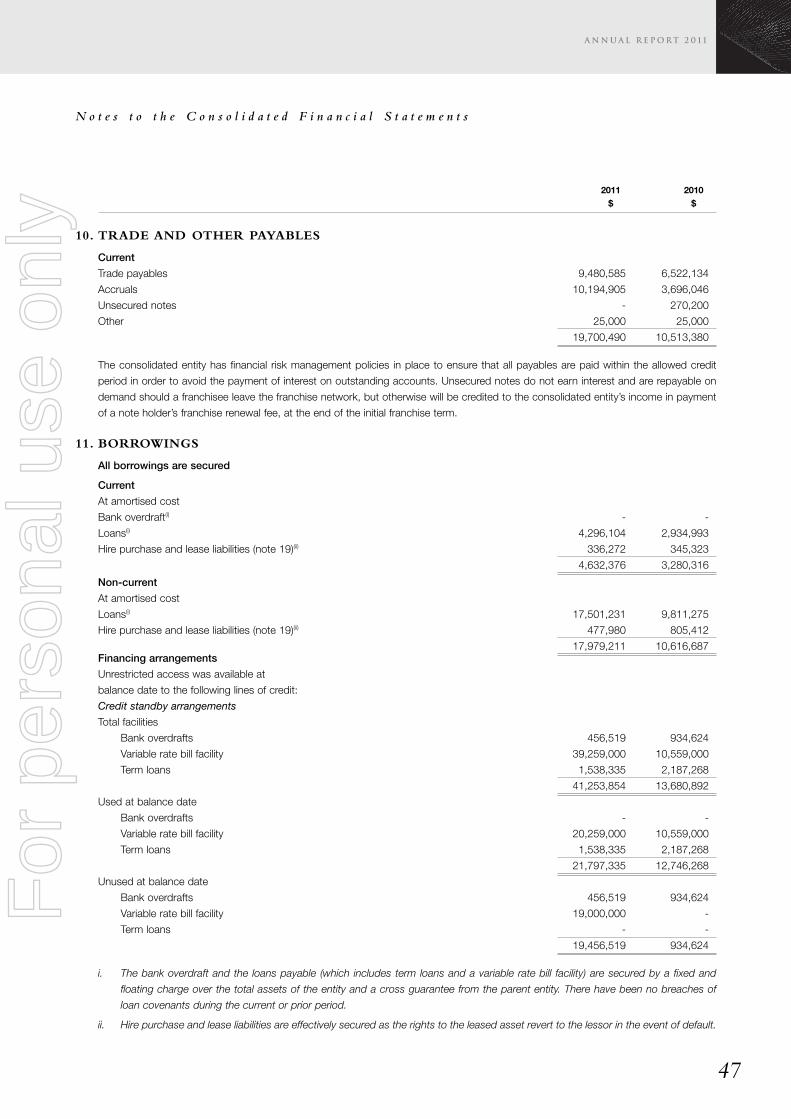
N o t e s t o t h e C o n s o l i d a t e d F i n a n c i a l S t a t e m e n t s
47
2011 2010$ $
10. TRADE AND OTHER PAYABLES
Current
Trade payables 9,480,585 6,522,134
Accruals 10,194,905 3,696,046
Unsecured notes - 270,200
Other 25,000 25,000
19,700,490 10,513,380
The consolidated entity has financial risk management policies in place to ensure that all payables are paid within the allowed credit
period in order to avoid the payment of interest on outstanding accounts. Unsecured notes do not earn interest and are repayable on
demand should a franchisee leave the franchise network, but otherwise will be credited to the consolidated entity’s income in payment
of a note holder’s franchise renewal fee, at the end of the initial franchise term.
11. BORROWINGS
All borrowings are secured
Current
At amortised cost
Bank overdraft(i) - -
Loans(i) 4,296,104 2,934,993
Hire purchase and lease liabilities (note 19)(ii) 336,272 345,323
4,632,376 3,280,316
Non-current
At amortised cost
Loans(i) 17,501,231 9,811,275
Hire purchase and lease liabilities (note 19)(ii) 477,980 805,412
17,979,211 10,616,687Financing arrangements
Unrestricted access was available at
balance date to the following lines of credit:
Credit standby arrangements
Total facilities
Bank overdrafts 456,519 934,624
Variable rate bill facility 39,259,000 10,559,000
Term loans 1,538,335 2,187,268
41,253,854 13,680,892
Used at balance date
Bank overdrafts - -
Variable rate bill facility 20,259,000 10,559,000
Term loans 1,538,335 2,187,268
21,797,335 12,746,268
Unused at balance date
Bank overdrafts 456,519 934,624
Variable rate bill facility 19,000,000 -
Term loans - -
19,456,519 934,624
i. The bank overdraft and the loans payable (which includes term loans and a variable rate bill facility) are secured by a fixed and
floating charge over the total assets of the entity and a cross guarantee from the parent entity. There have been no breaches of
loan covenants during the current or prior period.
ii. Hire purchase and lease liabilities are effectively secured as the rights to the leased asset revert to the lessor in the event of default.
For
per
sona
l use
onl
y
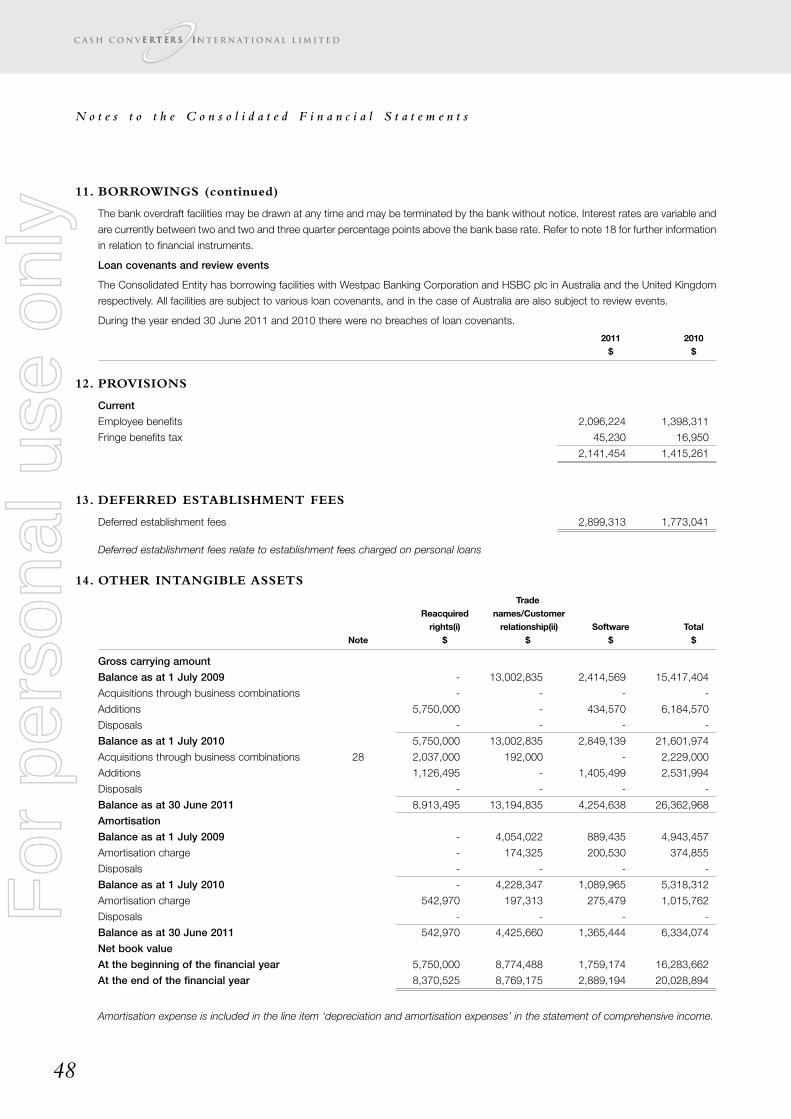
N o t e s t o t h e C o n s o l i d a t e d F i n a n c i a l S t a t e m e n t s
48
11. BORROWINGS (continued)
The bank overdraft facilities may be drawn at any time and may be terminated by the bank without notice. Interest rates are variable and
are currently between two and two and three quarter percentage points above the bank base rate. Refer to note 18 for further information
in relation to financial instruments.
Loan covenants and review events
The Consolidated Entity has borrowing facilities with Westpac Banking Corporation and HSBC plc in Australia and the United Kingdom
respectively. All facilities are subject to various loan covenants, and in the case of Australia are also subject to review events.
During the year ended 30 June 2011 and 2010 there were no breaches of loan covenants.
2011 2010$ $
12. PROVISIONS
Current
Employee benefits 2,096,224 1,398,311
Fringe benefits tax 45,230 16,950
2,141,454 1,415,261
13. DEFERRED ESTABLISHMENT FEES
Deferred establishment fees 2,899,313 1,773,041
Deferred establishment fees relate to establishment fees charged on personal loans
14. OTHER INTANGIBLE ASSETS
TradeReacquired names/Customerrights(i) relationship(ii) Software Total
Note $ $ $ $
Gross carrying amount
Balance as at 1 July 2009 - 13,002,835 2,414,569 15,417,404
Acquisitions through business combinations - - - -
Additions 5,750,000 - 434,570 6,184,570
Disposals - - - -
Balance as at 1 July 2010 5,750,000 13,002,835 2,849,139 21,601,974
Acquisitions through business combinations 28 2,037,000 192,000 - 2,229,000
Additions 1,126,495 - 1,405,499 2,531,994
Disposals - - - -
Balance as at 30 June 2011 8,913,495 13,194,835 4,254,638 26,362,968
Amortisation
Balance as at 1 July 2009 - 4,054,022 889,435 4,943,457
Amortisation charge - 174,325 200,530 374,855
Disposals - - - -
Balance as at 1 July 2010 - 4,228,347 1,089,965 5,318,312
Amortisation charge 542,970 197,313 275,479 1,015,762
Disposals - - - -
Balance as at 30 June 2011 542,970 4,425,660 1,365,444 6,334,074
Net book value
At the beginning of the financial year 5,750,000 8,774,488 1,759,174 16,283,662
At the end of the financial year 8,370,525 8,769,175 2,889,194 20,028,894
Amortisation expense is included in the line item ‘depreciation and amortisation expenses’ in the statement of comprehensive income.
For
per
sona
l use
onl
y
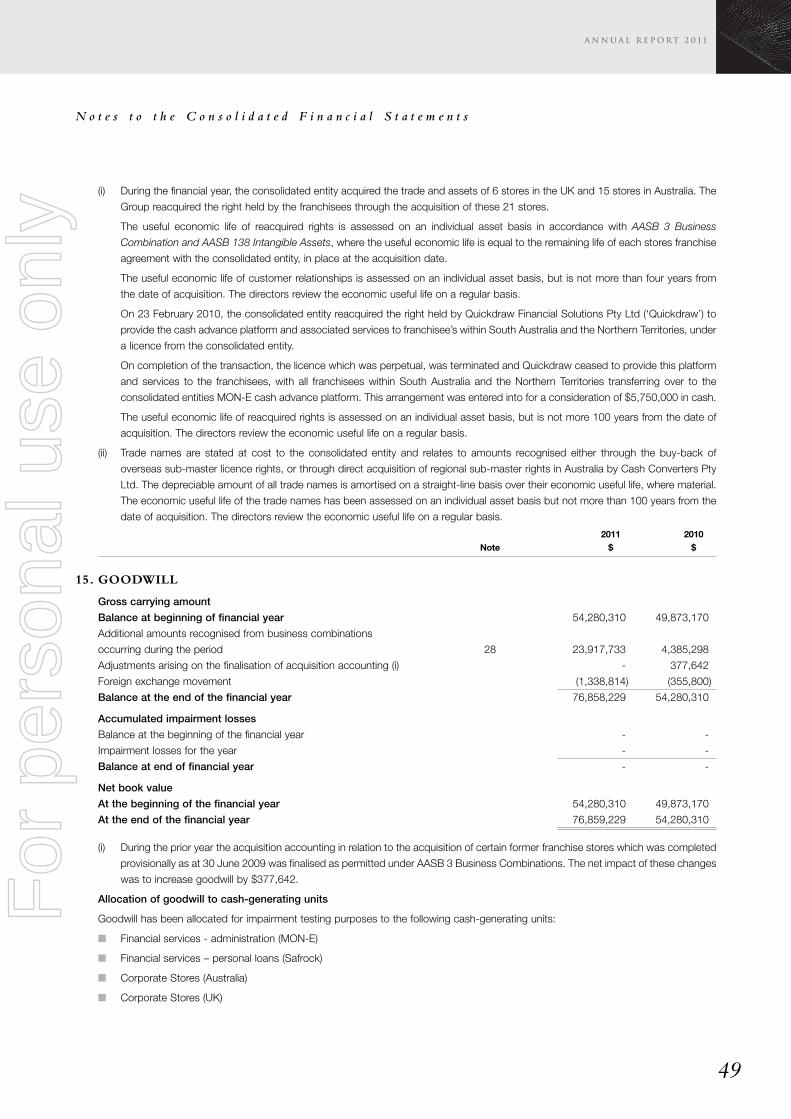
N o t e s t o t h e C o n s o l i d a t e d F i n a n c i a l S t a t e m e n t s
49
(i) During the financial year, the consolidated entity acquired the trade and assets of 6 stores in the UK and 15 stores in Australia. The
Group reacquired the right held by the franchisees through the acquisition of these 21 stores.
The useful economic life of reacquired rights is assessed on an individual asset basis in accordance with AASB 3 Business
Combination and AASB 138 Intangible Assets, where the useful economic life is equal to the remaining life of each stores franchise
agreement with the consolidated entity, in place at the acquisition date.
The useful economic life of customer relationships is assessed on an individual asset basis, but is not more than four years from
the date of acquisition. The directors review the economic useful life on a regular basis.
On 23 February 2010, the consolidated entity reacquired the right held by Quickdraw Financial Solutions Pty Ltd (‘Quickdraw’) to
provide the cash advance platform and associated services to franchisee’s within South Australia and the Northern Territories, under
a licence from the consolidated entity.
On completion of the transaction, the licence which was perpetual, was terminated and Quickdraw ceased to provide this platform
and services to the franchisees, with all franchisees within South Australia and the Northern Territories transferring over to the
consolidated entities MON-E cash advance platform. This arrangement was entered into for a consideration of $5,750,000 in cash.
The useful economic life of reacquired rights is assessed on an individual asset basis, but is not more 100 years from the date of
acquisition. The directors review the economic useful life on a regular basis.
(ii) Trade names are stated at cost to the consolidated entity and relates to amounts recognised either through the buy-back of
overseas sub-master licence rights, or through direct acquisition of regional sub-master rights in Australia by Cash Converters Pty
Ltd. The depreciable amount of all trade names is amortised on a straight-line basis over their economic useful life, where material.
The economic useful life of the trade names has been assessed on an individual asset basis but not more than 100 years from the
date of acquisition. The directors review the economic useful life on a regular basis.
2011 2010Note $ $
15. GOODWILL
Gross carrying amount
Balance at beginning of financial year 54,280,310 49,873,170
Additional amounts recognised from business combinations
occurring during the period 28 23,917,733 4,385,298
Adjustments arising on the finalisation of acquisition accounting (i) - 377,642
Foreign exchange movement (1,338,814) (355,800)
Balance at the end of the financial year 76,858,229 54,280,310
Accumulated impairment losses
Balance at the beginning of the financial year - -
Impairment losses for the year - -
Balance at end of financial year - -
Net book value
At the beginning of the financial year 54,280,310 49,873,170
At the end of the financial year 76,859,229 54,280,310
(i) During the prior year the acquisition accounting in relation to the acquisition of certain former franchise stores which was completed
provisionally as at 30 June 2009 was finalised as permitted under AASB 3 Business Combinations. The net impact of these changes
was to increase goodwill by $377,642.
Allocation of goodwill to cash-generating units
Goodwill has been allocated for impairment testing purposes to the following cash-generating units:
� Financial services - administration (MON-E)
� Financial services – personal loans (Safrock)
� Corporate Stores (Australia)
� Corporate Stores (UK)
For
per
sona
l use
onl
y
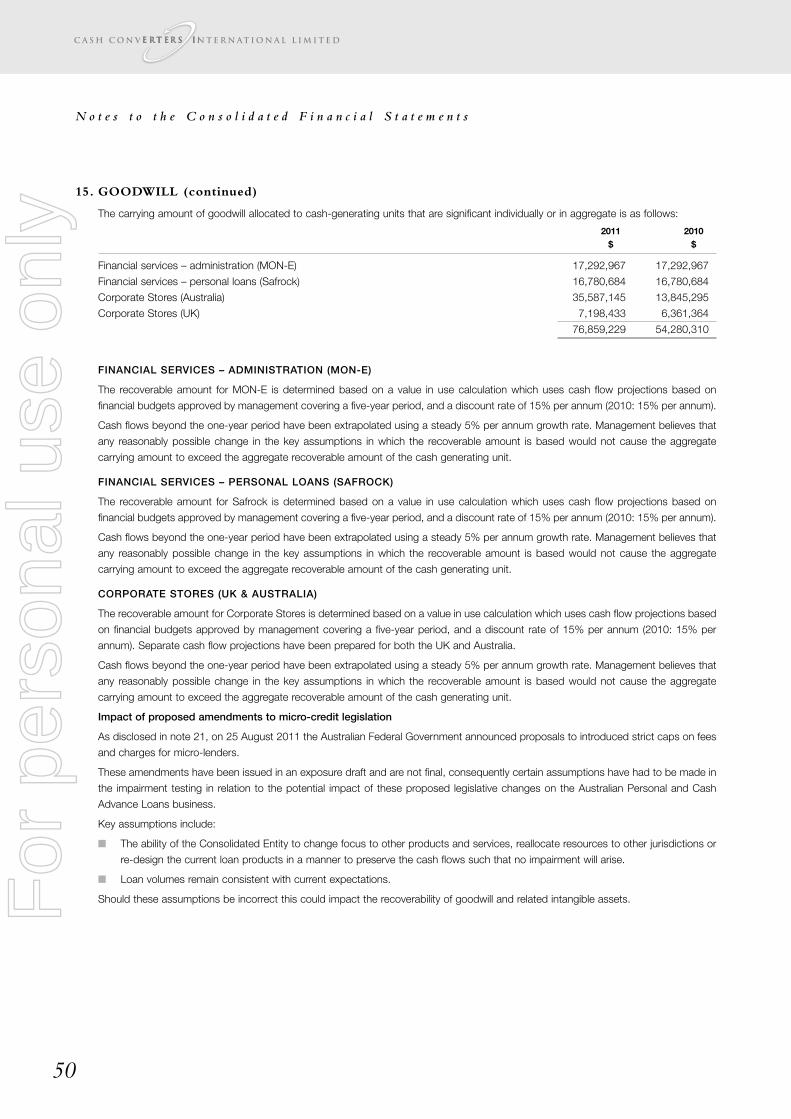
N o t e s t o t h e C o n s o l i d a t e d F i n a n c i a l S t a t e m e n t s
50
15. GOODWILL (continued)
The carrying amount of goodwill allocated to cash-generating units that are significant individually or in aggregate is as follows:
2011 2010$ $
Financial services – administration (MON-E) 17,292,967 17,292,967
Financial services – personal loans (Safrock) 16,780,684 16,780,684
Corporate Stores (Australia) 35,587,145 13,845,295
Corporate Stores (UK) 7,198,433 6,361,364
76,859,229 54,280,310
FINANCIAL SERVICES – ADMINISTRATION (MON-E)
The recoverable amount for MON-E is determined based on a value in use calculation which uses cash flow projections based on
financial budgets approved by management covering a five-year period, and a discount rate of 15% per annum (2010: 15% per annum).
Cash flows beyond the one-year period have been extrapolated using a steady 5% per annum growth rate. Management believes that
any reasonably possible change in the key assumptions in which the recoverable amount is based would not cause the aggregate
carrying amount to exceed the aggregate recoverable amount of the cash generating unit.
FINANCIAL SERVICES – PERSONAL LOANS (SAFROCK)
The recoverable amount for Safrock is determined based on a value in use calculation which uses cash flow projections based on
financial budgets approved by management covering a five-year period, and a discount rate of 15% per annum (2010: 15% per annum).
Cash flows beyond the one-year period have been extrapolated using a steady 5% per annum growth rate. Management believes that
any reasonably possible change in the key assumptions in which the recoverable amount is based would not cause the aggregate
carrying amount to exceed the aggregate recoverable amount of the cash generating unit.
CORPORATE STORES (UK & AUSTRALIA)
The recoverable amount for Corporate Stores is determined based on a value in use calculation which uses cash flow projections based
on financial budgets approved by management covering a five-year period, and a discount rate of 15% per annum (2010: 15% per
annum). Separate cash flow projections have been prepared for both the UK and Australia.
Cash flows beyond the one-year period have been extrapolated using a steady 5% per annum growth rate. Management believes that
any reasonably possible change in the key assumptions in which the recoverable amount is based would not cause the aggregate
carrying amount to exceed the aggregate recoverable amount of the cash generating unit.
Impact of proposed amendments to micro-credit legislation
As disclosed in note 21, on 25 August 2011 the Australian Federal Government announced proposals to introduced strict caps on fees
and charges for micro-lenders.
These amendments have been issued in an exposure draft and are not final, consequently certain assumptions have had to be made in
the impairment testing in relation to the potential impact of these proposed legislative changes on the Australian Personal and Cash
Advance Loans business.
Key assumptions include:
� The ability of the Consolidated Entity to change focus to other products and services, reallocate resources to other jurisdictions or
re-design the current loan products in a manner to preserve the cash flows such that no impairment will arise.
� Loan volumes remain consistent with current expectations.
Should these assumptions be incorrect this could impact the recoverability of goodwill and related intangible assets.For
per
sona
l use
onl
y
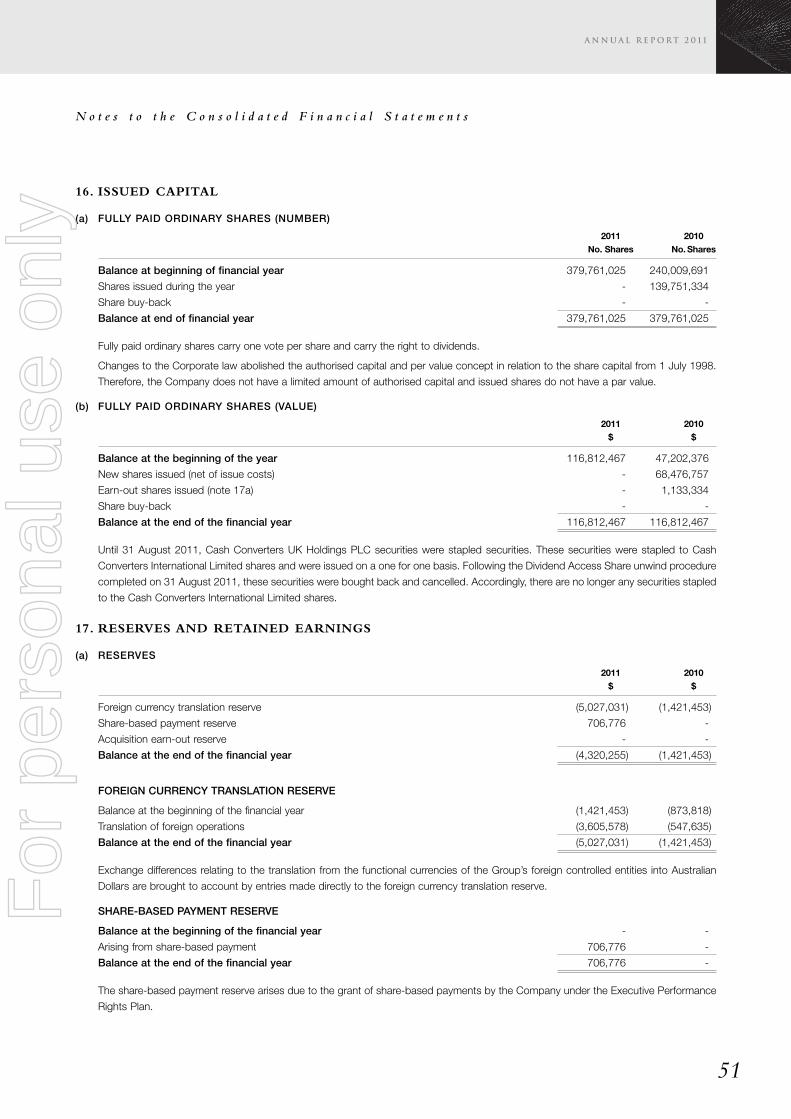
N o t e s t o t h e C o n s o l i d a t e d F i n a n c i a l S t a t e m e n t s
51
16. ISSUED CAPITAL
(a) FULLY PAID ORDINARY SHARES (NUMBER)
2011 2010No. Shares No.Shares
Balance at beginning of financial year 379,761,025 240,009,691
Shares issued during the year - 139,751,334
Share buy-back - -
Balance at end of financial year 379,761,025 379,761,025
Fully paid ordinary shares carry one vote per share and carry the right to dividends.
Changes to the Corporate law abolished the authorised capital and per value concept in relation to the share capital from 1 July 1998.
Therefore, the Company does not have a limited amount of authorised capital and issued shares do not have a par value.
(b) FULLY PAID ORDINARY SHARES (VALUE)
2011 2010$ $
Balance at the beginning of the year 116,812,467 47,202,376
New shares issued (net of issue costs) - 68,476,757
Earn-out shares issued (note 17a) - 1,133,334
Share buy-back - -
Balance at the end of the financial year 116,812,467 116,812,467
Until 31 August 2011, Cash Converters UK Holdings PLC securities were stapled securities. These securities were stapled to Cash
Converters International Limited shares and were issued on a one for one basis. Following the Dividend Access Share unwind procedure
completed on 31 August 2011, these securities were bought back and cancelled. Accordingly, there are no longer any securities stapled
to the Cash Converters International Limited shares.
17. RESERVES AND RETAINED EARNINGS
(a) RESERVES
2011 2010$ $
Foreign currency translation reserve (5,027,031) (1,421,453)
Share-based payment reserve 706,776 -
Acquisition earn-out reserve - -
Balance at the end of the financial year (4,320,255) (1,421,453)
FOREIGN CURRENCY TRANSLATION RESERVE
Balance at the beginning of the financial year (1,421,453) (873,818)
Translation of foreign operations (3,605,578) (547,635)
Balance at the end of the financial year (5,027,031) (1,421,453)
Exchange differences relating to the translation from the functional currencies of the Group’s foreign controlled entities into Australian
Dollars are brought to account by entries made directly to the foreign currency translation reserve.
SHARE-BASED PAYMENT RESERVE
Balance at the beginning of the financial year - -
Arising from share-based payment 706,776 -
Balance at the end of the financial year 706,776 -
The share-based payment reserve arises due to the grant of share-based payments by the Company under the Executive Performance
Rights Plan.
For
per
sona
l use
onl
y
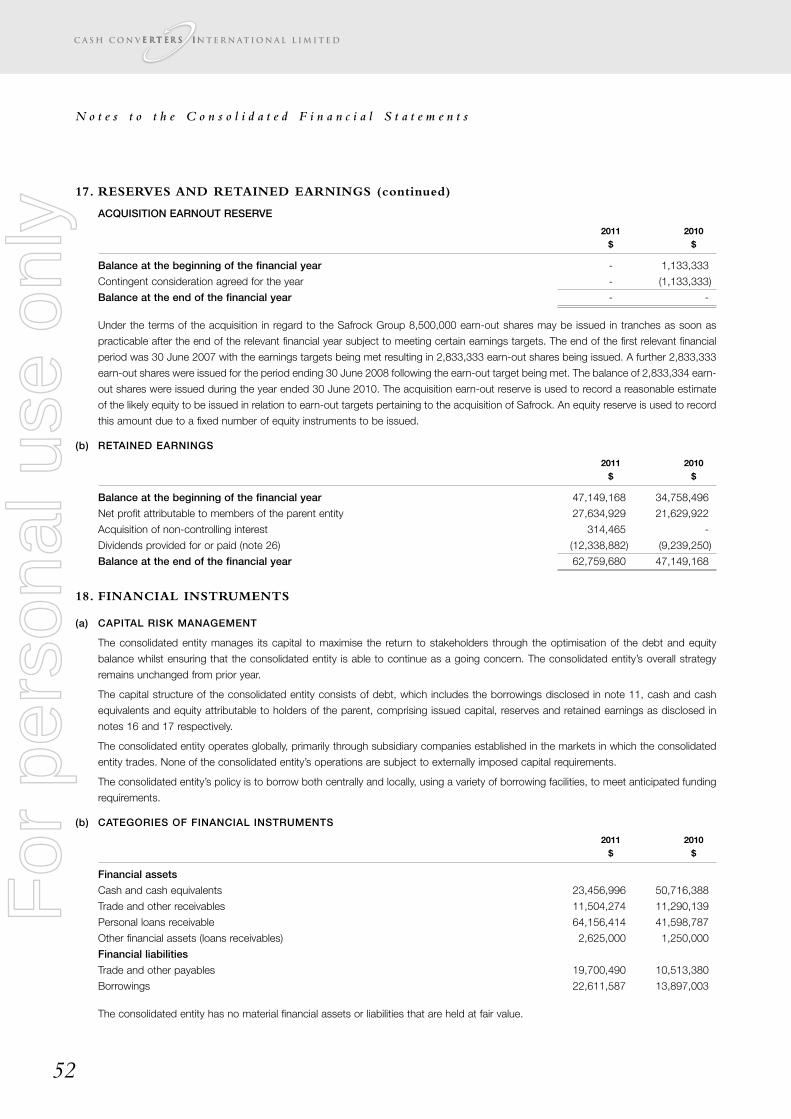
N o t e s t o t h e C o n s o l i d a t e d F i n a n c i a l S t a t e m e n t s
52
17. RESERVES AND RETAINED EARNINGS (continued)
ACQUISITION EARNOUT RESERVE
2011 2010$ $
Balance at the beginning of the financial year - 1,133,333
Contingent consideration agreed for the year - (1,133,333)
Balance at the end of the financial year - -
Under the terms of the acquisition in regard to the Safrock Group 8,500,000 earn-out shares may be issued in tranches as soon as
practicable after the end of the relevant financial year subject to meeting certain earnings targets. The end of the first relevant financial
period was 30 June 2007 with the earnings targets being met resulting in 2,833,333 earn-out shares being issued. A further 2,833,333
earn-out shares were issued for the period ending 30 June 2008 following the earn-out target being met. The balance of 2,833,334 earn-
out shares were issued during the year ended 30 June 2010. The acquisition earn-out reserve is used to record a reasonable estimate
of the likely equity to be issued in relation to earn-out targets pertaining to the acquisition of Safrock. An equity reserve is used to record
this amount due to a fixed number of equity instruments to be issued.
(b) RETAINED EARNINGS
2011 2010$ $
Balance at the beginning of the financial year 47,149,168 34,758,496
Net profit attributable to members of the parent entity 27,634,929 21,629,922
Acquisition of non-controlling interest 314,465 -
Dividends provided for or paid (note 26) (12,338,882) (9,239,250)
Balance at the end of the financial year 62,759,680 47,149,168
18. FINANCIAL INSTRUMENTS
(a) CAPITAL RISK MANAGEMENT
The consolidated entity manages its capital to maximise the return to stakeholders through the optimisation of the debt and equity
balance whilst ensuring that the consolidated entity is able to continue as a going concern. The consolidated entity’s overall strategy
remains unchanged from prior year.
The capital structure of the consolidated entity consists of debt, which includes the borrowings disclosed in note 11, cash and cash
equivalents and equity attributable to holders of the parent, comprising issued capital, reserves and retained earnings as disclosed in
notes 16 and 17 respectively.
The consolidated entity operates globally, primarily through subsidiary companies established in the markets in which the consolidated
entity trades. None of the consolidated entity’s operations are subject to externally imposed capital requirements.
The consolidated entity’s policy is to borrow both centrally and locally, using a variety of borrowing facilities, to meet anticipated funding
requirements.
(b) CATEGORIES OF FINANCIAL INSTRUMENTS
2011 2010$ $
Financial assets
Cash and cash equivalents 23,456,996 50,716,388
Trade and other receivables 11,504,274 11,290,139
Personal loans receivable 64,156,414 41,598,787
Other financial assets (loans receivables) 2,625,000 1,250,000
Financial liabilities
Trade and other payables 19,700,490 10,513,380
Borrowings 22,611,587 13,897,003
The consolidated entity has no material financial assets or liabilities that are held at fair value.
For
per
sona
l use
onl
y
N o t e s t o t h e C o n s o l i d a t e d F i n a n c i a l S t a t e m e n t s
53
(c) FINANCIAL RISK MANAGEMENT OBJECTIVES
The consolidated entity’s treasury function provides services to the business, co-ordinates access to domestic and international financial
markets, and manages the financial risks relating to the operations of the consolidated entity. The consolidated entity does not enter into
or trade financial instruments, including derivative financial instruments, for speculative purposes. The consolidated entity’s activities
expose it primarily to the financial risks of changes in foreign currency exchange rates and interest rates.
(d) MARKET RISK
The consolidated entity’s activities expose it primarily to the financial risks of changes in foreign currency exchange rates (refer note 18(e))
and interest rates (refer note 18(f)).
There has been no change to the consolidated entity’s exposure to market risks or the manner in which it manages and measures the
risk from the previous period.
(e) FOREIGN CURRENCY RISK MANAGEMENT
The consolidated entity undertakes certain transactions denominated in foreign currencies, hence exposures to exchange rate
fluctuations arise. Exchange rate exposures are relatively small and spot rates are normally used.
The carrying amount of the consolidated entity’s foreign currency denominated monetary assets and monetary liabilities at the reporting
date is as follows:
Liabilities Assets2011 2010 2011 2010$ $ $ $
United States Dollars 3,694 4,629 - -
Foreign currency sensitivity analysis
At 30 June 2011, if the Australian Dollar / Pound Sterling exchange rate had changed by +/- 5% from the actual rates observed during
the year, with all other variables held constant, post tax profit and equity for the year would have been $25,109 higher/lower (2010 -
$68,149 higher/lower).
(f) INTEREST RATE RISK MANAGEMENT
The company and the consolidated entity are exposed to interest rate risk as entities in the consolidated entity borrow funds at variable
rates and place funds on deposit at variable rates. Personal loans issues by the consolidated entity are at fixed rates. The risk is managed
by the Consolidated Entity by monitoring interest rates.
The company and the consolidated entity’s exposures to interest rates on financial assets and financial liabilities are detailed in the
liquidity risk management section of this note.
Interest rate sensitivity analysis
The sensitivity analyses below have been determined based on the exposure to interest rates at the reporting date and the stipulated
change taking place at the beginning of the financial year and held constant throughout the reporting period. A 200 basis point increase
or decrease is used because this represents management’s assessment of the possible change in interest rates.
At reporting date, if interest rates had been 200 basis points higher or lower and all other variables were held constant, the consolidated
entity’s:
� Net profit would increase/decrease by approximately $16,908 (2010: increase/decrease by approximately $736,000).
The Consolidated entity’s sensitivity to interest rates has decreased during the current period mainly due to additional borrowings.
For
per
sona
l use
onl
y
N o t e s t o t h e C o n s o l i d a t e d F i n a n c i a l S t a t e m e n t s
54
18. FINANCIAL INSTRUMENTS (continued)
(g) CREDIT RISK MANAGEMENT
Credit risk refers to the risk that a counter-party will default on its contractual obligations resulting in financial loss to the consolidated
entity. The consolidated entity has adopted the policy of only dealing with creditworthy counterparties and obtaining sufficient collateral
or other security where appropriate, as a means of mitigating the risk of financial loss from defaults. The consolidated entity measures
credit risk on a fair value basis. The consolidated entity does not have any significant credit risk exposure to any single counterparty or
any group of counterparties having similar characteristics, other than its franchisees. The consolidated entity has a policy of obtaining
sufficient collateral or other securities from these franchisees. The majority of loans within the financing division relate to loans made by
Safrock which makes both secured and unsecured personal loans. Credit risk is present in relation to all unsecured loans made which
is managed within an agreed corporate policy on customer acceptance and on-going review of recoverability.
(h) LIQUIDITY RISK MANAGEMENT
Ultimate responsibility for liquidity risk management rests with the board of directors, who have built an appropriate liquidity risk
management framework for the management of the consolidated entity’s short, medium and long-term funding and liquidity
management requirements. The consolidated entity manages liquidity risk by maintaining adequate cash reserves, banking facilities and
reserve borrowing facilities by continuously monitoring forecast and actual cash flows and matching maturity profiles of financial assets
and liabilities. Included in note 11 is a listing of additional undrawn facilities that the company/consolidated entity has at its disposal to
further reduce liquidity risk.
Liquidity and interest risk tables
The following table detail the consolidated entity’s remaining contractual maturity for its financial liabilities. The tables have been drawn
up based on the undiscounted cash flows of financial liabilities based on the earliest date on which the consolidated entity can be
required to pay. The table includes both interest and principal cash flows.
Weightedaverage effectiveinterest rate 1 year or less 1 to 5 years More than 5 years Total
% $ $ $ $
2011
Non-interest bearing - 19,700,490 - - 19,700,490
Finance lease liability 8.50 389,405 512,546 - 901,951
Variable interest rate instruments 5.60 5,641,847 21,316,112 - 26,957,959
25,731,742 21,828,658 - 47,560,400
2010
Non-interest bearing - 10,513,380 - - 10,513,380
Finance lease liability 8.50 419,100 900,363 - 1,319,463
Variable interest rate instruments 6.15 3,121,380 10,408,706 - 13,530,086
14,053,860 11,309,069 - 25,362,929
At the year-end it was not probable that the counterparty to the financial guarantee contract will claim under the contract. Consequently,
the amount included above is nil.
For
per
sona
l use
onl
y
N o t e s t o t h e C o n s o l i d a t e d F i n a n c i a l S t a t e m e n t s
55
The following table details the consolidated entity’s expected maturity for its financial assets. The tables below have been drawn up
based on the undiscounted contractual maturities of the financial assets including interest that will be earned on those assets except
where the company/consolidated entity anticipates that the cash flow will occur in a different period.
Weightedaverage effectiveinterest rate 1 year or less 1 to 5 years More than 5 years Total
% $ $ $ $
2011
Non-interest bearing - 8,721,637 - - 8,721,637
Finance lease receivables - - - - -
Variable interest rate instruments 4.05 24,407,004 - - 24,407,004
Fixed interest rate instruments 122.18 101,733,804 3,218,778 - 104,952,582
134,862,445 3,218,778 - 138,081,223
2010
Non-interest bearing - 7,265,523 - - 7,265,523
Finance lease receivables - - - - -
Variable interest rate instruments 5.09 53,295,763 - - 53,295,763
Fixed interest rate instruments 93.86 61,813,163 5,677,472 - 67,490,635
122,374,449 5,677,472 - 128,051,921
(i) FAIR VALUE OF FINANCIAL ASSETS AND LIABILITIES
The fair value of cash and cash equivalents and non-interest bearing monetary financial assets and financial liabilities of the consolidated
entity and company approximates the carrying value.
The fair value of the monetary financial assets and financial liabilities is based upon market prices where a market price exists or by
discounting the expected future cash flows by the current interest rates for assets and liabilities with similar risk profiles. The carrying
amounts and fair values of financial assets and liabilities at reporting date are:
2011 2010Carrying amount Fair value Carrying amount Fair value
$ $ $ $
Financial instruments
Unsecured notes - - 270,200 270,200
The consolidated entity has no material financial assets or liabilities that are held at fair value.
For
per
sona
l use
onl
y

N o t e s t o t h e C o n s o l i d a t e d F i n a n c i a l S t a t e m e n t s
56
19. LEASES
(a) FINANCE LEASES
Leasing arrangements
Finance leases relate to computer equipment and motor vehicles with lease terms of up to 5 years. The consolidated entity has options
to purchase the equipment for a nominal amount at the conclusion of the lease agreements.
Minimum future Present value of minimumlease payments future lease payments
2011 2010 2011 2010$ $ $ $
Finance lease and hire purchase expenditure
contracted for at balance sheet date, payable:
Within one year 389,405 419,100 336,270 345,323
Later than one,
not later than five years 512,546 900,363 477,980 805,412
901,951 1,319,463 814,250 1,150,735
Less future finance charges (87,701) (168,728) - -
814,250 1,150,735 814,250 1,150,735
Included in the financial statement as:
Current borrowings (note 11) 336,270 345,323
Non-current borrowings (note 11) 477,980 805,412
814,250 1,150,735
(b) OPERATING LEASES
Leasing arrangements
Operating leases relate to office accommodation and retail premises with lease terms of between 5 to 10 years, with an option to extend
for a further 5 years. All operating lease contracts contain market review clauses in the event that the consolidated entity exercises its
option to renew. The consolidated entity does not have an option to purchase the leased assets at the expiry of the lease period.
2011 2010$ $
Non-cancellable operating lease commitments payable:
Within one year 6,617,621 4,245,326
Later than one, not later than five years 16,167,028 11,605,638
Later than five years 5,755,537 3,234,230
28,540,186 19,085,194
Operating lease commitments relate to head office premises in Australia, the regional offices in the UK and around Australia and the
corporate stores in the UK and Australia. Cash Converters hold an option to renew on the Australian premises.
(c) COMMITMENT FOR CAPITAL EXPENDITURE
At 30 June 2011 capital expenditure commitments were $Nil (2010: $250,000).
For
per
sona
l use
onl
y

N o t e s t o t h e C o n s o l i d a t e d F i n a n c i a l S t a t e m e n t s
57
20. RELATED PARTY TRANSACTIONS
(a) KEY MANAGEMENT PERSONNEL REMUNERATION
Details of directors and other members of key management personnel of Cash Converters International Limited during the year are:
� R. Webb (Chairman, non-executive director)
� P. Cumins (Managing director, executive)
� J. Yeudall (Non-executive director)
� M. Cooke (Legal counsel)
� D. Patrick (Chief executive officer - UK)
� I. Day (General manager – Australia)
� R. Groom (Company secretary / chief financial officer)
� J. Spratley (Group accountant – UK, resigned on 8 September 2010)
� M. Osborne (Company secretary / chief financial officer – UK, appointed 23 August 2010)
� R. Pilgrim (Operations manager – UK)
The aggregate compensation of the key management personnel of the consolidated entity is set out below:
2011 2010$ $
Short-term employee benefits 3,272,766 2,238,620
Long-term employee benefits 19,965 43,797
Post-employee benefits 150,000 214,912
Share-based payment(i) 706,776 -
Total 4,149,507 2,497,329
(i) Please refer to note 31 for further information.
(b) DIRECTORS’ AND SPECIFIED KEY MANAGEMENT PERSONNEL EQUITY HOLDINGS
Fully paid ordinary shares issued by Cash Converters International Limited
Balance at Granted Received on Acquisition/ Balance at Balance1 July as exercise (disposal) 30 June held2010 remuneration of options of shares 2011 indirectlyNo. No. No. No. No. No.
Directors
P. Cumins 7,840,530 - - 185,500 8,026,030 -
R. Webb 1,112,500 - - - 1,112,500 -
J. Yeudall 295,668 - - - 295,668 -
W. Love - - - - - -
J. Beal - - - - - -
Other key management personnel
I. Day 3,659,260 - - 21,914 3,681,174 -
R. Groom 3,007,347 - - 66,437 3,073,784 -
J. Spratley - - - - - -
D. Patrick - - - - - -
M. Osborne - - - - -
M. Cooke 4,500,000 - - - 4,500,000 -
R. Pilgrim - - - - - -
20,415,305 - - 273,851 20,689,156 -
For
per
sona
l use
onl
y
N o t e s t o t h e C o n s o l i d a t e d F i n a n c i a l S t a t e m e n t s
58
20. RELATED PARTY TRANSACTIONS (continued)
Fully paid ordinary shares issued by Cash Converters International Limited
Balance at Granted Received on Acquisition/ Balance at Balance1 July as exercise (disposal) 30 June held2009 remuneration of options of shares 2010 indirectlyNo. No. No. No. No. No.
Directors
P. Cumins 7,707,830 - - 132,700 7,840,530 -
R. Webb 1,112,500 - - - 1,112,500 -
J. Yeudall 295,668 - - - 295,668 -
P. Cowan - - - - - -
W. Love - - - - - -
J. Beal - - - - - -
Other key management personnel
I. Day 3,949,260 - - (290,000) 3,659,260 -
R. Groom 2,644,618 - - 362,729 3,007,347 -
J. Spratley - - - - - -
D. Patrick - - - - - -
M. Cooke 5,815,000 - - (1,315,000) 4,500,000 -
R. Pilgrim - - - - - -
21,524,876 - - (1,109,571) 20,415,305 -
Performance rights/ share options of Cash Converters International Limited
Balance OptionsBalance Granted Balance vested at Vested Vested Vestedat 1 July as at 30 June 30 June but not and during2010 compensation Exercised 2011 2011 exercisable exercisable the yearNo. No. No. No. No. No. No. No.
Peter Cumins - 10,000,000 - 10,000,000 - - - -
No Performance Rights were in existence during the year ended 30 June 2010.
21. SUBSEQUENT EVENTS
Since the end of the financial year the directors are not aware of any matter or circumstance, other than those mentioned below, thathas significantly or may significantly affect the operations of the consolidated entity, the results of these operations or the state of affairsof the consolidated entity in subsequent financial years.
In July 2010 the Australian Federal Government released a Green Paper on phase two of the national consumer credit reforms. One ofthe proposals considered in the Green Paper included placing a national cap on interest rates that may be charged by payday lendersin Australia. As announced by Cash Converters to the ASX and LSE on 25 August 2011, the Australian Federal Government has nowreleased exposure drafts in relation to a proposed National Consumer Credit Protection Amendment (Enhancements) Bill 2011. Theexposure drafts contain proposed amendments to the National Consumer Credit Protection Act 2009 which contain suggested reformsto introduce a national cap on costs for ‘small amount’ contracts (defined as contracts with a credit limit of $2,000 for a term of lessthan two years). Under the proposed reforms it is intended that, from 1 July 2012, small amount credit lenders (often called paydaylenders or micro lenders) will be limited to charging a maximum establishment fee of 10% of the total amount borrowed and a maximummonthly fee of 2% of the total amount borrowed each month for the life of the loan.
Other key measures in the draft legislation include:
1. a prohibition on refinancing or increasing the credit limit of small amount contracts;
2. requirements for short term lenders to disclose the availability of other options, with internet based lenders required to have a linkto the ASIC website at moneysmart.com.au;
3. that a credit provider must not enter into a credit contract (other than a small amount credit contract) if the annual cost rate of thecontract exceeds 48%; and
4. that a licensee must not provide credit assistance to a consumer by suggesting that the consumer apply, or assisting the consumerto apply, for a small amount credit contract with a particular credit provider if the licensee knows, or is reckless as to whether, theconsumer is a debtor under another small amount credit contract.
For
per
sona
l use
onl
y
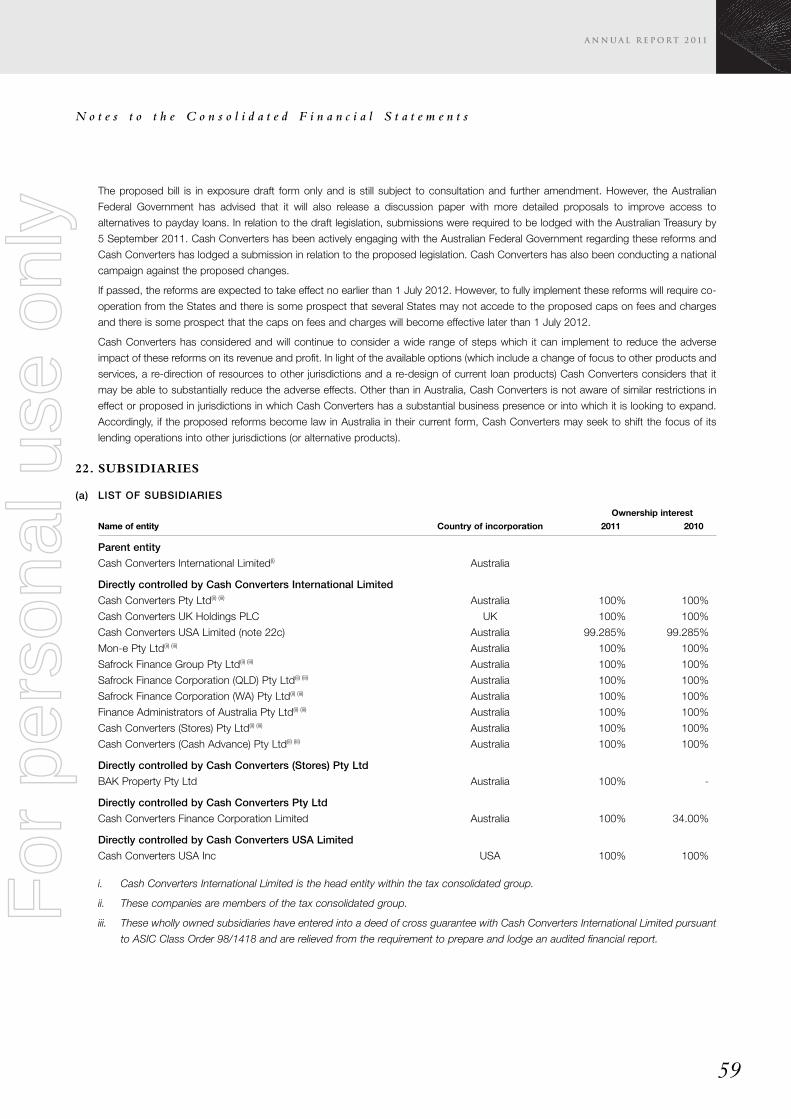
N o t e s t o t h e C o n s o l i d a t e d F i n a n c i a l S t a t e m e n t s
59
The proposed bill is in exposure draft form only and is still subject to consultation and further amendment. However, the Australian
Federal Government has advised that it will also release a discussion paper with more detailed proposals to improve access to
alternatives to payday loans. In relation to the draft legislation, submissions were required to be lodged with the Australian Treasury by
5 September 2011. Cash Converters has been actively engaging with the Australian Federal Government regarding these reforms and
Cash Converters has lodged a submission in relation to the proposed legislation. Cash Converters has also been conducting a national
campaign against the proposed changes.
If passed, the reforms are expected to take effect no earlier than 1 July 2012. However, to fully implement these reforms will require co-
operation from the States and there is some prospect that several States may not accede to the proposed caps on fees and charges
and there is some prospect that the caps on fees and charges will become effective later than 1 July 2012.
Cash Converters has considered and will continue to consider a wide range of steps which it can implement to reduce the adverse
impact of these reforms on its revenue and profit. In light of the available options (which include a change of focus to other products and
services, a re-direction of resources to other jurisdictions and a re-design of current loan products) Cash Converters considers that it
may be able to substantially reduce the adverse effects. Other than in Australia, Cash Converters is not aware of similar restrictions in
effect or proposed in jurisdictions in which Cash Converters has a substantial business presence or into which it is looking to expand.
Accordingly, if the proposed reforms become law in Australia in their current form, Cash Converters may seek to shift the focus of its
lending operations into other jurisdictions (or alternative products).
22. SUBSIDIARIES
(a) LIST OF SUBSIDIARIES
Ownership interestName of entity Country of incorporation 2011 2010
Parent entity
Cash Converters International Limited(i) Australia
Directly controlled by Cash Converters International Limited
Cash Converters Pty Ltd(ii) (iii) Australia 100% 100%
Cash Converters UK Holdings PLC UK 100% 100%
Cash Converters USA Limited (note 22c) Australia 99.285% 99.285%
Mon-e Pty Ltd(ii) (iii) Australia 100% 100%
Safrock Finance Group Pty Ltd(ii) (iii) Australia 100% 100%
Safrock Finance Corporation (QLD) Pty Ltd(ii) (iii) Australia 100% 100%
Safrock Finance Corporation (WA) Pty Ltd(ii) (iii) Australia 100% 100%
Finance Administrators of Australia Pty Ltd(ii) (iii) Australia 100% 100%
Cash Converters (Stores) Pty Ltd(ii) (iii) Australia 100% 100%
Cash Converters (Cash Advance) Pty Ltd(ii) (iii) Australia 100% 100%
Directly controlled by Cash Converters (Stores) Pty Ltd
BAK Property Pty Ltd Australia 100% -
Directly controlled by Cash Converters Pty Ltd
Cash Converters Finance Corporation Limited Australia 100% 34.00%
Directly controlled by Cash Converters USA Limited
Cash Converters USA Inc USA 100% 100%
i. Cash Converters International Limited is the head entity within the tax consolidated group.
ii. These companies are members of the tax consolidated group.
iii. These wholly owned subsidiaries have entered into a deed of cross guarantee with Cash Converters International Limited pursuant
to ASIC Class Order 98/1418 and are relieved from the requirement to prepare and lodge an audited financial report.
For
per
sona
l use
onl
y
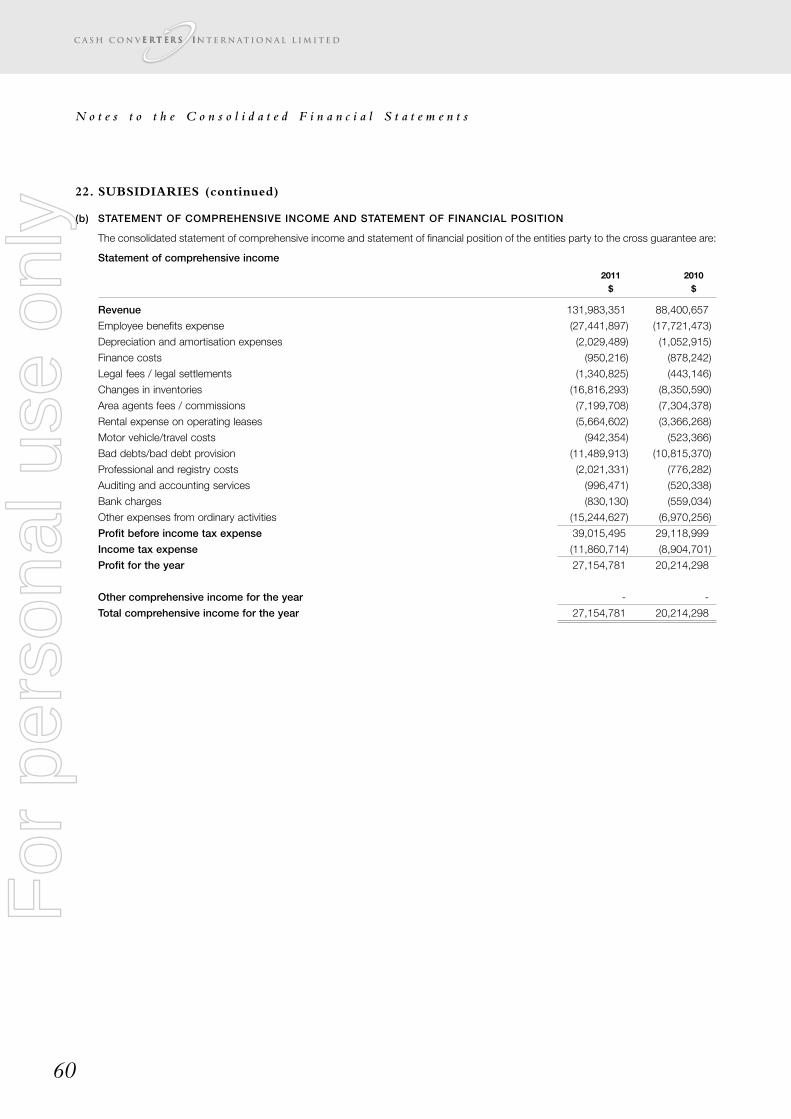
N o t e s t o t h e C o n s o l i d a t e d F i n a n c i a l S t a t e m e n t s
60
22. SUBSIDIARIES (continued)
(b) STATEMENT OF COMPREHENSIVE INCOME AND STATEMENT OF FINANCIAL POSITION
The consolidated statement of comprehensive income and statement of financial position of the entities party to the cross guarantee are:
Statement of comprehensive income
2011 2010$ $
Revenue 131,983,351 88,400,657
Employee benefits expense (27,441,897) (17,721,473)
Depreciation and amortisation expenses (2,029,489) (1,052,915)
Finance costs (950,216) (878,242)
Legal fees / legal settlements (1,340,825) (443,146)
Changes in inventories (16,816,293) (8,350,590)
Area agents fees / commissions (7,199,708) (7,304,378)
Rental expense on operating leases (5,664,602) (3,366,268)
Motor vehicle/travel costs (942,354) (523,366)
Bad debts/bad debt provision (11,489,913) (10,815,370)
Professional and registry costs (2,021,331) (776,282)
Auditing and accounting services (996,471) (520,338)
Bank charges (830,130) (559,034)
Other expenses from ordinary activities (15,244,627) (6,970,256)
Profit before income tax expense 39,015,495 29,118,999
Income tax expense (11,860,714) (8,904,701)
Profit for the year 27,154,781 20,214,298
Other comprehensive income for the year - -
Total comprehensive income for the year 27,154,781 20,214,298
For
per
sona
l use
onl
y
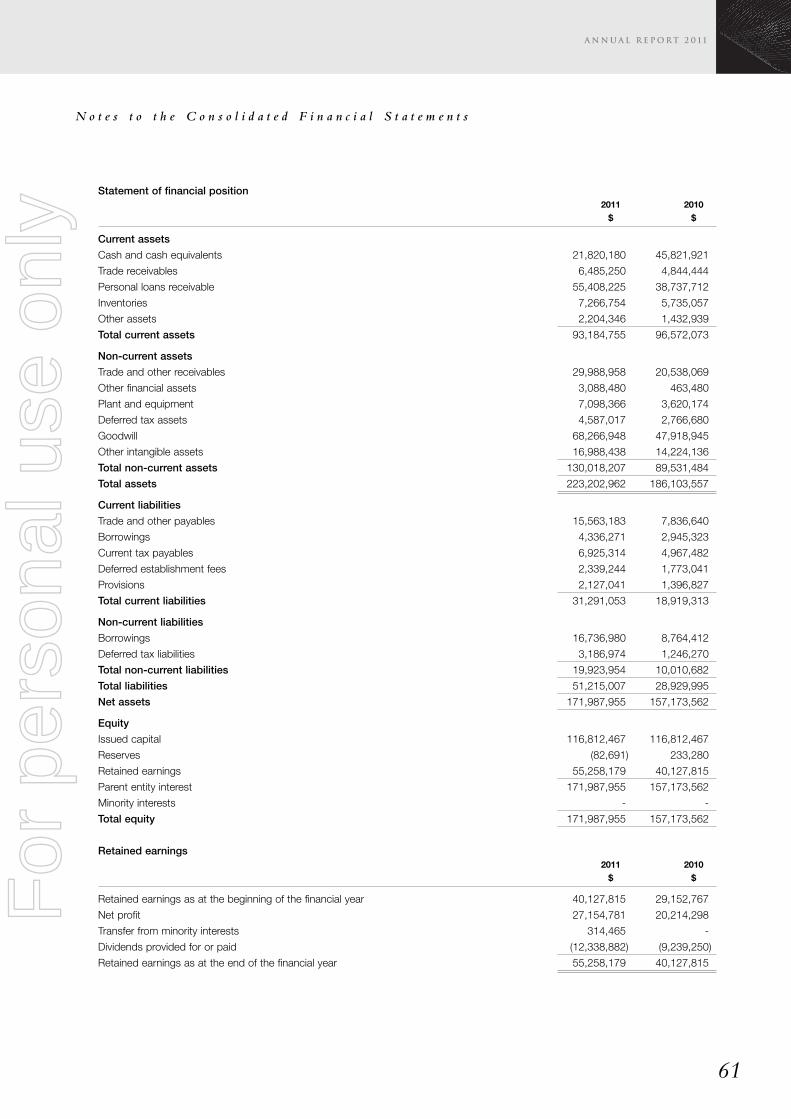
N o t e s t o t h e C o n s o l i d a t e d F i n a n c i a l S t a t e m e n t s
61
Statement of financial position2011 2010$ $
Current assets
Cash and cash equivalents 21,820,180 45,821,921
Trade receivables 6,485,250 4,844,444
Personal loans receivable 55,408,225 38,737,712
Inventories 7,266,754 5,735,057
Other assets 2,204,346 1,432,939
Total current assets 93,184,755 96,572,073
Non-current assets
Trade and other receivables 29,988,958 20,538,069
Other financial assets 3,088,480 463,480
Plant and equipment 7,098,366 3,620,174
Deferred tax assets 4,587,017 2,766,680
Goodwill 68,266,948 47,918,945
Other intangible assets 16,988,438 14,224,136
Total non-current assets 130,018,207 89,531,484
Total assets 223,202,962 186,103,557
Current liabilities
Trade and other payables 15,563,183 7,836,640
Borrowings 4,336,271 2,945,323
Current tax payables 6,925,314 4,967,482
Deferred establishment fees 2,339,244 1,773,041
Provisions 2,127,041 1,396,827
Total current liabilities 31,291,053 18,919,313
Non-current liabilities
Borrowings 16,736,980 8,764,412
Deferred tax liabilities 3,186,974 1,246,270
Total non-current liabilities 19,923,954 10,010,682
Total liabilities 51,215,007 28,929,995
Net assets 171,987,955 157,173,562
Equity
Issued capital 116,812,467 116,812,467
Reserves (82,691) 233,280
Retained earnings 55,258,179 40,127,815
Parent entity interest 171,987,955 157,173,562
Minority interests - -
Total equity 171,987,955 157,173,562
Retained earnings2011 2010$ $
Retained earnings as at the beginning of the financial year 40,127,815 29,152,767
Net profit 27,154,781 20,214,298
Transfer from minority interests 314,465 -
Dividends provided for or paid (12,338,882) (9,239,250)
Retained earnings as at the end of the financial year 55,258,179 40,127,815
For
per
sona
l use
onl
y
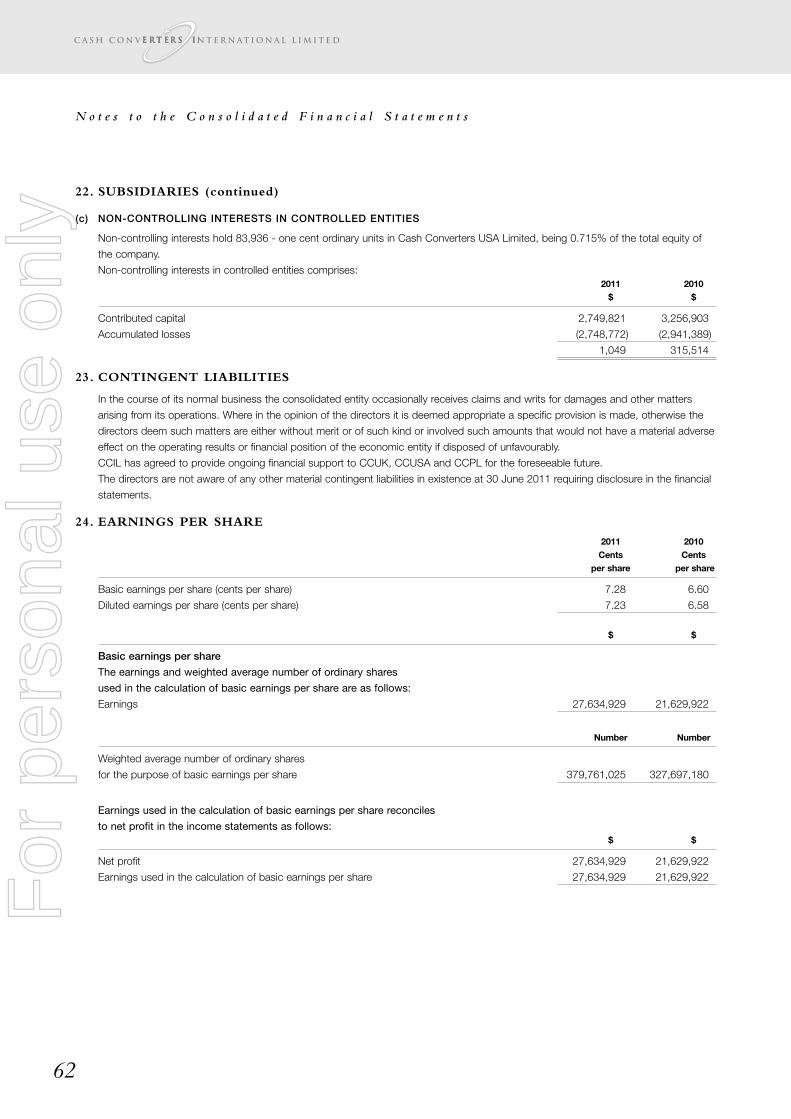
N o t e s t o t h e C o n s o l i d a t e d F i n a n c i a l S t a t e m e n t s
62
22. SUBSIDIARIES (continued)
(c) NON-CONTROLLING INTERESTS IN CONTROLLED ENTITIES
Non-controlling interests hold 83,936 - one cent ordinary units in Cash Converters USA Limited, being 0.715% of the total equity of
the company.
Non-controlling interests in controlled entities comprises:2011 2010$ $
Contributed capital 2,749,821 3,256,903
Accumulated losses (2,748,772) (2,941,389)
1,049 315,514
23. CONTINGENT LIABILITIES
In the course of its normal business the consolidated entity occasionally receives claims and writs for damages and other matters
arising from its operations. Where in the opinion of the directors it is deemed appropriate a specific provision is made, otherwise the
directors deem such matters are either without merit or of such kind or involved such amounts that would not have a material adverse
effect on the operating results or financial position of the economic entity if disposed of unfavourably.
CCIL has agreed to provide ongoing financial support to CCUK, CCUSA and CCPL for the foreseeable future.
The directors are not aware of any other material contingent liabilities in existence at 30 June 2011 requiring disclosure in the financial
statements.
24. EARNINGS PER SHARE
2011 2010Cents Cents
per share per share
Basic earnings per share (cents per share) 7.28 6.60
Diluted earnings per share (cents per share) 7.23 6.58
$ $
Basic earnings per share
The earnings and weighted average number of ordinary shares
used in the calculation of basic earnings per share are as follows:
Earnings 27,634,929 21,629,922
Number Number
Weighted average number of ordinary shares
for the purpose of basic earnings per share 379,761,025 327,697,180
Earnings used in the calculation of basic earnings per share reconciles
to net profit in the income statements as follows:$ $
Net profit 27,634,929 21,629,922
Earnings used in the calculation of basic earnings per share 27,634,929 21,629,922For
per
sona
l use
onl
y
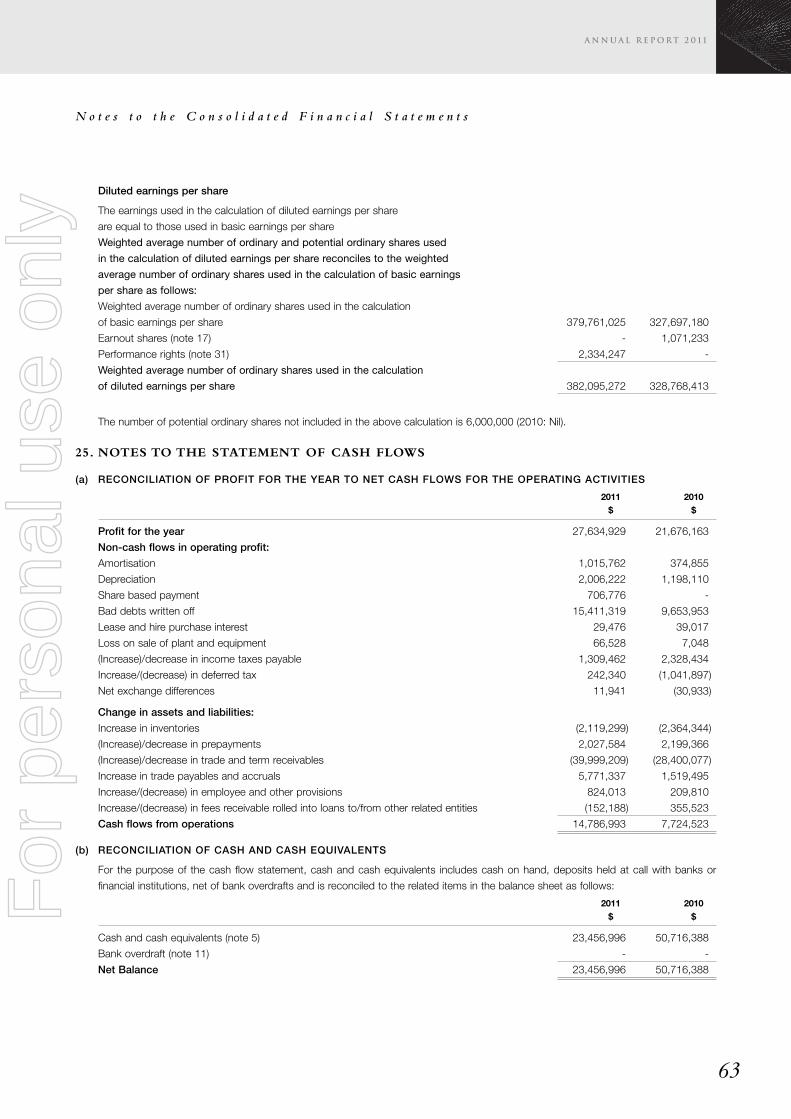
N o t e s t o t h e C o n s o l i d a t e d F i n a n c i a l S t a t e m e n t s
63
Diluted earnings per share
The earnings used in the calculation of diluted earnings per share
are equal to those used in basic earnings per share
Weighted average number of ordinary and potential ordinary shares used
in the calculation of diluted earnings per share reconciles to the weighted
average number of ordinary shares used in the calculation of basic earnings
per share as follows:
Weighted average number of ordinary shares used in the calculation
of basic earnings per share 379,761,025 327,697,180
Earnout shares (note 17) - 1,071,233
Performance rights (note 31) 2,334,247 -
Weighted average number of ordinary shares used in the calculation
of diluted earnings per share 382,095,272 328,768,413
The number of potential ordinary shares not included in the above calculation is 6,000,000 (2010: Nil).
25. NOTES TO THE STATEMENT OF CASH FLOWS
(a) RECONCILIATION OF PROFIT FOR THE YEAR TO NET CASH FLOWS FOR THE OPERATING ACTIVITIES
2011 2010$ $
Profit for the year 27,634,929 21,676,163
Non-cash flows in operating profit:
Amortisation 1,015,762 374,855
Depreciation 2,006,222 1,198,110
Share based payment 706,776 -
Bad debts written off 15,411,319 9,653,953
Lease and hire purchase interest 29,476 39,017
Loss on sale of plant and equipment 66,528 7,048
(Increase)/decrease in income taxes payable 1,309,462 2,328,434
Increase/(decrease) in deferred tax 242,340 (1,041,897)
Net exchange differences 11,941 (30,933)
Change in assets and liabilities:
Increase in inventories (2,119,299) (2,364,344)
(Increase)/decrease in prepayments 2,027,584 2,199,366
(Increase)/decrease in trade and term receivables (39,999,209) (28,400,077)
Increase in trade payables and accruals 5,771,337 1,519,495
Increase/(decrease) in employee and other provisions 824,013 209,810
Increase/(decrease) in fees receivable rolled into loans to/from other related entities (152,188) 355,523
Cash flows from operations 14,786,993 7,724,523
(b) RECONCILIATION OF CASH AND CASH EQUIVALENTS
For the purpose of the cash flow statement, cash and cash equivalents includes cash on hand, deposits held at call with banks or
financial institutions, net of bank overdrafts and is reconciled to the related items in the balance sheet as follows:
2011 2010$ $
Cash and cash equivalents (note 5) 23,456,996 50,716,388
Bank overdraft (note 11) - -
Net Balance 23,456,996 50,716,388
For
per
sona
l use
onl
y
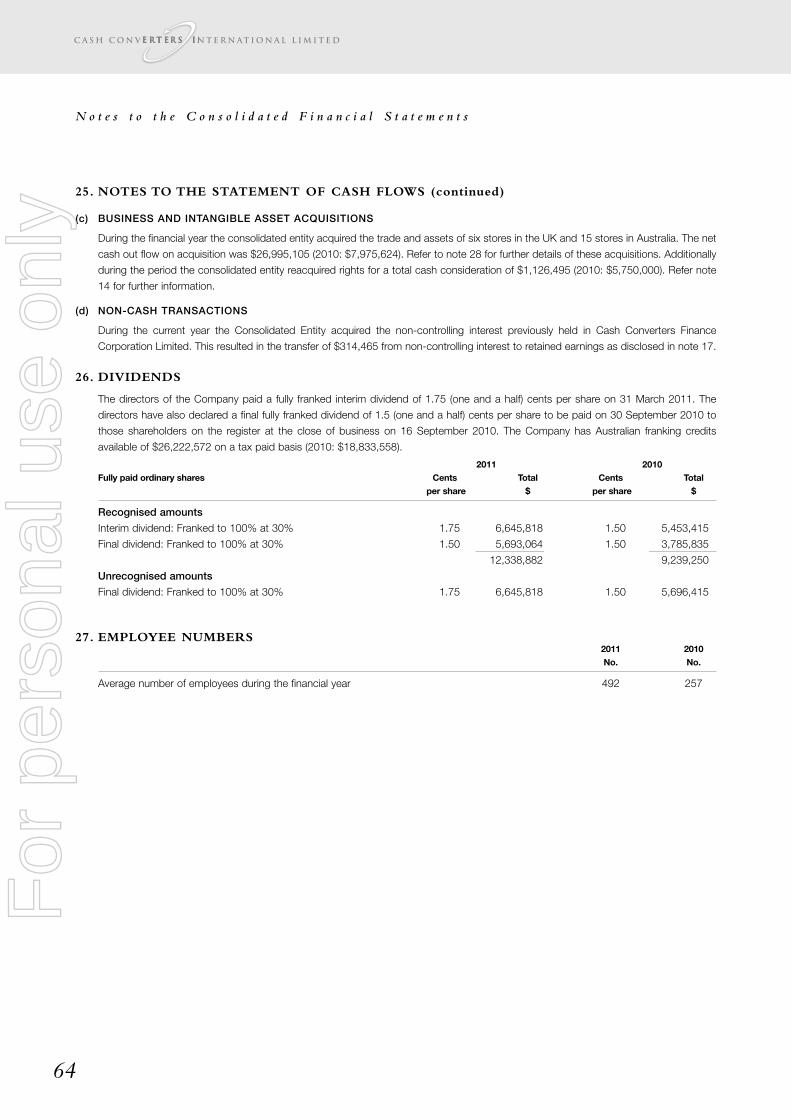
N o t e s t o t h e C o n s o l i d a t e d F i n a n c i a l S t a t e m e n t s
64
25. NOTES TO THE STATEMENT OF CASH FLOWS (continued)
(c) BUSINESS AND INTANGIBLE ASSET ACQUISITIONS
During the financial year the consolidated entity acquired the trade and assets of six stores in the UK and 15 stores in Australia. The net
cash out flow on acquisition was $26,995,105 (2010: $7,975,624). Refer to note 28 for further details of these acquisitions. Additionally
during the period the consolidated entity reacquired rights for a total cash consideration of $1,126,495 (2010: $5,750,000). Refer note
14 for further information.
(d) NON-CASH TRANSACTIONS
During the current year the Consolidated Entity acquired the non-controlling interest previously held in Cash Converters Finance
Corporation Limited. This resulted in the transfer of $314,465 from non-controlling interest to retained earnings as disclosed in note 17.
26. DIVIDENDS
The directors of the Company paid a fully franked interim dividend of 1.75 (one and a half) cents per share on 31 March 2011. The
directors have also declared a final fully franked dividend of 1.5 (one and a half) cents per share to be paid on 30 September 2010 to
those shareholders on the register at the close of business on 16 September 2010. The Company has Australian franking credits
available of $26,222,572 on a tax paid basis (2010: $18,833,558).
2011 2010Fully paid ordinary shares Cents Total Cents Total
per share $ per share $
Recognised amounts
Interim dividend: Franked to 100% at 30% 1.75 6,645,818 1.50 5,453,415
Final dividend: Franked to 100% at 30% 1.50 5,693,064 1.50 3,785,835
12,338,882 9,239,250
Unrecognised amounts
Final dividend: Franked to 100% at 30% 1.75 6,645,818 1.50 5,696,415
27. EMPLOYEE NUMBERS2011 2010No. No.
Average number of employees during the financial year 492 257
For
per
sona
l use
onl
y
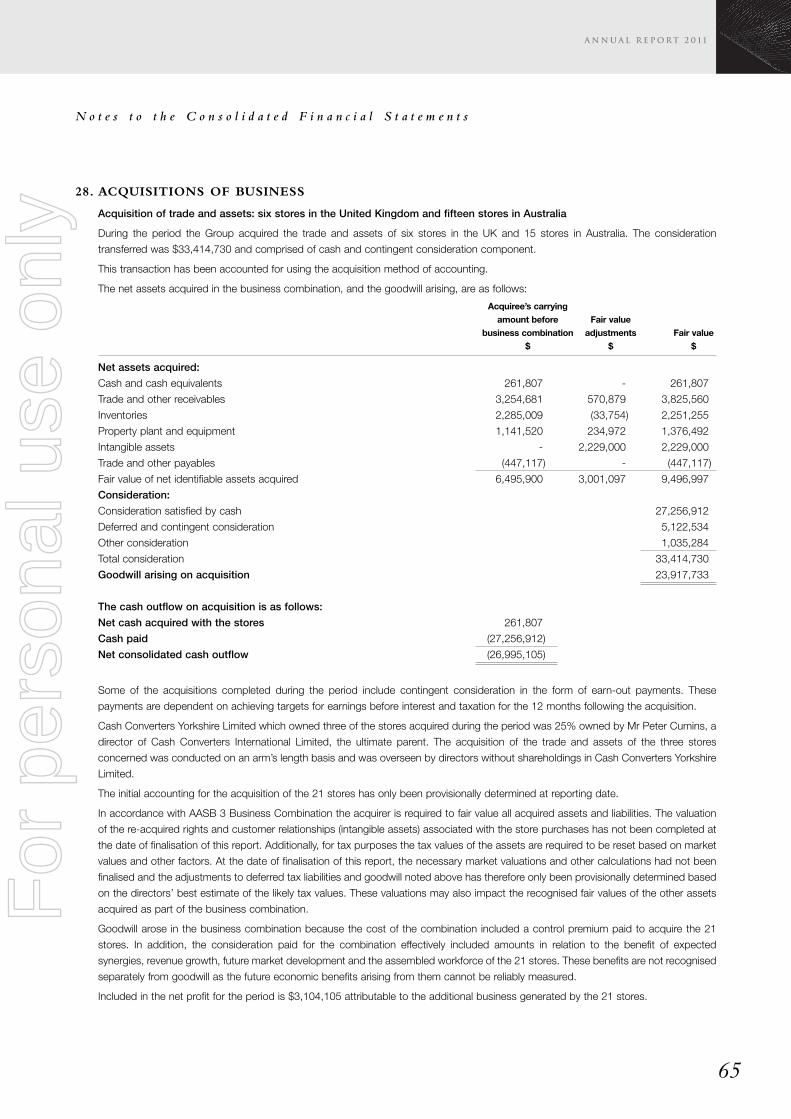
N o t e s t o t h e C o n s o l i d a t e d F i n a n c i a l S t a t e m e n t s
65
28. ACQUISITIONS OF BUSINESS
Acquisition of trade and assets: six stores in the United Kingdom and fifteen stores in Australia
During the period the Group acquired the trade and assets of six stores in the UK and 15 stores in Australia. The consideration
transferred was $33,414,730 and comprised of cash and contingent consideration component.
This transaction has been accounted for using the acquisition method of accounting.
The net assets acquired in the business combination, and the goodwill arising, are as follows:
Acquiree’s carryingamount before Fair value
business combination adjustments Fair value$ $ $
Net assets acquired:
Cash and cash equivalents 261,807 - 261,807
Trade and other receivables 3,254,681 570,879 3,825,560
Inventories 2,285,009 (33,754) 2,251,255
Property plant and equipment 1,141,520 234,972 1,376,492
Intangible assets - 2,229,000 2,229,000
Trade and other payables (447,117) - (447,117)
Fair value of net identifiable assets acquired 6,495,900 3,001,097 9,496,997
Consideration:
Consideration satisfied by cash 27,256,912
Deferred and contingent consideration 5,122,534
Other consideration 1,035,284
Total consideration 33,414,730
Goodwill arising on acquisition 23,917,733
The cash outflow on acquisition is as follows:
Net cash acquired with the stores 261,807
Cash paid (27,256,912)
Net consolidated cash outflow (26,995,105)
Some of the acquisitions completed during the period include contingent consideration in the form of earn-out payments. These
payments are dependent on achieving targets for earnings before interest and taxation for the 12 months following the acquisition.
Cash Converters Yorkshire Limited which owned three of the stores acquired during the period was 25% owned by Mr Peter Cumins, a
director of Cash Converters International Limited, the ultimate parent. The acquisition of the trade and assets of the three stores
concerned was conducted on an arm’s length basis and was overseen by directors without shareholdings in Cash Converters Yorkshire
Limited.
The initial accounting for the acquisition of the 21 stores has only been provisionally determined at reporting date.
In accordance with AASB 3 Business Combination the acquirer is required to fair value all acquired assets and liabilities. The valuation
of the re-acquired rights and customer relationships (intangible assets) associated with the store purchases has not been completed at
the date of finalisation of this report. Additionally, for tax purposes the tax values of the assets are required to be reset based on market
values and other factors. At the date of finalisation of this report, the necessary market valuations and other calculations had not been
finalised and the adjustments to deferred tax liabilities and goodwill noted above has therefore only been provisionally determined based
on the directors’ best estimate of the likely tax values. These valuations may also impact the recognised fair values of the other assets
acquired as part of the business combination.
Goodwill arose in the business combination because the cost of the combination included a control premium paid to acquire the 21
stores. In addition, the consideration paid for the combination effectively included amounts in relation to the benefit of expected
synergies, revenue growth, future market development and the assembled workforce of the 21 stores. These benefits are not recognised
separately from goodwill as the future economic benefits arising from them cannot be reliably measured.
Included in the net profit for the period is $3,104,105 attributable to the additional business generated by the 21 stores.
For
per
sona
l use
onl
y
N o t e s t o t h e C o n s o l i d a t e d F i n a n c i a l S t a t e m e n t s
66
28. ACQUISITIONS OF BUSINESS (continued)
Had the business combinations been effected at 1 July 2010, the revenue of the Group would be $217,229,118 and net profit
$30,961,430. The directors of the Group consider these ‘pro-forma’ numbers to represent an approximate measure of the performance
of the combined group on an annualised basis and to provide a reference point for future periods.
In determining the ‘pro-forma’ revenue and profit of the Group had the 21 stores been acquired at the beginning of the current reporting
period, the directors have:
� calculated depreciation and amortisation of plant and equipment acquired on the basis of the fair values arising in the initial
accounting for the business combination rather than the carrying amounts recognised in the pre-acquisition financial statements
� based borrowing costs on the funding levels, credit ratings and debt/equity position of the Group after the business combination
� utilised the un-audited 30 June 2011 financial information of the 21 stores.
AMENDMENTS TO CONTINGENT CONSIDERATION
In August 2010 the Consolidated Entity acquired 4 stores in Queensland from an existing franchisee.
Consideration for this acquisition consisted of an initial cash payment and an earn-out payment based on earnings before interest and
taxation (“EBIT”) for the 12 months following the acquisition. In accordance with AASB 3 Business Combinations, the initial acquisition
accounting included an estimate of the likely earn-out payments to be made.
In January 2011 the Goodna store, which was one of the stores acquired, was severely damaged as a result of Queensland Floods. The
flood resulted in write-offs to inventory, fixtures and fittings, damage to customers’ pawned goods, and a consequent prolonged store
closure. The insurance company has refused to honour the Consolidated Entity’s claim in respect to damages and losses incurred
pursuant to the flood. Cash Converters intend to challenge this decision. The Goodna store has been re-fitted and was re-opened in
July 2011.
The Store Purchase Agreement did not contain a force majeure clause, or any other clause identifying what would occur in relation to
the earn-out payments should one or more of the stores not trade or could only trade in a limited manner as a result of a natural disaster
or some other event outside the control of either parties.
The prolonged store closure significantly impacted the EBIT for the acquired store group and consequently the potential earn-out. As a
result of this the Consolidated Entity entered into an agreement with the Vendor which resulted in a final payment being made which was
$1,173,933 lower than estimated during the initial acquisition accounting.
In accordance with AASB 3 Business Combinations and consistent with AASB 110 Events after the reporting period, given that the final
contingent consideration was different to that originally estimated, and the event driving this change was clearly subsequent to the
acquisition date, this reduction in contingent consideration has been recognised as a gain in the income statement during the year. This
gain has been recognised as other income (refer note 2).
All costs associated with the flood damage have also been recognised in the income statement during the current period.
29. SEGMENTAL INFORMATION
Information reported to the consolidated entity’s Managing Director for the purposes of resource assessment and assessment of
performance is focused on the nature of the service and category of customer. The consolidated entity’s reportable segments under
AASB 8 are therefore as follows:
Franchise operations
This involves the sale of franchises for the retail sale of second had goods and the sale of master licences for the development of
franchises in countries around the world.
Store Operations
This involves the retail sale of second hand goods at corporate owned stores in Australia and the UK.
Financial services – personal loans
This segment includes the Safrock personal loans business.
Financial services – administration
This segment includes Mon-e which is responsible for providing the internet platform and administration services for the Cash Converters
network in Australia to offer small cash advance loans to their customers.
For
per
sona
l use
onl
y
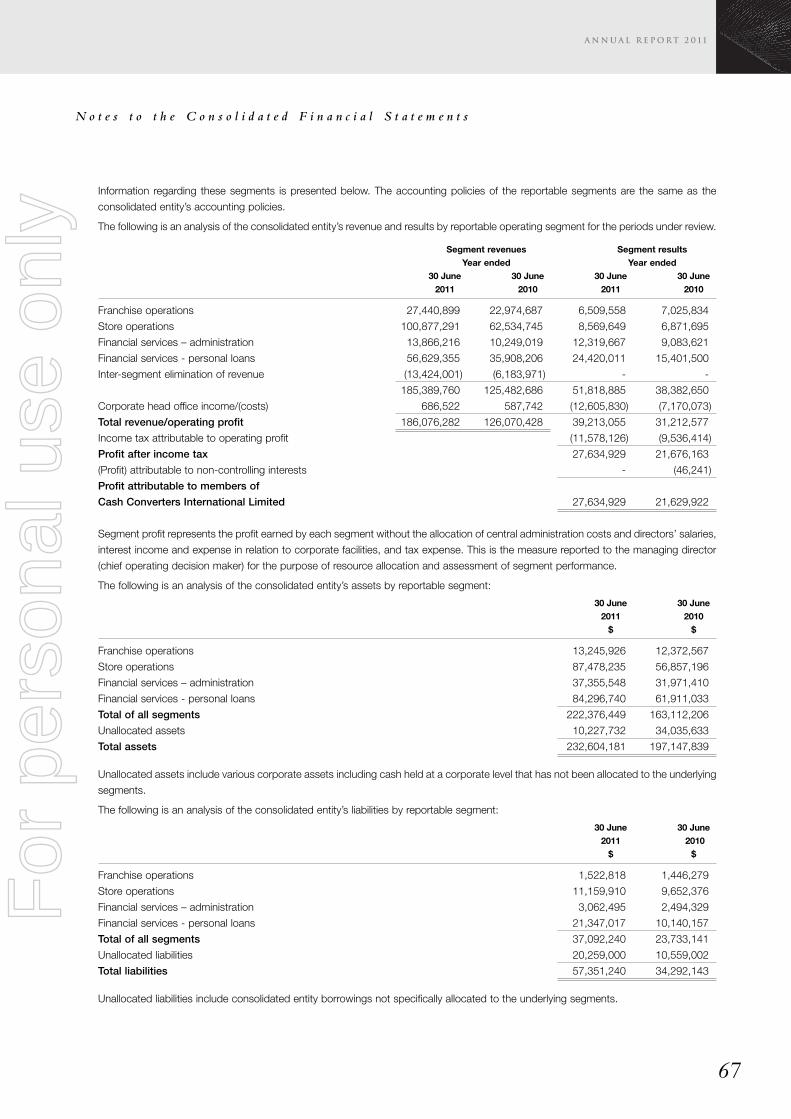
N o t e s t o t h e C o n s o l i d a t e d F i n a n c i a l S t a t e m e n t s
67
Information regarding these segments is presented below. The accounting policies of the reportable segments are the same as the
consolidated entity’s accounting policies.
The following is an analysis of the consolidated entity’s revenue and results by reportable operating segment for the periods under review.
Segment revenues Segment resultsYear ended Year ended
30 June 30 June 30 June 30 June2011 2010 2011 2010
Franchise operations 27,440,899 22,974,687 6,509,558 7,025,834
Store operations 100,877,291 62,534,745 8,569,649 6,871,695
Financial services – administration 13,866,216 10,249,019 12,319,667 9,083,621
Financial services - personal loans 56,629,355 35,908,206 24,420,011 15,401,500
Inter-segment elimination of revenue (13,424,001) (6,183,971) - -
185,389,760 125,482,686 51,818,885 38,382,650
Corporate head office income/(costs) 686,522 587,742 (12,605,830) (7,170,073)
Total revenue/operating profit 186,076,282 126,070,428 39,213,055 31,212,577
Income tax attributable to operating profit (11,578,126) (9,536,414)
Profit after income tax 27,634,929 21,676,163
(Profit) attributable to non-controlling interests - (46,241)
Profit attributable to members of
Cash Converters International Limited 27,634,929 21,629,922
Segment profit represents the profit earned by each segment without the allocation of central administration costs and directors’ salaries,
interest income and expense in relation to corporate facilities, and tax expense. This is the measure reported to the managing director
(chief operating decision maker) for the purpose of resource allocation and assessment of segment performance.
The following is an analysis of the consolidated entity’s assets by reportable segment:
30 June 30 June2011 2010$ $
Franchise operations 13,245,926 12,372,567
Store operations 87,478,235 56,857,196
Financial services – administration 37,355,548 31,971,410
Financial services - personal loans 84,296,740 61,911,033
Total of all segments 222,376,449 163,112,206
Unallocated assets 10,227,732 34,035,633
Total assets 232,604,181 197,147,839
Unallocated assets include various corporate assets including cash held at a corporate level that has not been allocated to the underlying
segments.
The following is an analysis of the consolidated entity’s liabilities by reportable segment:
30 June 30 June2011 2010$ $
Franchise operations 1,522,818 1,446,279
Store operations 11,159,910 9,652,376
Financial services – administration 3,062,495 2,494,329
Financial services - personal loans 21,347,017 10,140,157
Total of all segments 37,092,240 23,733,141
Unallocated liabilities 20,259,000 10,559,002
Total liabilities 57,351,240 34,292,143
Unallocated liabilities include consolidated entity borrowings not specifically allocated to the underlying segments.
For
per
sona
l use
onl
y
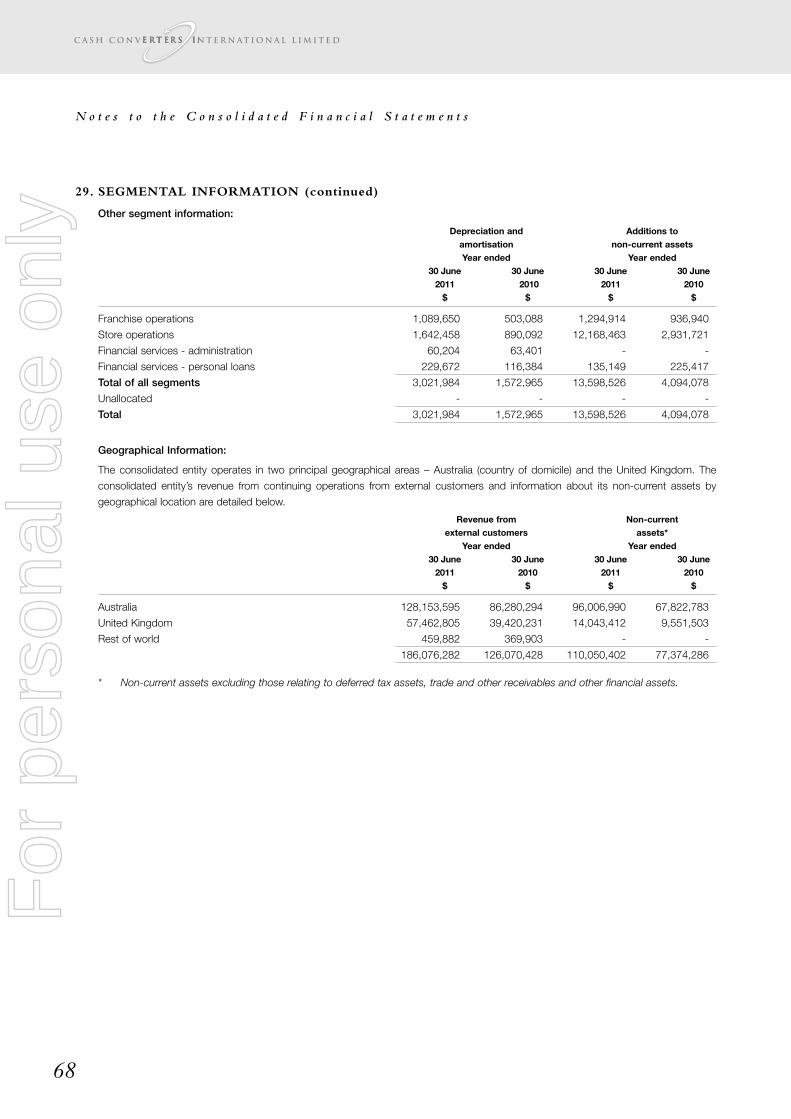
N o t e s t o t h e C o n s o l i d a t e d F i n a n c i a l S t a t e m e n t s
68
29. SEGMENTAL INFORMATION (continued)
Other segment information:
Depreciation and Additions toamortisation non-current assetsYear ended Year ended
30 June 30 June 30 June 30 June2011 2010 2011 2010$ $ $ $
Franchise operations 1,089,650 503,088 1,294,914 936,940
Store operations 1,642,458 890,092 12,168,463 2,931,721
Financial services - administration 60,204 63,401 - -
Financial services - personal loans 229,672 116,384 135,149 225,417
Total of all segments 3,021,984 1,572,965 13,598,526 4,094,078
Unallocated - - - -
Total 3,021,984 1,572,965 13,598,526 4,094,078
Geographical Information:
The consolidated entity operates in two principal geographical areas – Australia (country of domicile) and the United Kingdom. The
consolidated entity’s revenue from continuing operations from external customers and information about its non-current assets by
geographical location are detailed below.
Revenue from Non-currentexternal customers assets*
Year ended Year ended30 June 30 June 30 June 30 June2011 2010 2011 2010$ $ $ $
Australia 128,153,595 86,280,294 96,006,990 67,822,783
United Kingdom 57,462,805 39,420,231 14,043,412 9,551,503
Rest of world 459,882 369,903 - -
186,076,282 126,070,428 110,050,402 77,374,286
* Non-current assets excluding those relating to deferred tax assets, trade and other receivables and other financial assets.
For
per
sona
l use
onl
y
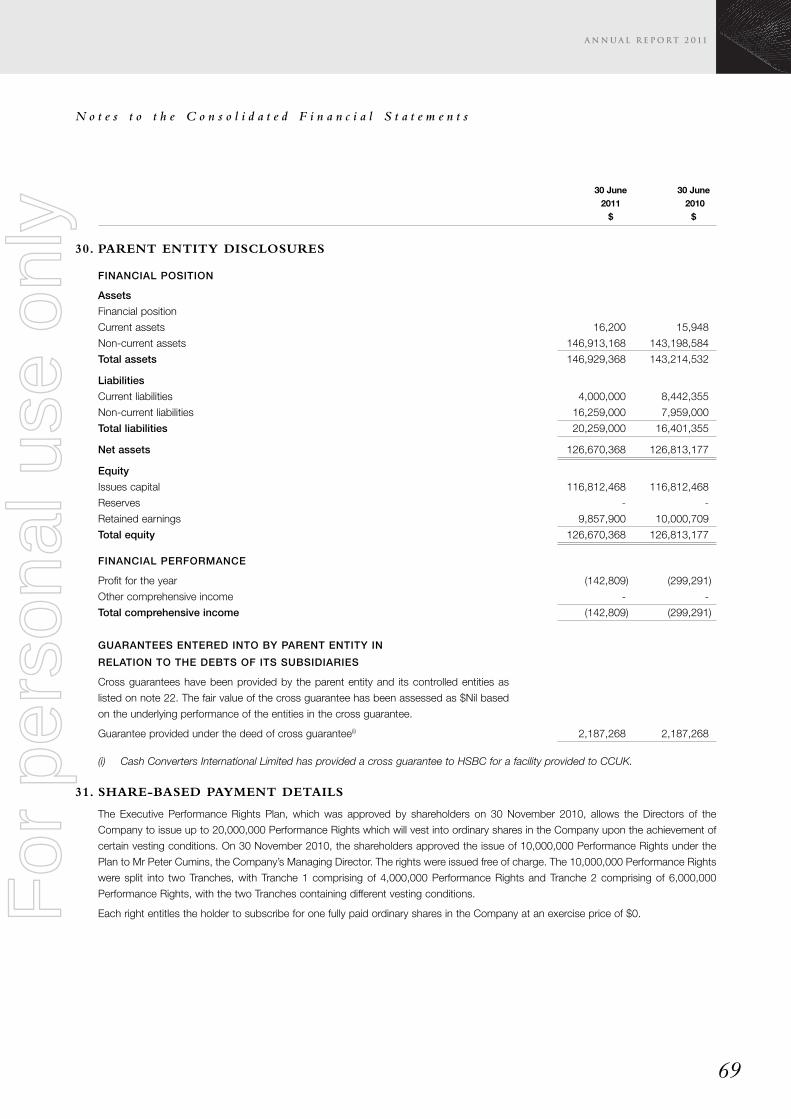
N o t e s t o t h e C o n s o l i d a t e d F i n a n c i a l S t a t e m e n t s
69
30 June 30 June2011 2010$ $
30. PARENT ENTITY DISCLOSURES
FINANCIAL POSITION
Assets
Financial position
Current assets 16,200 15,948
Non-current assets 146,913,168 143,198,584
Total assets 146,929,368 143,214,532
Liabilities
Current liabilities 4,000,000 8,442,355
Non-current liabilities 16,259,000 7,959,000
Total liabilities 20,259,000 16,401,355
Net assets 126,670,368 126,813,177
Equity
Issues capital 116,812,468 116,812,468
Reserves - -
Retained earnings 9,857,900 10,000,709
Total equity 126,670,368 126,813,177
FINANCIAL PERFORMANCE
Profit for the year (142,809) (299,291)
Other comprehensive income - -
Total comprehensive income (142,809) (299,291)
GUARANTEES ENTERED INTO BY PARENT ENTITY IN
RELATION TO THE DEBTS OF ITS SUBSIDIARIES
Cross guarantees have been provided by the parent entity and its controlled entities as
listed on note 22. The fair value of the cross guarantee has been assessed as $Nil based
on the underlying performance of the entities in the cross guarantee.
Guarantee provided under the deed of cross guarantee(i) 2,187,268 2,187,268
(i) Cash Converters International Limited has provided a cross guarantee to HSBC for a facility provided to CCUK.
31. SHARE-BASED PAYMENT DETAILS
The Executive Performance Rights Plan, which was approved by shareholders on 30 November 2010, allows the Directors of the
Company to issue up to 20,000,000 Performance Rights which will vest into ordinary shares in the Company upon the achievement of
certain vesting conditions. On 30 November 2010, the shareholders approved the issue of 10,000,000 Performance Rights under the
Plan to Mr Peter Cumins, the Company’s Managing Director. The rights were issued free of charge. The 10,000,000 Performance Rights
were split into two Tranches, with Tranche 1 comprising of 4,000,000 Performance Rights and Tranche 2 comprising of 6,000,000
Performance Rights, with the two Tranches containing different vesting conditions.
Each right entitles the holder to subscribe for one fully paid ordinary shares in the Company at an exercise price of $0.For
per
sona
l use
onl
y
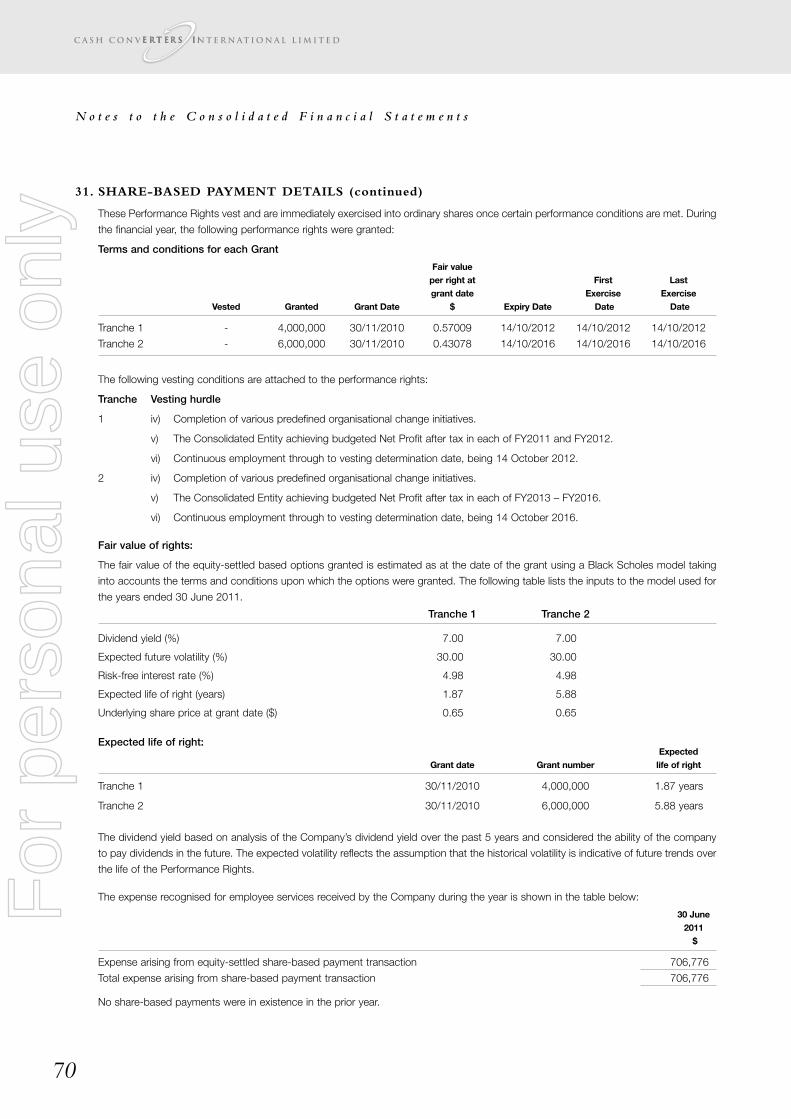
N o t e s t o t h e C o n s o l i d a t e d F i n a n c i a l S t a t e m e n t s
70
31. SHARE-BASED PAYMENT DETAILS (continued)
These Performance Rights vest and are immediately exercised into ordinary shares once certain performance conditions are met. During
the financial year, the following performance rights were granted:
Terms and conditions for each Grant
Fair valueper right at First Lastgrant date Exercise Exercise
Vested Granted Grant Date $ Expiry Date Date Date
Tranche 1 - 4,000,000 30/11/2010 0.57009 14/10/2012 14/10/2012 14/10/2012
Tranche 2 - 6,000,000 30/11/2010 0.43078 14/10/2016 14/10/2016 14/10/2016
The following vesting conditions are attached to the performance rights:
Tranche Vesting hurdle
1 iv) Completion of various predefined organisational change initiatives.
v) The Consolidated Entity achieving budgeted Net Profit after tax in each of FY2011 and FY2012.
vi) Continuous employment through to vesting determination date, being 14 October 2012.
2 iv) Completion of various predefined organisational change initiatives.
v) The Consolidated Entity achieving budgeted Net Profit after tax in each of FY2013 – FY2016.
vi) Continuous employment through to vesting determination date, being 14 October 2016.
Fair value of rights:
The fair value of the equity-settled based options granted is estimated as at the date of the grant using a Black Scholes model taking
into accounts the terms and conditions upon which the options were granted. The following table lists the inputs to the model used for
the years ended 30 June 2011.
Tranche 1 Tranche 2
Dividend yield (%) 7.00 7.00
Expected future volatility (%) 30.00 30.00
Risk-free interest rate (%) 4.98 4.98
Expected life of right (years) 1.87 5.88
Underlying share price at grant date ($) 0.65 0.65
Expected life of right:Expected
Grant date Grant number life of right
Tranche 1 30/11/2010 4,000,000 1.87 years
Tranche 2 30/11/2010 6,000,000 5.88 years
The dividend yield based on analysis of the Company’s dividend yield over the past 5 years and considered the ability of the company
to pay dividends in the future. The expected volatility reflects the assumption that the historical volatility is indicative of future trends over
the life of the Performance Rights.
The expense recognised for employee services received by the Company during the year is shown in the table below:
30 June2011$
Expense arising from equity-settled share-based payment transaction 706,776
Total expense arising from share-based payment transaction 706,776
No share-based payments were in existence in the prior year.
For
per
sona
l use
onl
y
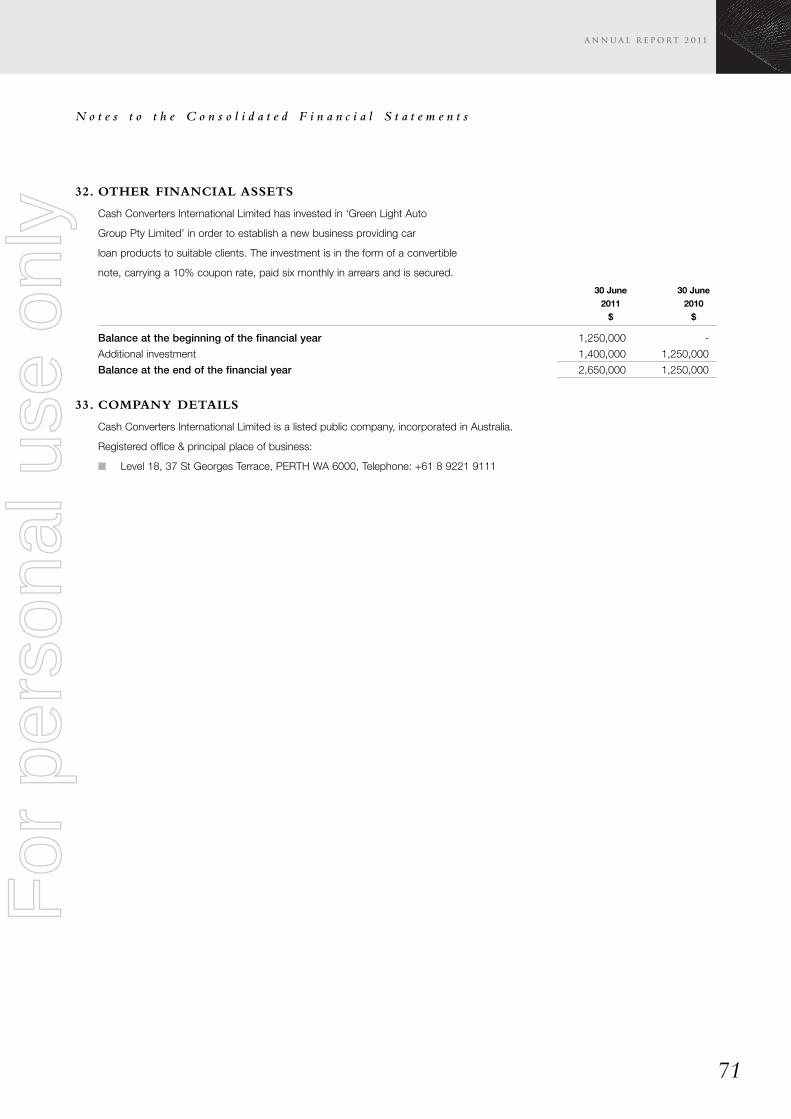
N o t e s t o t h e C o n s o l i d a t e d F i n a n c i a l S t a t e m e n t s
71
32. OTHER FINANCIAL ASSETS
Cash Converters International Limited has invested in ‘Green Light Auto
Group Pty Limited’ in order to establish a new business providing car
loan products to suitable clients. The investment is in the form of a convertible
note, carrying a 10% coupon rate, paid six monthly in arrears and is secured.
30 June 30 June2011 2010$ $
Balance at the beginning of the financial year 1,250,000 -
Additional investment 1,400,000 1,250,000
Balance at the end of the financial year 2,650,000 1,250,000
33. COMPANY DETAILS
Cash Converters International Limited is a listed public company, incorporated in Australia.
Registered office & principal place of business:
� Level 18, 37 St Georges Terrace, PERTH WA 6000, Telephone: +61 8 9221 9111
For
per
sona
l use
onl
y
D i r e c t o r s ’ D e c l a r a t i o n
72
The directors declare that:
a. In the directors’ opinion, there are reasonable grounds to believe that the company will be able to pay its debts as and when they become
due and payable;
b. The attached financial statements are in compliance with International Financial Reporting Standards, as stated in note 1 to the financial
statements;
c. In the directors’ opinion, the attached financial statements and notes thereto are in accordance with the Corporations Act 2001, including
compliance with accounting standards and giving a true and fair view of the financial position and performance of the consolidated entity;
and
d. the directors have been given the declarations required by s.295A of the Corporations Act 2001.
At the date of this declaration, the company is within the class of companies affected by ASIC Class Order 98/1418. The nature of the deed
of cross guarantee is such that each company which is party to the deed guarantees to each creditor payment in full of any debt in
accordance with the deed of cross guarantee.
In the directors’ opinion, there are reasonable grounds to believe that the company and the companies to which the ASIC Class Order applies,
as detailed in note 22 to the financial statements will, as a group, be able to meet any obligations or liabilities to which they are or may become
subject, by virtue of the deed of cross guarantee.
Signed in accordance with a resolution of the directors made pursuant to s.295 (5) of the Corporations Act 2001.
On behalf of the directors
Reginald Webb
Director
Perth, Western Australia
Date: 16 September 2011
For
per
sona
l use
onl
y
73
I n d e p e n d e n t A u d i t R e p o r t t o t h e M e m b e r s
For
per
sona
l use
onl
y
74
I n d e p e n d e n t A u d i t R e p o r t t o t h e M e m b e r s
For
per
sona
l use
onl
y
75
I n d e p e n d e n c e D e c l a r a t i o n
For
per
sona
l use
onl
y
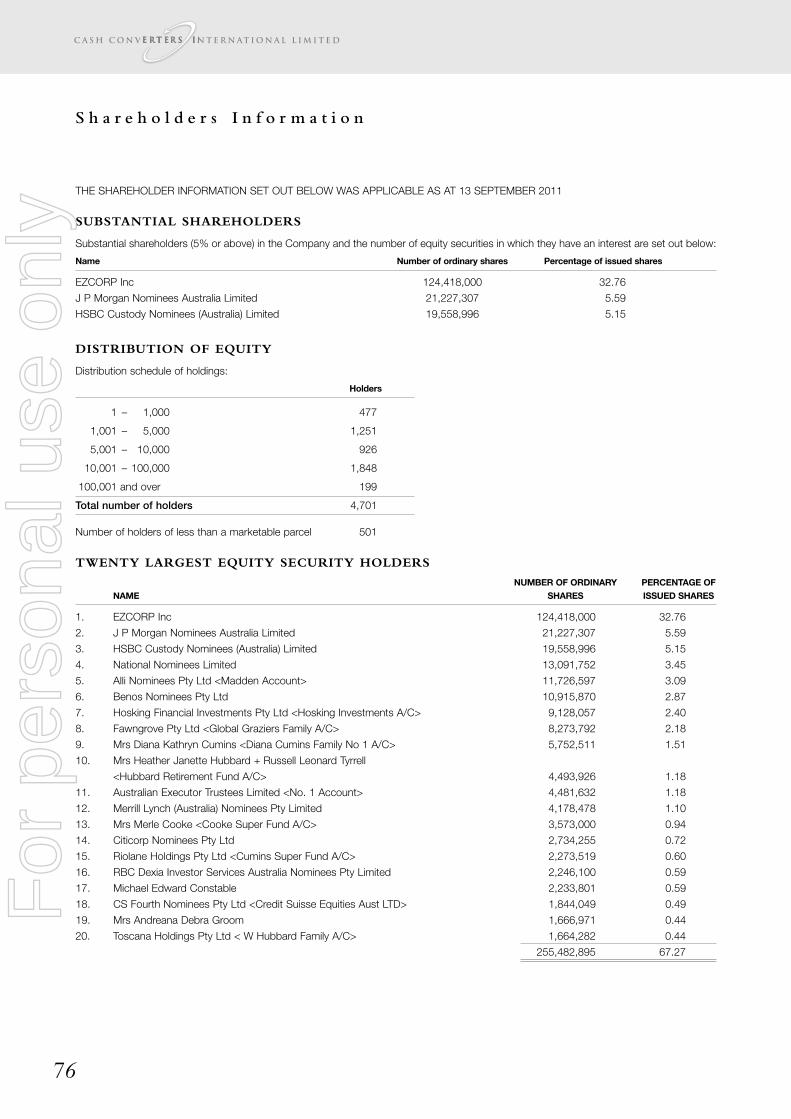
S h a r e h o l d e r s I n f o r m a t i o n
76
THE SHAREHOLDER INFORMATION SET OUT BELOW WAS APPLICABLE AS AT 13 SEPTEMBER 2011
SUBSTANTIAL SHAREHOLDERS
Substantial shareholders (5% or above) in the Company and the number of equity securities in which they have an interest are set out below:
Name Number of ordinary shares Percentage of issued shares
EZCORP Inc 124,418,000 32.76
J P Morgan Nominees Australia Limited 21,227,307 5.59
HSBC Custody Nominees (Australia) Limited 19,558,996 5.15
DISTRIBUTION OF EQUITY
Distribution schedule of holdings:
Holders
1 – 1,000 477
1,001 – 5,000 1,251
5,001 – 10,000 926
10,001 – 100,000 1,848
100,001 and over 199
Total number of holders 4,701
Number of holders of less than a marketable parcel 501
TWENTY LARGEST EQUITY SECURITY HOLDERS
NUMBER OF ORDINARY PERCENTAGE OFNAME SHARES ISSUED SHARES
1. EZCORP Inc 124,418,000 32.76
2. J P Morgan Nominees Australia Limited 21,227,307 5.59
3. HSBC Custody Nominees (Australia) Limited 19,558,996 5.15
4. National Nominees Limited 13,091,752 3.45
5. Alli Nominees Pty Ltd <Madden Account> 11,726,597 3.09
6. Benos Nominees Pty Ltd 10,915,870 2.87
7. Hosking Financial Investments Pty Ltd <Hosking Investments A/C> 9,128,057 2.40
8. Fawngrove Pty Ltd <Global Graziers Family A/C> 8,273,792 2.18
9. Mrs Diana Kathryn Cumins <Diana Cumins Family No 1 A/C> 5,752,511 1.51
10. Mrs Heather Janette Hubbard + Russell Leonard Tyrrell
<Hubbard Retirement Fund A/C> 4,493,926 1.18
11. Australian Executor Trustees Limited <No. 1 Account> 4,481,632 1.18
12. Merrill Lynch (Australia) Nominees Pty Limited 4,178,478 1.10
13. Mrs Merle Cooke <Cooke Super Fund A/C> 3,573,000 0.94
14. Citicorp Nominees Pty Ltd 2,734,255 0.72
15. Riolane Holdings Pty Ltd <Cumins Super Fund A/C> 2,273,519 0.60
16. RBC Dexia Investor Services Australia Nominees Pty Limited 2,246,100 0.59
17. Michael Edward Constable 2,233,801 0.59
18. CS Fourth Nominees Pty Ltd <Credit Suisse Equities Aust LTD> 1,844,049 0.49
19. Mrs Andreana Debra Groom 1,666,971 0.44
20. Toscana Holdings Pty Ltd < W Hubbard Family A/C> 1,664,282 0.44
255,482,895 67.27
For
per
sona
l use
onl
y

S h a r e h o l d e r s I n f o r m a t i o n
77
VOTING RIGHTS
All shares are one class with equal voting rights.
SHAREHOLDER INFORMATION
The shareholder information set out above was applicable as at 13 September 2011.
For
per
sona
l use
onl
y

For
per
sona
l use
onl
y