Embed Size (px)
Citation preview
2018 HALF YEAR REVIEW
SIX MONTHS TO 31 DECEMBER 2017
For
per
sona
l use
onl
y
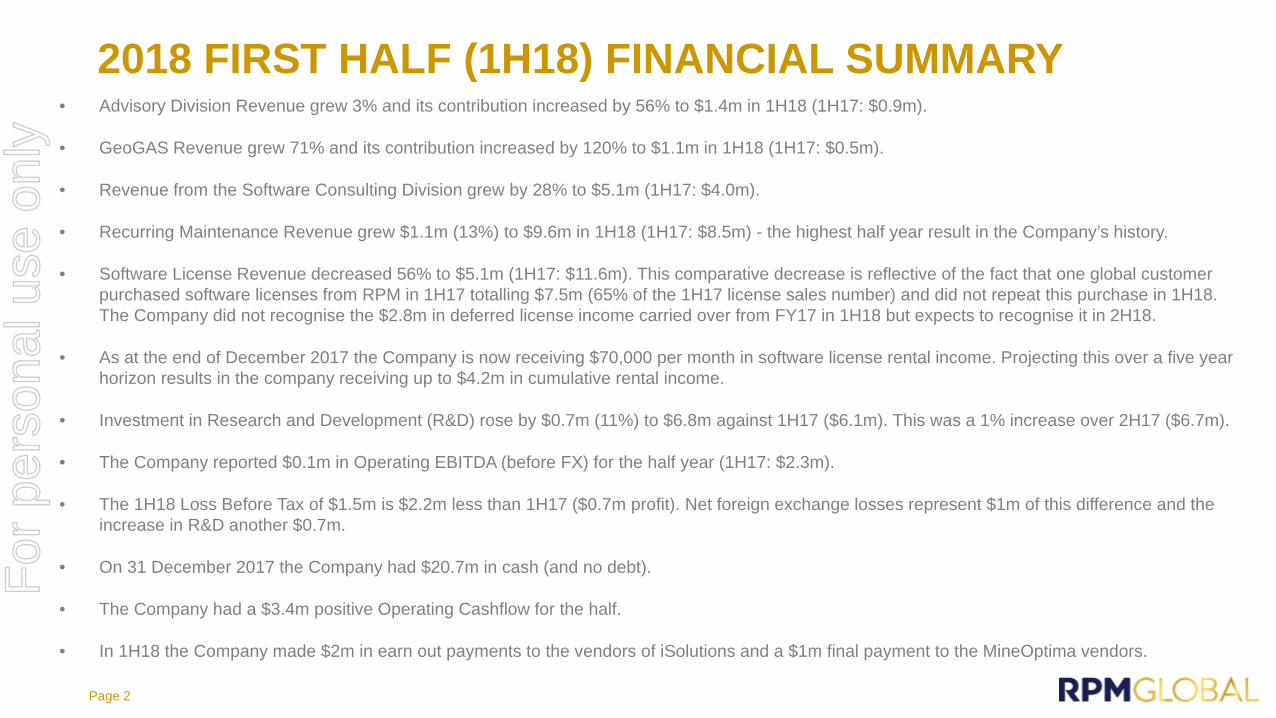
2018 FIRST HALF (1H18) FINANCIAL SUMMARY• Advisory Division Revenue grew 3% and its contribution increased by 56% to $1.4m in 1H18 (1H17: $0.9m).
• GeoGAS Revenue grew 71% and its contribution increased by 120% to $1.1m in 1H18 (1H17: $0.5m).
• Revenue from the Software Consulting Division grew by 28% to $5.1m (1H17: $4.0m).
• Recurring Maintenance Revenue grew $1.1m (13%) to $9.6m in 1H18 (1H17: $8.5m) - the highest half year result in the Company’s history.
• Software License Revenue decreased 56% to $5.1m (1H17: $11.6m). This comparative decrease is reflective of the fact that one global customer purchased software licenses from RPM in 1H17 totalling $7.5m (65% of the 1H17 license sales number) and did not repeat this purchase in 1H18. The Company did not recognise the $2.8m in deferred license income carried over from FY17 in 1H18 but expects to recognise it in 2H18.
• As at the end of December 2017 the Company is now receiving $70,000 per month in software license rental income. Projecting this over a five year horizon results in the company receiving up to $4.2m in cumulative rental income.
• Investment in Research and Development (R&D) rose by $0.7m (11%) to $6.8m against 1H17 ($6.1m). This was a 1% increase over 2H17 ($6.7m).
• The Company reported $0.1m in Operating EBITDA (before FX) for the half year (1H17: $2.3m).
• The 1H18 Loss Before Tax of $1.5m is $2.2m less than 1H17 ($0.7m profit). Net foreign exchange losses represent $1m of this difference and the increase in R&D another $0.7m.
• On 31 December 2017 the Company had $20.7m in cash (and no debt).
• The Company had a $3.4m positive Operating Cashflow for the half.
• In 1H18 the Company made $2m in earn out payments to the vendors of iSolutions and a $1m final payment to the MineOptima vendors.
Page 2
For
per
sona
l use
onl
y

1H18 OPERATIONAL HIGHLIGHTS• Five new products went live for the first time during the half:
• Open Cut Coal - Live at a number of mine sites in both South Africa and North America• XECUTE - Live at a USD$13 Billion greenfield site in the Canadian Oil Sands • Underground Metals - Live at a number of mines sites in Kazakhstan• Open Cut Phosphate - Live in Morocco• SIMULATE - Live in two of the largest global Original Equipment Manufacturers
• During 1H18 RPM released one significant new software product (Underground Metals), six major software upgrades and twenty-nine major functional upgrades. Considerable development time was also devoted to the new Steeply Dipping Coal product which RPM expects to release in 2H18.
• Sales of our recently released AMT Mobile App have quickly grown to over 3,500 users today and we expect this number to pass 20,000 users by the end of this calendar year.
• Following the first single site go live of our new combined AMT/XERAS solution in FY17 this offering is currently being rolled out at nine major mining sites around the world.
Page 3
For
per
sona
l use
onl
y

1H18 STRATEGIC HIGHLIGHTS• The Company welcomed nine new software customers in 1H18 all of whom purchased software for an initial small pilot site
with the expectation that if it goes well they will purchase more software and roll the product out to the rest of their operations. A number of these customers are long term Advisory clients and include:
• China’s largest and fastest growing global mining company
• The world’s fourth largest Gold company
• The world’s third largest Copper mine
• The world’s largest ‘premium aluminium’ producer and the biggest industrial company in the United Arab Emirates (outside of oil and gas)
• North America’s largest manufacturer of building products and materials
• In August 2017 RPM acquired MineOptima, a leading global private company whose software is used to design the optimal equipment access layouts for underground mines. 2H18 should see these products fully integrated into Underground Metals.
• RPM established a wholly owned subsidiary in Kazakhstan due to the amount of current and projected work the Company expects to complete in that country.
• In December RPM agreed to acquire MinVu, a mine-wide operational reporting and analytics solutions company to the mining industry.
Page 4
For
per
sona
l use
onl
y

MinVu ACQUISITION• On the 31st of January 2018 the Company acquired MinVu, a leading global private group of companies that provides
mine-wide operational reporting and analytics software solutions to the mining industry.
• Consideration for this transaction was made up of an upfront payment of $1.2 million, earn-out payments representing 50% of the existing MinVu product maintenance receipts for two years (which is estimated to be $1.28 million) and 3,000,000 RUL shares priced at 78 cents per share ($2.34 million).
• This acquisition is expected to provide RPM with annual revenue of $2.8 million (of which $1.3 million is recurring in nature), first year EDITDA of $1.2 million, accretive earning per share in 2018 and a meaningful increase in the breath of RPM’s software/service offering and customer base.
• MinVu provides RPM with a comprehensive suite of integration adaptors and data validation functionality. The integration adaptors feed operational data into a structured operational data store which are utilised by more than 250 standard reports and real time dashboards.
• The mining companies that use MinVu every day in their mining operations include BHP, Glencore, Anglo American, South32, Yancoal, US Steel, Canadian Natural Resources, PT Bumi, Ok Tedi, New Hope Corporation, Dominion Diamonds and Wesfarmers.
Page 5
For
per
sona
l use
onl
y

SOFTWARE DIVISION• The year on year decrease in licence revenue
is completely attributable to one customer not repeating a large software license order in 1H18.
• The Company did not recognise the $2.8m in deferred license income carried over from FY17 in 1H18 but expects to recognise it in 2H18.
• The software consulting Book of Work remains strong and the company is now hiring additional software implementation specialists.
• The Company is taking a careful and considered approach to its move to software rental pricing. Monthly rental as at the end of December 2017 is $70,000.
• Operating expenses decreased due to a reduction in sales commissions and as a result of restructuring decisions made in FY17.
• The Company expects annual Software Development costs to increase by 5% as a result of the MinVu acquisition.
Page 6
A$'m 1H18 2H17 $ Var % Var 1H17 $ Var % VarConsulting 5.1 5.0 0.1 2% 4.0 1.1 28%Licence 5.1 12.1 (7.0) (58)% 11.6 (6.5) (56)%Maintenance 9.6 9.0 0.6 7% 8.5 1.1 13%Software Revenue 19.8 26.1 (6.3) (24)% 24.1 (4.3) (18)%Direct Expenses (1.5) (2.4) 0.9 (38)% (1.6) 0.1 (6)%Net Revenue 18.3 23.7 (5.4) (23)% 22.5 (4.2) (19)%Operating Expenses (9.7) (11.5) 1.8 (16)% (11.2) 1.5 (13)%Gross Contribution 8.6 12.2 (3.6) (30)% 11.3 (2.7) (24)%
Software Development (6.8) (6.7) (0.1) 1% (6.1) (0.7) 11%Contribution 1.8 5.5 (3.7) (67)% 5.2 (3.4) (65)%
For
per
sona
l use
onl
y

ADVISORY DIVISION
• In 1H18 the Advisory Division achieved its highest half year contribution since December 2013 (when its revenue in that half was $16.2m).
• Gross utilisation of the team during 1H18 increased by 20% from 1H17 and 14% from 2H17. We are seeing employee utilisation continue to grow.
• The Advisory Book of Work visibility has increased from 2 to 3 weeks in July 2017 to 2 to 3 months in January 2018.
• Whilst the Company continues to use specialist sub contractors (where appropriate) it is hiring new high quality experts to broaden its domain knowledge and increase its in-house capability.
Page 7
A$'m 1H18 2H17 $ Var % Var 1H17 $ Var % VarAdvisory Revenue 10.7 10.0 0.7 7% 10.4 0.3 3%Direct Expenses (1.6) (2.1) 0.5 (24)% (1.9) 0.3 (16)%Net Revenue 9.1 7.9 1.2 15% 8.5 0.6 7%Operating Expenses (7.7) (7.8) 0.1 (1)% (7.6) (0.1) 1%Contribution 1.4 0.1 1.3 1300% 0.9 0.5 56%
For
per
sona
l use
onl
y

GeoGAS DIVISION
• In 1H18 the GeoGAS business achieved its highest half year contribution since December 2011 (when its revenue in that half was $5.1m).
• Gas consulting revenue grew on the back of the work the Company is currently completing for the Indian Government.
• Coal exploration in Australia is certainly recovering.
• The number of gas testing canisters out at customer sites remains high.
Page 8
A$'m 1H18 2H17 $ Var % Var 1H17 $ Var % Var Laboratory 2.0 1.5 0.5 33% 1.2 0.8 67% Consulting 0.4 0.3 0.1 33% 0.2 0.2 100%GeoGAS Revenue 2.4 1.8 0.6 33% 1.4 1.0 71%
Operating Expenses (1.3) (1.2) (0.1) 8% (0.9) (0.4) 44%Contribution 1.1 0.6 0.5 83% 0.5 0.6 120%
For
per
sona
l use
onl
y

FINANCIAL RESULTS SUMMARY
Page 9
A$'m 1H18 2H17 $ Var % Var 1H17 $ Var % VarRevenue 33.1 38.7 (5.6) (14)% 36.1 (3.0) (8)% Direct Costs (3.1) (4.5) 1.4 (31)% (3.5) 0.4 (11)%Net Operating Revenue 30.0 34.2 (4.2) (12)% 32.6 (2.6) (8)% Field Expenses (18.6) (20.3) 1.7 (8)% (19.8) 1.2 (6)% Development Expenses (6.8) (6.7) (0.1) 1% (6.1) (0.7) 11% Corporate Expenses (4.5) (4.9) 0.4 (8)% (4.4) (0.1) 2%Operating EBITDA 0.1 2.3 (2.2) (96)% 2.3 (2.2) (96)%FX gain/(loss) (0.2) (0.8) 0.6 (75)% 0.8 (1.0) -Depreciation & Amortisation (1.5) (1.4) (0.1) 7% (1.4) (0.1) 7%Net Finance Costs 0.1 0.1 - - 0.1 - -Operating Profit/(Loss) Before Tax (1.5) 0.2 (1.7) - 1.8 (3.3) -Significant One-off Items:Restructure - Staff & Acquistions - (0.1) 0.1 - (1.1) 1.1 -Loss before Tax (1.5) 0.1 (1.6) - 0.7 (2.2) -Net Loss After Tax (1.8) - (1.8) - - (1.8) -F
or p
erso
nal u
se o
nly

BALANCE SHEET
Page 10
A$'m Dec 17 Jun 17 $ Var % Var Cash 20.7 20.3 0.4 2% Receivables and WIP 14.4 26.6 (12.2) (46)% Property, Plant and Equipment 2.0 2.1 (0.1) (5)% Intangibles 7.4 7.5 (0.1) (1)% Goodwill 26.5 26.5 - - Deferred Tax 9.2 9.2 - - Prepayments, Deposits, etc 1.5 2.1 (0.6) (29)%Total Assets 81.7 94.3 (12.6) -13%
Trade Payables (4.0) (8.6) 4.6 (53)% Deferred and Contingent Consideration (3.8) (5.8) 2.0 (34)% Provisions - Employees (4.4) (4.1) (0.3) 7% Provisions - Onerous Leases & Make Good (0.9) (1.0) 0.1 (10)% Unearned Income (7.3) (11.9) 4.6 (39)% Lease Straightlining, etc (0.7) (1.1) 0.4 (36)%Total Liabilities (21.1) (32.5) 11.4 -
Share Capital 85.5 85.2 0.3 0% Reserves and Retained Earnings (24.9) (23.4) (1.5) 0.1Total Equity 60.6 61.8 (1.2) -2%
For
per
sona
l use
onl
y

CASH FLOW
Page 11
$'m 1H18 2H17 1H17Net Cash opening 20.3 19.4 18.1
Cash from Operations 3.4 3.7 (5.2)
Payments for:Restructure Costs - Staff - (0.2) (0.6)Restructure Costs - Premises (0.2) (0.2) (0.2)Restructure Costs - iSolutions - - (0.4)
(0.2) (0.4) (1.2)Payments for:Property Plant & Equipment (0.3) (0.4) (0.2)Software Acquisitions (3.0) (1.6) (6.7)
(3.3) (2.0) (6.9)Proceeds from:Capital Raising and Exercise of Options 0.3 - 14.4
Net Increase in Cash 0.2 1.3 1.1FX Restatement 0.2 (0.4) 0.2Net Cash Closing 20.7 20.3 19.4
For
per
sona
l use
onl
y

SOFTWARE PROGRESS UPDATE
Page 12
For
per
sona
l use
onl
y

STANDARDISE, SIMPLIFY & INTEGRATEDeliver a complete Commercial off the Shelf (COTS) Enterprise planning platform built on open industry standards.
Release a suite of simplified, standardised and integrated scheduling solutions for different commodities and mining methods built on the same product architecture.
Provide software solutions that deliver a step change in mine planning, execution and value chain optimisation through investments in innovation.
Page 13
For
per
sona
l use
onl
y

OUR PLAN COMPLIANCE JOURNEY
Page 14
Enterprise Planning Framework
Financial Budgeting
20192013 2018
Mine Planning Software
Shift Operations
Equipment Utilisation
Maintenance Systems
Short Interval Control (Plan Compliance)
IP Acquired IP Acquired
IP Acquired
Acquired
IP Acquired
Acquired
Acquired
For
per
sona
l use
onl
y

Page 15
THE CONNECTED MINEF
or p
erso
nal u
se o
nly

Open Pit Metals Oil Sands Open Pit
Diamonds Quarry Open Cut Phosphate
Stratigraphic Metals
Open Cut Coal
Underground Metals
Steeply Dipping Coal
Underground Coal
COMMODITY BASED SOLUTIONS DEVELOPMENT CYCLE
Page 16
2013
2014
2013 2014 2015 2016 2017 2018 09/18
HaulageRoutes
HaulageRoutes
HaulageRoutes
Interactive Scheduler
Automatic Destination Scheduling
Automatic Scheduler
Reserver
Product Optimiser
Commodity & Mining Method User Interface
High Performance
Database
Enterprise Integration
Systematic Mine Planning
Solution –One Single
Solution
Base Scheduling Engine
Scripting
Com
petit
ive
Offe
ring
Plan
ning
Hor
izon
RPM
Offering
Planning Horizon
For
per
sona
l use
onl
y

NEW PRODUCT ADOPTION - FY2018
Page 17
For
per
sona
l use
onl
y

OUTLOOKContinued strong commodity prices is providing mining companies with confidence to investigate new sources of resource supply. As a result our Advisory division (which focused hard on retaining its premium brand in the market through five tough years of trading) has seen a major increase in jobs won and therefore employee utilisation. This division had an exceptional second quarter which we expect to see continue through the rest of this financial year given their current Book of Work.
Our GeoGAS division traded strongly in 1H18 as coal miners on the East Coast of Australia restarted their exploration drilling programmes. Given the number of gas testing canisters which are currently out on customers sites we expect the level of exploration testing to remain high while coal prices remain strong.
The Board and Management remain excited about the momentum of RPM’s Software division and in particular the number of new customers (nine in 1H18) who have purchased RPM’s software for the first time. We believe that as these customers become more familiar with our software products and the value they can extract from them they will look to roll these products out across the rest of their global operations.
Mining companies who are benefiting from stronger commodity prices are investing greater amounts into equipment maintenance and maintenance strategy software such as AMT. These companies are now actively turning their minds to the use of real time data to measure and manage the actual performance data from their mining equipment against the company’s daily mining plans. After the acquisition of the MinVu product suite (which includes a full suite of integration APIs and validation logic) RPM is ideally placed to address this challenge following five years of investment in its enterprise integration platform and acquisition of a copy of the Fewzion short interval control user interface and workflows.
Page 18
For
per
sona
l use
onl
y

The material in this presentation is a summary of the results of RPMGlobal Holdings Limited (RPM) for the six months ended 31 December 2017
including historical financial information from prior half year’s results as announced to the market and an update on RPM’s business and activities
and is current at the date of preparation, 16 February 2018. Further details are provided in RPM’s Appendix 4D - Half Yearly Results - 31
December 2017 released on 19 February 2018 and RPM’s Appendix 4E and Annual Report for the full year ended 30 June 2017 released on 28
August 2017.
This presentation provides information in summary form only and is not intended to be complete. It is not intended to be relied upon as advice to
investors or potential investors and does not take into account the investment objectives, financial situation or needs of any particular investor.
No representation, express or implied, is made as to the fairness, accuracy, completeness or correctness of information contained in this
presentation, including the accuracy, likelihood of achievement or reasonableness of any forecasts, prospects, returns or statements in relation to
future matters contained in the presentation (“forward-looking statements”). Such forward-looking statements are by their nature subject to
significant uncertainties and contingencies and are based on a number of estimates and assumptions that are subject to change (and in many
cases are outside the control of RPM and its Directors and Officers) which may cause the actual results or performance of RPM to be materially
different from any future results or performance expressed or implied by such forward-looking statements.
Due care and consideration should be undertaken when considering and analysing RPM’s financial performance. All references to dollars are to
Australian Dollars unless otherwise stated.
To the maximum extent permitted by law, neither RPM nor its related corporations, Directors, Officers, employees or agents, nor any other person,
accepts any liability, including, without limitation, any liability arising from fault or negligence, for any loss arising from the use of this presentation
or its contents or otherwise arising in connection with it. This presentation should be read in conjunction with other publicly available material
including but not limited to RPM’s Appendix 4D - Half Yearly Results - 31 December 2017 released on 19 February 2018 and RPM’s Appendix 4E
and Annual Report for the full year ended 30 June 2017 released on 28 August 2017. Further information including historical results and a
description of the activities of RPM is available on our website, www.rpmglobal.com.
RPMGlobal and the RPM software products and services referenced in this presentation are the registered and unregistered trademarks of
RPMGlobal Holdings Limited. The material in this presentation is the copyright of RPMGlobal Holdings Limited and may not be re-used in whole or
in part without the prior consent of RPM.
For
per
sona
l use
onl
y


![[FINAL ONLINE] CNPF 1H18 Investor Presentation](https://img.pdfslide.us/doc/110x75/622da732490085282e59227e/final-online-cnpf-1h18-investor-presentation.jpg)