Embed Size (px)
Citation preview

FY2020 HALF YEAR REVIEW
For
per
sona
l use
onl
y

For
per
sona
l use
onl
y

For
per
sona
l use
onl
y

Diversified Client BaseF
or p
erso
nal u
se o
nly

For
per
sona
l use
onl
y

Historical Comparative Revenue by Division(FY2013 v FY2019 Comparative)
For
per
sona
l use
onl
y

Our Intelligent Mining Platform
- 7
For
per
sona
l use
onl
y

For
per
sona
l use
onl
y

FINANCIAL SUMMARY
* The operating expenses, depreciation and finance income in 1H20 in this report are presented under the new standard AASB 16.
A$'m 1H20 2H19 $ Var % Var 1H19 $ Var % Var Subscriptions 3.9 1.6 2.3 144% 0.8 3.1 388% Annual Software Support 10.9 10.9 - - 10.9 - - Perpetual Licences 2.6 7.0 (4.4) (63)% 5.0 (2.4) (48)% Laboratory Testing 2.3 2.2 0.1 5% 2.0 0.3 15% Advisory and Consulting Services 21.4 21.4 - - 17.7 3.7 21%Revenue 41.1 43.1 (2.0) (5)% 36.4 4.7 13% Direct Costs (4.6) (3.9) (0.7) 18% (3.0) (1.6) 53%Net Operating Revenue 36.5 39.2 (2.7) (7)% 33.4 3.1 9% Field Expenses (21.7) (21.8) 0.1 - (20.7) (1.0) 5% Development Expenses (5.8) (6.4) 0.6 (9)% (6.4) 0.6 (9)% Corporate Expenses (4.4) (4.5) 0.1 (2)% (4.2) (0.2) 5% Rent Expenses * (0.3) (1.8) 1.5 (83)% (1.7) 1.4 (82)%Operating EBITDA 4.3 4.7 (0.4) (9)% 0.4 3.9 975% Depreciation & Amortisation * (3.2) (2.0) (1.2) 60% (2.0) (1.2) 60% Foreign Exchange Gains/(Losses) (0.2) 0.1 (0.3) - 0.5 (0.7) - Net Finance and Fair Value Costs * (0.1) 0.1 (0.2) - (0.1) - -Operating Profit/(Loss) Before Tax 0.8 2.9 (2.1) (72)% (1.2) 2.0 -Net Profit/(Loss) After Tax 0.5 (4.2) 4.7 - (1.7) 2.2 -F
or p
erso
nal u
se o
nly

FINANCIAL SUMMARY NARRATIVE
• Gross revenue increased by 13% and net revenue increased by 9% on the prior corresponding half year.
• The Advisory and consulting division’s net revenue grew 21% over 1H19, with the division’s financial contribution increasing by $1.5m to $2.1m (1H19: $0.6m) and its contribution as a percentage of net revenue growing 216% to 19% (1H19: 6%).
• The Software division’s net revenue grew by 4% on the prior corresponding half with perpetual license sales dropping 48%, subscription revenue growing 388% and both support revenue and consulting revenue remaining steady.
• The Company’s Annual Recurring Revenue (ARR) from software subscriptions at the date of this report is $10.7m p.a. up from $4.3m at 30 June 2019.
• The Company’ Total Contracted Value (TCV) from new software subscriptions sold year-to-date is $21.5m of which only $1.8m was recognised in the first half year financials.
• The Company has sold $4.1m year-to-date of new perpetual license sales of which only $3.5m will be recognised in FY2020.
• Research and Development costs dropped 9% from the previous half year to $5.8m.
• Operating costs (excluding rent) increased by only 2% to $31.9m (1H19: $31.3m).
• Operating EBITDA increased by $3.9m to $4.3m (1H19: $0.4m).
• As at 31 December 2019, the Company had $24.6m in cash (and no debt) after having paid out $1.9m in acquisition earn-outs (iSolutions: $1.7m, MinVu: $0.2m) during 1H20. The remaining value of acquisition earn-outs is $0.8M. As at the date of this report the Company has $32.9m in cash (and no debt).
• Cash outflow from operations for the first six months (which is always a lower cashflow half due to the majority of annual software support payments (approximately $20m) being received in the second half) was $0.7m.
For
per
sona
l use
onl
y

BALANCE SHEETA$'m Dec-19 Jun-19 $ Var % Var Cash 24.6 28.2 (3.6) (13)% Receivables and WIP 19.9 23.9 (4.0) (17)% Property, Plant and Equipment 2.1 1.7 0.4 24% Right-of-Use Assets 4.3 - 4.3 - Intangibles 32.8 34.2 (1.4) (4)% Deferred Tax 2.7 2.7 - - Prepayments, Deposits, etc 3.9 2.8 1.1 39%Total Assets 90.3 93.5 (3.2) (3)%
Trade Payables (5.5) (7.9) 2.4 (30)% Provisions - Employees (5.4) (5.2) (0.2) 4% Provisions - Other (0.3) (0.6) 0.3 (50)% Contingent Consideration (0.8) (2.4) 1.6 (67)% Unearned Income (12.1) (17.1) 5.0 (29)% Right-of-Use Lease Liabilities (4.7) - (4.7) - Tax payable, lease incentives (0.2) (0.6) 0.4 (67)%Total Liabilities (29.0) (33.8) 4.8 (14)%
Share Capital 88.8 87.9 0.9 1% Reserves and Accumulated Losses (27.5) (28.2) 0.7 (2)%Total Equity 61.3 59.7 1.6 3%
For
per
sona
l use
onl
y

CASHFLOW$'m 1H20 2H19 1H19
Net Cash Opening 28.2 19.9 23.3
Cash from Operations (0.7) 10.1 -Rent (1.4) (1.4) (1.4)
Payments for:Property Plant & Equipment (0.6) (0.4) (0.3)Software Acquisitions (2.0) (0.5) (2.3)
(2.6) (0.9) (2.6)Proceeds from:Exercise of Options 0.9 0.1 0.1
Net Increase/(Decrease) in Cash (3.8) 7.9 (3.9)FX Restatement 0.2 0.4 0.5Net Cash Closing 24.6 28.2 19.9F
or p
erso
nal u
se o
nly

MANAGEMENT COMMENTSWe continue to see a smooth transition from perpetual software license sales to multi-year subscription revenue. Pleasingly in 1H20 the Company’s underlying EBITDA ($4.3m) was greater than the value of one-off perpetual license sales ($2.6m) meaning the Company is not dependent on perpetual licenses to be EBITDA positive.
The move to subscription revenue continues to gain momentum with the Company's calendar year 2020 pipeline of subscription deals particularly strong especially for the new products which have been released to the market in recent years.
We are very pleased with the momentum of :
• RPM’s Short Interval Control product (XECUTE) which has been purchased by six customers in FY2020 to-date and has a very impressive pipeline; and
• RPM’s Enterprise Simulation product (SIMULATE) which is quickly becoming the de-facto standard for the Global Original EquipmentManufacturers (OEMs) after previous years’ sales to Volvo (2015), Komatsu (2017), Hitachi (2018) and more recently Caterpillar (early 2020).
The Company has added eleven (11) new software customers this year and expects that number to increase.
Significant progress has been made on the development of our new Design products with the release of “Underground Metals” in 1H20 and the soon to be released “Open Pit” and “Underground Coal” versions.
The Company is extremely pleased with the market response to these innovative, state-of-the-art and ground-breaking products. In management’s view, there is little doubt that these parametric design-based products will change the way mine engineers visualise and evaluate multiple mining scenarios so as to identify the most economic and profitable mine plan available to them.
For
per
sona
l use
onl
y

SOFTWARE DIVISIONA$'m 1H20 2H19 $ Var % Var 1H19 $ Var % VarConsulting 6.4 6.2 0.2 3% 6.4 - -Subscriptions 3.9 1.6 2.3 144% 0.8 3.1 388%Perpetual Licences 2.6 7.0 (4.4) (63)% 5.0 (2.4) (48)%Support 10.9 10.9 - - 10.9 - -Software Revenue 23.8 25.7 (1.9) (7)% 23.1 0.7 3%Direct Expenses (0.9) (0.6) (0.3) 50% (1.1) 0.2 (18)%Net Revenue 22.9 25.1 (2.2) (9)% 22.0 0.9 4%Operating Expenses (12.0) (12.3) 0.3 (2)% (11.5) (0.5) 4%Gross Contribution 10.9 12.8 (1.9) (15)% 10.5 0.4 4%
Software Development (5.8) (6.4) 0.6 (9)% (6.4) 0.6 (9)%Contribution 5.1 6.4 (1.3) (20)% 4.1 1.0 24%
For
per
sona
l use
onl
y

SOFTWARE STRATEGY
Deliver a complete Commercial-off-the-Shelf Enterprise Planning Framework built on open industry standards.
Release simplified, standardised, integrated and optimised solutions for different commodities and mining methods which cover the full mining value chain.
Provide software solutions that deliver a step change in mining productivity through investments in innovation.
For
per
sona
l use
onl
y

For
per
sona
l use
onl
y

NEW PRODUCT ADOPTION - FY2020F
or p
erso
nal u
se o
nly

For
per
sona
l use
onl
y

Parametric modelling and design allows users to change key parameters in a
complex system and understand the impact of those changes
Parametric modelling and design is not new in other industries (for example
construction) however until now it has not been harnessed within mining
Parametric modelling / designF
or p
erso
nal u
se o
nly

Design – Underground MetalsF
or p
erso
nal u
se o
nly

Design – Open Pit MetalsF
or p
erso
nal u
se o
nly
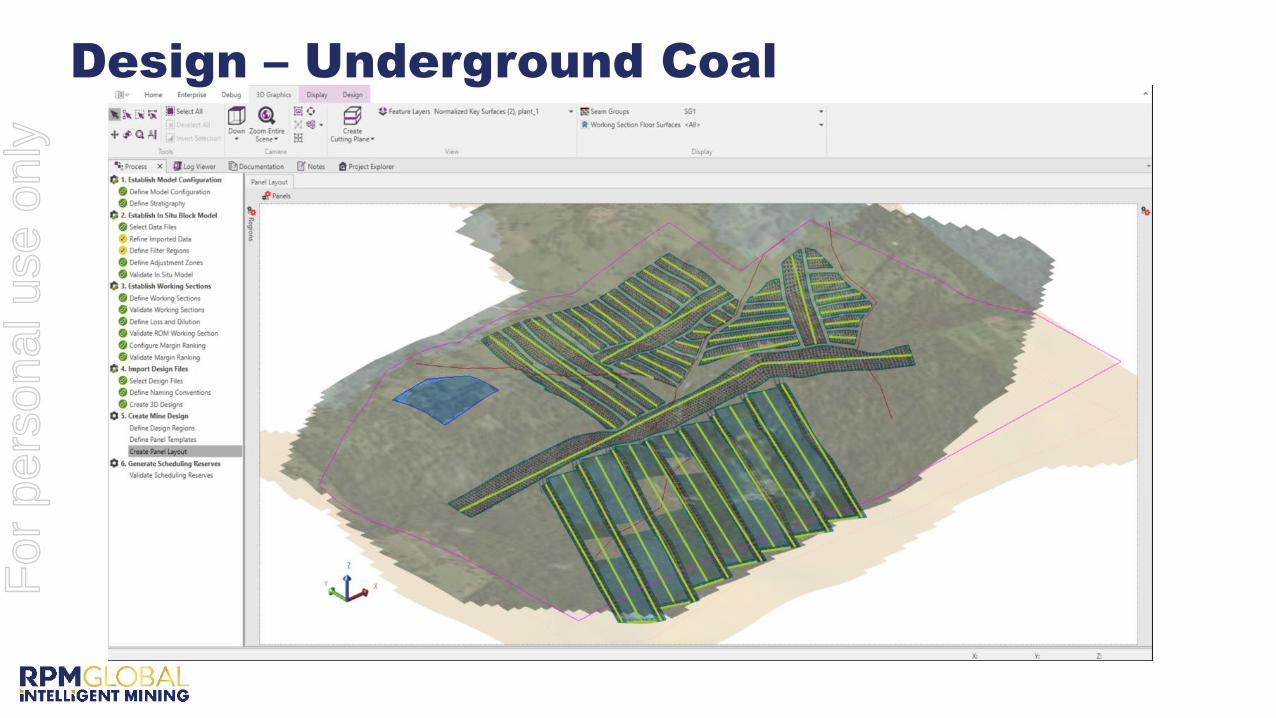
Design – Underground CoalF
or p
erso
nal u
se o
nly

OUTLOOK
The move to software subscription licensing is likely to accelerate as we offer this pricing alternative to our current customers.
The slow but steady acceptance by mining companies of technical enterprise software products plays to our competitive strengths and endorses the investments we have made over the last six years.
We remain confident that our mobile equipment simulation products (HAULSIM / SIMULATE) will become the de-facto standard for the industry in calendar year 2020 and believe our ultra-short term scheduling product (XECUTE) has the same potential over the next few years.
The decision to extend our offerings into the area of “Design” (which we announced in March 2019) is proving to be a positive one. Given the feedback we have received from mining companies we now believe these software offerings will over time replace the common outdated approaches of the past.
Six months ago we said “It feels like we are one year through a two-to-three year subscription transition” it now feels like “we only have another four months to go”.
For
per
sona
l use
onl
y

The material in this presentation is a summary of the results of RPMGlobal Holdings Limited (RPM) for the six months ended 31 December
2019 including historical financial information from prior half year’s results as announced to the market and an update on RPM’s business and
activities and is current at the date of preparation, 24 February 2020. Further details are provided in RPM’s Appendix 4D - Half Yearly Results
- 31 December 2019 released to the market on 24 February 2020 and RPM’s Appendix 4E and Annual Report for the full year ended 30 June
2019 released on 23 August 2019.
This presentation provides information in summary form only and is not intended to be complete. It is not intended to be relied upon as advice
to investors or potential investors and does not take into account the investment objectives, financial situation or needs of any particular
investor.
No representation, express or implied, is made as to the fairness, accuracy, completeness or correctness of information contained in this
presentation, including the accuracy, likelihood of achievement or reasonableness of any forecasts, prospects, returns or statements in
relation to future matters contained in the presentation (“forward-looking statements”). Such forward-looking statements are by their nature
subject to significant uncertainties and contingencies and are based on a number of estimates and assumptions that are subject to change
(and in many cases are outside the control of RPM and its Directors and Officers) which may cause the actual results or performance of RPM
to be materially different from any future results or performance expressed or implied by such forward-looking statements.
Due care and consideration should be undertaken when considering and analysing RPM’s financial performance. All references to dollars are
to Australian Dollars unless otherwise stated.
To the maximum extent permitted by law, neither RPM nor its related corporations, Directors, Officers, employees or agents, nor any other
person, accepts any liability, including, without limitation, any liability arising from fault or negligence, for any loss arising from the use of this
presentation or its contents or otherwise arising in connection with it. This presentation should be read in conjunction with other publicly
available material including but not limited to RPM’s Appendix 4D - Half Yearly Results - 31 December 2019 released to the market on 24
February 2020 and RPM’s Appendix 4E and Annual Report for the full year ended 30 June 2019 released on 23 August 2019. Further
information including historical results and a description of the activities of RPM is available on our website, www.rpmglobal.com.
RPMGlobal and the RPM software products and services referenced in this presentation are the registered and unregistered trademarks of
RPMGlobal Holdings Limited. The material in this presentation is the copyright of RPMGlobal Holdings Limited and may not be re-used in
whole or in part without the prior consent of RPM.
For
per
sona
l use
onl
y