Embed Size (px)
Citation preview
BUREY GOLD LIMITEDABN 14113517203
ANNUAL FINANCIAL REPORT2016F
or p
erso
nal u
se o
nly
Burey Gold LimitedCorporate Directory
Page 1
Directors Klaus EckhofMark CalderwoodSusmit ShahKevin Thomson
Company Secretary Susmit Shah
Registered and AdministrativeOffice
Level 2, Suite 9389 Oxford StreetMt Hawthorn Western Australia 6016
PO Box 281Mt Hawthorn Western Australia 6915Telephone: (61 8) 9381 2299Facsimile: (61 8) 9380 6761
Auditors BDO Audit (WA) Pty Ltd38 Station StreetSubiaco Western Australia 6008
Share Registry Advanced Share Registry Limited110 Stirling HighwayNedlands Western Australia 6009Telephone: (61 8) 9389 8033Facsimile: (61 8) 9262 3723
Website: www.bureygold.com
Securities trade on the Australian Securities Exchange – BYR
For
per
sona
l use
onl
y
Burey Gold LimitedContentsFor the year ended 30 June 2016
Page 2
Review of Operations 3
Directors’ Report 11
Auditor’s Independence Declaration 23
Consolidated Statement of Comprehensive Income 24
Consolidated Statement of Financial Position 25
Consolidated Statement of Changes in Equity 26
Consolidated Statement of Cash Flows 28
Notes to the Consolidated Financial Statements 29
Directors’ Declaration 58
Independent Audit Report 59
For
per
sona
l use
onl
y
Burey Gold LimitedReview of OperationsFor the year ended 30 June 2016
Page 3
REVIEW OF OPERATIONS
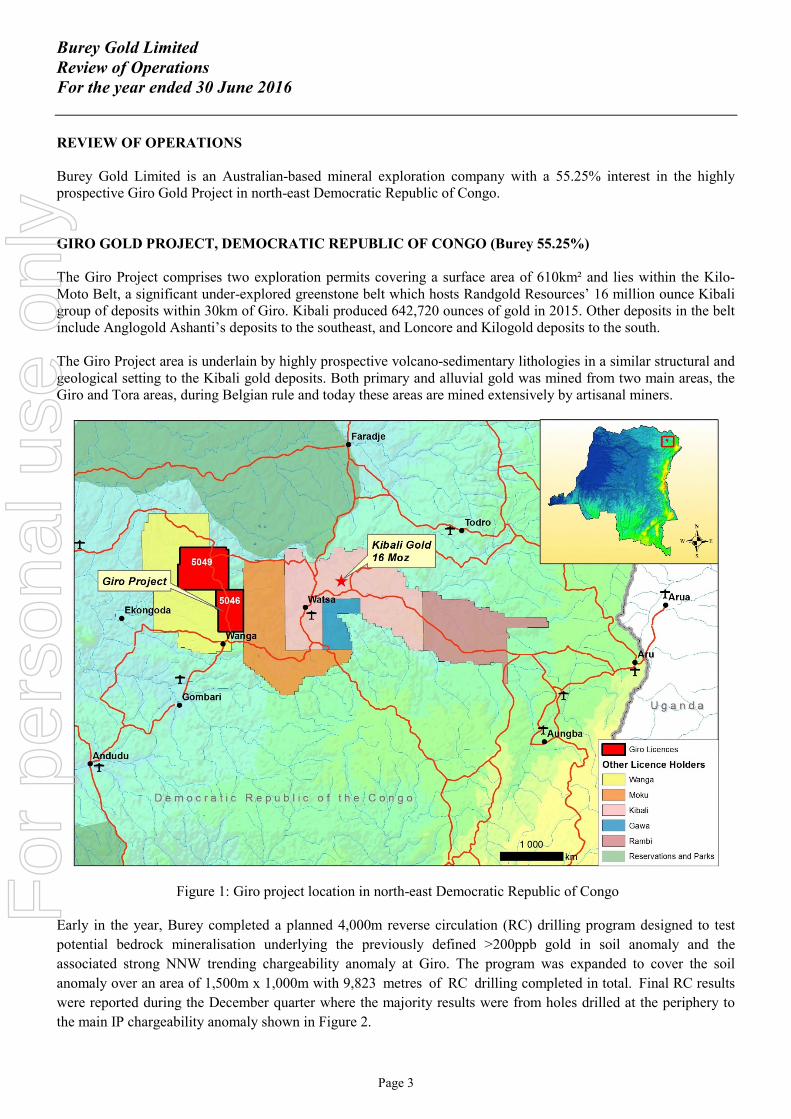
Burey Gold Limited is an Australian-based mineral exploration company with a 55.25% interest in the highlyprospective Giro Gold Project in north-east Democratic Republic of Congo.
GIRO GOLD PROJECT, DEMOCRATIC REPUBLIC OF CONGO (Burey 55.25%)
The Giro Project comprises two exploration permits covering a surface area of 610km² and lies within the Kilo-Moto Belt, a significant under-explored greenstone belt which hosts Randgold Resources’ 16 million ounce Kibaligroup of deposits within 30km of Giro. Kibali produced 642,720 ounces of gold in 2015. Other deposits in the beltinclude Anglogold Ashanti’s deposits to the southeast, and Loncore and Kilogold deposits to the south.
The Giro Project area is underlain by highly prospective volcano-sedimentary lithologies in a similar structural andgeological setting to the Kibali gold deposits. Both primary and alluvial gold was mined from two main areas, theGiro and Tora areas, during Belgian rule and today these areas are mined extensively by artisanal miners.
Figure 1: Giro project location in north-east Democratic Republic of Congo
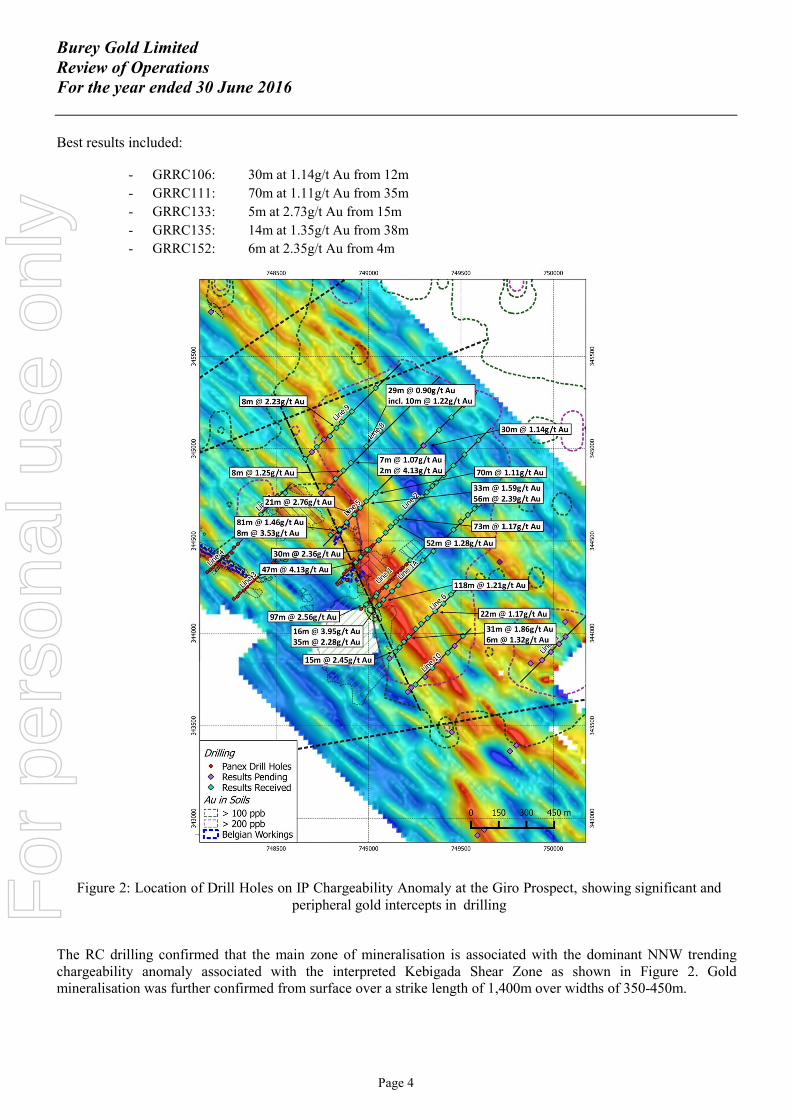
Early in the year, Burey completed a planned 4,000m reverse circulation (RC) drilling program designed to test
potential bedrock mineralisation underlying the previously defined >200ppb gold in soil anomaly and the
associated strong NNW trending chargeability anomaly at Giro. The program was expanded to cover the soil
anomaly over an area of 1,500m x 1,000m with 9,823 metres of RC drilling completed in total. Final RC results
were reported during the December quarter where the majority results were from holes drilled at the periphery to
the main IP chargeability anomaly shown in Figure 2.
For
per
sona
l use
onl
y
Burey Gold LimitedReview of OperationsFor the year ended 30 June 2016
Page 4
Best results included:
- GRRC106: 30m at 1.14g/t Au from 12m
- GRRC111: 70m at 1.11g/t Au from 35m
- GRRC133: 5m at 2.73g/t Au from 15m
- GRRC135: 14m at 1.35g/t Au from 38m
- GRRC152: 6m at 2.35g/t Au from 4m
Figure 2: Location of Drill Holes on IP Chargeability Anomaly at the Giro Prospect, showing significant andperipheral gold intercepts in drilling
The RC drilling confirmed that the main zone of mineralisation is associated with the dominant NNW trendingchargeability anomaly associated with the interpreted Kebigada Shear Zone as shown in Figure 2. Goldmineralisation was further confirmed from surface over a strike length of 1,400m over widths of 350-450m.
For
per
sona
l use
onl
y
Burey Gold LimitedReview of OperationsFor the year ended 30 June 2016
Page 5
During the December Quarter, the Company commenced a diamond drilling program to test the continuity of goldmineralisation at depth below the RC drilling at the Kebigada Shear Zone. The drilling also aimed to definestructural controls on mineralisation and define any plunge component associated with the intersection of the twodominant structural trends identified in the IP survey. Two holes were also planned to intersect the Giro Veinwhich was mined previously during Belgian colonial rule at depth. Additional diamond drill holes were planned totest the mineralised potential of Mangote, a high grade zone of mineralisation mined historically by the Belgians,the Peteku granite and the Adoku artisanal workings.
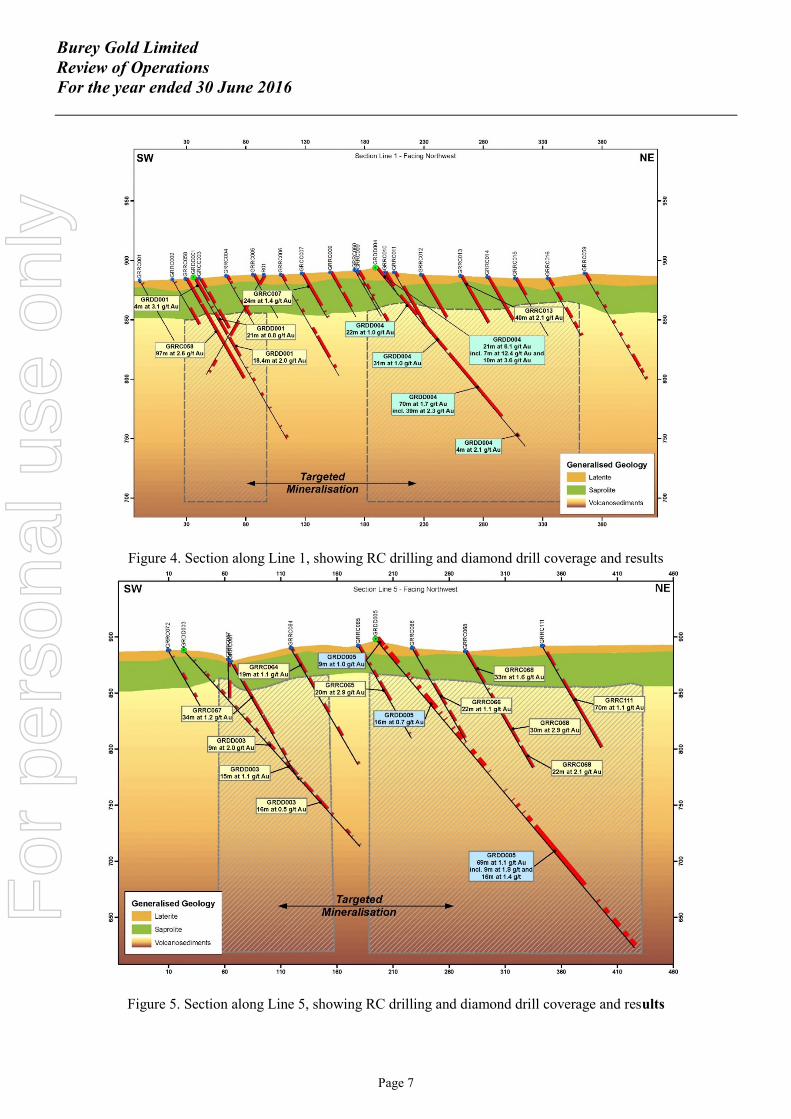
Five holes were completed for 1,221 metres at the Kebigada Shear Zone as shown in Figure 3 and in section inFigures 4 and 5. Comparison of drill core and RC drill chips from adjacent holes show that a strong correlationexists between gold mineralisation and silica flooding and pyrite and occasional narrow quartz veins and stringers.Pyrite is either disseminated or occurs as fine laminae parallel to the foliation which is perpendicular to theorientation of the drill holes. Specks of visible gold were noted along quartz filled fractures in 2 holes at Kebigada.
All holes intersected at least one broad zone of silica alteration and pyrite mineralisation often exceedingthicknesses of 100m. Many diamond holes ended in mineralisation with GRDD005 ending in mineralisation at361m due to rig limitations confirming mineralisation is open at depths exceeding 250 vertical metres showingcontinuity at depth. Structural measurements of the orientated core suggest mineralisation has two distinctorientations, namely a strong NNW orientation as shown in the IP gradient array survey and a W-E to ESEorientation interpreted from measurements of pyrite and chalcopyrite laminae in the core and associated gold grade.
Two holes for 310 metres were drilled to intersect the Giro vein mined by the Belgians at roughly 100m depth.Drilling was completed during the first two weeks of January 2016. Mineralisation detected was typically within anarrow sheared, mylonitic zone with narrow quartz veins with significant visible gold was noted in GRDD007.
Significant results from the diamond drilling at Kebigada and Giro Vein targets included:
• GRDD001: 23.5m at 3.07g/t Au from 0.5m, including 13.6m at 4.73g/t Au from 4.4m
• GRDD001: 18.4m at 2.02g/t Au from 59.1m
• GRDD002: 38.1m at 2.53g/t Au from 191m including 30.6m at 3.00g/t Au from 198.5m
• GRDD004: 21.0m at 6.06g/t Au from 0m including 7.0m at 12.44g/t Au from 0m; and10.0m at 3.55g/t Au from 11m; and69.6m at 1.67g/t Au including 39m at 2.3g/t Au from 94.9m
• GRDD005: 68.79m at 1.08g/t Au from 218.8m including 36.71m at 1.40g/t Au from 226.39m
For
per
sona
l use
onl
y
Burey Gold LimitedReview of OperationsFor the year ended 30 June 2016
Page 6
Figure 3: Drill hole location map showing extent of the soil anomalies, extent of mineralisation, better results at
Kebigada and Giro Vein Prospects and Belgian workings
Diamond results at the Giro Vein target were reported during the March quarter and confirmed the presence of anarrow (<1m) very high grade quartz vein mined by the Belgians. This is seen in diamond hole GRDD007 whichreported 0.7m at 37.50g/t Au from 103.5m. The core half which did not go into the sample for assay showedappreciable visible gold and might have assayed considerably higher than the reported intercept. Burey’s technicalteam is of the opinion that the Giro Vein can be re-investigated at a later stage because of its low tonnage potential.
For
per
sona
l use
onl
y
Burey Gold LimitedReview of OperationsFor the year ended 30 June 2016
Page 7
Figure 4. Section along Line 1, showing RC drilling and diamond drill coverage and results
Figure 5. Section along Line 5, showing RC drilling and diamond drill coverage and results
For
per
sona
l use
onl
y
Burey Gold LimitedReview of OperationsFor the year ended 30 June 2016
Page 8
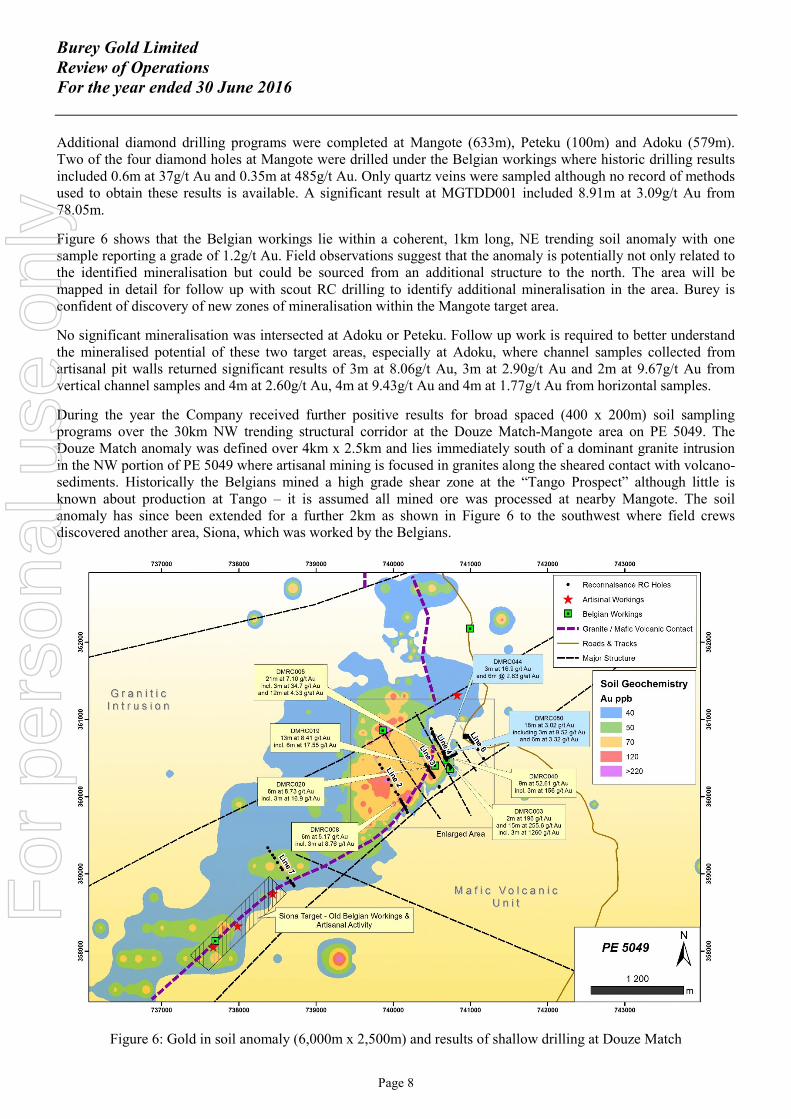
Additional diamond drilling programs were completed at Mangote (633m), Peteku (100m) and Adoku (579m).Two of the four diamond holes at Mangote were drilled under the Belgian workings where historic drilling resultsincluded 0.6m at 37g/t Au and 0.35m at 485g/t Au. Only quartz veins were sampled although no record of methodsused to obtain these results is available. A significant result at MGTDD001 included 8.91m at 3.09g/t Au from78.05m.
Figure 6 shows that the Belgian workings lie within a coherent, 1km long, NE trending soil anomaly with onesample reporting a grade of 1.2g/t Au. Field observations suggest that the anomaly is potentially not only related tothe identified mineralisation but could be sourced from an additional structure to the north. The area will bemapped in detail for follow up with scout RC drilling to identify additional mineralisation in the area. Burey isconfident of discovery of new zones of mineralisation within the Mangote target area.
No significant mineralisation was intersected at Adoku or Peteku. Follow up work is required to better understandthe mineralised potential of these two target areas, especially at Adoku, where channel samples collected fromartisanal pit walls returned significant results of 3m at 8.06g/t Au, 3m at 2.90g/t Au and 2m at 9.67g/t Au fromvertical channel samples and 4m at 2.60g/t Au, 4m at 9.43g/t Au and 4m at 1.77g/t Au from horizontal samples.
During the year the Company received further positive results for broad spaced (400 x 200m) soil samplingprograms over the 30km NW trending structural corridor at the Douze Match-Mangote area on PE 5049. TheDouze Match anomaly was defined over 4km x 2.5km and lies immediately south of a dominant granite intrusionin the NW portion of PE 5049 where artisanal mining is focused in granites along the sheared contact with volcano-sediments. Historically the Belgians mined a high grade shear zone at the “Tango Prospect” although little isknown about production at Tango – it is assumed all mined ore was processed at nearby Mangote. The soilanomaly has since been extended for a further 2km as shown in Figure 6 to the southwest where field crewsdiscovered another area, Siona, which was worked by the Belgians.
Figure 6: Gold in soil anomaly (6,000m x 2,500m) and results of shallow drilling at Douze Match
For
per
sona
l use
onl
y
Burey Gold LimitedReview of OperationsFor the year ended 30 June 2016
Page 9
A 3,500m shallow reverse circulation (RC) scout drilling commenced at Douze Match in early June with first holesdrilled across the Belgian “Tango” workings. The drilling program tested potential underlying mineralisation over1km of the 4km soil anomaly. Early results from the program were encouraging, with coarse visible gold pannedover a 5m interval in DMRC003 from a zone comprised mostly of black quartz veining in ferruginous saprolitebetween 12m and 17m. A 1m cavity was intersected within the zone and is assumed to originate from historicBelgian workings. Visible gold was also identified within the laterite zone in DMRC004.
Results for the first 10 RC holes for 490m on Lines 2 and 4 (as shown in Figure 6) returned exceptional gradesincluding:
- 2m at 196g/t Au from 12m
- 15m at 255.6g/t Au from 15m including 3m at 1,260g/t from 15m and 3m at 14.3g/t Au from 21m
- 9m at 5.7g/t Au from 24m
- 20m at 7.1g/t Au from surface
- 12m at 21.2g/t Au from 3m
- 7m at 5.2g/t Au from 30m.
All reported samples comprised 3m composite samples collected at the drill site.
Figure 7: Douze Match borehole results
For
per
sona
l use
onl
y
Burey Gold LimitedReview of OperationsFor the year ended 30 June 2016
Page 10
Results for a further 31 shallow scout RC holes for 1,249m at Douze Match were announced on 27 July 2016. Asignificant result of 9m at 52.6g/t Au from 6m, including 3m at 156g/t Au from 6m in drill hole DMRC040 wasreported to the northwest of the Tango mineralisation and is probably related to a second mineralised structure.
Significant high-grade mineralisation was intersected in two holes drilled along the NE-trending granite contactzone. Results included 13m at 8.4g/t Au from 36m, including 6m at 17.6g/t Au from 42m in DMRC019 and 6m at8.7g/t Au from 15m, including 3m at 16.9g/t Au from 15m in DMRC020. A zone with >5% sulphides wasintersected in holes DMRC029 and DMRC036 drilled on the same line as shown in section in Figure 7 ispotentially the southwest extension of the Tango shear. Significant results included 17m at 2.0g/t Au from 20m,including 7m at 2.9g/t Au from 20m and 9m at 1.6g/t Au from 42m respectively. Both holes ended inmineralisation. The true width of the mineralised zone will be determined from conventional RC and diamonddrilling.
Results from the final 56 holes of the 97-hole program were reported at the end of August, with the campaigntesting 1,100m of the extended 6,000m-long soil anomaly. Significant results from these holes included:
- 18m at 3.0g/t Au from 24m including 3m at 9.5g/t Au from 27m
- 21m at 2.0g/t Au from 9m, including 9m at 3.7g/t Au from 15m.
Burey has since commenced a 22,200m program that will include:
- 5,000m RC resource drilling program at Kebigada prospect
- 1,500m diamond drilling at Kebigada to test depth extension to mineralisation
- 3,200m program at Douze Match to infill and define the true width and depth extent of mineralisation identified
in the scout drilling, where several holes ended in gold mineralisation
- 11,500m RC drilling planned along 6km Douze Match granite contact, to test “Siona” workings and remaining
soil anomaly.
Burey expects to report a maiden Inferred Mineral Resource estimate for the Kebigada prospect early in CY2017.One RC rig has commenced infill drilling at the Kebigada Shear Zone where 5,000m drilling has been planned toinfill the area of defined mineralisation down to 100m line sections.
BALATINDI PROJECT
In the latter part of the year, Burey reached a decision to withdraw from the Balatindi Project in Guinea, WestAfrica and has no residual interest in that project. This decision was made to allow the Company and managementto focus human resources as well as exploration funds solely on the Giro Gold Project in line with investorexpectations. Over the past two years there has been little activity on the Balatindi project, triggered initially by theEbola crisis and subsequently by the Company’s entry into and focus on the Giro Gold Project. The polymetallicnature of mineralisation at Balatindi (copper, gold, uranium) was always going to present greater technicalchallenges and further stages of exploration by Burey would have required very large investment, which is betterdirected to the Giro Gold Project.
Competent Person’s Statement – Exploration ResultsThe information in this report that relates to exploration results is based on, and fairly represents information and supporting documentationprepared by Mr Klaus Eckhof, a Competent Person who is a member of The Australasian Institute of Mining and Metallurgy. Mr Eckhof is adirector of Burey Gold Limited. Mr Eckhof has sufficient experience that is relevant to the style of mineralisation and type of deposit underconsideration and to the activity being undertaken to qualify as a Competent Person as defined in the 2012 Edition of the “AustralasianCode for Reporting of Exploration Results, Mineral Resource and Ore Reserves”. Mr Eckhof consents to the inclusion in this report of thematters based on his information in the form and context in which it appears.
The information in this report that relates to the Giro Gold Project has been previously reported by the Company in compliance with JORC2012 in various market releases, with the last one being dated 19 September 2016. The Company confirms that it is not aware of any newinformation or data that materially affects the information included in those earlier market announcements.
For
per
sona
l use
onl
y
Burey Gold LimitedDirectors’ ReportFor the year ended 30 June 2016
Page 11
Your Directors present their report together with the financial statements of Burey Gold Limited and the entities itcontrolled at the end of, or during, the year ended 30 June 2016 (“the consolidated entity” or “Group”) and theauditor’s report thereon.
DIRECTORS
The names and details of the Directors in office during or since the end of the financial year are as follows.Directors were in office for the entire year unless otherwise stated.
Klaus Peter EckhofDip. Geol. TU, AusIMMChairman(Appointed 12 August 2014)
Klaus Eckhof is a geologist who has global contacts and has beeninstrumental in sourcing and developing successful projects in Australia,Africa, Russia, South America and the Philippines. He was formerlyPresident and Chief Executive Officer of Moto Goldmines Limited(“MGL”). Within four years of Mr Eckhof’s appointment, MGL discoveredjust under 20 million ounces of gold and completed a bankable feasibilitystudy at the Moto Gold Project in the Democratic Republic of Congo.MGL was subsequently acquired by Rangold Resources Limited. MrEckhof served as the Company’s Managing Director and Chief ExecutiveOfficer up to 12 August 2014. Since that date he has served as part-timeExecutive Chairman of the Company. During the past three years he hasalso served as a director of the following listed companies:
AVZ Limited (appointed 12 May 2014)Carnavale Resources Limited (appointed 1 January 2008, resigned 20 July2015)Explaurum Limited (appointed 24 August 2011, resigned 4 October 2013)Panex Resources Inc. (appointed 30 May 2006, resigned 24 July 2014)Cardinal Resources Limited (appointed 1 February 2013, resigned 16 June2014)
Mark Andrew CalderwoodCP AusIMMNon-Executive Director(Appointed 12 August 2014)
Mr Calderwood has 30 years’ experience with both exploration andproduction companies in Australia and Africa. He served as MD and CEOof Perseus Mining Ltd from 2004 to 2012, a period which saw the juniorexplorer mature to an ASX100 company. He led Perseus from discovery toproduction at its Edikan Gold Mine in Ghana and has held key roles inseveral World Class gold deposits including Tarmoola in WesternAustralia, Kibali in DRC and Edikan in Ghana. During the past three yearshe has also served as a director of the following listed companies:
Explaurum Limited (appointed 7 August 2013, resigned 8 August 2016)Manas Resources Limited (appointed 17 October 2007, Chairman from 1April 2014)
Susmit Mohanlal ShahBSc Econ, CANon-Executive Director /Company Secretary(Director since 16 June 2005)
Susmit Shah is a Chartered Accountant with more than 25 years’experience. Over the past 20 years, Mr Shah has been involved with adiverse range of Australian public listed companies in company secretarialand financial roles. His experience includes negotiation and conduct ofmining joint ventures, public flotations and mergers and acquisitions. MrShah has not served as a director of any other listed entity in the past threeyears.
For
per
sona
l use
onl
y
Burey Gold LimitedDirectors’ ReportFor the year ended 30 June 2016
Page 12
DIRECTORS (continued)
Kevin Peter ThomsonBSc, P GeoNon-Executive Director(Director since 23 February 2011)
Kevin Thomson is a geologist with nearly 30 years’ experience of which 15years have been in West Africa gaining exposure to a number of countriesin the sub-region, including Guinea. Mr Thomson is currently theExploration Manager for one of Burey’s larger shareholders, PerseusMining Limited. He has been instrumental in Perseus Mining Limited’sexploration success on its gold projects in Ghana and Côte d'Ivoire. MrThomson has not served as a director of any other listed entity in the pastthree years.
CORPORATE INFORMATION
Corporate Structure
Burey Gold Limited is a limited liability company that is incorporated and domiciled in Australia. During thefinancial year, it had the following subsidiaries:
Amani Consulting sarl Giro Goldfields Exploration sarl Burey Gold Guinee sarl Burey Gold (Ghana) Limited Burey Resources Pty Ltd (dormant)
PRINCIPAL ACTIVITIES
The principal activity of the consolidated entity during the course of the year was acquiring and exploring mineralinterests, prospective for precious metals and energy.
RESULTS AND DIVIDENDS
The consolidated loss after tax for the year ended 30 June 2016 was $12,411,305 (30 June 2015: $1,236,667). Nodividends were paid during the year and the Directors do not recommend payment of a dividend. The loss for theyear has been significantly impacted by the decision to withdraw from the Balatindi Project as a result of which$8.8 million of previously capitalised exploration expenditure at Balatindi has been written off. The loss for theyear also includes a $899,596 charge as a result of the vesting of securities incentives granted to directors and keymanagement personnel.
EARNINGS PER SHARE
Basic loss per share for the year was 1.56 cents (30 June 2015: 0.22 cents)
REVIEW OF OPERATIONS / OPERATING AND FINANCIAL REVIEW
The Group is engaged in mineral exploration for metals and energy in North-East Democratic Republic of Congo(“DRC”). A review of the Group’s operations, including information on exploration activity and results thereof,financial position, strategies and projects of the consolidated entity during the year ended 30 June 2016 is providedin this Financial Report and, in particular, in the "Review of Operations" section immediately preceding thisDirectors’ Report. The Group’s financial position, financial performance and use of funds information for thefinancial year is provided in the financial statements that follow this Directors’ Report.
As an exploration entity, the Group has no operating revenue or earnings and consequently the Group’sperformance cannot be gauged by reference to those measures. Instead, the Directors’ consider the Group’sperformance based on the success of exploration activity, acquisition of additional prospective mineral interestsand, in general, the value added to the Group’s mineral portfolio during the course of the financial year.
For
per
sona
l use
onl
y
Burey Gold LimitedDirectors’ ReportFor the year ended 30 June 2016
Page 13
REVIEW OF OPERATIONS / OPERATING AND FINANCIAL REVIEW (continued)
Whilst performance can be gauged by reference to market capitalisation, that measure is also subject to numerousexternal factors. These external factors can be specific to the Group, generic to the mining industry and generic tothe stock market as a whole and the Board and management would only be able to control a small number of thesefactors,
The Group’s business strategy for the financial year ahead and, in the foreseeable future, is to continue explorationactivity on the Group’s existing mineral project, identify and assess new mineral project opportunities in the DRCand review development strategies where individual projects have reached a stage that allows for such anassessment. Due to the inherent risky nature of the Group’s activities, the Directors are unable to comment on thelikely results or success of these strategies. The Group’s activities are also subject to numerous risks, mostlyoutside the Board’s and management’s control. These risks can be specific to the Group, generic to the miningindustry and generic to the stock market as a whole. The key risks, expressed in summary form, affecting theGroup and its future performance include but are not limited to:
Geological and technical risk posed to exploration and commercial exploitation success; Sovereign risk, change in government policy, change in mining and fiscal legislation; Prevention of access by reason of political or civil unrest, disease, outbreak of hostilities, inability to obtain
regulatory or landowner consents or approvals, or native title issues; force majeure events; change in metal market conditions; mineral title tenure and renewal risks; and capital requirement and lack of future funding.
This is not an exhaustive list of risks faced by the Group or an investment in it. There are other risks generic to thestock market and the world economy as a whole and other risks generic to the mining industry, all of which canimpact on the Group.
SIGNIFICANT CHANGES IN STATE OF AFFAIRS
During the financial year, the Company completed a number of separate capital raisings to fund its explorationactivities and to supplement working capital. These capital raisings were mostly by way of private placement ofsecurities and, in one instance, an entitlement offer of options to raise a total of just over $7.3 million net of issuecosts.
EVENTS SUBSEQUENT TO REPORTING DATE
Since the end of the financial year and to the date of this report no matter or circumstance has arisen which hassignificantly affected, or may significantly affect, the operations of the consolidated entity, the results of thoseoperations or the state of affairs of the consolidated entity in subsequent financial years other than the mattersreferred to below.
Subsequent to the year-end and to the date of this report, the Company concluded a placement issue of 216,199,999shares at an issue price of $0.054 to raise $11.67 million before costs. A further 3,014,836 shares were issued uponexercise of the same number of listed options at an exercise price of $0.05 each..Subsequent to the year-end, a total of 76 million performance rights vested and were converted into shares. As apost balance date adjusting event, an amount of $728,725 has been recognised in the profit and loss account for theyear ended 30 June 2016 to recognise these vesting events.
For
per
sona
l use
onl
y
Burey Gold LimitedDirectors’ ReportFor the year ended 30 June 2016
Page 14
LIKELY DEVELOPMENTS AND EXPECTED RESULTS
The Company’s objective is to maximise shareholder value through the discovery and delineation of significantmineral deposits. The Directors will also continue to assess additional opportunities within the mineral and energysectors in Central Africa.
The Directors are unable to comment on the likely results from the Company’s planned exploration activities due tothe speculative nature of such activities.
DIRECTORS’ MEETINGS
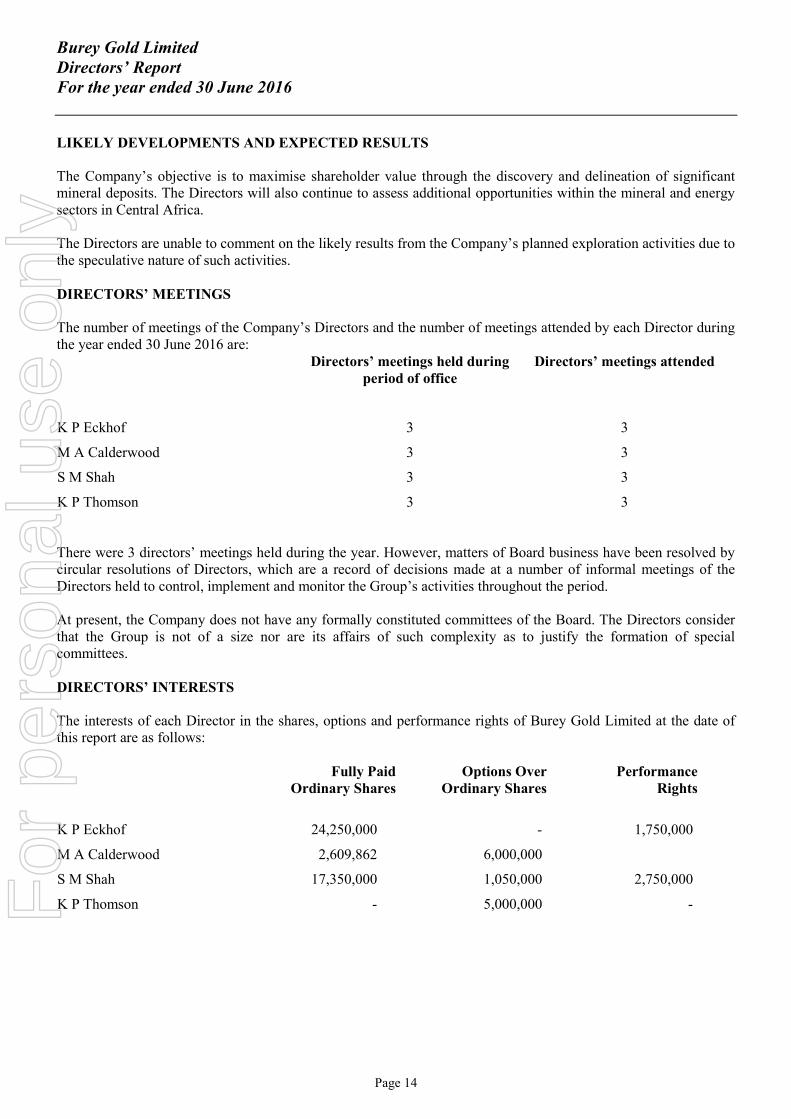
The number of meetings of the Company’s Directors and the number of meetings attended by each Director duringthe year ended 30 June 2016 are:
Directors’ meetings held duringperiod of office
Directors’ meetings attended
K P Eckhof 3 3
M A Calderwood 3 3
S M Shah 3 3
K P Thomson 3 3
There were 3 directors’ meetings held during the year. However, matters of Board business have been resolved bycircular resolutions of Directors, which are a record of decisions made at a number of informal meetings of theDirectors held to control, implement and monitor the Group’s activities throughout the period.
At present, the Company does not have any formally constituted committees of the Board. The Directors considerthat the Group is not of a size nor are its affairs of such complexity as to justify the formation of specialcommittees.
DIRECTORS’ INTERESTS
The interests of each Director in the shares, options and performance rights of Burey Gold Limited at the date ofthis report are as follows:
Fully PaidOrdinary Shares
Options OverOrdinary Shares
PerformanceRights
K P Eckhof 24,250,000 - 1,750,000
M A Calderwood 2,609,862 6,000,000
S M Shah 17,350,000 1,050,000 2,750,000
K P Thomson - 5,000,000 -For
per
sona
l use
onl
y
Burey Gold LimitedDirectors’ ReportFor the year ended 30 June 2016
Page 15
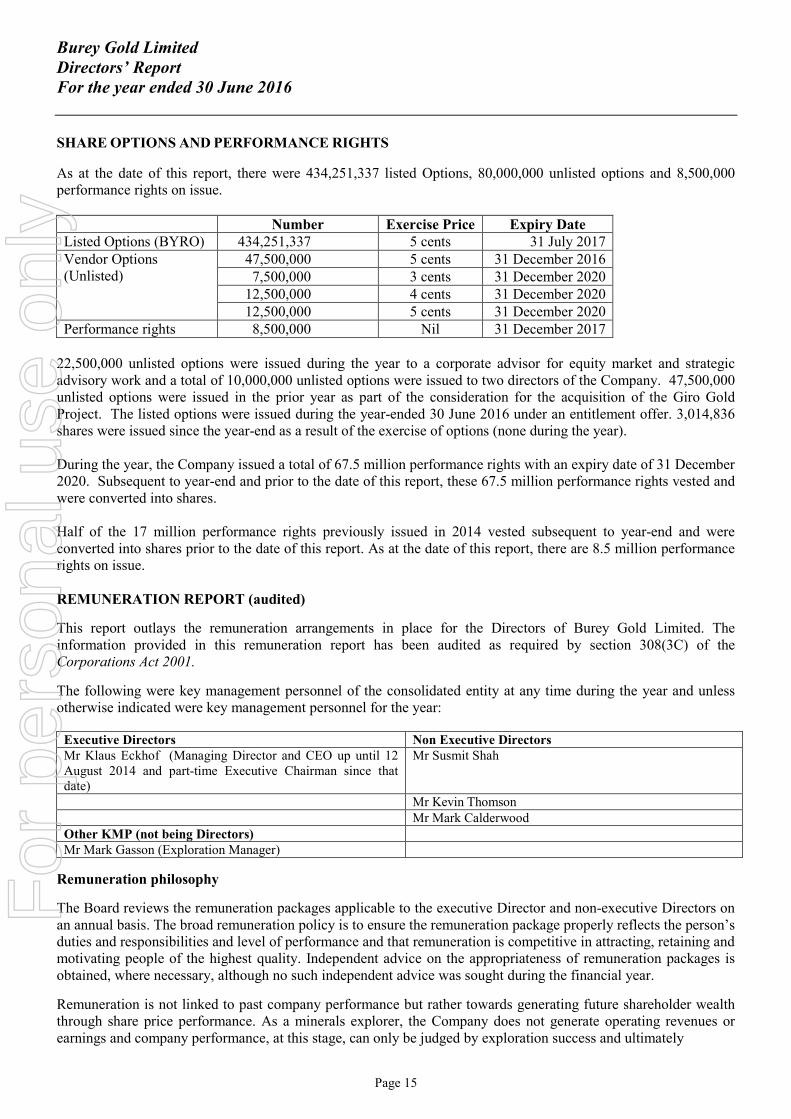
SHARE OPTIONS AND PERFORMANCE RIGHTS
As at the date of this report, there were 434,251,337 listed Options, 80,000,000 unlisted options and 8,500,000performance rights on issue.
Number Exercise Price Expiry DateListed Options (BYRO) 434,251,337 5 cents 31 July 2017Vendor Options(Unlisted)
47,500,000 5 cents 31 December 20167,500,000 3 cents 31 December 2020
12,500,000 4 cents 31 December 202012,500,000 5 cents 31 December 2020
Performance rights 8,500,000 Nil 31 December 2017
22,500,000 unlisted options were issued during the year to a corporate advisor for equity market and strategicadvisory work and a total of 10,000,000 unlisted options were issued to two directors of the Company. 47,500,000unlisted options were issued in the prior year as part of the consideration for the acquisition of the Giro GoldProject. The listed options were issued during the year-ended 30 June 2016 under an entitlement offer. 3,014,836shares were issued since the year-end as a result of the exercise of options (none during the year).
During the year, the Company issued a total of 67.5 million performance rights with an expiry date of 31 December2020. Subsequent to year-end and prior to the date of this report, these 67.5 million performance rights vested andwere converted into shares.
Half of the 17 million performance rights previously issued in 2014 vested subsequent to year-end and wereconverted into shares prior to the date of this report. As at the date of this report, there are 8.5 million performancerights on issue.
REMUNERATION REPORT (audited)
This report outlays the remuneration arrangements in place for the Directors of Burey Gold Limited. Theinformation provided in this remuneration report has been audited as required by section 308(3C) of theCorporations Act 2001.
The following were key management personnel of the consolidated entity at any time during the year and unlessotherwise indicated were key management personnel for the year:
Executive Directors Non Executive DirectorsMr Klaus Eckhof (Managing Director and CEO up until 12August 2014 and part-time Executive Chairman since thatdate)
Mr Susmit Shah
Mr Kevin ThomsonMr Mark Calderwood
Other KMP (not being Directors)Mr Mark Gasson (Exploration Manager)
Remuneration philosophy
The Board reviews the remuneration packages applicable to the executive Director and non-executive Directors onan annual basis. The broad remuneration policy is to ensure the remuneration package properly reflects the person’sduties and responsibilities and level of performance and that remuneration is competitive in attracting, retaining andmotivating people of the highest quality. Independent advice on the appropriateness of remuneration packages isobtained, where necessary, although no such independent advice was sought during the financial year.
Remuneration is not linked to past company performance but rather towards generating future shareholder wealththrough share price performance. As a minerals explorer, the Company does not generate operating revenues orearnings and company performance, at this stage, can only be judged by exploration success and ultimately
For
per
sona
l use
onl
y
Burey Gold LimitedDirectors’ ReportFor the year ended 30 June 2016
Page 16
REMUNERATION REPORT (audited) (continued)
shareholder value. Market capitalisation is one measure of shareholder value but this is subject to many externalfactors over which the Company has no control. Consequently linking remuneration to past performance is difficultto implement and not in the best interests of the Company. Presently, total fixed remuneration for senior executivesis determined by reference to market conditions and incentives for out performance are provided by way of optionsor performance rights over unissued shares. The Directors believe that this best aligns the interests of theshareholders with those of the senior executives.
Remuneration committee
The Company does not have a formally constituted remuneration committee of the Board. The Directors considerthat the Group is not of a size nor are its affairs of such complexity as to justify the formation of a Remunerationcommittee.
The Board assesses the appropriateness of the nature and amount of remuneration of Directors and senior managerson a periodical basis by reference to relevant employment market conditions with the overall objective of ensuringmaximum stakeholder benefit from the retention of a high quality board and management team.
Remuneration structure
In accordance with best practice corporate governance, the structure of non-executive Directors and executiveDirector remuneration is separate and distinct.
Non-executive Directors remuneration
Objective
The Board seeks to set aggregate remuneration at a level which provides the Company with the ability to attractand retain directors of the highest calibre, whilst incurring a cost which is acceptable to shareholders.
Structure
The Constitution and the ASX Listing Rules specify that the aggregate remuneration of non-executive Directorsshall be determined from time to time by a general meeting. An amount not exceeding the amount determined isthen divided between the directors as agreed. The present limit of approved aggregate remuneration is $200,000per year.
The Board reviews the remuneration packages applicable to the non-executive Directors on an annual basis. TheBoard considers fees paid to non-executive directors of comparable companies when undertaking the annual reviewprocess.
It has been agreed that non-executive Directors, excluding the Chairman shall receive a fee in the range of $20,000to $25,000 each per annum from 1 July 2006. Non-executive Directors may also be remunerated for additionalspecialised services performed at the request of the Board. A non-executive Chairman shall receive a fee of$36,000 per annum. Mr Eckhof, however, is a part-time executive Chairman.
The remuneration of the non-executive Directors for the year ending 30 June 2016 is detailed in Table 1 of thisreport.
For
per
sona
l use
onl
y
Burey Gold LimitedDirectors’ ReportFor the year ended 30 June 2016
Page 17
REMUNERATION REPORT (audited) (continued)
Executive Directors remuneration
Objective
The Company aims to reward the Executive Directors with a level of remuneration commensurate with theirposition and responsibilities within the Company and so as to:
align the interests of the Executive Directors with those of shareholders; link reward with the strategic goals and performance of the Company; and ensure total remuneration is competitive by market standards.
Structure
Remuneration consists of the following key elements:
Fixed remuneration Variable remuneration
Fixed remuneration
The level of fixed remuneration is set so as to provide a base level of remuneration which is both appropriate to theposition and is competitive in the market.
Fixed remuneration is reviewed annually by the Board and the process consists of a review of companywide,business unit and individual performance, relevant comparative remuneration in the market and internal and, whereappropriate, external advice on policies and practice.
The fixed component of the Executive Director remuneration for the year ending 30 June 2016 is detailed in Table1 of this report.
Variable remuneration – Long Term Incentive (‘LTI’)
Objective
The objective of the LTI plan is to reward executives and senior managers in a manner which aligns this element ofremuneration with the creation of shareholder wealth.
As such LTI grants are only made to executives who are able to influence the generation of shareholder wealth andthus have a direct impact on the Group’s performance.
Structure
LTI grants to executives are delivered in the form of options and performance rights. The issue of options /performance rights as part of the remuneration packages of executive and non-executive directors is an establishedpractice of junior public listed companies and, in the case of the Company, has the benefit of conserving cashwhilst properly rewarding each of the directors.
Remuneration is not linked to past group performance but rather towards generating future shareholder wealththrough share price performance. Burey Gold Ltd listed on 14 December 2006 at 20c per share and the share priceat 30 June 2016 was 5.7 cents (2015: 2.8 cents). The shares recorded high and low points of 6.5c and 1.4c duringthe year. The Company has recorded a loss each financial year to date as it carries out exploration activities on itstenements. No dividends have been paid.
For
per
sona
l use
onl
y
Burey Gold LimitedDirectors’ ReportFor the year ended 30 June 2016
Page 18
REMUNERATION REPORT (audited) (continued)
Service agreements
Mr Eckhof entered into an employment agreement with Burey Gold Limited on 2 February 2012 as the ManagingDirector and Chief Executive Officer. Mr Eckhof continued in that role of Managing Director and Chief ExecutiveOfficer until 12 August 2014. His employment agreement was terminated at that stage and his role changed to thatof a part-time Executive Chairman. His remuneration for the year was $130,000. In his capacity as a part-timeExecutive Chairman, Mr Eckhof does not have a service agreement.
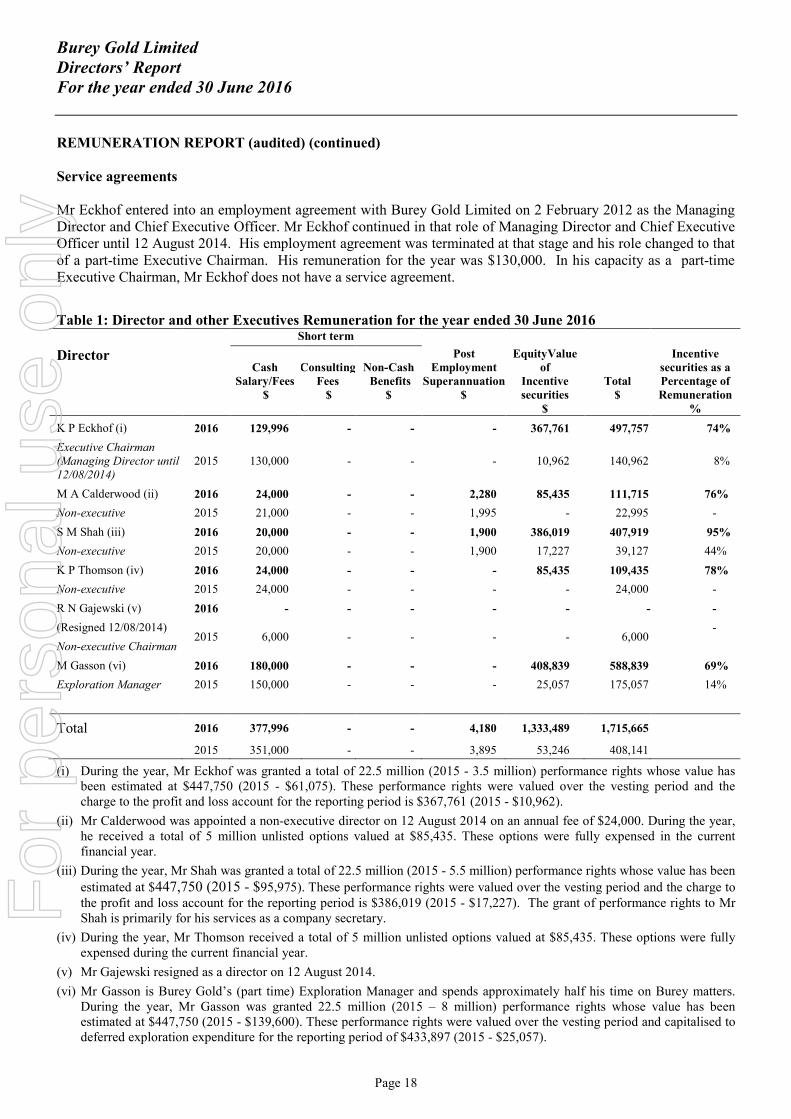
Table 1: Director and other Executives Remuneration for the year ended 30 June 2016Short term
DirectorCash
Salary/Fees$
ConsultingFees
$
Non-CashBenefits
$
PostEmployment
Superannuation$
EquityValueof
Incentivesecurities
$
Total$
Incentivesecurities as aPercentage ofRemuneration
%
K P Eckhof (i) 2016 129,996 - - - 367,761 497,757 74%
Executive Chairman(Managing Director until12/08/2014)
2015 130,000 - - - 10,962 140,962 8%
M A Calderwood (ii) 2016 24,000 - - 2,280 85,435 111,715 76%
Non-executive 2015 21,000 - - 1,995 - 22,995 -
S M Shah (iii) 2016 20,000 - - 1,900 386,019 407,919 95%
Non-executive 2015 20,000 - - 1,900 17,227 39,127 44%
K P Thomson (iv) 2016 24,000 - - - 85,435 109,435 78%
Non-executive 2015 24,000 - - - - 24,000 -
R N Gajewski (v) 2016 - - - - - - -
(Resigned 12/08/2014)
Non-executive Chairman2015 6,000 - - - - 6,000
-
M Gasson (vi) 2016 180,000 - - - 408,839 588,839 69%
Exploration Manager 2015 150,000 - - - 25,057 175,057 14%
Total 2016 377,996 - - 4,180 1,333,489 1,715,665
2015 351,000 - - 3,895 53,246 408,141
(i) During the year, Mr Eckhof was granted a total of 22.5 million (2015 - 3.5 million) performance rights whose value hasbeen estimated at $447,750 (2015 - $61,075). These performance rights were valued over the vesting period and thecharge to the profit and loss account for the reporting period is $367,761 (2015 - $10,962).
(ii) Mr Calderwood was appointed a non-executive director on 12 August 2014 on an annual fee of $24,000. During the year,he received a total of 5 million unlisted options valued at $85,435. These options were fully expensed in the currentfinancial year.
(iii) During the year, Mr Shah was granted a total of 22.5 million (2015 - 5.5 million) performance rights whose value has been
estimated at $447,750 (2015 - $95,975). These performance rights were valued over the vesting period and the charge tothe profit and loss account for the reporting period is $386,019 (2015 - $17,227). The grant of performance rights to MrShah is primarily for his services as a company secretary.
(iv) During the year, Mr Thomson received a total of 5 million unlisted options valued at $85,435. These options were fullyexpensed during the current financial year.
(v) Mr Gajewski resigned as a director on 12 August 2014.
(vi) Mr Gasson is Burey Gold’s (part time) Exploration Manager and spends approximately half his time on Burey matters.During the year, Mr Gasson was granted 22.5 million (2015 – 8 million) performance rights whose value has beenestimated at $447,750 (2015 - $139,600). These performance rights were valued over the vesting period and capitalised todeferred exploration expenditure for the reporting period of $433,897 (2015 - $25,057).
For
per
sona
l use
onl
y
Burey Gold LimitedDirectors’ ReportFor the year ended 30 June 2016
Page 19
REMUNERATION REPORT (audited) (continued)
(vii)Additional fees paid or payable to Corporate Consultants Pty Ltd, a company in which Mr Gajewski and Mr Shah havebeneficial interests for (a) secretarial, accounting, and office administration services amounted to $183,853 (2015:$169,586) , and (b) sub-lease rental fees amounted to $34,088 (2015: $34,178). The amount due to Corporate ConsultantsPty Ltd at reporting date was $34,646 (2015 - $15,000) in trade and other payables.
Shareholdings of Key Management Personnel
The numbers of shares in the Company held during the financial period by Directors and other Key ManagementPersonnel, including shares held by entities they control, are set out below:
Balance at1 July 2015
Received asRemuneration
OptionsExercised
OtherMovements
Balance at30 June 2016
Directors
Klaus Eckhof - - - - -
Mark Calderwood 2,609,862 - - - 2,609,862
Susmit Shah 2,100,000 - - - 2,100,000
Kevin Thomson - - - - -
Other KMP
Mark Gasson 200,000 - - - 200,000
Optionholdings and Performance Rights of Key Management Personnel
The numbers of options and performance rights in the Company held during the financial period by Directors andother Key Management Personnel, including options held by entities they control, are set out below:
Balance at1 July 2015
Received asRemuneration
Exercised /converted
OtherMovements
Balance at30 June 2016
Directors
Klaus Eckhof
– Options
- Performance rights
-
3,500,000
-
22,500,000
-
-
-
-
-
26,000,000
Mark Calderwood
- Options - 5,000,000 - 1,000,000 6,000,000
Susmit Shah
- Options
- Performance rights
-
5,500,000
-
22,500,000
-
-
1,050,000
-
1,050,000
28,000,000
Kevin Thomson
- Options - 5,000,000 - - 5,000,000
Other KMP
Mark Gasson
- Options
- Performance rights
-
8,000,000
-
22,500,000
-
-
100,000
-
100,000
30,500,000
For
per
sona
l use
onl
y
Burey Gold LimitedDirectors’ ReportFor the year ended 30 June 2016
Page 20
REMUNERATION REPORT (audited) (continued)
During or since the end of the financial year, the Company has granted 10 million (2015 – nil) options for nilconsideration over unissued ordinary shares in the Company to the following Directors as part of theirremuneration:
2016Options
Numbergranted Grant Date
Fair valueper option at
grant date
Exerciseprice per
option Expiry dateFair value at
grant dateM Calderwood:- tranche 1 2,500,000 24/3/2016 $0.0175 $0.04 31/12/2020
$43,705
- tranche 2 2,500,000 24/3/2016 $0.0167 $0.05 31/12/2020 41,730
K Thomson:- tranche 1 2,500,000 24/3/2016 $0.0175 $0.04 31/12/2020 43,705- tranche 2 2,500,000 24/3/2016 $0.0167 $0.05 31/12/2020 41,730
As the above options vested on grant, the fair value at grant date was expensed to profit and loss account
The model inputs for options granted in year ended 30 June 2016 included:
a) Exercise price: ranging from $0.04 to $0.05
b) Grant date: 24 March 2016
c) Expiry date: 31 December 2020
d) Share price at grant date: $0.025
e) Risk free rate: 2%
f) Volatility rate: 105%
The Company has granted performance rights for nil consideration over unissued ordinary shares in the Companyto the following KMP as part of their remuneration (2015: nil) and details are noted below:
2016PerformanceRights
Numbergranted Grant Date
Fair valueper right atgrant date
Exerciseprice per
right Expiry date
Maximumtotal value ofgrant yet to
vestK Eckhof:- tranche 1 7,500,000 24/3/2016 $0.0228 - 31/12/2020
$42,750
- tranche 2- tranche 3
7,500,0007,500,000
24/3/201624/3/2016
$0.0199$0.0170
--
31/12/202031/12/2020
37,31231,875
S Shah:- tranche 1 7,500,000 24/3/2016 $0.0228 - 31/12/2020 42,750- tranche 2- tranche 3
7,500,0007,500,000
24/3/201624/3/2016
$0.0199$0.0170
--
31/12/202031/12/2020
37,31231,875
M Gasson:- tranche 1 7,500,000 24/3/2016 $0.0228 - 31/12/2020 42,750- tranche 2- tranche 3
7,500,0007,500,000
24/3/201624/3/2016
$0.0199$0.0170
--
31/12/202031/12/2020
37,31231,875F
or p
erso
nal u
se o
nly
Burey Gold LimitedDirectors’ ReportFor the year ended 30 June 2016
Page 21
REMUNERATION REPORT (audited) (continued)
2015PerformanceRights
Numbergranted Grant Date
Fair valueper right atgrant date
Exerciseprice per
right Expiry date
Maximumtotal value ofgrant yet to
vestK Eckhof:- tranche 1 1,750,000 26/11/2014 $0.0169 - 31/12/2017
$24,267
- tranche 2 1,750,000 26/11/2014 $0.0180 - 31/12/2017 25,846
S Shah:- tranche 1 2,750,000 26/11/2014 $0.0169 - 31/12/2017 38,133- tranche 2 2,750,000 26/11/2014 $0.0180 - 31/12/2017 40,615
M Gasson:- tranche 1 4,000,000 26/11/2014 $0.0169 - 31/12/2017 55,466- tranche 2 4,000,000 26/11/2014 $0.0180 - 31/12/2017 59,076
2016 performance rights will vest subject to meeting specific performance conditions. Tranche 1,2 and 3 performance rightshave a market vesting condition being a daily volume weighted average share price of at least $0.03, $0.04 and $0.05respectively over a consecutive 10 trading days. Subsequent to year-end, all market vesting conditions were met and the rightswere converted into shares.
2015 performance rights will vest subject to Tranche 1 performance rights having a market vesting condition being a shareprice of 5 cents or more over a consecutive 20 day business period. Tranche 2 performance rights have a non-market vestingcondition being estimation of a mineral resource of at least one million gold or gold equivalent ounces at any Burey Groupmineral project. Subsequent to year-end, Tranche 1 performance rights met their vesting condition and were converted intoshares.
Each right is converted to one ordinary share upon vesting. The performance rights vest when the vesting conditions are met.No performance rights will vest if the conditions are not satisfied, hence the minimum value of the performance rights yet tovest is nil. The maximum value of the performance rights yet to vest has been determined as the amount of the grant date fairvalue of the performance rights that is yet to be expensed.
The fair values at grant date of performance rights issued were determined using a Black-Scholes option pricing model orBarrier model simulation that takes into account the exercise price, the term of the rights, the share price at grant date andexpected price volatility of the underlying share, and the risk free interest rate for the term of the rights. The model inputs forperformance rights granted in year ended 30 June 2016 and 2015 included:
a) Exercise price: nil (2015: nil)
b) Grant date: 24 March 2016 (2015: 26 November 2014)
c) Expiry date: 31 December 2020 (2015: 31 December 2017)
d) Share price at grant date: $0.025 (2015: $0.018)
e) Risk free rate: 2% (2015: 2.5%)
f) Volatility rate: 45% (2015: 100%)
Loans to key management personnel and their related parties
There were no loans outstanding at the reporting date to key management personnel and their related parties.
Use of Remuneration Consultants
The Company did not use any remuneration consultants during the period.
End of Remuneration Report (audited)
For
per
sona
l use
onl
y
Burey Gold LimitedDirectors’ ReportFor the year ended 30 June 2016
Page 22
INDEMNIFICATION AND INSURANCE OF OFFICERS AND AUDITORS
The Company’s Constitution requires it to indemnify directors and officers of any entity within the consolidatedentity against liabilities incurred to third parties and against costs and expenses incurred in defending civil orcriminal proceedings, except in certain circumstances. An indemnity is also provided to the Company’s auditorsunder the terms of their engagement. Directors and officers of the consolidated entity have been insured against allliabilities and expenses arising as a result of work performed in their respective capacities, to the extent permittedby law. The insurance premium, amounting to $7,021 (2015 - $9,051) relates to:
costs and expenses incurred by the relevant officers in defending proceedings, whether civil or criminal andwhatever the outcome;
other liabilities that may arise from their position, with the exception of conduct involving a wilful breachof duty or improper use of information or position to gain a personal advantage.
ENVIRONMENTAL REGULATIONS
The consolidated entity’s exploration activities in the Democratic Republic of Congo during the year were subjectto environmental laws, regulations and permit conditions in that jurisdiction. There have been no known breachesof environmental laws or permit conditions while conducting operations in the Democratic Republic of Congoduring the year.
The Directors have considered compliance with the National Greenhouse and Energy Reporting Act 2007 whichrequires entities to report annual greenhouse gas emissions and energy use. For the measurement period 1 July2015 to 30 June 2016 the Directors have assessed that there are no current reporting requirements, but may berequired to do so in the future.
NON-AUDIT SERVICES
The Company may decide to employ the auditor on assignments additional to their statutory audit duties where theauditor’s expertise and experience with the Company and/or consolidated entity is important. During the yearended 30 June 2016 the external auditors did not provide any non-audit services. Refer to Note 4 in the financialstatements for further details.
AUDITOR’S INDEPENDENCE DECLARATION
The auditor, BDO Audit (WA) Pty Ltd, has provided the Board of Directors with an independence declaration inaccordance with section 307C of the Corporations Act 2001.
The independence declaration is located on the next page.
Signed in accordance with a resolution of Directors.
K P EckhofChairmanPerth, 30 September 2016
For
per
sona
l use
onl
y
38 Station StreetSubiaco, WA 6008PO Box 700 West Perth WA 6872Australia
Tel: +61 8 6382 4600Fax: +61 8 6382 4601www.bdo.com.au
BDO Audit (WA) Pty Ltd ABN 79 112 284 787 is a member of a national association of independent entities which are all members of BDO Australia Ltd ABN77 050 110 275, an Australian company limited by guarantee. BDO Audit (WA) Pty Ltd and BDO Australia Ltd are members of BDO International Ltd, a UKcompany limited by guarantee, and form part of the international BDO network of independent member firms. Liability limited by a scheme approved underProfessional Standards Legislation, other than for the acts or omissions of financial services licensees.
DECLARATION OF INDEPENDENCE BY DEAN JUST TO THE DIRECTORS OF BUREY GOLD LIMITED
As lead auditor of Burey Gold Limited for the year ended 30 June 2016, I declare that, to the best ofmy knowledge and belief, there have been:
1. No contraventions of the auditor independence requirements of the Corporations Act 2001 inrelation to the audit; and
2. No contraventions of any applicable code of professional conduct in relation to the audit.
This declaration is in respect of Burey Gold Limited and the entities it controlled during the period.
Dean Just
Director
BDO Audit (WA) Pty Ltd
Perth, 30 September 2016
For
per
sona
l use
onl
y
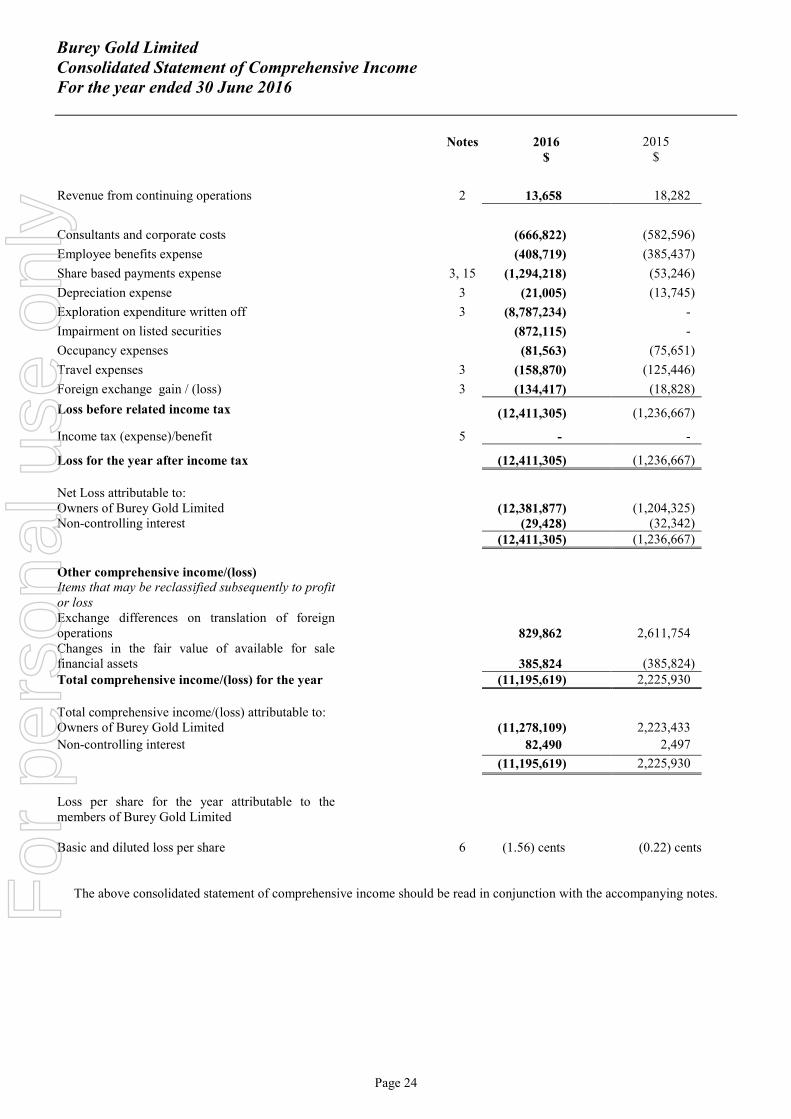
Burey Gold LimitedConsolidated Statement of Comprehensive IncomeFor the year ended 30 June 2016
Page 24
Notes 2016 2015$ $
Revenue from continuing operations 2 13,658 18,282
Consultants and corporate costs (666,822) (582,596)
Employee benefits expense (408,719) (385,437)
Share based payments expense 3, 15 (1,294,218) (53,246)
Depreciation expense 3 (21,005) (13,745)
Exploration expenditure written off 3 (8,787,234) -
Impairment on listed securities (872,115) -
Occupancy expenses (81,563) (75,651)
Travel expenses 3 (158,870) (125,446)
Foreign exchange gain / (loss) 3 (134,417) (18,828)
Loss before related income tax (12,411,305) (1,236,667)
Income tax (expense)/benefit 5 - -
Loss for the year after income tax (12,411,305) (1,236,667)
Net Loss attributable to:Owners of Burey Gold Limited (12,381,877) (1,204,325)Non-controlling interest (29,428) (32,342)
(12,411,305) (1,236,667)
Other comprehensive income/(loss)Items that may be reclassified subsequently to profitor lossExchange differences on translation of foreignoperations 829,862 2,611,754Changes in the fair value of available for salefinancial assets 385,824 (385,824)Total comprehensive income/(loss) for the year (11,195,619) 2,225,930
Total comprehensive income/(loss) attributable to:Owners of Burey Gold Limited (11,278,109) 2,223,433
Non-controlling interest 82,490 2,497
(11,195,619) 2,225,930
Loss per share for the year attributable to themembers of Burey Gold Limited
Basic and diluted loss per share 6 (1.56) cents (0.22) cents
The above consolidated statement of comprehensive income should be read in conjunction with the accompanying notes.For
per
sona
l use
onl
y
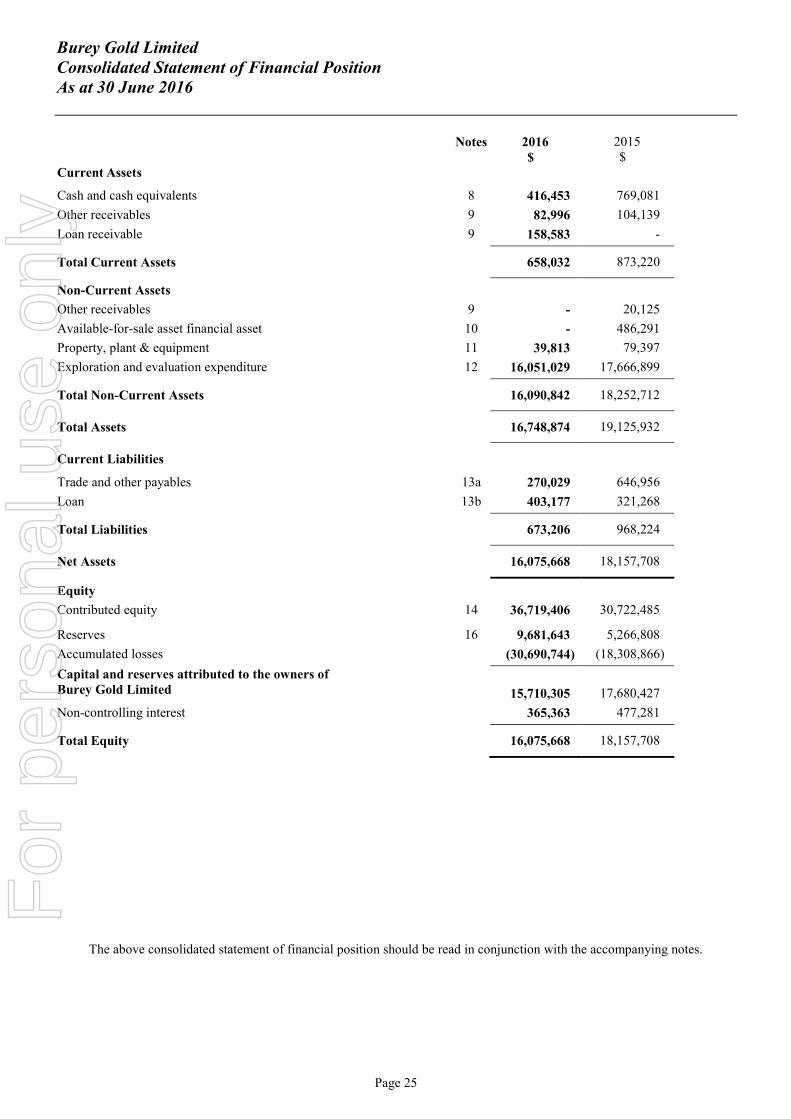
Burey Gold LimitedConsolidated Statement of Financial PositionAs at 30 June 2016
Page 25
Notes 2016 2015$ $
Current Assets
Cash and cash equivalents 8 416,453 769,081
Other receivables 9 82,996 104,139
Loan receivable 9 158,583 -
Total Current Assets 658,032 873,220
Non-Current Assets
Other receivables 9 - 20,125
Available-for-sale asset financial asset 10 - 486,291
Property, plant & equipment 11 39,813 79,397
Exploration and evaluation expenditure 12 16,051,029 17,666,899
Total Non-Current Assets 16,090,842 18,252,712
Total Assets 16,748,874 19,125,932
Current Liabilities
Trade and other payables 13a 270,029 646,956
Loan 13b 403,177 321,268
Total Liabilities 673,206 968,224
Net Assets 16,075,668 18,157,708
Equity
Contributed equity 14 36,719,406 30,722,485
Reserves 16 9,681,643 5,266,808
Accumulated losses (30,690,744) (18,308,866)
Capital and reserves attributed to the owners ofBurey Gold Limited 15,710,305 17,680,427
Non-controlling interest 365,363 477,281
Total Equity 16,075,668 18,157,708
The above consolidated statement of financial position should be read in conjunction with the accompanying notes.
For
per
sona
l use
onl
y
Burey Gold LimitedConsolidated Statement of Changes in EquityFor the year ended 30 June 2016
Page 26
Contributed
EquityAccumulated
LossesOption Premium
Reserve
AssetRevaluation
Reserve
ForeignCurrency
TranslationReserve
Non-controllinginterest Total Equity
Share basedReserves
$ $ $ $ $ $ $ $
Balance at 1 July 2014 23,820,845 (17,104,541) - 2,395,828 - 71,801 - 9,183,933
Loss for the year - (1,204,325) - - - - (32,342) (1,236,667)Exchange differences on translation offoreign operations - - - - - 2,609,257 2,497 2,611,754Changes in the fair value of available forsale financial assets - - - - (385,824) - (385,824)Total comprehensive profit / (loss) for theyear
- (1,204,325) - - (385,824) 2,609,257 (29,845) 989,263
Transactions with equity holders intheir capacity as equity holders -
Share issue 7,215,680 - - - - - 7,215,680
Share issue costs (314,040) - - - - - - (314,040)Share based payments expense – optionsissue
- - - 522,500 - - - 522,500Share based payments expense –performance rights - - - 53,246 - - - 53,246Transactions with non-controllinginterests
- - - -53,246
- - 507,126 507,126
Balance at 30 June 2015 30,722,485 (18,308,866) - 2,971,574 (385,824) 2,681,058 477,281 18,157,708
The above consolidated statement of changes in equity should be read in conjunction with the accompanying notes.
For
per
sona
l use
onl
y
Burey Gold LimitedConsolidated Statement of Changes in EquityFor the year ended 30 June 2016
Page 27
ForeignCurrency
TranslationReserve
AssetRevaluation
Reserve
Contributed
EquityAccumulated
LossesOption Premium
ReserveShare based
ReservesNon-controlling
interest Total Equity
$ $ $ $ $ $ $ $
Balance at 1 July 2015 30,722,485 (18,308,866) - 2,971,574 (385,824) 2,681,058 477,281 18,157,708
Loss for the year - (12,381,877) - - - - (29,428) (12,411,305)
Exchange differences on translation offoreign operations - - - - - 912,352 (82,490) 829,862
Changes in the fair value of available forsale financial assets - - - - 385,824 - - 385,824Total comprehensive profit / (loss) for theyear
- (12,381,877) - - 385,824 912,352 (111,918) (11,195,619)
Transactions with equity holders intheir capacity as equity holders
Share and listed option issue 6,426,527 - 1,388,544 - - - - 7,815,071
Share issue costs (429,606) - - - - - - (429,606)Share based payments expense – optionissue
- - - 565,493 - - - 565,493
Share based payments expense –performance rights - - - 1,162,622 - - - 1,162,622Transactions with non-controllinginterests
- - - - - - - -
Balance at 30 June 2016 36,719,406 (30,690,743) 1,388,544 4,699,689 - 3,593,410 365,363 16,075,669
The above consolidated statement of changes in equity should be read in conjunction with the accompanying notes.
For
per
sona
l use
onl
y
Burey Gold LimitedConsolidated Statement of Cash Flowsfor the year ended 30 June 2016
Page 28
Notes 2016 2015$ $
Cash Flows from Operating Activities
Payments to suppliers and employees (1,045,714) (1,185,973)
Interest received 1,137 14,769
Net Cash outflows from Operating Activities 20 (1,044,577) (1,171,204)
Cash Flows from Investing Activities
Payments for plant and equipment (3,209) (4,330)
Proceeds from sale of mineral projects - 106,316
Payment for exploration asset (refer Note 23) - (321,268)
Payments for exploration and development expenditure (6,568,432) (3,963,228)
Cash received from acquisition (refer Note 23) - 21,353
Net Cash outflows from Investing Activities (6,571,641) (4,161,157)
Cash Flows from Financing Activities
Proceeds from securities issues 7,792,571 4,500,000
Securities issue expenses (429,606) (314,040)
Loan issued (158,583) -
Net Cash inflows from Financing Activities 7,204,382 4,185,960
Net decrease in Cash and Cash Equivalents (411,836) (1,146,401)
Cash and cash equivalents at the beginning of the year 769,081 1,870,025
Effects of exchange rate fluctuations on the balances of cashheld in foreign currencies 59,208 45,457
Cash and Cash Equivalents at End of Year 8 416,453 769,081
The above consolidated statement of cash flows should be read in conjunction with the accompanying notes.
For
per
sona
l use
onl
y
Burey Gold LimitedNotes to the Financial Statementsfor the year ended 30 June 2016
Page 29
1. SUMMARY OF SIGNIFICANT ACCOUNTING POLICIES
These general purpose financial statements have been prepared in accordance with Australian AccountingStandards, other authoritative pronouncements of the Australian Accounting Standards Board, Urgent IssuesGroup Interpretations and the Corporations Act 2001.
The financial statements are for the consolidated entity consisting of Burey Gold Limited and its subsidiaries(the “group” or the “consolidated entity”). Burey Gold Mining Limited is a listed for-profit public company,incorporated and domiciled in Australia. During the year ended 30 June 2016, the consolidated entity conductedoperations in Australia, the Democratic Republic of Congo, and Guinea. The financial statements have also beenprepared on a historical cost basis. Cost is based on the fair values of the consideration given in exchange forassets.
The financial report is presented in Australian dollars.
Going Concern Basis
The financial report has been prepared on a going concern basis which contemplates that the Group will realiseits assets and extinguish its liabilities in the normal course of business at amounts stated in the half yearlyreport. At 30 June 2016, the Group had net assets of $16,075,668 (30 June 2015: $18,157,708). The Groupincurred a net loss after tax of $12,411,305 (2015: $1,236,667) and net operating and investing cash outflows of$7,616,218 (2015: $5,332,361) and continues to incur expenditure on its exploration projects drawing on itscash balances. As at 30 June 2016, the Group had $416,454 (30 June 2015: $769,081) in cash and cashequivalents.
Subsequent to year-end, the Company raised $11.67 million before costs in new equity capital and also has theability to modify expenditure outlays if required. The directors’ are satisfied the current cash resources areadequate for the Group to continue as a going concern.
Adoption of New and Revised Standards
In the year ended 30 June 2016, the group has reviewed all of the new and revised Standards and interpretationsissued by the AASB that are relevant to its operations and effective for annual reporting periods beginning 1July 2015. It has been determined by the Directors that there is no impact material or otherwise, of any of thenew and revised Standard and Interpretations on its business and, therefore, no change is necessary to Groupaccounting policies.
The Group has also reviewed all new Standards and Interpretations that have been issued but are not yeteffective for the year ended 30 June 2016. As a result of this review the Directors have determined that there isno impact, material or otherwise, of the new and revised Standards and Interpretations on its business and,therefore, no change necessary to Group accounting policies.
Statement of Compliance
These financial statements were authorised for issue on 30 September 2016.
For
per
sona
l use
onl
y
Burey Gold LimitedNotes to the Financial Statementsfor the year ended 30 June 2016
Page 30
1. SUMMARY OF SIGNIFICANT ACCOUNTING POLICIES – continued
The consolidated financial statements comprising the financial statements and notes thereto, comply withInternational Financial Reporting Standards (IFRS) as issued by the International Accounting Standards Board(IASB).
Asset Acquisition
On 5 September 2014, Burey Gold Limited acquired 85% of the issued shares of Amani Consulting sarl(Amani) by the issue of shares, options and cash. Directors’ judgement was required to be used in classifyingthis transaction as an asset acquisition rather than as a business combination. As the acquisition of Amani is notdeemed a business combination, the transaction must be accounted for as a share based payment for the netassets acquired.
When an asset acquisition does not constitute a business combination, the assets and liabilities are assigned acarrying amount based on their relative fair values in an asset purchase transaction and no deferred tax will arisein relation to the acquired assets and assumed liabilities as the initial recognition exemption for deferred taxunder AASB 112 applies. No goodwill will arise on the acquisition and transaction costs of the acquisition willbe included in the capitalised cost of the asset.
Basis of Consolidation
The consolidated financial statements comprise the financial statements of Burey Gold Limited (the“Company”) and subsidiaries. Subsidiaries are all entities over which the group has control. The group controlsan entity when the group is exposed to, or has rights to variable returns from its involvement with the entity andhas the ability to affect those returns through its power to direct the activities of the entity.
The financial statements of the subsidiaries are prepared for the same reporting period as the parent company,using consistent accounting policies.
In preparing the consolidated financial statements, all intercompany balances and transactions, income andexpenses and profit and losses resulting from intra-group transactions have been eliminated in full. Subsidiariesare fully consolidated from the date on which control is transferred tothe consolidated entity and cease to beconsolidated from the date on which control is transferred out of the consolidated entity.
Parent Entity Financial Information
The financial information for the parent entity, Burey Gold Ltd, disclosed in note 22 has been prepared on thesame basis as the consolidated financial statements.
Revenue recognition
Revenue is recognised to the extent that it is probable that the economic benefits will flow to the consolidatedentity and the revenue is capable of being reliably measured.
Interest income is recognised in the statement of comprehensive income as it accrues, using the effective interestmethod.
All revenue is stated net of the amount of goods and services tax (GST).
Cash and cash equivalents
Cash and cash equivalents include cash on hand, deposits held at call with banks and other short-term highlyliquid investments readily convertible to cash.
For
per
sona
l use
onl
y
Burey Gold LimitedNotes to the Financial Statementsfor the year ended 30 June 2016
Page 31
1. SUMMARY OF SIGNIFICANT ACCOUNTING POLICIES – continued
Trade and Other Receivables
Trade receivables, which generally have 30-90 day terms, are recognised and carried at original invoice amountless an allowance for any uncollectible amounts. An allowance account (provision for impairment) is used whencollection of the full amount is no longer probable. Bad debts are written off when identified.
Foreign currency transactions and balances
The functional and presentation currency of Burey Gold Limited is Australian dollars.
Transactions in foreign currencies are initially recorded in the functional currency at the exchange rates ruling atthe date of the transaction. Monetary assets and liabilities denominated in foreign currencies are retranslated atthe rate of exchange ruling at the end of the reporting period.
Foreign currency transactions are translated into the functional currency using the exchange rates ruling at thedate of the transaction. Monetary assets and liabilities denominated in foreign currencies are retranslated at therate of exchange ruling at the end of the reporting period. Foreign exchange gains and losses resulting fromsettling foreign currency transactions, as well as from restating foreign currency denominated monetary assetsand liabilities, are recognised in profit or loss, except when they are deferred in other comprehensive income asqualifying cash flow hedges or where they relate to differences on foreign currency borrowings that provide ahedge against a net investment in a foreign entity.
Non-monetary items that are measured in terms of historical cost in a foreign currency are translated using theexchange rate as at the date of the initial transaction.
Non-monetary items measured at fair value in a foreign currency are translated using the exchange rate at thedate the fair value was determined.
The functional currencies of the overseas subsidiaries are as follows:
Democratic Republic of Congo subsidiaries United States Dollars (USD)Guinean subsidiary United States Dollars (USD)Ghanaian subsidiary Ghanaian New Cedis (GHS)
At the end of the reporting period, the assets and liabilities of these overseas subsidiaries are translated into thepresentation currency of Burey Gold Limited at the closing rate at the end of the reporting period and incomeand expenses are translated at the weighted average exchange rates for the year. All resulting exchangedifferences are recognised in other comprehensive income as a separate component of equity (foreign currencytranslation reserve). On disposal of a foreign entity, the cumulative exchange differences recognised in foreigncurrency translation reserves relating to that particular foreign operation is recognised in profit or loss.
Taxes
Income tax
Deferred income tax is provided for on all temporary differences at reporting date between the tax base of assetsand liabilities and their carrying amounts for financial reporting purposes.
No deferred income tax will be recognised from the initial recognition of an asset or liability, excluding abusiness combination, where there is no effect on accounting or taxable profit or loss.
Deferred tax is calculated at the tax rates that are expected to apply to the period when the asset is realised orliability is settled. Deferred tax is credited in the statement of comprehensive income except where it relates toitems that may be credited directly to equity, in which case the deferred tax is adjusted directly against equity.
Deferred income tax assets are recognised to the extent that it is probable that future tax profits will be availableagainst which deductible temporary differences can be utilised.
For
per
sona
l use
onl
y
Burey Gold LimitedNotes to the Financial Statementsfor the year ended 30 June 2016
Page 32
1. SUMMARY OF SIGNIFICANT ACCOUNTING POLICIES – continued
Taxes (continued)
The amount of benefits brought to account or which may be realised in the future is based on the assumptionthat no adverse change will occur in income taxation legislation and the anticipation that the Group will derivesufficient future assessable income to enable the benefit to be realised and comply with the conditions ofdeductibility imposed by the law. The carrying amount of deferred tax assets is reviewed at each reporting dateand only recognised to the extent that sufficient future assessable income is expected to be obtained.
At the reporting date, the Directors have not made a decision to elect to be taxed as a single entity. Inaccordance with Australian Accounting Interpretations, “Substantive Enactment of Major Tax Bills inAustralia”, the financial effect of the legislation has therefore not been brought to account in the financialstatements for the year ended 30 June 2016, except to the extent that the adoption of the tax consolidation wouldimpair the carrying value of any deferred tax assets.
Deferred tax assets and deferred tax liabilities are offset only if a legally enforceable right exists to set offcurrent tax assets against current tax liabilities and the deferred tax assets and liabilities relate to the sametaxable entity and the same taxation authority.
Goods and Services Tax (GST)
Revenues, expenses and assets are recognised net of the amount of GST, except where the amount of GSTincurred is not recoverable from the Australian Tax Office. In these circumstances the GST is recognised as partof the cost of acquisition of the asset or as part of an item of the expense.
Receivables and payables on the statement of financial position are shown inclusive of GST.
Cash flows are presented in the statement of cash flows on a gross basis, except for the GST component ofinvesting and financing activities, which are disclosed as operating cash flows.
Commitments and contingencies are disclosed net of the amount of GST recoverable from, or payable to, thetaxation authority.
Investments and other financial assets
Financial assets in the scope of AASB 139 Financial Instruments: Recognition and Measurement are classifiedas loans and receivables. When financial assets are recognised initially, they are measured at fair value, plus, inthe case of investments not at fair value through profit or loss, directly attributable transactions costs. The Groupdetermines the classification of its financial assets after initial recognition and, when allowed and appropriate,re-evaluates this designation at each financial year-end.
Loans and receivables
During the year, the consolidated entity has held loans and receivables.
Loans and receivables are non-derivative financial assets with fixed or determinable payments that are notquoted in an active market. Such assets are carried at amortised cost using the effective interest method. Gainsand losses are recognised in profit or loss when the loans and receivables are derecognised or impaired, as wellas through the amortisation process.
Available-for-sale financial assets
Available-for-sale financial assets, comprising principally marketable equity securities, are non-derivatives thatare either designated in this category or not classified in any of the other categories. They are included in non-current assets unless management intends to dispose of the investment within 12 months of the reporting date.Investments are designated as available-for-sale if they do not have fixed maturities and fixed or determinablepayments and management intends to hold them for the medium to long term.
For
per
sona
l use
onl
y
Burey Gold LimitedNotes to the Financial Statementsfor the year ended 30 June 2016
Page 33
1. SUMMARY OF SIGNIFICANT ACCOUNTING POLICIES – continued
Investments and other financial assets (continued)
Investments are initially recognised at fair value plus transaction costs for all financial assets not carried at fairvalue through profit or loss. Changes in the fair value of securities classified as available-for-sale assets arerecognised in equity. The group assesses at each balance date whether there is objective evidence that a financialasset or group of financial assets is impaired. In the case of equity securities classified as available-for-sale, asignificant or prolonged decline in the fair value of a security below its cost is considered as an indicator that thesecurities are impaired. If any such evidence exists for available-for-sale financial assets, the cumulative lossmeasured as the difference between the acquisition cost and the current fair value, less any impairment loss onthat financial asset previously recognised in profit or loss is removed from equity and recognised in the profitand loss.
Property, plant and equipment
Items of plant and equipment are carried at cost less accumulated depreciation and impairment losses (seeaccounting policy “impairment testing”).
Plant and equipment
Plant and equipment acquired is initially recorded at their cost of acquisition at the date of acquisition, being thefair value of the consideration provided plus incidental costs directly attributable to the acquisition.
Subsequent costs are included in the asset’s carrying amount or recognised as a separate asset, as appropriate,only when it is probable that future economic benefits associated with the item will flow to the consolidatedentity and the cost of the item can be measured reliably. All other repairs and maintenance are charged to thestatement of comprehensive income during the financial period in which they are incurred.
Depreciation
All assets have limited useful lives and are depreciated using the straight line method over their estimated usefullives commencing from the time the asset is held ready for use.
Depreciation and amortisation rates and methods are reviewed annually for appropriateness. When changes aremade, adjustments are reflected prospectively in current and future periods only. The estimated useful livesused in the calculation of depreciation for plant and equipment for the current and corresponding period arebetween three and ten years.
Gains and losses on disposals are determined by comparing proceeds with the carrying amount. These gainsand losses are included in the statement of comprehensive income. When revalued assets are sold, amountsincluded in the revaluation reserve relating to that asset are transferred to retained earnings, through othercomprehensive income.
Mineral interest acquisition, exploration and development expenditure
Mineral interest acquisition, exploration and evaluation expenditure incurred is accumulated in respect of eachidentifiable area of interest. These costs are only carried forward to the extent that the Group’s rights of tenureto that area of interest are current and either the costs are expected to be recouped through the successfuldevelopment and commercial exploitation of the area of interest or where exploration activities in the area ofinterest have not yet reached a stage that permits reasonable assessment of the existence of economicallyrecoverable reserves and active and significant operations, in, or in relation to, the area of interest arecontinuing.
Accumulated costs in relation to an abandoned area are written off in full against profit in the year in which thedecision to abandon the area is made.
For
per
sona
l use
onl
y
Burey Gold LimitedNotes to the Financial Statementsfor the year ended 30 June 2016
Page 34
1. SUMMARY OF SIGNIFICANT ACCOUNTING POLICIES – continued
Mineral interest acquisition, exploration and development expenditure (continued)
Exploration and evaluation assets are assessed for impairment if (i) sufficient data exists to determine technicalfeasibility and commercial viability, and (ii) facts and circumstances suggest that the carrying amount exceedsthe recoverable amount (see impairment accounting policy).
Impairment testing
The carrying amount of the consolidated entity’s assets, other than deferred tax assets, are reviewed at eachreporting date to determine whether there is any indication of impairment. Where such an indication exists, aformal assessment of recoverable amount is then made and where this is in excess of carrying amount, the assetis written down to its recoverable amount.
Recoverable amount is the greater of fair value less costs to sell and value in use. Value in use is the presentvalue of the future cash flows expected to be derived from the asset or cash generating unit. In estimating valuein use, a pre-tax discount rate is used which reflects current market assessments of the time value of money andthe risks specific to the asset. Any resulting impairment loss is recognised immediately in the statement ofcomprehensive income.
Impairment losses are reversed when there is an indication that the impairment loss may no longer exist andthere has been a change in the estimate used to determine the recoverable amount. An impairment loss isreversed only to the extent that the assets’ carrying amount does not exceed the carrying amount that wouldhave been determined, net of depreciation or amortisation, if no impairment loss had been recognised.
Trade and other payables
Trade payables and other payables are carried at amortised costs and represent liabilities for goods and servicesprovided to the consolidated entity prior to the end of the financial year that are unpaid and arise when theconsolidated entity becomes obliged to make future payments in respect of the purchase of these goods andservices.
Employee benefits
Wages, salaries and annual leave
Liabilities for wages and salaries, including non-monetary benefits and annual leave expected to be settledwithin 12 months of the reporting date are recognised in other payables in respect of employees’ services up tothe reporting date. They are measured at the amounts expected to be paid when the liabilities are settled.
Contributions are made by the consolidated entity to superannuation funds as stipulated by statutoryrequirements and are charged as expenses when incurred.
Long service leave
The liability for long service leave is recognised in the provision for employee benefits and measured as thepresent value of expected future payments to be made in respect of services provided by employees up to thereporting date using the projected unit credit method. Consideration is given to expected future wage and salarylevels, experience of employee departures and periods of service. Expected future payments are discountedusing market yields at the reporting date on national government bonds with terms to maturity and currency thatmatch, as closely as possible, the estimated future cash outflows.
For
per
sona
l use
onl
y
Burey Gold LimitedNotes to the Financial Statementsfor the year ended 30 June 2016
Page 35
1. SUMMARY OF SIGNIFICANT ACCOUNTING POLICIES – continued
Contributed equity
Ordinary shares are classified as equity. Incremental costs directly attributable to the issue of new shares oroptions are shown in equity as a deduction, net of tax, from the proceeds.
Earnings per share
Basic earnings per share is determined by dividing the net result attributable to members, adjusted to excludecosts of servicing equity (other than dividends), by the weighted average number of ordinary shares, adjusted forany bonus element.
Diluted earnings per share is determined by dividing the net result attributable to members, adjusted to excludecosts of servicing equity (other than dividends) and any expenses associated with dividends and interest ofdilutive potential ordinary shares, by the weighted average number of ordinary shares (both issued andpotentially dilutive) adjusted for any bonus element.
Share based payments
The Group provides compensation benefits to employees (including directors) of the Group in the form of share-based payment transactions, whereby employees render services in exchange for shares or rights over shares(‘equity-settled transactions’).
The cost of these equity-settled transactions with employees is measured by reference to the fair value at thedate at which they are granted. The fair value is determined by a Black Scholes model or similar such marketbased valuation models.
The cost of equity-settled transactions is recognised, together with a corresponding increase in equity, over theperiod in which the performance conditions are fulfilled, ending on the date on which the relevant employeesbecome fully entitled to the award (‘vesting date’).
The cumulative expense recognised for equity-settled transactions at each reporting date until vesting datereflects (i) the extent to which the vesting period has expired and (ii) the number of awards that, in the opinionof the directors of the Group, will ultimately vest. This opinion is formed based on the best availableinformation at reporting date. No adjustment is made for the likelihood of market performance conditions beingmet as the effect of these conditions is included in the determination of fair value at grant date.
No expense is recognised for awards that do not ultimately vest, except for awards where vesting is conditionalupon a market condition.
Where the terms of an equity-settled award are modified, as a minimum an expense is recognised as if the termshad not been modified. In addition, an expense is recognised for any increase in the value of the transaction as aresult of the modification, as measured at the date of modification.
Where an equity-settled award is cancelled, it is treated as if it had vested on the date of cancellation, and anyexpense not yet recognised for the award is recognised immediately. However, if a new award is substituted forthe cancelled award, and designated as a replacement award on the date that it is granted, the cancelled and newaward are treated as if they were a modification of the original award, as described in the previous paragraph.
The dilutive effect, if any, of outstanding options is reflected as additional share dilution in the computation ofearnings per share.
For
per
sona
l use
onl
y
Burey Gold LimitedNotes to the Financial Statementsfor the year ended 30 June 2016
Page 36
1. SUMMARY OF SIGNIFICANT ACCOUNTING POLICIES – continued
Segment reporting
Operating segments are reported in a manner consistent with the internal reporting provided to the chiefoperating decision maker. The chief decision maker has been identified as the Board of Directors.
Critical accounting estimates
The preparation of financial statements in conformity with AIFRS requires the use of certain critical accountingestimates. It also requires management to exercise its judgement in the process of applying the Group’saccounting policies. The areas that may have a significant risk of causing a material adjustment to the carryingamounts of certain assets and liabilities within the next annual reporting period are:
(a) Exploration and evaluation expenditure
In accordance with accounting policy note described above under “Mineral interest acquisition, exploration anddevelopment expenditure” the Board determines when an area of interest should be abandoned. When a decisionis made that an area of interest is not commercially viable, all costs that have been capitalised in respect of thatarea of interest are written off. In determining this, assumptions, including the maintenance of title, ongoingexpenditure and prospectivity are made. As described in Note 18, under existing contractual terms ofshareholders agreements a feasibility study was required to be completed by January 2016 at the Giro GoldProject, with a grace period of a further 12 months allowed for under the terms in order for the parties tonegotiate an equitable outcome.Failure to do so may adversely affect the Group’s tenure at the Giro GoldProject. Based on previous discussions and negotiations with Societe Miniere De Kilo Moto (“Sokimo”), alimited liability company wholly owned by the DRC Government (the original holder of the Giro exploitationpermits), an understanding was reached between the parties, including Sokimo, that the deadline for completionof the feasibility study would be extended to at least January 2018. With the further passage of time, the partiesare now negotiating a later date. Formal amendments to the shareholders agreement have not yet been made toreflect that understanding. The ultimate recoupment of capitalised expenditure at the Giro Project is thereforedependent amongst other things on the Group maintaining its rights of tenure.
(b) Share Based Payments to employees
The consolidated entity measures the cost of equity-settled transactions with employees by reference to the fairvalue of the equity instruments at the date at which they are granted. The fair value of options with non-marketconditions is determined by an internal valuation using a Black-Scholes option pricing model taking intoaccount the terms and conditions upon which the instruments were granted. The fair value of performance rightswith market conditions is determined by an internal valuation using a Trinomial Barrier option pricing model.
(c) Control Over Subsidiaries
In determining whether the consolidated group has control over subsidiaries that are not wholly owned,judgement is applied to assess the ability of the consolidated group to control the day to day activities of thepartly owned subsidiary and its economic outcomes. In exercising this judgement, the commercial and legalrelationships that the consolidated group has with other owners of partly owned subsidiaries are taken intoconsideration. Whilst the consolidated group is not able to control all activities of a partly owned subsidiary, thepartly owned subsidiary is consolidated within the consolidated group where it is determined that theconsolidated group controls the day to day activities and economic outcomes of a partly owned subsidiary.Changes in agreements with other owners of partly owned subsidiaries could result in a loss of control andsubsequently de-consolidation.
During the year ended 30 June 2015, Burey Gold Limited acquired 85% of the issued shares of AmaniConsulting sarl (Amani) by the issue of shares, options and cash. Amani holds a 65% shareholding in GiroGoldfields Exploration sarl (Giro). Giro explores the Giro gold project in the Oriental Province, northeast DRC.
For
per
sona
l use
onl
y
Burey Gold LimitedNotes to the Financial Statementsfor the year ended 30 June 2016
Page 37
1. SUMMARY OF SIGNIFICANT ACCOUNTING POLICIES – continued
Critical accounting estimates (contined)
Under the terms of shareholders agreements the Company is at this stage solely responsible for fundingexploration activities and therefore has control over the day to day activities and economic outcomes of Amani
and Giro. Future changes to the shareholders agreements may impact on the ability of the Company to controlAmani and Giro.
(d) Contingent liabilities
Under the terms of the agreement to acquire an interest in Amani Consulting sarl (Amani) the Company may beliable in the future to make additional payments subject to certain events occurring as described in Note 18.
After an assessment of the conditions that would require these payments to be made in the future, the Companyhas judged that these possible future payments are a contingent liability.
Change in circumstances or the future occurrence of specified events may cause liabilities that are currentlyassessed as being contingent to be reclassified as financial liabilities.
(e) Tax in foreign jurisdictions
The consolidated entity operates in overseas jurisdictions and accordingly is required to comply with thetaxation requirements of those relevant countries. This results in the consolidated entity making estimates inrelation to taxes including but not limited to income tax, goods and services tax, withholding tax and employeeincome tax. The consolidated entity estimates its tax liabilities based on the consolidated entity’s understandingof the tax law. Where the final outcome of these matters is different from the amounts that were initiallyrecorded, such differences will impact profit or loss in the period in which they are settled.
For
per
sona
l use
onl
y
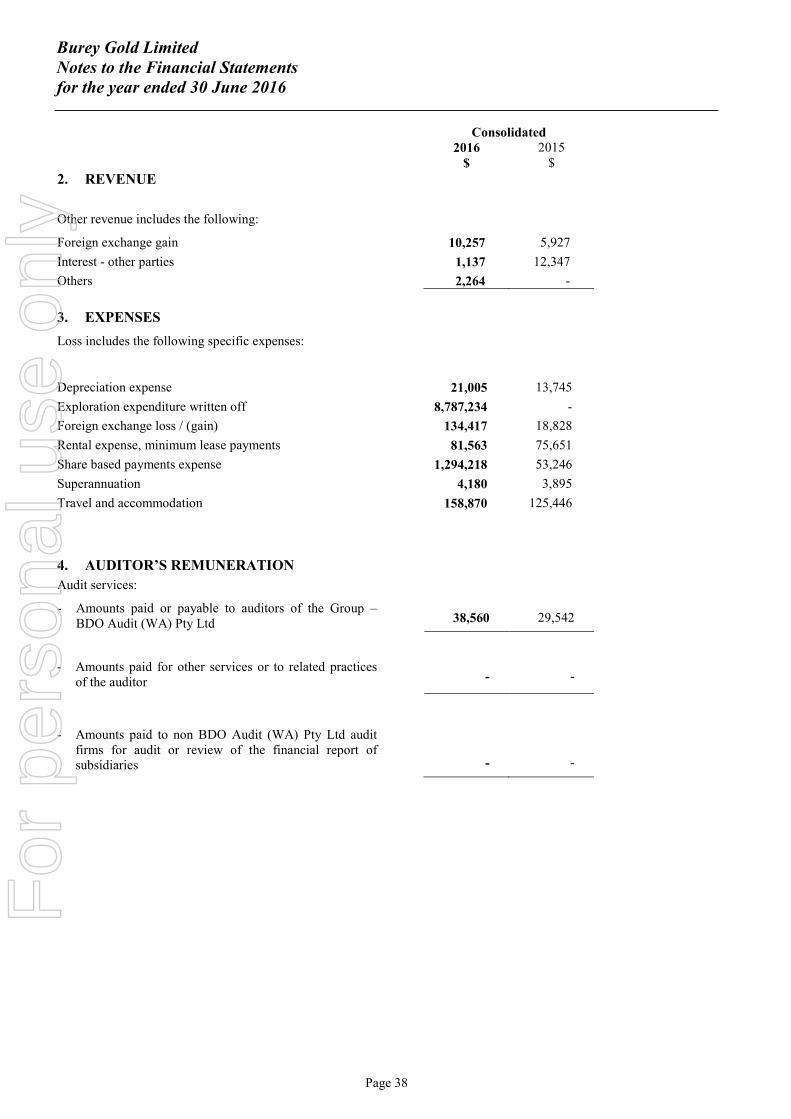
Burey Gold LimitedNotes to the Financial Statementsfor the year ended 30 June 2016
Page 38
Consolidated2016 2015
$ $
2. REVENUE
Other revenue includes the following:
Foreign exchange gain 10,257 5,927
Interest - other parties
Others
1,137
2,264
12,347
-
3. EXPENSES
Loss includes the following specific expenses:
Depreciation expense 21,005 13,745
Exploration expenditure written off 8,787,234 -
Foreign exchange loss / (gain) 134,417 18,828
Rental expense, minimum lease payments 81,563 75,651
Share based payments expense 1,294,218 53,246
Superannuation 4,180 3,895
Travel and accommodation 158,870 125,446
4. AUDITOR’S REMUNERATION
Audit services:
- Amounts paid or payable to auditors of the Group –BDO Audit (WA) Pty Ltd 38,560 29,542
- Amounts paid for other services or to related practicesof the auditor - -
- Amounts paid to non BDO Audit (WA) Pty Ltd auditfirms for audit or review of the financial report ofsubsidiaries - -
For
per
sona
l use
onl
y
Burey Gold LimitedNotes to the Financial Statementsfor the year ended 30 June 2016
Page 39
Consolidated2016 2015$ $
5. INCOME TAX EXPENSE
(a) The prima facie tax benefit at 30% on loss for the yearis reconciled to the income tax provided in thefinancial statements as follows:
Loss before income tax 12,411,305 1,236,667
Prima facie income tax benefit @ 30% 3,723,392 371,000Tax effect of permanent differences:
Capital raising costs 60,275 71,737Legal fees - (23,096)Exploration expenses (622,714) 1,346,033Employee option expense / share based payments (388,265) (15,974)
2,772,688 1,749,700
Income tax benefit not brought to account (2,772,688) (1,749,700)
Income tax expense - -
(b) The following deferred tax balances have not beenrecognised:
Deferred Tax Assets at 30%:
- Carry forward revenue losses 10,334,488 7,583,401
- Capital raising costs 180,122 92,915
- Provisions and accruals (3,000) 1,800
10,511,610 7,678,116
The tax benefits of the above deferred tax assets will only be obtained if: the Group derives future assessable income of a nature and of an amount sufficient to enable the benefits to be
utilised; the Group continues to comply with the conditions for deductibility imposed by law; and no changes in income tax legislation adversely affect the Group in utilising benefits.
Deferred tax liabilities in relation to capitalised exploration costs have been recognised and offset against deferredtax assets above.
Consolidated
2016Cents
2015cents
6. EARNINGS PER SHARE
Basic and diluted loss per share (1.56) (0.22)
2016Number
2015Number
Weighted average number of ordinary shares used in thecalculation of basic and diluted loss per share 794,854,611 538,900,730
The Company’s potential ordinary shares, being its options granted, are not considered dilutive as the conversion ofthese options would result in a decrease in the net loss per share.
For
per
sona
l use
onl
y
Burey Gold LimitedNotes to the Financial Statementsfor the year ended 30 June 2016
Page 40
7. SEGMENT INFORMATION
Management has determined that the Group has one reportable segment, being mineral exploration in Africa. As theGroup is focused on mineral exploration, the Board monitors the Group based on actual versus budgeted explorationexpenditure incurred by area of interest. This internal reporting framework is the most relevant to assist the Board withmaking decisions regarding the Group and its ongoing exploration activities, while also taking into consideration theresults of exploration work that has been performed to date.
Consolidated2016 2015$ $
Revenue from external sources - -
Reportable segment loss (8,949,522) (203,733)
Reportable segment assets 16,435,327 17,964,111
Reportable segment liabilities (500,231) (898,054)
Reconciliation of reportable segment profit or loss
Reportable segment loss (8,949,522) (203,733)
Other revenue / income 11,394 18,274
Unallocated:
Corporate expenses (3,473,177) (1,051,208)
Loss before tax (12,411,305) (1,236,667)
Reconciliation of reportable segment assets to total assetsand liabilities
Segment assets 16,435,327 17,964,111
Unallocated:
Corporate assets 313,547 675,530
Available for sale asset - 486,291
16,748,874 19,125,932
Segment liabilities (500,231) (898,054)
Unallocated:
Corporate assets (172,976) (70,169)
(673,207) (968,224)
Consolidated2016 2015$ $
8. CASH AND CASH EQUIVALENTS
Cash at bank and in hand 416,453 769,081
- Cash at bank earns interest at floating rates based on daily bank deposit rates. Refer note 17(iv)
- In 2015, an amount of $10,000 was held as a deposit as collateral for the provision of credit card facilities usedby an employee of the consolidated entity in the course of his employment. This amount is not included in note8, cash and cash equivalents.
For
per
sona
l use
onl
y
Burey Gold LimitedNotes to the Financial Statementsfor the year ended 30 June 2016
Page 41
Consolidated2016 2015$ $
9. OTHER RECEIVABLES
Current
Prepayments - -Other receivables 82,996 104,139
82,996 104,139
Loan receivable (i) 158,583 -
Non-Current
Other receivable (ii) - 20,125
(i) During the year, Burey provided a short term loan which is unsecured, interest free and repayable upon demand.(ii) $10,000 deposit held as collateral for the provision of credit card facilities used by an employee of the consolidated
entity in the course of his employment and $10,125 security deposit for office premises.
Refer to notes 17(a) and 17(b) for information about the Group’s exposure to credit and liquidity risk.
Consolidated2016 2015$ $
10. AVAILABLE FOR SALE FINANCIAL ASSET
Listed securities – overseas equity securities
Balance at the beginning of the year 486,291 872,115
Additions - -
Fair value adjustment as at balance sheet date (486,291) (385,824)
Carrying amount at the end of the year - 486,291
Available-for-sale financial assets comprise of an investment in the share capital of US Over the Counter listed, Blox, Inc.The shares in Blox, Inc. were received as partial consideration for the sale of the Group’s interest in the Mansounia GoldProject. The investment is recorded at cost and is marked to market at the balance date with changes recognised directly inother comprehensive income. The Group is exposed to security price risk. This arises from investments held by the Groupin entities listed on a stock exchange. Due to the low value of the investment, security price risk is not considered materialto the Group.
The financial assets are classified as non-current unless they mature, or management intends to dispose of them within12 months of the end of the accounting period. Available for sale financial assets are level 1 financial assets as prescribedunder the accounting standards. The financial asset was fully impaired during the year due to low volume and inactiveshare trading.
For
per
sona
l use
onl
y
Burey Gold LimitedNotes to the Financial Statementsfor the year ended 30 June 2016
Page 42
11. PROPERTY, PLANT AND EQUIPMENT Consolidated
2016 2015$ $
Plant and equipment
At cost 148,795 368,568
Less accumulated depreciation (108,982) (289,171)
39,813 79,397
ReconciliationMovement in the carrying amounts for each class of property,plant and equipment between the beginning and the end of thecurrent financial period.
Balance at the beginning of the year 79,397 44,095
Asset acquisition – Giro project (Note 23) - 39,567
Additions - 4,330
Disposals (18,359) -
Depreciation expense (21,004) (13,836)
Depreciation capitalised to exploration (10,721) (11,299)
Foreign currency translation difference movement 10,500 16,540
Carrying amount at the end of the year 39,812 79,397
Consolidated
12. EXPLORATION AND EVALUATIONEXPENDITURE
2016$
2015$
Exploration and evaluation phase – at cost
Balance at the beginning of the year 17,666,899 5,818,071
Asset acquisition – Giro project (Note 23) - 4,710,638
Expenditure incurred during the year 6,711,520 4,486,776
Exploration expenditure written off during the year (Balatindiproject) (8,787,234) -
Foreign currency translation difference movement 459,844 2,651,414
Carrying amount at the end of the year 16,051,030 17,666,899
The expenditure above relates principally to the exploration and evaluation phase. The ultimate recoupment of thisexpenditure is dependent upon the successful development and commercial exploitation, or alternatively, sale of therespective areas of interest.
Consolidated
2016 2015
$ $
13a. TRADE AND OTHER PAYABLES
Current
Trade payables 270,029 646,956
270,029 646,956
Terms and conditions relating to the above financial instruments:
- Trade and other creditors are non-interest bearing and are normally settled on 30 day terms.
Risk exposure:
- Information about the group’s risk exposure to foreign exchange risk is provided in note 17.
For
per
sona
l use
onl
y
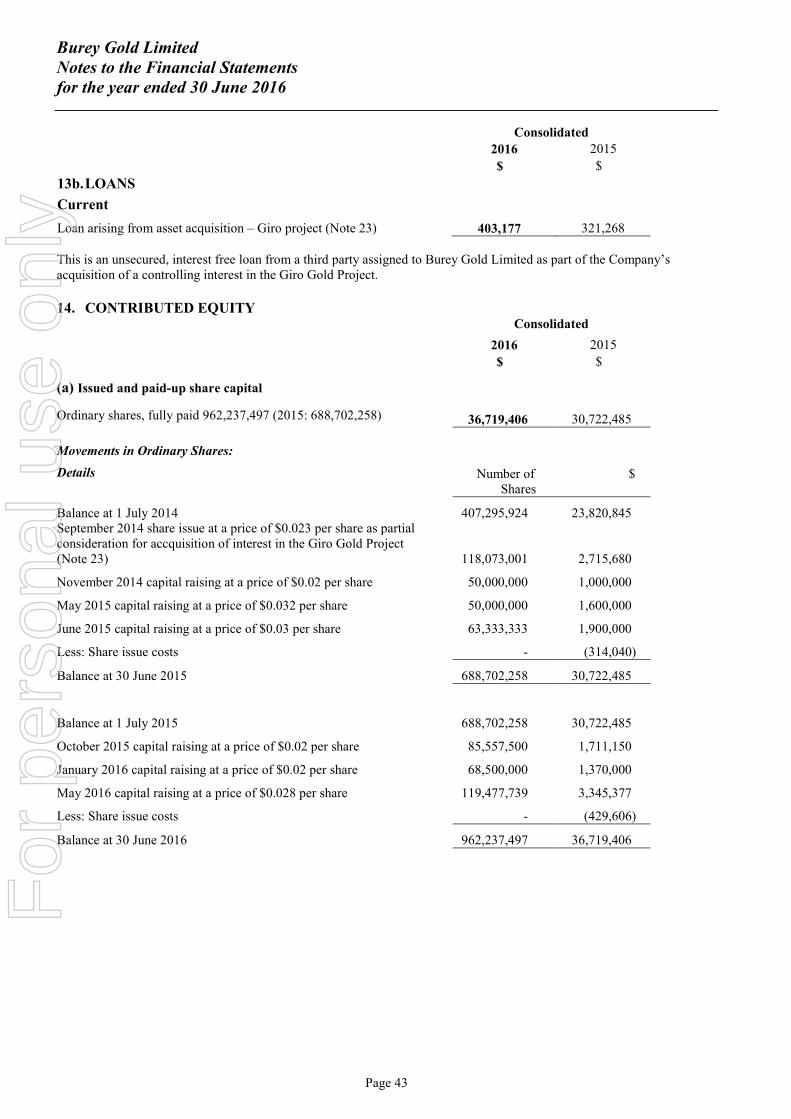
Burey Gold LimitedNotes to the Financial Statementsfor the year ended 30 June 2016
Page 43
Consolidated
2016 2015
$ $
13b.LOANS
Current
Loan arising from asset acquisition – Giro project (Note 23) 403,177 321,268
This is an unsecured, interest free loan from a third party assigned to Burey Gold Limited as part of the Company’sacquisition of a controlling interest in the Giro Gold Project.
14. CONTRIBUTED EQUITYConsolidated
2016 2015
$ $
(a) Issued and paid-up share capital
Ordinary shares, fully paid 962,237,497 (2015: 688,702,258) 36,719,406 30,722,485
Movements in Ordinary Shares:
Details Number ofShares
$
Balance at 1 July 2014 407,295,924 23,820,845September 2014 share issue at a price of $0.023 per share as partialconsideration for accquisition of interest in the Giro Gold Project(Note 23) 118,073,001 2,715,680
November 2014 capital raising at a price of $0.02 per share 50,000,000 1,000,000
May 2015 capital raising at a price of $0.032 per share 50,000,000 1,600,000
June 2015 capital raising at a price of $0.03 per share 63,333,333 1,900,000
Less: Share issue costs - (314,040)
Balance at 30 June 2015 688,702,258 30,722,485
Balance at 1 July 2015 688,702,258 30,722,485
October 2015 capital raising at a price of $0.02 per share 85,557,500 1,711,150
January 2016 capital raising at a price of $0.02 per share 68,500,000 1,370,000
May 2016 capital raising at a price of $0.028 per share 119,477,739 3,345,377
Less: Share issue costs - (429,606)
Balance at 30 June 2016 962,237,497 36,719,406
For
per
sona
l use
onl
y
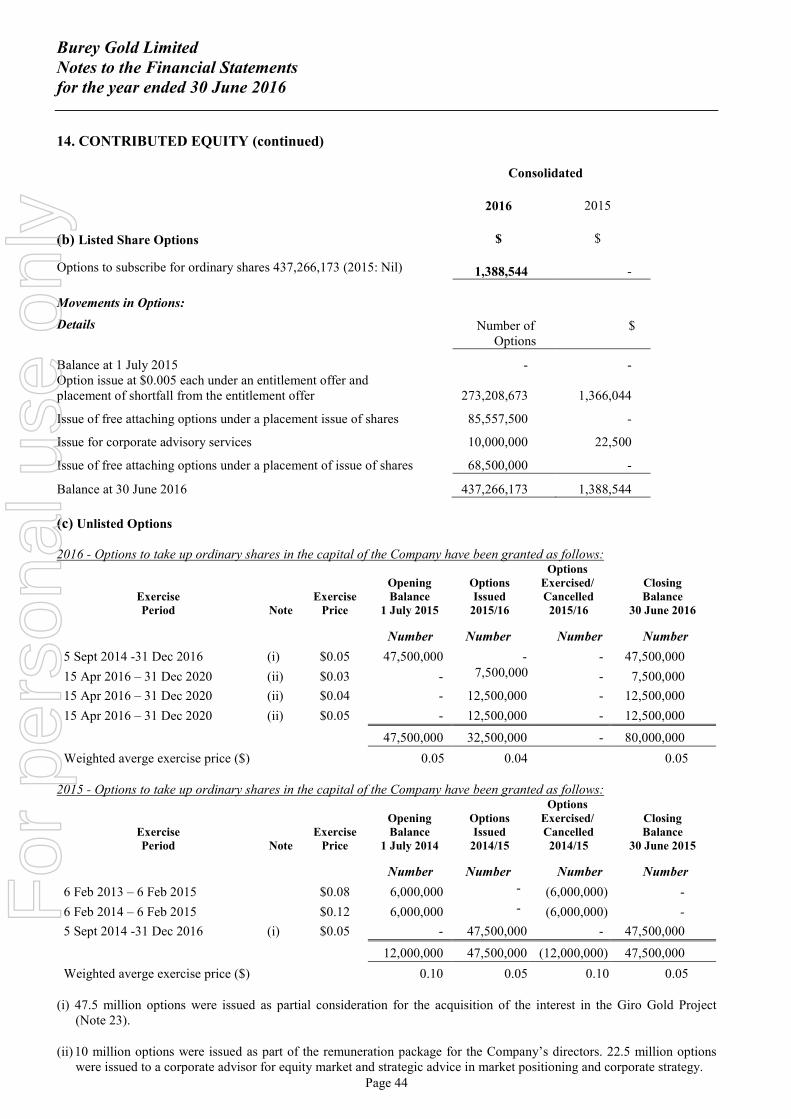
Burey Gold LimitedNotes to the Financial Statementsfor the year ended 30 June 2016
Page 44
14. CONTRIBUTED EQUITY (continued)
Consolidated
2016 2015
(b) Listed Share Options $ $
Options to subscribe for ordinary shares 437,266,173 (2015: Nil) 1,388,544 -
Movements in Options:
Details Number ofOptions
$
Balance at 1 July 2015 - -Option issue at $0.005 each under an entitlement offer andplacement of shortfall from the entitlement offer 273,208,673 1,366,044
Issue of free attaching options under a placement issue of shares 85,557,500 -
Issue for corporate advisory services 10,000,000 22,500
Issue of free attaching options under a placement of issue of shares 68,500,000 -
Balance at 30 June 2016 437,266,173 1,388,544
(c) Unlisted Options
2016 - Options to take up ordinary shares in the capital of the Company have been granted as follows:
ExercisePeriod Note
ExercisePrice
OpeningBalance
1 July 2015
OptionsIssued
2015/16
OptionsExercised/Cancelled2015/16
ClosingBalance
30 June 2016
Number Number Number Number
5 Sept 2014 -31 Dec 2016 (i) $0.05 47,500,000 - - 47,500,000
15 Apr 2016 – 31 Dec 2020 (ii) $0.03 - 7,500,000 - 7,500,000
15 Apr 2016 – 31 Dec 2020 (ii) $0.04 - 12,500,000 - 12,500,000
15 Apr 2016 – 31 Dec 2020 (ii) $0.05 - 12,500,000 - 12,500,000
47,500,000 32,500,000 - 80,000,000
Weighted averge exercise price ($) 0.05 0.04 0.05
2015 - Options to take up ordinary shares in the capital of the Company have been granted as follows:
ExercisePeriod Note
ExercisePrice
OpeningBalance
1 July 2014
OptionsIssued
2014/15
OptionsExercised/Cancelled2014/15
ClosingBalance
30 June 2015
Number Number Number Number
6 Feb 2013 – 6 Feb 2015 $0.08 6,000,000 - (6,000,000) -
6 Feb 2014 – 6 Feb 2015 $0.12 6,000,000 - (6,000,000) -
5 Sept 2014 -31 Dec 2016 (i) $0.05 - 47,500,000 - 47,500,000
12,000,000 47,500,000 (12,000,000) 47,500,000
Weighted averge exercise price ($) 0.10 0.05 0.10 0.05
(i) 47.5 million options were issued as partial consideration for the acquisition of the interest in the Giro Gold Project(Note 23).
(ii) 10 million options were issued as part of the remuneration package for the Company’s directors. 22.5 million optionswere issued to a corporate advisor for equity market and strategic advice in market positioning and corporate strategy.
For
per
sona
l use
onl
y
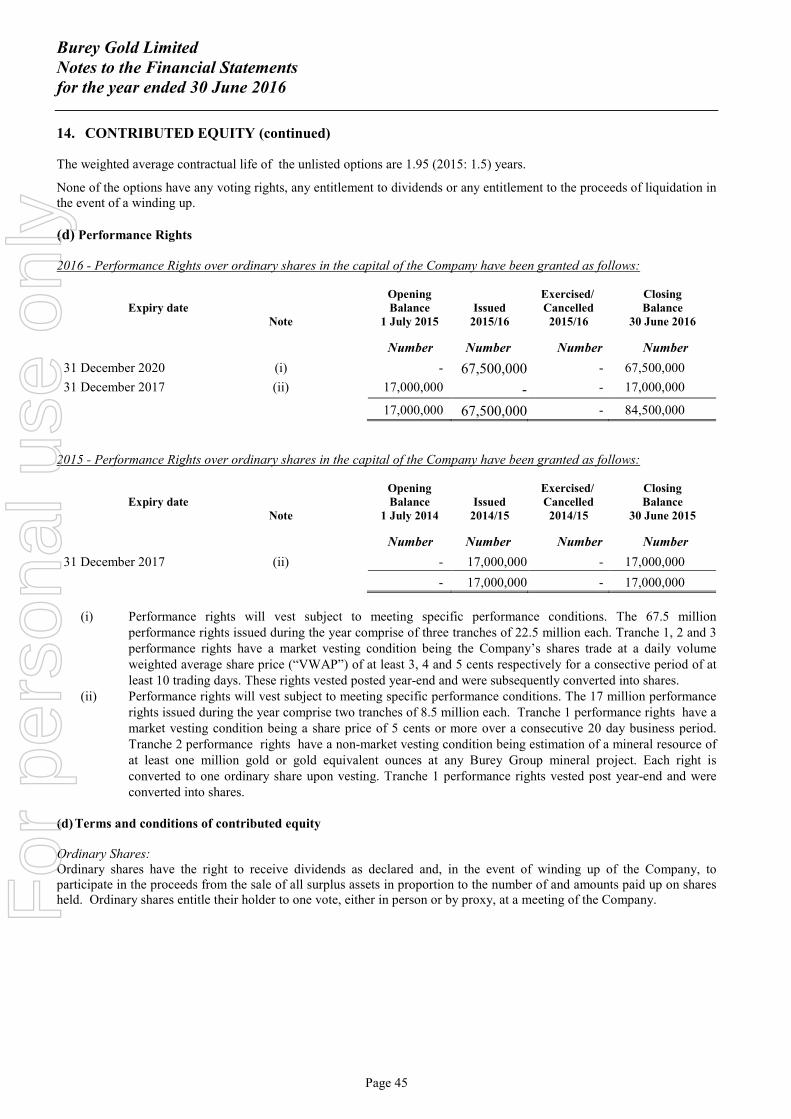
Burey Gold LimitedNotes to the Financial Statementsfor the year ended 30 June 2016
Page 45
14. CONTRIBUTED EQUITY (continued)
The weighted average contractual life of the unlisted options are 1.95 (2015: 1.5) years.
None of the options have any voting rights, any entitlement to dividends or any entitlement to the proceeds of liquidation inthe event of a winding up.
(d) Performance Rights
2016 - Performance Rights over ordinary shares in the capital of the Company have been granted as follows:
Expiry dateNote
OpeningBalance
1 July 2015Issued
2015/16
Exercised/Cancelled2015/16
ClosingBalance
30 June 2016
Number Number Number Number
31 December 2020
31 December 2017
(i)
(ii)
-
17,000,000
67,500,000
-
-
-
67,500,000
17,000,000
17,000,000 67,500,000 - 84,500,000
2015 - Performance Rights over ordinary shares in the capital of the Company have been granted as follows:
Expiry dateNote
OpeningBalance
1 July 2014Issued
2014/15
Exercised/Cancelled2014/15
ClosingBalance
30 June 2015
Number Number Number Number
31 December 2017 (ii) - 17,000,000 - 17,000,000
- 17,000,000 - 17,000,000
(i) Performance rights will vest subject to meeting specific performance conditions. The 67.5 millionperformance rights issued during the year comprise of three tranches of 22.5 million each. Tranche 1, 2 and 3performance rights have a market vesting condition being the Company’s shares trade at a daily volumeweighted average share price (“VWAP”) of at least 3, 4 and 5 cents respectively for a consective period of atleast 10 trading days. These rights vested posted year-end and were subsequently converted into shares.
(ii) Performance rights will vest subject to meeting specific performance conditions. The 17 million performancerights issued during the year comprise two tranches of 8.5 million each. Tranche 1 performance rights have amarket vesting condition being a share price of 5 cents or more over a consecutive 20 day business period.Tranche 2 performance rights have a non-market vesting condition being estimation of a mineral resource ofat least one million gold or gold equivalent ounces at any Burey Group mineral project. Each right isconverted to one ordinary share upon vesting. Tranche 1 performance rights vested post year-end and wereconverted into shares.
(d)Terms and conditions of contributed equity
Ordinary Shares:Ordinary shares have the right to receive dividends as declared and, in the event of winding up of the Company, toparticipate in the proceeds from the sale of all surplus assets in proportion to the number of and amounts paid up on sharesheld. Ordinary shares entitle their holder to one vote, either in person or by proxy, at a meeting of the Company.F
or p
erso
nal u
se o
nly
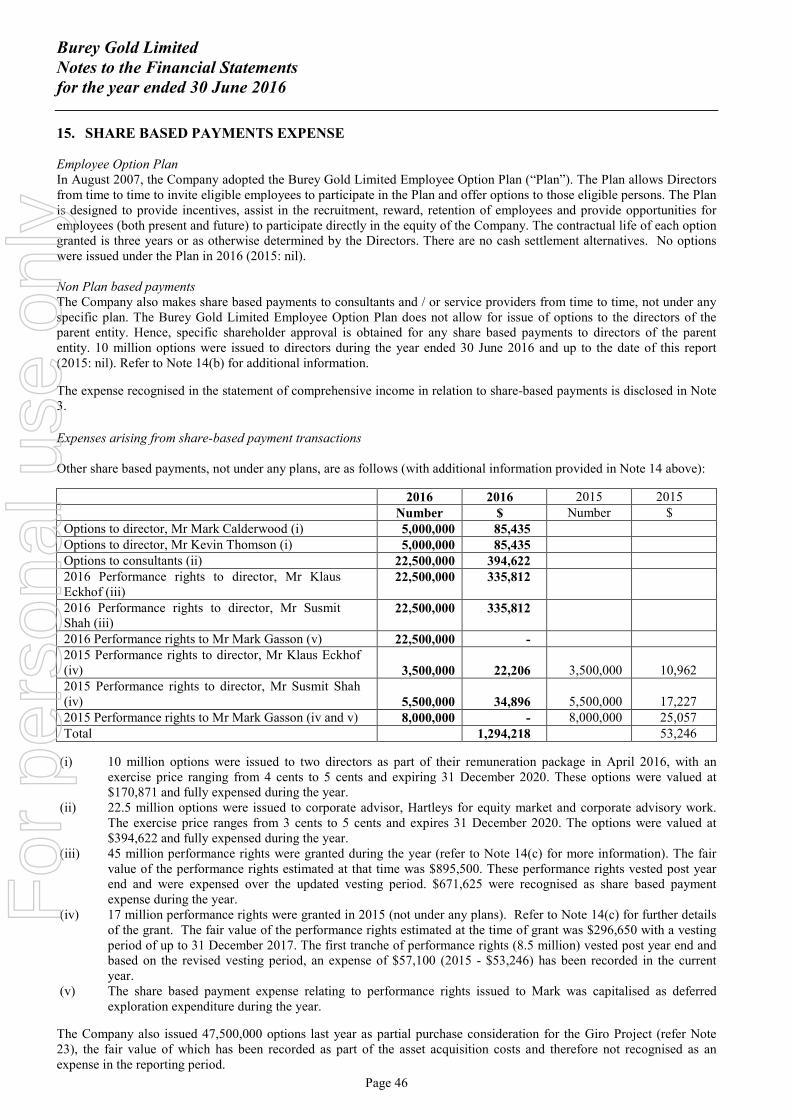
Burey Gold LimitedNotes to the Financial Statementsfor the year ended 30 June 2016
Page 46
15. SHARE BASED PAYMENTS EXPENSE
Employee Option PlanIn August 2007, the Company adopted the Burey Gold Limited Employee Option Plan (“Plan”). The Plan allows Directorsfrom time to time to invite eligible employees to participate in the Plan and offer options to those eligible persons. The Planis designed to provide incentives, assist in the recruitment, reward, retention of employees and provide opportunities foremployees (both present and future) to participate directly in the equity of the Company. The contractual life of each optiongranted is three years or as otherwise determined by the Directors. There are no cash settlement alternatives. No optionswere issued under the Plan in 2016 (2015: nil).
Non Plan based paymentsThe Company also makes share based payments to consultants and / or service providers from time to time, not under anyspecific plan. The Burey Gold Limited Employee Option Plan does not allow for issue of options to the directors of theparent entity. Hence, specific shareholder approval is obtained for any share based payments to directors of the parententity. 10 million options were issued to directors during the year ended 30 June 2016 and up to the date of this report(2015: nil). Refer to Note 14(b) for additional information.
The expense recognised in the statement of comprehensive income in relation to share-based payments is disclosed in Note3.
Expenses arising from share-based payment transactions
Other share based payments, not under any plans, are as follows (with additional information provided in Note 14 above):
2016 2016 2015 2015Number $ Number $
Options to director, Mr Mark Calderwood (i) 5,000,000 85,435Options to director, Mr Kevin Thomson (i) 5,000,000 85,435Options to consultants (ii) 22,500,000 394,6222016 Performance rights to director, Mr KlausEckhof (iii)
22,500,000 335,812
2016 Performance rights to director, Mr SusmitShah (iii)
22,500,000 335,812
2016 Performance rights to Mr Mark Gasson (v) 22,500,000 -2015 Performance rights to director, Mr Klaus Eckhof(iv) 3,500,000 22,206 3,500,000 10,9622015 Performance rights to director, Mr Susmit Shah(iv) 5,500,000 34,896 5,500,000 17,2272015 Performance rights to Mr Mark Gasson (iv and v) 8,000,000 - 8,000,000 25,057Total 1,294,218 53,246
(i) 10 million options were issued to two directors as part of their remuneration package in April 2016, with anexercise price ranging from 4 cents to 5 cents and expiring 31 December 2020. These options were valued at$170,871 and fully expensed during the year.
(ii) 22.5 million options were issued to corporate advisor, Hartleys for equity market and corporate advisory work.The exercise price ranges from 3 cents to 5 cents and expires 31 December 2020. The options were valued at$394,622 and fully expensed during the year.
(iii) 45 million performance rights were granted during the year (refer to Note 14(c) for more information). The fairvalue of the performance rights estimated at that time was $895,500. These performance rights vested post yearend and were expensed over the updated vesting period. $671,625 were recognised as share based paymentexpense during the year.
(iv) 17 million performance rights were granted in 2015 (not under any plans). Refer to Note 14(c) for further detailsof the grant. The fair value of the performance rights estimated at the time of grant was $296,650 with a vestingperiod of up to 31 December 2017. The first tranche of performance rights (8.5 million) vested post year end andbased on the revised vesting period, an expense of $57,100 (2015 - $53,246) has been recorded in the currentyear.
(v) The share based payment expense relating to performance rights issued to Mark was capitalised as deferredexploration expenditure during the year.
The Company also issued 47,500,000 options last year as partial purchase consideration for the Giro Project (refer Note23), the fair value of which has been recorded as part of the asset acquisition costs and therefore not recognised as anexpense in the reporting period.
For
per
sona
l use
onl
y
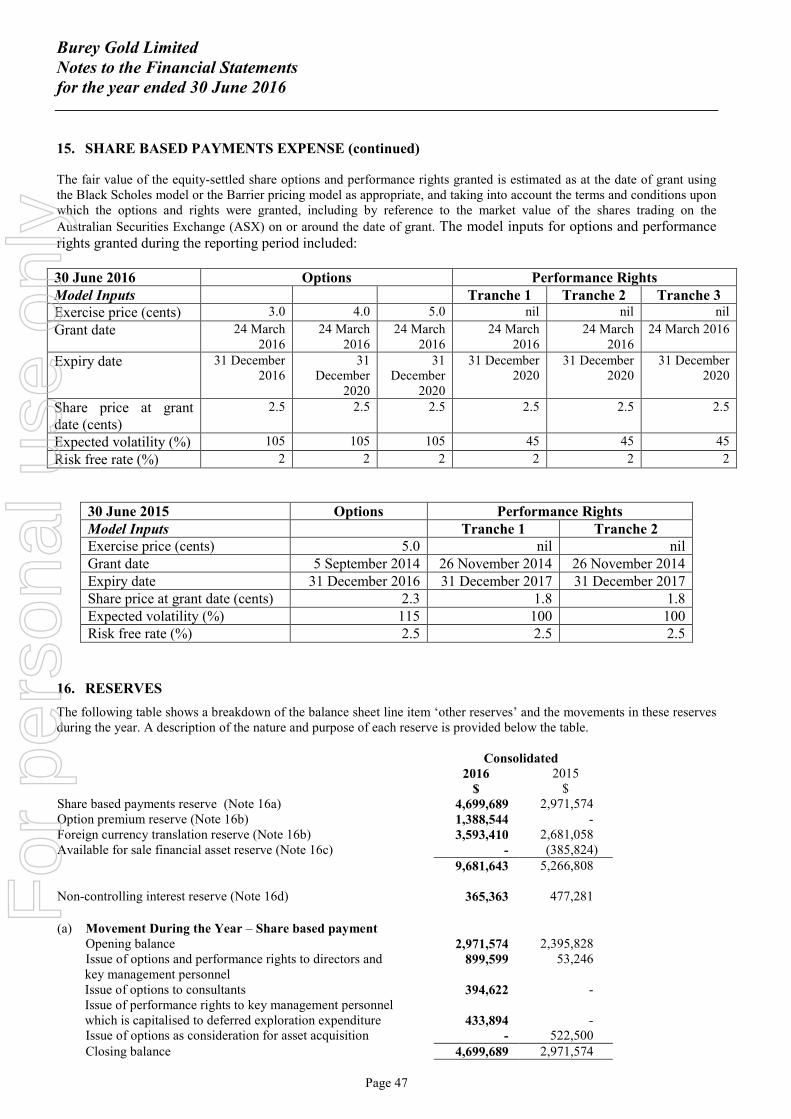
Burey Gold LimitedNotes to the Financial Statementsfor the year ended 30 June 2016
Page 47
15. SHARE BASED PAYMENTS EXPENSE (continued)
The fair value of the equity-settled share options and performance rights granted is estimated as at the date of grant usingthe Black Scholes model or the Barrier pricing model as appropriate, and taking into account the terms and conditions uponwhich the options and rights were granted, including by reference to the market value of the shares trading on the
Australian Securities Exchange (ASX) on or around the date of grant. The model inputs for options and performancerights granted during the reporting period included:
30 June 2016 Options Performance RightsModel Inputs Tranche 1 Tranche 2 Tranche 3Exercise price (cents) 3.0 4.0 5.0 nil nil nil
Grant date 24 March2016
24 March2016
24 March2016
24 March2016
24 March2016
24 March 2016
Expiry date 31 December2016
31December
2020
31December
2020
31 December2020
31 December2020
31 December2020
Share price at grantdate (cents)
2.5 2.5 2.5 2.5 2.5 2.5
Expected volatility (%) 105 105 105 45 45 45
Risk free rate (%) 2 2 2 2 2 2
30 June 2015 Options Performance RightsModel Inputs Tranche 1 Tranche 2Exercise price (cents) 5.0 nil nilGrant date 5 September 2014 26 November 2014 26 November 2014Expiry date 31 December 2016 31 December 2017 31 December 2017Share price at grant date (cents) 2.3 1.8 1.8Expected volatility (%) 115 100 100Risk free rate (%) 2.5 2.5 2.5
16. RESERVES
The following table shows a breakdown of the balance sheet line item ‘other reserves’ and the movements in these reservesduring the year. A description of the nature and purpose of each reserve is provided below the table.
Consolidated2016 2015
$ $Share based payments reserve (Note 16a)Option premium reserve (Note 16b)
4,699,6891,388,544
2,971,574-
Foreign currency translation reserve (Note 16b) 3,593,410 2,681,058Available for sale financial asset reserve (Note 16c) - (385,824)
9,681,643 5,266,808
Non-controlling interest reserve (Note 16d) 365,363 477,281
(a) Movement During the Year – Share based paymentOpening balance 2,971,574 2,395,828Issue of options and performance rights to directors andkey management personnel
899,599 53,246
Issue of options to consultants 394,622 -Issue of performance rights to key management personnelwhich is capitalised to deferred exploration expenditure 433,894 -Issue of options as consideration for asset acquisition - 522,500Closing balance 4,699,689 2,971,574
For
per
sona
l use
onl
y
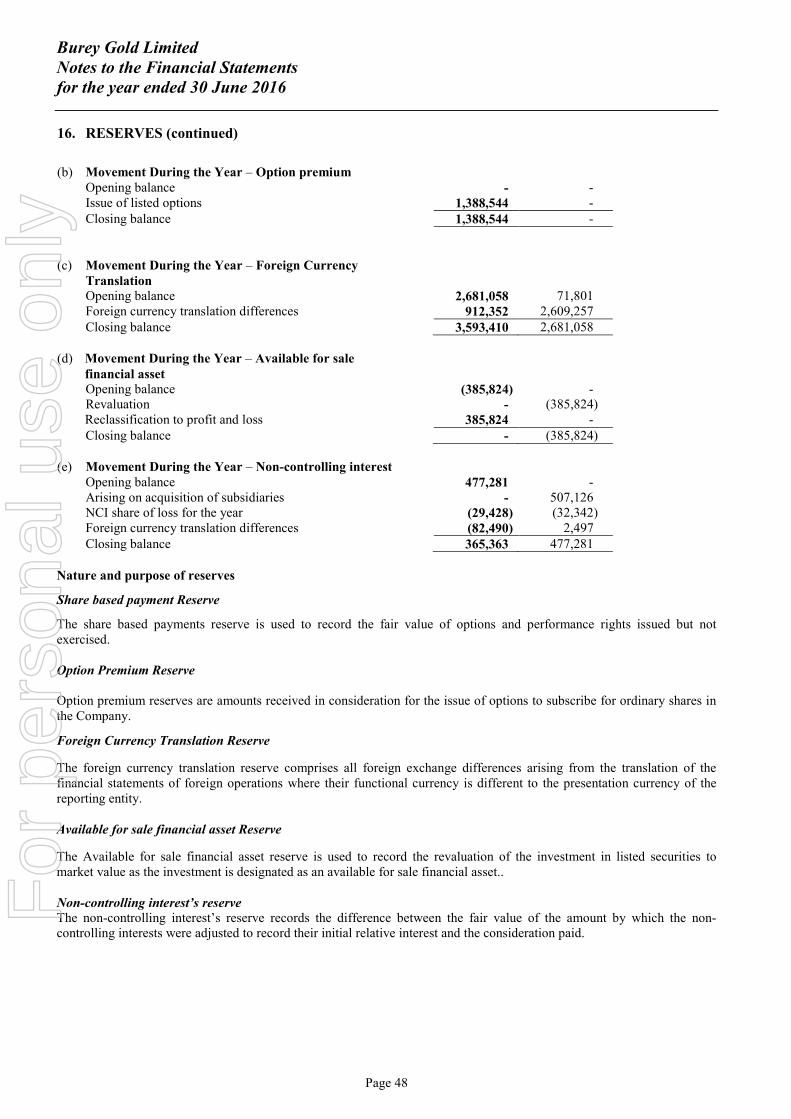
Burey Gold LimitedNotes to the Financial Statementsfor the year ended 30 June 2016
Page 48
16. RESERVES (continued)
(b) Movement During the Year – Option premiumOpening balance - -Issue of listed options 1,388,544 -Closing balance 1,388,544 -
(c) Movement During the Year – Foreign CurrencyTranslationOpening balance 2,681,058 71,801Foreign currency translation differences 912,352 2,609,257Closing balance 3,593,410 2,681,058
(d) Movement During the Year – Available for salefinancial assetOpening balance (385,824) -Revaluation - (385,824)Reclassification to profit and loss 385,824 -Closing balance - (385,824)
(e) Movement During the Year – Non-controlling interestOpening balance 477,281 -Arising on acquisition of subsidiaries - 507,126NCI share of loss for the year (29,428) (32,342)Foreign currency translation differences (82,490) 2,497Closing balance 365,363 477,281
Nature and purpose of reserves
Share based payment Reserve
The share based payments reserve is used to record the fair value of options and performance rights issued but notexercised.
Option Premium Reserve
Option premium reserves are amounts received in consideration for the issue of options to subscribe for ordinary shares inthe Company.
Foreign Currency Translation Reserve
The foreign currency translation reserve comprises all foreign exchange differences arising from the translation of thefinancial statements of foreign operations where their functional currency is different to the presentation currency of thereporting entity.
Available for sale financial asset Reserve
The Available for sale financial asset reserve is used to record the revaluation of the investment in listed securities tomarket value as the investment is designated as an available for sale financial asset..
Non-controlling interest’s reserveThe non-controlling interest’s reserve records the difference between the fair value of the amount by which the non-controlling interests were adjusted to record their initial relative interest and the consideration paid.
For
per
sona
l use
onl
y
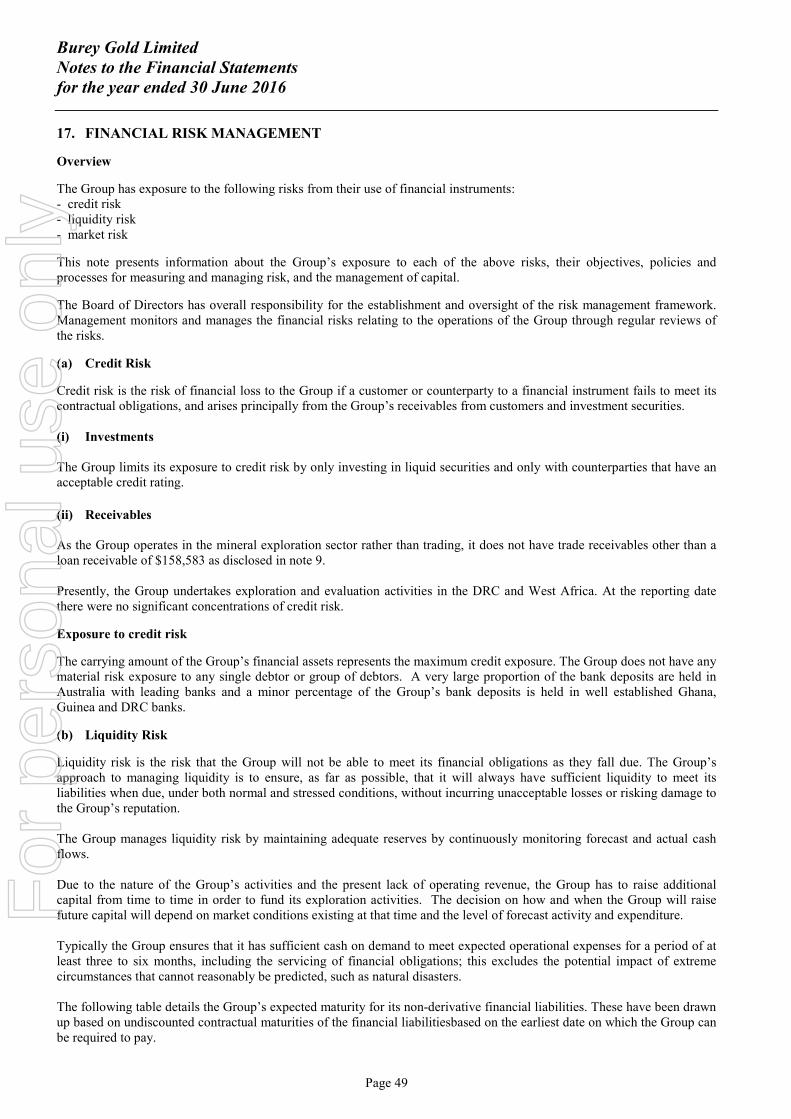
Burey Gold LimitedNotes to the Financial Statementsfor the year ended 30 June 2016
Page 49
17. FINANCIAL RISK MANAGEMENT
Overview
The Group has exposure to the following risks from their use of financial instruments:- credit risk- liquidity risk- market risk
This note presents information about the Group’s exposure to each of the above risks, their objectives, policies andprocesses for measuring and managing risk, and the management of capital.
The Board of Directors has overall responsibility for the establishment and oversight of the risk management framework.Management monitors and manages the financial risks relating to the operations of the Group through regular reviews ofthe risks.
(a) Credit Risk
Credit risk is the risk of financial loss to the Group if a customer or counterparty to a financial instrument fails to meet itscontractual obligations, and arises principally from the Group’s receivables from customers and investment securities.
(i) Investments
The Group limits its exposure to credit risk by only investing in liquid securities and only with counterparties that have anacceptable credit rating.
(ii) Receivables
As the Group operates in the mineral exploration sector rather than trading, it does not have trade receivables other than aloan receivable of $158,583 as disclosed in note 9.
Presently, the Group undertakes exploration and evaluation activities in the DRC and West Africa. At the reporting datethere were no significant concentrations of credit risk.
Exposure to credit risk
The carrying amount of the Group’s financial assets represents the maximum credit exposure. The Group does not have anymaterial risk exposure to any single debtor or group of debtors. A very large proportion of the bank deposits are held inAustralia with leading banks and a minor percentage of the Group’s bank deposits is held in well established Ghana,Guinea and DRC banks.
(b) Liquidity Risk
Liquidity risk is the risk that the Group will not be able to meet its financial obligations as they fall due. The Group’sapproach to managing liquidity is to ensure, as far as possible, that it will always have sufficient liquidity to meet itsliabilities when due, under both normal and stressed conditions, without incurring unacceptable losses or risking damage tothe Group’s reputation.
The Group manages liquidity risk by maintaining adequate reserves by continuously monitoring forecast and actual cashflows.
Due to the nature of the Group’s activities and the present lack of operating revenue, the Group has to raise additionalcapital from time to time in order to fund its exploration activities. The decision on how and when the Group will raisefuture capital will depend on market conditions existing at that time and the level of forecast activity and expenditure.
Typically the Group ensures that it has sufficient cash on demand to meet expected operational expenses for a period of atleast three to six months, including the servicing of financial obligations; this excludes the potential impact of extremecircumstances that cannot reasonably be predicted, such as natural disasters.
The following table details the Group’s expected maturity for its non-derivative financial liabilities. These have been drawnup based on undiscounted contractual maturities of the financial liabilitiesbased on the earliest date on which the Group canbe required to pay.
For
per
sona
l use
onl
y
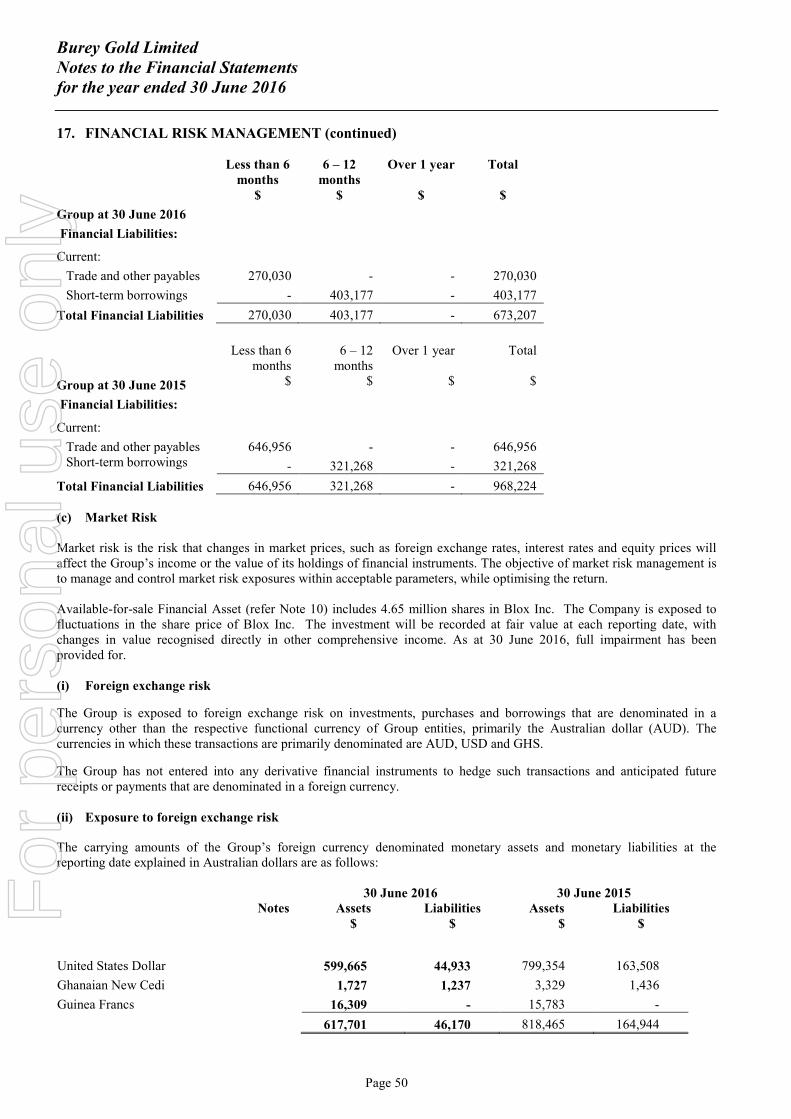
Burey Gold LimitedNotes to the Financial Statementsfor the year ended 30 June 2016
Page 50
17. FINANCIAL RISK MANAGEMENT (continued)
Less than 6months
6 – 12months
Over 1 year Total
$ $ $ $
Group at 30 June 2016
Financial Liabilities:
Current:
Trade and other payables 270,030 - - 270,030
Short-term borrowings - 403,177 - 403,177
Total Financial Liabilities 270,030 403,177 - 673,207
Less than 6months
6 – 12months
Over 1 year Total
Group at 30 June 2015
Financial Liabilities:
$ $ $ $
Current:
Trade and other payablesShort-term borrowings
646,956
-
-
321,268
-
-
646,956
321,268
Total Financial Liabilities 646,956 321,268 - 968,224
(c) Market Risk
Market risk is the risk that changes in market prices, such as foreign exchange rates, interest rates and equity prices willaffect the Group’s income or the value of its holdings of financial instruments. The objective of market risk management isto manage and control market risk exposures within acceptable parameters, while optimising the return.
Available-for-sale Financial Asset (refer Note 10) includes 4.65 million shares in Blox Inc. The Company is exposed tofluctuations in the share price of Blox Inc. The investment will be recorded at fair value at each reporting date, withchanges in value recognised directly in other comprehensive income. As at 30 June 2016, full impairment has beenprovided for.
(i) Foreign exchange risk
The Group is exposed to foreign exchange risk on investments, purchases and borrowings that are denominated in acurrency other than the respective functional currency of Group entities, primarily the Australian dollar (AUD). Thecurrencies in which these transactions are primarily denominated are AUD, USD and GHS.
The Group has not entered into any derivative financial instruments to hedge such transactions and anticipated futurereceipts or payments that are denominated in a foreign currency.
(ii) Exposure to foreign exchange risk
The carrying amounts of the Group’s foreign currency denominated monetary assets and monetary liabilities at thereporting date explained in Australian dollars are as follows:
30 June 2016 30 June 2015Notes Assets Liabilities Assets Liabilities
$ $ $ $
United States Dollar 599,665 44,933 799,354 163,508
Ghanaian New Cedi 1,727 1,237 3,329 1,436
Guinea Francs 16,309 - 15,783 -
617,701 46,170 818,465 164,944
For
per
sona
l use
onl
y
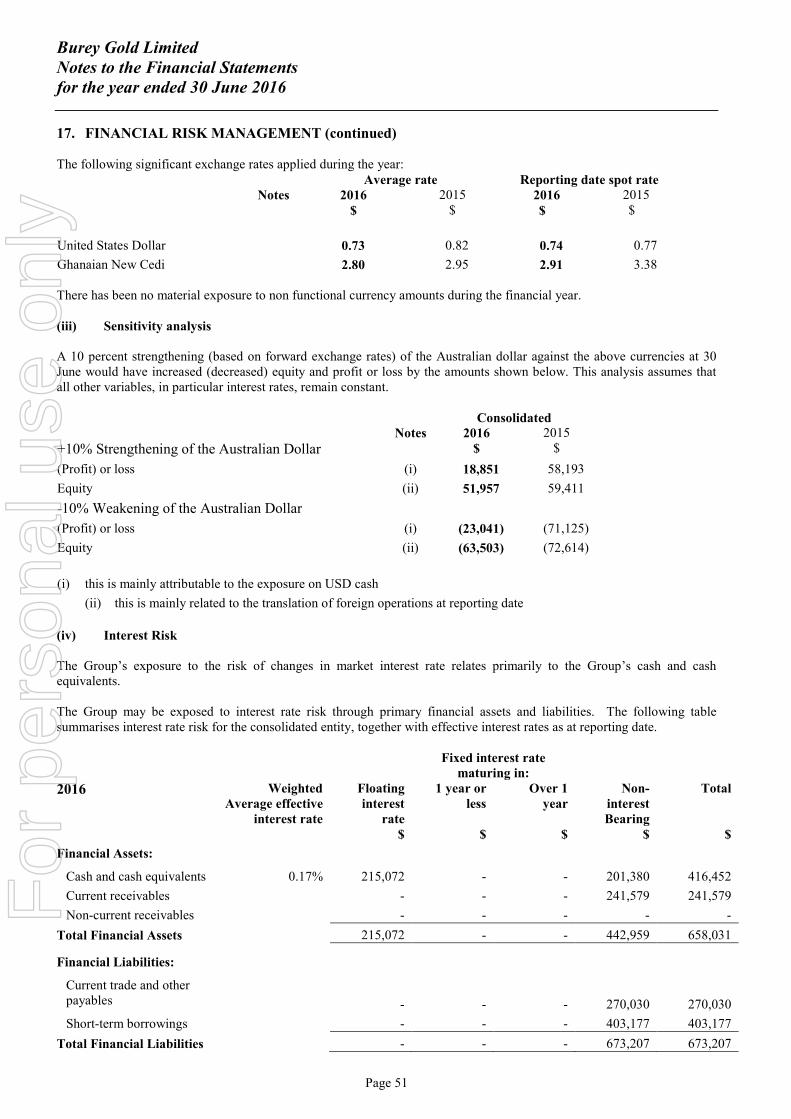
Burey Gold LimitedNotes to the Financial Statementsfor the year ended 30 June 2016
Page 51
17. FINANCIAL RISK MANAGEMENT (continued)
The following significant exchange rates applied during the year:Average rate Reporting date spot rate
Notes 2016 2015 2016 2015$ $ $ $
United States Dollar 0.73 0.82 0.74 0.77
Ghanaian New Cedi 2.80 2.95 2.91 3.38
There has been no material exposure to non functional currency amounts during the financial year.
(iii) Sensitivity analysis
A 10 percent strengthening (based on forward exchange rates) of the Australian dollar against the above currencies at 30June would have increased (decreased) equity and profit or loss by the amounts shown below. This analysis assumes thatall other variables, in particular interest rates, remain constant.
ConsolidatedNotes 2016 2015
+10% Strengthening of the Australian Dollar $ $
(Profit) or loss (i) 18,851 58,193
Equity (ii) 51,957 59,411
-10% Weakening of the Australian Dollar
(Profit) or loss (i) (23,041) (71,125)
Equity (ii) (63,503) (72,614)
(i) this is mainly attributable to the exposure on USD cash
(ii) this is mainly related to the translation of foreign operations at reporting date
(iv) Interest Risk
The Group’s exposure to the risk of changes in market interest rate relates primarily to the Group’s cash and cashequivalents.
The Group may be exposed to interest rate risk through primary financial assets and liabilities. The following tablesummarises interest rate risk for the consolidated entity, together with effective interest rates as at reporting date.
Fixed interest ratematuring in:
2016 WeightedAverage effective
interest rate
Floatinginterest
rate
1 year orless
Over 1year
Non-interestBearing
Total
$ $ $ $ $
Financial Assets:
Cash and cash equivalents 0.17% 215,072 - - 201,380 416,452
Current receivables - - - 241,579 241,579
Non-current receivables - - - - -
Total Financial Assets 215,072 - - 442,959 658,031
Financial Liabilities:
Current trade and otherpayables - - - 270,030 270,030
Short-term borrowings - - - 403,177 403,177
Total Financial Liabilities - - - 673,207 673,207
For
per
sona
l use
onl
y
Burey Gold LimitedNotes to the Financial Statementsfor the year ended 30 June 2016
Page 52
17. FINANCIAL RISK MANAGEMENT (continued)
Fixed interest ratematuring in:
2015 WeightedAverage effective
interest rate
Floatinginterest
rate
1 year orless
Over 1year
Non-interestbearing
Total
$ $ $ $ $
Financial Assets:
Cash and cash equivalents 1.51% 641,801 - - 127,280 769,081
Current receivables - - - 104,139 104,139
Non-current receivables - - - 20,125 20,125
Total Financial Assets 641,801 - - 251,544 893,345
Financial Liabilities:
Current trade and otherpayables
Short-term borrowings-
-
-
-
-
-
646,956
321,268
646,956
321,268
Total Financial Liabilities - - - 968,224 968,224
The Group does not account for any fixed rate financial assets and liabilities at fair value through profit or loss, and theGroup does not designate derivatives (interest rate swaps) as hedging instruments under a fair value hedge accountingmodel. Therefore a change in interest rates at the reporting date would not affect profit or loss.
Cash flow sensitivity analysis for variable rate instruments
The Group holds working capital in transaction accounts at variable interest rates. If the interest rates had increased ordecreased by 100 basis points (100bps) from the year end rates (based on forward treasury rates) with all other variablesheld constant, profit would increase or decrease by $7,809 (2015:$9,137).
The following table summarises the sensitivity of the Group’s financial assets to interest rate risk.
2016 Interest rate risk-100 bps +100 bps
Carrying Amount$
Profit$
Equity$
Profit$
Equity$
Financial assets
Cash and cash equivalents 416,452 (7,809) (7,809) 7,809 7,809Total increase / (decrease) (7,809) (7,809) 7,809 7,809
2015 Interest rate risk-100 bps +100 bps
Carrying Amount$
Profit$
Equity$
Profit$
Equity$
Financial assets
Cash and cash equivalents 769,801 (9,137) (9,137) 9,137 9,137Total increase / (decrease) (9,137) (9,137) 9,137 9,137
(d) Net fair values
For assets and other liabilities, the net fair value approximates their carrying value. No financial assets and financialliabilities are readily traded on organised markets in standardised form.
For
per
sona
l use
onl
y
Burey Gold LimitedNotes to the Financial Statementsfor the year ended 30 June 2016
Page 53
17. FINANCIAL RISK MANAGEMENT (continued)
The aggregate net fair values and carrying amounts of financial assets and financial liabilities are disclosed in the statementof financial position and in the notes to and forming part of the financial statements.
(e) Capital risk management
Management controls the capital of the Group in order to ensure that the Group can fund its operations on an efficient andtimely basis and continue as a going concern.
There are no externally imposed capital requirements.
Management effectively manages the Group’s capital by assessing the Group’s cash projections up to twelve months in thefuture and any associated financial risks. Management will adjust the Group’s capital structure in response to changes inthese risks and in the market.
There have been no changes in the strategy adopted by management to control the capital of the Group since the prior year.
18. CONTINGENCIES
If 3moz (measured and indicated category) gold resources at a cut-off grade of 2.5g/t Au are estimated at the Giro Project,Burey will be required to pay US$5,350,000 to the former shareholders of Amani Consulting sarl (“Amani”) from whomBurey acquired its 85% interest in the capital of Amani. At Burey’s election, 50% of this amount can be settled by an issueof Burey shares at the then market value of Burey shares. In any case, the liability for this amount of US$5.35M only fallsdue for payment upon drawdown of development funds.
On conclusion of feasibility studies (which studies were required to be completed by January 2016 under currentcontractual terms with a grace period of a further 12 months, however negotiations are ongoing for an extension to thecompletion date of a feasibility study) and a decision to mine at the Giro Project, payments of US$2.5 million and US$0.7million will be required to be made by Amani to the DRC Government and Societe Miniere De Kilo Moto (Sokimo)respectively.
In view of the nature of the trigger events and the early stage of exploration activity at the Giro Gold Project, theseliabilities are contingent in nature and no values were allocated as liabilities in this financial report (2015: Nil).
19. COMMITMENTS
(a) Capital commitments
There were no capital commitments, not provided for in the financial statements as at 30 June 2016, other than:
With respect to the Group’s mineral property interests in Guinea, statutory expenditure commitments specified by themining legislation are nominal in monetary terms. However, as part of mineral licence application and renewalrequirements, the Group submits budgeted exploration expenditure. In assessing subsequent renewal applications, themining authorities review actual expenditure against budgets previously submitted. These budget amounts do not becomelegal obligations of the Group and actual expenditure may and does vary depending on the outcome of actual explorationprogrammes, and the costs and results from those programmes.
(b) Lease commitments: non-cancellable operating lease
Burey Gold Limited entered into a lease agreement with Corporate Consultants Pty Ltd for the use of furnished office spaceon 7 June 2012. The agreement was effective from 7 June 2012 to its expiry date of 30 September 2015. No new agreementhas been signed to date.
Consolidated2016 2015
$ $Commitments for minimum lease payments in relation tonon-cancellable operating leases are payable as follows:Within one year - 5,428One year to five years - -Total - 5,428
For
per
sona
l use
onl
y
Burey Gold LimitedNotes to the Financial Statementsfor the year ended 30 June 2016
Page 54
20. STATEMENTS OF CASH FLOWS2016 2015
(a) Reconciliation of loss after income tax to net cash outflow fromoperating activities
$ $
Loss after income tax (12,411,305) (1,236,667)
Add back non-cash items:
Depreciation 21,005 13,745
Impairment of exploration expenditure 8,787,234 -
Impairment of listed securities 872,115 -
Share based payments expense 1,294,218 53,246
Net exchange differences 241,523 11,540Change in assets and liabilities:
Decrease / (Increase) in receivables 527,559 (3,216)
Increase / (Decrease) in operating payables (376,926) (9,852)
Net cash outflow from operating activities (1,044,578) (1,171,204)
(b) Non-Cash Financing and Investing Activities
The Group acquired a controlling interest in the Giro Gold Project last year, with the majority of the purchase considerationcomprising the issue of shares and options in Burey Gold Limited. Details are provided in Note 23. Share based paymentsof $433,897 (2015 - $25,057) were classified and capitalised under exploration expenditure for incentive securities awardedto exploration staff.
21. RELATED PARTY TRANSACTIONS
(a) Key Management Personnel
A number of key management persons, or their related parties, hold positions in other entities that result in them havingcontrol or significant influence over the financial or operating policies of those entities. Transactions between relatedparties are on normal commercial terms and conditions unless otherwise stated.
Consolidated2016 2015
$ $Accounting, secretarial and corporate service fees paid or payable toCorporate Consultants Pty Ltd, a company in which Mr Gajewski andMr Shah have beneficial interests. 183,853 169,586
Rental fees for the sub-lease of furnished office space paid or payableto Corporate Consultants Pty Ltd, a company in which Mr Gajewskiand Mr Shah have beneficial interests.
34,088 34,178
Balances due to Directors and Director Related Entities at year end
- included in trade creditors and accruals 50,674 22,366
(b) Parent entity
Burey Gold Limited is the ultimate parent entity.For
per
sona
l use
onl
y
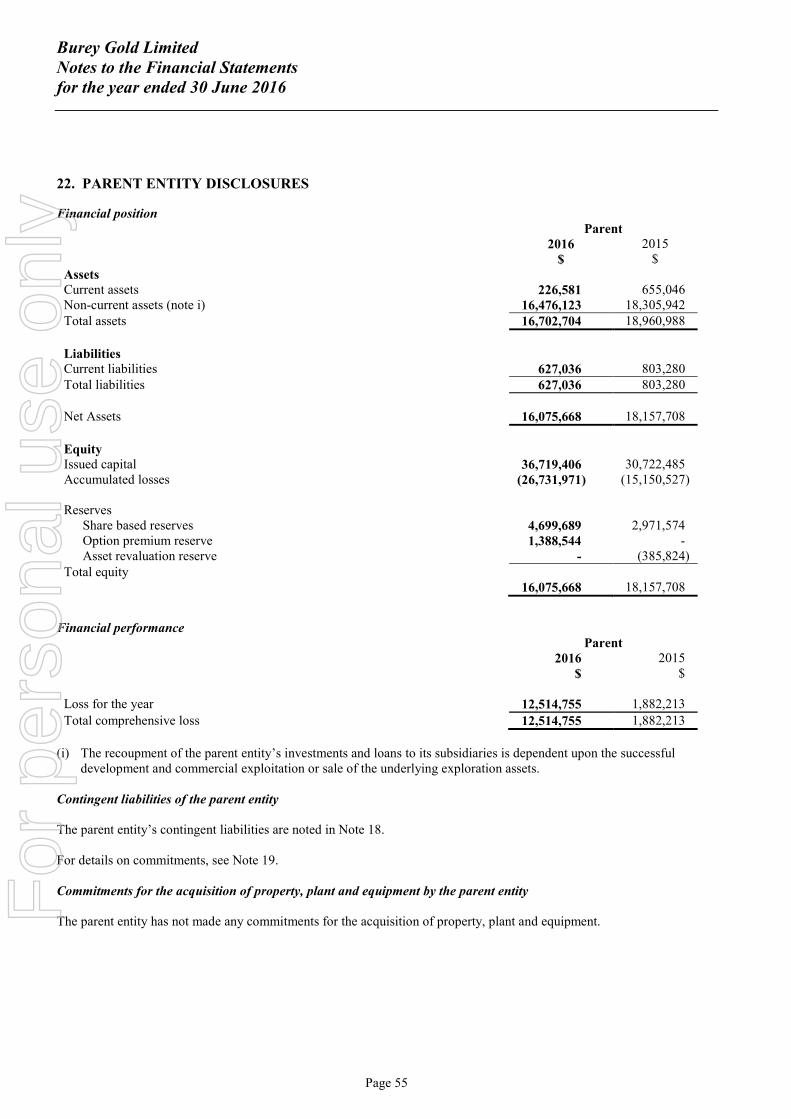
Burey Gold LimitedNotes to the Financial Statementsfor the year ended 30 June 2016
Page 55
22. PARENT ENTITY DISCLOSURES
Financial positionParent
2016$
2015$
AssetsCurrent assets 226,581 655,046Non-current assets (note i) 16,476,123 18,305,942Total assets 16,702,704 18,960,988
LiabilitiesCurrent liabilities 627,036 803,280Total liabilities 627,036 803,280
Net Assets 16,075,668 18,157,708
EquityIssued capital 36,719,406 30,722,485Accumulated losses (26,731,971) (15,150,527)
ReservesShare based reserves 4,699,689 2,971,574Option premium reserve 1,388,544 -Asset revaluation reserve - (385,824)
Total equity16,075,668 18,157,708
Financial performanceParent
2016$
2015$
Loss for the year 12,514,755 1,882,213
Total comprehensive loss 12,514,755 1,882,213
(i) The recoupment of the parent entity’s investments and loans to its subsidiaries is dependent upon the successfuldevelopment and commercial exploitation or sale of the underlying exploration assets.
Contingent liabilities of the parent entity
The parent entity’s contingent liabilities are noted in Note 18.
For details on commitments, see Note 19.
Commitments for the acquisition of property, plant and equipment by the parent entity
The parent entity has not made any commitments for the acquisition of property, plant and equipment.For
per
sona
l use
onl
y
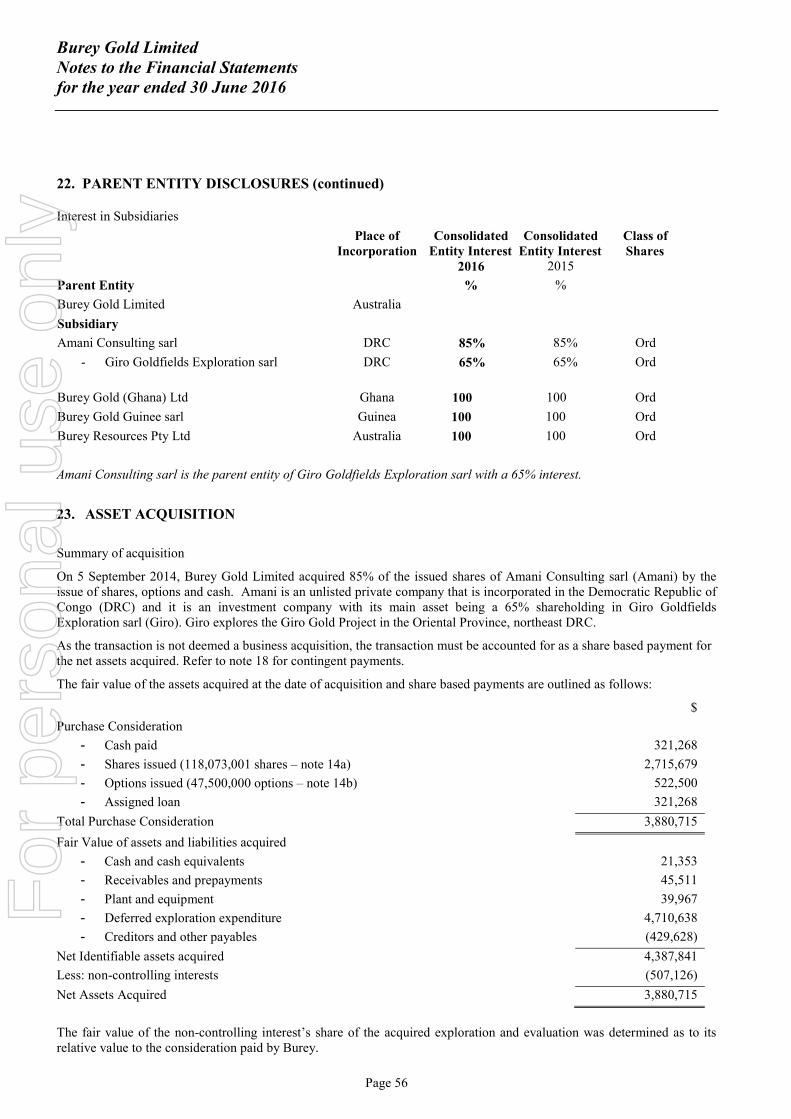
Burey Gold LimitedNotes to the Financial Statementsfor the year ended 30 June 2016
Page 56
22. PARENT ENTITY DISCLOSURES (continued)
Interest in Subsidiaries
Place ofIncorporation
ConsolidatedEntity Interest
ConsolidatedEntity Interest
Class ofShares
2016 2015
Parent Entity % %
Burey Gold Limited Australia
Subsidiary
Amani Consulting sarl DRC 85% 85% Ord
- Giro Goldfields Exploration sarl DRC 65% 65% Ord
Burey Gold (Ghana) Ltd Ghana 100 100 Ord
Burey Gold Guinee sarl Guinea 100 100 Ord
Burey Resources Pty Ltd Australia 100 100 Ord
Amani Consulting sarl is the parent entity of Giro Goldfields Exploration sarl with a 65% interest.
23. ASSET ACQUISITION
Summary of acquisition
On 5 September 2014, Burey Gold Limited acquired 85% of the issued shares of Amani Consulting sarl (Amani) by theissue of shares, options and cash. Amani is an unlisted private company that is incorporated in the Democratic Republic ofCongo (DRC) and it is an investment company with its main asset being a 65% shareholding in Giro GoldfieldsExploration sarl (Giro). Giro explores the Giro Gold Project in the Oriental Province, northeast DRC.
As the transaction is not deemed a business acquisition, the transaction must be accounted for as a share based payment forthe net assets acquired. Refer to note 18 for contingent payments.
The fair value of the assets acquired at the date of acquisition and share based payments are outlined as follows:
$
Purchase Consideration
- Cash paid 321,268
- Shares issued (118,073,001 shares – note 14a) 2,715,679
- Options issued (47,500,000 options – note 14b) 522,500
- Assigned loan 321,268
Total Purchase Consideration 3,880,715
Fair Value of assets and liabilities acquired
- Cash and cash equivalents 21,353
- Receivables and prepayments 45,511
- Plant and equipment 39,967
- Deferred exploration expenditure 4,710,638
- Creditors and other payables (429,628)
Net Identifiable assets acquired 4,387,841
Less: non-controlling interests (507,126)
Net Assets Acquired 3,880,715
The fair value of the non-controlling interest’s share of the acquired exploration and evaluation was determined as to itsrelative value to the consideration paid by Burey.
For
per
sona
l use
onl
y

Burey Gold LimitedNotes to the Financial Statementsfor the year ended 30 June 2016
Page 57
24. EVENTS OCCURRING AFTER THE REPORTING DATE
Since the end of the financial year and to the date of this report no matter or circumstance has arisen which has significantlyaffected, or may significantly affect, the operations of the consolidated entity, the results of those operations or the state ofaffairs of the consolidated entity in subsequent financial years other than the matter referred to below:
Subsequent to the year-end and to the date of this report, the Company completed a private placement to raiseapproximately $11.67 million from the issue of 216.2 million shares at $0.054 each.
A total of 76 million performance rights vested after 30 June 2016, and were converted to shares.
For
per
sona
l use
onl
y
Burey Gold LimitedDirectors’ Declarationfor the year ended 30 June 2016
Page 58
In the opinion of the Directors:
a) The financial statements and the notes and the additional disclosures included in the directors’ reportdesignated as audited of the consolidated entity are in accordance with the Corporations Act 2001, including:
(i) Giving a true and fair view of the consolidated entity’s financial position as at 30 June 2016 and ofits performance for the year ended on that date; and
(ii) Complying with Accounting Standards (including Australian Accounting Standards) andCorporations Regulations 2001 and other mandatory professional reporting requirements; and
b) There are reasonable grounds to believe that the Company will be able to pay its debts as and when theybecome due and payable.
c) The financial statements and notes thereto include an explicit and unreserved statement of compliance withInternational Financial Reporting Standards issued by the International Accounting Standards Board.
This declaration has been made after receiving the declarations required to be made to the Directors in accordancewith section 295A of the Corporations Act 2001 for the financial year ended 30 June 2016.
Signed in accordance with a resolution of the Directors made pursuant to s 295(5) of the Corporations Act 2001.
On behalf of the Board
K P EckhofChairman
Dated at Perth on the 30th day of September 2016
For
per
sona
l use
onl
y
38 Station StreetSubiaco, WA 6008PO Box 700 West Perth WA 6872Australia
Tel: +61 8 6382 4600Fax: +61 8 6382 4601www.bdo.com.au
BDO Audit (WA) Pty Ltd ABN 79 112 284 787 is a member of a national association of independent entities which are all members of BDO Australia Ltd ABN77 050 110 275, an Australian company limited by guarantee. BDO Audit (WA) Pty Ltd and BDO Australia Ltd are members of BDO International Ltd, a UKcompany limited by guarantee, and form part of the international BDO network of independent member firms. Liability limited by a scheme approved underProfessional Standards Legislation, other than for the acts or omissions of financial services licensees.
INDEPENDENT AUDITOR’S REPORT
To the members of Burey Gold Limited
Report on the Financial Report
We have audited the accompanying financial report of Burey Gold Limited, which comprises theconsolidated statement of financial position as at 30 June 2016, the consolidated statement of profit orloss and other comprehensive income, the consolidated statement of changes in equity and theconsolidated statement of cash flows for the year then ended, notes comprising a summary ofsignificant accounting policies and other explanatory information, and the directors’ declaration of theconsolidated entity comprising the company and the entities it controlled at the year’s end or fromtime to time during the financial year.
Directors’ Responsibility for the Financial Report
The directors of the company are responsible for the preparation of the financial report that gives atrue and fair view in accordance with Australian Accounting Standards and the Corporations Act 2001and for such internal control as the directors determine is necessary to enable the preparation of thefinancial report that gives a true and fair view and is free from material misstatement, whether due tofraud or error. In Note 1, the directors also state, in accordance with Accounting Standard AASB 101Presentation of Financial Statements, that the financial statements comply with InternationalFinancial Reporting Standards.
Auditor’s Responsibility
Our responsibility is to express an opinion on the financial report based on our audit. We conducted ouraudit in accordance with Australian Auditing Standards. Those standards require that we comply withrelevant ethical requirements relating to audit engagements and plan and perform the audit to obtainreasonable assurance about whether the financial report is free from material misstatement.
An audit involves performing procedures to obtain audit evidence about the amounts and disclosures inthe financial report. The procedures selected depend on the auditor’s judgement, including theassessment of the risks of material misstatement of the financial report, whether due to fraud or error.In making those risk assessments, the auditor considers internal control relevant to the company’spreparation of the financial report that gives a true and fair view in order to design audit proceduresthat are appropriate in the circumstances, but not for the purpose of expressing an opinion on theeffectiveness of the company’s internal control. An audit also includes evaluating the appropriatenessof accounting policies used and the reasonableness of accounting estimates made by the directors, aswell as evaluating the overall presentation of the financial report.
We believe that the audit evidence we have obtained is sufficient and appropriate to provide a basisfor our audit opinion.F
or p
erso
nal u
se o
nly
Independence
In conducting our audit, we have complied with the independence requirements of the CorporationsAct 2001. We confirm that the independence declaration required by the Corporations Act 2001, whichhas been given to the directors of Burey Gold Limited, would be in the same terms if given to thedirectors as at the time of this auditor’s report.
Opinion
In our opinion:
(a) the financial report of Burey Gold Limited is in accordance with the Corporations Act 2001,including:
(i) giving a true and fair view of the consolidated entity’s financial position as at 30 June 2016and of its performance for the year ended on that date; and
(ii) complying with Australian Accounting Standards and the Corporations Regulations 2001; and
(b) the financial report also complies with International Financial Reporting Standards as disclosed inNote 1.
Report on the Remuneration Report
We have audited the Remuneration Report included in pages 15 to 21 of the directors’ report for theyear ended 30 June 2016. The directors of the company are responsible for the preparation andpresentation of the Remuneration Report in accordance with section 300A of the Corporations Act2001. Our responsibility is to express an opinion on the Remuneration Report, based on our auditconducted in accordance with Australian Auditing Standards.
Opinion
In our opinion, the Remuneration Report of Burey Gold Limited for the year ended 30 June 2016complies with section 300A of the Corporations Act 2001.
BDO Audit (WA) Pty Ltd
Dean Just
Director
Perth, 30 September 2016
For
per
sona
l use
onl
y