Embed Size (px)
Citation preview

Iluka Resources Limited, Annual Report 2019 1
Annual Report
2019
DELIVER SUSTAINABLEVALUE
For
per
sona
l use
onl
y

Iluka Resources Limited, Annual Report 20192
PRODUCTS
Iluka is the world’s largest producer of natural rutile and a major producer of synthetic rutile, which is an upgraded form of ilmenite. Collectively, these products are referred to as high-grade titanium dioxide feedstocks, owing to their high titanium content. Primary uses include pigment (paints), titanium metal and welding.
Iluka is the world’s largest producer of zircon. Zircon is opaque; and heat, water, chemical and abrasion resistant. Primary uses include ceramics; refractory and foundry; and zirconium chemicals.
TITANIUMDIOXIDE
ZIRCON
TiO2
Zr
Iluka recovers and markets activated carbon and iron concentrate, which are produced as a part of the synthetic rutile process. The company also has a burgeoning interest in monazite, from which rare earth elements are derived. Certain rare earths are considered a critical input across a number of rapidly evolving markets, including permanent magnets used in electric cars, wind turbines and electronics.
OTHER PRODUCTS
For
per
sona
l use
onl
y

Iluka Resources Limited, Annual Report 2019 1
MINERAL SANDS PART OF EVERYDAY LIFE
FROM EVERYDAY APPLICATIONS IN THE HOME AND WORKPLACE, TO MEDICAL, LIFESTYLE AND INDUSTRIAL APPLICATIONS, THE UNIQUE PROPERTIES OF TITANIUM DIOXIDE AND
ZIRCON ARE UTILISED IN A VAST ARRAY OF PRODUCTS. ILUKA’S MATERIALS ARE ALSO USED IN END-USE PRODUCTS WHICH CREATE SUSTAINABLE BENEFITS, INCLUDING
RENEWABLE ENERGY TECHNOLOGIES.
PHOTOCATALYTICSThe photocatalytic properties of titanium dioxide (TiO2) have
driven new and innovative applications. Titanium dioxide products are used in self-cleaning windows, air and water purification systems, light emitting diodes and solar cells.
ROOF/BUILDING/CONSTRUCTION Electrical insulators, bricks/cement, fibre optics, exterior
and interior paint, tiles, anti-pollution coatings.
SUSTAINABLE DEVELOPMENT PRODUCTSRenewable energy technologies (solar panels, wind turbines and electric vehicles), wastewater treatment, potable water
filtration, air purification, desalination plants, and energy efficient reflective roof coatings.
HOME/OFFICE Mobile phones, plastic, printer inks, paper, packaging.
KITCHEN Light bulbs, dishes, glasses, clock parts, food colouring,
ceramic knives, pans.
HEALTHCARE AND MEDICINE Prosthetics, orthopaedic implants, medical instruments.
CERAMICSMost types of ceramic tiles used for floor and wall coverings contain zircon. Zircon contributes to whiteness, opacity, and
the abrasion and chemical resistance that tiles provide.
PIGMENTS Paint coatings, inks, plastic and ceramics use titanium
dioxide in the form of pigment.
BATHROOM/LIFESTYLE Ceramics, sanitary and toilet basins, glass, faucets for
taps, cosmetics, pharmaceutical products, toothpaste, antiperspirants, sunscreens.
AUTOMOTIVEBrake linings/pads, car parking sensors, automotive paint,
catalytic converters, automotive electrics, rubber products.
SPORTING GOODS AND RECREATION Golf clubs, tennis racquets, bicycle frames.
AIRCRAFT AND INDUSTRY Titanium metal, desalination plants, zirconium metal, corrosion
resistant coatings.
For
per
sona
l use
onl
y

Iluka Resources Limited, Annual Report 20192
ABOUT ILUKA RESOURCES
MINERAL SANDS PROCESS
lluka Resources Limited (Iluka) is primarily an international mineral sands company with expertise in exploration, project development, mining operations, processing, marketing and rehabilitation.
Its core objective is to deliver sustainable value by leveraging the company’s expertise and over 60 years of mineral sands industry experience.
The company is the largest producer of zircon and rutile globally and a major producer of synthetic rutile. Iluka’s products are used in an increasing array of applications including home, workplace, medical, lifestyle and industrial uses.
With over 3,000 direct employees, the company has operations and projects in Australia and Sierra Leone; and a globally integrated marketing network.
Iluka conducts international exploration activities and is actively engaged in the rehabilitation of previous operations in the United States, Australia and Sierra Leone.
Listed on the Australian Securities Exchange and headquartered in Perth, the company has a royalty business with a world-class cornerstone royalty asset over iron ore sales revenues from tenements of BHP’s Mining Area C (MAC) province in the north west of Western Australia.
GEOLOGICAL SETTING 1Mineral sands are heavy minerals found in sediments on, or near to, the surface of ancient beach, dune or river systems. Mineral sands include minerals such as rutile, ilmenite, zircon and monazite.
MINING APPROACH 2Mineral sands mining involves both dry mining and wet (dredge or hydraulic) operations. All of Iluka’s current mining operations use a dry mining approach. Mining units and wet concentrator plants separate ore from waste material and concentrate the heavy mineral sands.
MINERAL SEPARATION 3The heavy mineral concentrate is transported from the mine to a mineral separation plant for final product processing. The plant separates the heavy minerals zircon, rutile and ilmenite from each other in multiple stages by magnetic, electrostatic and gravity separation.
SYNTHETIC RUTILE 4Iluka also produces synthetic rutile from ilmenite that is upgraded by high temperature chemical processes.
REHABILITATION 5As mining progresses, the mining pit is backfilled and covered with stockpiled soils that were removed at the start of the mining process. Rehabilitation is undertaken progressively to return land to a form similar to its pre-mining state and suitable for various uses including agricultural, pastoral and native vegetation.
MARKETING6Iluka transports the final products of zircon, rutile, synthetic rutile and ilmenite to customers around the world.
THE COMPANY IS THE LARGEST PRODUCER OF ZIRCON AND RUTILE GLOBALLY AND A MAJOR PRODUCER OF SYNTHETIC RUTILE
For
per
sona
l use
onl
y

Iluka Resources Limited, Annual Report 2019 3
WHERE WE OPERATE
UNITED STATES
Rehabilitation
OPERATIONS, RESOURCE DEVELOPMENT AND REHABILITATION ACTIVITIES
SIERRA LEONE
Sierra Rutile mining, concentrating and processing operations
Sembehun project
Rehabilitation
SOUTH AUSTRALIA
Jacinth-Ambrosia mining and concentrating
Atacama project
Rehabilitation
WESTERN AUSTRALIA
Narngulu processing
Cataby mining and concentrating
Capel synthetic rutile processing
Corporate support centre
Rehabilitation
Eneabba mineral sands recovery project
VICTORIA
Wimmera project
Rehabilitation
NEW SOUTH WALES
Balranald project
SRI LANKA
Puttalam project
For
per
sona
l use
onl
y

Iluka Resources Limited, Annual Report 20194
Capel synthetic rutile kiln, Western Australia
ABOUT THIS REPORT
This Annual Report is a summary of Iluka Resources Limited and its subsidiaries’ operations, activities and financial position as at 31 December 2019. Currency is expressed in Australian dollars (AUD) unless otherwise stated.
Iluka publishes annually a separate Sustainability Report, in accordance with the Global Reporting Initiative Framework. The company plans to publish its 2019 Sustainability Report in April 2020 and will cover the company’s sustainability performance for the period 1 January to 31 December 2019.
Current and previous Sustainability Reports are available on the company’s website – www.iluka.com. Iluka also plans to publish its Tax and Other Payments to Governments Report in April 2020.
Iluka is committed to reducing the environmental footprint associated with the production of the Annual Report, and printed copies are only posted to shareholders who have elected to receive a printed copy.
OVER 3000 EMPLOYEES GLOBALLYF
or p
erso
nal u
se o
nly

Iluka Resources Limited, Annual Report 2019 5
DELIVER SUSTAINABLE VALUE
BUSINESS REVIEW2019 year in review 6 Chairman’s review 8 Managing Director’s review 10 Board and Executive 12 Financial summary 14
Strategy and business model 18 Financial and operational review 20 Sustainability 38 Business risks and mitigations 40
FINANCIAL REPORT Results for announcement to the market 44 Directors’ report 45 Remuneration report 56Auditor’s independence declaration 81
Financial statements 82
Directors’ declaration 136
Independent auditor’s report 137
PHYSICAL, FINANCIAL AND CORPORATE INFORMATION
Five year physical and financial summary 144
Operating mines physical data 146
Ore Reserves and Mineral Resources statement 148
Shareholder and investor information 156
Corporate information 158
For
per
sona
l use
onl
y
Iluka Resources Limited, Annual Report 20196
2019 YEARIN REVIEW
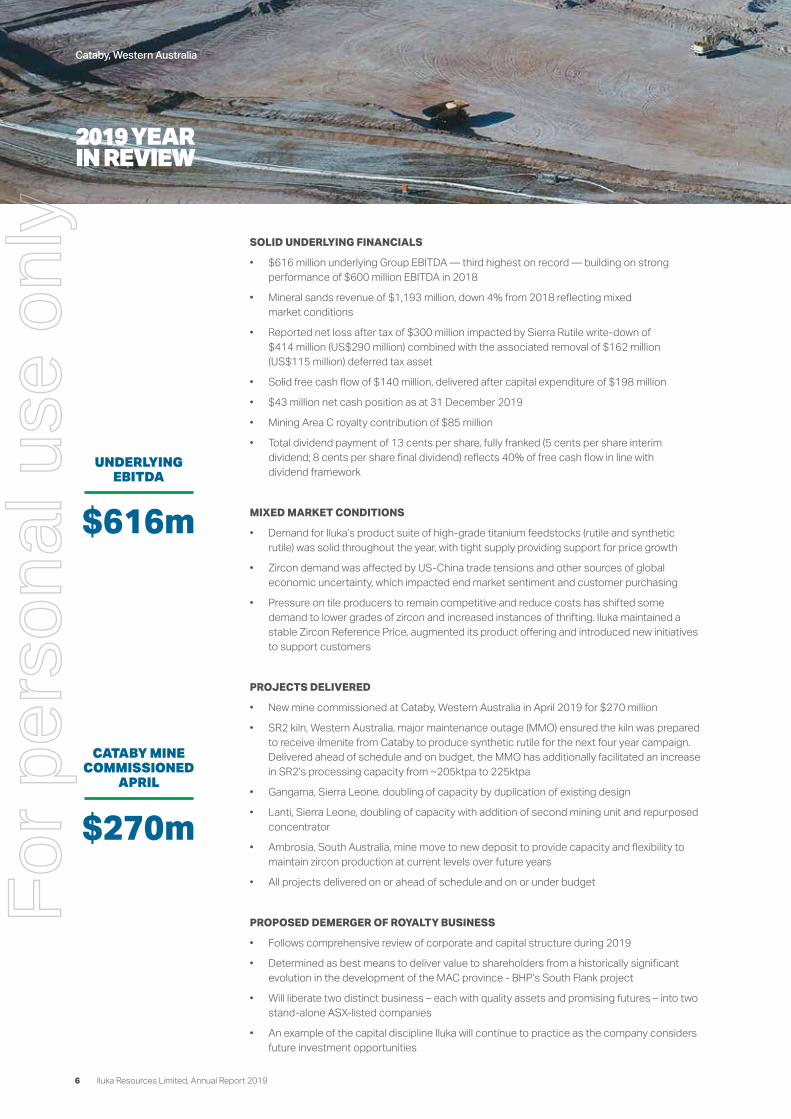
Cataby, Western Australia
SOLID UNDERLYING FINANCIALS
• $616 million underlying Group EBITDA — third highest on record — building on strong performance of $600 million EBITDA in 2018
• Mineral sands revenue of $1,193 million, down 4% from 2018 reflecting mixed market conditions
• Reported net loss after tax of $300 million impacted by Sierra Rutile write-down of $414 million (US$290 million) combined with the associated removal of $162 million (US$115 million) deferred tax asset
• Solid free cash flow of $140 million, delivered after capital expenditure of $198 million
• $43 million net cash position as at 31 December 2019
• Mining Area C royalty contribution of $85 million
• Total dividend payment of 13 cents per share, fully franked (5 cents per share interim dividend; 8 cents per share final dividend) reflects 40% of free cash flow in line with dividend framework
MIXED MARKET CONDITIONS
• Demand for Iluka’s product suite of high-grade titanium feedstocks (rutile and synthetic rutile) was solid throughout the year, with tight supply providing support for price growth
• Zircon demand was affected by US-China trade tensions and other sources of global economic uncertainty, which impacted end market sentiment and customer purchasing
• Pressure on tile producers to remain competitive and reduce costs has shifted some demand to lower grades of zircon and increased instances of thrifting. Iluka maintained a stable Zircon Reference Price, augmented its product offering and introduced new initiatives to support customers
PROJECTS DELIVERED
• New mine commissioned at Cataby, Western Australia in April 2019 for $270 million
• SR2 kiln, Western Australia, major maintenance outage (MMO) ensured the kiln was prepared to receive ilmenite from Cataby to produce synthetic rutile for the next four year campaign. Delivered ahead of schedule and on budget, the MMO has additionally facilitated an increase in SR2’s processing capacity from ~205ktpa to 225ktpa
• Gangama, Sierra Leone, doubling of capacity by duplication of existing design
• Lanti, Sierra Leone, doubling of capacity with addition of second mining unit and repurposed concentrator
• Ambrosia, South Australia, mine move to new deposit to provide capacity and flexibility to maintain zircon production at current levels over future years
• All projects delivered on or ahead of schedule and on or under budget
PROPOSED DEMERGER OF ROYALTY BUSINESS
• Follows comprehensive review of corporate and capital structure during 2019
• Determined as best means to deliver value to shareholders from a historically significant evolution in the development of the MAC province - BHP’s South Flank project
• Will liberate two distinct business – each with quality assets and promising futures – into two stand-alone ASX-listed companies
• An example of the capital discipline Iluka will continue to practice as the company considers future investment opportunities
UNDERLYING EBITDA
$616m
CATABY MINE COMMISSIONED
APRIL
$270m
For
per
sona
l use
onl
y

Iluka Resources Limited, Annual Report 2019 7
SOLID UNDERLYING FINANCIALS
OPERATIONAL TRANSITION
• Expansions and new developments executed across the business as a new operational configuration was established
• Sierra Rutile operations transitioned during the year to accommodate expansions at Lanti and Gangama, with fourth quarter (post expansion) rutile production of 44 thousand tonnes — the strongest consistent production performance since acquisition in late 2016
• Cataby ramped up to near nameplate production as at December 2019
• Jacinth-Ambrosia operated as per plan
• Narngulu mineral separation plant reconfigured with a barite facility in order to process Cataby’s zircon and rutile streams
• Synthetic rutile kiln outperformed expectations
PIPELINE OF GROWTH PROJECTS
• Pipeline of projects to sustain and grow production progressed over 2019
• Iluka poised to produce and market monazite – from which rare earths are derived – for the first time in many years - with commencement of Eneabba mineral sands recovery project in 2020, currently under construction
• Sembehun development re-scoping advanced and field trials for alternative mining method planned in 2020
• Balranald third trial (T3) committed for 2020
• Other zircon, high-grade titanium and rare earth focused projects at various stages of evaluation
SUSTAINABILITY PERFORMANCE
• Material reduction in the number of injuries classified as having serious potential
• Iluka’s total recordable injury frequency rate decreased from 3.5 to 2.9 with four less injuries than 2018
• Sierra Rutile achieved 12 months without a lost time injury
• Increase in ‘near hits’ classified as having the potential for severe injury or fatality to 76 from 47 in 2018. While this may in part be a reflection of improvements in incident classification and reporting implemented in 2019, it remains a focus for continual improvement in safety
• 35% reduction in reportable environmental incidents
• Proactive measures introduced to manage the impact of communicable diseases including malaria and typhoid
• Demolition of redundant assets, clean-up of sites; and rehabilitation and revegetation of former mined land as part of ongoing closure and land management activities
• Inclusion within 2019 Australian Dow Jones Sustainability Indices and FTSE4Good Index for leading sustainability performance
• Progress on understanding of physical climate risks and opportunities, in line with the recommendations of the Taskforce on Climate-related Financial Disclosure (TCFD)
SR2KILN OUTPERFORMED
EXPECTATIONS
REDUCTION IN REPORTABLE
ENVIRONMENTAL INCIDENTS
35%
For
per
sona
l use
onl
y

Iluka Resources Limited, Annual Report 20198
CHAIRMAN’S REVIEW
DEAR SHAREHOLDERS,
2019 was a year which produced accomplishment and disappointment at Iluka; and yet demonstrated the company’s resilience overall.
This mixed performance across the portfolio was reflected in the company’s results and attributable to lingering uncertainties in the global economy, uneven mineral sands market conditions and challenges with respect to our investment in Sierra Leone. Key features included:
• a total recordable injury frequency rate of 2.9, down from 3.5 in 2018;
• a reported net loss of $300 million, after write-downs of $414 million for Sierra Rutile and an associated $162 million reduction in the deferred tax asset;
• underlying group EBITDA of $616 million, up 3% on 2018;• free cash flow of $140 million, after capital expenditure of
$198 million; and• a net cash position of $43 million at 31 December 2019.
The notable disappointment was the $414 million carrying value write-down of Sierra Rutile. Nevertheless, Iluka’s underlying performance was the third best in the company’s history – achieved against a backdrop of commissioning five key capital projects; and a challenging macroeconomic environment for business generally. The company declared a final dividend of 8 cents per share. Total dividends for the year were 13 cents per share, consistent with our dividend framework to return to shareholders a minimum of 40% of free cash flow not required for investment purposes or balance sheet activity.
Business sentiment softened over the course of the year, for the most part a result of persistent trade and other geopolitical tensions. The subsequent impact across Iluka’s markets was varied, with ceramics customers reducing zircon inventories, placing pressure on sales volumes and prices into both China and Europe. Market conditions in the high-grade titanium feedstock market, by contrast, remained steady. Iluka took a number of steps to adapt to these conditions and the company’s mineral sands business remains well positioned, with strong fundamentals serving as a foundation from which to continue to meet our objective – to deliver sustainable value.
In a significant development, your Board and Executive have taken the decision to make preparations to put a proposal to shareholders regarding a demerger of the Mining Area C (MAC) royalty business from the mineral sands business via an in specie distribution.
For
per
sona
l use
onl
y

Iluka Resources Limited, Annual Report 2019 9
The position of the MAC royalty within Iluka’s portfolio has been subject to ongoing consideration by the company over many years. Our primary driver for pursuing a demerger at this time relates to greater clarity, proximity and certainty from BHP regarding the development of its South Flank iron ore project. South Flank is now more than 50% complete and expected to deliver a production increase within the MAC royalty area of approximately 80 million dry metric tonnes per annum from 2023, increasing the potential cash flows generated by Iluka’s royalty business substantially. A demerger holds the prospect of liberating two fundamentally distinct and different businesses – each with quality assets and promising futures – into two separate, stand-alone ASX listed companies.
Your Board plans to put a demerger resolution to shareholders at an Extraordinary General Meeting to be held later this year. We expect to be in a position to provide you an update on specific timing at our Annual General Meeting in April. The decision to pursue a demerger follows a comprehensive review undertaken over the past year, which intensified following our announcement to the ASX in October. That review determined a demerger would deliver the most appropriate corporate structure for the future of both businesses; and the best means to deliver value from what is a historically significant evolution in the development of the MAC province. Shareholders will in time receive a demerger booklet setting out the rationale for this proposal in detail.
In Sierra Leone, I would reiterate our disappointment at the write-down of Sierra Rutile. Put plainly, since acquiring the asset in 2016, we have not been able to achieve what we thought we would, including a defined development approach to Sembehun. Notwithstanding our disappointment, Sembehun remains one of the largest, highest quality known rutile deposits in the world and offers the potential to extend the operating life of Sierra Rutile by up to 25 years. We are pursuing a development approach in a disciplined and rigorous manner that ensures an appropriate balance between risk and return. Progress on operational improvements has also been slower than that anticipated in the investment case, though I would note that over the last several months Sierra Rutile has delivered its strongest consistent production performance since acquisition.
Iluka’s safety performance also reflected mixed results across the business – at Sierra Rutile we achieved 12 months without a lost time injury, which is a terrific outcome; whereas in Australia, while our headline statistical performance improved, we saw a concerning rise in incidents with the potential to
cause serious harm. Iluka simply cannot afford to lose focus on the company’s first and enduring priority – the safety and well-being of our people. Renewed efforts in this area are at the forefront of the Board’s agenda, including implementation of a number of grass roots, ‘back to basics’ initiatives.
On sustainability matters more broadly, Iluka recorded 13 reportable environmental incidents in 2019, down from 20 during the previous year. The company rehabilitated 686 hectares of land previously disturbed by mining, compared with 808 hectares in 2018. Steps to implement the recommendations made by the Task Force on Climate related Financial Disclosures (TCFD) continued, with the Board Charter revised to provide for an annual review of climate-related risks. Iluka also participated in the resource and energy industries’ modern slavery collaborative group, developing an understanding and capability to support the implementation of Australian modern slavery legislation.
Renewal at Board level continued in 2019, with the appointments of Susie Corlett and Lynne Saint in May and October respectively. Given the prospect of considerable evolution in Iluka’s business over the coming period, the Board is mindful of balancing institutional memory with fresh perspectives and Susie and Lynne are already making important contributions in this regard.
While early 2020 has brought some welcome geopolitical developments – including signs of rapprochement between the US and China on trade and resolution with respect to the UK’s departure from the EU – the state of the global economy remains finely balanced and it is likely that a degree of external uncertainty will persist for some time to come. In these circumstances, as ever, it is imperative that Iluka continues to capitalise on the opportunities that are available, consistent with the company’s objective.
I would like to thank my fellow Directors, Iluka’s Executive and wider workforce for their shared dedication to this task. I am also grateful for the enduring interest and support of our shareholders.
Greg Martin ChairmanF
or p
erso
nal u
se o
nly

Iluka Resources Limited, Annual Report 201910
MANAGING DIRECTOR’S REVIEW
DEAR SHAREHOLDERS,
Over the past three years Iluka has embarked on an ambitious agenda of delivery designed to put the company on a sustainable footing. In 2019 we realised the first phase of this agenda, with the completion of key projects at Cataby and the associated refresh of synthetic rutile kiln 2 in Western Australia ($305 million); Ambrosia in South Australia ($35 million); and Lanti and Gangama in Sierra Leone ($US78 million) – each on time and budget.
Parallel to these developments, the company has pursued a range of complementary marketing, operational and corporate initiatives as part of an enduring focus on capital discipline, which is inexorably linked to the delivery of sustainable value. The past 12 months has seen this programme tested amid challenging business conditions, with mixed results. The disappointing outcome was at Sierra Rutile, where to this point the acquisition has fallen well short of investment case expectations, both in terms of the operational outcomes that have been achievable in Sierra Leone and the potential cost to develop Sembehun. As we look to the period ahead and the prospect of progressing our next phase of production replacement and growth options, Iluka will pursue capital discipline of the quality demonstrated in the Cataby development and deploy capital only where and when we have sufficient confidence in achieving a satisfactory return.
Markets
Revenue generated from mineral sands was $1,193 million, down 4% on 2018. Lower sales volumes were partially offset by price increases across the portfolio, with revenue per tonne sold up 17%. The company identified short-term softness in the zircon market at mid-year and responded in the second half. Inasmuch as sustainability, transparency and predictability had governed our approach during the market tightness of 2017-18, in 2019 we added flexibility, via enhanced loyalty rewards and an augmented product mix of standard grade zircon and zircon-in-concentrate. This enabled us to achieve sales volumes in line with revised guidance despite cautious purchasing behaviour, some thrifting in downstream industries and an attendant reduction in demand. Destocking on the part of Iluka’s customers was evident during the year, though there are indications this may have now run its course. Long-term fundamentals for zircon remain positive, with a projected return to market tightness as demand grows modestly and new supply sources become increasingly challenging.
Conditions for high-grade titanium dioxide provided an altogether different scenario, with Iluka’s rutile and synthetic rutile sales constrained by production with limited inventory. Major pigment producers have expressed optimism around improving demand and pricing in 2020; and there is tangible strength in welding and titanium
For
per
sona
l use
onl
y

Iluka Resources Limited, Annual Report 2019 11
sponge markets. In January, Iluka and Kronos signed a take-or-pay sales offtake agreement for 75% of standard grade rutile produced at Sierra Rutile through to the end of 2022. This agreement provides certainty for one of our key customers and supports value generation at Lanti and Gangama, which is especially important as we progress work on a development approach to the Sembehun project. With the signing of the Kronos contract; the offtake agreements in place to underpin synthetic rutile production from Cataby; and the rutile take-or-pay contracts agreed with Japanese titanium metal customers announced last year, we have achieved an unprecedented level of revenue certainty for our titanium dioxide feedstocks business.
Operations
Iluka’s full year production of 702 thousand tonnes was down 4% on 2018, as the company adjusted settings in response to market dynamics. In addition, each of our operations experienced some planned disruption in association with major projects being commissioned. In Australia, synthetic rutile kiln 2 underwent a major maintenance outage in January prior to receiving ilmenite sourced from Cataby, which itself commenced production in April and ramped up over the rest of the year. Similarly, the Narngulu mineral separation plant was reconfigured with a barite facility in order to process Cataby’s zircon and rutile streams, in addition to concentrate from Ambrosia following the mine move from Jacinth in August. Overall performance was solid given the scale of change, though I would echo the Chairman’s comments regarding safety, which is the essential foundation for whatever else we might achieve as a company and must improve. With assets now largely settled, Iluka’s Australian sites are well placed to return to operational excellence over the coming year.
At Sierra Rutile, the year began with the decommissioning of dredge operations and the commencement of Iluka’s strategic partnership with the International Finance Corporation – the private sector development arm of the World Bank and one of the country’s largest foreign donors. This was followed by the commissioning of the Lanti and Gangama expansions in the fourth quarter, which have doubled the production capacity of each of these mines. Punctuating our year of transition was a 32% increase in fourth quarter production, comprising 44 thousand tonnes of rutile, with the mineral separation plant operating at capacity. Improvement – albeit slower than anticipated and off a poor year in 2018 – is discernible, whether in the area of safety, production or our relationships with local stakeholders. While clearly we still have a long way to go, Iluka will continue to implement measures to maintain and build on these results as part of our ongoing efforts in-country.
Projects
2019 saw progress throughout Iluka’s project development pipeline, which includes traditional mineral sands developments (Sembehun, synthetic rutile kiln 1, Atacama), those based on innovation (Wimmera, Balranald) and potential diversification prospects (Eneabba, Wimmera). These projects provide a range of options to drive the next stage of the company’s growth. Clearly not all of them will be developed simultaneously; indeed some may not be developed at all for technical or market reasons.
We are at present actively engaged in preparations for the key trial of underground mining technology at Balranald in New South Wales. At Eneabba in Western Australia, site construction has commenced at our strategic stockpile of historical material. Commissioning for Phase 1 at Eneabba, which involves recovering and processing these tailings to produce a mixed zircon and monazite concentrate, is expected in the first half of 2020. Studies into Phase 2, which involves further processing to separate the zircon and monazite product streams, are well underway. This is a low risk, low capital project that delivers strong returns as well as reducing an ongoing rehabilitation obligation. I would add that the production and sale of monazite – from which rare earths are derived – affords Iluka the opportunity to establish some customer and shareholder credibility in a market the company has not participated in for many years. This credibility will be very important as we consider the Wimmera project in particular, which is a potentially long-life zircon and rare earths development currently at pre-feasibility study stage. More information on our project pipeline can be found on pages 34-35.
Iluka commences 2020 with a healthy balance sheet; settled operations; a diverse project pipeline; and a demonstrated ability to adapt flexibly to changes in our key markets, both of which display strong fundamentals over the long term. These are characteristics of a company with a sustainable future, which underpins the Board’s decision to move toward demerging the MAC royalty business. The potential demerger is a further example of the capital discipline Iluka will continue to practice as we consider future investment opportunities.
Tom O’Leary Managing Director and Chief Executive Officer
For
per
sona
l use
onl
y

Iluka Resources Limited, Annual Report 201912
BOARD OF DIRECTORSSUMMARY OF EXPERIENCE
GREG MARTIN BEc, LLB, FAIM, MAICD
Chairman Independent Non-Executive DirectorJoined Iluka 2013 Murchison Metals, The Australian Gas Light Company, Santos, Western Power
TOM O’LEARY LLB, BJuris
Managing Director Chief Executive Officer Joined Iluka 2016 Wesfarmers Chemicals, Energy & Fertilisers, Wesfarmers; Nikko, Nomura, Allen & Overy, Clayton Utz JAMES (HUTCH) RANCK BSE (Econ), FAICD
Independent Non-Executive Director Joined Iluka 2013 Elders, CSIRO, DuPont
ROB COLE LLB (Hons), BSc
Independent Non-Executive DirectorJoined Iluka 2018 Perenti, GLX Group, Synergy, Southern Ports, St Bartholomew’s House, Woodside Petroleum, King & Wood Mallesons
JENNIFER SEABROOK BCom, FCA, FAICD
Independent Non-Executive Director Joined Iluka 2008 IRESS, BGC Australia, ARTC Corporation, MMG, Gresham, Hartley Poynton, Touche Ross
MARCELO BASTOS BEng Mechanical (Hons, UFMG), MBA (FDC-MG), MAICD
Independent Non-Executive DirectorJoined Iluka 2014 Vale, BHP, MMG, Aurizon Holdings,Golder Associates, Golding Contractors, Anglo American PLC
SUSIE CORLETT BSc (Geo Hons), GAICD, FAusIMM
Independent Non-Executive DirectorJoined Iluka 2019 Aurelia Metals Ltd, The Foundation for National Parks and Wildlife, Standard Bank Limited, Macquarie Bank
LYNNE SAINT BCom, GradDip Ed Studies, Cert Business Administration, FAICD
Independent Non-Executive DirectorJoined Iluka 2019Bechtel Group, Australian Society of Certified Practising Accountants
Image above (L-R): James (Hutch) Ranck, Susie Corlett, Marcello Bastos, Lynne Saint, Greg Martin, Tom O’Leary, Jennifer Seabrook, Rob Cole
For
per
sona
l use
onl
y

Iluka Resources Limited, Annual Report 2019 13
TOM O’LEARY LLB, BJuris
Managing Director and Chief Executive Officer Joined Iluka 2016 Wesfarmers Chemicals, Energy & Fertilisers; Wesfarmers; Nikko; Nomura
ADELE STRATTON BA (Hons), FCA, GAICD
Chief Financial Officer Joined Iluka 2011 KPMG; Rio Tinto Iron Ore
MATTHEW BLACKWELL BEng (Mech), Grad Dip (Tech Mgt), MBA, MAICD, MIEAust
Head of Major Projects, Engineering & InnovationJoined Iluka 2004 Asia Pacific Resources; WMC Resources; Normandy Poseidon
SARAH HODGSON LLB, GAICD
General Manager People & Sustainability Joined Iluka 2013 Mercer; Westpac; KPMG
ROB HATTINGH MSc (Geochem)
Chief Executive Officer Sierra Rutile Joined Iluka 2008 Richards Bay Minerals; Exxaro
JULIAN ANDREWS BCom (Hons), PhD, CFA, GAICD
Head of Strategy, Planning and Business Development Joined Iluka 2017 Wesfarmers Chemicals, Energy & Fertilisers; PwC
SUE WILSON BJuris, LLB, FGIA, FICSA, FAICD
General Counsel and Company Secretary Joined Iluka 2016 South32; Bankwest; Herbert Smith Freehills; Western Power
MELISSA ROBERTS BCom (Hons), MBA
General Manager, Investor Relations and Commercial Mineral Sands Operations Joined Iluka 2009 CSBP (now part of Wesfarmers); Mayne Health
DANIEL MCGRATH BSc (Math)
General Manager, Cataby & Southwest Joined Iluka 1993
CHRISTIAN BARBIER M.Sc. (Management)
Head of Marketing Joined Iluka 2016Sibelco Asia, Alcan International
TIM BARTHOLOMEW B.Eng. (Hons)
General Manager Strategic Management and ClosureJoined Iluka 2007Peabody Energy; Mussellbrook Coal Company; Henry Walker Eltin
SHANE TILKA BCom
General Manager Jacinth-Ambrosia & Midwest Joined Iluka 2004
Image above (L-R): Tim Bartholomew, Sue Wilson, Rob Hattingh, Adele Stratton, Daniel McGrath, Tom O’Leary, Julian Andrews, Matthew Blackwell, Melissa Roberts, Shane Tilka, Sarah Hodgson, Christian Barbier
EXECUTIVE
COMMITTEES
The Board of Directors comprises six non-executive Directors and one executive Director (the Managing Director).
EXECUTIVE
The Executive is structured to include 12 senior leaders. Its responsibilities include achieving defined business and financial outcomes, capital deployment, business planning, identification and pursuit of appropriate growth opportunities, sustainability performance, promotion of diversity objectives and succession planning.
Audit and Risk Committee Chairman – Jennifer Seabrook
People and Performance Committee Chairman – James (Hutch) Ranck
Nominations and Governance Committee Chairman – Greg MartinF
or p
erso
nal u
se o
nly

Iluka Resources Limited, Annual Report 201914
FINANCIAL SUMMARY
MINERAL SANDS
REVENUE
$1,193m
Mineral sands revenue was $1,193 million, down 4% from 2018. This reflects an 18% decline in Z/R/SR sales volumes, partially offset by a 17% increase in average revenue per tonne.
Zircon sales volumes declined 28% to 274 thousand tonnes as geopolitical and trade tensions weighed on business sentiment in key markets. Iluka maintained a stable Zircon Reference Price at US$1,580 per tonne over 2019, resulting in the average zircon premium and standard prices up 10% relative to 2018. The company’s flexible approach in offering an augmented product mix of standard grade zircon and zircon-in-concentrate enabled Iluka to maintain price stability for premium products.
Market conditions remained solid for high-grade titanium, though sales were production constrained and down 9%. Weighted average rutile prices increased by 20%, reflecting market tightness for high-grade titanium feedstocks.
2019 underlying mineral sands EBITDA was $531 million, down 3% from 2018, driven by lower sales volumes.
The Group reset its operating configuration during the year, with the commencement of mining and concentrating at the new Cataby mine development in Western Australia, the mine move from Jacinth to Ambrosia in South Australia and the doubling of production capacity at both Lanti and Gangama mines in Sierra Leone. This operational reset increased cash production costs as a result of increased mining activities. The mineral sands business continued to generate strong EBITDA margins, up to 45% (2018: 44%).
Mining Area C royalty income was $85 million, up 53% from 2018, reflecting strong iron ore prices, 7% higher sales volumes and a stronger US dollar exchange rate.
BHP’s South Flank iron ore project is now more than 50% complete and expected to deliver a production increase within the MAC royalty area of approximately 80 million dry metric tonnes per annum from 2023, increasing the potential cash flows generated by Iluka’s royalty business substantially.
Iluka’s 2019 underlying Group EBITDA of $616 million represents the third best underlying performance in the company’s history and is the second consecutive year of strong results. This is a significant achievement in a period of subdued zircon market conditions and operational configuration transition.
820726
1,018
1,244
15 16 17 18 19
1,193
$m
UNDERLYING MINERAL
SANDS EBITDA
$531m
232
103
301
15 16 17 18 19
545
EBITDA 1
EBITDA 1 margin
28%14%
30%
44%
531
45%
$m
MINING AREA C EBITDA
$85m
62
48
60
15 16 17 18 19
56
$m
85
UNDERLYING GROUP EBITDA
$616m
$m
293
151
361
15 16 17 18 19
600 616
For
per
sona
l use
onl
y

Iluka Resources Limited, Annual Report 2019 15
NET (LOSS) PROFIT
AFTER TAX
$(300)m
FREE CASH FLOW
$140m
NET CASH (DEBT)
$43m
ROE AND ROC
ROE (26.6)% ROC 4.6%
Iluka reported a net loss after tax of $300 million in 2019. This reflects a $414 million (US$290 million) write-down for the carrying value of assets associated with Sierra Rutile combined with the associated removal of $162 million (US$115 million) deferred tax asset. Underlying net profit after tax was $279 million.
The adjustment to the Sierra Rutile carrying value is a function of operational performance achieved to date being below the acquisition investment case; and that Iluka does not currently have a defined development approach for the Sembehun deposit. The company is however continuing to implement various measures to drive production improvement and advance Sembehun development options.
2019 free cash flow was $140 million, down from $304 million in 2018.
Operating cash flow was $408 million and the Mining Area C royalty contributed $79 million.
Capital expenditure in 2019 was $198 million, with a number of projects completed and commissioned during the year, including the Cataby development and associated kiln refresh at SR2; the Lanti and Gangama mine expansions at Sierra Rutile; and the mine move from Jacinth to Ambrosia in South Australia.
The free cash flow includes tax payments of $147 million (further tax payments of $94 million relating to the 2019 financial year are to be made in 2020).
Iluka reported a net cash position of $43 million as at 31 December 2019, up from net cash of $2 million at 31 December 2018. Over the course of 2019, net debt peaked at $142 million with significant capital expenditure on project completion to sustain future production. Solid cash flows from Iluka’s underlying business funded these projects and returned the business to a net cash position over the second half of the year.
155
47
15 16 17 18 19
322304
Net debtGearing %
Return on equityReturn on capital
15 16 17 18 19
$m $m $m %
140
64% 32% 2
n/a n/a
(183)
(506)
43
15 16 17 18 19 15 16 17 18 19
7
(18) (20)
54
32
(12)(17)
4
The reported loss as a consequence of the Sierra Rutile write-down is reflected in a return on shareholders equity (ROE) of (26.6%) and return on capital (ROC) of 4.6%.
5
(27)
54
(172)
304
(224)(300)
n/a
For
per
sona
l use
onl
y

Iluka Resources Limited, Annual Report 201916
Nitti Port, Sierra Rutile, Sierra Leone
BALANCE SHEET As at 31 December 2019, Iluka had total debt facilities of $519 million and net cash of $43 million. The company has a Multi Optional Facility Agreement (MOFA), which comprises a series of five-year unsecured bilateral revolving credit facilities with several domestic and foreign institutions. In July 2019, Iluka completed a refinancing of its MOFA resulting in improved (lower) margins and fees and an extension of maturity through to July 2024. Following an assessment of its medium term liquidity requirements, Iluka reduced the size of its facilities to ~$520 million from $620 million. Drawings under the MOFA at 31 December 2019 were $56 million (2018: $50 million). Of the above interest-bearing liabilities, $56 million is subject to an effective weighted average floating interest rate of 3.1% (2018: 4.2%). Note 15 of Iluka’s Financial Report provides details of the maturity profile and interest rate exposure.
DEBT FACILITIESMATURITY PROFILE
020 21 22 23 24
0 0 0
519Debt & Facility
DEBT, GEARING AND DEBT FACILITIES PROFILE
$m
1200
1000
800
600
400
200
0
(200)
(400)
(600)
17%32%
15 16 17 18 19
6
(506)
(183)
2
1,010 1,015
695618
Gearing %
100
80
60
40
20
0
519
43
FacilityDebtGearing%
For
per
sona
l use
onl
y

Iluka Resources Limited, Annual Report 2019 17
DIVIDEND FRAMEWORK Iluka’s dividend framework is to pay a minimum of 40% of free cash flow not required for investing or balance sheet activity. The company also seeks to distribute the maximum franking credits available. Iluka’s 2019 full year dividend payment of 13 cents per share (8 cents per share final and 5 cents per share interim dividend), fully franked, represents 40% of free cash flow for the year.
Distribution metrics 2019 2018 Payout ratio % free cash flow 40 40
HEDGING Iluka extended its foreign exchange hedging programme during the year as part of its financial risk management strategy by entering into US$32 million in forward foreign exchange contracts maturing in 2020 at an average AUD:USD rate of 69.3 cents in relation to expected 2020 USD revenue.
US$118 million in foreign exchange collar contracts consisting of US$118 million of bought AUD call options with weighted average strike prices of 80.5 cents and US$118 million of sold AUD put options with weighted average strike prices of 70.0 cents expired during the year.
Note 21 of Iluka’s Financial Report provides details of Iluka’s open hedge contracts at 31 December 2019.
For
per
sona
l use
onl
y

Iluka Resources Limited, Annual Report 201918
OUR CORE We are an
INTERNATIONAL MINERAL SANDS COMPANY with expertise in
exploration, development, mining, processing, marketing and
rehabilitation.
OUR DIRECTION
-
DELIVER TO GROW OUR
FUTURE
EXECUTE our projectsEXCEL
in our coreMATURE our options
OUR DIRECTION -
LONGER TERM
GROW WHERE WE CAN ADD VALUE
OUR VALUES
Act with INTEGRITYDemonstrate
RESPECTShow
COURAGETake
ACCOUNTABILITY
COLLABORATE
Mineral sands opportunitiesand diversification
NEAR TERM
THE ILUKA PLANThe Iluka Plan outlines Iluka’s values, purpose, core and direction. It is the strategic reference point that guides the company’s priorities and decision-making.Cataby, Western Australia
OUR PURPOSE
DELIVERSUSTAINABLEVALUE
For
per
sona
l use
onl
y

Iluka Resources Limited, Annual Report 2019 19
STRATEGY AND BUSINESS MODEL OUR VALUES
INTEGRITYRESPECTCOURAGEACCOUNTABILITYCOLLABORATION
OUR PURPOSE
Iluka’s purpose is to deliver sustainable value.
The company aims to achieve this by:
• protecting the safety, health and wellbeing of our employees;
• optimising shareholder returns through prudent capital management and allocation;
• developing a robust business that can maintain and grow returns over time;
• providing a competitive offering to our customers;
• managing our impact on the environment; • supporting the communities in which
we operate; and • building and maintaining an engaged,
diverse and capable workforce.
DELIVER TO GROW OUR FUTURE
Iluka delivered five major projects in 2019, establishing a strong base to sustain the company’s operations.
• The Cataby mine in Western Australia was commissioned and supports synthetic rutile production for at least the next 8.5 years, with the possibility of further extending mine life. The operation achieved near nameplate production in December.
• Ilmenite mined at Cataby is processed at synthetic rutile kiln 2 (SR2), which underwent a major refresh prior to receiving Cataby material. Delivered ahead of schedule and on budget, the refresh has additionally facilitated an increase in SR2’s processing capacity from approximately 205 thousand tonnes per annum to approximately 225 thousand tonnes per annum.
• The mine move from Jacinth to Ambrosia in South Australia was achieved ahead of schedule and significantly under budget. This development enables Iluka to sustain zircon production levels into the medium term. It also provides for enhanced flexibility in Iluka’s
zircon product suite, which is essential in the context of challenging market conditions in the short term.
• Expansion projects to double production levels at Lanti and Gangama in Sierra Leone have been delivered on schedule and budget. With these expansions commissioned, fourth quarter production at Sierra Rutile was up 32%, comprising 44 thousand tonnes of rutile, with the mineral separation plant operating at capacity.
GROW WHERE WE CAN ADD VALUE
The company is also maturing its portfolio of projects with a view to future production replacement and growth options.
This includes:
• traditional mineral sands developments (Sembehun, synthetic rutile kiln 1, Atacama);
• developments based on innovation (Wimmera, Balranald); and
• diversification prospects (Eneabba, Wimmera).
An overview of Iluka’s development pipeline, including the current status of each of these projects is detailed on pages 34-35 of this report.
Insofar as inorganic growth options are concerned, Iluka considers merger and acquisition opportunities that demonstrate both a clear business advantage and value for shareholders on a risk-adjusted basis.
CAPITAL MANAGEMENT
Iluka’s approach to capital management seeks to balance the impact of mineral sands pricing and investment factors. Central aspects of the company’s methodology in this area include:
• disciplined capital allocation, meaning Iluka will commit funds to new projects only where and when it is sufficiently confident of achieving a satisfactory return; and
• Iluka’s dividend framework, which stipulates distributions to shareholders of a minimum of 40% of free cash flow not required for investment purposes or balance sheet activity.
Risks to the achievement of the Iluka Plan, and their associated mitigation measures, are outlined on pages 40-41 of this report.F
or p
erso
nal u
se o
nly

Iluka Resources Limited, Annual Report 201920
FINANCIAL AND OPERATIONAL REVIEW
For
per
sona
l use
onl
y
Iluka Resources Limited, Annual Report 2019 21
In this section
SALES AND MARKETS
PRODUCTION AND OPERATIONS
PROJECTS
EXPLORATION
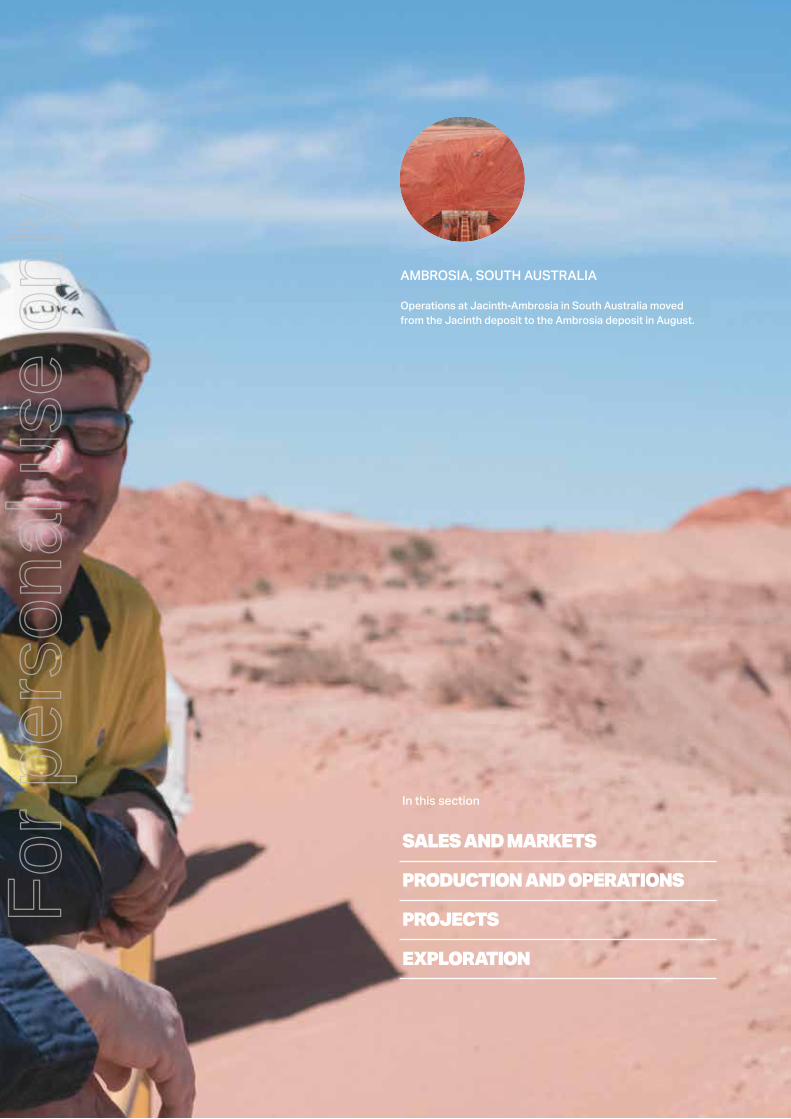
AMBROSIA, SOUTH AUSTRALIA
Operations at Jacinth-Ambrosia in South Australia moved from the Jacinth deposit to the Ambrosia deposit in August.
For
per
sona
l use
onl
y

Iluka Resources Limited, Annual Report 201922
FINANCIAL AND OPERATIONAL REVIEW
Sierra Rutile, Sierra Leone
INCOME STATEMENT ANALYSIS
2019 2018 % change$ millionZ/R/SR revenue 1,128.7 1,179.0 (4.3)Ilmenite and other revenue 64.4 65.1 (1.1)Mineral sands revenue 1,193.1 1,244.1 (4.1)Cash costs of production (539.6) (455.1) 18.6 Inventory movement - cash 63.4 (68.5) n/aRestructure and idle capacity charges (19.7) (24.7) (20.2)Government royalties (39.4) (38.1) 3.4 Marketing and selling costs (35.0) (38.1) (8.1)Asset sales and other income (3.5) 1.8 n/aExploration and resources development (42.2) (30.1) 40.2Corporate and other costs (48.0) (48.1) (0.2) Foreign exchange 1.8 1.3 38.5 Mineral sands EBITDA 530.9 544.5 (2.5)Mining Area C EBITDA 85.1 55.6 53.1 Underlying Group EBITDA 616.0 600.1 2.6 Depreciation and amortisation (163.2) (93.6) 74.4 Inventory movement - non-cash 15.5 (28.3) n/aRehabilitation for closed sites (3.2) 4.6 n/aWrite-down of Sierra Rutile Limited (414.3) - n/aGroup EBIT 50.8 482.8 (89.5)Net interest costs and bank charges (13.8) (14.1) (2.1)Rehabilitation unwind and other finance costs (38.0) (16.7) 127.5 (Loss) profit before tax (1.0) 452.0 n/aTax expense (298.7) (148.1) 101.7 Profit (loss) for the period (NPAT) (299.7) 303.9 n/aAverage AUD/USD (cents) 69.5 74.8 (7.1)
1 Underlying Group EBITDA excludes adjustments including write-downs, and changes to rehabilitation provisions for closed sites.
UNDERLYING NPAT
$ million 2019 2018NPAT (299.7) 303.9Non-recurring adjustments:Rehabilitation for closed sites - total (post tax) (2.2) 3.2 Derecognition of SRL tax assets (161.9) - Write-down of Sierra Rutile Limited (414.3) - Underlying NPAT 278.7 300.7
For
per
sona
l use
onl
y

Iluka Resources Limited, Annual Report 2019 23
MOVEMENT IN UNDERLYING NPAT
Sales commentary is contained on pages 24-25.
The Australian dollar weakened in 2019, with an average exchange rate of 69.5 cents compared to 74.8 cents in 2018. This increased the Australian dollar Z/R/SR revenue received, with the majority of sales denominated in US dollars. The Group has hedging contracts to assist in managing exchange rate exposure, which are detailed on page 17 of this report. Foreign exchange impacts on operating costs, mainly those relating to Sierra Rutile operations, are included in the overall movement in unit cost of goods sold.
Cash costs of production increased by $85 million, despite lower production volumes. Increased costs related to increased mining activity with commencement of mining and concentrating activities at the new Cataby mine in April 2019. Higher costs at Sierra Rutile were due to increased production levels resulting in higher variable costs, along with increased maintenance and power costs. Also, exchange rate depreciation has contributed to higher Australian dollar costs on conversion of the Sierra Rutile US dollar cost base.
Unit cost of goods sold increased to $889 per tonne compared to $750 per tonne in 2018, reflecting a combination of factors including sales mix, with a greater proportion of higher cost Sierra Rutile sales and the change in the operating configuration of the Group, with the introduction of higher cost Cataby mine replacing Tutunup South mine for production of synthetic rutile.
Idle costs reflect ongoing maintenance and land management costs for idle plant and operations at Eneabba, Tutunup South, Murray Basin and the US.
Sierra Rutile was written down by $414 million. The adjustment to the Sierra Rutile carrying value is a function of operational performance achieved to date being below the acquisition investment case; and that Iluka does not currently have a defined development approach for the Sembehun deposit. The company is however continuing to implement various measures to drive production improvement and advance Sembehun development options.
Tax expense increased dramatically due to the de-recognition of US$115 million of deferred tax assets in Sierra Leone following the write-down of Sierra Rutile (although this had no impact on tax paid in the year, and tax losses are still available to be utilised if sufficient profit is generated). The corporate tax rate applicable in the main operating jurisdictions of Australia and Sierra Leone remained at 30%. Corporate tax payments in Sierra Leone are based on the higher of 30% of taxable profit or 3.5% of turnover. The group effective tax rate adjusted for write-down, deferred tax de-recognition and rehabilitation for closed sites was 32.8%.
.
31 D
ecem
ber 2
018
Pric
e
Vol
Mix FX
Ilm &
Oth
Unit
COG
S
Idle
Reha
b
Min
San
d O
ther
MAC
Unwi
nd &
Oth
er Tax
31 D
ecem
ber 2
019
130
(117)(22)
90
(4)
(107)
5
(5) (16)
30301
500
400
300
200
100
0
27911
(17)
For
per
sona
l use
onl
y

Iluka Resources Limited, Annual Report 201924
FINANCIAL AND OPERATIONAL REVIEW SALES AND MARKETS
Iluka sold 274 thousand tonnes of zircon in 2019, down 28% compared to 2018.
In 2019, sales were affected by subdued business and consumer confidence, particularly in China, as US-China trade tensions and a softer economic growth outlook weighed on end demand for zircon products and customer buying patterns.
Throughout the course of 2019, Iluka recorded a shift in customer buying patterns to lower grades of zircon in an effort to reduce costs and increase competitiveness. The company responded by managing sales of zircon across the product suite, including more Standard Zircon and zircon-in-concentrate. Iluka also introduced a number of enhanced loyalty rewards to support the company’s customer base.
Iluka’s Zircon Reference Price remained stable at US$1,580 per tonne during 2019.
Zircon
High-grade titanium feedstocks
Iluka’s 2019 sales of high-grade titanium feedstocks, rutile and synthetic rutile, were 407 thousand tonnes. Full year sales of high-grade titanium dioxide feedstock products (rutile and synthetic rutile) exceeded production reflecting solid demand for Iluka’s high-grade products.
The pigment industry, which accounts for around 90% of global titanium feedstock demand, went through a phase of destocking in 2019. However, for high-grade feedstocks, tight supply contributed to solid market conditions. Iluka’s feedstocks continue to be sought after for their high-grade titanium dioxide content properties, which increase average pigment plant feed grade for the company’s customers.
Iluka’s synthetic rutile is predominantly sold under contract. Sales volumes reflect annual production from the kiln and minor inventory movement. As per contractual arrangements, prices are not disclosed, but increased in line with market conditions. Iluka’s weighted average rutile price increased by 20% in 2019 to US$1,142 per tonne (excludes lower grade HYTI).
(1) Includes HYTI.
ZIRCON RUTILE(1) SYNTHETIC RUTILE ILMENITE
Sales volumes (kt) Sales volumes (kt) Sales volumes (kt) Sales volumes (kt)
346 339380 379
15 16 17 18 19
274
134
172
264
15 16 17 18 19
233
171187
244
15 16 17 18 19
215300
18
203
15 16 17 18 19
225
200 207
171
For
per
sona
l use
onl
y

Iluka Resources Limited, Annual Report 2019 25
AMERICAS
EUROPE
CHINA
AUSTRALIA
11%
33%
18%
3%
34%
ASIA & MIDDLE EAST
% OF TOTAL 2019 MINERAL SANDS SALES REVENUE
Weighted average received prices – US$/t FOB
2019 2018 2017 2016 2015Zircon premium and standard 1,487 1351 958 810 986Zircon all products (including zircon in concentrate)1 1,380 1321 940 773 961Rutile (excluding HYTI)2 1,142 952 790 731 763Synthetic rutile3 - - - - -
(1) Zircon prices reflect the weighted average price for zircon premium, zircon standard and zircon-in-concentrate. The prices for each product vary considerably, as does the mix of such products sold period to period. In 2019, full year split of premium, standard and concentrate by zircon sand-equivalent was approximately: 42%, 28%, 30% (2018: 50%, 30%, 20%).
(2) Included in rutile sales volumes reported elsewhere in this Annual Report is a lower titanium dioxide product, HYTI that typically has a titanium dioxide content of 70 to 91%. This product sells at a lower price than rutile, which typically has a titanium dioxide content of 95%. 2019 full year sales of the lower grade HYTI material were 23% of rutile sales (2018: 22%).
(3) Iluka’s synthetic rutile sales are, in large part, underpinned by commercial offtake arrangements. The terms of these arrangements, including the pricing arrangements are commercial in confidence and as such not disclosed by Iluka. Synthetic rutile, due to its lower titanium dioxide content than rutile, is priced lower than natural rutile.
For
per
sona
l use
onl
y

Iluka Resources Limited, Annual Report 201926
FINANCIAL AND OPERATIONAL REVIEW PRODUCTION AND OPERATIONS
Iluka’s operational configuration underwent significant change over 2019. In April, the Cataby mine development began production. Cataby produces magnetic (ilmenite) and non-magnetic (zircon and rutile) product streams. The ilmenite is processed at synthetic rutile kiln 2 (SR2) at Capel to produce synthetic rutile. The non-magnetic fraction is processed at the Narngulu mineral separation plant in Geraldton to produce zircon and rutile. Following a period of commissioning, Cataby ramped up over the course of 2019, operating at near nameplate production by December; and producing 240 thousand tonnes of heavy mineral concentrate for the year.
SR2 produced 196 thousand tonnes of synthetic rutile, down on the previous year due to a planned major maintenance outage undertaken in the first quarter of 2019. Full year production was above expectations, owing to the maintenance being completed ahead of schedule; and higher runtimes resulting from plant improvements implemented during the year.
Mining at Jacinth-Ambrosia in South Australia moved from the Jacinth North to the Ambrosia deposit. This move was expedited from the previously planned move in 2022 to provide capacity and flexibility to maintain zircon production at current levels over future years. The move was completed in August and operations were returned to full capacity. The mine produced 558 thousand tonnes of heavy mineral concentrate in 2019, which resulted from improved grades following the move to Ambrosia and increased mineral recoveries.
The Narngulu mineral separation plant processed 519 thousand tonnes of heavy mineral concentrate during 2019, including material from both the Cataby and Jacinth-Ambrosia mines. Operational settings at the plant were adjusted during the year to respond to market requirements across the zircon product suite, including the processing of heavy mineral concentrate with lower zircon assemblage.
Australia
Sierra Leone
2019 was also a year of major operational transition at Sierra Rutile. In February, Iluka decommissioned the dredge operation at the end of its life, as planned. This was followed by two major expansion projects being commissioned at Lanti and Gangama dry mines.
Sierra Rutile produced a total of 137 thousand tonnes of rutile during 2019, up 13% on the previous year (2018: 122 thousand tonnes). The operations experienced lower run time and throughput during 2019. Subsequently, a number of operational improvement initiatives were identified and implemented.
Post commissioning of the expansions, performance improved month-on-month over the December quarter, with rutile production reaching 44 thousand tonnes for the quarter, as the mineral separation plant operated at capacity. This represents Sierra Rutile’s strongest consistent production performance for some time.
Work continues on improving run times and throughput across the operation.
(1) Includes HYTI.
ZIRCON RUTILE (1) SYNTHETIC RUTILE ILMENITE
Production volumes (kt) Production volumes (kt) Production volumes (kt) Production volumes (kt)
389
347312
15 16 17 18 19
349322
137118
15 16 17 18 19
302
163 184
165
211
15 16 17 18 19
220196211 499
15 16 17 18 19
329
448395
319
For
per
sona
l use
onl
y

Iluka Resources Limited, Annual Report 2019 27
2019 2018 % changeHMC produced 1087 934 16.4HMC processed 961 1037 (7.3)
HMC produced and processed
Cash cost and unit cost of production $/t
2019 2018 % changeCash costs of production $m 539.6 455.1 18.6Unit cash production cost per tonne Z/R/SR produced1 $/t 753 606 24.2Unit cost of goods sold per tonne Z/R/SR sold $/t 889 750 18.5
Mineral sands operations results
Testing and analysis
Iluka has advanced testing and analysis facilities at Capel, Western Australia.
Revenue Mineral sands EBITDA EBIT$ million 2019 2018 2019 2018 2019 2018Jacinth-Ambrosia / Midwest 482.7 568.6 343.3 378.8 330.2 364.0Cataby / Southwest 414.2 297.2 220.6 142.3 172.7 115.6Idle Ops 38.6 184.9 3.9 83.9 (4.4) 54.4SRL 257.6 205.7 63.3 30.2 (427.6) (12.5)Support, Corporate & other elim 0.9 - (99.9) (88.6) (19.8) (36.7)Elimination - Interco Sales (0.9) (12.3) (0.3) (2.1) (0.3) (2.1)Total 1,193.1 1,244.1 530.9 544.5 50.8 482.8
(1) Calculated as cash costs of production, excluding by-product costs divided by Z/R/SR production.
For
per
sona
l use
onl
y

Iluka Resources Limited, Annual Report 201928
FINANCIAL AND OPERATIONAL REVIEW OPERATIONS
Jacinth-Ambrosia/Mid West
2019 2018 % changeProduction volumesZircon kt 260.2 311.9 (16.6)Rutile kt 31.2 38.0 (17.9)Total Z/R/SR production kt 291.4 349.9 (16.7)Ilmenite kt 107.0 121.7 (12.1)Total saleable production kt 398.4 471.6 (15.5)HMC produced kt 558.3 674 (17.1)HMC processed kt 454.8 530 (14.1)Unit cash cost of production - Z/R/SR (1) $/t 557 491 13.4 Mineral Sands revenue $m 482.7 568.6 (15.1)Cash costs of production $m (162.3) (168.4) (3.6)Inventory movement - cash costs of production $m 57.8 16.8 243.7 Restructure and idle capacity charges $m (2.4) (3.4) (29.9)Government royalties $m (23.6) (26.2) (9.9)Marketing and selling costs $m (8.9) (8.9) 0.1 Asset sales and other income $m - 0.4 (n/a)EBITDA $m 343.3 378.8 (9.4)Depreciation and amortisation $m (28.9) (25.3) 14.2 Inventory movement - non-cash production costs $m 14.2 2.0 618.1 Rehabilitation costs for closed sites $m 1.6 8.6 (81.4)EBIT $m 330.2 364.0 (9.3)
1 Calculated as cash costs of production, including by-product costs divided by Z/R/SR production.
Mineral sands revenue of $483 million for the year decreased 15% on lower demand for zircon, despite stronger sales prices.
Lower market demand resulted in a 40% increase in inventories held to $237 million at year end.
Cash costs of production reduced, predominantly reflecting lower production, with lower transport of concentrate to the mineral separation plant and less concentrate treatment in line with zircon demand.
Gross margin remained strong, increasing to 75% from 69% in 2018 mainly driven by improved pricing.
For
per
sona
l use
onl
y

Iluka Resources Limited, Annual Report 2019 29
Cataby/South West
2019 2018 % changeProduction volumesZircon kt 53.5 15.9 236.5 Rutile kt 15.6 3.7 321.6 Synthetic rutile kt 196.2 219.9 (10.8)Total Z/R/SR production kt 265.3 239.5 10.8 Ilmenite kt 152.4 168.1 (9.3)Total saleable production kt 417.7 407.6 2.5 HMC produced kt 240 20 1,075.6 HMC processed kt 217 265 (18.4)Unit cash cost of production - Z/R/SR $/t 747 512 45.9 Mineral sands revenue $m 414.2 297.2 39.3 Cash costs of production $m (198.1) (120.6) 64.2 Inventory movement - cash costs of production $m 24.9 (16.9) (246.9)Restructure and idle capacity charges $m (6.8) (4.6) 46.6 Government royalties $m (4.2) (2.6) 61.9 Marketing and selling costs $m (9.4) (11.0) (14.9)Asset sales and other income $m - 0.9 (100.0)EBITDA $m 220.6 142.3 55.1 Depreciation and amortisation $m (54.0) (20.1) 168.8 Inventory movement - non-cash production costs $m 6.2 (5.1) (221.6)Rehabilitation costs for closed sites $m (0.1) (1.4) (92.9)EBIT $m 172.7 115.6 49.3
Mineral sands revenue of $414 million increased by 39% with increased sales of Z/R/SR due to higher production following the successful commencement of operations at Cataby, as well as higher sales prices per tonne of Z/R/SR sold. Take-or-pay offtake agreements for at least 175 thousand tonnes of synthetic rutile production provided higher levels of certainty around both offtake and price. The planned major maintenance outage of the SR2 kiln resulted in lower production volumes of synthetic rutile in 2019, but was completed ahead of budget and will facilitate increased production.
Inventories increased 24% to $143 million with the new Cataby mine and associated operations stockpiles also reflected in the change in inventory movements year on year.
Cash costs of production reflect the mining commencement at Cataby, with unit cash costs of production reflective of ramp up rates and treatment of lower grade ores in 2019.
Gross margin increased to 42% (2018: 39%).
Activated carbon warehouse
Iluka sells and markets activated carbon, a by-product of its synthetic rutile kiln operations.
For
per
sona
l use
onl
y

Iluka Resources Limited, Annual Report 201930
Sierra Rutile
2019 2018 % changeProduction volumesZircon kt 8.5 11.4 (25.4)Rutile kt 137.2 121.5 12.9Total Z/R/SR production kt 145.7 132.9 9.6 Ilmenite kt 59.2 54.5 8.6Total saleable production kt 204.9 187.4 9.3HMC produced kt 288 240 20.2HMC processed kt 289.8 242 19.8Unit cash cost of production - Z/R/SR $/t 1,185 1,155 2.6Mineral sands revenue $m 257.6 205.7 25.2Cash costs of production $m (172.6) (153.5) 12.4Inventory movement - cash costs of production $m (7.9) (11.7) (32.5)Restructure and idle capacity charges $m 1.2 (2.5) (148.0)Government royalties $m (10.7) (6.9) 55.1Marketing and selling costs $m (3.7) (0.9) 311.1Asset sales and other income $m (0.6) - 100.0EBITDA $m 63.3 30.2 109.6Depreciation and amortisation $m (74.6) (41.1) 81.5Inventory movement - non-cash production costs $m (2.0) (2.9) (31.0)Rehabilitation costs for closed sites $m - 1.3 (100.0)Write-down expense $m (414.3) - n/aEBIT $m (427.6) (12.5) 3,320.8
Sierra Rutile was written down by $414 million. The adjustment to the Sierra Rutile carrying value is a function of operational performance achieved to date being below the acquisition investment case; and that Iluka does not currently have a defined development approach for the Sembehun deposit.
The company is however continuing to implement various measures to drive production improvement and advance Sembehun development options.
Mineral sands revenue increased 25% on higher sales prices, with production constraining sales volumes. Sales in 2020 will be supported by the take-or-pay offtake agreement with Kronos Worldwide Inc. for 75% of standard grade rutile produced by Sierra Rutile through to December 2022.
FINANCIAL AND OPERATIONAL REVIEW OPERATIONS
Sierra Rutile
Iluka’s safety performance in Sierra Leone was outstanding, with the Sierra Rutile operation exceeding one year without a lost time injury across its workforce and contractors.
For
per
sona
l use
onl
y

Iluka Resources Limited, Annual Report 2019 31
Idle operations (United States/Murray Basin)
2019 2018 % changeProduction volumesZircon kt - 9.3 -Total Z/R/SR production kt - 9.3 -Ilmenite kt - 50.8 -Total saleable production kt - 60.1 -Unit cash cost of production - Z/R/SR $/t - 225 -Mineral sands revenue $m 38.6 184.9 (79.1)Cash costs of production $m (6.5) (12.5) (48.1)Inventory movement - cash costs of production $m (11.4) (68.8) (83.4)Restructure and idle capacity charges $m (11.6) (14.1) (18.0)Government royalties $m (0.9) (2.4) (63.0)Marketing and selling costs $m (1.3) (3.8) (65.9)Asset sales and other income $m (2.9) 0.8 (462.5)EBITDA $m 4.0 83.9 (95.2)Depreciation and amortisation $m (0.6) (3.4) (82.2)Inventory movement - non-cash production costs $m (3.0) (22.2) (86.5)Rehabilitation costs for closed sites $m (4.7) (3.9) 21.2 EBIT $m (4.3) 54.4 (107.9)
Discontinued and idle operations reflect rehabilitation obligations in the United States (Florida and Virginia) and certain idle assets in Australia (Murray Basin). Zircon and ilmenite production ceased in the US in December 2015 following the completion of mining at Brink and Concord deposits. The US operations were permanently closed in December 2016. Production in 2018 represented the processing of remnant stockpiles to reduce future rehabilitation obligations.
Mineral sands revenue represents the sale of finished goods that had been stockpiled before cessation of production. The US inventory balance was $2.0 million at 31 December 2019 and the Murray Basin held $6.0 million of inventory.
Cash costs of production were largely driven by activities associated with product transportation, combined with some processing costs for the remnant stockpiles in 2018.
Restructure and idle costs reflect regional management and holding costs following closure of operations and care and maintenance of idled assets. These costs decreased by 18% in 2019 but are expected to continue to be broadly consistent until all stockpiles are diminished and rehabilitation is complete.
Rehabilitation costs remained consistent with the prior year. The cost of rehabilitating the Virginia operation will largely depend on the rehabilitation programme ultimately undertaken by Iluka, which will be determined following engagement with local regulators.
For
per
sona
l use
onl
y

Iluka Resources Limited, Annual Report 201932
FINANCIAL AND OPERATIONAL REVIEW
Movement in net (debt) cashH1 H2 H1 H2
2018 2018 2019 2019Opening net cash (debt) (182.5) (34.4) 1.8 (141.5)Operating cash flow 306.5 287.7 179.9 228.2 MAC royalty 29.6 26.2 30.4 48.1 Exploration (4.6) (7.1) (5.0) (6.3)Interest (net) (4.7) (1.9) (2.9) (2.8)Tax (2.4) (2.8) (143.9) (3.5)Capital expenditure (93.6) (217.9) (145.0) (52.5)Proceeds from changes in ownership interests - - 28.5 - Payments for options contracts - (0.6) - - Principal element of lease payments AASB 16 - - (4.0) (4.1)Asset sales 1.1 1.3 1.8 0.2 Share purchases (6.4) (6.0) (5.0) (2.4)Free cash flow 225.5 78.9 (65.2) 204.9 Dividends (69.2) (39.1) (79.6) (20.3)Net cash flow 156.3 39.8 (144.8) 184.6 Exchange revaluation of USD net debt (7.3) (2.9) 1.8 1.1 Amortisation of deferred borrowing costs (0.9) (0.7) (0.3) (0.9)(Decrease)/increase in net cash (debt) 148.1 36.2 (143.3) 184.8 Closing net cash (debt) (34.4) 1.8 (141.5) 43.3
Net cash increased to $43 million, reflecting strong free cash flow of $140 million, partially offset by a weaker Australian dollar revaluing US dollar denominated debt.
Operating cash flow of $408 million was a 31% decrease from 2018 due to higher cash costs, reflecting increased mining activities with the commissioning of the new Cataby mine; a build in inventories for both finished goods and run of mine stockpiles at Cataby; and higher receivables from customers at year end.
Cash flows from the MAC royalty are received quarterly in arrears and were 40% higher, predominantly due to higher iron ore sales prices.
Iluka invested $198 million on capital developments during 2019, predominantly at Cataby and the expansions at Sierra Rutile.
An interim dividend of 5 cents per share was paid in September and Iluka has announced a final fully franked dividend of 8 cents per share payable in April 2020.
For
per
sona
l use
onl
y

Iluka Resources Limited, Annual Report 2019 33
2019 JA/MW C/SW Idle SRLExpl & oth
Mineral sands MAC Corp Group
Mineral sands revenue 482.7 414.2 38.6 257.6 (0.0) 1,193.1 - - 1,193.1 AASB 15 freight revenue 19.8 7.4 3.3 8.1 - 38.6 - - 38.6 Expenses (159.3) (201.0) (37.9) (202.4) (37.6) (638.1) - (16.5) (654.6)Mining Area C - - - - - - 85.1 - 85.1 FX - - - - - - - 1.8 1.8 Corporate costs - - - - - - - (48.0) (48.0)EBITDA 343.2 220.6 4.0 63.3 (37.5) 593.6 85.1 (62.7) 616.0 Depn & Amort (28.9) (54.0) (0.6) (74.6) (4.7) (162.8) (0.4) - (163.2)Inventory movement - non-cash 14.3 6.2 (3.0) (2.0) - 15.5 - - 15.5 Rehabilitation for closed sites 1.6 (0.1) (4.7) - - (3.2) - - (3.2)Write-down of Sierra Rutile - - - (414.3) - (414.3) - - (414.3)EBIT 330.2 172.7 (4.3) (427.6) (42.2) 28.8 84.7 (62.7) 50.8 Net interest costs (0.3) (0.2) - (0.1) - (0.6) - (13.2) (13.8)Rehab unwind and other finance costs (13.1) (12.1) (10.5) (2.3) - (38.0) - - (38.0)Profit before tax 316.8 160.4 (14.8) (430.0) (42.2) (9.8) 84.7 (75.9) (1.0) Segment result 316.8 160.4 (14.8) (430.0) n/a (9.8) 84.7 n/a 117.1
Non-IFRS financial information
This document uses non-IFRS financial information including underlying mineral sands EBITDA, underlying Group EBITDA and Group EBIT which are used to measure both Group and operational performance. Non-IFRS measures are unaudited but derived from audited accounts. All currency shown in the Annual Report is expressed in Australian dollars, unless otherwise indicated.
2018 JA/MW C/SW Idle SRLExpl & oth
Mineral sands MAC Corp Group
Mineral sands revenue 568.6 297.2 184.9 205.7 (12.3) 1,244.1 - - 1,244.1AASB 15 freight revenue 26.2 4.9 12.0 7.0 - 50.3 - - 50.3Expenses (206.9) (138.9) (143.2) (182.5) (31.6) (703.1) - - (703.1)Mining Area C - - - - - - 55.6 - 55.6FX - - - - - - - 1.3 1.3Corporate costs - - - - - - - (48.1) (48.1)EBITDA 378.8 142.3 83.9 30.2 (43.9) 591.3 55.6 (46.8) 600.1Depn & Amort (25.3) (20.1) (3.4) (41.1) (3.3) (93.2) (0.4) - (93.6)Inventory movement - non-cash 2.0 (5.1) (22.2) (2.9) - (28.3) - - (28.3)Rehabilitation for closed sites 8.6 (1.4) (3.9) 1.3 - 4.6 - - 4.6EBIT 364.0 115.6 54.4 (12.5) (47.2) 474.4 55.2 (46.8) 482.8Net interest costs - - - - - - - (14.1) (14.1)Rehab unwind and other finance costs (5.1) (5.2) (4.4) (2.0) - (16.7) - - (16.7)Profit before tax 358.9 110.5 50.0 (14.5) (47.2) 457.7 55.2 (60.9) 452.0Segment result 358.9 110.5 50.0 (14.5) n/a 504.9 55.2 n/a 560.1
For
per
sona
l use
onl
y

Iluka Resources Limited, Annual Report 201934
FINANCIAL AND OPERATIONAL REVIEW PROJECTS
CATABY, WESTERN AUSTRALIA
Iluka completed and commissioned the $270 million Cataby development in early 2019, on schedule and on budget.
Cataby is a large, chloride ilmenite-rich deposit 150 kilometres north of Perth. The mine is a conventional mineral sands development, utilising dozer push and truck and excavator mining to feed two in-pit mining units. An onsite Wet High Intensity Magnetic Separation (WHIMS) plant separates the magnetic (ilmenite) and non-magnetic product streams (zircon and rutile). Ilmenite sourced from Cataby is transported to Capel for synthetic rutile production and the non-magnetic stream to Iluka’s Narngulu mineral separation plant at Geraldton for final processing of zircon and rutile.
AMBROSIA, SOUTH AUSTRALIA
Operations at Jacinth-Ambrosia in South Australia moved from the Jacinth deposit to the Ambrosia deposit in August. The planned mine move was expedited from 2022 to 2019 to provide capacity and flexibility to maintain zircon production at current levels over future years. Site works included road, earthworks, power and water infrastructure; and pipe and pumping equipment. The mining unit was relocated and production recommenced within three days of outage. The project was delivered ahead of schedule and under budget.
ENEABBA MINERAL SANDS RECOVERY, WESTERN AUSTRALIA
The Eneabba mineral sands recovery project involves the extraction, processing and sale of a strategic stockpile of historical monazite-rich material that is currently stored in a mining void at Eneabba, Western Australia.
The focus of Phase 1 is to monetise monazite concentrates contained in the Mineral Separation Plant By-Product Mineral Resource. This has required the development of a viable processing methodology and the selection of a channel to market, which satisfies product stewardship protocols. The execution budget for Phase 1 is less than $10 million.
An offtake agreement to underpin the project was finalised during the year, with construction and off-site fabrication activities commencing soon after. Approvals have been granted and the project is on track for commissioning in the first half of 2020.
Studies into Phase 2 of the project, which involves further processing, are well underway.
BALRANALD, NEW SOUTH WALES
Balranald and Nepean are two rutile-rich deposits in the northern Murray Basin, New South Wales. Work in 2019 focused on planning for a third trial (T3) to take place in 2020. This will determine whether an underground mining and backfilling technology developed by Iluka is economically viable in a continuous mining and processing environment.
ATACAMA, SOUTH AUSTRALIA
Atacama is a satellite deposit to Iluka’s existing operation at Jacinth-Ambrosia. Iluka undertook project work to evaluate the potential for this deposit to add material zircon production when required by utilising existing infrastructure. The pre-feasibility study commenced in late 2018 and progressed over 2019.F
or p
erso
nal u
se o
nly

Iluka Resources Limited, Annual Report 2019 35
LANTI AND GANGAMA, SIERRA LEONE
During 2019 Iluka completed projects doubling the capacity at both the Lanti and Gangama mining operations in Sierra Leone.
The Gangama project involved the addition of mining fleet and construction of a second concentrator, duplicating the design of existing operations. Commissioning of the Gangama concentrator began in May and was operating at design capacity by June.
At Lanti, a second mining unit was added and the floating concentrator from the decommissioned dredge operation was beached and refurbished. Construction and commissioning activities were completed during August.
Both projects were delivered on schedule and on budget.
SEMBEHUN, SIERRA LEONE
The Sembehun group of deposits are situated 20 to 30 kilometres north west of the existing Sierra Rutile operations. Sembehun is one of the largest and highest quality known rutile deposits in the world.
Detailed engineering and definitive estimates based on original project scope to achieve production capacity of 300 thousand tonnes per annum of rutile were completed in first half of 2019. These estimates were beyond that estimated in mid-2018. In response, the company determined the most prudent approach was to revisit and broaden the value optimisation studies to consider changes to the parameters that had been set at the time of acquisition, as well as mining technique and mine sequencing, with a view to determining a development option which was both fit for purpose and ensured an appropriate balance between risk and return.
Study work focused on a number of areas including identifying and evaluating infrastructure, logistics and mining methods.
WIMMERA, VICTORIA
The Wimmera project involves the mining and beneficiation of a fine grained heavy mineral sand ore body in the Victorian Murray Basin for the potential long-term supply of zircon and rare earths. Technical challenges relating to purity and recovery of the valuable mineral have, in the past, impeded development of this style of deposit. Iluka has undertaken technical development studies which have yielded pathways to address the challenges with recovery and purity.
Over the course of the year a number of key project milestones were achieved, including the successful production of a rare earth carbonate mixture and pilot plant optimisation of separation and refining processes. Product samples were provided to customers for the purposes of assessing quality, which resulted in changes to the process flow-sheet that will be tested in 2020. Work was also undertaken to understand the implications of recent hydrogeological modelling and geotechnical studies on the range of possible earth moving techniques.
The pre-feasibility study is now scheduled for completion in 2020.
SR1 RESTART, WESTERN AUSTRALIA
A scoping study commenced and was completed on the potential restart of Iluka’s synthetic rutile kiln 1 (SR1) at Capel, Western Australia. The kiln is adjacent to the currently operational SR2 kiln and has capacity to produce 110-120 thousand tonnes of synthetic rutile per annum.
Key long-lead items have been manufactured. Approval to commence the bulk of the scope of works for refurbishment of the kiln remained subject to the company securing ilmenite feed source and appropriate commercial arrangements.
PUTTALAM, SRI LANKA
The Puttalam Quarry (PQ) deposit is a large sulphate ilmenite deposit, located approximately 30 kilometres from the town of Puttalam in north western Sri Lanka. A pre-feasibility study on the deposit has been completed.
In April Iluka withdrew its project team from the country following the Colombo terrorist attacks. The company subsequently recommenced limited engagement activities with government on legal and investment terms for the development. As anticipated, little progress was made in the lead up to the November presidential election.
For
per
sona
l use
onl
y

Iluka Resources Limited, Annual Report 201936
FINANCIAL AND OPERATIONAL REVIEW
EXPLORATION
EXPLORATION AND GEOLOGY
Growing and improving the quality of Iluka’s Ore Reserves and Mineral Resources is important to the company’s ability to deliver sustainable value. Brownfield exploration is focused on extending the life of existing assets via value-adding extensions and discoveries. Greenfield exploration is focused on identifying regionally significant deposits capable of delivering significant longer-term growth. The assessment of exploration opportunities is managed through a stage-gate approach requiring specific technical and non-technical criteria to be satisfied before progressing to the next stage of assessment.
SIERRA LEONE
At Sierra Rutile, drilling was conducted for potential extensions near current mining areas and to improve confidence at the Sembehun group of deposits. Approximately 21,000m of drilling was completed in 2,359 holes. Updated geological modelling was carried out over a number of the deposits in response to the field exploration. In January 2019, Iluka announced the inaugural Pejebu Mineral Resource estimate of 0.22Mt of rutile, which is proximate to current mining areas. Following an assessment of the regional geological setting, four new exploration lease applications have been submitted and are currently being processed. If awarded, these leases are considered to have the potential to add standalone deposits and extensions to Sembehun.
AUSTRALIA
Iluka completed over 19,000m of drilling supporting key projects at Cataby, Western Australia; Ambrosia, South Australia; and the Wimmera project, Victoria.
At Atacama, 10,148m of drilling was completed to improve the confidence in mineralisation with high zircon content, aimed at supporting feasibility study mining options.
At Cataby, in excess of 5,000m of drilling was completed to support mining operations.
4,000m of drilling was completed in relation to the ongoing economic assessment of Wimmera project and associated regional prospects.
Atacama, South Australia
LEADERS IN MINERAL SAND EXPLORATION
For
per
sona
l use
onl
y

Iluka Resources Limited, Annual Report 2019 37
QUEBEC, CANADA
Iluka continued to explore for high-grade rutile bearing ilmenite bodies through its agreement with Canadian junior Societe d’Exploration Miniere Vior Inc. Four diamond drill holes targeting gravity anomalies identified during 2018 were completed, totalling 1,256m. No significant mineralisation was identified. The focus of the activity shifted to the Grand Duc region, with the remaining targets subject to detailed ground gravity surveys to refine the drill hole designs. Drilling of the remaining targets is scheduled to commence in late Q1 2020.
GENERATION AND EXTERNAL OPPORTUNITIES
Over 15,500m of drilling was completed on exploration projects in Australia and the United States, with a significant proportion of this completed in South Australia. Follow up drilling is planned on several targets as part of ongoing exploration activities aimed at providing a sustainable operational pipeline. Additionally, the Group continues to generate both greenfield and brownfield targets through the assessment of standalone, internally generated opportunities and third-party approaches. During 2019 Iluka applied for and sought access to over 2,600 square kilometres of new exploration leases for greenfield exploration activity.
Granted tenement position as at 31 December 2019
Region Approx. square kilometresEucla Basin, South Australia 10,427Murray Basin (NSW & Vic) 3,669Perth Basin (WA) 584Other - Australia 0Sierra Leone 559Sri Lanka 147Other - international 0Total 15,386
Tenement applications as at 31 December 2019
Region Approx. square kilometresEucla Basin, South Australia 0Murray Basin (NSW & Vic) 874Perth Basin (WA) 6Other - Australia (QLD) 1,791Sierra Leone 858Sri Lanka 0Other - international 0Total 3,529
Australian exploration
$4.3m
International exploration
$0.2m
US + Canada$3.1m
Operations and project support
$2.5m
Administration + other$0.9m
Exploration and geology expenditure 2019 - $11.0 Million
For
per
sona
l use
onl
y

Iluka Resources Limited, Annual Report 201938
SUSTAINABILITY APPROACH
Iluka aspires to achieve high levels of sustainability performance integrating economic, environmental and social considerations into business practice and ensuring safe and responsible conduct underpins everything we do. Iluka’s sustainability approach and performance is overseen by the Board and is integrated into all levels of the business. Sustainability is governed through a series of policies and management systems aligned to the company’s core values – to act with integrity, demonstrate respect, show courage, take accountability and collaborate.
Governance and integrity
We conduct our business by adhering to the highest standards of corporate governance whilst acting with integrity by being transparent and honouring our commitments.
Economic responsibility
We aim to create sustainable economic outcomes, which allow us to share economic benefits with our host communities and deliver sustainable value.
People
Iluka aims to attract and retain the best people while building and maintaining a diverse, inclusive and high-achieving workforce.
Health and safety
We strive to protect the health and safety of our people through identifying risk and taking appropriate action to avoid workplace fatalities and minimise injuries and illnesses.
Social performance
We respect human rights, engage meaningfully with stakeholders and look to make a positive difference to the communities where we operate whilst minimising and managing potential impacts.
Environment
We seek to manage our impact on the environment, use resources efficiently and leave positive rehabilitation and closure outcomes.
Health and safety performance
The health and safety of Iluka’s people is the foundation of our business, and a personal responsibility of all members of our workforce. Iluka continues to strive to avoid fatalities and life-changing injuries from occurring in our workplace and minimising injury and illness potential. Thirty people sustained recordable injures while working for Iluka in 2019; 1 of these was a lost time injury, 23 were medical treatment injuries and 6 were restricted work cases. The Group total recordable injury frequency rate decreased from 3.5 in December 2018 to 2.9 in December 2019. The Group lost time injury frequency rate reduced to 0.1 compared to 1.0 in 2018. The severity of injuries has reduced with the severity rate declining from 18.8 to 2.4. The number of serious incidents or near hits classified as having the potential for severe injury or fatality has increased to 76 from 47 in 2018. While this may in part be a reflection of improvements in incident classification and reporting implemented in 2019, it remains a key area of focus for continual safety improvement across the Iluka Group.
Iluka’s safety performance in Sierra Leone was outstanding with the Sierra Rutile operation exceeding one year without a lost time injury across its workforce and contractors.
Environmental and social performance
Iluka continued to improve our environmental performance with 13 recordable environmental incidents compared to 20 during the previous year; and successfully rehabilitated 686 hectares of disturbed area. An improvement in the number of social incidents also occurred during 2019 with a reduction from 14 level 3 and above incidents in 2018 to a total of 7 in 2019. No level 5 environmental or social incidents occurred during 2019.
THE HEALTH AND SAFETY OF ILUKA’S PEOPLE IS THE FOUNDATION OF OUR BUSINESS
SUSTAINABILITY
For
per
sona
l use
onl
y

Iluka Resources Limited, Annual Report 2019 39
Tutunup South native plant nursery, Western Australia
SUSTAINABILITY INITIATIVES
Iluka continued to make progress with a number of sustainability initiatives, including the development of a modern slavery work programme and the assessment of potential physical climate risks and opportunities.
Iluka is committed to managing its climate change risks and taking advantage of associated business opportunities. The company is committed to the Paris Agreement objectives and accepts the Intergovernmental Panel on Climate Change (IPCC) assessment of climate change science. Iluka is taking steps to implement the recommendations made by the Task Force on Climate-related Financial Disclosures (TCFD) over a three-year period. During 2019, this included the company assessing the potential physical climate risks and opportunities that may impact our operations. In 2020 Iluka will evaluate the transition risks which may impact the business.
The Board Charter was revised to stipulate the requirement for the Board to conduct an annual review of climate-related risks and approve climate-related disclosures. The Board’s duties also extend to measuring and reviewing Iluka’s performance against climate change and sustainability targets. Further discussion of Iluka’s progress on implementing the recommendations of the TCFD will be provided in the 2019 Sustainability Report, to be released in April 2020.
Iluka retained its position on the Australian DJSI and was included in the FTSE4Good Index in recognition of strong environmental, social and governance practices. These indices track the performance of over 3,500 leading companies worldwide, independently evaluating their long-term sustainability performance.
The company has continued its commitment to building capacity for the understanding and application of revegetation science across the mining industry, both in Australia and overseas. July 2019 marked the launch of the Iluka Chair in Vegetation Science and Biogeography, embedded within the Harry Butler Institute, Murdoch University.
Iluka participated in the resource and energy industries’ modern slavery collaborative group, developing an understanding and capability to support measures to comply with the implementation of Australian modern slavery legislation. The company plans to release its first Modern Slavery Statement in 2021.F
or p
erso
nal u
se o
nly

Iluka Resources Limited, Annual Report 201940
BUSINESS RISKS AND MITIGATIONS The identification and management of risk is fundamental to achieving Iluka’s objective to deliver sustainable value. The company is committed to managing risk in a proactive and effective manner. Iluka’s Risk Management Policy is supported by a risk management framework which is aligned to the International Standard for risk management, ISO 31000. This framework provides a whole of business approach to the management of risks and sets out the process for the identification, assessment, monitoring, review and reporting of risk to facilitate the achievement of our plans and objectives. The Board, through the Board Charter, delegates responsibility for identifying and managing risks and implementing effective controls to management. Management is required to report to the Board on those risks which could have a material impact on the company’s business. The Audit and Risk Committee assists the Board with regard to oversight of the company’s risk management practices. Through its risk management framework Iluka seeks to:
• apply a structured and systematic risk management process across the Group;
• embed a culture of risk awareness by integrating risk management into our business activities and processes;
• identify, assess and manage risks in a structured and systematic manner;
• enable prudent risk taking in line with business objectives and strategies;
• establish and monitor the effectiveness of controls in line with agreed risk tolerances;
• ensure material business risks are effectively identified, communicated and appropriately elevated throughout all levels of management and to the Board;
• implement appropriate insurance strategies;
• assess regularly the effectiveness of the risk management process and risk controls; and
• continue to fulfil governance requirements for risk management.
Iluka applies a structured and systematic approach to assess the consequence of risk in areas such as injury; illness; community; environment; compliance; financial; company objectives and reputation. Company risks, and how they are being managed, are reviewed and updated by the Executive regularly and are reported, along with the Executive’s assessment of the company’s risk profile, for approval by the Board twice yearly.
Set out below are the key risk areas that could have a material impact on the company. The nature and potential
impact of risks changes over time. The risks described below are not the only risks that Iluka faces and, whilst reasonable effort is made to identify and manage material risks, additional risks not currently known or detailed below may adversely affect future performance. Emerging risk is a standing Board agenda item. Risks identified through this process are incorporated into the Iluka corporate planning process.
HEALTH & SAFETY RISKS
Iluka faces risks relating to the health and safety of our workforce and it is our top priority to look after the wellbeing of our employees and contractors. Iluka works actively to protect the health and safety of our people by identifying and taking appropriate action aiming to eliminate workplace fatalities, and life-changing injuries and minimise injuries and illnesses through the delivery of effective training, capturing accurate safety statistics, conducting thorough incident investigations and sharing learnings.
SUSTAINING OPERATIONS RISKS
Maintaining a pipeline of Ore Reserves and projects in order to sustain operations is a key focus for Iluka. The success of exploration activity and project delivery is critical to sustain operational production profiles. Tailings dam management is an ongoing management and Board focus at Iluka across all of our mines. Iluka has dedicated geotechnical resources and draws on external tailings and dam management experts to continue to improve our designs and monitoring activities to reflect best practice. Annual reviews are conducted of the company’s resources and reserves, asset integrity, short and long term planning, geotechnical and hydrogeological modelling.
ATTRACTING AND RETAINING KEY PEOPLE RISKS
Attracting and retaining key personnel is a priority and Iluka has effective plans in place to develop and deliver ongoing training and leadership development combined with succession planning and talent management processes.
PROJECT DEVELOPMENT RISKS
Iluka regularly assesses its ability to enhance its production profile or extend the economic life of deposits through the development of new deposits within its portfolio. A failure to develop and operate projects in accordance with expectations could negatively impact results of operations and the company’s financial position. Risks to major
development projects include the ability to acquire and/or obtain appropriate access to property, regulatory approvals, supply chain risks, construction and commissioning risks. There are also technology risks associated with some projects; for example, the new unconventional mineral sands mining approach planned for the Balranald deposit, and in the Wimmera project in Victoria. A structured capital process and project delivery framework is utilised to facilitate successful project development to manage risks associated with bringing new projects into operation.
PRODUCT DEMAND AND PRICE RISKS
Iluka is subject to fluctuations in global economic conditions, customer demand and end-use markets. The demand for Iluka’s products may be sensitive to a wide range of factors most of which are outside of the company’s control such as changes in the global economy, adverse changes in pigment or ceramic markets, or technology changes that reduce the level of feedstock required (substitution or thrifting). The prices for products are also subject to these market conditions. The company’s approach to these risks is to adopt pricing strategies that promote sustainability (of demand and pricing) and where appropriate to seek offtake agreements that support project capital returns, and to adjust production and inventory levels in the context of market demand.
FINANCIAL RISKS
Iluka faces risks relating to the cost of and access to funds, movement in interest rates and foreign exchange rates (refer Note 20 in financial statements). Iluka maintains policies which define appropriate financial controls and governance which seek to ensure financial risks are fully recognised, managed and recorded in a manner consistent with:
• the financial risk appetite and delegations as set by Iluka’s Board;
• generally accepted industry practice and corporate governance standards; and
• shareholder expectations of a mineral sands producer.
Where Iluka has entered into long-term contracts with fixed or floor prices (i.e. hedged the commodity price), Iluka will consider the management of the risks related to movements in foreign exchange rates by entering into appropriate hedging arrangements. Any hedging is conducted in accordance with Iluka’s risk tolerances and policies including appropriate approvals.
For
per
sona
l use
onl
y

Iluka Resources Limited, Annual Report 2019 41
GROWTH RISKS
To deliver sustainable value, Iluka attempts to generate growth options through exploration, innovation, project development and appropriate external growth opportunities. Evaluating growth opportunities requires prudent risk taking as part of a disciplined process of project selection and evaluation to maximise the opportunity, achieve the desired outcomes, and manage the associated risks to the company. This includes applying the company’s established disciplines and systems to evaluate growth opportunities and assess their potential value and impact considering a range of modifying factors and assumptions.
GLOBAL ECONOMIC UNCERTAINTY RISK
Iluka operates in a context of global economic uncertainty. Contributing factors currently include subdued economic growth, trade tensions and the impact of COVID-19. The company maintains a strong business focus to detect and respond to changes in demand which inform changes to the operational settings of our assets.
GOVERNMENT AND REGULATORY RISK
Increasing international activities have increased Iluka’s exposure to country risks. New or evolving regulations and international standards are outside the company’s control and are often complex and difficult to predict. The potential development of international opportunities can be jeopardised by changes to fiscal or regulatory regimes, adverse changes to tax laws, difficulties in interpreting or complying with local laws, material differences in sustainability standards and practices, or changes to existing political, judicial or administrative policies and changing community expectations. Risks in the locations in which Iluka operates could include terrorism, civil unrest, judicial activism, community challenge or opposition, regulatory investigation, nationalisation, protectionism, renegotiation or nullification of existing contracts, leases, permits or other agreements, imposts, restrictions on repatriation of earnings or capital and changes in laws and policy, as well as other unforeseeable risks. If any of the company’s operations are affected by one or more of these risks, it could have a material adverse effect on its assets in those countries, as well as Iluka’s overall operating results, financial condition and prospects.
ANTI-BRIBERY AND CORRUPTION RISK
Iluka’s business activities and operations are located in jurisdictions with varying degrees of political and judicial stability, including some countries with a relatively
high inherent risk with regards to bribery and corruption. This exposes Iluka to the risk of unauthorised payments or offers of payments to or by employees, agents or distributors that could be in violation of applicable anti-corruption laws. Risks also include possible delays or disruptions resulting from a refusal to make so-called facilitation payments or any other form of benefit inconsistent with Iluka policy or applicable laws. Iluka has a clear Anti-bribery and Corruption Policy, and internal controls and procedures to protect against such risks, including training and compliance programmes for its employees, agents and distributors. However, there is no assurance that such controls, policies, procedures or programmes will protect Iluka from potentially improper or criminal acts. Violations of anti-corruption laws or regulations may result in criminal or civil sanctions and adverse publicity.
COMMUNITY/ SOCIAL EXPECTATIONS RISK
Iluka operates in different jurisdictions with varying community and social laws and expectations which are addressed through having dedicated internal resources to deal with these issues on a regional basis. Community expectations are continually evolving and can be best managed through the development of robust strategies, maintaining strong relationships and delivering on our commitments.
ENVIRONMENTAL RISK
Iluka is committed to leading practice in environmental management as outlined in the Iluka Health, Safety, Environment and Community Policy. Leading practice is based upon current community expectations, applicable legislation and regulatory standards, all of which change over time. With increasing government and public sensitivity to environmental sustainability, environmental regulation is becoming more stringent. Iluka could be subject to increasing environmental responsibility and liability, including laws and regulations dealing with air quality, water and noise pollution and other discharges of materials into the environment, plant and wildlife protection, the reclamation and restoration of certain of its properties, greenhouse gas emissions, storage, treatment and disposal of wastes and the effects of its business on the water table and groundwater quality. Sanctions for non-compliance with these laws and regulations may include administrative, civil and criminal penalties, revocation of permits, reputational issues, increased licence conditions and corrective action orders. Historic operations or disposal methods by the company or its predecessor companies, although materially compliant with regulatory requirements at the time, may be subject to increased
or new environmental standards which require additional remediation. The company monitors these risks as part of the ongoing remediation of its former operational sites.
BUSINESS INTERRUPTION RISKS
Circumstances may arise which preclude sites from operating including natural disaster, material disruption to our logistics chain, critical plant failure or industrial action. Iluka experienced illegal industrial action at the Sierra Rutile operation during late 2018. The Board and Executive have developed specific actions in response to the 2018 events which address the risks to the stability of Sierra Rutile’s operating environment.
The company undertakes regular reviews for mitigation of property and business continuity risks. Iluka also conducts planning and simulated scenarios to ensure rapid and effective response in the event of an emergency or crisis. Appropriate business plans, policies and training exercises provides support to mitigate Iluka’s risk. Iluka also maintains a prudent insurance programme that may offset a portion of the financial impact of a major business interruption event.
SUSTAINABILITY RISK
Iluka’s safety, health, environmental, people and community performance expectations are clearly articulated in its policies and are overseen by the Board. The annual Iluka Sustainability Report contains further information on the company’s operating conditions, as well as elements of the business strategy. This document (for the 2018 year), as well as other company information, is available on Iluka’s website www.iluka.com. Iluka plans to publish a Sustainability Report in respect of the 2019 year, in April 2020.
CLIMATE CHANGE RISK
Iluka is committed to managing its climate change risks and taking advantage of associated business opportunities. The company is committed to the Paris Agreement objectives and accepts the Intergovernmental Panel on Climate Change (IPCC) assessment of climate change science. Iluka is taking steps to implement the recommendations made by the Task Force on Climate related Financial Disclosures (TCFD) over a three-year period. During 2019, this included the company assessing the potential physical climate risks and opportunities that may impact its operations. In 2020 Iluka will evaluate the transition risks which may impact the business.
For
per
sona
l use
onl
y

Iluka Resources Limited, Annual Report 201942
Capel synthetic rutile kiln, Western Australia
For
per
sona
l use
onl
y

Iluka Resources Limited, Annual Report 2019 43
FINANCIAL REPORT
Results for announcement to the market 44
Directors’ report 45
Remuneration report 56
Auditor’s independence declaration 81
Financial statements 82
Consolidated statement of profit or loss and other comprehensive income 83
Consolidated balance sheet 84
Consolidated statement of changes in equity 85
Consolidated statement of cash flows 86
Notes to the consolidated financial statements 87
Directors’ declaration 136
Independent auditor’s report 137
SYNTHETIC RUTILE KILNS, CAPEL, WESTERN AUSTRALIA
Iluka’s Capel operation includes two synthetic rutile kilns: SR1 and SR2. The SR1 kiln is currently idle, with a project focused on the restarting of the kiln is underway.
For
per
sona
l use
onl
y

Iluka Resources Limited, Annual Report 201944
RESULTS FOR ANNOUNCEMENT TO THE MARKET ILUKA RESOURCES LIMITED
31 DECEMBER 2019
RESULTS FOR ANNOUNCEMENT TO THE MARKET
Provided below are the results for announcement to the market in accordance with Australian SecuritiesExchange (ASX) Listing Rule 4.2A and Appendix 4E for the consolidated entity Iluka Resources Limited and itscontrolled entities for the year ended 31 December 2019 (the 'financial year') compared with the year ended 31December 2018 (the 'comparative year').
All currencies shown in this report are Australian dollars unless otherwise indicated.
Revenue from ordinary activities Down 2.4% to $1,318.0mNet loss after tax for the period from ordinary activities Down to $299.7mNet loss after tax for the period attributable to equity holders of the parent Down to $279.9m
Dividends2019 final: 8 cents per ordinary share (100% franked), to be paid in April 20202019 interim: 5 cents per ordinary share (100% franked), paid in October 20192018 final: 19 cents per ordinary share (100% franked), paid in April 20192018 interim: 10 cents per ordinary share (100% franked), paid in September 2018
Key ratios 2019 2018
Basic (loss)/profit per share (cents) (71.0) 72.2Diluted (loss)/profit per share (cents) (71.0) 71.8Free cash flow per share (cents)¹ 33.0 72.1Return on Equity² (26.6) 31.8Net tangible assets per share ($) 1.63 2.12
¹Free cash flow is determined as cash flow before refinance costs, proceeds/repayment of borrowings and dividends paid in
the year.
²Calculated as Net Profit/(Loss) after Tax (NPAT) for the year as a percentage of average monthly shareholder's equity over the
year.
Commentary on the consolidated results and outlook are set out in the Operating and Financial Review section ofthe Directors' Report.
Dividend Reinvestment Plan (DRP)
The current Dividend Reinvestment Plan (DRP) was approved by the Board of Directors, effective for all dividendsfrom the 2017 final dividend onwards. Under the plan, eligible shareholders can reinvest either all or part of theirdividend payments into additional fully paid Iluka shares. The DRP remained active for the 2019 interim and finaldividends.
The Directors have determined that no discount will apply for the DRP in respect of the 2019 final dividend.Shares allocated to shareholders under the DRP for the 2019 final dividend will be allocated at an amount equalto the average of the daily volume weighted average market price of ordinary shares of the Company traded onthe ASX over the period of 10 trading days commencing on 11 March 2020. The last date for receipt of electionnotices for the DRP is 9 March 2020.
Independent auditor's report
The Consolidated Financial Statements upon which this Appendix 4E is based have been audited.
44
ILUKA RESOURCES LIMITED31 DECEMBER 2019
DIRECTORS' REPORT
The directors present their report on the Group consisting of Iluka Resources Limited (the 'Company') and theentities it controlled at the end of, or during, the year ended 31 December 2019.
The information appearing on pages 14 to 41 forms part of the Directors' Report for the financial year ended 31December 2019 and is to be read in conjunction with the following information:
DIRECTORS
The following individuals were directors of Iluka Resources Limited during the whole of the financial year and upto the date of the report, unless otherwise stated:
G MartinM BastosR ColeS Corlett (appointed 1 June 2019)X Liu (retired 16 April 2019)T O'LearyJ RanckL Saint (appointed 24 October 2019)J Seabrook
DIRECTORS' PROFILES
Name: Greg MartinQualifications: BEc, LLB, FAIM, MAICDAge: 60Role: Chairman and Non-executive DirectorAppointed: January 2013Independent: Yes
Current positions:• Chairman of the Board• Nominations and Governance Committee - Chairman• People and Performance Committee - Member
Relevant skills and experience:Mr Martin has 4 decades of experience in the energy, utility and infrastructure sectors, having spent 25 years withthe Australian Gas Light Company Ltd (AGL), including five years as CEO and Managing Director. After leavingAGL, Greg was CEO of the infrastructure division of Challenger Financial Services Group and, subsequently,Managing Director of Murchison Metals Ltd.
Other relevant directorships and offices (current and recent):• Sydney Desalination Plant Pty Ltd - Chairman (retired July 2019)• Western Power Corporation - Deputy Board Chair (appointed April 2015)• Spark Infrastructure - Non-executive Director (appointed January 2017)• Coronado Global Resources Inc. - Chairman (retired February 2019)• Prostar Investments (Australia) Ply Ltd - Chairman (retired December 2017)• Santos Limited - Non-executive Director (retired August 2017)
45
For the year ended 31 December 2019
For
per
sona
l use
onl
y

Iluka Resources Limited, Annual Report 2019 45
ILUKA RESOURCES LIMITED31 DECEMBER 2019
DIRECTORS' REPORT
The directors present their report on the Group consisting of Iluka Resources Limited (the 'Company') and theentities it controlled at the end of, or during, the year ended 31 December 2019.
The information appearing on pages 14 to 41 forms part of the Directors' Report for the financial year ended 31December 2019 and is to be read in conjunction with the following information:
DIRECTORS
The following individuals were directors of Iluka Resources Limited during the whole of the financial year and upto the date of the report, unless otherwise stated:
G MartinM BastosR ColeS Corlett (appointed 1 June 2019)X Liu (retired 16 April 2019)T O'LearyJ RanckL Saint (appointed 24 October 2019)J Seabrook
DIRECTORS' PROFILES
Name: Greg MartinQualifications: BEc, LLB, FAIM, MAICDAge: 60Role: Chairman and Non-executive DirectorAppointed: January 2013Independent: Yes
Current positions:• Chairman of the Board• Nominations and Governance Committee - Chairman• People and Performance Committee - Member
Relevant skills and experience:Mr Martin has 4 decades of experience in the energy, utility and infrastructure sectors, having spent 25 years withthe Australian Gas Light Company Ltd (AGL), including five years as CEO and Managing Director. After leavingAGL, Greg was CEO of the infrastructure division of Challenger Financial Services Group and, subsequently,Managing Director of Murchison Metals Ltd.
Other relevant directorships and offices (current and recent):• Sydney Desalination Plant Pty Ltd - Chairman (retired July 2019)• Western Power Corporation - Deputy Board Chair (appointed April 2015)• Spark Infrastructure - Non-executive Director (appointed January 2017)• Coronado Global Resources Inc. - Chairman (retired February 2019)• Prostar Investments (Australia) Ply Ltd - Chairman (retired December 2017)• Santos Limited - Non-executive Director (retired August 2017)
45
DIRECTOR’S REPORTFor the year ended 31 December 2019
For
per
sona
l use
onl
y

Iluka Resources Limited, Annual Report 201946
ILUKA RESOURCES LIMITED31 DECEMBER 2019
Name: Tom O'LearyQualifications: LLB, BJurisAge: 56Role: Managing DirectorAppointed: October 2016Independent: No
Relevant skills and experience:Mr O’Leary was previously Managing Director of Wesfarmers Chemicals, Energy & Fertilisers having beenappointed to the role in 2010. Tom joined Wesfarmers in 2000 in a Business Development role and was thenappointed to Managing Director, Wesfarmers Energy, in 2009. Prior to joining Wesfarmers, Tom worked inLondon for 10 years in finance law, investment banking and private equity. Tom holds a law degree from TheUniversity of Western Australia and has completed the Advanced Management Program at Harvard BusinessSchool.
Other relevant directorships and offices (current and recent):• Clontarf Foundation - Director (current)• Edith Cowan University Council - Member (retired June 2017)
Name: Marcelo BastosQualifications: BEng Mechanical (Hons, UFMG), MBA (FDC-MG), MAICDAge: 56Role: Non-executive DirectorAppointed: February 2014Independent: Yes
Current positions:• Audit and Risk Committee - Member• Nominations and Governance Committee - Member
Relevant skills and experience:Mr Bastos was formerly the Chief Operating Officer of the global resources company, MMG Limited, withresponsibility for operations on three continents. Marcelo has extensive experience in major projectsdevelopment and operation, and company management in the metals and mining industry (iron ore, gold, copper,nickel and coal sectors). Marcelo also served as the Chief Executive Officer of BHP Billiton Mitsubishi Alliance(BMA), President of Nickel West (BHP Billiton), President and Chief Operating Officer of Cerro Matoso and NickelAmericas (BHP Billiton) and had a 19 year career with Vale (CVRD) in senior management and operationalpositions, the last of those as Director of Non Ferrous Operations. Marcelo is a former Non-executive Director ofOZ Minerals Limited and Golding Contractors Pty Ltd, a former Member of the Western Australia Chamber ofMines and Energy and served as Vice President of the Queensland Resources Council.
Other relevant directorships and offices (current and recent):• OZ Minerals Limited - Non-executive Director (retired April 2019)• Aurizon Holdings Limited - Non-executive Director (appointed November 2017)• Golder Associates - Non-executive Director (appointed July 2017)• Anglo American PLC - Non-executive Director (appointed April 2019)
46
ILUKA RESOURCES LIMITED31 DECEMBER 2019
Name: Rob ColeQualifications: LLB (Hons), BScAge: 57Role: Non-executive DirectorAppointed: March 2018Independent: Yes
Current positions:• Nominations and Governance Committee - Member• People and Performance Committee - Member
Relevant skills and experience:Mr Cole is an experienced business leader and has worked for over 35 years in the energy and resourcesindustry. Rob has held a diverse range of senior positions in commercial, corporate, marketing and businessstrategy and planning functions. Rob was previously Managing Director of oil and gas production and explorationcompany, Beach Energy, where he led a whole of business review and successfully implemented a new strategicdirection for the company. Rob also spent over eight years at Woodside Petroleum Limited across a number ofsenior positions in commercial, corporate and legal areas, including Executive Director, Executive Vice President(Corporate and Commercial) and General Counsel. Prior to his time at Woodside, Rob was a Partner at the lawfirm King & Wood Mallesons.
Other relevant directorships and offices (current and recent):• Perenti Global Limited - Non-executive Director (appointed July 2018)• Synergy - Non-executive Chair (appointed November 2017)• GLX Group - Chair (appointed November 2016)• St Bartholomew's House Inc. - Non-executive Director (appointed November 2016)• Southern Ports Authority - Non-executive Chair (appointed July 2016)
Name: Susie CorlettQualifications: BSc (Geo, Hons), FAusIMM, GAICDAge: 49Role: Non-executive DirectorAppointed: June 2019Independent: Yes
Current positions:• Audit and Risk Committee - Member• Nominations and Governance Committee - Member
Relevant skills and experience:Ms Corlett is a professional non-executive director following an executive career spanning mine operations,investment banking and private equity. Susie is currently a non-executive director of Aurelia Metals Ltd, a Trusteeof the Australian Institute of Mining and Metallurgy (AusIMM) Education Endowment Fund and a director of TheFoundation for National Parks and Wildlife. A geologist, Susie's background is in mining operations andexploration for RGC Ltd and Goldfields Ltd. Susie was most recently an Investment Director for global miningprivate equity fund, following a career in mining project finance and credit risk management for Standard BankLimited, Deutsche Bank and Macquarie Bank.
Other relevant directorships and offices (current and recent):• Aurelia Metals Ltd - non-executive Director (appointed October 2018)• Australian Institute of Mining & Metallurgy (AusIMM) Education Endowment Fund - Trustee (appointed June2018)• Foundation for National Parks and Wildlife - Director and Treasurer (appointed June 2018)• The David Burgess Foundation - Director (retired June 2019)
47
DIRECTOR’S REPORTFor the year ended 31 December 2019
For
per
sona
l use
onl
y

Iluka Resources Limited, Annual Report 2019 47
ILUKA RESOURCES LIMITED31 DECEMBER 2019
Name: Rob ColeQualifications: LLB (Hons), BScAge: 57Role: Non-executive DirectorAppointed: March 2018Independent: Yes
Current positions:• Nominations and Governance Committee - Member• People and Performance Committee - Member
Relevant skills and experience:Mr Cole is an experienced business leader and has worked for over 35 years in the energy and resourcesindustry. Rob has held a diverse range of senior positions in commercial, corporate, marketing and businessstrategy and planning functions. Rob was previously Managing Director of oil and gas production and explorationcompany, Beach Energy, where he led a whole of business review and successfully implemented a new strategicdirection for the company. Rob also spent over eight years at Woodside Petroleum Limited across a number ofsenior positions in commercial, corporate and legal areas, including Executive Director, Executive Vice President(Corporate and Commercial) and General Counsel. Prior to his time at Woodside, Rob was a Partner at the lawfirm King & Wood Mallesons.
Other relevant directorships and offices (current and recent):• Perenti Global Limited - Non-executive Director (appointed July 2018)• Synergy - Non-executive Chair (appointed November 2017)• GLX Group - Chair (appointed November 2016)• St Bartholomew's House Inc. - Non-executive Director (appointed November 2016)• Southern Ports Authority - Non-executive Chair (appointed July 2016)
Name: Susie CorlettQualifications: BSc (Geo, Hons), FAusIMM, GAICDAge: 49Role: Non-executive DirectorAppointed: June 2019Independent: Yes
Current positions:• Audit and Risk Committee - Member• Nominations and Governance Committee - Member
Relevant skills and experience:Ms Corlett is a professional non-executive director following an executive career spanning mine operations,investment banking and private equity. Susie is currently a non-executive director of Aurelia Metals Ltd, a Trusteeof the Australian Institute of Mining and Metallurgy (AusIMM) Education Endowment Fund and a director of TheFoundation for National Parks and Wildlife. A geologist, Susie's background is in mining operations andexploration for RGC Ltd and Goldfields Ltd. Susie was most recently an Investment Director for global miningprivate equity fund, following a career in mining project finance and credit risk management for Standard BankLimited, Deutsche Bank and Macquarie Bank.
Other relevant directorships and offices (current and recent):• Aurelia Metals Ltd - non-executive Director (appointed October 2018)• Australian Institute of Mining & Metallurgy (AusIMM) Education Endowment Fund - Trustee (appointed June2018)• Foundation for National Parks and Wildlife - Director and Treasurer (appointed June 2018)• The David Burgess Foundation - Director (retired June 2019)
47
DIRECTOR’S REPORTFor the year ended 31 December 2019
For
per
sona
l use
onl
y

Iluka Resources Limited, Annual Report 201948
ILUKA RESOURCES LIMITED31 DECEMBER 2019
Name: James (Hutch) RanckQualifications: BSE (Econ), FAICDAge: 71Role: Non-executive DirectorAppointed: January 2013Independent: Yes
Current positions:• People and Performance Committee - Chairman• Nominations and Governance Committee - Member
Relevant skills and experience:Mr Ranck has held senior management positions with DuPont, both in Australia and internationally in finance,chemicals, pharmaceuticals and agriculture for over 30 years. Hutch also served as a director of DuPont’s HongKong based subsidiary, Titanium Technologies, for seven years. Hutch retired as Managing Director of DuPontAustralia and New Zealand and Group Managing Director of DuPont ASEAN in May 2010. In 2018 Hutch retiredas Chairman of Elders Ltd after 6 years as a director and 4 years as Chairman. Also in 2018 Hutch retired as adirector of CSIRO after an appointment of 7 years.
Other relevant directorships and offices (current and recent):• Elders Limited - Chairman (retired December 2018)• CSIRO - Non-executive Member of the Board (retired May 2018)• Autopak-Vetlab Group - Chairman (appointed April 2019)
Name: Lynne SaintQualifications: BCom, GradDip Ed Studies, FCPA, AICD, Cert Business AdministrationAge: 57Role: Non-executive DirectorAppointed: October 2019Independent: Yes
Current positions:• Audit and Risk Committee - Member• Nominations and Governance Committee - Member
Relevant skills and experience:Ms Saint joins the Board from Bechtel Group, where she acquired more than 19 years’ leadership experience inher executive career. Having most recently served as Chief Audit Executive, Lynne was formerly Chief FinancialOfficer of Bechtel’s Mining and Metals Global Business Unit. Lynne's expertise encompasses corporategovernance, enterprise risk and supply chain and project management. In 2003, Lynne was recognised as theTelstra Queensland Business Woman of the Year.
48
ILUKA RESOURCES LIMITED31 DECEMBER 2019
Name: Jenny SeabrookQualifications: BCom, FCA, FAICDAge: 62Role: Non-executive DirectorAppointed: May 2008Independent: Yes
Current positions:• Audit and Risk Committee - Chairman• Nominations and Governance Committee - Member
Relevant skills and experience:In Ms Seabrook's executive career, she has worked at senior levels in chartered accounting, capital markets andinvestment banking businesses. Jenny is a Senior Advisor to Gresham Partners Limited. Jenny was formerly amember of the Takeovers Panel (2000 to 2012), and her previous non-executive directorships include: ExportFinance and Insurance Corporation, Amcor Limited, Bank of Western Australia Limited, West AustralianNewspapers Holdings Limited, Australian Postal Corporation, AlintaGas, Western Power Corporation, WesternAustralian Treasury Corporation and MMG Limited.
Other relevant directorships and offices (current and recent):• BGC (Australia) Pty Ltd - Non-executive Director (appointed October 2018)• Esther Investments Pty Ltd - Non-executive Director (appointed October 2018)• MMG Limited - Non-executive Director (retired October 2019)• IRESS Limited - Non-executive Director (appointed August 2008)• Australian Rail Track Corporation - Non-executive Director (appointed December 2016)
49
DIRECTOR’S REPORTFor the year ended 31 December 2019
For
per
sona
l use
onl
y

Iluka Resources Limited, Annual Report 2019 49
ILUKA RESOURCES LIMITED31 DECEMBER 2019
Name: Jenny SeabrookQualifications: BCom, FCA, FAICDAge: 62Role: Non-executive DirectorAppointed: May 2008Independent: Yes
Current positions:• Audit and Risk Committee - Chairman• Nominations and Governance Committee - Member
Relevant skills and experience:In Ms Seabrook's executive career, she has worked at senior levels in chartered accounting, capital markets andinvestment banking businesses. Jenny is a Senior Advisor to Gresham Partners Limited. Jenny was formerly amember of the Takeovers Panel (2000 to 2012), and her previous non-executive directorships include: ExportFinance and Insurance Corporation, Amcor Limited, Bank of Western Australia Limited, West AustralianNewspapers Holdings Limited, Australian Postal Corporation, AlintaGas, Western Power Corporation, WesternAustralian Treasury Corporation and MMG Limited.
Other relevant directorships and offices (current and recent):• BGC (Australia) Pty Ltd - Non-executive Director (appointed October 2018)• Esther Investments Pty Ltd - Non-executive Director (appointed October 2018)• MMG Limited - Non-executive Director (retired October 2019)• IRESS Limited - Non-executive Director (appointed August 2008)• Australian Rail Track Corporation - Non-executive Director (appointed December 2016)
49
DIRECTOR’S REPORTFor the year ended 31 December 2019
For
per
sona
l use
onl
y

Iluka Resources Limited, Annual Report 201950
ILUKA RESOURCES LIMITED31 DECEMBER 2019
MEETINGS OF DIRECTORS
In 2019, the Board met on 11 occasions, of which 8 meetings were scheduled. In addition to these meetings, theBoard spent a day primarily focused on strategic planning. The Non-executive Directors periodically metindependent of management to discuss relevant issues. Directors’ attendance at Board and committee meetingsduring 2019 is detailed below:
(1) “Held” indicates the number of meetings held during the period of each director’s tenure. Where a director is not a member
but attended meetings during the period, only the number of meetings attended is shown.
(2) “Attended” indicates the number of meetings attended by each director.
(3) Mr Martin and Mr Ranck retired from the Audit and Risk Committee on 30 September 2019.
(4) Ms Corlett was appointed as a director and member of the Audit and Risk Committee on 1 June 2019.
(5) Dr Liu retired as a director on 16 April 2019.
(6) Ms Saint was appointed as a director and member of the Audit and Risk Committee on 24 October 2019.
(7) Ms Seabrook retired from the People and Performance Committee on 30 September 2019.
DIRECTORS SHAREHOLDING
Directors shareholding is set out in the Remuneration Report, section X.X.
EXECUTIVE TEAM PROFILES
Julian Andrews, BCom (Hons), PhD, CFA, GAICDHead of Strategy, Planning & Business Development
Mr Andrews joined Iluka as Head of Business Development in 2017 and assumed his current role in 2018. Prior tojoining Iluka, Mr Andrews held various roles at Wesfarmers, including General Manager, Business Developmentand Chief Financial Officer of Wesfarmers Chemicals, Energy & Fertilisers. He began his career in strategyconsulting with PricewaterhouseCoopers Canada and worked in project finance and corporate advisory in theUSA before relocating to Perth in 2004.
50
ILUKA RESOURCES LIMITED31 DECEMBER 2019
Christian Barbier, M.Sc. (Management), GAICDHead of Marketing
Mr Barbier joined Iluka in January 2016 and prior to appointment as Head of Marketing, was the General ManagerZircon Sales at Iluka. He has over 25 years of experience in leading resources and industrial multinationalcorporations, holding senior management positions in Europe, Australia and Asia. Prior to Iluka, Mr Barbier wasPresident Markets at Sibelco Asia, overseeing marketing, communication and sales. He arrived in Asia in 2004 asManaging Director of Alcan International SE Asia & Australia, after having worked with Alcan and Pechiney inEurope and Australia, in marketing, sales and finance positions.
Tim Bartholomew, B.Eng Mining (Hons), G.Dip. Energy & Resource Law, GAICDGeneral Manager, Strategic Development & Closure
Mr Bartholomew joined Iluka in 2007 and has held technical and project roles across the business in Operations,Major Projects and most recently in Rehabilitation and Closure. Mr Bartholomew has over 20 years of experiencein the mining industry within Australia, New Zealand and the USA predominantly in the coal and mineral sandssectors.
Matthew Blackwell, BEng (Mech), Grad Dip (Tech Mgt), MBA, MAICD, MIEAustHead of Major Projects, Engineering & Innovation
Mr Blackwell joined Iluka in 2004 as President of US Operations. He had responsibilities for Land Managementand as General Manager, USA, before being appointed Head of Marketing, Mineral Sands in February 2014. In2019, Mr Blackwell commenced in his current role of Head of Major Projects, Engineering & Innovation. Prior tojoining Iluka he was Executive Vice President of TSX listed Asia Pacific Resources, based in Thailand. MrBlackwell has a background in mining and processing with positions in project management, maintenance,production and business development.
Rob Hattingh, MSc (Geochem), GAICDChief Executive Officer, Sierra Rutile
Mr Hattingh joined Sierra Rutile in November 2016 from Iluka Resources where he held the position of GeneralManager Innovation, Sustainability and Technology. Mr Hattingh has more than 28 years’ experience in themineral sands industry in a number of roles. He was Principal Environmental Scientist at Richards Bay Minerals inSouth Africa and worked in senior roles at Exxaro Resources’ mineral sands business (now part of Tronox) wherehe was responsible for technical disciplines for a number of years. In 2008, Mr Hattingh joined Iluka Resources inPerth where he held management roles in the fields of hydrogeology, metallurgy, sustainability and businessdevelopment.
Sarah Hodgson, LLB, GAICDGeneral Manager, People & Sustainability
Ms Hodgson joined the People team at Iluka in 2013 and was appointed to her current role in March 2018. MsHodgson has 20 years’ HR experience specialising in remuneration and international mobility and started hercareer at PricewaterhouseCoopers in London before relocating to Australia with KPMG in 2002. Prior to joiningIluka Ms Hodgson held senior remuneration roles both as a consultant and in-house at Mercer, Westpac andKPMG.
Daniel McGrath, B.Sc (Math)General Manager, Cataby & Southwest
Mr McGrath joined Iluka in 1993 and has held technical and operations management roles throughout Iluka formany years. His most recent appointment was as Chief Metallurgist where he oversaw the technicaldevelopment and metallurgy functions. Prior to this Mr McGrath has held senior operational positions at Iluka’sWestern Australian, Eastern Australian, and USA operations while also having held metallurgy and processengineering roles in Australia, Indonesia and Sierra Leone.
51
DIRECTOR’S REPORTFor the year ended 31 December 2019
For
per
sona
l use
onl
y

Iluka Resources Limited, Annual Report 2019 51
ILUKA RESOURCES LIMITED31 DECEMBER 2019
Christian Barbier, M.Sc. (Management), GAICDHead of Marketing
Mr Barbier joined Iluka in January 2016 and prior to appointment as Head of Marketing, was the General ManagerZircon Sales at Iluka. He has over 25 years of experience in leading resources and industrial multinationalcorporations, holding senior management positions in Europe, Australia and Asia. Prior to Iluka, Mr Barbier wasPresident Markets at Sibelco Asia, overseeing marketing, communication and sales. He arrived in Asia in 2004 asManaging Director of Alcan International SE Asia & Australia, after having worked with Alcan and Pechiney inEurope and Australia, in marketing, sales and finance positions.
Tim Bartholomew, B.Eng Mining (Hons), G.Dip. Energy & Resource Law, GAICDGeneral Manager, Strategic Development & Closure
Mr Bartholomew joined Iluka in 2007 and has held technical and project roles across the business in Operations,Major Projects and most recently in Rehabilitation and Closure. Mr Bartholomew has over 20 years of experiencein the mining industry within Australia, New Zealand and the USA predominantly in the coal and mineral sandssectors.
Matthew Blackwell, BEng (Mech), Grad Dip (Tech Mgt), MBA, MAICD, MIEAustHead of Major Projects, Engineering & Innovation
Mr Blackwell joined Iluka in 2004 as President of US Operations. He had responsibilities for Land Managementand as General Manager, USA, before being appointed Head of Marketing, Mineral Sands in February 2014. In2019, Mr Blackwell commenced in his current role of Head of Major Projects, Engineering & Innovation. Prior tojoining Iluka he was Executive Vice President of TSX listed Asia Pacific Resources, based in Thailand. MrBlackwell has a background in mining and processing with positions in project management, maintenance,production and business development.
Rob Hattingh, MSc (Geochem), GAICDChief Executive Officer, Sierra Rutile
Mr Hattingh joined Sierra Rutile in November 2016 from Iluka Resources where he held the position of GeneralManager Innovation, Sustainability and Technology. Mr Hattingh has more than 28 years’ experience in themineral sands industry in a number of roles. He was Principal Environmental Scientist at Richards Bay Minerals inSouth Africa and worked in senior roles at Exxaro Resources’ mineral sands business (now part of Tronox) wherehe was responsible for technical disciplines for a number of years. In 2008, Mr Hattingh joined Iluka Resources inPerth where he held management roles in the fields of hydrogeology, metallurgy, sustainability and businessdevelopment.
Sarah Hodgson, LLB, GAICDGeneral Manager, People & Sustainability
Ms Hodgson joined the People team at Iluka in 2013 and was appointed to her current role in March 2018. MsHodgson has 20 years’ HR experience specialising in remuneration and international mobility and started hercareer at PricewaterhouseCoopers in London before relocating to Australia with KPMG in 2002. Prior to joiningIluka Ms Hodgson held senior remuneration roles both as a consultant and in-house at Mercer, Westpac andKPMG.
Daniel McGrath, B.Sc (Math)General Manager, Cataby & Southwest
Mr McGrath joined Iluka in 1993 and has held technical and operations management roles throughout Iluka formany years. His most recent appointment was as Chief Metallurgist where he oversaw the technicaldevelopment and metallurgy functions. Prior to this Mr McGrath has held senior operational positions at Iluka’sWestern Australian, Eastern Australian, and USA operations while also having held metallurgy and processengineering roles in Australia, Indonesia and Sierra Leone.
51
DIRECTOR’S REPORTFor the year ended 31 December 2019
For
per
sona
l use
onl
y

Iluka Resources Limited, Annual Report 201952
ILUKA RESOURCES LIMITED31 DECEMBER 2019
Melissa Roberts, BCom (Hons), MBAGeneral Manager, Investor Relations and Commercial Mineral Sands Operations
Ms Roberts joined Iluka in 2009 and has held a number of roles across the business in Commercial, BusinessDevelopment, IT and Investor Relations. Ms Roberts has 19 years’ experience within the health, chemicals and oil& gas industries. Prior to joining Iluka, Ms Roberts held various positions consulting to a range of oil and gasoperators in the UK, including, Maersk, BP and Talisman Energy. She also held positions in Australia withWesfarmers Chemicals, Energy & Fertilisers division, and with Mayne Health.
Adele Stratton, BA (Hons), FCA, GAICDChief Financial Officer
Ms Stratton joined Iluka in 2011 and was appointed Chief Financial Officer in August 2018. In the interveningperiod she held numerous senior roles across the company, most recently General Manager Finance, InvestorRelations and Corporate Affairs. She is a qualified chartered accountant with 18 years’ experience working inboth practice and public listed companies. Ms Stratton commenced her career with KPMG, spending 7 years inthe assurance practice both in the UK, where she qualified as a chartered accountant, and Australia. Prior tojoining Iluka, she worked in a number of finance roles at Rio Tinto Iron Ore in Perth.
Shane Tilka, BComGeneral Manager, Jacinth-Ambrosia & Midwest
Mr Tilka joined Iluka in November 2004 and has held operations management roles throughout Iluka. His mostrecent appointment was as Chief Operating Officer for Sierra Rutile Ltd. Prior to this Mr Tilka was GeneralManager for Iluka’s US Operations and has held other senior roles at Iluka’s Western Australian and SouthAustralian operations.
Sue Wilson, BJuris, LLB, FGIA, FCIS, FAICDGeneral Counsel and Company Secretary
Ms Wilson joined Iluka in December 2016. She was previously the Head of Company Secretariat at South32following the demerger from BHP Billiton. She was also General Counsel and Company Secretary and a memberof the executive team at Bankwest and HBOS Australia. Prior to joining Bankwest, Ms Wilson was a partner of lawfirm Parker & Parker (now part of Herbert Smith Freehills). She is currently the Pro Chancellor and a member ofthe Council at Curtin University. She is a former Chairman of the WA State Council of the Governance Institute ofAustralia and non-executive director of Western Power.
COMPANY SECRETARY
Ms Wilson is the Company Secretary of the Company. Ms Wilson was appointed to the position of CompanySecretary in December 2016. Refer to the previous section for Ms Wilson’s profile.
Mr Nigel Tinley BBus CPA GAICD FGIA FCIS also acts as Company Secretary for the Company. Mr Tinley wasappointed to the position of Joint Company Secretary in 2013 and prior to that he held senior positions in Financeand Sales and Marketing. Before joining Iluka in 2006, Mr Tinley held a range of accounting, financial andcommercial roles over his 18 years with BHP Limited both in Australia and internationally.
DIRECTORS AND OTHER OFFICERS’ REMUNERATION
Discussion of the Board’s policy for determining the nature and amount of remuneration for directors and seniorexecutives and the relationship between such policy and company performance are contained in theremuneration report on pages 56 to 80 of this Annual Report.
PRINCIPAL ACTIVITIES
The principal activities and operations of the Group during the financial year were the exploration, projectdevelopment, mining operations, processing and marketing of mineral sands and rehabilitation. The Companyalso has a royalty business, with its cornerstone asset being a royalty over iron ore sales revenue from BHP'sMining Area C province in Western Australia.
52
ILUKA RESOURCES LIMITED31 DECEMBER 2019
INDEMNIFICATION AND INSURANCE OF DIRECTORS AND OFFICERS
The Company indemnifies all directors of the Company named in this report and current and former executiveofficers of the Company and its controlled entities against all liabilities to persons (other than the Company orthe related body corporate) which arise out of the performance of their normal duties as director or executiveofficer unless the liability relates to conduct involving bad faith. The Company also has a policy to indemnify thedirectors and executive officers against all costs and expenses incurred in defending an action that falls withinthe scope of the indemnity and any resulting payments.
During the year the Company has paid a premium in respect of directors' and executive officers' insurance. Thecontract contains a prohibition on disclosure of the amount of the premium and the nature of the liabilities underthe policy.
INDEMNIFICATION OF AUDITORS
The Company's auditor is PricewaterhouseCoopers. The terms of engagement of Iluka's external auditor includesan indemnity in favour of the external auditor. This indemnity is in accordance with PricewaterhouseCoopers'standard Terms of Business and is conditional upon PricewaterhouseCoopers acting as external auditor. Ilukahas not otherwise indemnified or agreed to indemnify the external auditors of Iluka at any time during thefinancial year.
NON-AUDIT SERVICES
The Group has, from time to time, employed the external auditor, PricewaterhouseCoopers, on assignmentsadditional to their statutory audit duties where the auditor's expertise and experience with the Group areimportant.
Fees that were paid or payable during the year for non-audit services provided by the auditor of the parent entity,its network firms and non-related audit firms is set out in note 27 of the financial report.
The Board of directors has considered the position and, in accordance with advice received from the Audit andRisk Committee, is satisfied that the provision of the non-audit services is compatible with the general standardof independence for auditors imposed by the Corporations Act 2001 for the following reasons:
• all non-audit services were provided in accordance with Iluka’s Non-Audit Services Policy and ExternalAuditor Guidelines; and
• all non-audit services were subject to the corporate governance processes adopted by the company and havebeen reviewed by the Audit & Risk Committee to ensure that they do not affect the integrity or objectivity ofthe auditor.
A copy of the auditors' independence declaration as required under section 307C of the Corporations Act 2011 isset out on page 81.
ENVIRONMENTAL REGULATIONS
So far as the directors are aware, there have been no material breaches of the Group's licences and all miningand exploration activities have been undertaken in compliance with the relevant environmental regulations.
53
DIRECTOR’S REPORTFor the year ended 31 December 2019
For
per
sona
l use
onl
y

Iluka Resources Limited, Annual Report 2019 53
ILUKA RESOURCES LIMITED31 DECEMBER 2019
INDEMNIFICATION AND INSURANCE OF DIRECTORS AND OFFICERS
The Company indemnifies all directors of the Company named in this report and current and former executiveofficers of the Company and its controlled entities against all liabilities to persons (other than the Company orthe related body corporate) which arise out of the performance of their normal duties as director or executiveofficer unless the liability relates to conduct involving bad faith. The Company also has a policy to indemnify thedirectors and executive officers against all costs and expenses incurred in defending an action that falls withinthe scope of the indemnity and any resulting payments.
During the year the Company has paid a premium in respect of directors' and executive officers' insurance. Thecontract contains a prohibition on disclosure of the amount of the premium and the nature of the liabilities underthe policy.
INDEMNIFICATION OF AUDITORS
The Company's auditor is PricewaterhouseCoopers. The terms of engagement of Iluka's external auditor includesan indemnity in favour of the external auditor. This indemnity is in accordance with PricewaterhouseCoopers'standard Terms of Business and is conditional upon PricewaterhouseCoopers acting as external auditor. Ilukahas not otherwise indemnified or agreed to indemnify the external auditors of Iluka at any time during thefinancial year.
NON-AUDIT SERVICES
The Group has, from time to time, employed the external auditor, PricewaterhouseCoopers, on assignmentsadditional to their statutory audit duties where the auditor's expertise and experience with the Group areimportant.
Fees that were paid or payable during the year for non-audit services provided by the auditor of the parent entity,its network firms and non-related audit firms is set out in note 27 of the financial report.
The Board of directors has considered the position and, in accordance with advice received from the Audit andRisk Committee, is satisfied that the provision of the non-audit services is compatible with the general standardof independence for auditors imposed by the Corporations Act 2001 for the following reasons:
• all non-audit services were provided in accordance with Iluka’s Non-Audit Services Policy and ExternalAuditor Guidelines; and
• all non-audit services were subject to the corporate governance processes adopted by the company and havebeen reviewed by the Audit & Risk Committee to ensure that they do not affect the integrity or objectivity ofthe auditor.
A copy of the auditors' independence declaration as required under section 307C of the Corporations Act 2011 isset out on page 81.
ENVIRONMENTAL REGULATIONS
So far as the directors are aware, there have been no material breaches of the Group's licences and all miningand exploration activities have been undertaken in compliance with the relevant environmental regulations.
53
DIRECTOR’S REPORTFor the year ended 31 December 2019
For
per
sona
l use
onl
y
Iluka Resources Limited, Annual Report 201954
ILUKA RESOURCES LIMITED31 DECEMBER 2019
OTHER MATTERS
Shareholder class actionOn 24 March 2014, Iluka became aware that a litigation funder proposed to fund claims that current or formershareholders may have against the company in respect of continuous disclosure obligations in 2012. On 23 April2018, Iluka was served with an originating application and statement of claim in respect of a shareholder classaction for alleged breaches of continuous disclosure obligations, and misleading and deceptive conduct.
During the current reporting period, the presiding judge has made orders for the exchange of evidence in theproceedings and a trial date has been set for 1 March 2021. Iluka remains unable to reliably estimate thequantum of liability, if any, that the Group may incur in respect of this class action.
Sierra Leone environmental class actionOn 22 January 2019, class action proceedings were brought by a group of landowner representatives in SierraLeone, who allege they suffered a loss as a result of Sierra Rutile Limited’s mining operations. As at the reportingdate, it is not practicable for Iluka to estimate the quantum of liability, if any, that Iluka may incur in respect of thisclass action.
Other than the above matters, which are disclosed in note 24 of the financial statements, the directors are notaware of any matter or circumstance not otherwise dealt with in the Directors' Report that has or maysignificantly affect the operations of the entity, the results of its operations or the state of affairs of the entity insubsequent financial years.
MATTERS SUBSEQUENT TO THE END OF THE FINANCIAL YEAR
Following a comprehensive review of the Group’s corporate and capital structure during 2019, the Board andmanagement have decided to make preparations to put a proposal to shareholders regarding a demerger of theMining Area C (MAC) royalty business from the Group’s mineral sands business. This option has beendetermined as the best means to deliver value to shareholders by separating distinct businesses and creatingtwo stand-alone ASX-listed companies. As the proposal is still in development and will be subject to furtherBoard approval, as well as regulatory, and shareholder approvals, MAC is not classified as held-for-sale as at 31December 2019.
The directors are not aware of any other matter or circumstance not otherwise dealt with in the Financial Report(refer to note 25) or the Directors' Report that has or may significantly affect the operations of the entity, theresults of its operations or the state of affairs of the entity in subsequent financial years.
DIVIDEND
The directors have declared a fully franked final dividend of 8 cents per ordinary share payable on 2 April 2020.
LIKELY DEVELOPMENTS AND EXPECTED RESULTS
In the opinion of the directors, likely developments in and expected results of the operations of the Group havebeen disclosed in the Operating and Financial Review on pages 20 to 37. Disclosure of any further materialrelating to those matters could result in unreasonable prejudice to the interests of the Group.
CORPORATE GOVERNANCE STATEMENT
The Company’s Corporate Governance Statement for the year ended 31 December 2019 may be accessed fromthe Company’s website at http://www.iluka.com/about-iluka/governance.
54
ILUKA RESOURCES LIMITED31 DECEMBER 2019
ROUNDING OF AMOUNTS
The Company is of a kind referred to in "ASIC Corporations (Rounding in Financial/Directors' Reports) Instrument2016/191", issued by the Australian Securities and Investments Commission, relating to the 'rounding off' ofamounts in the Directors' Report and accompanying Financial Report. Amounts in the Directors' Report have beenrounded off in accordance with that Rounding Instrument to the nearest hundred thousand dollars, or in certaincases, to the nearest dollar.
This report is made in accordance with a resolution of the directors.
G MartinChairman
T O'LearyManaging Director
20 February 2020
55
DIRECTOR’S REPORTFor the year ended 31 December 2019
For
per
sona
l use
onl
y

Iluka Resources Limited, Annual Report 2019 55
ILUKA RESOURCES LIMITED31 DECEMBER 2019
ROUNDING OF AMOUNTS
The Company is of a kind referred to in "ASIC Corporations (Rounding in Financial/Directors' Reports) Instrument2016/191", issued by the Australian Securities and Investments Commission, relating to the 'rounding off' ofamounts in the Directors' Report and accompanying Financial Report. Amounts in the Directors' Report have beenrounded off in accordance with that Rounding Instrument to the nearest hundred thousand dollars, or in certaincases, to the nearest dollar.
This report is made in accordance with a resolution of the directors.
G MartinChairman
T O'LearyManaging Director
20 February 2020
55
DIRECTOR’S REPORTFor the year ended 31 December 2019
For
per
sona
l use
onl
y

Iluka Resources Limited, Annual Report 201956
Remuneration Report Message from the Chairman of the People & Performance Committee Dear Shareholders
On behalf of the Board I am pleased to present Iluka’s 2019 Remuneration Report.
As the Chairman and Managing Director have outlined in their Annual Report letters, 2019 saw accomplishment – exemplified in the delivery of five key projects across Iluka’s portfolio; and disappointment – being the write-down of the carrying value of Sierra Rutile. Overall, the company demonstrated resilience in the face of mixed market conditions and global economic uncertainties, delivering EBITDA of $616 million, the third best underlying financial performance in Iluka’s history.
Safety performance at Sierra Rutile saw significant improvement, with the operation achieving 12 months without a lost time injury. Across the Group total injuries reduced from 34 in 2018 to 30 in 2019. Environmental incidents also reduced compared to the previous year; and Iluka successfully rehabilitated 686 hectares of land disturbed by mining activities.
2019 Remuneration outcomes
As a Board we apply a disciplined approach to our assessment of performance and determination of remuneration outcomes.
Notwithstanding Iluka’s strong underlying performance, scorecard outcomes for 2019 reflect the impact of the write down of Sierra Rutile on the overall financial result and mixed results achieved across various performance measures.
The Board believes the outcomes set out in this report balance the accomplishments and disappointment the business faced, along with the progress achieved in maturing Iluka’s project development pipeline.
Key 2019 Highlights:
• MD Executive Incentive Plan outcome was 43% of maximum (64% of target)
• Executive Key Management Personnel outcomes were between 38% and 45% of maximum (58% and 67% of target)
Further detail is provided in Section 3 of this Report.
Response to the 2018 strike
Iluka received a ‘first strike’ on remuneration as a result of more than 25% of shareholders voting against the 2018 Remuneration Report.
Since the 2019 AGM, the Board has engaged with investors and proxy advisers to understand key concerns and determine an appropriate response.
Based on our consultation with stakeholders, the key concerns which led to the first strike related to the perceived short term nature of the Executive Incentive Plan (EIP), a preference towards longer vesting periods, the nature of the long term performance test and the weighting of financial metrics in the scorecard.
The Board and management value the insights received during the consultation process and we thank you for your willingness to provide feedback. We have spent considerable time reflecting on your concerns and reviewing our executive remuneration arrangements.
2020 executive incentives
The Board continues to believe the fundamental objectives of the EIP remain appropriate for Iluka’s business and the cyclical environment in which we operate. Through the EIP we aim to:
• facilitate a personally significant shareholding in Iluka, subject to performance, with the majority of the award being delivered in equity;
• align the performance of executives with the interests of shareholders over the long-term;
• set targets annually that are directly impacted by the performance of executives and feed into Iluka’s strategy to deliver sustainable value; and
• address the difficulty in setting appropriate performance measures over a long-term period.
In determining appropriate changes to the EIP for 2020, the Board considered shareholders’ feedback and determined an approach that continues to support our objectives and the achievement of our long term corporate plan.
The key changes for 2020 are:
• extending performance and vesting periods so the plan operates over a five year period;
• increasing the proportion of the award that is subject to a second performance test at the end of the (extended) five year period;
• reshaping our performance scorecard and increasing the weighting of financial performance to 50%;
• introducing scale vesting for the Relative Total Shareholder Return test on the performance rights portion of the award; and
• a modest increase to target EIP incentive opportunities following detailed benchmarking against Iluka’s peers.
Full details regarding the changes for 2020 are outlined in this report (see Section 2). We have also updated the disclosure and worked to improve the transparency in this Remuneration Report.
DIRECTOR’S REPORTFor the year ended 31 December 2019
For
per
sona
l use
onl
y

Iluka Resources Limited, Annual Report 2019 57
We have attempted to explain clearly how our executive remuneration approach reflects the needs of the business and to provide more clarity around our decision making.
On behalf of the Board, I invite you to review our Remuneration Report. We look forward to your ongoing feedback and discussion with our shareholders and their proxy advisers on our remuneration approach including the EIP structure and this report.
Thank you for your ongoing support
Yours sincerely
Hutch Ranck People and Performance Committee Chair
DIRECTOR’S REPORTFor the year ended 31 December 2019
For
per
sona
l use
onl
y

Iluka Resources Limited, Annual Report 201958
Contents
1. Who is covered by this report? 58
2. Iluka’s approach to executive remuneration 59
3. 2019 performance highlights and alignment to Executive KMP remuneration outcomes 63
4. Executive remuneration framework and details 70
5. Remuneration governance 73
6. Non-executive director fees 76
7. Statutory disclosures 77
1. Who is covered by this report?
This Report details the remuneration arrangements for Iluka’s key management personnel (KMP). KMP in 2019 comprised the Managing Director and other key executives (Executive KMP), as well as non-executive directors. Name Position Term as KMP
Managing Director
T O’Leary Managing Director and Chief Executive Officer Full year
Current Executive KMP
J Andrews Head of Strategy, Planning and Business Development Full year
C Barbier Head of Marketing Appointed 10 June 2019
M Blackwell Head of Major Projects, Engineering and Innovation Full year
A Stratton Chief Financial Officer Full year
Former Executive KMP
S Hay Head of Resource Development Ceased 7 June 20191
S Wickham Chief Operating Officer, Mineral Sands Ceased 7 June 20192
Current Non-Executive Directors
G Martin Chairman, Independent Non-Executive Director Full year
M Bastos Independent Non-Executive Director Full year
R Cole Independent Non-Executive Director Full year
S Corlett Independent Non-Executive Director Commenced 1 June 2019
J Ranck Independent Non-Executive Director Full year
L Saint Independent Non-Executive Director Commenced 24 October 2019
J Seabrook Independent Non-Executive Director Full year
Former Non-Executive Directors
X Liu Independent Non-Executive Director Ceased 16 April 2019
1 S Hay was a member of KMP until ceasing employment on 7 June 2019. 2 S Wickham ceased to be a member of KMP on 7 June 2019 when he transferred into the role of Operations Transition Advisor. Following the completion of transition projects, Mr Wickham plans to depart from Iluka (expected during 2020.)
DIRECTOR’S REPORTFor the year ended 31 December 2019
For
per
sona
l use
onl
y

Iluka Resources Limited, Annual Report 2019 59
2. Iluka’s approach to executive remuneration
Remuneration Principles Iluka’s Remuneration Principles provide the foundations for how remuneration is determined and paid. Remuneration arrangements are structured to achieve the following:
• Remuneration which is comparable and competitive within the relevant market; • Performance based with targets that reflect both prevailing business expectations and minimum time requirements; • Trailing exposure to company performance through deferred equity plans and minimum shareholding requirements; • An appropriate balance between fixed and ‘at risk’ remuneration; • Alignment to shareholder returns through performance objectives which support improved shareholder returns, and • Fair and transparent remuneration based on performance, compliance with legislated frameworks and clear and
concise disclosure.
Executive Remuneration Approach Our purpose to deliver sustainable value is key to Iluka’s approach to executive remuneration. Our Executive Incentive Plan (EIP) is designed to ensure remuneration received by Executive KMP is closely linked to the Company’s performance, aligning it with the returns generated for our shareholders over the long term.
The EIP design, guided by our Remuneration Principles, reflects that we operate in a cyclical industry with volatile results largely influenced by price and foreign exchange. The Board sets an annual scorecard to focus our Executive KMP on financial and strategic imperatives they can influence and are critical to Iluka’s long-term sustainability. In 2019 objectives for Executive KMP covered:
• Financial performance; • Optimisation of production; • Sustainability focusing on protecting our people, our environment and our communities; and • Key strategic projects to deliver sustainable value over the long-term and progression of longer term growth.
In setting objectives, the Board aims to ensure that targets are quantifiable and drive the right commercial and strategic outcomes for Iluka. Section 3 provides a detailed explanation of the specific targets set in 2019, how they were measured and our assessment of performance. The EIP award is delivered with a larger proportion of ‘at risk’ remuneration in equity, deferred over several years. This, coupled with requiring our Executive KMP to maintain a personally significant shareholding in Iluka, aligns Executive KMP with and exposed to the same financial consequences as shareholders.
Executive remuneration framework and approach for 2019
Attract and retain highly skilled and engaged executives to Iluka
Pay for performance and delivering shareholder value Reward for results and tie executives to long-term Company performance
Fixed remuneration Executive Incentive Plan (FY19)
Set after considering:
- Market median - Executive KMP’s
experience and performance
- Executive KMP’s role responsibilities
Annual scorecard of financial and strategic measures. Board assesses scorecard performance at the end of the year with resulting award split into three components: Cash – a small proportion providing modest reward for short-term results Restricted rights - vest in equally weighted tranches on the first, second and third anniversary of the grant Performance rights are subject to performance testing at two stages. Initial scorecard performance determines the amount of the grant. A further performance test relating to Iluka’s relative TSR is undertaken at the end of four years ensures the award will only vest if relative TSR meets or exceeds the median TSR performance of the selected peer group over the period. The award lapses if median performance is not met
Governance
Remuneration principles and structure are supported by policies and mechanisms including security trading and minimum shareholding policies and clawback arrangements
DIRECTOR’S REPORTFor the year ended 31 December 2019
For
per
sona
l use
onl
y

Iluka Resources Limited, Annual Report 201960
Response to 2018 Remuneration Report Strike We introduced the EIP in 2018, following significant consultation with investors and proxy advisers over the course of 2017 and incorporating the feedback received in the final design. The EIP was outlined in our 2017 Remuneration Report, which received a 99.4% ‘for’ vote. Following this initial support, we implemented the new structure in 2018 and shareholders expressed concern with some elements of the plan and we received a first strike on the 2018 Remuneration Report.
Your feedback identified several concerns including:
Structural elements of the EIP Communicating our approach and decision-making
• Timelines regarded as too short term focussed • Long-term performance test not considered to be
challenging enough and applying to an insufficient portion
• Weighting on financial performance considered too low
Clarity of communication not regarded as sufficient in relation to: • remuneration structures; • expectations of performance; and • the translation to remuneration outcomes
Having spent considerable time reflecting on the issues raised, we remain committed to the EIP as the right structure for our business and operating environment. We have addressed your feedback in relation to both structure and communication by making several changes, outlined below.
Structural elements of the EIP
Feedback
How it looked in 2019
How the EIP will look in 2020
EIP performance timelines regarded as being too short
Equity makes up the majority of the EIP award, with the remainder in cash. The quantum of cash and equity was awarded following testing of performance against a scorecard over a 12 month period.
Restricted rights (two thirds of the equity component) vested in three equal tranches, one, two- and three-years following award.
Performance rights (the remaining one third) vest three years after award subject to a further performance test (with a four-year relative TSR performance period).
We have extended vesting periods so over half the award vests over a four and five year period.
From 2020, there will be four equal tranches of restricted rights vesting up to four years after award.
For performance rights, an additional year has been added so vesting will occur four years after grant subject to a relative TSR performance over the preceding five years.
These extended timelines complement our existing requirement for executives to hold personally significant shareholdings.
The longer-term performance test is not regarded as challenging enough and applying to an insufficient portion of the EIP
Vesting of the performance rights was subject to a further performance test of achieving median performance relative TSR over a four year period.
One third of the EIP equity award was granted as performance rights subject to the further relative TSR testing.
Performance rights will continue to be subject to performance testing at two stages; once to determine the size of award granted; and a further time at vesting, to ensure that TSR performance above median has been sustained.
We have changed the vesting approach on the second test to a “sliding scale”– where 50% of the award will vest for median performance, increasing to 100% of the award vesting where TSR is at or above the 75th percentile relative to the selected comparator group.
We have also increased the portion of EIP equity awards delivered in performance rights from 33% to 40%.
DIRECTOR’S REPORTFor the year ended 31 December 2019
For
per
sona
l use
onl
y

Iluka Resources Limited, Annual Report 2019 61
Feedback
How it looked in 2019
How the EIP will look in 2020
The weighting on financial measures is considered to be too low
2019 scorecard performance measures (and weighting) covered the following areas:
Financial (35%), Production (15%), Sustainability (15%), Group strategy (10%) and Individual strategy (25%)
Two sets of financial metrics were used – one for the MD and CFO and one for other Executive KMP.
We have simplified our scorecard and increased the weighting of financial measures to 50% in addition to introducing one set of financial metrics for all participants.
Group and individual strategic priorities will no longer be measured separately.
Payment of dividend equivalents was questioned
Dividend equivalents were to be paid on restricted rights and performance rights at vesting – to the extent awards did not vest, dividend equivalents were not paid.
As equity awarded under the EIP is a result of performance, dividend equivalent payments will be paid on restricted rights and performance rights at the time of vesting only to the extent the rights vest.
2020 Executive Incentive Plan changes
After the changes, the EIP will operate as below.
Relative TSR (5 years) Grant subject to EIP scorecard performance
Performance rights Second performance test four years after award; five year relative TSR
performance assessed against a sliding scale test for vesting
2021 2022 2023
Annual Performance Period
Scorecard outcome determines value of
entire EIP award
Restricted rights 25%
vesting (1 year)
Restricted rights 25% vesting (2 years)
Cash payment (Executives only. MD will not receive a cash component)
2024 2025
Restricted rights 25% vesting (3 years)
Restricted rights 25% vesting (4 years)
DIRECTOR’S REPORTFor the year ended 31 December 2019
For
per
sona
l use
onl
y

Iluka Resources Limited, Annual Report 201962
Remuneration mix
A substantial portion of variable remuneration for Executive KMP is delivered in equity.
As disclosed in the 2018 Remuneration Report, from 2020 onwards, the Managing Director will not receive cash. All variable remuneration will be delivered as equity, creating further alignment with shareholders.
Managing Director Remuneration mix (maximum opportunity)
Communicating our approach and decision-making on remuneration
We also received your feedback on several other items relating to remuneration and have made further changes to address this.
Further developments
Quantum of EIP opportunity was questioned as being too high by some
Existing incentive opportunities have been reviewed against incentives paid elsewhere in the market through a thorough benchmarking exercise and in light of the changes being made to our EIP structure in 2020.
Modest increases to the maximum incentive opportunity will be made for 2020 awards. For the MD, the maximum incentive opportunity has increased by 10% to 210% of fixed remuneration and for other executive KMP, there has been an increase of 15% to 165% of fixed remuneration to maximum incentive opportunity from 2020.
Insufficient disclosure of performance targets
We have provided disclosure of our costs, production, sustainability and strategic targets. We have not disclosed certain financial and strategic targets due to commercial sensitivities. See section 3 for further details.
Communication was not sufficiently clear
We have reviewed our disclosure with the aim to provide a clearer and more transparent explanation of our remuneration arrangements and how and why remuneration decisions are made.
Approach to obtaining shareholder approval of the Managing Director EIP award
At the 2018 and 2019 Annual General Meetings (AGM), Iluka sought shareholder approval for the Managing Director’s 2018 and 2019 EIP equity grants, with the number of restricted rights and performance rights to be determined following the 12 month scorecard performance assessment using the equity allocation methodology disclosed. Shareholder approval was sought at that time to ensure support before implementing the EIP grants.
As shareholder approval for the Managing Director’s 2019 EIP equity grant has already been obtained, we will not seek shareholder approval again for the grant at the 2020 AGM. At the 2021 AGM we will seek shareholder approval for the Managing Director 2020 EIP grant. This approach reflects market practice and will allow shareholders the opportunity to approve the actual number of securities to be allocated based on the 2020 EIP outcome.
DIRECTOR’S REPORTFor the year ended 31 December 2019
For
per
sona
l use
onl
y

Iluka Resources Limited, Annual Report 2019 63
3. 2019 performance highlights and alignment to Executive KMP remuneration outcomes
Outlined below is the 2019 performance compared to the historic performance of the Group.
Historical Company Performance
2015
20164
20174
2018
20194
Net profit/(loss) after tax ($m) 53.5 (224.0) (171.6) 303.9 (299.7)
Underlying EBITDA (Group) ($m)1 293.4 150.5 360.5 600.1 616.0
EBITDA margin (%) 31.2 13.9 35.4 48.2 51.6
Free cash flow ($ million) 155.0 47.3 321.9 304.4 139.7
Earnings per share (cents) 12.8 (53.3) (41.0) 72.2 (71.0)
Return on equity (%) 3.8 (17.1) (20.1) 31.8 (26.6)
Closing share price ($)2 6.13 7.27 10.17 7.62 9.30
Dividends paid (cents)3 25 3 31 29 13
Franking credit level (%) 100 100 100 100 100
Average AUD : USD spot exchange rate (cents) 75.2 74.4 76.7 74.8 69.5
Revenue per tonne Z/R/SR sold ($/t) 1,136 999 1,079 1,426 1,654 1Underlying Group EBITDA excludes adjustments including impairments, write-downs and changes to rehabilitation provisions for closed sites. 2Starting share price on 1 January 2015 was $8.63. 3 Dividends paid in relation to the year 4 Reported earnings in 2016, 2017 and 2019 were impacted by impairments, write-downs and changes to rehabilitation provisions for closed sites.
DIRECTOR’S REPORTFor the year ended 31 December 2019
For
per
sona
l use
onl
y

Iluka Resources Limited, Annual Report 201964
2019 EIP Scorecard and outcomes achieved The EIP Scorecard is approved by the Board at the commencement of the financial year and focuses executives on business priorities that support the delivery of Iluka’s Corporate five year plan. Outlined below are the targets that were set in 2019, and the performance achieved.
Scorecard measure and target Weight Performance and outcome Threshold – Target - Stretch
FINANCIALS (MD and CFO) 35% Outcome – 27% of target; 18% of maximum
Group ROE (%)1 Target 2019 budget
15%
Below threshold
Return of (26.6%) was well below expectations primarily due to the $414 million write-down of Sierra Rutile and the associated write off of the deferred tax asset. The underlying Group earnings were strong, particularly given the mixed mineral sands market conditions, with the Group achieving an underlying EBITDA of $616 million, an improvement on last year’s strong performance of $600 million.
EPS (c/s )1 Target 2019 budget
10%
Below threshold
Earnings per share of (71c) compared to 72c in 2018 was below expectations, predominantly due to the write-down of Sierra Rutile.
All in Unit Cash Costs of Production $/t Target $1,016 / t
10% Towards target
All in cash costs of $1,032 /t are slightly higher than budget primarily due to lower production volumes at Sierra Rutile. Overall costs were lower than expectations.
1Disclosure of financial targets
No specific targets are disclosed in relation to the financial earnings measures due to commercial sensitivity. Iluka’s approach to the marketing and pricing of its products is key to achievement of the company’s objective to deliver sustainable value. We believe maintaining confidentiality on financial earnings targets, even on a retrospective basis, is critical to our competitive advantage and is in the best interests of shareholders.
PRODUCTION 15% Outcome – 56% of target; 33% of maximum
Australia Z/R/SR Kt Target 565
10%
Below target
Australian production of 556.7 Kt was 1 per cent below budget. Zircon production was intentionally constrained in the last quarter to reflect current market conditions. Synthetic Rutile production was above expectations due to an earlier restart after the planned major maintenance outage in the first quarter and consistently higher runtime for the remainder of the year.
Sierra Rutile Z/R Kt Target 155
5%
Below threshold
Overall production of 145.7kt was below threshold.
Production lower due to continued mining runtime and throughput issues (noting production performance improved in the fourth quarter).
DIRECTOR’S REPORTFor the year ended 31 December 2019
For
per
sona
l use
onl
y

Iluka Resources Limited, Annual Report 2019 65
Scorecard measure and target Weight Performance and outcome Threshold – Target - Stretch
SUSTAINABILITY 15% Outcome – 75% of target; 50% of maximum
Group Total Recordable Injury Frequency Rate Reduction to 2.6
5%
Below threshold While failing to achieve the targeted reduction, TRIFR has decreased by 0.6 to finish the year at 2.9. Total Recordable Injuries reduced from 34 in 2018 to 30 in 2019. Sierra Rutile operations achieved 12 months without a lost time injury in December 2019.
Group Closure Index (%) Reduction of rehabilitation liability through closure index target of 101%
5%
Above stretch (maximum) Above stretch performance was achieved as a result of the rehabilitation of 686 hectares during the year and the opening of new land maintained within budgeted mine plans
Group environmental level 3 and above incidents Target of 20 or less
2.5%
Above stretch (maximum) There was a significant reduction in number of serious environmental incidents (classified as Level 3 or above defined by Iluka’s incident classification matrix) with 13 incidents during the year, compared with 20 in 2018.
Closed actions by due date 95% of actions (excluding SRL) closed out by initial set due date
2.5%
Below threshold Disappointing result with 86% of actions (identified through incident investigations, planned workplace inspections and safety visits) closed out by initial due date on a rolling 12 month basis. The monthly close out of actions over the second half of the year has increased to targeted levels and remains a key focus for the business.
GROUP STRATEGY/ PROJECTS 10% Outcome – 100% of target; 66.7% of maximum
Measures focused on progressing 5 year strategic plan covering: • Delivery of key projects • Optimisation of marketing
approach • Improvement of social
performance in Sierra Leone
• Progression of growth projects
At target performance has been assessed overall reflecting: • Strong delivery of major projects to sustain production, provide additional flexibility
and increase capacity across our operations; • Resilient performance in a subdued zircon market; • Significant improvement in social performance at Sierra Rutile with a reduction in
social incidents rated level 3 and above from 14 in 2018 to 7 in 2019 • Progress made on a range of growth project feasibility studies during the year. Detailed outcomes for the individual strategic objectives set for the Managing Director are covered in the following pages, which provide more information relating to key projects.
GROUP SCORECARD MD and CFO2 Outcome – 52% of target; 34.7% of maximum
2 Financials, Production, Sustainability, Group Strategy The financial measures and outcomes for other Executive KMP were Return on Capital (below threshold performance outcome), Net Profit after tax (below threshold performance outcome) and All in Unit Cash Costs of Production as described above. These outcomes resulted in a Group EIP scorecard result of 52% of target for other Executive KMP.
DIRECTOR’S REPORTFor the year ended 31 December 2019
For
per
sona
l use
onl
y

Iluka Resources Limited, Annual Report 201966
Managing Director individual objectives Individual strategic objectives were set based on individual KMP accountabilities. Outlined below is assessment of the MD’s performance against the Individual Strategy scorecard measure and corresponding EIP outcome.
Scorecard measure (weight)
Performance
Threshold – Target - Stretch
INDIVIDUAL STRATEGY (25%)
Outcome – 100% of target; 67% of maximum
Deliver, execute and progress growth projects
The Group delivered five major projects in 2019, establishing a strong base to sustain operations.
• The Cataby mine was commissioned and will support synthetic rutile production for at least the next 8.5 years. The operation achieved near nameplate production in December.
• Ilmenite mined at Cataby is processed at synthetic rutile kiln 2, which underwent a major refresh prior to receiving this material. Delivered ahead of schedule and on budget, the refresh has facilitated an increase in processing capacity from ~205ktpa to 225ktpa.
• The mine move from Jacinth to Ambrosia was achieved ahead of schedule and significantly under budget (>25%). This development enables Iluka to sustain zircon production levels into the medium term. It also provides for enhanced flexibility in Iluka’s zircon product suite, which is important given challenging market conditions.
• Expansion projects to double current production levels at Lanti and Gangama in Sierra Leone have been delivered on schedule and budget. With these expansions commissioned, fourth quarter production at Sierra Rutile was up 32%, comprising 44 Kt of rutile, with the mineral separation plant operating at capacity.
The Sembehun development did not progress in line with plan and reverted to scoping stage. The feasibility study for the Eneabba Mineral Sands Recovery project was completed during the year, with several studies progressed including those on the Wimmera, Balranald and Atacama developments also progressed.
Optimise SRL financial and social performance
Overall financial performance at SRL was disappointing and, with its write-down, the Board has acknowledged that the acquisition has fallen well short of investment case expectations, both in terms of the operational outcomes that have been achievable in Sierra Leone and the potential cost to develop Sembehun.
2019 exhibited improvement in SRL’s performance with respect to safety and stakeholder relationships. This included 12 months without a lost time injury; improved production (following the completion of expansion projects); and commencement of a strategic partnership with the IFC – the private sector development arm of the World Bank and one of the country’s largest foreign donors and comparatively calm industrial relations notwithstanding the shutdown of the dredge.
Optimise price and volume settings
Iluka identified short term softness in the zircon market at mid-year and responded in the second half with enhanced loyalty rewards and an augmented product mix of standard grade zircon and zircon-in-concentrate. This enabled the achievement of sales volumes in line with revised guidance despite cautious purchasing behaviour, some thrifting in downstream industries and an attendant reduction in demand.
Deliver people strategy
Iluka implemented a new leadership framework in 2019, setting out expectations of leaders. This was complemented by the launch of new leadership development programmes.
The Executive was restructured to strengthen Iluka’s resource development and project execution capability. This saw three new members to the Executive (all internal appointees).
The SRL Executive was also strengthened through expatriate and local Sierra Leonean hires, building operational leadership capability.
Overall EIP scorecard outcome for the MD
Scorecard measure Weight Outcome Weighted Outcome
Threshold – Target - Stretch
Group Scorecard 75% 52% 39%
Individual Strategy MD Outcome 25% 100% 25%
OVERALL MD RESULT 64%
DIRECTOR’S REPORTFor the year ended 31 December 2019
For
per
sona
l use
onl
y

Iluka Resources Limited, Annual Report 2019 67
The Individual strategy scorecard area outcomes for other Executive KMP ranged from 74 – 111 % of target.
EIP awards from 2019 scorecard outcomes
The following table presents the outcomes of the EIP award attributed to the 2019 performance year. The face value of restricted rights and performance rights has been presented, as the fair value will not be determined until the grant is made in March 2020.
Executive KMP
Maximum EIP
opportunity % of target EIP earned
% of maximum EIP earned Cash
Restricted Rights
Performance Rights Total
T O’Leary $2,800,000 64 43 $179,031 $ 620,642 $393,869 $1,193,542
J Andrews $ 837,123 67 45 $ 74,671 $175,478 $123,208 $373,357 C Barbier1 $ 484,418 61 41 $39,399 $92,588 $65,009 $196,996
M Blackwell $ 982,500 64 43 $83,971 $197,332 $138,552 $419,855
A Stratton $ 925,274 67 44 $82,164 $193,086 $135,571 $410,821 S Wickham2 $ 475,948 58 38 $36,552 $85,899 $60,312 $182,763
1 Represents the period that C Barbier was a member of KMP. 2 Represents the period that S Wickham was a member of KMP.
Summary of realised remuneration paid to Executive KMP in 2019
This section uses non-IFRS information to explain the “realised remuneration” received by Executive KMP for 2019. This is a voluntary disclosure intended to demonstrate the link between the remuneration received by Executive KMP and the performance of Iluka over this same period.
Executive KMP
Fixed Remuneration Other
EIP LTIP/LDTR
Performance Rights
Total Cash Restricted
Rights
T O’Leary1 $1,400,000 $11,499 $179,031 $ 620,642 $433,185 $2,644,357
J Andrews $ 553,125 $11,499 $ 74,671 $175,478 - $814,773
C Barbier2 $ 312,569 $ 67,217 $39,399 $92,588 - $511,773 M Blackwell $ 655,000 $11,499 $83,971 $197,332 - $947,802
A Stratton $ 612,708 $11,499 $82,164 $193,086 - $899,457 Former Executives S Hay $ 262,500 $280,622 - - - $543,122 S Wickham3 $ 320,688 $ 34,010 $36,552 $85,899 - $477,149
1 The estimated value of the 2016 LTDR award for T O’Leary was calculated using the opening share price of $9.30 at 1 January 2020. The actual value will be calculated using the closing price at the date of vesting (1 March 2020). 2 Represents the period that C Barbier was a member of KMP. 3 Represents the period that S Wickham was a member of KMP.
“Fixed Remuneration (FR)” includes base salary and superannuation earned in 2019.
“Other” payments include non-monetary benefits received in 2019, including car parking, relocation benefits, and termination entitlements (such as payment in lieu of notice and accrued annual and long service leave).
“EIP” reflects the EIP cash amount and restricted right award receivable by executive KMP in respect of performance in 2019 (paid in March 2020 following the release of the annual results). It does not include the performance rights component of EIP outcomes, as they will only vest in future years if additional performance conditions are met.
“LTIP/LTDR” reflects previous awards of shares as a consequence of rights from prior years which reached the end of their performance period in 2019 and vested in 2020. It does not include awards which may vest in future years subject to performance conditions.
DIRECTOR’S REPORTFor the year ended 31 December 2019
For
per
sona
l use
onl
y

Iluka Resources Limited, Annual Report 201968
Legacy Arrangements
2016 LTIP outcome
The four-year 2016 LTIP award which commenced on 1 January 2016 completed its performance period at the end of 2019. Based on the results of testing, the Board determined that the award would not vest as outlined below.
Performance Measure/ Weighting Performance Target Actual Performance Vesting outcome
ROE (50%) 50% vesting at Threshold of 10% with full vesting at target of 14% over performance period
Did not reach threshold 0%
Relative TSR (50%)
(S&P/ASX 200 Materials Index)
50% vesting at 50th percentile and full vesting for 75th percentile 39th percentile 0%
Managing Director One-off equity grant
In October 2016, the Managing Director received an award of Long Term Deferred Rights (LTDR) in consideration of joining Iluka and thereby forfeiting benefits that he may have become entitled to at his previous employer.
The LTDR award comprised three tranches of share rights which vest subject to ROE and relative TSR performance targets over staggered performance periods.
Following the end of 2019, the third and final tranche of award was eligible to be tested against the ROE and relative TSR performance targets over the performance period 1 October 2016 to 31 December 2019.
Average ROE performance of the period was below the threshold of 10% (reported earnings in 2016, 2017 and 2019 were impacted by impairments, write-downs and increases to provisions) resulting in no vesting of the ROE component (half of tranche 3) and TSR of 53rd percentile of the S&P/ASX 200 Materials Index comparator group on a relative basis resulted in 57% vesting of the TSR component (the remaining half of Tranche 3).
Award Performance Period Award details Award outcome
Tranche 3 1 October 2016 to 31 December 2019 163,031 share rights granted
46,579 share rights to vest in March 2020
(116,452 share rights to lapse)
Prior year LTDR award outcome
Tranche 1 1 October 2016 to 31 December 2017 147,814 share rights granted
73,907 share rights vested (March 2018)
(75,907 share rights lapsed)
Tranche 2 1 October 2016 to 31 December 2018
194,084 share rights granted
69,288 shares rights vested (March 2019)
(124,796 shares rights lapsed)
DIRECTOR’S REPORTFor the year ended 31 December 2019
For
per
sona
l use
onl
y

Iluka Resources Limited, Annual Report 2019 69
Long-Term Deferred Rights (LTDR) award – Chief Operating Officer, Mineral Sands
The Board has historically retained flexibility to make one-off equity grants to key executives to recognise change of position and the impact of these will have on delivering Iluka’s future strategic plan. In recognition of the ongoing importance of integration and delivery of the investment case for the Sierra Rutile operations, an equity grant was awarded as LTDR to the Chief Operating Officer in 2019. Grants were also made during the 2017 and 2018 financial years.
Following the end of 2019, the 2017 and 2019 LTDR granted to the Chief Operating Officer, Mineral Sands were eligible to be tested. Performance was assessed against Sierra Rutile specific objectives covering financial, operational and safety performance, and effective succession plans for key senior roles.
Award
Details
Award
Details
2017 LTDR – Chief Operating Officer
Share rights vest at the end of three-year performance period
23% of rights to vest 1 March 2020
3,711 rights will vest
12,422 rights will lapse
2019 LTDR – Chief Operating Officer
Share rights vest at the end of one-year performance period
35% of rights to vest 1 March 2020
4,117 rights will vest
7,645 rights will lapse
The following ad-hoc rights award will lapse on Steve Wickham’s departure from Iluka in 2020:
Award
Details
Award
Details
2018 LTDR – Chief Operating Officer
Share rights vest at the end of three-year performance period
n/a Award will lapse in 2020
DIRECTOR’S REPORTFor the year ended 31 December 2019
For
per
sona
l use
onl
y

Iluka Resources Limited, Annual Report 201970
4. Executive remuneration framework and details
Our current executive remuneration framework is described below in further detail.
Executive remuneration framework and remuneration mix
Fixed remuneration 2019 remuneration mix Base salary, superannuation and salary sacrificed items. Iluka undertakes executive remuneration benchmarking to ensure fixed remuneration remains competitive within the relevant markets and against our chosen peer groups. These are based on market capitalisation, industry and matching of similar roles. Two peer groups have been used for benchmarking in 2019. The first consisting of twenty ASX 200 companies in the Materials, Energy, Utilities and Industrials Global Industry Classification and a second general industry peer group based on similar market capitalisation to Iluka. Iluka’s remuneration policy is to position remuneration at the market median.
A substantial proportion of variable remuneration is delivered in equity (restricted rights and performance rights) as the below remuneration mix illustrates, based on the
achievement of maximum performance.
Managing Director
Other Executive KMP
From 2020, EIP awards provided to the MD will be delivered solely in equity.
DIRECTOR’S REPORTFor the year ended 31 December 2019
For
per
sona
l use
onl
y

Iluka Resources Limited, Annual Report 2019 71
Fixed remuneration for 2019
In 2019 there was no increase to the Managing Director’s fixed remuneration, which has not changed since his appointment to the role in September 2016. A benchmarking exercise was undertaken during 2019 and some roles received an increase to their fixed remuneration where there was a change in scope and accountabilities.
• Julian Andrews’ accountabilities were increased seeing him take charge of the exploration, geology and mine planning functions.
• Adele Stratton’s accountabilities were increased seeing her take charge of the procurement function in addition to her CFO role.
Executive KMP
At 31 December 2018 Fixed Remuneration
At 31 December 2019 Fixed Remuneration
T O’Leary $1,400,000 $1,400,000
J Andrews $ 500,000 $ 580,000
C Barbier N/A $ 575,000
M Blackwell $ 655,000 $ 655,000
A Stratton $ 575,000 $ 630,000
S Wickham $ 733,000 $ 733,000 Key design features of 2019 EIP
2019 EIP opportunity
The EIP opportunity is expressed as a percentage of fixed remuneration (FR).
Target (% of FR)
Maximum (% of FR)
Managing Director 133% 200% Other Executive KMP 100% 150%
Change for 2020: The maximum incentive opportunity has been increased by an additional 10% of FR for the MD and by 15% of FR for Other Executive KMP based on the results of external remuneration benchmarking.
Performance Measures
The EIP scorecard includes Financial Performance, Production, Sustainability, Group and Individual Strategy measures. For all scorecard performance measures, a threshold, target and stretch goal was set at the start of 2019. Change for 2020: Increased weighting on financial measures. Scorecard has been simplified to include the same financial measures for all participants. Additionally, strategy will be measured on an individual basis only (2019 also measured strategic objectives set at the group level).
Vesting schedule EIP scorecard outcomes are calculated based on the following schedule, with a sliding scale operating between threshold and target, and between target and stretch:
Performance Level EIP Outcome (% Target)
Threshold Target Stretch (maximum)
50% 100% 150%
Performance assessment
EIP outcomes are determined following assessment of performance measures at the end of the 2019 performance period. Outcomes are subject to one up assessment and, for the Managing Director and Executive KMP, assessment by the Board.
Award type and timing
EIP awards are delivered in the form of cash, restricted rights and performance rights. The award will be granted for nil consideration in March 2020.
DIRECTOR’S REPORTFor the year ended 31 December 2019
For
per
sona
l use
onl
y

Iluka Resources Limited, Annual Report 201972
Allocation Methodology
The number of restricted rights and performance rights awarded to each participant are based on face value. This is determined by dividing the dollar value of the deferred component by the Volume Weighted Average Price (VWAP) of Iluka shares traded on the ASX over the five trading days following the release of the Company’s full year results.
Restriction and performance periods on EIP equity
EIP equity is subject to restriction or performance conditions:
Restricted Rights Performance Rights
Restricted rights will be granted following the end of the 2019 performance period and vest in equally weighted tranches on the first, second and third anniversary of the grant, subject to continued service.
Performance rights will be subject to an additional performance test prior to vesting.
TSR performance will be measured over a four-year period commencing on 1 January 2019 against the S&P / ASX 200 Resources Index (excluding companies primarily engaged in the oil and gas sector and non-mining activities).
Change for 2020: Restricted rights be released in four tranches over four years.
Change for 2020: TSR measured over five years and subject to sliding scale vesting. Proportion of equity award subject to the TSR test has been increased from 33% of the equity award to 40%.
Voting rights and dividends
No dividends are paid on restricted rights or performance rights prior to vesting. For any restricted rights or performance rights that ultimately vest, a cash payment equivalent to dividends paid by Iluka during the period between grant of the awards and vesting will be made. No cash payment will be made in respect of dividends on awards which do not vest.
DIRECTOR’S REPORTFor the year ended 31 December 2019
For
per
sona
l use
onl
y

Iluka Resources Limited, Annual Report 2019 73
5. Remuneration governance
We have established a governance framework around remuneration, to ensure that decisions around remuneration of our executive and employees reflects our remuneration principles.
Remuneration governance framework
External advice provided to PPC
External remuneration consultants were engaged by the PPC in 2019 to conduct benchmarking analysis in respect to executive and non-executive directors’ remuneration and provide advice in relation to incentive arrangements. The remuneration consultants did not provide a ‘Remuneration Recommendation’ as defined in the Corporations Act 2011 during the 2019 financial year.
EIP governance framework and mechanisms
The structure of the EIP provides different ways to allow the PPC and the Board the flexibility to ensure remuneration outcomes reflect the performance of Iluka and each individual.
Cessation of employment
In the event of an Executive KMP ceasing employment for:
Resignation or termination for cause: all restricted shares and unvested performance rights and restricted rights will be forfeited or lapse (as applicable).
Any other circumstances (including death, total and permanent disability, retirement or redundancy): unvested restricted shares, restricted rights, and performance rights will remain on foot and be subject to the original terms of the award.
Clawback & Malus
The Board has power to clawback incentives that have vested and that have been paid or awarded to participants in certain circumstances. For example, restricted shares, restricted rights and performance rights may be lapsed or forfeited (as appropriate) if a participant acts fraudulently or dishonestly or if there is a material misstatement or omission in the accounts of a Group company.
DIRECTOR’S REPORTFor the year ended 31 December 2019
For
per
sona
l use
onl
y

Iluka Resources Limited, Annual Report 201974
Change of control Board discretion to determine that vesting of some or all of the performance rights and restricted rights be accelerated and that dealing restrictions on restricted shares be released, in the event of a takeover or other transaction that in the Board’s opinion should be treated as a change of control event.
Board discretion Where the Board exercises its discretion under the EIP, the Board will consider all relevant factors at the time, which may include the participant's performance against the performance targets and the proportion of the performance or deferral period that has elapsed.
Minimum Shareholding Requirement
Executive KMP Executive KMP are required to acquire and hold a personally significant shareholding in Iluka to align executives to the interests of shareholders. Through shareholding, executives are exposed to the experience of shareholders (e.g., share price appreciation and dividends). Executive KMP are required to build the shareholding over a reasonable time frame taking into account vesting and taxation obligations.
As at 31 December 2019, two members of Executive KMP have met the minimum shareholding requirement.
MSR requirement % of FR (year-end)
Managing Director Other KMP
200% 100%
Non- executive directors
The Board is committed to non-executive directors acquiring and holding a shareholding within three years of appointment.
As at 31 December 2019 all Board members, with the exception of the Board members who joined the Board in 2019, have bought and now hold at least the minimum shareholding requirement.
MSR requirement No of shares
Chairman Other NEDs
30,000 12,000
See Section 7 for details of current KMP and NED shareholdings
Securities Trading Policy
Security Trading Policy
Directors and employees (including Executive KMP) are prohibited from trading in financial products issued or created over the Company’s securities created by third parties, and from trading in associated products and entering into transactions which operate to limit the economic risk of their security holdings in the Company.
The Security Trading Policy is available on the Company’s website at www.iluka.com.
DIRECTOR’S REPORTFor the year ended 31 December 2019
For
per
sona
l use
onl
y

Iluka Resources Limited, Annual Report 2019 75
Executive employment agreements
Iluka’s Executive KMP are employed on terms set out in individual employment agreements which do not contain a fixed term. Key terms of the agreements are as follows: Executive KMP
Termination Notice Period by Iluka or Employee1
T O'Leary Managing Director 6 months
J Andrews Head of Strategy, Planning and Business Development 3 months
C Barbier Head of Marketing 3 months
M Blackwell Head of Major Projects, Engineering and Innovation 3 months
A Stratton Chief Financial Officer 6 months
Former Executives S Hay Head of Resource Development 3 months
S Wickham Chief Operating Officer 3 months
1If the executive’s employment is terminated by Iluka (other than for gross misconduct or on other grounds for summary dismissal). The executive may be eligible to receive a termination payment to a maximum of 6 months TFR (inclusive of any payment made in lieu of notice). Iluka may terminate Executive KMP’s employment agreements without notice and without providing payment in lieu of notice where there is gross misconduct or other grounds for summary dismissal.
DIRECTOR’S REPORTFor the year ended 31 December 2019
For
per
sona
l use
onl
y

Iluka Resources Limited, Annual Report 201976
6. Non-executive director fees
Non-executive director fees are paid from an aggregate fee pool of $1.8 million as approved by shareholders at Iluka’s AGM in May 2015. The total amount paid to non-executive directors in 2019 (including superannuation) was $1, 221,204. There were no increases to the non-executive directors’ fees in 2019.
2019 Non-executive director fee policy
Board and Committee Fees Chair Member
2018 2019 2018 2019 Board $321,400 $321,400 $128,800 $128,800 Audit and Risk Committee $ 36,100 $36,100 $ 18,100 $18,100 People and Performance Committee $ 30,600 $30,600 $ 15,350 $15,350 Nomination Committee Nil Nil Nil Nil
The minimum required employer superannuation contribution up to the statutory maximum is paid into each non-executive director’s nominated eligible fund and is in addition to the above fees.
2019 Non-executive director Statutory Remuneration Disclosures
Outlined below are the fees paid to non-executive directors in 2019, prepared in accordance with the requirements of the Corporations Act 2001 (Cth) and the relevant Australian Accounting Standards.
Name Year Board, Committee
Fees Non-Monetary
Benefits Superannuation Statutory Total
Current Non-Executive Directors
G Martin 2019 $321,400 - $20,767 $342,167 2018 $319,833 - $20,290 $340,123 M Bastos 2019 $146,900 - $13,956 $160,856 2018 $146,167 - $13,886 $160,053 R Cole1 2019 $144,150 $13,694 $157,844 2018 $132,138 - $12,553 $144,691 S Corlett2 2019 $85,692 - $8,141 $93,833 J Ranck 2019 $172,975 - $16,433 $189,408 2018 $175,833 - $16,704 $192,537 L Saint3 2019 $27,677 - $2,629 $30,306 J Seabrook 2019 $176,412 - $16,759 $193,171 2018 $178,958 - $17,001 $195,959
Former Non-Executive Directors
X Liu4 2019 $48,967 - $4,652 $53,619 2018 $146,167 - $13,886 $160,053 Total fees 2019 $1,124,173 - $97,031 $1,221,204
2018 $1,099,096 - $94,320 $1,193,416
1R Cole was appointed 1 March 2018 2S Corlett was appointed 1 June 2019 3L Saint was appointed 24 October 2019 4X Liu resigned effective 16 April 2019
DIRECTOR’S REPORTFor the year ended 31 December 2019
For
per
sona
l use
onl
y

Iluka Resources Limited, Annual Report 2019 77
7. Statutory disclosures
Details of the remuneration of the KMP, prepared in accordance with the requirements of the Corporations Act 2001 (Cth) and the relevant Australian Accounting Standards, are set out in the following tables.
Executive KMP Statutory Remuneration Disclosures
Name Year FR1 EIP/STIP
Cash2
Non-Monetary Benefits3
Termination Benefits4 Other5
Share Based
Payments,
6 Statutory
Total Current Executives
T O’Leary
2019 $1,400,000 $179,031 $11,499 - - $1,590,547 $3,181,077 2018 $1,400,000 $323,569 $13,406 - - $1,065,428 $2,802,403
J Andrews 2019 $553,125 $74,671 $11,499 - - $204,440 $843,735 2018 $500,000 $115,350 $13,406 - - $157,036 $785,792 C Barbier7,8 2019 $312,569 $39,399 $ 67,217 - - $185,194 $604,379
M Blackwell
2019 $655,000 $83,971 $11,499 - - $465,032 $1,215,502 2018 $655,000 $153,729 $13,406 - - $373,502 $1,195,637
A Stratton 2019 $612,708 $82,164 $11,499 - - $258,970 $965,341 2018 $469,783 $132,653 $13,406 - - $205,213 $821,055 Former Executives S Hay9 2019 $262,500 - $4,932 $275,690 - $7,707 $550,829 2018 $600,000 $134,820 $13,406 - - $323,472 $1,071,698 S Wickham10 2019 $320,688 $36,552 $2,073 - $31,937 $657,805 $1,049,055 2018 $733,000 $155,909 $4,434 - $ 73,000 $481,435 $1,447,778 Total 2019 $4,116,590 $495,788 $120,218 $275,690 $31,937 $3,369,695 $8,409,918 201811 $4,357,783 $1,016,030 $71,464 - $73,000 $2,606,086 $8,124,363
1 Includes base salary and superannuation. 2 EIP cash payments and restricted share awards for 2019 will be made in March 2020. 3 Includes car parking, medical insurance and relocation costs for C Barbier. Includes car parking for other KMP. 4 Includes cessation entitlements relating to payment in lieu of notice and accrued leave entitlements. 5 Includes Sierra Leone travel allowance for S Wickham. 6 Amounts relate to the fair value of awards from prior years made under various incentive plans attributable to the year measured in accordance with AASB 2 Share Based Payments. 7 C Barbier became a KMP on 10 June 2019. Remuneration disclosures reflect the period he was a KMP 8 C Barbier relocated from Singapore to Australia effective 7 October 2019. The SGD denominated portion of his 2019 earnings have been converted from SGD to AUD for 2019 using the average monthly foreign exchange rate for the duration of his 2019 Singapore employment. 9 S Hay ceased to be a KMP on 7 June 2019. Remuneration disclosures for 2019 reflect the period he was a KMP. 10 S Wickham ceased to be a KMP on 7 June 2019. Remuneration disclosures reflect the period he was a KMP 11 The total for 2018 is different from the total in the 2018 Annual Report as those figures included D Warden, who is no longer an employee of Iluka
DIRECTOR’S REPORTFor the year ended 31 December 2019
For
per
sona
l use
onl
y

Iluka Resources Limited, Annual Report 201978
KMP Share–based Compensation
EIP and STIP restricted shares and restricted share rights
2016 STIP1 2017 STIP1 2018 EIP1 2019 EIP2 % of maximum opportunity awarded 3
Name (restricted shares)
(restricted shares)
(restricted shares)
(restricted rights)
2016 2017 2018 2019
T O’Leary - 36,273 119,991 64,132 - 61 77 43
J Andrews - - 28,998 18,868 - - 77 45
C Barbier4 - - - 9,955 - - - 41
M Blackwell 16,177 16,635 38,646 21,218 35 60 78 43
A Stratton - - 33,348 20,761 - - 77 44
Former Executives
S Hay5 13,208 14,215 33,894 - 39 56 75 -
S Wickham6 18,391 17,803 39,195 21,337 38 57 71 38 1 The restricted share fair value is determined as the volume weighted average price of ordinary shares over the five trading days following the release of the Company’s annual results. Restricted shares are awarded in March of the following year (e.g. 2018 EIP awards were made in March 2019). 2 Represents the estimated number of restricted rights to be awarded under the 2019 EIP calculated using the closing share price of $9.30 at 1 January 2020. 3 The percentage achieved of the EIP or STIP maximum incentive opportunity awarded for the financial year 4 C Barbier became a KMP on 10 June 2019. Disclosures reflect the period he was a KMP. 5 S Hay ceased to be a KMP on 7 June 2019. Disclosures for 2019 reflect the period he was a KMP 6 S Wickham ceased to be a KMP on 7 June 2019. Disclosures for 2019 reflect the full year
Performance Rights
Number of share rights Value of share rights
Name
Balance at 1 January 2019/KMP start date1
Granted during 20192
Vested / exercised
into shares in 2019
Lapsed during 20193
Balance at 31 December 2019/ KMP end date4
Granted in 2019
$
Value of rights vested /
exercised into shares in 2019
$5
T O’Leary 856,983 76,148 (69,288) (124,796) 739,047 711,852 630,867
J Andrews - 20,360 - - 20,360 190,328 -
C Barbier 46,463 - - - 46,463 - -
M Blackwell 192,378 27,134 (16,840) (50,518) 152,154 253,652 156,444
A Stratton 24,006 23,414 (1,754) (5,260) 40,406 218,877 16,053
S Hay 147,836 23,796 (11,877) (159,755) - - 109,159
S Wickham 223,746 39,281 (16,583) (49,747) 196,697 367,200 149,910 1 Balance at date commenced as KMP for C Barbier. 2 Share rights granted in respect of the 2018 EIP, and 2018 and 2019 LTDR awards for the Chief Operating Officer, which form part of share based payments for 2018 to 2021 inclusive. 3 Share rights which lapsed during 2019 relate to the 2016 LTIP award and MD LTDR (Tranche 2). Share rights were forfeited upon the departure of S Hay. 4 Balance at KMP end date for S Wickham. 5 Value at point of vest.
DIRECTOR’S REPORTFor the year ended 31 December 2019
For
per
sona
l use
onl
y

Iluka Resources Limited, Annual Report 2019 79
Fair Value
The fair value of each restricted share or share right and the vesting year for each incentive plan is set out below.
The maximum value of restricted shares and/or share rights yet to vest is not able to be determined as it is dependent on satisfaction of service and performance conditions and Iluka’s future share price. The minimum value of unvested restricted shares and/or share rights is nil.
Fair value of equity grants
Incentive Plan Grant Date
Fair Value per Share or Right at
Grant Date1 $
Vesting Year Expiry year2
2016 LTIP Tranche 2 May 2016 5.07 2020 2026
2016 LTDR3 October 2016 4.68 2020 2026
2016 LTIP (MD grant) October 2016 4.57 2021 2026
2017 LTIP March 2017 6.55 2021 2027
2017 STIP4 March 2018 10.55 2020 2019,2020
2017 LTDR5 March 2017 6.82 2021 2027
2018 LTDR5 March 2018 10.55 2021 2028
2019 LTDR5 March 2019 9.35 2020 2029
2018 EIP6 March 2019 9.35 2020, 2021, 2022 2020,2021,2022
2018 STIP6 March 2019 9.35 2020, 2021 2020,2021
2019 EIP7 March 2020 9.30 2021, 2022, 2023 2021,2022,2023
2019 STIP7 March 2020 9.30 2021, 2022 2021,2022
1 The fair value is calculated in accordance with the measurement criteria of Accounting Standard AASB 2 Share Based Payments. 2 Rights granted under the LTIP and LTDR are not automatically exercised and must be exercised by the Executive KMP before the expiry date. Rights that are not exercised by the expiry date are automatically exercised by this date. No amounts are payable on exercise of the rights. 3 2016 LTDRs awarded to the Managing Director are tested at the end of 2017, 2018 and 2019. 4 Awards under these plans are restricted shares; all other plans grant share rights. 5 Represents the face value of the LTDR award for the Chief Operating Officer being the VWAP of Iluka shares traded over the five trading days following the release of the Company’s 2017, 2018 and 2019 annual results, respectively. 6 Represents the estimated fair value of restricted shares and performance rights to be awarded under the 2018 EIP/STIP for which the performance period concluded on 31 December 2018 calculated using VWAP of ordinary shares over the five trading days following the release of the Company’s 2018 annual results. 7 Represents the estimated fair value of restricted rights and performance rights to be awarded under the 2019 EIP/STIP for which the performance period concluded on 31 December 2019 calculated using the closing share price of $9.30 at 1 January 2020. The actual value will be calculated as the VWAP of ordinary shares over the five trading days following the release of the Company’s 2019 annual results.
DIRECTOR’S REPORTFor the year ended 31 December 2019
For
per
sona
l use
onl
y

Iluka Resources Limited, Annual Report 201980
Shareholdings of executive KMP and their related parties
Number of shares
Name
Balance held at
1 January 2019/ KMP
start date1,2
Vesting/exercise of share rights
pursuant to LTDR and LTIP
Awarded as Restricted Shares
pursuant to EIP
Other changes3
Balance held at 31 December
2019/KMP end date
Minimum shareholding
met? 6
T O’Leary 110,180 69,288 119,991 - 299,459 Yes
J Andrews 4,740 - 28,998 - 33,738 No
C Barbier4 31,377 - - - 31,377 No
M Blackwell 63,555 16,840 38,646 (36,764) 82,277 Yes
A Stratton 13,923 1,754 33,348 - 49,025 No
S Hay5 66,669 11,877 33,894 (112,440) - N/A
S Wickham6 69,878 16,583 39,195 (44,851) 80,805 N/A
1 S Wickham ceased to be a member of KMP on 7 June 2019. The closing balance reflects the period he was a KMP. 2 Includes shares held directly or through a nominee or agent (e.g. family trust). 3 Other changes may include changes due to personal trades and forfeited shares. 4 C Barbier became a member of KMP on 10 June 2019. The opening balance reflects the period he was a KMP. 5 S Hay ceased to be a member of KMP on 7 June 2019. The closing balance reflects this date. 6 As at 31 December with share price of $9.30
Shareholdings of Non-executive directors and their related parties
Number of shares1
Name Balance held at 1 January 2019 Net movement Balance held at
31 December 2019 Minimum shareholding
met? G Martin2 30,000 - 30,000 Yes
M Bastos2 13,985 394 14,379 Yes
R Cole2, 4,000 8,000 12,000 Yes
S Corlett - 5,588 5,588 No
J Ranck 12,412 350 12,762 Yes
L Saint3 - - - No
J Seabrook2 19,977 563 20,540 Yes
Former Non-Executive Directors
X Liu2 12,000 - 12,000 N/A
1 Non-executive directors do not receive share based compensation and movements in their shareholdings reflect on-market trades. 2 Includes shares held indirectly through a nominee or agent (e.g. family trust). 3 L Saint was appointed a non-executive director on 24 October 2019. Remuneration disclosures for 2019 reflect the period she was a non-executive director. On-market Share Purchases
The total number of Iluka shares acquired on-market to satisfy employee incentive schemes in 2019 was 856,601 at an average price of $8.59 per share.
Transactions with Key Management Personnel
During the financial year there were no product or services purchases by KMP from the Group (2018: nil) and there are no amounts payable at 31 December 2019 (2018: nil).
There have been no loans to KMP during the financial year (2018: nil).
DIRECTOR’S REPORT
PricewaterhouseCoopers, ABN 52 780 433 757 Brookfield Place, 125 St Georges Terrace, PERTH WA 6000, GPO Box D198, PERTH WA 6840 T: +61 8 9238 3000, F: +61 8 9238 3999, www.pwc.com.au
Liability limited by a scheme approved under Professional Standards Legislation.
Auditor’s Independence Declaration As lead auditor for the audit of Iluka Resources Limited for the year ended 31 December 2019, I declare that to the best of my knowledge and belief, there have been:
(a) no contraventions of the auditor independence requirements of the Corporations Act 2001 inrelation to the audit, and
(b) no contraventions of any applicable code of professional conduct in relation to the audit.
This declaration is in respect of Iluka Resources Limited and the entities it controlled during the period.
Justin Carroll Partner PricewaterhouseCoopers
Perth 20 February 2020
For the year ended 31 December 2019
For
per
sona
l use
onl
y

Iluka Resources Limited, Annual Report 2019 81
AUDITOR’S INDEPENDENCE DECLARATION
PricewaterhouseCoopers, ABN 52 780 433 757 Brookfield Place, 125 St Georges Terrace, PERTH WA 6000, GPO Box D198, PERTH WA 6840 T: +61 8 9238 3000, F: +61 8 9238 3999, www.pwc.com.au
Liability limited by a scheme approved under Professional Standards Legislation.
Auditor’s Independence Declaration As lead auditor for the audit of Iluka Resources Limited for the year ended 31 December 2019, I declare that to the best of my knowledge and belief, there have been:
(a) no contraventions of the auditor independence requirements of the Corporations Act 2001 inrelation to the audit, and
(b) no contraventions of any applicable code of professional conduct in relation to the audit.
This declaration is in respect of Iluka Resources Limited and the entities it controlled during the period.
Justin Carroll Partner PricewaterhouseCoopers
Perth 20 February 2020
For the year ended 31 December 2019
For
per
sona
l use
onl
y
Iluka Resources Limited, Annual Report 201982
ILUKA RESOURCES LIMITED ABN 34 008 675 018
FINANCIAL REPORT - 31 DECEMBER 2019
CONTENTS PageFinancial statements
Consolidated statement of profit or loss and other comprehensive income 83Consolidated balance sheet 84Consolidated statement of changes in equity 85Consolidated statement of cash flows 86Notes to the consolidated financial statements 87
Directors' declaration 136Independent auditor's report to the members 137
ABOUT THIS REPORT
These financial statements are the consolidated financial statements of the Group consisting of Iluka ResourcesLimited and its subsidiaries (the Group). The financial statements are presented in Australian dollars.
Iluka Resources Limited is a company limited by shares, incorporated and domiciled in Australia. Its registeredoffice and principal place of business is:
Iluka Resources LimitedLevel 17240 St Georges TerracePerth WA 6000
A description of the nature of the Group's operations and its principal activities is included in the operating andfinancial review section of the Directors' Report, which is not part of these financial statements.
The financial statements were authorised for issue by the directors on 20 February 2020. The directors have thepower to amend and reissue the financial statements.
Through the use of the internet, we have ensured that our corporate reporting is timely and complete. All ASXreleases, financial reports and other relevant information are available at www.iluka.com.
82
For
per
sona
l use
onl
y

Iluka Resources Limited, Annual Report 2019 83
ILUKA RESOURCES LIMITED
CONSOLIDATED STATEMENT OF PROFIT OR LOSSAND OTHER COMPREHENSIVE INCOMEFOR THE YEAR ENDED 31 DECEMBER 2019
Notes2019
$m2018
$m
Revenue 5 1,318.0 1,350.9- -
Other income 2.4 3.1Expenses 6 (854.1) (870.3)
Write-down of Sierra Rutile Limited 7 (414.3) -
Interest and finance charges (15.0) (15.0)Rehabilitation and mine closure provision discount unwind (38.0) (16.7)
Total finance costs 15 (53.0) (31.7)
+0.1 DR (0.1) -
Profit/(loss) before income tax (1.0) 452.0
Income tax expense 11 (298.7) (148.1)- -
Profit/(loss) for the period, attributable to: (299.7) 303.9
Equity holders of Iluka Resources Limited (279.9) 303.9Non-controlling interest 22 (19.8) -
- -- -
Other comprehensive income
Items that may be reclassified subsequently to profit or lossCurrency translation of foreign operations 17 2.7 43.2Hedge of net investment in foreign operation, net of tax 17 (2.6) (2.1)Movements in foreign exchange cash flow hedges, net of tax 4.7 (7.9)
Items that will not be reclassified to profit or lossActuarial (losses) gains on defined benefit plans, net of tax 17 (3.9) 0.6
Total other comprehensive income/(loss) for the year, net of tax 0.9 33.8
- -- -
Total comprehensive income/(loss) for the year, attributable to: (298.8) 337.7
Equity holders of Iluka Resources Limited (279.0) 337.7Non-controlling interest 22 (19.8) -
Cents Cents
Profit/(loss) per share attributable to ordinary equity holders of the parentBasic profit/(loss) per share 19 (71.0) 72.2Diluted profit/(loss) per share 19 (71.0) 71.8
The above consolidated statement of profit or loss and other comprehensive income should be read in conjunction with theaccompanying notes.
83
CONSOLIDATED STATEMENT OF PROFIT OR LOSS AND OTHER COMPREHENSIVE INCOMEFor the year ended 31 December 2019
For
per
sona
l use
onl
y

Iluka Resources Limited, Annual Report 201984
ILUKA RESOURCES LIMITED
CONSOLIDATED BALANCE SHEETAS AT 31 DECEMBER 2019
Notes2019
$m2018
$m
ASSETSCurrent assetsCash and cash equivalents 15 97.3 51.3Receivables 13 196.3 162.6Inventories 14 341.1 387.1
Current tax receivables 3.3 7.7
Total current assets 638.0 608.7
Non-current assetsProperty, plant and equipment 9 1,126.2 1,379.1Deferred tax assets 12 22.1 215.6Intangible asset - MAC Royalty 5(c) 3.5 3.9Inventories 14 84.1 4.6Right of use assets 10 20.5 --0.1 CR - (0.1)
+0.1 DR 0.1 -
Total non-current assets 1,256.4 1,603.2
Total assets 1,894.4 2,211.9
LIABILITIESCurrent liabilitiesPayables 140.8 153.2Derivative financial instruments 21 3.7 4.4Current tax payable 96.1 143.6Provisions 8 112.6 105.6Lease liabilities 10 9.2 --0.1 CR 0.1 -
+0.1 DR - (0.1)
Total current liabilities 362.4 406.8
Non-current liabilitiesInterest-bearing liabilities 15 54.0 49.5Derivative financial instruments 21 1.6 7.3Provisions 8 715.6 638.3Financial liabilities at fair value through profit or loss 22 28.4 -Lease liabilities 10 20.8 --0.1 CR - 0.1
+0.1 DR(0.1) -
Total non-current liabilities 820.4 695.1
-0.1 CR 0.1 -
Total liabilities 1,182.8 1,101.9
Net assets 711.6 1,110.0
EQUITYContributed equity 16 1,157.6 1,154.0Reserves 17 24.0 42.6Accumulated losses 17 (472.0) (86.6)Non-controlling interests 22 2.0 -+0.1 DR (0.1) -
Total equity 711.6 1,110.0
The above consolidated balance sheet should be read in conjunction with the accompanying notes.
84
CONSOLIDATED BALANCE SHEETFor the year ended 31 December 2019
For
per
sona
l use
onl
y

Iluka Resources Limited, Annual Report 2019 85
ILUKA RESOURCES LIMITED
CONSOLIDATED STATEMENT OF CHANGES IN EQUITYFOR THE YEAR ENDED 31 DECEMBER 2019
Attributable to owners ofIluka Resources Limited
Notes
Sharecapital
$m
Otherreserves
$m
Retainedearnings
$m
Totalequity
$m
Balance at 1 January 2018 1,119.7 9.4 (244.2) 884.9
Profit for the year 17 - - 303.9 303.9
Other comprehensive income (loss) 17 - 33.2 0.6 33.8
Total comprehensive income - 33.2 304.5 337.7
Transactions with owners in their capacity as owners:Transfer of shares to employees, net of tax 4.6 (4.6) - -Purchase of treasury shares, net of tax (8.9) - - (8.9)Share-based payments, net of tax 17 - 4.6 - 4.6
Dividends paid 17 38.6 - (146.9) (108.3)
34.3 - (146.9) (112.6)
space
Balance at 31 December 2018 1,154.0 42.6 (86.6) 1,110.0
Attributable to owners ofIluka Resources Limited
Notes
Sharecapital
$m
Otherreserves
$m
Retainedearnings
$mTotal
$mNCI¹
$m
Totalequity
$m
Balance at 1 January 2019 1,154.0 42.6 (86.6) 1,110.0 - 1,110.0
Loss for the year 17 - - (279.9) (279.9) (19.8) (299.7)
Other comprehensive income (loss) 17 - 4.8 (3.9) 0.9 - 0.9
Total comprehensive income - 4.8 (283.8) (279.0) (19.8) (298.8)
Transfer of asset revaluation reserve - 0.1 (0.1) - - -spaceTransactions with owners in their capacity as owners:Transfer of shares to employees, net of tax 8.0 (8.0) - - - -Purchase of treasury shares, net of tax (6.0) - - (6.0) - (6.0)Share-based payments, net of tax 17 - 5.9 - 5.9 - 5.9Dividends paid 17 1.6 - (101.5) (99.9) - (99.9)
Transactions with non-controlling interests 22 - (21.4) - (21.4) 21.8 0.4
3.6 (23.5) (101.5) (121.4) 21.8 (99.6)
space
Balance at 31 December 2019 1,157.6 24.0 (472.0) 709.6 2.0 711.6
¹Non-controlling interest - refer to note 22.
The above consolidated statement of changes in equity should be read in conjunction with the accompanying notes.
85
CONSOLIDATED STATEMENT OF CHANGES IN EQUITYFor the year ended 31 December 2019
For
per
sona
l use
onl
y

Iluka Resources Limited, Annual Report 201986
ILUKA RESOURCES LIMITED
CONSOLIDATED STATEMENT OF CASH FLOWSFOR THE YEAR ENDED 31 DECEMBER 2019
Notes2019
$m2018
$m
Cash flows from operating activitiesReceipts from customers 1,189.8 1,277.4
Payments to suppliers and employees (781.7) (683.2)
Operating cash flow 408.1 594.2.Interest received 1.2 1.0Interest paid (6.9) (7.6)Income taxes paid (147.4) (5.2)Exploration expenditure (11.3) (11.7)
Mining Area C royalty receipts 78.5 55.8
Net cash inflow from operating activities 30 322.2 626.5
Cash flows from investing activitiesPayments for property, plant and equipment (197.5) (311.5)Sale of property, plant and equipment 2.0 2.4
Payments for options contracts - (0.6)
Net cash outflow from investing activities (195.5) (309.7)
Cash flows from financing activitiesRepayment of borrowings (324.7) (366.0)Proceeds from borrowings 332.7 166.0Purchase of treasury shares (7.4) (12.4)Proceeds from changes in ownership interests 28.5 -Dividends paid 18 (99.9) (108.3)Principal element of lease payments (8.2) -
Debt refinance costs (2.0) -
Net cash outflow from financing activities (81.0) (320.7)
Net increase/(decrease) in cash and cash equivalents 45.7 (3.9).Cash and cash equivalents at 1 January 51.3 53.6
Effects of exchange rate changes on cash and cash equivalents 0.3 1.6
Cash and cash equivalents at end of period 15 97.3 51.3
The above consolidated statement of cash flows should be read in conjunction with the accompanying notes.
86
ILUKA RESOURCES LIMITED31 DECEMBER 2019
CONTENTS OF THE NOTES TO THE FINANCIAL STATEMENTS
Page
Basis of preparation 881. Reporting entity 882. Basis of preparation 883. Critical accounting estimates and judgements 90
Key numbers 904. Segment information 905. Revenue 936. Expenses 947. Impairment of assets 968. Provisions 989. Property, plant and equipment 10010. Leases 10211. Income tax 10412. Deferred tax 10613. Receivables 10714. Inventories 108
Capital 10915. Net cash/(debt) and finance costs 10916. Contributed equity 11117. Reserves and retained earnings 11218. Dividends 11419. Profit/(loss) per share 114
Risk 11520. Financial risk management 11521. Hedging 118
Group structure 12022. Changes in ownership interests held in controlled entities 12023. Controlled entities and deed of cross guarantee 121
Other notes 12424. Contingent liabilities 12425. Events occurring after the reporting period 12526. Commitments 12527. Remuneration of auditors 12628. Share-based payments 12729. Post-employment benefit obligations 12930. Reconciliation of profit/(loss) after income tax to net cash inflow from operating activities 13131. Key Management Personnel 13132. Parent entity financial information 13233. Related party transactions 13334. New and amended standards 134
87
CONSOLIDATED STATEMENT OF CASH FLOWSFor the year ended 31 December 2019
For
per
sona
l use
onl
y

Iluka Resources Limited, Annual Report 2019 87
ILUKA RESOURCES LIMITED31 DECEMBER 2019
CONTENTS OF THE NOTES TO THE FINANCIAL STATEMENTS
Page
Basis of preparation 881. Reporting entity 882. Basis of preparation 883. Critical accounting estimates and judgements 90
Key numbers 904. Segment information 905. Revenue 936. Expenses 947. Impairment of assets 968. Provisions 989. Property, plant and equipment 10010. Leases 10211. Income tax 10412. Deferred tax 10613. Receivables 10714. Inventories 108
Capital 10915. Net cash/(debt) and finance costs 10916. Contributed equity 11117. Reserves and retained earnings 11218. Dividends 11419. Profit/(loss) per share 114
Risk 11520. Financial risk management 11521. Hedging 118
Group structure 12022. Changes in ownership interests held in controlled entities 12023. Controlled entities and deed of cross guarantee 121
Other notes 12424. Contingent liabilities 12425. Events occurring after the reporting period 12526. Commitments 12527. Remuneration of auditors 12628. Share-based payments 12729. Post-employment benefit obligations 12930. Reconciliation of profit/(loss) after income tax to net cash inflow from operating activities 13131. Key Management Personnel 13132. Parent entity financial information 13233. Related party transactions 13334. New and amended standards 134
87
NOTES TO FINANCIAL STATEMENTSFor the year ended 31 December 2019
For
per
sona
l use
onl
y

Iluka Resources Limited, Annual Report 201988
ILUKA RESOURCES LIMITED31 DECEMBER 2019
Iluka Resources Limited and its subsidiaries together are referred to in this financial report as the Group.
The notes include information which is required to understand the financial statements and is material andrelevant to the operations and the financial position and performance of the Iluka Group. Information isconsidered relevant and material if:
• The amount is significant due to its size or nature;• The amount is important in understanding the results of the Group;• It helps to explain the impact of significant changes in the Group's business; or• It relates to an aspect of the Group's operations that is important to its future performance.
BASIS OF PREPARATIONThis section of the financial report sets out the Group’s accounting policies that relate to the financial statementsas a whole. This section also sets out information related to critical accounting estimates and judgementsapplied to these financial statements.
1 REPORTING ENTITY
Iluka Resources Limited (Company or parent entity) is domiciled in Australia. The financial statements are for theGroup consisting of Iluka Resources Limited and its subsidiaries. A list of the Group's subsidiaries is provided innote 23.
2 BASIS OF PREPARATION
These general purpose financial statements have been prepared in accordance with Australian AccountingStandards and Interpretations issued by the Australian Accounting Standards Board (AASB) and the CorporationsAct 2001. Iluka Resources Limited is a for-profit entity and is primarily involved in mineral sands exploration,project development, mining operations, processing and marketing. The Group also has a royalty business, withthe cornerstone asset being a royalty over BHP's Mining Area C in Western Australia.
The consolidated financial statements of Iluka Resources Limited also comply with International FinancialReporting Standards (IFRS) as issued by the International Accounting Standards Board (IASB).
These financial statements have been prepared under the historical cost convention except for financial assetsand liabilities which are required to be measured at fair value.
New and amended standards adopted by the Group, and the related impacts on the financial statements, aredetailed in note 34.
(a) Principles of consolidation
(i) Subsidiaries
The consolidated financial statements incorporate the assets and liabilities of all subsidiaries of Iluka ResourcesLimited as at 31 December 2019 and the results of all subsidiaries for the year then ended. A list of controlledentities (subsidiaries) at year-end is contained in note 23.
The financial statements of subsidiaries are included in the consolidated financial statements from the date onwhich control commences until the date on which control ceases. Accounting policies of subsidiaries arechanged where necessary to ensure consistency with the policies adopted by the Group.
Intercompany transactions, balances, and unrealised gains on transactions between Group companies, areeliminated. Unrealised losses are also eliminated unless the transaction provides evidence of the impairment ofthe asset transferred.
The Group accounts for business combinations using the acquisition method when control is transferred to theGroup. Cost is measured as the fair value of the assets given, shares issued, or liabilities incurred or assumed atthe date of exchange. Transaction costs are expensed as incurred, except if related to the issue of debt or equitysecurities.
88
NOTES TO FINANCIAL STATEMENTSFor the year ended 31 December 2019
For
per
sona
l use
onl
y

Iluka Resources Limited, Annual Report 2019 89
ILUKA RESOURCES LIMITED31 DECEMBER 2019
(ii) Employee Share Trust
The Group's Employee Share Schemes are administered through the Iluka Resources Limited Employee SharePlan Trust (the trust). This trust is consolidated, as the substance of the relationship is that the trust is controlledby the Group. Shares in the Company held by the trust are disclosed as treasury shares in the consolidatedfinancial statements and deducted from contributed equity, net of tax.
(b) Foreign currency translation
The consolidated financial statements are presented in Australian dollars, which is the Company's functional andpresentation currency.
Where Group companies based in Australia transact in foreign currencies, these transactions are translated intoAustralian dollars using the exchange rate on that day. Foreign currency monetary assets and liabilities aretranslated to Australian dollars at each reporting date exchange rate. Non-monetary assets and liabilities that aremeasured at fair value in a foreign currency are translated to Australian dollars at the exchange rate when the fairvalue was determined. Foreign currency differences are generally recognised in profit or loss. Non-monetaryitems that are measured based on historical cost in a foreign currency are not re-translated.
The financial position of foreign operations is translated into Australian dollars at the exchange rates at thereporting date. The income and expenses of foreign operations are translated into Australian dollars at averageexchange rates each month. Foreign currency differences are recognised in other comprehensive income andaccumulated in the foreign currency translation reserve.
The Group had US dollar denominated borrowings that were used to hedge against translation differences arisingfrom assets held by the Group's Sierra Rutile Limited operations (see note 21 for more information).
To the extent that these borrowings did not exceed the net assets of these operations, foreign currencydifferences arising on the translation of these borrowings were recognised in other comprehensive income andaccumulated in the foreign currency translation reserve. Any remaining differences were recognised in profit orloss. If these operations were to be disposed of (in full or in part), the relevant amount in the foreign currencytranslation reserve would be transferred to profit or loss as part of the gain or loss on disposal.
(c) Rounding of amounts
The Company is of a kind referred to in Rounding Instrument 2016/191, issued by the Australian Securities andInvestments Commission, relating to the rounding of amounts in the financial statements. In accordance withthat Rounding Instrument, amounts in the financial statements have been rounded to the nearest hundredthousand dollars, or in certain cases, the nearest thousand dollars or nearest dollar.
89
NOTES TO FINANCIAL STATEMENTSFor the year ended 31 December 2019
For
per
sona
l use
onl
y

Iluka Resources Limited, Annual Report 201990
ILUKA RESOURCES LIMITED31 DECEMBER 2019
3 CRITICAL ACCOUNTING ESTIMATES AND JUDGEMENTS
The Group makes estimates and assumptions concerning the future in applying its accounting policies. Theresulting accounting estimates will, by definition, seldom equal the related actual results. The estimates andassumptions that have a significant risk of causing a material adjustment to the carrying amounts of assets andliabilities within the next financial year are noted below.
Estimates and underlying assumptions are reviewed on an ongoing basis, with revisions recognised in the periodin which the estimates are revised and future periods affected.
Estimates and assumptions which are material to the financial report are found in the following notes:
-Note
-Impairment of assets 7Rehabilitation and mine closure provisions 8Tax balances 11Deferred tax asset recognition 12Net realisable value and classification of product inventory 14
KEY NUMBERS
4 SEGMENT INFORMATION
(a) Description of segments
The Group has identified its operating segments based on the internal reports that are reviewed and used by theexecutive management team (the chief operating decision-makers) in assessing performance and in determiningthe allocation of resources.
During the current reporting period, the Group changed the internal reporting basis of its operations to matchchanges in the operational structure of the business, with the resultant new operating segments of the Groupbeing as follows:
Jacinth-Ambrosia/Mid West (JA/MW) comprises the mining operations at Jacinth-Ambrosia located in SouthAustralia, and associated processing operations at the Narngulu mineral separation plant in WesternAustralia.
Cataby/South West (C/SW) comprises mining activities at Cataby and processing of ilmenite at Synthetic RutileKiln 2, both located in Western Australia.
Sierra Rutile (SRL) comprises the integrated mineral sands mining and processing operations in Sierra Leone.
Mining Area C (MAC) comprises a deferred consideration iron ore royalty interest over certain mining tenementsin Australia operated by BHP Group.
United States/Murray Basin (US/MB) comprises rehabilitation obligations in the United States (Florida andVirginia), where mining and processing activities were substantially completed in December 2015, although saleof remnant product remains an activity; and certain idle assets located in Australia (Murray Basin).
The previous Australia operating segment has been disaggregated to form the Jacinth-Ambrosia/Mid West andCataby/South West operating segments. Certain idle assets previously included in the Australia operatingsegment have been combined with the United States operating segment to form the United States/Murray Basinsegment. The Sierra Rutile and Mining Area C segments are unchanged. Comparative information for changedsegments has been restated.
Cash, debt and tax balances are managed at a group level, together with exploration and other corporateactivities, and are not allocated to segments.
90
NOTES TO FINANCIAL STATEMENTSFor the year ended 31 December 2019
For
per
sona
l use
onl
y

Iluka Resources Limited, Annual Report 2019 91
ILUKA RESOURCES LIMITED31 DECEMBER 2019
Where finished product capable of sale to a third party is transferred between operating segments, the transfersare made at arm’s length prices. Any transfers of intermediate products between operating segments are madeat cost. No such transfers took place between segments during the year ended 31 December 2019 (2018: $12.4million).
(b) Segment information
2019 JA/MW C/SW SRL MAC US/MB Total$m $m $m $m $m $m
Total segment sales of mineral sands 482.7 414.2 257.6 - 38.6 1,193.1Total segment freight revenue 19.8 7.4 8.1 - 3.3 38.6Write-down of Sierra Rutile Limited - - 414.3 - - 414.3Depreciation and amortisation expense 28.9 54.0 74.6 0.4 0.6 158.5Changes in rehabilitation for closed sites 1.6 (0.1) - - (4.7) (3.2)Total segment result¹ 316.8 160.4 (430.0) 84.7 (14.8) 117.1Segment assets 588.4 717.2 220.2 23.7 154.1 1,703.6Segment liabilities 248.1 254.7 169.3 - 304.6 976.7
Additions to non-current segment assets 78.0 113.1 79.9 - 2.0 273.0
2018 JA/MW C/SW SRL MAC US/MB Total$m $m $m $m $m $m
Total segment sales of mineral sands 568.6 297.2 203.9 - 174.4 1,244.1Total segment freight revenue 26.3 5.0 7.0 - 12.0 50.3Depreciation and amortisation expense 25.3 20.1 41.1 0.4 3.4 90.3Changes in rehabilitation for closed sites (8.6) 1.4 (1.3) - 3.9 (4.6)Total segment result¹ 358.9 110.5 (14.5) 55.2 50.0 560.1Segment assets 465.6 624.8 621.0 17.5 165.9 1,894.8Segment liabilities 198.9 209.5 137.6 - 319.2 865.2
Additions to non-current segment assets 9.8 263.1 109.9 - 8.2 391.0
¹Total segment result includes impairment charges, depreciation and amortisation expenses, and rehabilitation and holdingcosts for closed sites that are also separately reported above.
Mineral sands revenue is derived from sales to external customers domiciled in various geographical regions.Details of segment revenue by location of customers are as follows:
2019$m
2018$m
China 404.1 462.3Asia excluding China 200.9 198.4Europe 400.1 304.5Americas 135.9 230.7
Other countries 52.1 48.2
Sale of goods 1,193.1 1,244.1
Revenue of $187.7 million and $136.9 million was derived from two external customers of the mineral sandssegments, which individually account for greater than 10% of the total segment revenue (2018: revenues of$147.3 million and $143.0 million from two external customers).
91
NOTES TO FINANCIAL STATEMENTSFor the year ended 31 December 2019
For
per
sona
l use
onl
y

Iluka Resources Limited, Annual Report 201992
ILUKA RESOURCES LIMITED31 DECEMBER 2019
Segment result is reconciled to profit/(loss) before income tax as follows:
2019$m
2018$m
Segment result 117.1 560.1Interest income - 1.0Asset sales and other income 1.8 0.8Marketing and selling (11.9) (13.6)Corporate and other costs (47.3) (48.2)Depreciation (4.6) (3.3)Resource development (42.2) (30.1)Interest and finance charges (13.9) (15.1)
Net foreign exchange gains - 0.4
Profit/(loss) before income tax (1.0) 452.0
Total segment assets and total segment liabilities are reconciled to the balance sheet as follows:
Segment assets 1,703.6 1,894.8Corporate assets 68.1 42.5Cash and cash equivalents 97.3 51.3Current tax receivable 3.3 7.7
Deferred tax assets 22.1 215.6
Total assets as per the balance sheet 1,894.4 2,211.9
Segment liabilities 976.7 865.2Corporate liabilities 56.0 43.6Current tax payable 96.1 143.6
Interest-bearing liabilities 54.0 49.5
Total liabilities as per the balance sheet 1,182.8 1,101.9
92
NOTES TO FINANCIAL STATEMENTSFor the year ended 31 December 2019
For
per
sona
l use
onl
y

Iluka Resources Limited, Annual Report 2019 93
ILUKA RESOURCES LIMITED31 DECEMBER 2019
5 REVENUE
Notes2019
$m2018
$m
-0.1 CR 0.1 -Sales revenueSale of goods 5(a) 1,193.1 1,244.1Freight revenue 5(b) 38.6 50.3
Other revenueMining Area C royalty income 5(c) 85.1 55.6
Interest 5(d) 1.2 0.9
86.3 56.5
1,318.0 1,350.9
(a) Sale of mineral sands
The Group earns revenue by mining, processing, and subsequently selling mineral sands (including zircon, rutile,synthetic rutile and ilmenite) by export to customers based in the Americas, Europe, China, the rest of Asia, andother countries under a range of commercial terms.
Revenue from the sale of product is recognised when control has been transferred to the customer, generallybeing when the product has been dispatched and is no longer under the physical control of the Group. In caseswhere control of product is transferred to the customer before dispatch takes place, revenue is recognised whenthe customer has formally acknowledged their legal ownership of the product, which includes all inherent risksassociated with control of the product. In these cases, product is clearly identified and immediately available tothe customer.
Sales to customers are generally denominated in US Dollars, which are translated into the functional currency ofthe Group using the spot exchange rate applicable on the transaction date. The effect of variable considerationarising from rebates, discounts and other similar arrangements with customers is included in revenue to theextent that it is highly probable that there will be no significant reversal of the cumulative amount of revenuerecognised when any pricing uncertainty is resolved. Revenue is recognised net of duties and other taxes.
The Group does not expect to have any contracts where the period between the transfer of the promised goodsor services to the customer and payment by the customer exceeds one year. Accordingly, the group does notadjust transaction prices for the time value of money.
(b) Freight revenue
The Group also earns revenue from freighting its products to customers in accordance with the incoterms ineach particular sales contract. Freight revenue is recognised to the extent that the freight service has beendelivered, specifically with reference to the proportion of completed freight distance to total freight distance,which is determined by the Group at each reporting date.
Freight revenue is allocated from the overall contract price at its standalone selling price (where observable) orotherwise at its estimated cost plus margin.
Freight revenue includes $2.4 million relating to contracts in place at the end of the prior year (2018: $0.9 million).Deferred freight revenue of $1.5 million has been deferred at the end of the current year in relation to unfulfilledshipping obligations.
93
NOTES TO FINANCIAL STATEMENTSFor the year ended 31 December 2019
For
per
sona
l use
onl
y
Iluka Resources Limited, Annual Report 201994
ILUKA RESOURCES LIMITED31 DECEMBER 2019
(c) Mining Area C royalty income and amortisation of royalty asset
Iluka holds a royalty over BHP’s Mining Area C (MAC) iron ore mine. The royalty stream is paid as 1.232% ofAustralian dollar denominated revenue from the royalty area and a one-off payment of $1 million per milliontonne increase in annual production capacity.
Royalty income is recognised on an accrual basis and is received on a quarterly basis in arrears. The royaltyentitlement asset is an intangible asset and is amortised on a straight-line basis over its estimated useful life.
(d) Interest income
Interest income is recognised in profit or loss as it accrues, using the effective interest method.
6 EXPENSES
Notes2019
$m2018
$m
ExpensesCash costs of production 6(a) 528.7 443.6Depreciation and amortisation 155.6 84.1Inventory movement - cash costs of production (63.4) 68.5
Inventory movement - non-cash production costs (15.5) 28.3
Cost of goods sold 6(b) 605.4 624.5
Ilmenite concentrate and by-product costs 6(c) 10.9 11.5Depreciation (idle, corporate and other) 7.6 9.4Restructure and idle capacity charges 6(d) 19.7 24.7Rehabilitation costs for closed sites 6(e) 3.2 (4.6)Government royalties 39.4 38.1Marketing and selling costs, including freight 73.6 88.5Corporate and other costs 48.0 48.1Resource development costs 42.2 30.1
Net loss on disposal of property, plant and equipment 4.1 -
854.1 870.3
Write-down of Sierra Rutile LimitedImpairment recognised against property, plant and equipment 375.2 -
Write-down of inventory to net realisable value 39.1 -
7 414.3 -
(1,268.4) (870.3)(a) Cash costs of production
Cash costs of production include costs for mining and concentrating, transport of heavy mineral concentrate,mineral separation, synthetic rutile production, externally purchased ilmenite, and production overheads; butexclude Australian state and Sierra Leone government royalties which are reported separately.
94
NOTES TO FINANCIAL STATEMENTSFor the year ended 31 December 2019
For
per
sona
l use
onl
y

Iluka Resources Limited, Annual Report 2019 95
ILUKA RESOURCES LIMITED31 DECEMBER 2019
(b) Cost of goods sold
Cost of goods sold is the inventory value of each tonne of finished product sold. All production is added toinventory at cost, which includes direct costs and an appropriate portion of fixed and variable overheadexpenditure, including depreciation and amortisation, allocated on the basis of relative sales value. The inventoryvalue recognised as cost of goods sold for each tonne of finished product sold is the weighted average value pertonne for the stockpile from which the product is sold.
Inventory movement represents the movement in balance sheet inventory of work in progress and finishedgoods, including the non-cash depreciation and amortisation components and movement in the net realisablevalue adjustments.
(c) Ilmenite concentrate and by-product costs
Ilmenite and by-product costs include by-product costs such as for iron concentrate processing, activated carbonand wet high intensity magnetic separation (WHIMS) ilmenite transport costs.
(d) Restructure and idle capacity charges
Idle capacity charges reflect ongoing costs incurred during periods of no or restricted production.
(e) Rehabilitation costs for closed sites
These costs relate to adjustments to the rehabilitation provision for closed sites arising from the annual reviewof rehabilitation programmes and estimates. These adjustments are recognised in profit or loss in accordancewith the policy described in note 8.
(f) Other required disclosures
Expenses also include the following:
2019$m
2018$m
Employee benefits (excluding share-based payments) 194.7 174.5Share-based payments 6.2 6.2Exploration expenditure 11.3 11.8Operating leases 4.8 1.8Inventory NRV write-downs - finished goods and WIP 2.7 11.4
Inventory NRV write-downs - Sierra Rutile Limited consumables 39.1 -
(258.8) (205.7)
95
NOTES TO FINANCIAL STATEMENTSFor the year ended 31 December 2019
For
per
sona
l use
onl
y

Iluka Resources Limited, Annual Report 201996
ILUKA RESOURCES LIMITED31 DECEMBER 2019
7 IMPAIRMENT OF ASSETS
(a) Impairment policy
Assets are reviewed for impairment whenever events or changes in circumstances indicate that the carryingamount may not be recoverable. An impairment charge is recognised for the amount by which the asset’scarrying amount exceeds its recoverable amount. For the purposes of assessing impairment, operating assetsare grouped at the lowest levels for which there are separately identifiable cash flows (Cash Generating Units -CGUs). The recoverable amount of each CGU is determined as the higher of value-in-use and fair value less costsof disposal (FVLCD) estimated based on the discounted present value of future cash flows (a level 3 fair valueestimation method) and other adjustments. Assets that are not currently in use and not scheduled to be broughtback into use (idle assets) are considered on a standalone basis.
Indicators of impairment may include significant changes in business performance or future operating plansalong with changes in technology.
Key estimate: Recoverable amount calculation
In determining the recoverable amount of assets, estimates are made regarding the present value of futurecash flows in the absence of quoted market prices. These estimates require significant levels of judgement andare subject to risk and uncertainty that may be beyond the control of the Group, including political risk, climatechange risk, and other global uncertainty risks, like the impacts of COVID-19. Given the nature of the Group’smining activities, changes in assumptions upon which these estimates are based may give rise to materialadjustments. This could lead to recognition of new impairment charges in the future, or the reversal ofimpairment charges already recognised.
Where an impairment assessment is needed, the estimates of discounted future cash flows for each CGU usedin determining its FVLCD are based on significant assumptions including:
• estimates of the quantities of mineral reserves and ore resources for which there is a high degree ofconfidence of economic extraction and the timing of access to these reserves and ore resources;• future production levels and the ability to sell that production;• future product prices based on the Group’s assessment of short and long-term prices for each of the keyproducts;• future exchange rates using external forecasts (2019 long term AUD:USD exchange rate of 0.75, unchangedfrom 2018 assessment);• successful development and operation of new mines, consistent with latest forecasts;• future cash costs of production, sustaining capital expenditure, rehabilitation and mine closure; and• the asset specific discount rate applicable to the CGU (SRL: 12%; Australian operations: 10%).
96
NOTES TO FINANCIAL STATEMENTSFor the year ended 31 December 2019
For
per
sona
l use
onl
y

Iluka Resources Limited, Annual Report 2019 97
ILUKA RESOURCES LIMITED31 DECEMBER 2019
(b) Impairment of Sierra Rutile Limited cash generating unit
An impairment indicator was noted in Iluka’s Interim Report for 30 June 2019 for SRL due to management’s decision to delay the Sembehun Early Works beyond the end of 2019 in order to revisit and broaden optimisation studies following further expected increases to the capital costs to develop Sembehun based on production capacity, over time, in excess of 300 thousand tonnes of rutile production per annum. As noted in that report, no impairment was recognised at that time. The fair value was assessed with reference both to the value implied by the IFC investment in Sierra Rutile, announced on 6 June 2019, and to a range of life of mine discounted cash flow estimates.
The Group has continued to progress the Sembehun optimisation studies and does not currently have a defined development approach, resulting in difficulties in ascribing any meaningful value to the Sembehun deposit in the impairment assessment at this time. SRL operational performance achieved to date has also been below the acquisition investment case. In line with the requirements of accounting standards, the Group’s determination of the recoverable amount of SRL assumes limited improvement from current budgeted performance levels and has valued the Sembehun deposit on the current status of development. Iluka is continuing to implement various measures to drive production increases in its current SRL operations, and to advance the Sembehun development options, but has not incorporated these potential increases in value into the determination of fair value.
In accordance with the Group policy, at 31 December 2019, the Group wrote down Sierra Rutile’s carrying amount as well as associated deferred tax assets as detailed in the table below:
-Write-down amount
-- AUD USD
Notes $m $m-Property, plant and equipment 9 375.2 262.6
Consumables 14 39.1 27.4
414.3 290.0
-The recoverable amount of the SRL cash generating unit (which is now equal to its carrying value) wasdetermined with reference to its fair value less costs of disposal. The fair value estimate is a level 3measurement, as defined in AASB 13 Fair Value Measurement. In addition to the assumptions noted above,specific assumptions were required for the SRL CGU with regards to:
• The approach to valuing the Sembehun deposit that would be taken by a third party, given it does not currentlyhave a defined development approach;• Key operational performance metrics in the existing operations and their impact on the costs of production; and• The timing and approach to mining that would be assumed by a third party in determining its valuation.
The recoverable amount of the SRL CGU is particularly sensitive to changes in rutile prices, production and salesvolumes, cash costs, and capital expenditures. Changes in assumptions or real-world developments that impactthese inputs, including the establishment of a Sembehun development option, could result in a reversal ofimpairment or an additional reduction to CGU carrying value.
In addition, deferred tax assets with a carrying value of A$161.9 (US$115.0 million) were derecognised againstincome tax expense, as detailed in note 11.
97
NOTES TO FINANCIAL STATEMENTSFor the year ended 31 December 2019
For
per
sona
l use
onl
y

Iluka Resources Limited, Annual Report 201998
ILUKA RESOURCES LIMITED31 DECEMBER 2019
8 PROVISIONS
Notes2019
$m2018
$m
CurrentRehabilitation and mine closure 8(a) 97.7 87.7Employee benefits - long service leave 8(b) 12.7 12.2Workers compensation and other provisions 2.2 5.7-0.1 CR - 0.1
112.6 105.6
Non-currentRehabilitation and mine closure 8(a) 690.8 616.1Employee benefits - long service leave 8(b) 2.4 2.0Retirement benefit obligations 29 22.4 17.9Other provisions - 2.3-0.1 CR 0.1 -
715.6 638.3
Provisions are recognised when the Group has a present obligation (legal or constructive) as a result of a pastevent, it is probable that resources will be expended to settle the obligation and a reliable estimate can be madeof the amount of the obligation.
(a) Rehabilitation and mine closure
The movements in the rehabilitation and mine closure provision are set out below:
Notes $m
Movements in rehabilitation and mine closure provisionsBalance at 1 January 2019 703.8Amounts spent during the year (53.5)Rehabilitation and mine closure provision discount unwind 15(d) 19.7Change in provision - additions to property, plant and equipment 9 52.0Change in provision - expense for closed sites 6 3.2Rehabilitation discount rate changes - for closed sites 18.3Rehabilitation discount rate changes - for open sites 15(d) 43.0
Foreign exchange rate movements 2.0
Balance at 31 December 2019 788.5
The Group has obligations to dismantle and remove certain items of property, plant and equipment and to restoreand rehabilitate the land on which they sit.
A provision is raised for the estimated cost of settling the rehabilitation and restoration obligations existing atbalance date, discounted to present value using an appropriate pre-tax discount rate.
Where the obligation is related to an item of property, plant and equipment, its cost includes the present value ofthe estimated costs of dismantling and removing the asset and restoring the site on which it is located. Coststhat relate to obligations arising from waste created by the production process are recognised as productioncosts in the period in which they arise.
The increase in the provision associated with unwinding of the discount rate is recognised as a finance cost -refer to note 15(d).
98
NOTES TO FINANCIAL STATEMENTSFor the year ended 31 December 2019
For
per
sona
l use
onl
y

Iluka Resources Limited, Annual Report 2019 99
ILUKA RESOURCES LIMITED31 DECEMBER 2019
The total rehabilitation and mine closure provision of $788.5 million (2018: $703.8 million) includes $450.8million (2018: $464.0 million) for assets no longer in use. Changes to the provisions for assets no longer in useare charged/credited directly to profit or loss. A review of cost estimates resulted in a charge to profit or loss of$3.2 million (2018: credit of $4.6 million) which is reported within the expense item Rehabilitation costs for closedsites in note 6.
Key estimate: Rehabilitation and mine closure provisions
The Group’s assessment of the present value of the rehabilitation and mine closure provisions requires the useof significant estimates and judgements, including the future cost of performing the work required, timing of thecash flows, discount rates, final remediation strategy, and future land use requirements. The provision can alsobe impacted prospectively by changes to legislation or regulations.
The provisions are reassessed at least annually. A change in any of the assumptions used to determine theprovisions could have a material impact on the carrying value of the provision. In the case of provisions forassets which remain in use, adjustments to the provision are offset by a change in the carrying value of therelated asset. Where the provisions are for assets no longer in use, such as mines and processing sites thathave been closed, any adjustment is reflected directly in profit or loss.
Key estimate: Discount rate for provisions
Provisions are determined by discounting the expected future cash flows at a pre-tax rate that reflects currentmarket assessments of the time value of money and the risks specific to the liability to the extent they are notincluded in the cash flows.
Rehabilitation and mine closure provisions have been calculated by discounting risk adjusted cash flows atrisk-free discount rates, representing government bond rates for the associated currencies. Iluka has re-set therisk free discount rate used in calculating the Australian rehabilitation provision due to the continuing decline inAustralian dollar bond rates. The 15-year Australian Government Bond rate is used as a proxy for the risk-freediscount rate and is now calculated at 1.3% (2018: 3%). This has resulted in an increase of $61.3 million to theprovision. Of this amount, $18.3 million relates to closed sites, which is reported within finance costs item‘Rehabilitation discount rate changes’ in note 15(d).
Rehabilitation and mine closure provisions for the US and Sierra Rutile have been calculated by discounting riskadjusted cash flows at discount rates of 2% (2018: 2%).
(b) Employee benefits
The employee benefits provision relates to long service leave entitlements measured as the present value ofexpected future payments to be made in respect of services provided by employees up to the reporting date,discounted using market yields at the reporting date on corporate bonds with terms to maturity and currency thatmatch, as closely as possible, the estimated future cash outflows. Liabilities for annual leave are included inpayables.
The current provision represents amounts for vested long service leave for which the Group does not have anunconditional right to defer settlement, regardless of when the actual settlement is expected to occur. However,based on past experience, the Group does not expect all employees to take the full amount of accrued leave orrequire payment within the next 12 months.
99
NOTES TO FINANCIAL STATEMENTSFor the year ended 31 December 2019
For
per
sona
l use
onl
y

Iluka Resources Limited, Annual Report 2019100
ILUKA RESOURCES LIMITED31 DECEMBER 2019
9 PROPERTY, PLANT AND EQUIPMENT
Land &buildings $m
Plant,machinery &equipment
$m
Minereserves &
development$m
Exploration&
evaluation$m
Total$m
At 1 January 2018Cost 230.1 2,252.2 1,049.0 38.9 3,570.2
Accumulated depreciation¹ (74.1) (1,789.8) (659.5) (17.0) (2,540.4)
Opening written down value 156.0 462.4 389.5 21.9 1,029.8
Additions 9.5 235.4 152.1 0.2 397.2Disposals (1.0) (0.4) - - (1.4)Depreciation and amortisation (2.9) (68.7) (20.1) (1.9) (93.6)Exchange differences 7.9 22.2 15.8 1.2 47.1
Transfers/reclassifications 6.6 7.8 (11.2) (3.2) -
Closing written down value 176.1 658.7 526.1 18.2 1,379.1
At 31 December 2018Cost 256.4 2,541.4 1,066.5 35.1 3,899.4
Accumulated depreciation¹ (80.3) (1,882.7) (540.4) (16.9) (2,520.3)
Closing written down value 176.1 658.7 526.1 18.2 1,379.1PlantYear ended 31 December 2019Additions 10.3 109.1 165.0 - 284.4Disposals (1.9) (3.6) - - (5.5)Depreciation and amortisation (11.4) (86.1) (57.3) - (154.8)Exchange differences (0.1) (2.8) 0.8 0.3 (1.8)Transfers 55.6 (61.9) (1.8) 8.1 -
Impairment of Sierra Rutile Limited (57.0) (154.8) (154.7) (8.7) (375.2)
Closing written down value 171.6 458.6 478.1 17.9 1,126.2
PlantAt 31 December 2019Cost 320.5 2,536.7 1,265.4 43.6 4,166.2
Accumulated depreciation¹ (148.9) (2,078.1) (787.3) (25.7) (3,040.0)
Closing written down value 171.6 458.6 478.1 17.9 1,126.2
¹Accumulated depreciation includes cumulative impairment charges.
(a) Property, plant and equipment
Property, plant and equipment is stated at cost, less accumulated depreciation and impairment charges. Costincludes:
• expenditure that is directly attributable to the acquisition of the items;• direct costs associated with the commissioning of plant and equipment, including pre-commissioning costs
in testing the processing plant;• if the asset is constructed by the Group, the cost of all materials used in construction, direct labour on the
project, project management costs and unavoidable borrowing costs incurred during construction of assetswith a construction period greater than 12 months and an appropriate proportion of variable and fixedoverheads; and
• the present value of the estimated costs of dismantling and removing the asset and restoring the site onwhich it is located.
100
NOTES TO FINANCIAL STATEMENTSFor the year ended 31 December 2019
For
per
sona
l use
onl
y

Iluka Resources Limited, Annual Report 2019 101
ILUKA RESOURCES LIMITED31 DECEMBER 2019
As set out in note 8, in the case of rehabilitation provisions for assets which remain in use, adjustments to thecarrying value of the provision are offset by a change in the carrying value of the related asset. Total additions inthe year include $94.9 million (2018: $47.9 million) relating to rehabilitation, mainly due to changes in thediscount rate used in calculating the carrying value of rehabilitation provisions in Australia ($43.0 million) and anincreased footprint due to developing the new mine at Cataby.
(b) Maintenance and repairs
Certain items of plant used in the primary extraction, separation and secondary processing of extracted mineralsare subject to a major overhaul on a cyclical basis. Costs incurred during such overhauls are characterised aseither capital in nature or repairs and maintenance. Work performed may involve:
(i) the replacement of a discrete sub-component asset, in which case an asset addition is recognised and thebook value of the replaced item is written off; and
(ii) demonstrably extending the useful life or functionality of an existing asset, in which case the relevant cost isadded to the capitalised cost of the asset in question.
Costs incurred during a major cyclical overhaul which do not constitute (i) or (ii) above, are written off as repairsand maintenance as incurred. General repairs and maintenance which are not characterised as part of a majorcyclical overhaul are expensed as incurred.
(c) Depreciation and amortisation
Items of property, plant and equipment are depreciated on a straight-line basis over their useful lives. Theestimated useful life of buildings is the shorter of applicable mine life or 25 years; plant and equipment isbetween 2 and 20 years. Land is not depreciated.
Expenditure on mine reserves and development is amortised over the life of mine, based on the rate of depletionof the economically recoverable reserves (units of production methodology). If production has not yetcommenced, or the mine is idle, amortisation is not charged.
(d) Assets not being depreciated
Included in plant, machinery and equipment, mine reserves and development, and land and buildings are amountstotalling $33.0 million, $17.7 million and $10.1 million, respectively, relating to assets under construction whichare currently not being depreciated as the assets are not ready for use (2018 $218.7 million, $86.2 million and$2.3 million, respectively).
In addition, within property, plant and equipment, excluding exploration and land assets, are amounts totalling$61.2 million which have not been depreciated in the year as mining of the related area of interest has not yetcommenced (2018: $218.5 million).
(e) Exploration, evaluation and development expenditure
Exploration and evaluation expenditure is accumulated separately for each area of interest. Such expenditurecomprises net direct costs and an appropriate portion of related overhead expenditure. Expenditure is carriedforward when incurred in areas for which the Group has rights of tenure and where economic mineralisation isindicated, but activities have not yet reached a stage which permits a reasonable assessment of the existence orotherwise of economically recoverable ore reserves, and active and significant operations in relation to the areaare continuing. Each such project is regularly reviewed. If the project is abandoned or if it is considered unlikelythe project will proceed to development, accumulated costs to that point are written off immediately.
Each area of interest is limited to a size related to a known mineral resource capable of supporting a miningoperation. Identifiable exploration assets acquired from another mining company are recognised as assets attheir cost of acquisition.
Projects are advanced to development status when it is expected that accumulated and future expenditure ondevelopment can be recouped through project development or sale. Capitalised exploration is transferred to MineReserves once the related ore body achieved JORC reserve status (reported in accordance with JORC, 2012) andhas been included in the life of mine plan.
101
NOTES TO FINANCIAL STATEMENTSFor the year ended 31 December 2019
For
per
sona
l use
onl
y

Iluka Resources Limited, Annual Report 2019102
ILUKA RESOURCES LIMITED31 DECEMBER 2019
All of the above expenditure is carried forward up to commencement of operations at which time it is amortisedin accordance with the reserves and development depreciation policy noted in (c) above.
(f) Impairment of PPE
Refer to note 7 for details on impairment testing.
10 LEASES
(a) Amounts recognised in the statement of financial position
2019$m
Adoptiondate
$m
Right-of-use assetsBuildings 9.0 10.9
Plant, machinery and equipment 11.5 18.6
20.5 29.5
Lease liabilitiesCurrent (9.2) (9.6)
Non-current (20.8) (27.6)
(30.0) (37.2)
Additions to the right-of-use assets during the reporting period were $2.2 million. Right-of-use assets arereflected net of incentives received.
(b) Amounts recognised in the statement of profit or loss
2019$m
Amortisation charge of right-of-use assetsBuildings 1.7
Plant, machinery and equipment 6.7
8.4
Borrowing costs 1.5Expense relating to short term leases, low value leases and leases with variable payments 2.0...Total cash flow for leases 8.2
Until the end of the comparative period, leases were accounted for by applying the principles of AASB 117Leases, which classified arrangements as either finance leases or operating leases. From 1 January 2019, theGroup accounting policy was changed so that leases are recognised by applying the principles of AASB16Leases. Under the new standard, leases are recognised as right-of-use assets with corresponding lease liabilities- refer to note 34 for details of the impact on the Group of adopting the new standard.
The group leases various offices, warehouses, equipment and vehicles. Rental contracts are typically made forfixed periods of 6 months to 10 years, but may have extension options as described below.
Contracts may contain both lease and non-lease components. The group allocates the consideration in thecontract to the lease and non-lease components based on their relative stand-alone prices.
102
NOTES TO FINANCIAL STATEMENTSFor the year ended 31 December 2019
For
per
sona
l use
onl
y

Iluka Resources Limited, Annual Report 2019 103
ILUKA RESOURCES LIMITED31 DECEMBER 2019
Lease terms are negotiated on an individual basis and contain a wide range of different terms and conditions.The lease agreements do not impose any covenants other than the security interests in the leased assets that areheld by the lessor. Leased assets may not be used as security for borrowing purposes.
Lease liabilities
Liabilities arising from a lease are initially measured on a present value basis by discounting the following leasepayments to their present value:
• fixed payments (including in-substance fixed payments), less any lease incentives receivable• variable lease payments that are based on an index or a rate, initially measured using the index or rate as at thecommencement date• amounts expected to be payable by the group under residual value guarantees• the exercise price of a purchase option if the group is reasonably certain to exercise that option, and• payments of penalties for terminating the lease, if the lease term reflects the group exercising that option.
Lease payments to be made under reasonably certain extension options are also included in the measurement ofthe liability.
The lease payments are discounted using the interest rate implicit in the lease. If that rate cannot be readilydetermined, which is generally the case for leases in the Group, the incremental borrowing rate is used, being therate that the individual lessee would have to pay to borrow the funds necessary to obtain an asset of similarvalue to the right-of-use asset in a similar economic environment with similar terms, security and conditions. Theweighted average borrowing rate used for the year was 4.3%.
Subsequently to initial recognition, lease liabilities are carried at amortised cost. Payments are allocated betweenrepayment of principal and borrowing costs, which are charged to profit or loss over the lease period so as toproduce a constant periodic rate of interest on the remaining balance of the liability for each period.
Right-of-use assets
Right-of-use assets are initially recognised at cost, comprising:• The amount of the lease liability• Any lease payments made at or before the commencement date, less any incentives received• Initial direct costs, and• Restoration costs.
Subsequently. right-of-use assets are depreciated over the shorter of the asset's useful life and the lease term ona straight-line basis. Where the Group is reasonably certain to exercise a purchase option, the right-of-use assetis depreciated over the underlying asset’s useful life.
Short term leases, leases of low value assets and leases containing variable payments
Payments associated with short-term leases of equipment and vehicles and all leases of low-value assets arerecognised on a straight-line basis as an expense in profit or loss. Short-term leases are leases with a lease termof 12 months or less.
103
NOTES TO FINANCIAL STATEMENTSFor the year ended 31 December 2019
For
per
sona
l use
onl
y

Iluka Resources Limited, Annual Report 2019104
ILUKA RESOURCES LIMITED31 DECEMBER 2019
11 INCOME TAX
Income tax expense comprises current and deferred tax and is recognised in profit or loss, as disclosed in (a)below, except to the extent that it relates to items recognised directly in equity or other comprehensive income asdisclosed in (c) below.
(a) Income tax expense (benefit)
Notes2019
$m2018
$m
Current tax 111.6 157.3Deferred tax 12 188.6 (10.1)
Under (over) provided in prior years (1.5) 0.9
298.7 148.1
(b) Reconciliation of income tax expense to prima facie tax payable
(Loss)/profit before income tax expense (1.0) 452.0Tax at the Australian tax rate of 30% (2018: 30%) (0.3) 135.6Tax effect of amounts not deductible (taxable) in calculating taxable income:
Research and development credit (1.3) (0.7)Deferred tax losses not recognised by other overseas operations 4.1 1.3Recognition of historical alternative minimum tax (AMT) credits (7.2) -Deferred tax balances derecognised by Sierra Rutile Limited 161.9 -Tax benefit not recognised by Sierra Rutile Limited¹ 131.4 -SRL minimum tax (3.5% of revenue) 9.2 7.4Non-deductible expenses 1.7 2.1
Other items (1.3) 1.5
298.2 147.2
Difference in overseas tax rates 2.0 -
Under provision in prior years (1.5) 0.9
Income tax expense (benefit) 298.7 148.1
(297.7) (600.1)¹Sierra Rutile Limited could not recognise a tax benefit associated with the write-down of $414.3 million of assetsexpensed in the current year.
104
NOTES TO FINANCIAL STATEMENTSFor the year ended 31 December 2019
For
per
sona
l use
onl
y

Iluka Resources Limited, Annual Report 2019 105
ILUKA RESOURCES LIMITED31 DECEMBER 2019
No tax benefits have been recognised in respect of exploration activities of overseas operations as their recoveryis not currently considered probable.
The idling of the US operations at the end of 2015 means that the recovery of US state tax losses are notconsidered probable. Unrecognised US state tax losses for which no deferred tax asset has been recognised areUS$ 216.3 million at 31 December 2019 (31 December 2018: US$193.4 million).
Unused capital losses for which no deferred tax asset has been recognised are approximately $90.7 million(2018: $92.7 million) (tax at the Australian rate of 30%: $27.2 million (2018: $27.9 million)). The benefit of theseunused capital losses will only be obtained if sufficient future capital gains are made and the losses remainavailable under tax legislation.
The write-down of Sierra Rutile Limited means that the recovery of Sierra Leone tax losses are not consideredprobable. Unrecognised Sierra Leone tax losses for which no deferred tax asset has been recognised areUS$500.7 million at 31 December 2019.
(c) Tax expense relating to items of other comprehensive income2019
$m2018
$m
Hedge of net investments in foreign operations (1.1) (0.9)Changes in fair value of foreign exchange cash flow hedges (2.0) (3.4)
Actuarial gains (losses) on retirement benefit obligation (1.7) 0.2
(4.8) (4.1)
The income tax expense or benefit for the period is the tax payable on the current period’s taxable income basedon the applicable income tax rate for each jurisdiction adjusted by changes in deferred tax assets and liabilitiesattributable to temporary differences and to unused tax losses. The current tax charge is calculated using the taxrates and tax laws enacted or substantively enacted at the reporting date in the countries where the Groupoperates and generates taxable income.
Key estimate: Tax balances
Tax balances are based on management's best estimate and interpretation of the tax legislation in a number ofjurisdictions. This treatment can be subject to changes due to modification to legislation or differences ininterpretation by authorities. Where the amount of tax payable or recoverable includes some uncertainty, theGroup recognises amounts based on management’s best estimate of the most likely outcome.
105
NOTES TO FINANCIAL STATEMENTSFor the year ended 31 December 2019
For
per
sona
l use
onl
y

Iluka Resources Limited, Annual Report 2019106
ILUKA RESOURCES LIMITED31 DECEMBER 2019
12 DEFERRED TAX
2019$m
2018$m
Deferred tax asset:The balance comprises temporary differences attributable to:Tax losses - 209.3Employee provisions 7.4 6.9Provisions 149.3 160.2Cash flow hedge reserve (in equity) 2.1 4.3Other 8.0 8.3
Lease liabilities 8.9 -
Gross deferred tax assets 175.7 389.0
Amount offset to deferred tax liabilities pursuant to set-off provision (153.6) (173.4)
Net deferred tax assets 22.1 215.6
Deferred tax liability:The balance comprises temporary differences attributable to:Property, plant and equipment (119.2) (153.9)Inventory (18.1) (12.9)Receivables (6.7) (4.4)Treasury shares (in equity) (1.2) (1.9)Other (0.1) (0.4)
Right of use assets (8.3) -
Gross deferred tax liabilities (153.6) (173.5)
Amount offset to deferred tax assets pursuant to set-off provision 153.6 173.5
Net deferred tax liabilities - -
Movements in net deferred tax balance:Balance at 1 January 215.6 185.9(Charged)/credited to the income statement (188.6) 10.1Under provision in prior years (7.0) (2.2)
Charged directly to equity 2.1 21.8
Balance at 31 December 22.1 215.6
Deferred tax policy
Deferred income tax is provided on all temporary differences at the balance sheet date between accountingcarrying amounts and the tax bases of assets and liabilities.
Deferred income tax liabilities are recognised for all taxable temporary differences, other than for the exemptionspermitted under accounting standards.
Deferred income tax assets are recognised for all deductible temporary differences, carry-forward of unused taxassets and unused tax losses, to the extent it is probable that taxable profit will be available to utilise thesedeductible temporary differences, other than for the exemptions permitted under accounting standards. Thecarrying amount of deferred income tax assets is reviewed at each balance sheet date and reduced to the extentthat it is no longer probable that sufficient taxable profit will be available to allow all or part of the deferredincome tax asset to be utilised.
106
NOTES TO FINANCIAL STATEMENTSFor the year ended 31 December 2019
For
per
sona
l use
onl
y

Iluka Resources Limited, Annual Report 2019 107
ILUKA RESOURCES LIMITED31 DECEMBER 2019
Deferred income tax assets and liabilities are measured at the tax rates that are expected to apply to the yearwhen the asset is realised or the liability is settled, based on tax rates (and tax laws) that have been enacted orsubstantively enacted at the balance sheet date.
Income taxes relating to items recognised directly in equity are also recognised in equity and not in the incomestatement.
Deferred tax assets and deferred tax liabilities are offset only if a legally enforceable right exists to set off currenttax assets against current tax liabilities and the deferred tax assets and liabilities relate to the same taxableentity and the same taxation authority.
Deferred tax recognised
During the reporting period, the carried forward tax losses for Sierra Rutile Limited were derecognised resulting inan income tax expense of $161.9 million. As at 31 December 2019, there were $nil million of carried forward taxlosses recognised by SRL (2018: $209.3 million).
Key estimate: Deferred tax asset recognition
Deferred tax assets are based on tax laws (and tax rates) that have been enacted or substantively enacted atthe balance sheet date.
Deferred tax assets have been recognised to the extent that their recovery is probable, having regard to theavailability of sufficient taxable temporary differences relating to the same tax authority and the same taxableentity, the projected future taxable income of these taxable entities and after taking account of specific riskfactors that are expected to affect the recovery of these assets.
13 RECEIVABLES
2019$m
2018$m
Trade receivables 130.9 114.4Mining Area C royalty receivable 20.2 13.6Other receivables 29.3 26.7
Prepayments 15.9 7.9
196.3 162.6
Trade receivables are recognised initially at the value of the invoice sent to the customer and subsequently at theamount considered recoverable, translated using the spot exchange rate at balance date with translationdifferences accounted for in line with the Group's accounting policy (refer note 2). Recognition occurs at theearlier of dispatch or formal acknowledgement of legal ownership by a customer, as this is the point in time thatthe consideration is unconditional because only the passage of time is required before payment is due. Tradereceivables are generally due within 41 days of the invoice being issued (2018: 45 days).
Collectability of trade receivables is reviewed on an ongoing basis. Debts which are known to be uncollectible arewritten off. A provision for doubtful receivables is established based on the expected credit loss approach.Expected credit losses for the Group’s trade receivables are reviewed on an ongoing basis based on groups ofreceivables with shared risk characteristics.
There was $9.4 million overdue at balance date (2018: $1.7 million), of which $3.6 million are less than 28 daysoverdue (2018: $1.4 million). Due to the short-term nature of the Group’s receivables, their carrying value isconsidered to approximate fair value.
107
NOTES TO FINANCIAL STATEMENTSFor the year ended 31 December 2019
For
per
sona
l use
onl
y

Iluka Resources Limited, Annual Report 2019108
ILUKA RESOURCES LIMITED31 DECEMBER 2019
(a) Trade receivables purchase facilities
Iluka has a trade receivables purchase facility for the sale of eligible trade receivables. Under the agreement Ilukatransfers the majority of the risks and rewards of ownership, including credit risk (subject to a maximum firstloss).
Iluka maintains an insurance policy to assist in managing the credit risk of its customers. The credit insurancepolicy is a separate instrument to the receivables and reduces the exposure to credit risk. The trade receivablesbalance of $130.9 million excludes $117.3 million (31 December 2018: excludes $70.6 million) of receivablessold under the trade receivables purchase facility. Iluka has assigned a portion of the insurance policy to thesupplier of the trade receivables purchase facility but retains credit risk up to a maximum loss of $16.7 million(2018: $11.5 million). An asset for the loss amount has been recognised within other receivables offset by acorresponding continuing involvement liability in payables.
(b) Credit risk
At 31 December 2019 the trade receivables balance was $130.9 million, with $112.3 million covered by credit riskinsurance and a further $18.6 million by letters of credit. As a result, the Group had no uninsured receivables atthe reporting date (2018: $nil).
14 INVENTORIES
2019$m
2018$m
CurrentWork in progress 110.5 139.3Finished goods 208.7 178.9Consumable stores 21.9 68.9-0.1 CR (0.1) -
Total current inventories 341.1 387.1
Non-current
Work in progress 84.1 4.6
Total non-current inventories 84.1 4.6
Inventories are valued at the lower of weighted average cost and estimated net realisable value. The netrealisable value is the estimated selling price in the normal course of business, less any anticipated costs ofcompletion and the estimated costs to sell, including royalties.
There are separate inventory stockpile values for each product, including Heavy Mineral Concentrate (HMC) andother intermediate products, at each inventory location.
Weighted average cost includes direct costs and an appropriate portion of fixed and variable overheadexpenditure, including depreciation and amortisation. As a result of mineral sands being co-products from thesame mineral separation process, costs are allocated to inventory on the basis of the relative sales value of thefinished goods produced. No cost is attributed to by-products, except direct costs.
Finished goods inventory of $nil million (2018: $2.0 million) is carried at net realisable value, with all otherproduct inventory carried at cost.
Consumable stores include ilmenite acquired from third parties, flocculant, coal, diesel and warehouse stores. Aregular and ongoing review is undertaken to establish the extent of surplus, obsolete or damaged stores, whichare then valued at estimated net realisable value.
Inventories expected to be sold (or consumed in the case of stores) within 12 months after the balance sheetdate are classified as current assets; all other inventories are classified as non-current assets.
108
NOTES TO FINANCIAL STATEMENTSFor the year ended 31 December 2019
For
per
sona
l use
onl
y

Iluka Resources Limited, Annual Report 2019 109
ILUKA RESOURCES LIMITED31 DECEMBER 2019
Key estimate: Net realisable value and classification of product inventory
The Group’s assessment of the net realisable value and classification of its inventory holdings requires the useof estimates, including the estimation of the relevant future product price and the likely timing of the sale of theinventory.
During the year, inventory write-downs of $41.8 million occurred for work in progress or finished goods (2018:$11.4 million). Of this amount, $39.1 million is due to the write-down of inventory to its net realisable value dueto the write-down of Sierra Rutile Limited. If finished goods future selling prices were 5% lower than expected,no inventory write-down would be required at 31 December 2019 (2018: no write-down).
Inventory of $84.1 million (2018: $4.6 million) was classified as non-current as it is not expected to be soldwithin 12 months of the balance sheet date.
CAPITAL
15 NET CASH/(DEBT) AND FINANCE COSTS
2019$m
2018$m
Cash and cash equivalents
Cash at bank and in hand 97.3 51.3
Total cash and cash equivalents 97.3 51.3
Non-current interest-bearing liabilities (unsecured)Multi Optional Facility Agreement (55.7) (50.4)
Deferred borrowing costs 1.7 0.9
Total interest-bearing liabilities (54.0) (49.5)
Net cash 43.3 1.8
(a) Cash and cash equivalents
Cash and cash equivalents include cash on hand and deposits held at call with financial institutions with originalmaturities of three months or less.
Cash and deposits are at floating interest rates between 0.0% and 2.7% (2018: 0.0% and 2.5%) on Australian andforeign currency denominated deposits.
(b) Interest-bearing liabilities
Interest-bearing liabilities are initially recognised at fair value less directly attributable transaction costs, withsubsequent measurement at amortised cost using the effective interest rate method. Under the amortised costmethod the difference between the amount initially recognised and the redemption amount is recognised in profitor loss over the period of the borrowings on an effective interest basis.
Interest-bearing liabilities are classified as current liabilities unless the Group has an unconditional right to defersettlement for at least 12 months after the balance sheet date.
(i) Multi Optional Facility Agreement
The Multi Optional Facility Agreement (MOFA) comprises a series of unsecured five year bilateral revolving creditfacilities with several domestic and foreign institutions, totalling A$519.3 million (2018: A$618.3 million).
109
NOTES TO FINANCIAL STATEMENTSFor the year ended 31 December 2019
For
per
sona
l use
onl
y

Iluka Resources Limited, Annual Report 2019110
ILUKA RESOURCES LIMITED31 DECEMBER 2019
The table below details the facility expiries:
A$millionTotal
facilityFacility Expiry
2020 2021 2022 2023 2024
At 31 December 2019 519.3 - - - - 519.3
At 31 December 2018 618.3 77.1 - 541.2 - -
Undrawn MOFA facilities at 31 December 2019 were A$463.6 million (2018: A$567.9 million).
(c) Interest rate exposure
Of the above interest-bearing liabilities, $55.7 million is subject to an effective weighted average floating interestrate of 3.1% (2018: interest-bearing liabilities of $50.4 million at 4.2%). The contractual repricing date of all of thefloating rate interest-bearing liabilities at the balance date is within one year.
(d) Finance costs
2019$m
2018$m
Interest charges on interest-bearing liabilities 7.3 7.2Bank fees and similar charges 5.0 6.2Amortisation of deferred borrowing costs 1.2 1.6Lease borrowing costs 1.5 -Rehabilitation and mine closure provision discount unwind 19.7 16.7Rehabilitation provision discount rate changes 18.3 -+0.1 DR - 0.1
Total finance costs 53.0 31.7
(i) Amortisation of deferred borrowing costs
Fees paid on establishment of borrowing facilities are recognised as transaction costs and amortised over theperiod until the next expected facility extension. During the current reporting period, $2.0 million in transactioncosts associated with the extension of the MOFA were incurred and capitalised (2018: $nil) and $0.6 million ofpreviously capitalised costs were written off (2018: $nil).
(ii) Rehabilitation and mine closure provision discount unwind
Rehabilitation and mine closure unwind represents the cost associated with the passage of time. Rehabilitationprovisions are recognised as the discounted value of the present obligation to restore, dismantle and rehabilitatewith the increase in the provision due to passage of time being recognised as a finance cost in accordance withthe policy described in note 8(a).
Any change in the discount rate for closed sites is recorded as a finance cost. Refer to note 8(a) for furtherdetails.
110
NOTES TO FINANCIAL STATEMENTSFor the year ended 31 December 2019
For
per
sona
l use
onl
y

Iluka Resources Limited, Annual Report 2019 111
ILUKA RESOURCES LIMITED31 DECEMBER 2019
16 CONTRIBUTED EQUITY
(a) Share capital
2019Shares
2018Shares
2019$m
2018$m
Ordinary shares - fully paid 422,584,778 422,395,677 1,160.4 1,158.6
Treasury shares - net of tax (470,456) (675,521) (2.8) (4.6)
422,114,322 421,720,156 1,157.6 1,154.0
Ordinary shares entitle the holder to participate in dividends and the proceeds on winding up of the Company inproportion to the number of and amounts paid on the shares held. On a show of hands, every holder of ordinaryshares present at a meeting in person or by proxy is entitled to one vote, and upon a poll each share is entitled toone vote. Incremental costs directly attributable to the issue of new shares or options are shown in equity as adeduction, net of tax, from the proceeds.
Movements in ordinary share capital
The Group issues ordinary shares to shareholders who elect to receive shares instead of cash dividends as partof the Dividend Reinvestment Plan (DRP), the terms of which are detailed in the ASX announcement dated 27February 2018. During the year, the Group issued the following shares under the DRP:
Date issued Price per shareNumber of ordinary
shares issuedspace2018 final 4 April 2019 $8.86 103,439
2019 interim 2 October 2019 $7.57 85,662
189,101
(b) Treasury shares
Treasury shares are shares in Iluka Resources Limited acquired on market and held for the purpose of issuingshares under the Directors, Executives and Employees Share Acquisition Plan and the Employee Share Plan.
Number ofshares $m
Opening balance at 1 January 2018 53,218 0.3Acquisition of shares by the Trust 1,246,312 8.9
Employee share issues, net of tax (624,009) (4.6)
Balance at 31 December 2018 675,521 4.6
Acquisition of shares by the Trust 992,972 6.2
Employee share issues, net of tax (1,198,037) (8.0)
Balance at 31 December 2019 470,456 2.8
111
NOTES TO FINANCIAL STATEMENTSFor the year ended 31 December 2019
For
per
sona
l use
onl
y

Iluka Resources Limited, Annual Report 2019112
ILUKA RESOURCES LIMITED31 DECEMBER 2019
17 RESERVES AND RETAINED EARNINGS
Notes2019
$m2018
$m
Asset revaluation reserveBalance at 1 January 11.4 11.8
Transfer to retained earnings on disposal (0.1) (0.4)
Balance at 31 December 17(a) 11.3 11.4
blankHedge reserveBalance at 1 January (10.1) (2.2)Deferred costs of hedging 0.4 (14.4)Changes in the fair value of hedging instruments recognised in equity 3.6 (5.4)Reclassified to profit or loss 2.8 8.5
Deferred tax (1.5) 3.4
Balance 31 December 17(b) (4.8) (10.1)
blankShare-based payments reserveBalance at 1 January 2.3 1.9Transfer of shares to employees, net of tax (8.0) (4.6)
Share-based payments, net of tax 5.9 5.0
Balance at 31 December 17(c) 0.2 2.3
blankForeign currency translationBalance at 1 January 39.0 (2.1)Currency translation of US operation 21(a) (1.0) (15.7)Currency translation of Sierra Rutile 4.0 59.7Translation differences on other foreign operations (0.3) (0.8)Hedge of net investment in Sierra Rutile (3.6) (3.0)
Deferred tax 1.0 0.9
Balance at 31 December 17(d) 39.1 39.0
blankOther reservesGain on part disposal of investment in subsidiary 6.7 -
Loss on initial recognition of put option (28.5) -
Balance at 31 December 17(e) (21.8) -
blank
Total reserves 24.0 42.6
blank
Retained earningsBalance at 1 January (86.6) (243.6)Adjustment on adoption of AASB 15 (net of tax) - (0.6)Net profit/(loss) for the period (279.9) 303.9Dividends paid (101.5) (146.9)Actuarial gains/(losses) on retirement benefit obligation, net of tax (3.9) 0.6-0.1 CR
(0.1) -
Balance at 31 December (472.0) (86.6)
112
NOTES TO FINANCIAL STATEMENTSFor the year ended 31 December 2019
For
per
sona
l use
onl
y

Iluka Resources Limited, Annual Report 2019 113
ILUKA RESOURCES LIMITED31 DECEMBER 2019
(a) Asset revaluation reserve
The asset revaluation reserve records revaluations of non-current assets prior to the adoption of AIFRS.Transfers are made to retained earnings on disposal of previously revalued assets.
(b) Hedge reserve
Iluka uses two types of hedging instruments as part of its foreign currency risk management strategy associatedwith its US denominated sales, as described in note 21. These include foreign currency forward contracts andforeign currency collars, both of which are designated in cash flow hedge relationships. To the extent thesehedges are effective, the change in fair value of the hedging instrument is recognised in the cash flow hedgereserve.
(c) Share-based payments reserve
The employee share-based payments reserve is used to recognise the fair value of equity instruments grantedbut not yet issued to employees under the Group's various equity-based incentive schemes. Shares issued toemployees are acquired on-market prior to the issue. Shares not yet issued to employees are shown as treasuryshares. When shares are issued to employees the cost of the on-market acquisition, net of tax, is transferredfrom treasury shares (refer note 16) to the share-based payment reserve.
(d) Foreign currency translation reserve
Exchange differences arising on translation of the net investment in foreign operations, including US dollardenominated debt used as a hedge of the net investment, are taken into the foreign currency translation reservenet of applicable income tax, as described in note 2(b). At 31 December 2019, US$nil was designated as a hedgeof the net investment in Sierra Rutile Limited (2018: US$nil million). The reserve is recognised in profit or losswhen the net investment is disposed of.
(e) Other reserves
The impact on equity of transactions related to changes in the structure of the Group are accumulated in otherreserves. As detailed in note 22, the Group recognised a gain on partial disposal of its investment in SRL of $6.7million, and a loss on initial recognition of the related put option held by the IFC of $28.5 million against otherreserves in equity.
113
NOTES TO FINANCIAL STATEMENTSFor the year ended 31 December 2019
For
per
sona
l use
onl
y

Iluka Resources Limited, Annual Report 2019114
ILUKA RESOURCES LIMITED31 DECEMBER 2019
18 DIVIDENDS
2019$m
2018$m
Final dividendfor 2018 of 19 cents per share, fully franked 80.3 -
for 2017 of 25 cents per share, fully franked - 104.7
80.3 104.7
Interim dividendfor 2019 of 5 cents per share, fully franked 21.1 -
for 2018 of 10 cents per share, fully franked - 42.2
Total dividends 101.5 146.9
Of the total $21.1 million interim dividend declared for 2019 and the total $80.3 million final dividend declared for2018, shareholders respectively took up $0.6 million and $0.9 million as ordinary shares as part of the DividendReinvestment Plan. Refer to note 16(a).
Since balance date the directors have determined a final dividend for 2019 of 8 cents per share, fully franked. Thedividend is payable on 2 April 2020 for shareholders on the register as at 6 March 2020. The aggregate amountof the proposed dividend is $33.8 million, which has not been included in provisions at balance sheet date as itwas not declared on or before the end of the financial year.
Franking credits
The balance of franking credits available as at 31 December 2019 is $129.2 million (2018: $27.9 million). Thisbalance is based on a tax rate of 30% (2018: 30%).
19 PROFIT/(LOSS) PER SHARE
2019Cents
2018Cents
Basic (loss)/profit per share (cents) (71.0) 72.2
Diluted (loss)/profit per share (cents) (71.0) 71.8
Earnings/(loss) per share (EPS) is the amount of post-tax earnings or loss attributable to each share.
Basic EPS is calculated on the loss for the period attributable to equity owners of the parent of $299.7 million(2018: profit of of $303.9 million) divided by the weighted average number of shares on issue during the year,excluding treasury shares, being 422,146,281 shares (2018: 420,797,114 shares).
Diluted EPS takes into account the dilutive effect of all outstanding share rights vesting as ordinary shares. Theweighted average share rights outstanding were not dilutive in 2019 as they would reduce the loss per share andtherefore were not included in the calculation of diluted EPS in the current period.
114
NOTES TO FINANCIAL STATEMENTSFor the year ended 31 December 2019
For
per
sona
l use
onl
y

Iluka Resources Limited, Annual Report 2019 115
ILUKA RESOURCES LIMITED31 DECEMBER 2019
RISK
20 FINANCIAL RISK MANAGEMENT
The Group's activities expose it to a variety of financial risks: market risk (including currency risk and interest raterisk), credit risk and liquidity risk. The Group's overall risk management program focuses on the unpredictabilityof financial markets and seeks to minimise potential adverse effects on the financial performance of the Group.Financial risk management is managed by a central treasury department under policies approved by the Board.
(a) Market risk
Market risk is the risk that changes in market prices such as foreign exchange rates and interest rates will affectthe Group’s income or value of its holdings of financial instruments.
(i) Foreign exchange risk
The Group operates internationally and is exposed to foreign exchange risk arising predominantly from the USdollar, which is the currency the Group’s sales are generally denominated in.
The Group has operations in Sierra Leone and rehabilitation obligations in the US, which both have a USDfunctional currency. The balance sheet translation risk is managed by designating, to the extent possible, aportion of the Group’s borrowings in US dollars as a hedge against the net US dollar investment in the SierraRutile operation (with associated translation differences taken to the foreign currency translation reserve inequity).
Net US dollar-denominated working capital and cash balances act as a ‘natural’ hedge against movements in USdollar receivables from Australian sales (with associated translation differences taken to profit or loss).
Foreign exchange risk is also managed through entering into forward foreign exchange contracts and collarcontracts detailed in note 21.
The treasury function of the Group manages foreign currency risk centrally. The Group hedges foreign exchangeexposures for firm commitments relating to a portion of sales, where the hedging instrument must be in thesame currency as the hedged item.
The objective of Iluka’s policy on foreign exchange hedging is to protect the Group from adverse currencyfluctuations.
The Group's exposure to USD foreign currency risk (by entities which have an Australian dollar functionalcurrency) at the end of the reporting period, expressed in Australian dollars, was as follows:
2019 2018$m $m
Cash and cash equivalents 45.0 9.0Receivables 75.4 59.4Payables (21.0) (16.7)Interest-bearing liabilities (55.7) (50.4)
Derivative financial instruments (33.7) (7.3)
10.0 (6.0)
The Group's balance sheet exposure to other foreign currency risk is not significant.
115
NOTES TO FINANCIAL STATEMENTSFor the year ended 31 December 2019
For
per
sona
l use
onl
y
Iluka Resources Limited, Annual Report 2019116
ILUKA RESOURCES LIMITED31 DECEMBER 2019
(ii) Group sensitivity
The average US dollar exchange rate during the year was 0.6950 (2018: 0.7479). The US dollar spot rate at 31December 2019 was 0.7000 (31 December 2018: 0.7050). Based on the Group's net financial assets at 31December 2019, the following table demonstrates the estimated sensitivity to a -/+ 10% movement in the USdollar spot exchange rate, with all other variables held constant, on the Group's post-tax profit (loss) for the yearand equity:
-10% +10%Strengthen Weaken
Profit (loss) Equity Profit (loss) Equity$m $m $m $m
31 December 2019 0.3 (29.7) (0.2) 18.131 December 2018 0.4 (37.1) 0.2 24.5
(iii) Interest rate risk
Interest rate risk arises from the Group’s borrowings and cash deposits. During 2019 and 2018, the Group'sborrowings at variable rates were denominated in Australian dollars and US dollars. At 31 December 2019, ifvariable interest rates for the full year were -/+ 1% from the year-end rate with all other variables held constant,pre-tax profit for the year would have moved as per the table below.
+1% -1%$m $m
31 December 2019 0.6 (0.6)31 December 2018 0.5 (0.5)
The sensitivity is calculated using the average debt position for the year ended 31 December 2019. The interestcharges in note 15(d) of $7.3 million (2018: $7.2 million) reflect interest-bearing liabilities in 2019 that rangebetween $40.1 million and $191.4 million (2018: $38.4 million and $236.1 million).
(b) Credit risk
Credit risk arises from cash and cash equivalents and hedging instruments held with financial institutions, as wellas credit exposure to customers.
The Group has policies in place to ensure that credit sales are only made to customers with an appropriate credithistory. The Group also maintains an insurance policy and makes use of letters of credit to assist in managingthe credit risk of its customers. Further details are set out in note 13.
Derivative counterparties and cash transactions are limited to high credit quality financial institutions andpolicies limit the amount of credit exposure to any one financial institution.
The Group's policy is to ensure that cash deposits are held with counterparties with a minimum A-/A3 creditrating. Credit exposure limits are approved by the Board based on credit ratings from external ratings agencies.
(c) Liquidity risk
Liquidity risk is the risk the Group will not be able to meet its financial obligations as they fall due. Liquidity riskmanagement involves maintaining sufficient cash on hand or undrawn credit facilities to meet the operatingrequirements of the business. This is managed through committed undrawn facilities under the MOFA (refer note15(b)(i)) of $463.6 million at balance date as well as cash and cash equivalents of $97.3 million and prudent cashflow management.
116
NOTES TO FINANCIAL STATEMENTSFor the year ended 31 December 2019
For
per
sona
l use
onl
y
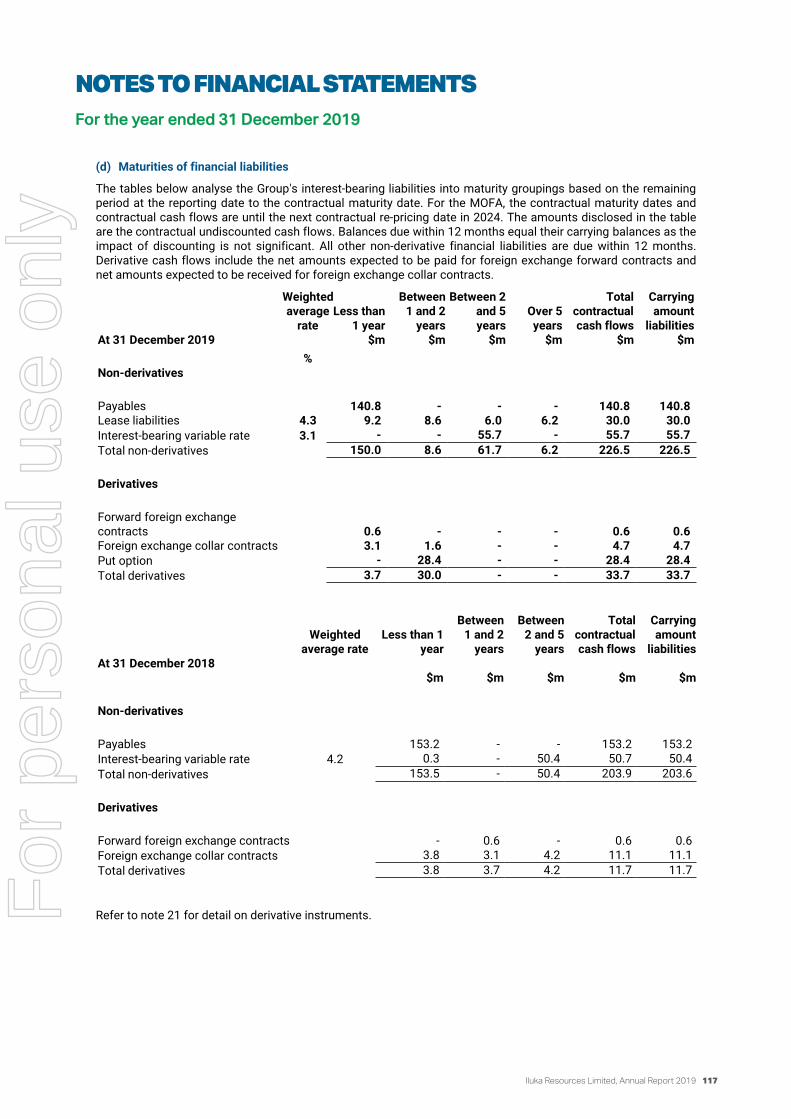
Iluka Resources Limited, Annual Report 2019 117
ILUKA RESOURCES LIMITED31 DECEMBER 2019
(d) Maturities of financial liabilities
The tables below analyse the Group's interest-bearing liabilities into maturity groupings based on the remainingperiod at the reporting date to the contractual maturity date. For the MOFA, the contractual maturity dates andcontractual cash flows are until the next contractual re-pricing date in 2024. The amounts disclosed in the tableare the contractual undiscounted cash flows. Balances due within 12 months equal their carrying balances as theimpact of discounting is not significant. All other non-derivative financial liabilities are due within 12 months.Derivative cash flows include the net amounts expected to be paid for foreign exchange forward contracts andnet amounts expected to be received for foreign exchange collar contracts.
Weightedaverage
rateLess than
1 year
Between1 and 2
years
Between 2and 5years
Over 5years
Totalcontractualcash flows
Carryingamount
liabilitiesAt 31 December 2019
%
$m $m $m $m $m $m
Non-derivatives
Payables 140.8 - - - 140.8 140.8Lease liabilities 4.3 9.2 8.6 6.0 6.2 30.0 30.0
Interest-bearing variable rate 3.1 - - 55.7 - 55.7 55.7
Total non-derivatives 150.0 8.6 61.7 6.2 226.5 226.5
Derivatives
Forward foreign exchangecontracts 0.6 - - - 0.6 0.6Foreign exchange collar contracts 3.1 1.6 - - 4.7 4.7
Put option - 28.4 - - 28.4 28.4
Total derivatives 3.7 30.0 - - 33.7 33.7
Weightedaverage rate
Less than 1year
Between1 and 2
years
Between2 and 5
years
Totalcontractualcash flows
Carryingamount
liabilitiesAt 31 December 2018
$m $m $m $m $m
Non-derivatives
Payables 153.2 - - 153.2 153.2
Interest-bearing variable rate 4.2 0.3 - 50.4 50.7 50.4
Total non-derivatives 153.5 - 50.4 203.9 203.6
Derivatives
Forward foreign exchange contracts - 0.6 - 0.6 0.6
Foreign exchange collar contracts 3.8 3.1 4.2 11.1 11.1
Total derivatives 3.8 3.7 4.2 11.7 11.7
Refer to note 21 for detail on derivative instruments.
117
NOTES TO FINANCIAL STATEMENTSFor the year ended 31 December 2019
For
per
sona
l use
onl
y

Iluka Resources Limited, Annual Report 2019118
ILUKA RESOURCES LIMITED31 DECEMBER 2019
21 HEDGING
2019$m
2018$m
Current liabilitiesForeign exchange collar hedges 3.1 3.8
Foreign exchange forward contracts 0.6 0.6
3.7 4.4
Non-current liabilities
Foreign exchange collar hedges 1.6 7.3
The Group is exposed to risk from movements in foreign exchange in relation to its forecast US dollardenominated sales and as part of the risk management strategy has entered into foreign exchange forwardcontracts and foreign exchange collar contracts.
(a) Recognition
Derivatives are initially recognised at fair value on the date a derivative contract is entered into and aresubsequently re-measured to their fair value at the end of each reporting period. The accounting for subsequentchanges in fair value depends on whether the derivative is designated as a hedging instrument and, if so, thenature of the item being hedged and the type of hedge relationship designated.
(b) Fair value of derivatives
Derivative financial instruments are the only assets and liabilities measured and recognised at fair value at 31December 2019 and 31 December 2018. The fair value of these instruments is determined using valuationtechniques with inputs that are observable market data (a level 2 measurement). The valuation of forwardcontracts is determined using forward exchange rates at the balance date. The valuation of the options makingup the collars is determined using forward foreign exchange rates, volatilities and interest rates at the balancedate. The only unobservable input used in the calculations is the credit default rate, movements in which wouldnot have a material effect on the valuation.
(c) Hedge accounting
At the start of a hedge relationship, the Group formally designates and documents the hedge relationship,including the risk management strategy for undertaking the hedge. This includes identification of the hedginginstrument, the hedged item or transaction, the nature of the risk being hedged and how the entity will assess thehedging instrument’s effectiveness. Hedge accounting is only applied where effective tests are met on aprospective basis.
Iluka will discontinue hedge accounting prospectively only when the hedging relationship, or part of the hedgingrelationship, no longer qualifies for hedge accounting. This includes where there has been a change to the riskmanagement objective and strategy for undertaking the hedge and instances when the hedging instrumentexpires or is sold, terminated or exercised. The replacement or rollover of a hedging instrument into anotherhedging instrument is not treated as an expiration or termination if such a replacement or rollover is consistentwith our documented risk management objective.
The foreign exchange forward contracts and foreign exchange collars Iluka holds are classified as cash flowhedges. Hedges are classified as cash flow hedges when they hedge a particular risk associated with the cashflows of recognised assets and liabilities and highly probable forecast transactions.
118
NOTES TO FINANCIAL STATEMENTSFor the year ended 31 December 2019
For
per
sona
l use
onl
y

Iluka Resources Limited, Annual Report 2019 119
ILUKA RESOURCES LIMITED31 DECEMBER 2019
Cash flow hedges
For cash flow hedges, the portion of the gain or loss on the hedging instrument that is effective is recogniseddirectly in equity, while the ineffective portion is recognised in profit or loss. The ineffective portion wasimmaterial in the current and prior periods. The maturity profile of these hedges is shown in note 20(d). Therecognition of the future gain or loss is expected to be consistent with this timing.
The following contracts in relation expected USD revenue, predominantly from contracted sales to 31 December2022, remain open at the reporting date:
• foreign exchange forward contracts covering US$63.6 million at a weighted average rate of 70.7 cents,including US$32 million of new foreign exchange forward contracts entered into during the year with aweighted average rate of 69.3 cents (31 December 2018: US$31.6 million at a weighted average rate of 72.1cents); and
• foreign exchange collar hedges covering US$193.1 million of expected USD revenue to 31 December 2022.The collars comprise US$193.1 million worth of purchased AUD call options with a weighted average strikeprice of 78.5 cents and US$193.1 million of AUD put options at a strike price of 68.6 cents.
The period above corresponds with the long-term sales contracts entered into in 2017 including those in supportof the development of the Cataby project. However, the hedged USD revenues do not represent the full value ofexpected sales under these contracts over this period.
US$118 million in foreign exchange collar contracts consisting of US$118 million of bought AUD call options withweighted average strike prices of 80.5 cents and US$118 million of sold AUD put options with weighted averagestrike prices of 70.0 cents expired during the year. No foreign exchange forward contracts expired during theyear.
Amounts recognised in equity are transferred to the income statement when the hedged sale occurs or when thehedging instrument is exercised.
If the forecast transaction is no longer expected to occur, amounts previously recognised in equity aretransferred to the income statement. If the hedging instrument expires or is sold, terminated or exercised withoutreplacement or roll over, or if its designation as a hedge is revoked, amounts previously recognised in equityremain in equity until the forecast transaction occurs.
Net investment hedge
The Group also designates US denominated debt as a hedge against the Group's net investment in Sierra Leone,which has a US dollar functional currency. During the period the Group's net investment hedge resulted in theforeign currency translation reserve being reduced by $2.6 million (2018: $2.1 million reserve reduction).
119
NOTES TO FINANCIAL STATEMENTSFor the year ended 31 December 2019
For
per
sona
l use
onl
y

Iluka Resources Limited, Annual Report 2019120
ILUKA RESOURCES LIMITED31 DECEMBER 2019
GROUP STRUCTURE
22 CHANGES IN OWNERSHIP INTERESTS HELD IN CONTROLLED ENTITIES
On 21 February 2019, the Group announced the potential for the International Finance Corporation (IFC), amember of the World Bank Group, to acquire a 10% equity interest in Sierra Rutile Limited (SRL), therebycommencing a strategic partnership in relation to the Group’s Sierra Rutile operation.
The transaction was subject to the completion of due diligence and necessary approvals being obtained, asdisclosed in note 23(a) of the 2018 annual report.
Upon completion of the above prerequisites, agreements to effect the transaction were finalised. The key termsthereof are summarised in the ASX announcement released on 6 June 2019, being:
• IFC will be issued new shares in Iluka Investments (BVI) Limited, the holding company of Sierra RutileLimited.
• IFC acquires their 10% equity interest in two tranches, with the first being the acquisition of 3.57% forUS$20 million on 6 June 2019. Acquisition of the second tranche will occur upon approval ofconstruction of early works on the Sembehun project. If approval is not obtained, then IFC may elect toacquire the second tranche regardless.
• The Group enters into an arrangement whereby IFC has the right to dispose of their interest back to theGroup at its fair value on date of exercise of the put. The put becomes exercisable after three years if theSembehun early works are not approved, alternatively the put is exercisable after seven years.
As advised on 17 December 2019, the terms and timing of the second tranche of this investment will likely besubject to renegotiation given the delay in approval of the Sembehun project.
(i) Non-controlling interest
The first tranche of the transaction was effected on 6 June 2019. The Group recognised a non-controlling interestof $21.8 million on this date, representing IFC's 3.57% share in the net assets of SRL. The Group received $28.5million (US$20 million) in cash consideration for the equity interest, with the resulting gain of $6.7 millionrecognised in other reserves in equity.
Subsequently, an amount of $19.8 million has been charged to the non-controlling interest, representing the IFC'sshare in the after tax losses of the Iluka Investments (BVI) group from the transaction date until the reportingdate, predominantly reflecting the impairment of the Sierra Rutile operations.
(ii) Put option held by the IFC
The Group also recognised a financial liability at its fair value on 6 June 2019 of $28.5 million against otherreserves in equity.
Subsequently, the Group translated the put option carrying value to Australian dollars at the spot rate applicableon the reporting date, with the resulting foreign exchange translation gain of $0.1 million recognised in profit orloss.
The fair value of the put option was determined based on a significant unobservable input, and accordingly it isclassified as level 3 in the fair value hierarchy. The significant unobservable input is the estimated settlementamount, which is based on the issue price of the interest held by the IFC.
120
NOTES TO FINANCIAL STATEMENTSFor the year ended 31 December 2019
For
per
sona
l use
onl
y

Iluka Resources Limited, Annual Report 2019 121
ILUKA RESOURCES LIMITED31 DECEMBER 2019
23 CONTROLLED ENTITIES AND DEED OF CROSS GUARANTEE
The consolidated financial statements incorporate the following subsidiaries:
Country of Equity holdingControlled entities incorporation 2019 2018
% %* Iluka Resources Limited (Parent Company) Australia* Westlime (WA) Limited Australia 100 100* Ilmenite Proprietary Limited Australia 100 100* Southwest Properties Pty Ltd Australia 100 100* Western Mineral Sands Proprietary Limited Australia 100 100* Yoganup Pty Ltd Australia 100 100* Iluka Corporation Limited Australia 100 100* Associated Minerals Consolidated Ltd Australia 100 100* Iluka Royalty Holdings Limited Australia 100 100* Iluka Consolidated Pty Limited Australia 100 100* Iluka Exploration Pty Limited Australia 100 100* Iluka (Eucla Basin) Pty Ltd Australia 100 100* Gold Fields Asia Ltd Australia 100 100* Iluka International Limited Australia 100 100* NGG Holdings Ltd Australia 100 100* Iluka Midwest Limited Australia 100 100* Western Titanium Limited Australia 100 100* The Mount Lyell Mining and Railway Company Limited Australia 100 100* Renison Limited Australia 100 100* Iluka Finance Limited Australia 100 100* The Nardell Colliery Pty Ltd Australia 100 100* Glendell Coal Ltd Australia 100 100* Lion Properties Pty Limited Australia 100 100* Basin Minerals Limited Australia 100 100* Basin Minerals Holdings Pty Ltd Australia 100 100* Basin Properties Pty Ltd Australia 100 100* Swansands Pty Ltd Australia 100 100* Iluka International (UAE) Pty Ltd Australia 100 100* Iluka International (Lanka) Pty Ltd Australia 100 100* Iluka International (China) Pty Ltd Australia 100 100* Iluka International (Brazil) Pty Ltd Australia 100 100* Iluka Share Plan Holdings Pty Ltd Australia 100 100* Iluka International (Netherlands) Pty Ltd Australia 100 100* Iluka Royalty (MAC) Pty Limited Australia 100 100* Iluka International (ERO) Pty Ltd Australia 100 100* Iluka International (West Africa) Pty Ltd Australia 100 100
Ashton Coal Interests Pty Limited Australia 95.8 95.8A.C.N. 637 824 027 Limited Australia 100 -A.C.N. 637 858 425 Pty Ltd Australia 100 -A.C.N. 637 858 434 Pty Ltd Australia 100 -A.C.N. 637 858 809 Pty Ltd Australia 100 -Iluka International Coӧperatief U.A. The Netherlands 100 100Iluka Investments 1 B.V. The Netherlands 100 100Iluka Trading (Europe) B.V. The Netherlands 100 100Iluka Lanka P Q (Private) Limited Sri Lanka 100 100Iluka Lanka Resources (Private) Limited Sri Lanka 100 100Iluka Lanka Exploration (Private) Limited Sri Lanka 100 100Iluka Trading (Shanghai) Co., Ltd China 100 100Iluka Brasil Mineracao Ltda Brazil 100 100
121
NOTES TO FINANCIAL STATEMENTSFor the year ended 31 December 2019
For
per
sona
l use
onl
y

Iluka Resources Limited, Annual Report 2019122
ILUKA RESOURCES LIMITED31 DECEMBER 2019
Iluka (UK) Ltd United Kingdom 100 100Iluka Technology (UK) Ltd United Kingdom 100 100Associated Minerals Consolidated Investments USA 100 100Iluka (USA) Investments Inc USA 100 100Iluka Resources Inc USA 100 100Iluka Resources (NC) LLC USA 100 100Iluka Resources (TN) LLC USA 100 100IR RE Holdings LLC USA 100 100Iluka Atlantic LLC USA 100 100Iluka International (Eurasia) Pte. Ltd. Singapore 100 100Iluka Exploration (Kazakhstan) Limited Liability Partnership Kazakhstan 100 100ERO (Tanzania) Limited Tanzania 100 100Iluka Exploration (Canada) Limited Canada 100 100Iluka Investments (BVI) Limited British Virgin Islands 96.4 100SRL Acquisition No. 3 Limited British Virgin Islands 100 100Sierra Rutile (UK) Limited United Kingdom 100 100Sierra Rutile Holdings Limited British Virgin Islands 100 100Sierra Rutile Limited Sierra Leone 100 100Iluka International (UK) Limited United Kingdom 100 100Iluka South Africa (Pty) Limited South Africa 100 100
* The above companies are parties to a Deed of Cross Guarantee (the Deed) under which each companyguarantees the debts of the others.
By entering into the Deed of Cross Guarantee, the wholly-owned entities represent a closed group and have beenrelieved from the requirements to prepare a Financial Report and Directors' Report under ASIC Corporations(Wholly-owned Companies) Instrument 2016/785. The closed group is also the extended closed group.
(a) Condensed financial statements of the extended closed group
Condensed statement of profit or loss and other comprehensive income2019
$m2018
$m
Revenue from ordinary activities 1,046.8 1,118.7Expenses from ordinary activities (560.4) (605.1)Finance costs (44.0) (24.1)
Income tax expense (131.7) (143.9)
Profit for the period 310.7 345.6
Other comprehensive income
Changes in the fair value of cash flow hedges (2.4) (7.9)
Total comprehensive income for the period 308.3 337.7
Summary of movements in consolidated retained earnings
Retained earnings/(accumulated loss) at the beginning of the financial year 187.8 (10.9)Profit for the period 310.7 345.6
Dividends paid (101.5) (146.9)
Retained earnings/(accumulated loss) at the end of the financial year 397.0 187.8
122
NOTES TO FINANCIAL STATEMENTSFor the year ended 31 December 2019
For
per
sona
l use
onl
y

Iluka Resources Limited, Annual Report 2019 123
ILUKA RESOURCES LIMITED31 DECEMBER 2019
Condensed balance sheet2019
$m2018
$m
Current assetsCash and cash equivalents 69.3 18.4Receivables 161.9 118.0
Inventories 300.4 292.5
Total current assets 531.6 428.9
Non-current assetsProperty, plant and equipment 933.2 838.3Deferred tax assets 17.5 46.3Intangible assets 3.5 3.9Inventories 84.1 4.6Other financial assets - investments in non-closed group entities 721.8 729.2
Right of use assets 20.0 -
Total non-current assets 1,780.1 1,622.3
Total assets 2,311.7 2,051.2
Current liabilitiesPayables 81.8 100.0Derivative financial instruments 3.7 4.4Current tax payable 94.4 137.3Provisions 62.9 82.2
Lease liabilities 9.2 -
Total current liabilities 252.0 323.9
Non-current liabilitiesInterest-bearing liabilities 54.0 49.5Derivatives 1.6 7.3Provisions 433.7 336.0
Lease liabilities 20.4 -
Total non-current liabilities 509.7 392.8
Total liabilities 761.7 716.7
Net assets 1,550.0 1,334.5
EquityContributed equity 1,157.5 1,154.0Reserves (4.5) (7.3)
Retained earnings 397.0 187.8
Total equity 1,550.0 1,334.5
123
NOTES TO FINANCIAL STATEMENTSFor the year ended 31 December 2019
For
per
sona
l use
onl
y

Iluka Resources Limited, Annual Report 2019124
ILUKA RESOURCES LIMITED31 DECEMBER 2019
OTHER NOTES
24 CONTINGENT LIABILITIES
(a) Bank guarantees
The Group has a number of bank guarantees in favour of various government authorities and service providers tomeet its obligations under exploration and mining tenements. At 31 December 2019, the total value ofperformance commitments and guarantees was $125.3 million (2018: $123.6 million).
(b) Native title
There is some risk that native title, as established by the High Court of Australia's decision in the Mabo case,exists over some of the land over which the Group holds tenements or over land required for access purposes. Itis impossible at this stage to quantify the impact, if any, which these developments may have on the operationsof the Group.
(c) Sri Lanka exploration deposits
In October 2013 the Group acquired all of the share capital in PKD Resources (Pvt) Ltd, a Sri Lankan domiciledcompany which owns an exploration tenement located near the city of Puttalam in the North Western Province ofSri Lanka. The consideration for the acquisition which remains contingent on future events includes:
• payment of US$2 million upon grant of a mining license, US$3 million on the Iluka Board approving adevelopment of mining operations and US$3 million upon commencement of commercial production; and
• the payment of an annual trailing payment calculated at 1% of the gross sale proceeds received from theannual sale of all mineral products and sand clay produced from the tenement, less the US$2.0 million paidon the grant of the mining license over EL 170, which is being treated as an advance on the trailing payment.
(d) Shareholder class action
On 24 March 2014 Iluka became aware that a litigation funder proposed to fund claims that current or formershareholders may have against Iluka Resources Limited in respect of alleged breaches of Iluka’s continuousdisclosure obligations and misleading and deceptive conduct in 2012.
On 23 April 2018, Iluka was served with an originating application and statement of claim in respect of ashareholder class action filed in the Federal Court of Australia. The proceedings have been brought by a group ofIluka shareholders for alleged breaches of Iluka’s continuous disclosure obligations, and misleading anddeceptive conduct in relation to disclosures made by Iluka to the market between April and July 2012.
In late January 2019, Iluka was informed that a dispute had arisen between the applicant and its third partylitigation funder, Harbour Fund II LP. On 2 August 2019, Iluka was notified that the applicant secured fundingfrom a replacement funder, August Ventures Limited.
The presiding judge has made orders for the exchange of evidence in the proceedings and a trial date has beenset for 1 March 2021.
Iluka denies liability in respect of the allegations and is defending the proceedings.
This contingent liability was first disclosed in Iluka’s 2018 Interim Report. The status of the proceedings has stillnot reached a stage where Iluka is able to reliably estimate the quantum of liability, if any, that Iluka may incur inrespect of the class action.
(e) Sierra Leone environmental class action
On 22 January 2019, SRL was served with a writ and statement of claim in respect of an action filed in the HighCourt of Sierra Leone Commercial And Admiralty Division against both SRL and The Environmental ProtectionAgency.
124
NOTES TO FINANCIAL STATEMENTSFor the year ended 31 December 2019
For
per
sona
l use
onl
y

Iluka Resources Limited, Annual Report 2019 125
ILUKA RESOURCES LIMITED31 DECEMBER 2019
(e) Sierra Leone environmental class action (continued)
The proceedings have been brought by a group of landowner representatives (Representatives) who allege thatthey suffered loss as a result of SRL’s mining operations. The claims primarily relate to environmental matters.The Representatives allege, in part, that SRL engaged in improper mining practices resulting in environmentaldegradation and contamination, did not meet certain rehabilitation obligations and violated local mining laws.SRL denies liability in respect of the allegations and intends to defend the claims. SRL filed its defence in March2019 and also applied to the Court for an order requiring the Representatives to provide further detail on theirclaims.
As at 31 December 2019, the status of the proceedings has still not reached a stage where SRL is able to reliablyestimate the quantum of liability, if any, that SRL may incur in respect of the class action.
(f) Other claims
In the course of its normal business, the Group occasionally receives claims arising from its operating activities.In the opinion of the directors, all such matters are covered by insurance or, if not covered, are without merit orare of such a kind or involve such amounts that would not have a material adverse effect on the operating resultsor financial position of the Group if settled unfavourably.
25 EVENTS OCCURRING AFTER THE REPORTING PERIOD
Following a comprehensive review of the Group’s corporate and capital structure during 2019, the Board andmanagement have decided to make preparations to put a proposal to shareholders regarding a demerger of theMining Area C (MAC) royalty business from the Group’s mineral sands business. This option has beendetermined as the best means to deliver value to shareholders by separating distinct businesses and creatingtwo stand-alone ASX-listed companies. As the proposal is still in development and will be subject to furtherBoard approval, as well as regulatory, and shareholder approvals, MAC is not classified as held-for-sale as at 31December 2019. The carrying values of assets and liabilities as at the reporting date and related profit or loss forthe year are disclosed in note 4(b). Any gain on distribution of non-cash assets to owners that may arise woulddepend on the fair value of those assets at the date of distribution, and can therefore not be estimated as at thereporting date.
No matter or circumstance has occurred subsequent to period end that has significantly affected, or maysignificantly affect, the operations of the Group, the results of those operations or the state of affairs of theGroup or economic entity in subsequent financial years.
26 COMMITMENTS
(a) Exploration and mining lease commitments2019
$m2018
$m
Commitments in relation to leases contracted for at reporting date but notrecognised as liabilities payable:
Within one year 14.9 15.7Later than one year but not later than five years 34.7 32.7
Later than five years 46.8 47.0
96.4 95.4
These costs are discretionary. If the expenditure commitments are not met then the associated exploration andmining leases may be relinquished.
125
NOTES TO FINANCIAL STATEMENTSFor the year ended 31 December 2019
For
per
sona
l use
onl
y

Iluka Resources Limited, Annual Report 2019126
ILUKA RESOURCES LIMITED31 DECEMBER 2019
(b) Lease commitments
Commitments for minimum lease payments in relation to non-cancellableoperating leases are payable as follows:
Within one year - 7.2Later than one year but not later than five years - 15.8
Later than five years - 14.3
- 37.3
From 1 January 2019, the group has recognised right-of-use assets for these leases, except for short-term andlow-value leases, see notes 10 and 34 for further information.
(c) Capital commitments
Capital expenditure contracted for and payable, but not recognised as liabilities is $26.5 million (2018: $57.8million). All of the commitments relate to the purchase of property, plant and equipment. Of the total amount,$25.7 million is payable within one year of the reporting date and $0.8 million is payable between one and fiveyears of the reporting date.
27 REMUNERATION OF AUDITORS
During the year the following fees were paid or payable for services provided by the auditor of the parent entity,its related practices and non-related audit firms:
(a) PricewaterhouseCoopers Australia
2019$000
2018$000
Audit and other assurance servicesAudit and review of Group financial statements 514 514
Audit and review of subsidiary financial statements 131 -
645 514
Tax and other servicesTax compliance and advisory services 7 10
Other compliance and advisory services 10 -
17 10
Total remuneration 662 524
(b) Network firms of PricewaterhouseCoopers Australia
Audit and review of financial statements 199 156
Other compliance and advisory services 16 34
215 190
126
NOTES TO FINANCIAL STATEMENTSFor the year ended 31 December 2019
For
per
sona
l use
onl
y

Iluka Resources Limited, Annual Report 2019 127
ILUKA RESOURCES LIMITED31 DECEMBER 2019
(c) Non-PricewaterhouseCoopers audit firms
Audit and review of financial statements 96 76
Other compliance and advisory services 15 142
111 218
Summary of total fees disclosed above:Audit and review of financial statements 940 746Tax compliance and advisory services 7 10
Other compliance and advisory services 41 176
988 932
28 SHARE-BASED PAYMENTS
Share-based compensation benefits are provided to employees via incentive plans, the Director's, Executives andEmployees Share Acquisition Plan, the Equity Incentive Plan and the Employee Share Plan. Information relating tothese schemes is set out in the Remuneration Report.
The fair value of shares granted is determined based on market prices at grant date, taking into account theterms and conditions upon which those shares were granted. The fair value is recognised as an expense throughprofit or loss on a straight-line basis between the grant date and the vesting date for each respective plan.
The fair value of share rights is independently determined using a Monte Carlo simulation that takes into accountthe exercise price, the term of the share right, the impact of dilution, the share price at grant date and expectedprice volatility of the underlying share, the expected dividend yield and the risk free interest rate of the term of theshare right. The fair value of the Long Term Incentive Plan (LTIP - TSR tranche) and Long Term Deferred Rights(LTDR - TSR tranche) also take into account the Company's predicted share prices against the comparator groupperformance at vesting date.
A credit to the share-based payments expense arises where unvested entitlements lapse on resignation or thenon-fulfilment of the vesting conditions that do not relate to market performance. Payroll tax payable on the grantof restricted shares or share rights is recognised as a component of the share-based payments expense whenpaid.
127
NOTES TO FINANCIAL STATEMENTSFor the year ended 31 December 2019
For
per
sona
l use
onl
y

Iluka Resources Limited, Annual Report 2019128
ILUKA RESOURCES LIMITED31 DECEMBER 2019
The share-based payment expense recognised in profit or loss of $6.2 million (2018: $6.2 million) results fromseveral schemes summarised below.
Fairvalue
Shares /rights at
Expense2019
Shares /rights at
Expense2018
SchemesGrantdate Vesting date $ 31 Dec 19 $m 31 Dec 18 $m
STIP (i)
2019 Mar-20 Mar-21/22/23 9.30 - 1.2 - -
2018 Mar-19 Mar-20/21 7.62 - 1.3 - 1.5
2017 Mar-18 Mar-19/20 10.55 - 0.5 - 1.4
2016 Mar-17 Mar-18/19 6.82 - - - 0.4
LTIP - TSR (ii)
2017 May-17 Mar-21 5.66 376,858 0.5 401,657 0.5
2016 MD Grant Oct-16 Mar-21 3.71 126,688 0.2 126,688 (0.3)
2016 May-16 Mar-20 4.27 211,502 - 237,217 0.2
2016 May-16 Mar-19 4.27 1,607 - 267,739 0.1
LTIP - ROE (ii)
2017 May-17 Mar-21 7.44 369,845 0.6 401,681 0.7
2016 MD Grant Oct-16 Mar-21 5.42 126,687 (0.4) 126,687 0.3
2016 May-16 Mar-20 5.86 211,519 (0.9) 237,234 0.3
2016 May-16 Mar-19 6.01 - (1.0) 267,757 (0.9)
2015 Feb-15 Mar-18 6.74 - - - (1.6)
EIP (iii) Mar-18 Mar-20/21/22/23 7.62 - 3.1 - 2.5
MD LTDR (iv) Oct-16 Mar-18/19/20 4.68 163,031 0.2 357,115 0.1
COO LTDR (v) Mar-17 Mar-20 6.82 16,133 0.1 16,133 0.1
COO LTDR (v) Mar-18 Mar-21 10.55 10,424 0.1 10,424 0.1
COO LTDR (v) Mar-19 Mar-22 9.35 11,762 0.1
Employee Share Plan (vi) 9.01 - - - 0.4
Restricted Share Plan (vii) 6.82 - 0.6 - 0.4
6.2 6.2
(i) Short Term Incentive Plan (STIP)
The fair value of the STIP is determined as the volume weighted average price of ordinary shares over the fivetrading days following the release of the Company’s annual results.
(ii) Long Term Incentive Plan (LTIP)
The fair value at grant date for the LTIP took into account the exercise price of $nil, the share price at grant date,the expected price volatility of the share price (based on historical volatility), the expected dividend yield of andthe risk free rate of return. The fair value of the total shareholder return tranche also took into account theCompany’s predicted share prices against the comparator group performance at vesting date.
Prior year expenses related to rights that do not vest for the Return on Equity (ROE) tranche are credited toshare-based payments expense.
(iii) Executive Incentive Plan (EIP)
Equity awarded under the Executive Incentive Plan is allocated on 1 March each year. The number of restrictedshares and performance rights to be awarded are determined based on a volume weighted average market priceof Iluka shares for the five days following the release of the full year results. The values disclosed represent theface value.
128
NOTES TO FINANCIAL STATEMENTSFor the year ended 31 December 2019
For
per
sona
l use
onl
y
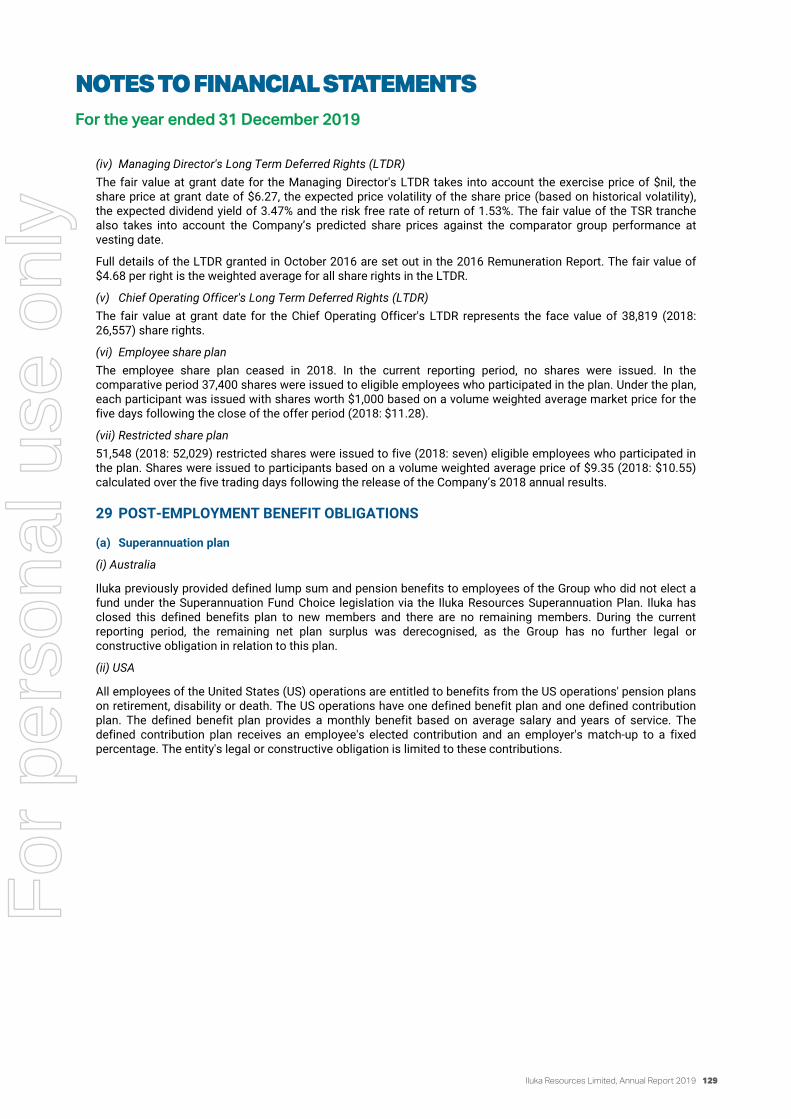
Iluka Resources Limited, Annual Report 2019 129
ILUKA RESOURCES LIMITED31 DECEMBER 2019
(iv) Managing Director's Long Term Deferred Rights (LTDR)
The fair value at grant date for the Managing Director's LTDR takes into account the exercise price of $nil, theshare price at grant date of $6.27, the expected price volatility of the share price (based on historical volatility),the expected dividend yield of 3.47% and the risk free rate of return of 1.53%. The fair value of the TSR tranchealso takes into account the Company’s predicted share prices against the comparator group performance atvesting date.
Full details of the LTDR granted in October 2016 are set out in the 2016 Remuneration Report. The fair value of$4.68 per right is the weighted average for all share rights in the LTDR.
(v) Chief Operating Officer's Long Term Deferred Rights (LTDR)
The fair value at grant date for the Chief Operating Officer's LTDR represents the face value of 38,819 (2018:26,557) share rights.
(vi) Employee share plan
The employee share plan ceased in 2018. In the current reporting period, no shares were issued. In thecomparative period 37,400 shares were issued to eligible employees who participated in the plan. Under the plan,each participant was issued with shares worth $1,000 based on a volume weighted average market price for thefive days following the close of the offer period (2018: $11.28).
(vii) Restricted share plan
51,548 (2018: 52,029) restricted shares were issued to five (2018: seven) eligible employees who participated inthe plan. Shares were issued to participants based on a volume weighted average price of $9.35 (2018: $10.55)calculated over the five trading days following the release of the Company’s 2018 annual results.
29 POST-EMPLOYMENT BENEFIT OBLIGATIONS
(a) Superannuation plan
(i) Australia
Iluka previously provided defined lump sum and pension benefits to employees of the Group who did not elect afund under the Superannuation Fund Choice legislation via the Iluka Resources Superannuation Plan. Iluka hasclosed this defined benefits plan to new members and there are no remaining members. During the currentreporting period, the remaining net plan surplus was derecognised, as the Group has no further legal orconstructive obligation in relation to this plan.
(ii) USA
All employees of the United States (US) operations are entitled to benefits from the US operations' pension planson retirement, disability or death. The US operations have one defined benefit plan and one defined contributionplan. The defined benefit plan provides a monthly benefit based on average salary and years of service. Thedefined contribution plan receives an employee's elected contribution and an employer's match-up to a fixedpercentage. The entity's legal or constructive obligation is limited to these contributions.
129
NOTES TO FINANCIAL STATEMENTSFor the year ended 31 December 2019
For
per
sona
l use
onl
y

Iluka Resources Limited, Annual Report 2019130
ILUKA RESOURCES LIMITED31 DECEMBER 2019
(iii) SRL
SRL does not operate any retirement benefit plan for its employees. For employees of the Sierra Leone basedsubsidiary, the Group makes a contribution of 10% of the employees' basic salary to the National Social Securityand Insurance Trust ("NASSIT") for payment of pension to staff on retirement. These employees also contribute5% of their basic salary to NASSIT.
The Sierra Leone based subsidiary also provides for end-of-term benefits based on the provisions contained inthe collective bargaining agreements negotiated with trade unions representing employees. On 1 January 2018,this benefit was extended to include senior and management employees, in addition to all other employees, withthe obligation to the newly added senior and management employees becoming effective from 1 January 2019.The post-employment benefit obligation recognised in the balance sheet represents the present value of thedefined benefit obligation in relation to this arrangement.
The following sets out details in respect of the defined benefit sections only for Australia, US and SRL.
(b) Financial position
The net financial position of the Group’s defined benefit plans based on information supplied from the plans'actuarial advisors per the table below.
2019 2018
Net plan position$m $m
Australia - - 0.4United States Deficit (15.7) (12.1)
Sierra Leone Deficit (6.7) (6.2)
Total (22.4) (17.9)
A net deficit of $22.4 million (2018: deficit $17.9 million) is included in non-current provisions in note 8. The tablebelow provides a summary of the net financial position at 31 December for the past five years.
2019$m
2018$m
2017$m
2016$m
2015$m
Defined benefit plan obligation (46.7) (39.4) (36.0) (35.0) (31.1)
Plan assets 24.3 21.5 21.2 20.3 20.4
Deficit (22.4) (17.9) (14.8) (14.7) (10.7)
(c) Defined benefits superannuation expense
In 2019, $2.4 million (2018: $2.3 million) was recognised in expenses for the year in respect of the defined benefitplans.
Other disclosures in respect of retirement benefit obligations required by AASB 119 are not included in thefinancial report as the directors do not consider them to be material to an understanding of the financial positionand performance of the Group.
130
NOTES TO FINANCIAL STATEMENTSFor the year ended 31 December 2019
For
per
sona
l use
onl
y

Iluka Resources Limited, Annual Report 2019 131
ILUKA RESOURCES LIMITED31 DECEMBER 2019
30 RECONCILIATION OF PROFIT/(LOSS) AFTER INCOME TAX TO NET CASH INFLOWFROM OPERATING ACTIVITIES
2019$m
2018$m
Profit (loss) for the year (299.7) 303.9Depreciation and amortisation 163.2 93.6Doubtful debts/(reversed) 1.6 (1.4)Net loss (gain) on disposal of property, plant and equipment 4.1 (1.3)Net exchange differences 0.3 1.6Rehabilitation and mine closure provision discount unwind 19.7 16.7Rehabilitation discount rate change 18.3 -Non-cash share-based payments expense 6.2 6.2Amortisation of deferred borrowing costs 1.2 1.6Impairment of Sierra Rutile Limited assets 375.2 -Inventory NRV write-down 41.8 11.4Changes in rehabilitation provisions for closed sites 3.2 (4.6)Change in operating assets and liabilities
(Increase)/decrease in receivables (39.8) 7.5(Increase)/decrease in inventories (35.2) 85.9Increase/(decrease) in net current tax liability (43.1) 152.1Decrease/(increase) in net deferred tax 199.0 (6.7)(Decrease) in payables (111.7) (35.3)
Increase/(decrease) in provisions 17.9 (4.7)
Net cash inflow from operating activities 322.2 626.5
31 KEY MANAGEMENT PERSONNEL
(a) Key Management Personnel
Key Management Personnel of the Group comprise directors of Iluka Resources Limited as well as other specificemployees of the Group who met the following criteria: "personnel who have authority and responsibility forplanning, directing and controlling the activities of the Group, either directly or indirectly."
(i) Key Management Personnel compensation
Detailed information about the remuneration received by each Key Management Person is provided in theRemuneration Report on pages 56 to 80.
The below provides a summary:
2019 2018$000 $000
-Short-term benefits 6,213 6,997Post-employment benefits 205 232Termination benefits 276 175
Share-based payments 3,362 2,312
Total 10,056 9,716
131
NOTES TO FINANCIAL STATEMENTSFor the year ended 31 December 2019
For
per
sona
l use
onl
y

Iluka Resources Limited, Annual Report 2019132
ILUKA RESOURCES LIMITED31 DECEMBER 2019
(b) Transactions with Key Management Personnel
There were no transactions between the Group and Key Management Personnel that were outside of the naturedescribed below:
(i) occurrence was within a normal employee, customer or supplier relationship on terms and conditions nomore favourable than those it is reasonable to expect the Group would have adopted if dealing at armslength with an unrelated individual;
(ii) information about these transactions does not have the potential to adversely affect the decisions aboutthe allocation of scarce resources made by users of the financial report, or the discharge ofaccountability by the Key Management Personnel; and
(iii) the transactions are trivial or domestic in nature.
32 PARENT ENTITY FINANCIAL INFORMATION
(a) Summary financial information for Iluka Resources Limited
2019$m
2018$m
Balance sheetCurrent assets 106.5 165.6
Non-current assets 1,481.1 1,393.9
Total assets 1,587.6 1,559.5
Current liabilities 40.6 196.4
Non-current liabilities 439.2 390.1
Total liabilities 479.8 586.5
Net assets 1,107.8 973.0
Shareholders' equityContributed equity 1,160.3 1,158.7Other reserves 2.6 0.5Profit reserve¹ 153.4 22.3
Accumulated loss (208.5) (208.5)
1,107.8 973.0
spaceProfit/(loss) for the year 234.3 86.8
Other comprehensive income
Changes in the fair value of cash flow hedges, net of tax (2.4) (7.9)
Total comprehensive loss (income) 231.9 78.9
¹Profits have been appropriated to a profits reserve for future dividend payments.
(b) Contingent liabilities of the parent entity
The parent had contingent liabilities for performance commitments and guarantees of $10.6 million as at 31December 2019 (2018: $42.8 million). In addition, the parent has a contingent liability related to the shareholderclass action, as detailed in note 24.
132
NOTES TO FINANCIAL STATEMENTSFor the year ended 31 December 2019
For
per
sona
l use
onl
y
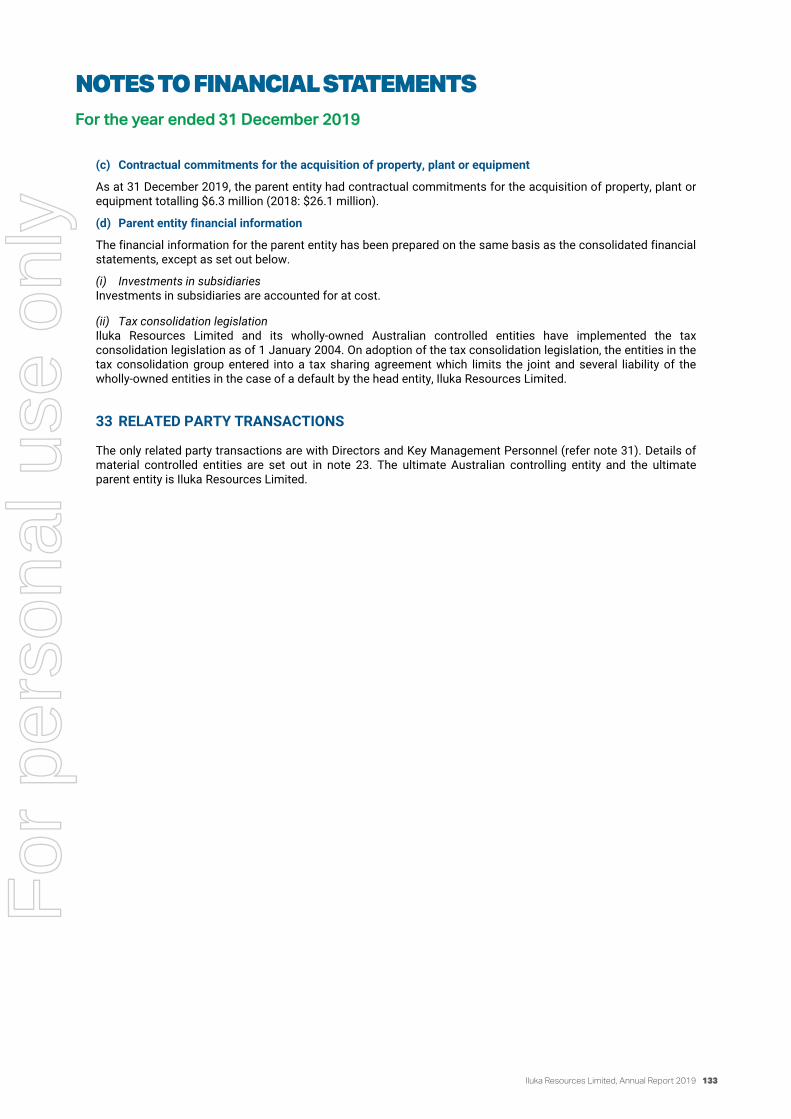
Iluka Resources Limited, Annual Report 2019 133
ILUKA RESOURCES LIMITED31 DECEMBER 2019
(c) Contractual commitments for the acquisition of property, plant or equipment
As at 31 December 2019, the parent entity had contractual commitments for the acquisition of property, plant orequipment totalling $6.3 million (2018: $26.1 million).
(d) Parent entity financial information
The financial information for the parent entity has been prepared on the same basis as the consolidated financialstatements, except as set out below.
(i) Investments in subsidiariesInvestments in subsidiaries are accounted for at cost.
(ii) Tax consolidation legislationIluka Resources Limited and its wholly-owned Australian controlled entities have implemented the taxconsolidation legislation as of 1 January 2004. On adoption of the tax consolidation legislation, the entities in thetax consolidation group entered into a tax sharing agreement which limits the joint and several liability of thewholly-owned entities in the case of a default by the head entity, Iluka Resources Limited.
33 RELATED PARTY TRANSACTIONS
The only related party transactions are with Directors and Key Management Personnel (refer note 31). Details ofmaterial controlled entities are set out in note 23. The ultimate Australian controlling entity and the ultimateparent entity is Iluka Resources Limited.
133
NOTES TO FINANCIAL STATEMENTSFor the year ended 31 December 2019
For
per
sona
l use
onl
y

Iluka Resources Limited, Annual Report 2019134
ILUKA RESOURCES LIMITED31 DECEMBER 2019
34 NEW AND AMENDED STANDARDS
New standards and amendments adopted
Iluka Resources Limited is required to change some of its accounting policies as the result of new or revisedaccounting standards which became effective for the annual reporting period commencing on 1 January 2019.The affected policies and standards are:
AASB16 Leases
The Group has adopted AASB 16 with effect from 1 January 2019 (the ‘adoption date’), but has not restatedcomparatives for the 2018 reporting period. All relevant contracts, other than short term contracts or thoserelating to low-value assets, have been assessed to determine whether they are, or contain, leases. For initialadoption purposes, short term contracts include contracts that are for a total period of more than 12 months, butthat expire within 12 months or less of the adoption date.
The new accounting policy applicable to leases, including measurement of lease liabilities and right-of-useassets, from 1 January 2019 is detailed in note 10.
The Group recognised lease liabilities and right of use assets in relation to leases which had previously beenclassified as operating leases under the principles of AASB 117. No adjustments were made to the openingbalance on retained earnings. The Group did not have any leases previously classified as finance leases on theadoption date.
Lease liabilities
The weighted average interest rate used to discount the payments due over the remaining term for each leasewas 4.3%. The Group estimated remaining lease terms including the effects of any renewal options ortermination options expected to be exercised, applying hindsight where appropriate.
Operating lease commitments disclosed at the end of the comparative period are reconciled to the opening leaseliability balance as follows:
$m
Operating lease commitments disclosed as at 31 December 2018 37.3Discounted using the Group's weighted average incremental borrowing rate on 1 January 2019 32.7Less: short-term and low value leases recognised on a straight-line basis (1.4)Add: contracts reassessed as leases 5.9Lease liabilities recognised on 1 January 2019 37.2
Right-of-use assets
Right-of-use assets were measured at amounts equal to the carrying amount of their respective lease liabilitieson the adoption date, adjusted for incentives, accruals and prepayments and to exclude initial direct costs. A totalof $29.5 million was recognised on the adoption date.
There were no onerous lease contracts that would have required an adjustment to the right-of-use assets on theadoption date.
134
NOTES TO FINANCIAL STATEMENTSFor the year ended 31 December 2019
For
per
sona
l use
onl
y

Iluka Resources Limited, Annual Report 2019 135
ILUKA RESOURCES LIMITED31 DECEMBER 2019
Impact on the current reporting period
Adoption of AASB 16 impacted all segments (except for MAC) and certain non-segment corporate and otheritems:
- JA/MW C/SW SRL US/MB
Corporateand
other Total$m $m $m $m $m $m
Lease liabilitiesRecognised on adoption 8.2 5.0 0.3 1.1 22.6 37.2Additional lease liabilities recognised 1.0 0.9 - 0.1 0.2 2.2Remeasurement adjustments - - - - (2.8) (2.8)Borrowing costs 0.3 0.2 0.1 0.1 0.9 1.5
Payments (4.0) (2.9) (0.1) (0.6) (0.6) (8.2)
Lease liabilities as at 31 December 2019 5.5 3.2 0.3 0.7 20.3 30.0-Right of use assets
Recognised on adoption 8.2 5.0 0.3 1.1 14.9 29.5Additional right of use assets recognised 1.0 0.9 - 0.1 0.2 2.2Remeasurement adjustments - - - - (2.8) (2.8)
Accumulated amortisation (3.5) (2.6) (0.1) (0.5) (1.7) (8.4)
Right of use assets as at 31 December 2019 5.7 3.3 0.2 0.7 10.6 20.5-
The impact on the profit or loss items of the JA/MW, C/SW, SRL and US/MB segments was not material, nor wasthere a material impact on Group earnings per share. The impact on the profit or loss of the Group was:
- Total$m
-Decrease in operating lease expense 8.2Increase in borrowing costs on lease liabilities (1.5)Increase in right of use asset amortisation (8.4)Decrease in profit before tax (1.7)Decrease in income tax expense 0.5Decrease in profit after tax (1.2)
Forthcoming standards and amendments not yet adopted
There are no other forthcoming standards and amendments that are expected to have a material impact on theentity in the current or future reporting periods, or on foreseeable future transactions.
135
NOTES TO FINANCIAL STATEMENTSFor the year ended 31 December 2019
For
per
sona
l use
onl
y

Iluka Resources Limited, Annual Report 2019136
ILUKA RESOURCES LIMITED31 DECEMBER 2019
DIRECTORS' DECLARATION
In the directors' opinion:
(a) the financial statements and notes set out on pages 82 to 135 are in accordance with the CorporationsAct 2001, including:
(i) complying with Accounting Standards and other mandatory professional reporting requirements asdetailed above, and the Corporations Regulations 2001; and
(ii) giving a true and fair view of the Group's financial position as at 31 December 2019 and of itsperformance for the financial year ended on that date, and
(b) there are reasonable grounds to believe that the Company will be able to pay its debts as and when theybecome due and payable, and
(c) at the date of this declaration, there are reasonable grounds to believe that the members of the extendedclosed group identified in note 22 will be able to meet any obligations or liabilities to which they are, ormay become, subject by virtue of the deed of cross guarantee described in note 22.
Note 2 confirms that the financial statements also comply with International Financial Reporting Standards asissued by the International Accounting Standards Board.
The directors have been given the declarations by the Chief Executive Officer and Chief Financial Officer requiredby section 295A of the Corporations Act 2001.
This declaration is made in accordance with a resolution of the directors.
G MartinChairman
T O'LearyManaging Director
20 February 2020
136
DIRECTOR’S DECLARATIONFor the year ended 31 December 2019
PricewaterhouseCoopers, ABN 52 780 433 757 Brookfield Place, 125 St Georges Terrace, PERTH WA 6000, GPO Box D198, PERTH WA 6840 T: +61 8 9238 3000, F: +61 8 9238 3999, www.pwc.com.au
Liability limited by a scheme approved under Professional Standards Legislation.
Independent auditor’s report To the members of Iluka Resources Limited
Report on the audit of the financial report
Our opinion In our opinion:
The accompanying financial report of Iluka Resources Limited (the Company) and its controlled entities (together the Group) is in accordance with the Corporations Act 2001, including:
(a) giving a true and fair view of the Group's financial position as at 31 December 2019 and of its financial performance for the year then ended, and
(b) complying with Australian Accounting Standards and the Corporations Regulations 2001.
What we have audited The Group financial report comprises:
• the consolidated balance sheet as at 31 December 2019 • the consolidated statement of changes in equity for the year then ended • the consolidated statement of cash flows for the year then ended • the consolidated statement of profit or loss and other comprehensive income for the year then
ended • the notes to the consolidated financial statements, which include a summary of significant
accounting policies, and • the directors’ declaration.
Basis for opinion We conducted our audit in accordance with Australian Auditing Standards. Our responsibilities under those standards are further described in the Auditor’s responsibilities for the audit of the financial report section of our report.
We believe that the audit evidence we have obtained is sufficient and appropriate to provide a basis for our opinion.
Independence We are independent of the Group in accordance with the auditor independence requirements of the Corporations Act 2001 and the ethical requirements of the Accounting Professional and Ethical Standards Board’s APES 110 Code of Ethics for Professional Accountants (including Independence Standards) (the Code) that are relevant to our audit of the financial report in Australia. We have also fulfilled our other ethical responsibilities in accordance with the Code.
For
per
sona
l use
onl
y

Iluka Resources Limited, Annual Report 2019 137
PricewaterhouseCoopers, ABN 52 780 433 757 Brookfield Place, 125 St Georges Terrace, PERTH WA 6000, GPO Box D198, PERTH WA 6840 T: +61 8 9238 3000, F: +61 8 9238 3999, www.pwc.com.au
Liability limited by a scheme approved under Professional Standards Legislation.
Independent auditor’s report To the members of Iluka Resources Limited
Report on the audit of the financial report
Our opinion In our opinion:
The accompanying financial report of Iluka Resources Limited (the Company) and its controlled entities (together the Group) is in accordance with the Corporations Act 2001, including:
(a) giving a true and fair view of the Group's financial position as at 31 December 2019 and of its financial performance for the year then ended, and
(b) complying with Australian Accounting Standards and the Corporations Regulations 2001.
What we have audited The Group financial report comprises:
• the consolidated balance sheet as at 31 December 2019 • the consolidated statement of changes in equity for the year then ended • the consolidated statement of cash flows for the year then ended • the consolidated statement of profit or loss and other comprehensive income for the year then
ended • the notes to the consolidated financial statements, which include a summary of significant
accounting policies, and • the directors’ declaration.
Basis for opinion We conducted our audit in accordance with Australian Auditing Standards. Our responsibilities under those standards are further described in the Auditor’s responsibilities for the audit of the financial report section of our report.
We believe that the audit evidence we have obtained is sufficient and appropriate to provide a basis for our opinion.
Independence We are independent of the Group in accordance with the auditor independence requirements of the Corporations Act 2001 and the ethical requirements of the Accounting Professional and Ethical Standards Board’s APES 110 Code of Ethics for Professional Accountants (including Independence Standards) (the Code) that are relevant to our audit of the financial report in Australia. We have also fulfilled our other ethical responsibilities in accordance with the Code.
INDEPENDENT AUDITOR’S REPORTTo the members of Iluka Resources Limited
For the year ended 31 December 2019
For
per
sona
l use
onl
y

Iluka Resources Limited, Annual Report 2019138
Our audit approach An audit is designed to provide reasonable assurance about whether the financial report is free from material misstatement. Misstatements may arise due to fraud or error. They are considered material if individually or in aggregate, they could reasonably be expected to influence the economic decisions of users taken on the basis of the financial report.
We tailored the scope of our audit to ensure that we performed enough work to be able to give an opinion on the financial report as a whole, taking into account the geographic and management structure of the Group, its accounting processes and controls and the industry in which it operates.
Materiality
• For the purpose of our audit we used overall Group materiality of $13 million, which represents approximately 1% of the Group’s total revenue.
• We applied this threshold, together with qualitative considerations, to determine the scope of our audit and the nature, timing and extent of our audit procedures and to evaluate the effect of misstatements on the financial report as a whole.
• We chose revenue as the materiality benchmark rather than profit before tax due to the recent volatility in profit before tax. Revenues are reflective of the Group's operating activities, are relatively stable when compared to profit before tax and provide a level of materiality which, in our view, is appropriate for the audit having regard to the expected requirements of users of the Group's financial report.
• We utilised a 1% threshold based on our professional judgement, noting it is within the range of commonly acceptable thresholds.
Audit Scope
• Our audit focused on where the Group made subjective judgements; for example, significant accounting estimates involving assumptions and inherently uncertain future events.
• Component auditors, operating under our instructions, performed audit procedures over the Group's Sierra Leone operations' financial information. These procedures, combined with the work performed by us which included reviewing component auditors' work, as the Group engagement team, provided sufficient appropriate audit evidence as a basis for our opinion on the Group financial report as a whole.
Key audit matters Key audit matters are those matters that, in our professional judgement, were of most significance in our audit of the financial report for the current period. The key audit matters were addressed in the context of our audit of the financial report as a whole, and in forming our opinion thereon, and we do not provide a separate opinion on these matters. Further, any commentary on the outcomes of a particular audit procedure is made in that context. We communicated the key audit matters to the Audit and Risk Committee.
Key audit matter How our audit addressed the key audit matter
Impairment of assets in Sierra Rutile Refer note 3 and note 7 to the financial statements
The Group performed an assessment for impairment indicators across its cash generating units (CGUs) given this is required by Australian Accounting Standards. During the year, the Group reviewed its approach to developing the Sembehun deposit in Sierra Leone due to unfavourable changes made to capital expenditure estimates on the previously preferred development option. The Group identified this as an indicator of impairment for the cash generating unit in Sierra Leone (the Sierra Rutile CGU) at year end and undertook an impairment assessment. This assessment resulted in an impairment charge of $375.2 million as the Group concluded the fair value less cost of disposal (FVLCOD) of the Sierra Rutile CGU was below its carrying value at 31 December 2019. When an impairment assessment is performed, there are significant judgements made in relation to assumptions, such as: • long term mineral sands pricing • reserve estimates and production and processing
volumes • operating costs, capital costs for future
developments, rehabilitation and mine closure costs, foreign exchange rates and inflation rates, and
• discount rates. This was a key audit matter due to the significant carrying value of the Sierra Rutile CGU’s non current assets and the significance of the impairment expense to the profit and loss, which are subject to the judgements and assumptions outlined above in relation to impairment.
We performed the following procedures on the Group’s impairment assessment for the Sierra Rutile CGU:
• assessed whether the Sierra Rutile CGU appropriately included all directly attributable assets and liabilities
• considered whether the discounted cash flow model used to estimate the ‘fair value less costs of disposal’ (the impairment model) was consistent with the basis required by Australian Accounting Standards
• tested whether forecast cash flows used in the impairment model were consistent with the most recent Corporate Plan formally approved by directors
• considered whether the forecast cash flows used in the impairment model were reasonable and based on supportable assumptions by: o comparing long term mineral sands pricing
data used in the impairment model to independent industry forecasts and long term sales contracts
o comparing the forecasted cash flows to actual cash flows for previous years to assess the accuracy of the Group’s forecasting
o assessing the objectivity and competence of internal engineering experts who assisted in developing ore reserve estimates for the Sierra Rutile CGU’s future developments
o comparing foreign exchange rate and inflation rate assumptions in the impairment model to current economic forecasts, and
o assessing the Group’s discount rate calculations, including having regard to the inputs utilised in the Group’s weighted average cost of capital such as peer company
INDEPENDENT AUDITOR’S REPORTTo the members of Iluka Resources Limited
For the year ended 31 December 2019
For
per
sona
l use
onl
y

Iluka Resources Limited, Annual Report 2019 139
Key audit matters Key audit matters are those matters that, in our professional judgement, were of most significance in our audit of the financial report for the current period. The key audit matters were addressed in the context of our audit of the financial report as a whole, and in forming our opinion thereon, and we do not provide a separate opinion on these matters. Further, any commentary on the outcomes of a particular audit procedure is made in that context. We communicated the key audit matters to the Audit and Risk Committee.
Key audit matter How our audit addressed the key audit matter
Impairment of assets in Sierra Rutile Refer note 3 and note 7 to the financial statements
The Group performed an assessment for impairment indicators across its cash generating units (CGUs) given this is required by Australian Accounting Standards. During the year, the Group reviewed its approach to developing the Sembehun deposit in Sierra Leone due to unfavourable changes made to capital expenditure estimates on the previously preferred development option. The Group identified this as an indicator of impairment for the cash generating unit in Sierra Leone (the Sierra Rutile CGU) at year end and undertook an impairment assessment. This assessment resulted in an impairment charge of $375.2 million as the Group concluded the fair value less cost of disposal (FVLCOD) of the Sierra Rutile CGU was below its carrying value at 31 December 2019. When an impairment assessment is performed, there are significant judgements made in relation to assumptions, such as: • long term mineral sands pricing • reserve estimates and production and processing
volumes • operating costs, capital costs for future
developments, rehabilitation and mine closure costs, foreign exchange rates and inflation rates, and
• discount rates. This was a key audit matter due to the significant carrying value of the Sierra Rutile CGU’s non current assets and the significance of the impairment expense to the profit and loss, which are subject to the judgements and assumptions outlined above in relation to impairment.
We performed the following procedures on the Group’s impairment assessment for the Sierra Rutile CGU:
• assessed whether the Sierra Rutile CGU appropriately included all directly attributable assets and liabilities
• considered whether the discounted cash flow model used to estimate the ‘fair value less costs of disposal’ (the impairment model) was consistent with the basis required by Australian Accounting Standards
• tested whether forecast cash flows used in the impairment model were consistent with the most recent Corporate Plan formally approved by directors
• considered whether the forecast cash flows used in the impairment model were reasonable and based on supportable assumptions by: o comparing long term mineral sands pricing
data used in the impairment model to independent industry forecasts and long term sales contracts
o comparing the forecasted cash flows to actual cash flows for previous years to assess the accuracy of the Group’s forecasting
o assessing the objectivity and competence of internal engineering experts who assisted in developing ore reserve estimates for the Sierra Rutile CGU’s future developments
o comparing foreign exchange rate and inflation rate assumptions in the impairment model to current economic forecasts, and
o assessing the Group’s discount rate calculations, including having regard to the inputs utilised in the Group’s weighted average cost of capital such as peer company
INDEPENDENT AUDITOR’S REPORTTo the members of Iluka Resources Limited
For the year ended 31 December 2019
For
per
sona
l use
onl
y

Iluka Resources Limited, Annual Report 2019140
Key audit matter How our audit addressed the key audit matter betas, risk free rate and gearing ratios, assisted by PwC valuation experts
• tested the mathematical accuracy of the impairment model’s calculations, and
• evaluated the adequacy of the disclosures made in note 7 including those regarding key assumptions used in the impairment assessment, in light of the requirements of Australian Accounting Standards.
Closure and rehabilitation provisions in Virginia Refer to Critical accounting estimates and judgements in note 3 and note 8 to the financial statements
As a result of its mining and processing operations, the Group is obliged to restore and rehabilitate the environment disturbed by these operations and remove related infrastructure. Rehabilitation activities are governed by a combination of legislative requirements and Group policies.
At 31 December 2019 the balance sheet included provisions for such obligations of $788.5 million. We placed particular focus on the closure and rehabilitation provisions for the Group’s legacy operations in Virginia and related disclosure due to the significant estimates made by the Group in determining the likely outcome of these matters. These provisions comprise a substantial portion of the $304.4 million US/MB segment liabilities.
This was a key audit matter given the determination of these provisions required judgement in the assessment of the nature and extent of the work to be performed, the future cost of performing the work, the timing of when the rehabilitation will take place and economic assumptions such as the discount rate for future cash outflows associated with rehabilitation activities.
We performed tests over the calculation and disclosures relating to the rehabilitation provision for the Group’s legacy Virginia operations.
We evaluated key assumptions utilised in these models by performing the following procedures:
• evaluated the competency and independence of the experts retained by the Group to assist with the assessment of its rehabilitation obligations
• examined the Group’s assessment of significant changes in future cost estimates from the prior year
• compared the estimated future rehabilitation costs to actual costs being incurred at the Group’s sites for similar activities and current contracts in place to assess the extent to which rehabilitation estimates take into account current experience
• assessed the ability of the Group to make reliable estimates of the extent of future rehabilitation expenditure by comparing actual cash outflows in 2019 to those forecast as part of the provision in previous years
• assessed the Group’s judgments in relation to the manner in which the rehabilitation of legacy sites in Virginia is likely to occur, and
• considered the appropriateness of the discount rates and inflation rates utilised in calculating the provision by comparing them to current market consensus.
Other information The directors are responsible for the other information. The other information comprises the information included in the annual report for the year ended 31 December 2019, but does not include the financial report and our auditor’s report thereon.
Our opinion on the financial report does not cover the other information and accordingly we do not express any form of assurance conclusion thereon.
In connection with our audit of the financial report, our responsibility is to read the other information and, in doing so, consider whether the other information is materially inconsistent with the financial report or our knowledge obtained in the audit, or otherwise appears to be materially misstated.
If, based on the work we have performed on the other information that we obtained prior to the date of this auditor’s report, we conclude that there is a material misstatement of this other information, we are required to report that fact. We have nothing to report in this regard.
Responsibilities of the directors for the financial report The directors of the Company are responsible for the preparation of the financial report that gives a true and fair view in accordance with Australian Accounting Standards and the Corporations Act 2001 and for such internal control as the directors determine is necessary to enable the preparation of the financial report that gives a true and fair view and is free from material misstatement, whether due to fraud or error.
In preparing the financial report, the directors are responsible for assessing the ability of the Group to continue as a going concern, disclosing, as applicable, matters related to going concern and using the going concern basis of accounting unless the directors either intend to liquidate the Group or to cease operations, or have no realistic alternative but to do so.
Auditor’s responsibilities for the audit of the financial report Our objectives are to obtain reasonable assurance about whether the financial report as a whole is free from material misstatement, whether due to fraud or error, and to issue an auditor’s report that includes our opinion. Reasonable assurance is a high level of assurance, but is not a guarantee that an audit conducted in accordance with the Australian Auditing Standards will always detect a material misstatement when it exists. Misstatements can arise from fraud or error and are considered material if, individually or in the aggregate, they could reasonably be expected to influence the economic decisions of users taken on the basis of the financial report.
A further description of our responsibilities for the audit of the financial report is located at the Auditing and Assurance Standards Board website at: http://www.auasb.gov.au/auditors_responsibilities/ar1.pdf. This description forms part of our auditor's report.
INDEPENDENT AUDITOR’S REPORTTo the members of Iluka Resources Limited
For the year ended 31 December 2019
For
per
sona
l use
onl
y

Iluka Resources Limited, Annual Report 2019 141
Other information The directors are responsible for the other information. The other information comprises the information included in the annual report for the year ended 31 December 2019, but does not include the financial report and our auditor’s report thereon.
Our opinion on the financial report does not cover the other information and accordingly we do not express any form of assurance conclusion thereon.
In connection with our audit of the financial report, our responsibility is to read the other information and, in doing so, consider whether the other information is materially inconsistent with the financial report or our knowledge obtained in the audit, or otherwise appears to be materially misstated.
If, based on the work we have performed on the other information that we obtained prior to the date of this auditor’s report, we conclude that there is a material misstatement of this other information, we are required to report that fact. We have nothing to report in this regard.
Responsibilities of the directors for the financial report The directors of the Company are responsible for the preparation of the financial report that gives a true and fair view in accordance with Australian Accounting Standards and the Corporations Act 2001 and for such internal control as the directors determine is necessary to enable the preparation of the financial report that gives a true and fair view and is free from material misstatement, whether due to fraud or error.
In preparing the financial report, the directors are responsible for assessing the ability of the Group to continue as a going concern, disclosing, as applicable, matters related to going concern and using the going concern basis of accounting unless the directors either intend to liquidate the Group or to cease operations, or have no realistic alternative but to do so.
Auditor’s responsibilities for the audit of the financial report Our objectives are to obtain reasonable assurance about whether the financial report as a whole is free from material misstatement, whether due to fraud or error, and to issue an auditor’s report that includes our opinion. Reasonable assurance is a high level of assurance, but is not a guarantee that an audit conducted in accordance with the Australian Auditing Standards will always detect a material misstatement when it exists. Misstatements can arise from fraud or error and are considered material if, individually or in the aggregate, they could reasonably be expected to influence the economic decisions of users taken on the basis of the financial report.
A further description of our responsibilities for the audit of the financial report is located at the Auditing and Assurance Standards Board website at: http://www.auasb.gov.au/auditors_responsibilities/ar1.pdf. This description forms part of our auditor's report.
INDEPENDENT AUDITOR’S REPORTTo the members of Iluka Resources Limited
For the year ended 31 December 2019
For
per
sona
l use
onl
y

Iluka Resources Limited, Annual Report 2019142
Report on the remuneration report
Our opinion on the remuneration report We have audited the remuneration report included in pages 56 to 80 of the directors’ report for the year ended 31 December 2019.
In our opinion, the remuneration report of Iluka Resources Limited for the year ended 31 December 2019 complies with section 300A of the Corporations Act 2001.
Responsibilities The directors of the Company are responsible for the preparation and presentation of the remuneration report in accordance with section 300A of the Corporations Act 2001. Our responsibility is to express an opinion on the remuneration report, based on our audit conducted in accordance with Australian Auditing Standards.
PricewaterhouseCoopers
Justin Carroll Partner
Perth 20 February 2020
INDEPENDENT AUDITOR’S REPORTTo the members of Iluka Resources Limited
For the year ended 31 December 2019
For
per
sona
l use
onl
y

Iluka Resources Limited, Annual Report 2019 143
Cataby mine, Western Australia
PHYSICAL, FINANCIAL AND CORPORATE INFORMATION
In this section
FIVE YEAR PHYSICAL AND FINANCIAL SUMMARY
OPERATING MINES PHYSICAL DATA
ORE RESERVES AND MINERAL RESOURCES STATEMENT
SHAREHOLDER AND INVESTOR INFORMATION
CORPORATE INFORMATION
For
per
sona
l use
onl
y

Iluka Resources Limited, Annual Report 2019144
FIVE YEAR PHYSICAL AND FINANCIAL SUMMARY2019 2018 2017 2016 2015
Production volumes (kt)- Zircon 322.1 348.6 312.3 347.1 388.6- Rutile 184.1 163.2 302.1 117.6 136.5- Synthetic rutile 196.2 219.9 210.8 210.9 164.9Total Z/R/SR 702.4 731.7 825.2 675.6 690- Ilmenite 318.6 395.1 448.1 329.4 466.1Sales volumes (kt)
- Zircon 274.0 379.3 380.4 338.8 346.2
- Rutile 200.1 233.2 264.3 172.1 133.6- Synthetic rutile 206.7 214.6 244.4 186.8 171.2Total Z/R/SR 680.8 827.1 889.1 697.7 651- Ilmenite 170.8 224.5 202.7 17.7 299.8Weighted average annual prices (US$/t) - Zircon (premium and standard) 1,487 1,351 958 810 986- Zircon (all products) 1,380 1,321 940 773 961- Rutile 1142 952 790 716 721- Synthetic rutile Not disclosed Not disclosed Not disclosed Not disclosed Not disclosedAverage AUD:USD spot exchange rate (cents) 69.5 74.8 76.7 74.4 75.2AUD:USD range (cents) 67.0/72.7 70.4/81.2 71.8/80.6 68.6/78.0 69.2/82.3
Unit revenue and cash cost ($/t)Revenue per tonne Z/R/SR sold (A$/t) 1,654 1,415 1,079 999 1,136Unit cash costs of production per tonne Z/R/SR produced excluding by-products
753 606 439 373 558
Unit cost of goods sold per tonne of Z/R/SR 889 750 743 700 780
Summary financials ($m) 2019 2018 2017 2016 2015Z/R/SR revenue 1,128.7 1,179.0 959.1 696.8 739.7Ilmenite and other revenue 64.4 65.1 58.4 29.5 80.1Revenue from operations 1,193.1 1,244.1 1,017.5 726.3 819.8Cash costs of production (539.6) (455.1) (372.4) (260.6) (392.5)Inventory movement – cash costs of production 63.4 (68.5) (141.5) (107.6) 9.6Restructure and idle capacity charges (19.7) (24.7) (73.3) (69.5) (38.3)Government royalties (39.4) (38.1) (25.2) (20.4) (21.0)
Marketing and selling costs (35.0) (38.1) (33.8) (36.3) (32.0)
Asset sales and other income (3.5) 1.8 0.7 (0.6) 1.4Corporate and other costs (64.5) (48.1) (47.1) (53.8) (52.7)Resources development (25.7) (30.1) (24.6) (79.4) (58.4)Mineral sands EBITDA 530.9 544.5 300.9 103.0 231.8Mining Area C EBITDA 85.1 55.6 59.6 47.5 61.6Underlying Group EBITDA1 616.0 600.1 360.5 150.5 293.4Rehabilitation and holding costs for closed sites (3.2) 4.6 (127.4) (42.6) (2.7)SRL transaction costs - - - (14.1) -Depreciation and amortisation (163.2) (93.6) (111.0) (79.9) (132.0)Inventory movement – non-cash production costs 15.5 (28.3) (66.8) (57.3) (15.3)Significant non-cash items (414.3) - (185.4) (201.0) -Net interest and finance charges (51.8) (30.8) (32.2) (30.0) (56.4)Income tax (expense) benefit (298.7) (148.1) (6.0) 53.7 (33.1)Net profit (loss) after tax for the period (NPAT) (299.7) 303.9 (171.6) (224.0) 53.5Operating cash flow 408.0 594.2 391.7 137.3 222.2Capital expenditure (197.5) (311.5) (93.1) (82.5) (66.4)Free cash (outflow) inflow2 ($m) 139.7 304.4 321.9 47.3 155.0Net (debt) cash 43.3 1.8 (182.5) (506.3) 6.0
For
per
sona
l use
onl
y
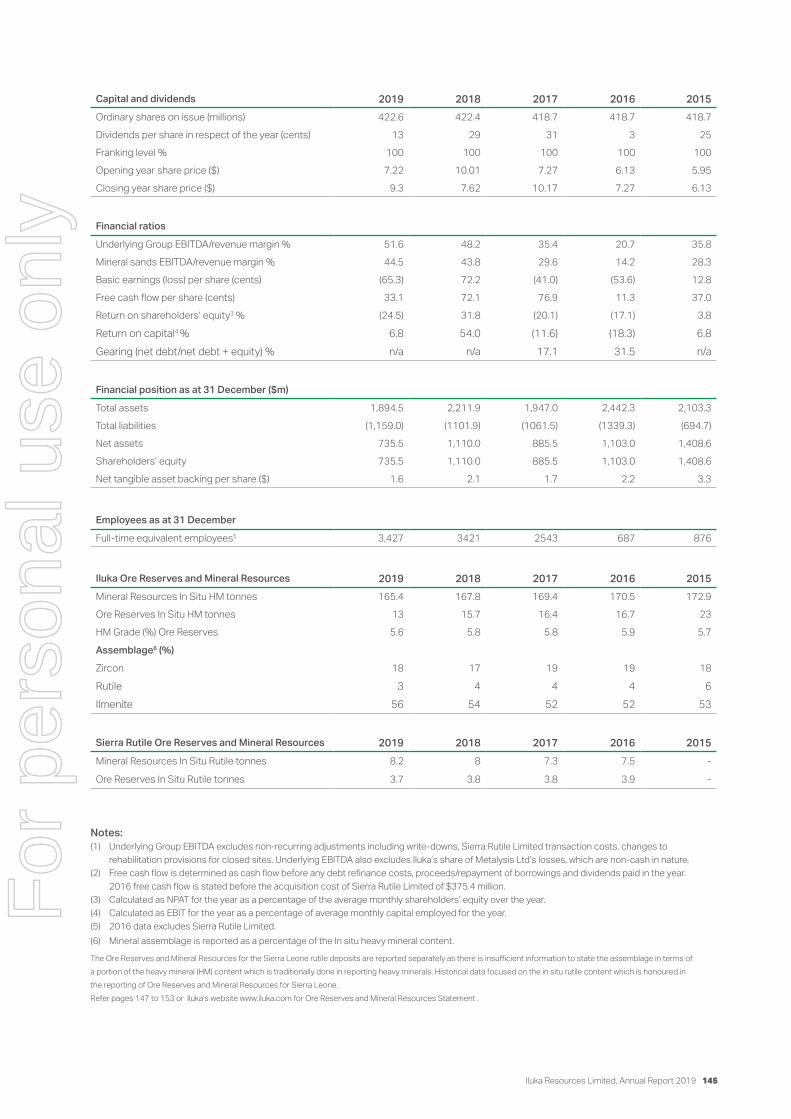
Iluka Resources Limited, Annual Report 2019 145
Capital and dividends 2019 2018 2017 2016 2015Ordinary shares on issue (millions) 422.6 422.4 418.7 418.7 418.7Dividends per share in respect of the year (cents) 13 29 31 3 25Franking level % 100 100 100 100 100Opening year share price ($) 7.22 10.01 7.27 6.13 5.95Closing year share price ($) 9.3 7.62 10.17 7.27 6.13
Financial ratios
Underlying Group EBITDA/revenue margin % 51.6 48.2 35.4 20.7 35.8Mineral sands EBITDA/revenue margin % 44.5 43.8 29.6 14.2 28.3Basic earnings (loss) per share (cents) (65.3) 72.2 (41.0) (53.6) 12.8Free cash flow per share (cents) 33.1 72.1 76.9 11.3 37.0Return on shareholders’ equity3 % (24.5) 31.8 (20.1) (17.1) 3.8
Return on capital4 % 6.8 54.0 (11.6) (18.3) 6.8Gearing (net debt/net debt + equity) % n/a n/a 17.1 31.5 n/a
Financial position as at 31 December ($m)
Total assets 1,894.5 2,211.9 1,947.0 2,442.3 2,103.3 Total liabilities (1,159.0) (1101.9) (1061.5) (1339.3) (694.7)Net assets 735.5 1,110.0 885.5 1,103.0 1,408.6 Shareholders’ equity 735.5 1,110.0 885.5 1,103.0 1,408.6 Net tangible asset backing per share ($) 1.6 2.1 1.7 2.2 3.3
Employees as at 31 December
Full-time equivalent employees5 3,427 3421 2543 687 876
Iluka Ore Reserves and Mineral Resources 2019 2018 2017 2016 2015Mineral Resources In Situ HM tonnes 165.4 167.8 169.4 170.5 172.9Ore Reserves In Situ HM tonnes 13 15.7 16.4 16.7 23HM Grade (%) Ore Reserves 5.6 5.8 5.8 5.9 5.7
Assemblage6 (%)
Zircon 18 17 19 19 18
Rutile 3 4 4 4 6Ilmenite 56 54 52 52 53
Sierra Rutile Ore Reserves and Mineral Resources 2019 2018 2017 2016 2015Mineral Resources In Situ Rutile tonnes 8.2 8 7.3 7.5 -Ore Reserves In Situ Rutile tonnes 3.7 3.8 3.8 3.9 -
Notes:(1) Underlying Group EBITDA excludes non-recurring adjustments including write-downs, Sierra Rutile Limited transaction costs, changes to
rehabilitation provisions for closed sites. Underlying EBITDA also excludes Iluka’s share of Metalysis Ltd’s losses, which are non-cash in nature.(2) Free cash flow is determined as cash flow before any debt refinance costs, proceeds/repayment of borrowings and dividends paid in the year.
2016 free cash flow is stated before the acquisition cost of Sierra Rutile Limited of $375.4 million.(3) Calculated as NPAT for the year as a percentage of the average monthly shareholders’ equity over the year.(4) Calculated as EBIT for the year as a percentage of average monthly capital employed for the year.(5) 2016 data excludes Sierra Rutile Limited.(6) Mineral assemblage is reported as a percentage of the In situ heavy mineral content.
The Ore Reserves and Mineral Resources for the Sierra Leone rutile deposits are reported separately as there is insufficient information to state the assemblage in terms of a portion of the heavy mineral (HM) content which is traditionally done in reporting heavy minerals. Historical data focused on the in situ rutile content which is honoured in the reporting of Ore Reserves and Mineral Resources for Sierra Leone. Refer pages 147 to 153 or Iluka’s website www.iluka.com for Ore Reserves and Mineral Resources Statement .
For
per
sona
l use
onl
y

Iluka Resources Limited, Annual Report 2019146
Notes:(1) Finished product includes material from heavy mineral concentrate (HMC initially processed in prior periods).
OPERATING MINES PHYSICAL DATA
Jacinth-Ambrosia/ Mid west
Cataby/ South west
Australia Total
Sierra Leone
Total Producing
OpsIdle Ops
Group Total2019
Group Total 2018
MiningOverburden moved kbcm 1,465 11,138 12,602 - 12,602 - 12,602 4,467 Ore mined kt 9,845 11,001 20,846 8,278 29,124 - 29,124 20,192 Ore grade HM % 6.3% 4.0% 5.1% 3.3% 4.6% 0.0% 4.6% 5.4%VHM grade % 5.7% 3.0% 4.3% 2.6% 3.8% 0.0% 3.8% 4.6%Concentrating HMC produced kt 558 240 799 288 1,087 - 1,087 934 VHM produced kt 500 209 709 202 911 - 911 786 VHM in HMC assemblage % 89.6% 86.9% 88.8% 70.0% 83.8% 0.0% 83.8% 84.2%Zircon 53.6% 10.7% 40.7% 4.0% 30.9% 0.0% 30.9% 46.7%Rutile 7.9% 9.5% 8.4% 47.1% 18.7% 0.0% 18.7% 16.7%Ilmenite 28.1% 66.8% 39.7% 18.9% 34.2% 0.0% 34.2% 20.8%HMC processed kt 455 217 671 290 961 - 961 1,037Finished product[1] kt Zircon 260.2 53.5 313.7 8.5 322.1 - 322.1 348.7 Rutile 31.2 15.6 46.9 137.2 184.1 - 184.1 163.2 Ilmenite (saleable/upgradeable) 107.0 152.4 259.3 59.2 318.6 - 318.6 395.2 Synthetic rutile produced kt - 196.2 196.2 - 196.2 - 196.2 219.9
Overburden moved (bank cubic metres) refers to material moved to enable mining of an ore body.
Ore mined (thousands of tonnes) refers to material moved containing heavy mineral ore.
Ore Grade HM % refers to percentage of heavy mineral (HM) found in a deposit.
VHM Grade % refers to percentage of valuable heavy mineral (VHM) — titanium dioxide (rutile and ilmenite), and zircon — found in a deposit.
Concentrating refers to the production of heavy mineral concentrate (HMC) through a wet concentrating process at the mine site, which is then transported for final processing into finished product at a mineral processing plant.
HMC produced refers to HMC, which includes the valuable heavy mineral concentrate (zircon, rutile, ilmenite) as well as other non-valuable heavy minerals (gangue).
VHM produced refers to an estimate of valuable heavy mineral in heavy mineral concentrate expected to be processed.
VHM produced and the VHM assemblage — provided to enable an indication of the valuable heavy mineral component in HMC.
HMC processed provides an indication of material emanating from each mining operation to be processed.
Finished product is provided as an indication of the finished production (zircon, rutile, ilmenite – both saleable and upgradeable) attributable to the VHM in HMC production streams from the various mining operations. Finished product levels are subject to recovery factors which can vary. The difference between the VHM produced and finished product reflects the recovery level by operation, as well as processing of finished material/concentrate in inventory. Ultimate finished product production (rutile, ilmenite, and zircon) is subject to recovery loss at the processing stage – this may be in the order of 10 per cent.
Ilmenite is produced for sale or as a feedstock for synthetic rutile production. Typically, 1 tonne of upgradeable ilmenite will produce between 0.56 to 0.60 tonnes of SR. Iluka also purchases external ilmenite for its synthetic rutile production process.
12 MONTHS TO 31 DECEMBER 2019
GLOSSARY
For
per
sona
l use
onl
y

Iluka Resources Limited, Annual Report 2019 147
ORE RESERVES AND MINERAL RESOURCES STATEMENTHM ORE RESERVES
Summary of Ore Reserves for Iluka (1,2,3,6) HM Assemblage(4)
Country Region
Ore Reserve Category
Ore TonnesMillions
In Situ HMTonnesMillions
HMGrade
(%)
IlmeniteGrade
(%)
ZirconGrade
(%)
RutileGrade
(%)
Change HMTonnesMillions
Australia Eucla Basin Proved 82 2.5 3.0 28 47 5 Probable 5 0.1 2.0 18 51 4
Total Eucla Basin 87 2.6 2.9 28 47 5 (0.6)Australia Perth Basin Proved 89 6.2 7.0 57 11 4
Probable 55 4.2 7.7 72 9 2 Total Perth Basin(5) 144 10.4 7.2 63 10 3 (2.1)Total Proved 171 8.7 5.1 49 21 4 Total Probable 60 4.3 7.2 71 10 2 Grand Total 231 13.0 5.6 56 18 3 (2.7)
Iluka HM Ore Reserve breakdown by country, region and JORC Category at 31 December 2019
Notes:(1) Competent Persons — Ore Reserves: A Walkenhorst (MAusIMM). The Ore Reserves in this table have been estimated in accordance with the
JORC Code (2012 Edition), other than the Ore Reserves for the Perth Basin, South West deposits, which have not materially changed and have been estimated in accordance with the JORC Code (2004 Edition). Iluka Resources is undertaking further work in order to report these estimates in accordance with the JORC Code (2012 Edition).
(2) Ore Reserves are a sub-set of Mineral Resources.(3) Rounding may generate differences in last decimal place.(4) Mineral assemblage is reported as a percentage of In situ HM content.(5) Rutile component in Perth Basin South West operations is sold as a leucoxene product.(6) The quoted figures are stated as at the 31 December 2019 and have been depleted for all production conducted to this date.
For
per
sona
l use
onl
y

Iluka Resources Limited, Annual Report 2019148
ORE RESERVES AND MINERAL RESOURCES STATEMENTRUTILE ORE RESERVES (SIERRA LEONE)
Summary of Ore Reserves for Iluka (1, 2, 3, 6, 7) In Situ Mineral Content (4)
Country Region
Ore Reserve Category
Ore TonnesMillions
In Situ RutileTonnesMillions
RutileGrade
(%)
Ilmenite (5)
Grade(%)
Zircon (5)
Grade(%)
Change RutileTonnesMillions
Sierra Leone Sierra Leone Proved 34 0.5 1.3 - - Probable 238 3.2 1.3 - -
Total Sierra Leone 272 3.7 1.3 - - (0.3)
Iluka Rutile Ore Reserve for Sierra Rutile by JORC Category at 31 December 2019
Notes:(1) Competent Persons — Ore Reserves: A Walkenhorst (MAusIMM).(2) Ore Reserves are a sub-set of Mineral Resources.(3) Rounding may generate differences in last decimal place.(4) Mineral content is reported as a percentage of in situ material.(5) The ilmenite and zircon are only considered to be at an Inferred level of confidence in the Mineral Resource estimates, and while present, currently
have a low value ascribed in the reserve optimisation process for Sierra Leone. This is not material to the economic viability.(6) The quoted figures are stated as at 31 December 2019 and have been depleted for all production conducted to this date.(7) In June 2019, International Finance Corporation acquired a 3.57% equity stake in Iluka Investments (BVI) Limited, the holding company of Sierra
Rutile Limited. Refer Iluka ASX announcement dated 6 June 2019 for further information.
In June 2019, International Finance Corporation invested US$20m for a 3.57% equity stake in Iluka Investments (BVI) Limited, the holding company of Sierra Rutile Limited, detailed in an ASX announcement titled “Iluka to Partner With IFC In Sierra Leone” dated 6 June 2019 and available on the Iluka website at www.iluka.com.
Ore Reserves are estimated using all available geological and relevant drill hole and assay data, including mineralogical sampling and test work on mineral recoveries and final product qualities. Reserve estimates are determined by the consideration of all of the “Modifying Factors” in accordance with the JORC Code 2004 and 2012, and for example, may include but are not limited to, product prices, mining costs, metallurgical recoveries, environmental consideration, access and approvals. These factors may vary significantly between deposits.
The Ore Reserves and Mineral Resources for the Sierra Leone rutile deposits are reported separately as there is insufficient information to state the assemblage in terms of a portion of the HM content which is traditionally done in reporting HM. Historical data focused on the In situ rutile content which is honoured in the reporting of Ore Reserves and Mineral Resources for Sierra Leone. An equivalent comparison of the rutile tonnages contained in Iluka’s Ore Reserve inventory for HM can be calculated using the formula:
[Rutile tonnes = HM tonnes * Rutile %] that is [13.0*(3/100)] = 0.39 Mt of rutile.
For the year ending 2019, HM Ore Reserves decreased by 2.7Mt HM associated with mining depletion and adjustments, down from 15.7Mt HM to 13.0Mt HM.
The main factors contributing to the movement in Iluka’s HM Ore Reserves during 2019 include the following:
• The Eucla Basin Ore Reserves decreased by 0.6Mt HM associated with mining depletion and pit re-design at Jacinth and Ambrosia.• The Perth Basin Ore Reserves decreased by 2.1Mt HM as a result of mine depletion and adjustment at Cataby delisting IPL North and reporting of the Mineral Separation Plant (MSP) By-Product Stockpile. F
or p
erso
nal u
se o
nly

Iluka Resources Limited, Annual Report 2019 149
HM ORE RESERVES MINED AND ADJUSTED
Summary of Ore Reserve Depletion (1)
Country Region Category
In SituHM
TonnesMillions
2018
In SituHM
Grade(%)
2018
In SituHM
TonnesMillions Mined 2019
In SituHM
Tonnes(2)
Millions Adjusted
2019
In SituHM
TonnesMillions
2019
In SituHM
Grade (%)
2019
In SituHM
Tonnes(3)
MillionsNet Change
Australia Eucla Basin Active Mines 1.3 3.5 (0.6) 1.9 2.6 3.0 1.3 Non-Active Sites 2.0 3.5 - (2.0) - 2.9 (2.0)
Total Eucla Basin 3.2 3.5 (0.6) (0.0) 2.6 2.9 (0.6)Perth Basin Active Mines - - (0.3) 7.1 6.8 5.8 6.8
Non-Active Sites 12.5 6.9 - (8.9) 3.6 13.5 (8.9)Total Perth Basin 12.5 6.9 (0.3) (1.8) 10.4 7.2 (2.1)Total Active Mines 1.3 3.5 (0.9) 9.0 9.4 5.2 8.1
Total Non-Active Sites 14.4 6.1 - (10.8) 3.6 6.3 (10.8)
Total Ore Reserves 15.7 5.8 (0.9) (1.8) 13.0 5.6 (2.7)
Iluka HM Ore Reserves mined and adjusted by country and region at 31 December 2019
Notes: (1) Rounding may generate differences in last decimal place. (2) Adjusted figure includes write-downs and modifications in mine design. (3) Net change includes depletion by mining and adjustments.
RUTILE ORE RESERVES MINED AND ADJUSTED
Summary of Ore Reserve Depletion (1)
Country Region Category
In SituRutile
TonnesMillions
2018
In SituRutileGrade
(%)2018
In SituRutile
TonnesMillions Mined 2019
In SituRutile
Tonnes(2)
Millions Adjusted
2019
In SituRutile
TonnesMillions
2019
In SituRutileGrade
(%) 2019
In SituRutile
Tonnes(3)
MillionsNet Change
Sierra Leone Sierra Leone Active Mines 0.8 1.4 (0.1) (0.1) 0.6 1.3 (0.2)
Non-Active Sites 3.1 1.3 - (0.0) 3.1 1.3 (0.0)Total Sierra Leone 3.9 1.4 (0.1) (0.1) 3.7 1.3 (0.3)
Iluka Rutile Ore Reserves mined and adjusted for Sierra Rutile at 31 December 2019
The rutile Ore Reserves for Sierra Leone decreased by 0.3Mt rutile associated with mining depletion and adjustment at Lanti, Gangama and Gbeni and adjustments at Benduma, Dodo, Kamatipa, Kibi and Komende down from 3.9Mt rutile to 3.7Mt rutile.
Notes: (1) Rounding may generate differences in last decimal place. (2) Adjusted figure includes write-downs and modifications in mine design. (3) Net change includes depletion by mining and adjustments.
For
per
sona
l use
onl
y

Iluka Resources Limited, Annual Report 2019150
ORE RESERVES AND MINERAL RESOURCES STATEMENTHM MINERAL RESOURCES
Summary of Mineral Reserves for Iluka (1,2,3) HM Assemblage(4)
Country Region
Mineral Resource Category
MaterialTonnesMillions
In Situ HMTonnesMillions
In Situ HMGrade
(%)
IlmeniteGrade
(%)
ZirconGrade
(%)
RutileGrade
(%)
Change HMTonnesMillions
Australia Eucla Basin Measured 204 5.5 2.7 34 40 4Indicated 81 8.0 9.8 68 18 2Inferred 76 3.9 5.1 59 21 2
Total Eucla Basin 361 17.4 4.8 55 26 3 (0.8)Murray Basin Measured 16 4.4 27.6 62 11 11
Indicated 88 18.5 21.0 56 11 14Inferred 91 10.5 11.6 49 10 14
Total Murray Basin 195 33.4 17.2 54 11 13 0.0Perth Basin Measured 482 29.0 6.0 58 11 5
Indicated 308 16.5 5.4 54 10 5Inferred 204 10.1 4.9 56 9 5
Total Perth Basin(5) 994 55.6 5.6 56 10 5 0.0
USA Atlantic Seaboard Measured 27 1.3 4.9 67 9 -
Indicated 47 2.5 5.3 64 11 -Inferred 16 0.5 3.1 60 11 -
Total Atlantic Seaboard(6) 91 4.4 4.8 64 10 - -
Sri Lanka Sri Lanka Measured 214 22.2 10.4 70 3 4Indicated 93 6.7 7.2 69 3 3Inferred 366 25.7 7.0 65 4 5
Total Sri Lanka(7) 673 54.6 8.1 68 4 4 (1.7)Total Measured 943 62.5 6.6 60 11 5Total Indicated 617 52.2 8.5 59 11 7Total Inferred 753 50.7 6.7 59 7 6Grand Total 2,313 165.4 7.1 60 10 6 (2.4)
Iluka Mineral Resource Breakdown by country, region and JORC category at 31 December 2019
Notes:(1) Competent Persons — Mineral Resources: B Gibson (MAIG).(2) Mineral Resources are inclusive of Ore Reserves.(3) Rounding may generate differences in last decimal place.(4) Mineral assemblage is reported as a percentage of the In situ HM component.(5) Rutile component in Perth Basin South West operations is sold as a leucoxene product.(6) Rutile is included in ilmenite for the Atlantic Seaboard region.(7) The Sri Lanka resource estimates are based on a 100 per cent ownership basis which applies to the exploration stage. The Sri Lankan Exchange
Control Act currently limits the percentage holding of a foreign entity in a Sri Lankan mining company to 40 per cent, although approval for up to 100 per cent may be granted.F
or p
erso
nal u
se o
nly

Iluka Resources Limited, Annual Report 2019 151
RUTILE MINERAL RESOURCES (SIERRA LEONE)
Iluka Rutile Mineral Resources for Sierra Rutile by JORC Category at 31 December 2019
Summary of Mineral Resources for Iluka (1,2,3,6) In Situ Mineral Content (4)
Country Region
Mineral Resource Category
MaterialTonnesMillions
In Situ RutileTonnesMillions
RutileGrade
(%)
Ilmenite (5)
Grade(%)
Zircon (5)
Grade(%)
Change RutileTonnesMillions
Sierra Leone Sierra Leone Measured 56 0.7 1.2 0.5 0.1 Indicated 506 5.6 1.1 0.9 0.1 Inferred 177 1.9 1.1 0.7 0.1
Total Sierra Leone 739 8.2 1.1 0.8 0.1 0.2
Notes:(1) Competent Persons — Mineral Resources: B Gibson (MAIG).(2) Mineral Resources are reported inclusive of Ore Reserves.(3) Rounding may generate differences in last decimal place.(4) Mineral assemblage is reported as a percentage of In situ material.(5) Ilmenite and zircon are included for tabulation purposes under the Measured and Indicated Resource categories. The confidence in the Mineral
Resource estimates for ilmenite and zircon are only considered to be at an Inferred level of confidence and should not be used in the estimation of Ore Reserves.
(6) In June 2019, International Finance Corporation acquired a 3.57% equity stake in Iluka Investments (BVI) Limited, the holding company of Sierra Rutile Limited. Refer Iluka ASX announcement dated 6 June 2019 for further information.
In June 2019, International Finance Corporation invested US$20m for a 3.57% equity stake in Iluka Investments (BVI) Limited, the holding company of Sierra Rutile Limited, detailed in an ASX announcement titled “Iluka to Partner With IFC In Sierra Leone” dated 6 June 2019 and available on the Iluka website at www.iluka.com.
Mineral Resources are estimated using all available and relevant geological, drill hole and assay data, including mineralogical sampling and test work on mineral and final product qualities. Resource estimates are determined by consideration of geology, HM cut-off grades, mineralisation thickness vs. overburden ratios and consideration of the potential mining and extraction methodology and are prepared in accordance with the 2012 JORC Code. These factors may vary significantly between deposits.
For the year ending 2019, Mineral Resources (excluding the Mineral Resources attributable to Sierra Rutile) decreased by 2.4Mt HM net of mining depletion and adjustments (exploration discovery, development and write-downs) down from 167.8Mt HM to 165.4Mt HM.
The change in Mineral Resources for 2019 was driven by the following:
• Eucla Basin Mineral Resources decreased by 0.8Mt HM as a result of re-estimation, re-reporting and mining depletion at Ambrosia and mining depletion and write-down at Jacinth.
• The Perth Basin Mineral Resources increased by 0.01Mt HM principally associated with re-estimation of the MSP By-Product Stockpile, re-estimation, re-reporting and mining depletion at Cataby and write-down of the South Secondary Mids.
• Sri Lanka Mineral Resources decreased by 1.7Mt HM as a result of re-estimation and re-reporting.
The rutile Mineral Resources for Sierra Leone increased by 0.22Mt rutile, net of mining and adjustments, associated with mining depletion and write-down for Lanti (-0.03Mt of rutile) and Gbeni (-0.04Mt of rutile), mining depletion and adjustment for Gangama (0.07Mt of rutile ) and inaugural estimation and reporting for Pejebu (0.22Mt of rutile).
For
per
sona
l use
onl
y

Iluka Resources Limited, Annual Report 2019152
ORE RESERVES AND MINERAL RESOURCES STATEMENTHM MINERAL RESOURCES MINED AND ADJUSTED
Iluka Mineral Resources mined and adjusted by country and region at 31 December 2019
Summary of Mineral Resource Depletion (1)
Country Region Category
In Situ HMTonnesMillions
2018
In Situ HMGrade
(%)2018
In Situ HMTonnes Millions Mined 2019
In Situ HMTonnes (2)
Millions Adjusted
2019
In Situ HM
Tonnes Millions
2019
In Situ HM
Grade (%)
2019
In Situ HMTonnes (3)
Millions Net Change
Australia Eucla Basin Active Mines 1.6 3.2 (0.6) 3.2 4.2 2.3 2.6
Non-Active Sites 16.6 5.1 - (3.4) 13.3 7.5 (3.4)
Total Eucla Basin 18.2 4.8 (0.6) (0.2) 17.4 4.8 (0.8)
Murray Basin Active Mines - - - - - - -
Non-Active Sites 33.4 17.2 - 0.0 33.4 17.2 0.0
Total Murray Basin 33.4 17.2 - 0.0 33.4 17.2 0.0
Perth Basin Active Mines - - (0.3) 14.0 13.7 4.5 13.7
Non-Active Sites 55.6 5.6 - (13.7) 41.9 6.1 (13.7)
Total Perth Basin 55.6 5.6 (0.3) 0.3 55.6 5.6 0.0
USA Atlantic Seaboard
Active Mines - - - - - - -
Non-Active Sites 4.4 4.8 - - 4.4 4.8 -
Total Atlantic Seaboard 4.4 4.8 - - 4.4 4.8 -
Sri Lanka Sri Lanka Active Mines - - - - - - -
Non-Active Sites 56.3 8.2 - (1.7) 54.6 8.1 (1.7)
Total Sri Lanka 56.3 8.2 - (1.7) 54.6 8.1 (1.7)Total Active Mines 1.6 3.2 (0.9) 17.2 17.9 3.6 16.3
Total Non-Active Sites 166.2 7.2 - (18.7) 147.5 8.1 (18.7)
Total Mineral Resources 167.8 7.1 (0.9) (1.6) 165.4 7.1 (2.4)
Notes:(1) Rounding may generate differences in last decimal place.(2) Adjusted figure includes write-downs and modifications in mine design.(3) Net difference includes depletion by mining and adjustments.
For
per
sona
l use
onl
y

Iluka Resources Limited, Annual Report 2019 153
RUTILE MINERAL RESOURCES MINED AND ADJUSTED (SIERRA LEONE)
Iluka Mineral Resources mined and adjusted for Sierra Rutile at 31 December 2019
Summary of Mineral Resource Depletion (1)
Country Region Category
In Situ Rutile
TonnesMillions
2018
In Situ RutileGrade
(%) 2018
In Situ Rutile
Tonnes Millions Mined 2019
In Situ Rutile
Tonnes (2)
Millions Adjusted
2019
In Situ Rutile
Tonnes Millions
2019
In Situ RutileGrade
(%) 2019
In Situ Rutile
Tonnes (3)
Millions Net Change
Sierra Leone Sierra Leone Active
Mines 1.7 1.2 (0.1) 0.1 1.7 1.2 (0.0)
Non-Active Sites 6.3 1.1 - 0.2 6.5 1.1 0.2
Total Sierra Leone 8.0 1.1 (0.1) 0.4 8.2 1.1 0.2
Notes:(1) Rounding may generate differences in last decimal place.(2) Adjusted figure includes write-downs and modifications in mine design.(3) Net difference includes depletion by mining and adjustments.
For
per
sona
l use
onl
y

Iluka Resources Limited, Annual Report 2019154
ANNUAL STATEMENT OF MINERAL RESOURCES AND ORE RESERVES
The Annual Statement of Mineral Resources and Ore Reserves as at 31 December 2019 presented in this report has been prepared in accordance with the Australasian Code for Reporting of Exploration Results, Mineral Resources and Ore Reserves 2012 Edition (the JORC Code 2012) and ASX Listing Rules and as disclosed in the announcement dated 20/02/2017. Information prepared and disclosed under the JORC Code 2004 Edition which has not materially changed since last reported has not been updated. Iluka is not aware of any new information or data that materially affects the information included in this Annual Statement and confirms that the material assumptions and technical parameters underpinning the estimates in the relevant market announcement continue to apply and have not materially changed.
COMPETENT PERSONS STATEMENT
The information in this report that relates to Mineral Resources is based on information compiled by Mr Brett Gibson who is a Member of the Australian Institute of Geoscientists (MAIG).
The information in this report that relates to Ore Reserves is based on information compiled by Mr Andrew Walkenhorst who is a Member of the Australasian Institute of Mining and Metallurgy (MAusIMM).
Mr Gibson and Mr Walkenhorst are full-time employees of Iluka Resources.
Mr Gibson and Mr Walkenhorst each have sufficient experience that is relevant to the styles of mineralisation and types of deposits under consideration and to the activity which is being undertaken to qualify as a Competent Person as defined in the 2012 Edition of the ‘Australasian Code for Reporting of Exploration Results, Mineral Resources and Ore Reserves’, the JORC Code 2012 Edition. Mr Gibson and Mr Walkenhorst consent to the inclusion in this report of the matters based on their information in the form and context in which it appears.
The information in this report that relates to specific Mineral Resources and Ore Reserves is based on and accurately reflects reports compiled by Competent Persons as defined in the JORC Code 2012 for each of the company regional business units. Each of these persons is a full-time employee of Iluka Resources Limited or its relevant subsidiaries, holds equity securities in Iluka Resources Limited and is entitled to participate in Iluka’s executive equity long term incentive plan, details of which are included in Iluka’s 2019 Remuneration Report.
All the Competent Persons named are Members of The Australasian Institute of Mining and Metallurgy and/or The Australian Institute of Geoscientists and/or the relevant jurisdiction ROPO (Recognised Overseas Professional Organisation) and have sufficient experience which is relevant to the styles of mineralisation and types of deposits under consideration and to the activity they are undertaking to qualify as a Competent Person as defined in the JORC Code 2012. At the reporting date, each Competent Person listed in this Report is a full-time employee of Iluka Resources Limited or one of its subsidiaries. Each Competent Person consents to the inclusion of material in the form and context in which it appears.
All of the Mineral Resource and Ore Reserve figures reported represent estimates as at 31 December 2019. All tonnes and grade information has been rounded, hence small differences may be present in the totals. All of the Mineral Resource information is inclusive of Ore Reserves (i.e. Mineral Resources are not additional to Ore Reserves).
MINERAL RESOURCES AND ORE RESERVES CORPORATE GOVERNANCE
Iluka has an established governance process supporting the preparation and publication of Mineral Resources and Ore Reserves which includes a series of structures and processes independent of the operational reporting through business units and product groups.
The Audit and Risk Committee has in its remit the governance of resources and reserves. This includes an annual review of Mineral Resources and Ore Reserves at a group level, as well as review of findings and progress from the Group Resources and Reserves internal audit programme within the regular meeting schedule.
Mineral Resources and Ore Reserves are estimated by Iluka Personnel or suitably qualified independent personnel using industry standard techniques and supported by internal guidelines for the estimation and reporting of Mineral Resources and Ore Reserves.
All Mineral Resource and Ore Reserve estimates and supporting documentation is reviewed by Competent Persons employed by Iluka. If there is a material change in the estimate of a Mineral Resource, the Modifying Factors for the preparation of Ore Reserves, or reporting an inaugural Mineral Resource or Ore Reserve and if it is considered prudent to have an external review, then the estimate and supporting documentation in question is reviewed by a suitably qualified independent Competent Person.
For
per
sona
l use
onl
y

Iluka Resources Limited, Annual Report 2019 155
The Iluka Mineral Resource and Ore Reserve position is reviewed annually by a suitably qualified independent Competent Person prior to publication and the governance process is also audited by an independent body (PricewaterhouseCoopers).
Iluka has continued the development of internal systems and controls in order to meet JORC (2012) guidelines in all external reporting including the preparation of all reported data by Competent Persons as members of The Australasian Institute of Mining and Metallurgy (The AusIMM), The Australian Institute of Geoscientists (AIG) or Recognised Overseas Professional Organisations (ROPOs).
The establishment of an enhanced governance process has also been supported by a number of process improvements and training initiatives over recent years, including a web-based Group reporting and sign-off database, annual internal Competent Person reports and Competent Person development and training.
For
per
sona
l use
onl
y

Iluka Resources Limited, Annual Report 2019156
SHAREHOLDERS AND CORPORATE INFORMATIONas at 31 January 2020
AUSTRALIAN SECURITIES EXCHANGE LISTING
Iluka’s shares are listed on the Australian Securities Exchange (ASX) Limited. The company is listed as Iluka Resources Limited with an ASX code of ILU.
SHARES ON ISSUE
The company had 422,584,778 shares on issue as at 31 January 2020. A total of 470,456 ordinary shares are restricted pursuant to the Directors, Executives and employees share acquisition plan, equity incentive plan and employee share plan.
SHAREHOLDINGS
There were 19,953 shareholders. Voting rights, on a show of hands, are one vote for every registered holder and on a poll, are one vote for each share held by registered holders.
DISTRIBUTION OF SHAREHOLDINGS
TOP 20 SHAREHOLDERS (NOMINEE COMPANY HOLDINGS)
SUBSTANTIAL SHAREHOLDERS (AS PROVIDED IN DISCLOSED SUBSTANTIAL SHAREHOLDER NOTICES TO THE COMPANY)
Range Total holders1 - 1,000 11,9811,001 - 5,000 6,9855,001 - 10,000 1,15710,001 - 100,000 672100,001 - 1,000,000 361,000,001 Over 14
Unmarketable Parcels (less than $500) - 1,274
Name Number of shares % UnitsHSBC CUSTODY NOMINEES (AUSTRALIA) LIMITED 136,061,433 32.20J P MORGAN NOMINEES AUSTRALIA PTY LIMITED 90,595,400 21.44CITICORP NOMINEES PTY LIMITED 49,370,210 11.68NATIONAL NOMINEES LIMITED 37,395,216 8.85BNP PARIBAS NOMS PTY LTD (DRP) 15,341,144 3.63BNP PARIBAS NOMINEES PTY LTD (AGENCY LENDING DRP A/C) 10,879,458 2.57UBS NOMINEES PTY LTD 10,276,490 2.43CS FOURTH NOMINEES PTY LIMITED (HSBC CUST NOM AU LTD 11 A/C) 4,552,143 1.08HSBC CUSTODY NOMINEES (AUSTRALIA) LIMITED (NT-COMNWLTH SUPER CORP A/C) 3,115,390 0.74UBS NOMINEES PTY LTD 2,711,374 0.64CITICORP NOMINEES PTY LIMITED (COLONIAL FIRST STATE INV A/C) 2,140,673 0.51ARGO INVESTMENTS LIMITED 1,700,000 0.40HSBC CUSTODY NOMINEES (AUSTRALIA) LIMITED-GSCO ECA 1,233,756 0.29R O HENDERSON (BEEHIVE) PTY LIMITED 1,080,000 0.26NETWEALTH INVESTMENTS LIMITED (WRAP SERVICES A/C) 983,995 0.23BNP PARIBAS NOMS (NZ) LTD (DRP) 912,916 0.22UBS NOMINEES PTY LTD 749,218 0.18WARBONT NOMINEES PTY LTD (UNPAID ENTREPOT A/C) 702,000 0.17BNP PARIBAS NOMINEES PTY LTD HUB24 CUSTODIAL SERV LTD DRP 671,719 0.16BNP PARIBAS NOMINEES PTY LTD (IB AU NOMS RETAILCLIENT DRP) 607,976 0.14
Shareholder Shareholding % of issued capitalPerpetual Limited 52,080,085 12.32%Schroder Investment Management Australia Limited 37,438,989 8.86%Sumitomo Mitsui Trust Holdings, Inc. (Nikko Asset Management Australia) 35,063,675 8.30%BlackRock Group 28,442,428 6.73%The Vanguard Group, Inc. 21,123,617 5.00%
For
per
sona
l use
onl
y

Iluka Resources Limited, Annual Report 2019 157
CALENDAR OF KEY EVENTS
20 February Announcement of financial results 7 April 9:30am (WST) Closure of acceptances of proxies for AGM 9 April 9:30am (WST) Annual General Meeting – Perth 29 April March quarterly review 22 July June quarterly review 20 August Announcement of half year financial results 27 October September quarterly review 31 December Financial year end
All dates are indicative and subject to change. Shareholders are advised to check with the company to confirm timings.
SHAREHOLDER AND NEW INVESTOR INFORMATION
Key shareholder information – Iluka website: www.iluka.com
To assist those considering an investment in the company, the investors and media section of the Iluka website contains key shareholder information, which includes the calendar of events. This site contains information on Iluka’s products, marketing, operations, ASX releases and financial and quarterly reports. It also contains links to other sites, including the share registry.
INVESTOR RELATIONS ENQUIRIES
Investor Relations Level 17, 240 St Georges Terrace Perth WA 6000 Telephone: +61 8 9360 4700 Email: [email protected]
DIVIDENDS
Iluka’s Board of Directors typically makes a determination on dividend payments twice each year. Iluka introduced a dividend reinvestment plan (DRP) in 2018.
SHARE REGISTRY SERVICES
Shareholders who require information about their shareholdings, dividend payments or related administrative matters should contact the company’s share registry:
Computershare Investor Services Pty Limited Level 11, 172 St Georges Terrace Perth, WA 6000 Telephone: 1300 733 043 (within Australia) or +61 3 9415 4801 (outside Australia) Facsimile: +61 3 9473 2500
Postal address GPO Box 2975 Melbourne VIC 3001 Website: www.investorcentre.com/au
ANNUAL REPORTS AND EMAIL NOTIFICATION OF MAJOR ACCOUNTS
Shareholders can elect to receive a printed copy of the Annual Report and/or receive an email notification related to major company events. Please contact Computershare. Each enquiry should refer to the shareholder number which is shown on holding statements and dividend statements. F
or p
erso
nal u
se o
nly
Iluka Resources Limited, Annual Report 2019158
CORPORATE INFORMATION
WEBSITE
www.iluka.com
The site contains information on Iluka’s products, marketing, operations, ASX releases and financial and quarterly reports. It also contains links to other sites, including the share registry.
NOTICE OF ANNUAL GENERAL MEETING
Iluka’s 65th Annual General Meeting of Shareholders will be held in Meeting Room 1 at the Perth Convention and Exhibition Centre, 21 Mounts Bay Road, Perth, Western Australia, on Thursday, 9 April 2020 commencing at 9:30am (WST).
DISCLAIMER: FORWARD-LOOKING STATEMENTS
This document has been prepared by Iluka Resources Limited (Iluka). By viewing this document you acknowledge that you have read and understood the following statement.
Forward-looking statements
This document contains certain statements which constitute “forward-looking statements”. Often, but not always, forward-looking statements can generally be identified by the use of forward-looking words such as “may”, “will”, “expect”, “plan”, “believes”, “estimate”, “anticipate”, “outlook” and “guidance”, or similar expressions, and may include, without limitation, statements regarding plans; strategies and objectives of management; anticipated production and production potential; estimates of future capital expenditure or construction commencement dates; expected costs or production outputs; estimates of future product supply, demand and consumption; statements regarding future product prices; and statements regarding the expectation of future Mineral Resources and Ore Reserves. Where Iluka expresses or implies an expectation or belief as to future events or results, such expectation or belief is expressed in good faith and on a reasonable basis. No representation or warranty, express or implied, is made by Iluka that the matters stated in this document will in fact be achieved or prove to be correct. The information is based on Iluka forecasts and as such is subject to variation related to, but not restricted to, economic, market demand/supply and competitive factors. It is Iluka’s approach to modify its production settings based on market demand, and this can have a significant effect on operational parameters and associated physical and financial characteristics of the company. Forward-looking statements are only predictions and are subject to known and unknown risks, uncertainties, assumptions and other important factors that could cause the actual results, performances or achievements of Iluka to differ materially from future results, performances or achievements expressed, projected or implied by such forward-looking statements. Readers are cautioned not to place undue reliance on these forward-looking statements, which speak only as of the date thereof. Such risks and factors include, but are not limited to: changes in exchange rate assumptions; changes in product pricing assumptions; major changes in mine plans and/or resources; changes in equipment life or capability; emergence of previously underestimated technical challenges; increased costs and demand for production inputs; and environmental or social factors which may affect a licence to operate, including political risk.
Capital estimates include contingency and risk allowances commensurate with international estimating classification systems. To the extent permitted by law, Iluka, its officers, employees and advisors expressly disclaim any responsibility for the accuracy or completeness of the material contained in this document and exclude all liability whatsoever (including in negligence) for any loss or damage which may be suffered by a person as a consequence of any information in this document or any error or omission therefrom. Iluka does not undertake to release publicly any revisions to any forward-looking statement to reflect events or circumstances after the date of this document, or to reflect the occurrence of unanticipated events, except as may be required under applicable securities laws. No independent third party has reviewed the reasonableness of the forward-looking statements or any underlying assumptions.
NON-IFRS FINANCIAL INFORMATION
This document contains non-IFRS financial measures including cash production costs, non-production costs, mineral sands EBITDA, Underlying Group EBITDA, EBIT, free cash flow, and net debt amongst others. Iluka management considers these to be key financial performance indicators of the business and they are defined and/or reconciled in Iluka’s annual results materials and/or Annual Report. Non-IFRS measures have not been subject to audit or review. All figures are expressed in Australian dollars unless stated otherwise.
COMPANY DETAILS
Iluka Resources Limited ABN: 34 008 675 018
REGISTERED OFFICE
Level 17, 240 St Georges Terrace Perth Western Australia, 6000
COMPANY SECRETARY
Sue Wilson, Company Secretary Nigel Tinley, Joint Company Secretary
POSTAL ADDRESS
GPO Box U1988 Perth Western Australia, 6845 Australia Telephone: +61 8 9360 4700 Facsimile: +61 8 9360 4777
For
per
sona
l use
onl
y

Iluka Resources Limited, Annual Report 2019 159
For
per
sona
l use
onl
y

Iluka Resources Limited, Annual Report 2019160
www.iluka.com
Front cover image: Major maintenance outage (MMO) SR2 kiln, Capel, Western Australia
For
per
sona
l use
onl
y