Embed Size (px)
Citation preview
Half Year 2016 results25 February 2016
Mark Bayliss – CEO
David Grbin – CFO
For
per
sona
l use
onl
y
H1 FY16 overview
Financial results
Positive outlook for FY16
For
per
sona
l use
onl
y
Transformed from a mix of retail and auction businesses to a predominantly B2B auction focussed business
Delivering on B2B growth strategy
Unlocking value for vendors and customers by providing an efficient and liquid marketplace that allows the monetisation of assets
Grays is uniquely placed to do this given its skill sets, relationships and online expertise and capability
Refocused profitable B2C consumer auction business
Implemented new sourcing strategies, cut warehouse space and reduced costs
Exited fixed price retail (FPR) business with its sale to MySale
Given highly competitive market, high fixed costs and customer loyalty dynamics, the chance of growing the business on a sustainable profitable basis was considered low
Sale de-risks continuing operations, reduces fixed costs and allows management to refocus and reinvest cash into GEG’s growing and profitable auction business
Focusing on key strengths
3
For
per
sona
l use
onl
y
Delivering on B2B growth strategy
Over 30% yoy gross sales growth across key Corporate categories of Auto, Mining & Contracting, and Transport
Banking, Insolvency & Finance (BIF) revenue, which can fluctuate, down in H1 FY16 vs H1 FY15
FY15 benefited from some large insolvency projects
H2 FY16 pipeline is strong, with expected revenue from BIF in H2 FY16 > H1 FY16
Expanded into SE Asia with early feedback showing strong pipeline of potential sale activity
GraysOnline & Iron Planet alliance
Exclusive joint venture arrangement, leveraging our expertise to extend into SE Asia
DMS Davlan integrated into GraysOnline B2B and underpinning our initial growth into Agricultural vertical
Invested in new infrastructure, facilities and people to provide long term sustainable growth
4
For
per
sona
l use
onl
y
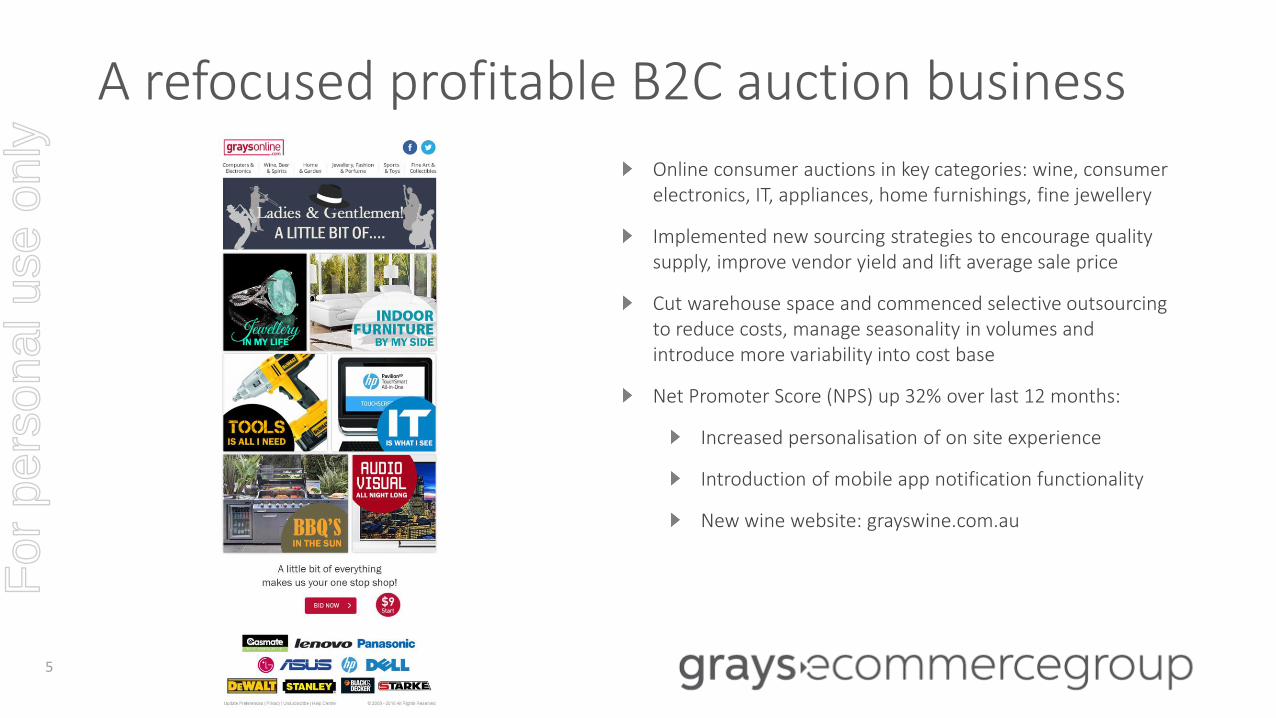
A refocused profitable B2C auction business
5
Online consumer auctions in key categories: wine, consumer electronics, IT, appliances, home furnishings, fine jewellery
Implemented new sourcing strategies to encourage quality supply, improve vendor yield and lift average sale price
Cut warehouse space and commenced selective outsourcing to reduce costs, manage seasonality in volumes and introduce more variability into cost base
Net Promoter Score (NPS) up 32% over last 12 months:
Increased personalisation of on site experience
Introduction of mobile app notification functionality
New wine website: grayswine.com.au
For
per
sona
l use
onl
y
Sale of goodwill and customer lists of OO.com.au, dealsdirect.com.au and topbuy.com.au to MySale Group plc for $5.2m
Initial purchase price component of $3.0m received in Nov 15, with remaining $2.2m received in early Feb 16
The sale proceeds covered costs associated with exiting the business
Expected to be earnings accretive in FY17
Given highly competitive market, high fixed costs and customer loyalty dynamics, the chance of growing the business on a sustainable profitable basis was considered low
Sale de-risks continuing operations, reduces fixed costs and allows management to focus and reinvest cash into the company’s growing and profitable auction business
Financial results of FPR reflected in “Disposed Operations” with $7.9m EBITDA loss and $25.0m significant item
Run down of net inventory from $11.6m at 30 Jun 15 to $1.6m at 31 Dec 15, with reduction to nil during H2 FY16
Sale of FPR business
6
For
per
sona
l use
onl
y
H1 FY16 overview
Financial results
Positive outlook for FY16
For
per
sona
l use
onl
y
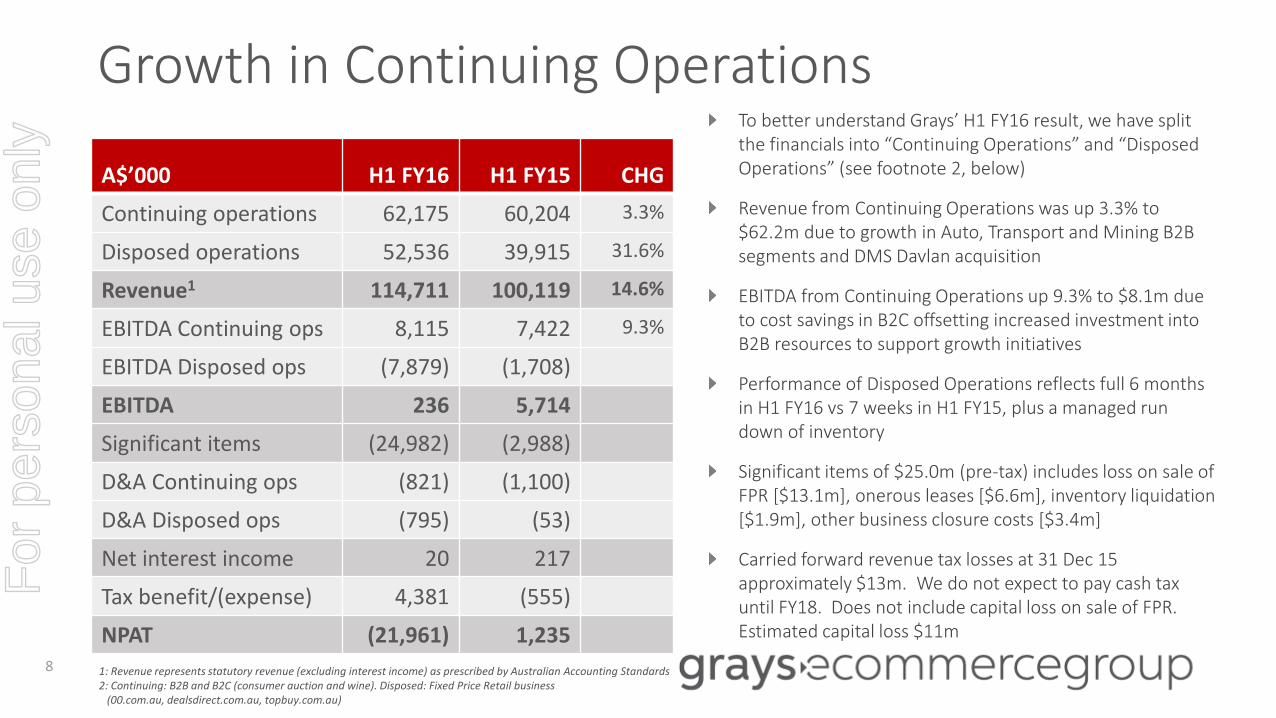
Growth in Continuing OperationsTo better understand Grays’ H1 FY16 result, we have split the financials into “Continuing Operations” and “Disposed Operations” (see footnote 2, below)
Revenue from Continuing Operations was up 3.3% to $62.2m due to growth in Auto, Transport and Mining B2B segments and DMS Davlan acquisition
EBITDA from Continuing Operations up 9.3% to $8.1m due to cost savings in B2C offsetting increased investment into B2B resources to support growth initiatives
Performance of Disposed Operations reflects full 6 months in H1 FY16 vs 7 weeks in H1 FY15, plus a managed run down of inventory
Significant items of $25.0m (pre-tax) includes loss on sale of FPR [$13.1m], onerous leases [$6.6m], inventory liquidation [$1.9m], other business closure costs [$3.4m]
Carried forward revenue tax losses at 31 Dec 15 approximately $13m. We do not expect to pay cash tax until FY18. Does not include capital loss on sale of FPR. Estimated capital loss $11m
A$’000 H1 FY16 H1 FY15 CHG
Continuing operations 62,175 60,204 3.3%
Disposed operations 52,536 39,915 31.6%
Revenue1 114,711 100,119 14.6%
EBITDA Continuing ops 8,115 7,422 9.3%
EBITDA Disposed ops (7,879) (1,708)
EBITDA 236 5,714
Significant items (24,982) (2,988)
D&A Continuing ops (821) (1,100)
D&A Disposed ops (795) (53)
Net interest income 20 217
Tax benefit/(expense) 4,381 (555)
NPAT (21,961) 1,2358 1: Revenue represents statutory revenue (excluding interest income) as prescribed by Australian Accounting Standards
2: Continuing: B2B and B2C (consumer auction and wine). Disposed: Fixed Price Retail business (00.com.au, dealsdirect.com.au, topbuy.com.au)
For
per
sona
l use
onl
y
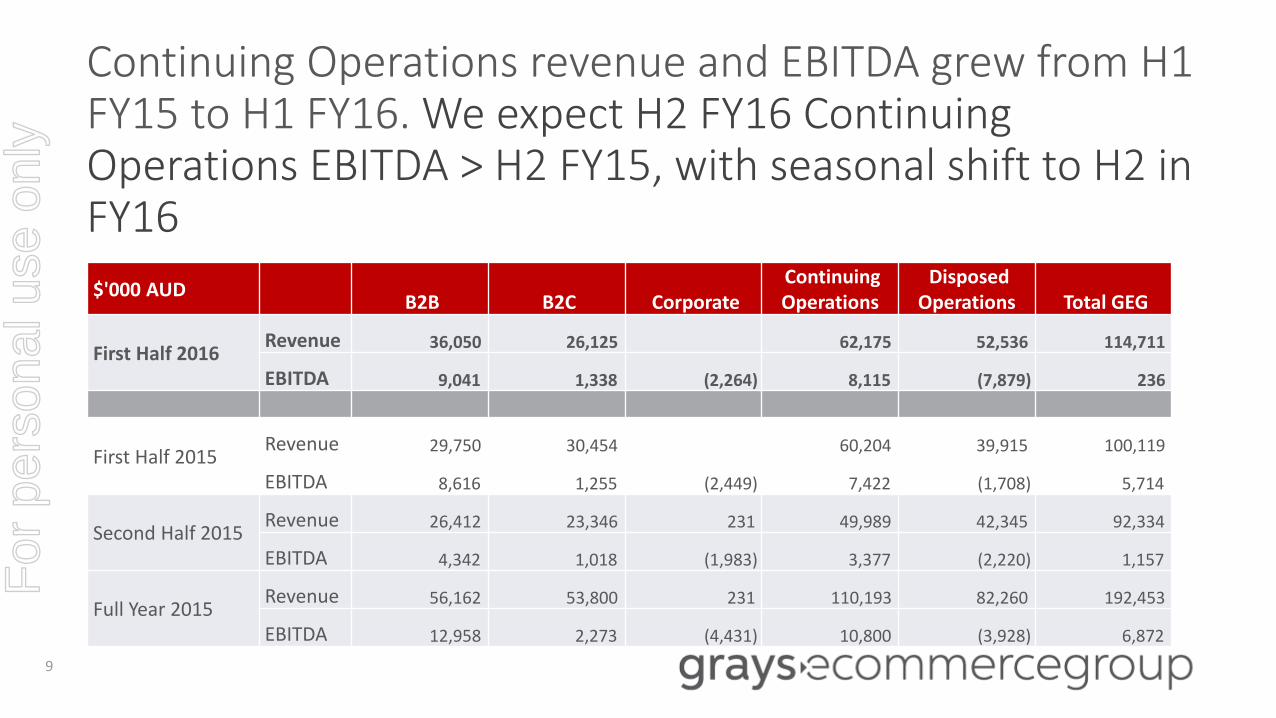
Continuing Operations revenue and EBITDA grew from H1 FY15 to H1 FY16. We expect H2 FY16 Continuing Operations EBITDA > H2 FY15, with seasonal shift to H2 in FY16
9
$'000 AUD B2B B2C Corporate
Continuing Operations
Disposed Operations Total GEG
First Half 2016 Revenue 36,050 26,125 62,175 52,536 114,711
EBITDA 9,041 1,338 (2,264) 8,115 (7,879) 236
First Half 2015 Revenue 29,750 30,454 60,204 39,915 100,119
EBITDA 8,616 1,255 (2,449) 7,422 (1,708) 5,714
Second Half 2015 Revenue 26,412 23,346 231 49,989 42,345 92,334
EBITDA 4,342 1,018 (1,983) 3,377 (2,220) 1,157
Full Year 2015 Revenue 56,162 53,800 231 110,193 82,260 192,453
EBITDA 12,958 2,273 (4,431) 10,800 (3,928) 6,872
For
per
sona
l use
onl
y
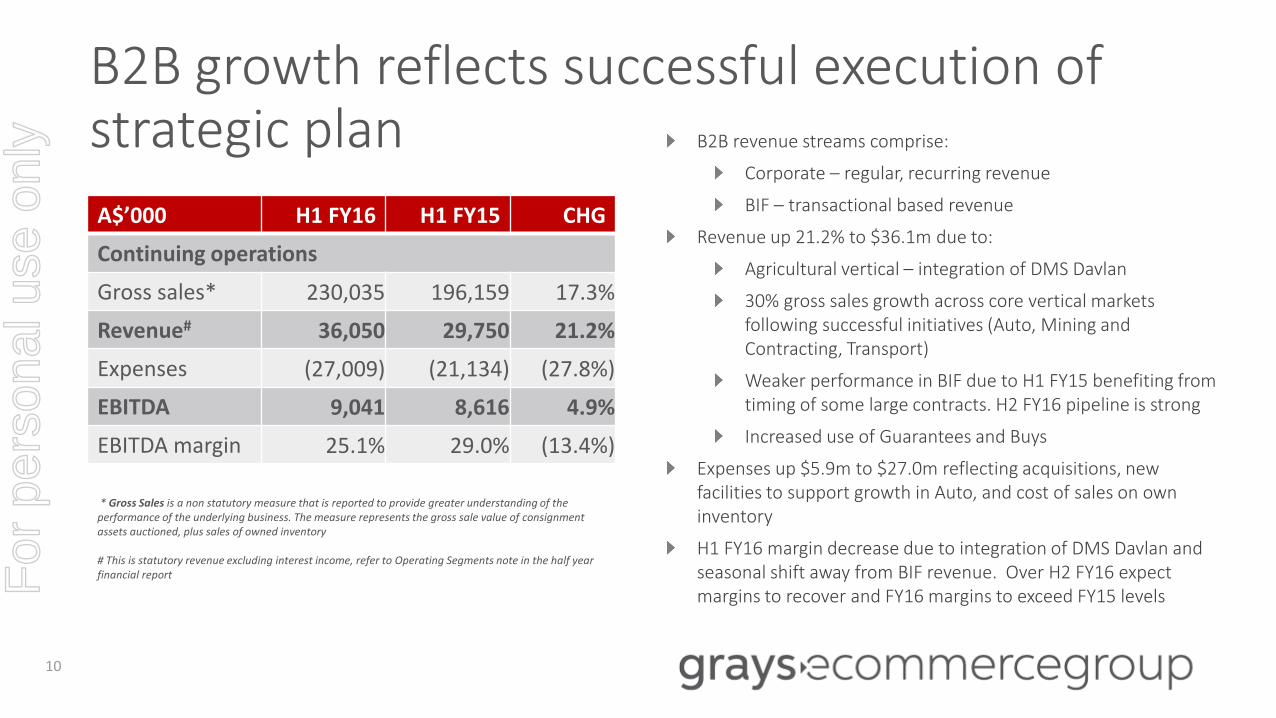
B2B growth reflects successful execution of strategic plan B2B revenue streams comprise:
Corporate – regular, recurring revenue
BIF – transactional based revenue
Revenue up 21.2% to $36.1m due to:
Agricultural vertical – integration of DMS Davlan
30% gross sales growth across core vertical markets following successful initiatives (Auto, Mining and Contracting, Transport)
Weaker performance in BIF due to H1 FY15 benefiting from timing of some large contracts. H2 FY16 pipeline is strong
Increased use of Guarantees and Buys
Expenses up $5.9m to $27.0m reflecting acquisitions, new facilities to support growth in Auto, and cost of sales on own inventory
H1 FY16 margin decrease due to integration of DMS Davlan and seasonal shift away from BIF revenue. Over H2 FY16 expect margins to recover and FY16 margins to exceed FY15 levels
* Gross Sales is a non statutory measure that is reported to provide greater understanding of the performance of the underlying business. The measure represents the gross sale value of consignment assets auctioned, plus sales of owned inventory
# This is statutory revenue excluding interest income, refer to Operating Segments note in the half year financial report
A$’000 H1 FY16 H1 FY15 CHG
Continuing operations
Gross sales* 230,035 196,159 17.3%
Revenue# 36,050 29,750 21.2%
Expenses (27,009) (21,134) (27.8%)
EBITDA 9,041 8,616 4.9%
EBITDA margin 25.1% 29.0% (13.4%)
10
For
per
sona
l use
onl
y
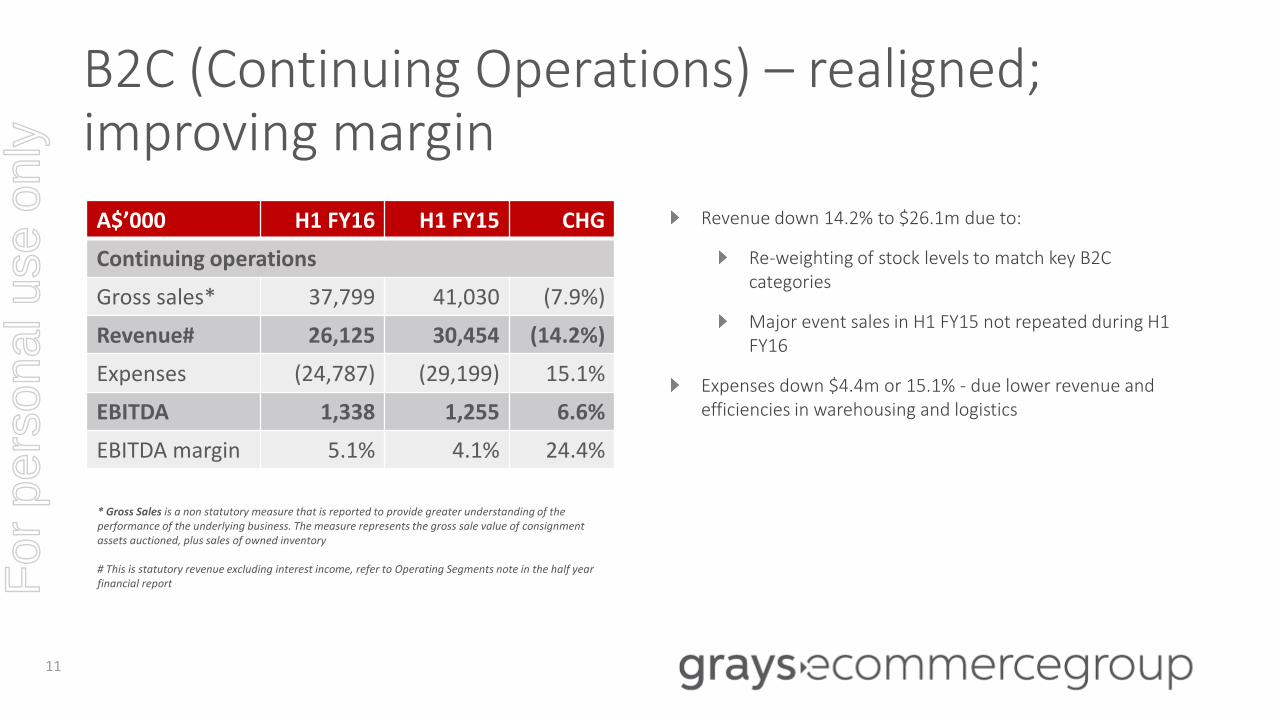
B2C (Continuing Operations) – realigned; improving margin
* Gross Sales is a non statutory measure that is reported to provide greater understanding of the performance of the underlying business. The measure represents the gross sale value of consignment assets auctioned, plus sales of owned inventory
# This is statutory revenue excluding interest income, refer to Operating Segments note in the half year financial report
11
A$’000 H1 FY16 H1 FY15 CHG
Continuing operations
Gross sales* 37,799 41,030 (7.9%)
Revenue# 26,125 30,454 (14.2%)
Expenses (24,787) (29,199) 15.1%
EBITDA 1,338 1,255 6.6%
EBITDA margin 5.1% 4.1% 24.4%
Revenue down 14.2% to $26.1m due to:
Re-weighting of stock levels to match key B2C categories
Major event sales in H1 FY15 not repeated during H1 FY16
Expenses down $4.4m or 15.1% - due lower revenue and efficiencies in warehousing and logistics
For
per
sona
l use
onl
y
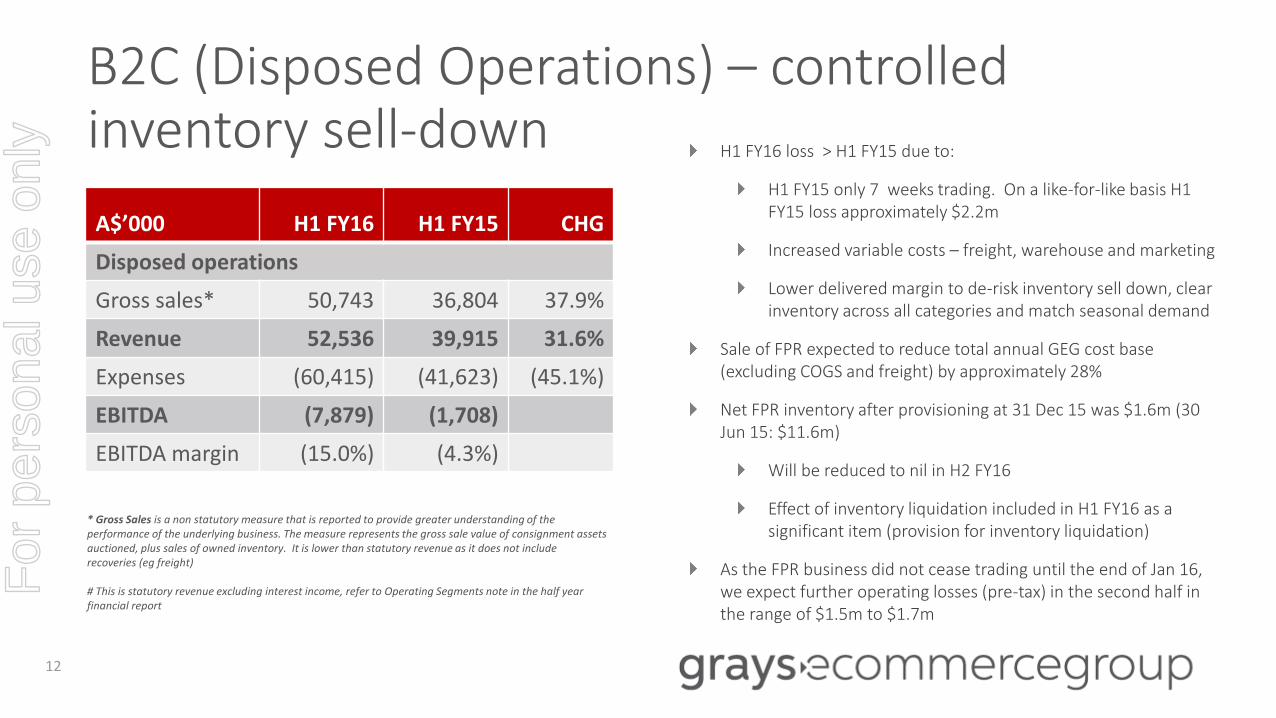
B2C (Disposed Operations) – controlled inventory sell-down
12
A$’000 H1 FY16 H1 FY15 CHG
Disposed operations
Gross sales* 50,743 36,804 37.9%
Revenue 52,536 39,915 31.6%
Expenses (60,415) (41,623) (45.1%)
EBITDA (7,879) (1,708)
EBITDA margin (15.0%) (4.3%)
* Gross Sales is a non statutory measure that is reported to provide greater understanding of the performance of the underlying business. The measure represents the gross sale value of consignment assets auctioned, plus sales of owned inventory. It is lower than statutory revenue as it does not include recoveries (eg freight)
# This is statutory revenue excluding interest income, refer to Operating Segments note in the half year financial report
H1 FY16 loss > H1 FY15 due to:
H1 FY15 only 7 weeks trading. On a like-for-like basis H1 FY15 loss approximately $2.2m
Increased variable costs – freight, warehouse and marketing
Lower delivered margin to de-risk inventory sell down, clear inventory across all categories and match seasonal demand
Sale of FPR expected to reduce total annual GEG cost base (excluding COGS and freight) by approximately 28%
Net FPR inventory after provisioning at 31 Dec 15 was $1.6m (30 Jun 15: $11.6m)
Will be reduced to nil in H2 FY16
Effect of inventory liquidation included in H1 FY16 as a significant item (provision for inventory liquidation)
As the FPR business did not cease trading until the end of Jan 16, we expect further operating losses (pre-tax) in the second half in the range of $1.5m to $1.7m
For
per
sona
l use
onl
y
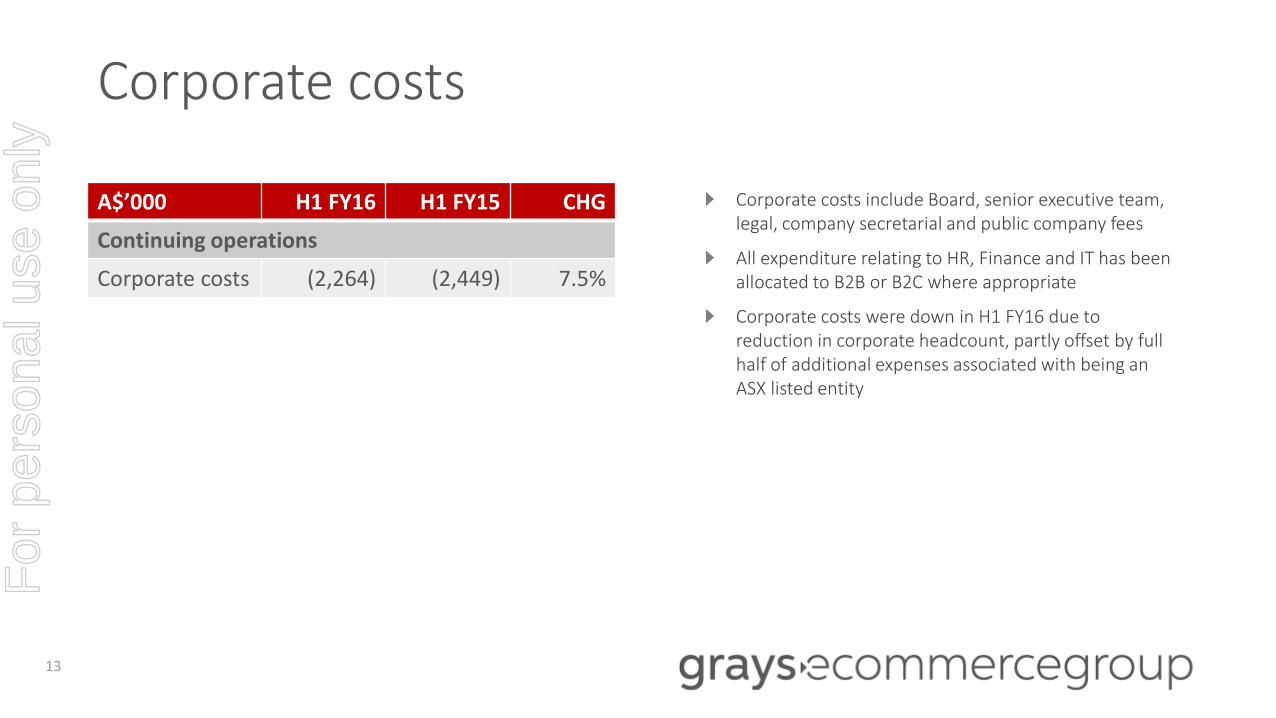
Corporate costs include Board, senior executive team, legal, company secretarial and public company fees
All expenditure relating to HR, Finance and IT has been allocated to B2B or B2C where appropriate
Corporate costs were down in H1 FY16 due to reduction in corporate headcount, partly offset by full half of additional expenses associated with being an ASX listed entity
A$’000 H1 FY16 H1 FY15 CHG
Continuing operations
Corporate costs (2,264) (2,449) 7.5%
Corporate costs
13
For
per
sona
l use
onl
y
Significant items – majority non-cash
14
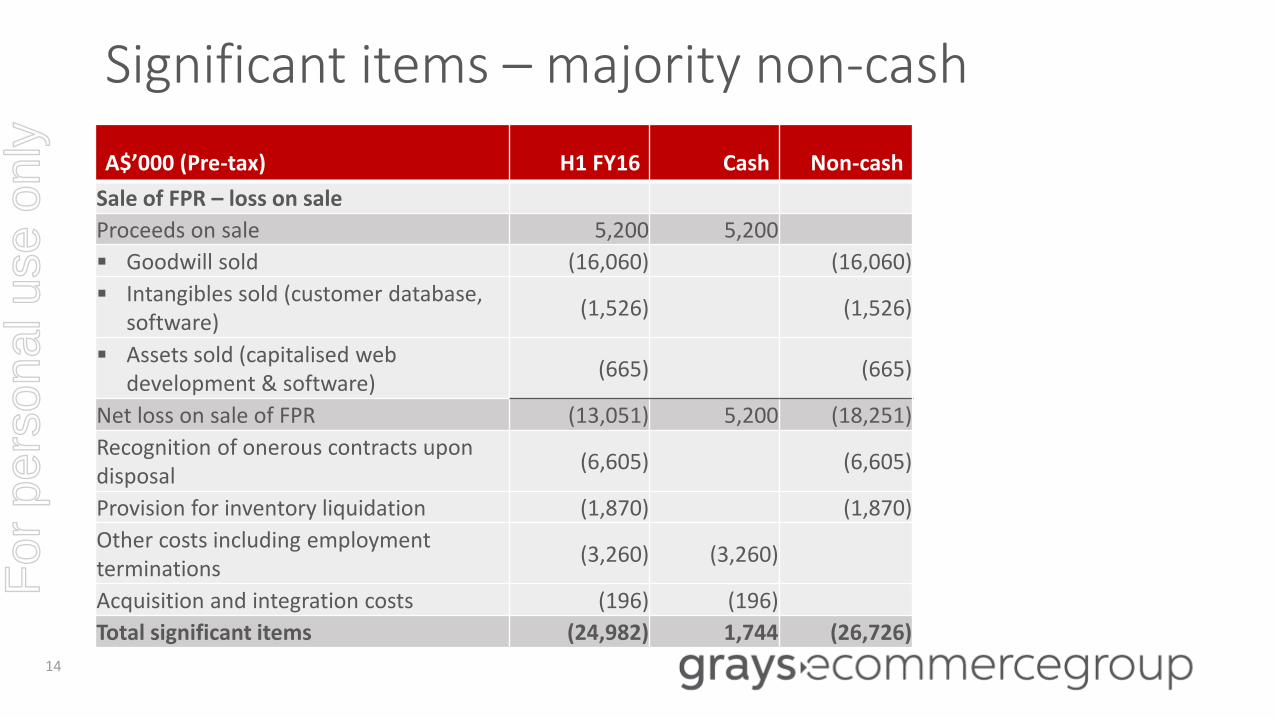
A$’000 (Pre-tax) H1 FY16 Cash Non-cash
Sale of FPR – loss on sale
Proceeds on sale 5,200 5,200
Goodwill sold (16,060) (16,060)
Intangibles sold (customer database, software)
(1,526) (1,526)
Assets sold (capitalised web development & software)
(665) (665)
Net loss on sale of FPR (13,051) 5,200 (18,251)
Recognition of onerous contracts upon disposal
(6,605) (6,605)
Provision for inventory liquidation (1,870) (1,870)
Other costs including employment terminations
(3,260) (3,260)
Acquisition and integration costs (196) (196)
Total significant items (24,982) 1,744 (26,726)
For
per
sona
l use
onl
y
Balance sheet movements reflect business transformation
15
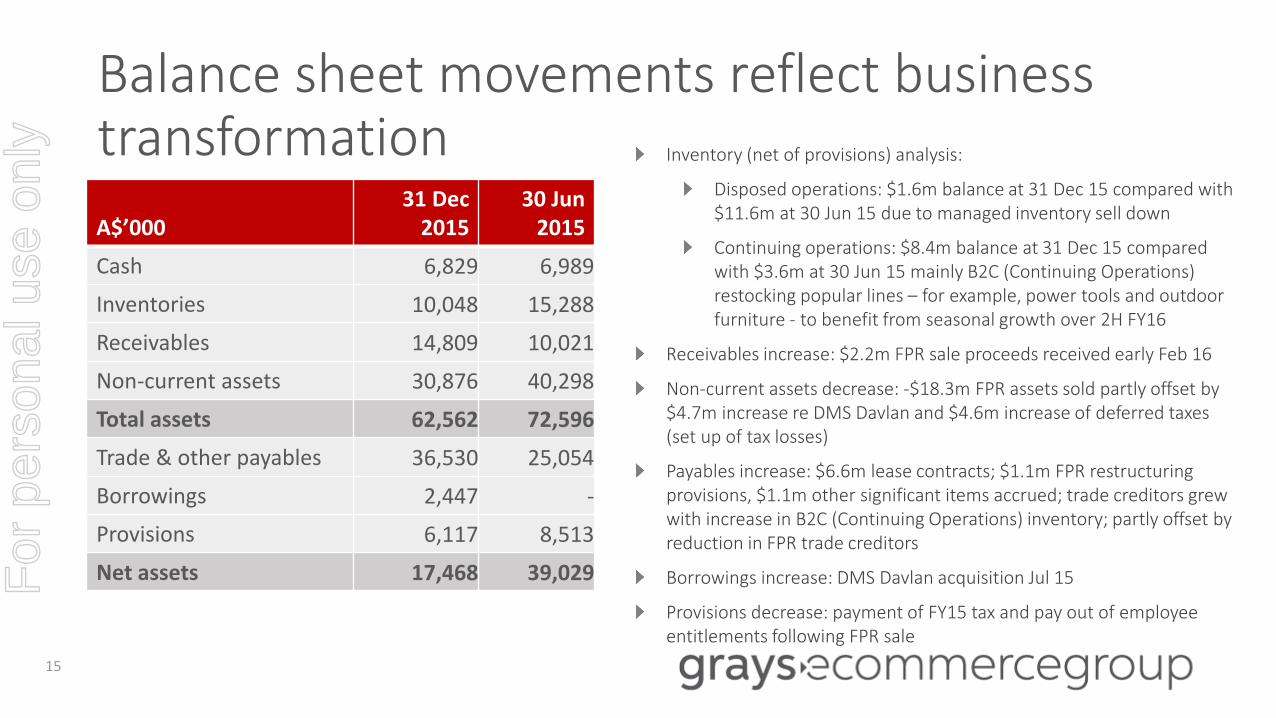
A$’00031 Dec
201530 Jun
2015
Cash 6,829 6,989
Inventories 10,048 15,288
Receivables 14,809 10,021
Non-current assets 30,876 40,298
Total assets 62,562 72,596
Trade & other payables 36,530 25,054
Borrowings 2,447 -
Provisions 6,117 8,513
Net assets 17,468 39,029
Inventory (net of provisions) analysis:
Disposed operations: $1.6m balance at 31 Dec 15 compared with $11.6m at 30 Jun 15 due to managed inventory sell down
Continuing operations: $8.4m balance at 31 Dec 15 compared with $3.6m at 30 Jun 15 mainly B2C (Continuing Operations) restocking popular lines – for example, power tools and outdoor furniture - to benefit from seasonal growth over 2H FY16
Receivables increase: $2.2m FPR sale proceeds received early Feb 16
Non-current assets decrease: -$18.3m FPR assets sold partly offset by $4.7m increase re DMS Davlan and $4.6m increase of deferred taxes (set up of tax losses)
Payables increase: $6.6m lease contracts; $1.1m FPR restructuring provisions, $1.1m other significant items accrued; trade creditors grew with increase in B2C (Continuing Operations) inventory; partly offset by reduction in FPR trade creditors
Borrowings increase: DMS Davlan acquisition Jul 15
Provisions decrease: payment of FY15 tax and pay out of employee entitlements following FPR sale
For
per
sona
l use
onl
y
Solid cash flows from Continuing Operations
16
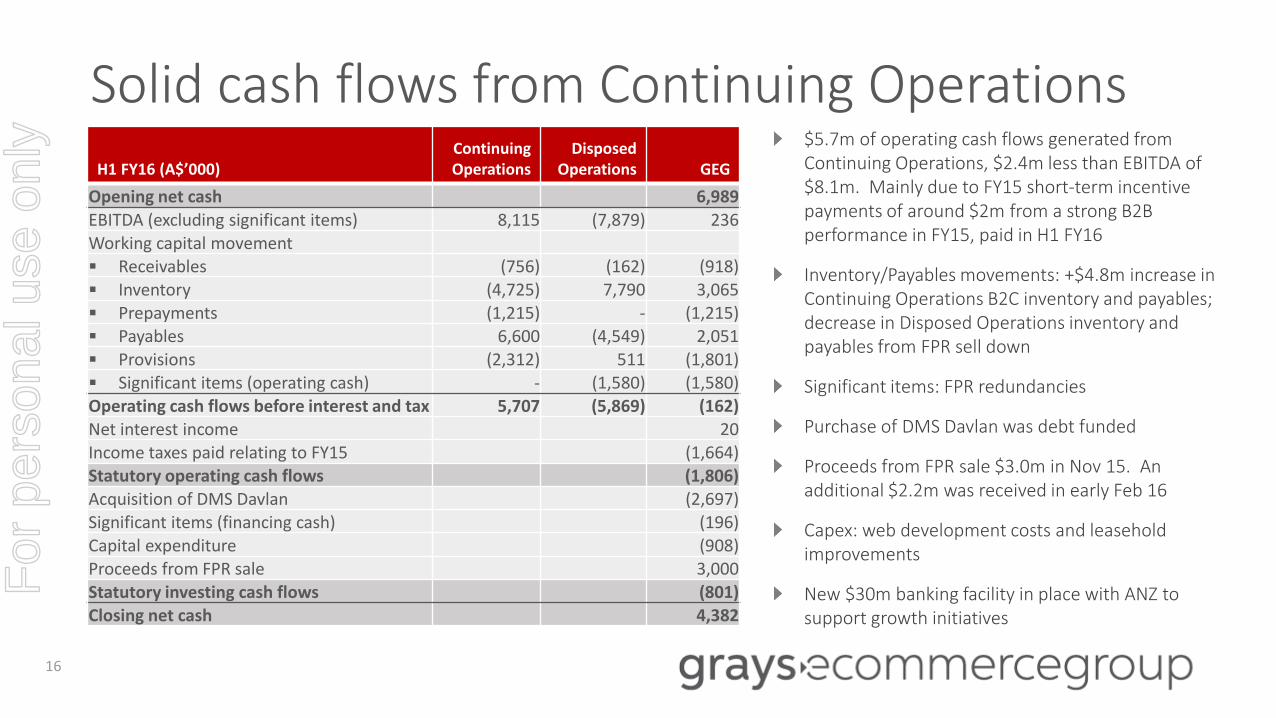
$5.7m of operating cash flows generated from Continuing Operations, $2.4m less than EBITDA of $8.1m. Mainly due to FY15 short-term incentive payments of around $2m from a strong B2B performance in FY15, paid in H1 FY16
Inventory/Payables movements: +$4.8m increase in Continuing Operations B2C inventory and payables; decrease in Disposed Operations inventory and payables from FPR sell down
Significant items: FPR redundancies
Purchase of DMS Davlan was debt funded
Proceeds from FPR sale $3.0m in Nov 15. An additional $2.2m was received in early Feb 16
Capex: web development costs and leasehold improvements
New $30m banking facility in place with ANZ to support growth initiatives
H1 FY16 (A$’000)ContinuingOperations
DisposedOperations GEG
Opening net cash 6,989
EBITDA (excluding significant items) 8,115 (7,879) 236Working capital movement
Receivables (756) (162) (918)
Inventory (4,725) 7,790 3,065
Prepayments (1,215) - (1,215)
Payables 6,600 (4,549) 2,051
Provisions (2,312) 511 (1,801)
Significant items (operating cash) - (1,580) (1,580)Operating cash flows before interest and tax 5,707 (5,869) (162)Net interest income 20Income taxes paid relating to FY15 (1,664)Statutory operating cash flows (1,806)Acquisition of DMS Davlan (2,697)Significant items (financing cash) (196)Capital expenditure (908)Proceeds from FPR sale 3,000Statutory investing cash flows (801)Closing net cash 4,382
For
per
sona
l use
onl
y
H1 FY16 overview
Financial results
Positive outlook for FY16
For
per
sona
l use
onl
y
B2B growth opportunities across all segments
18
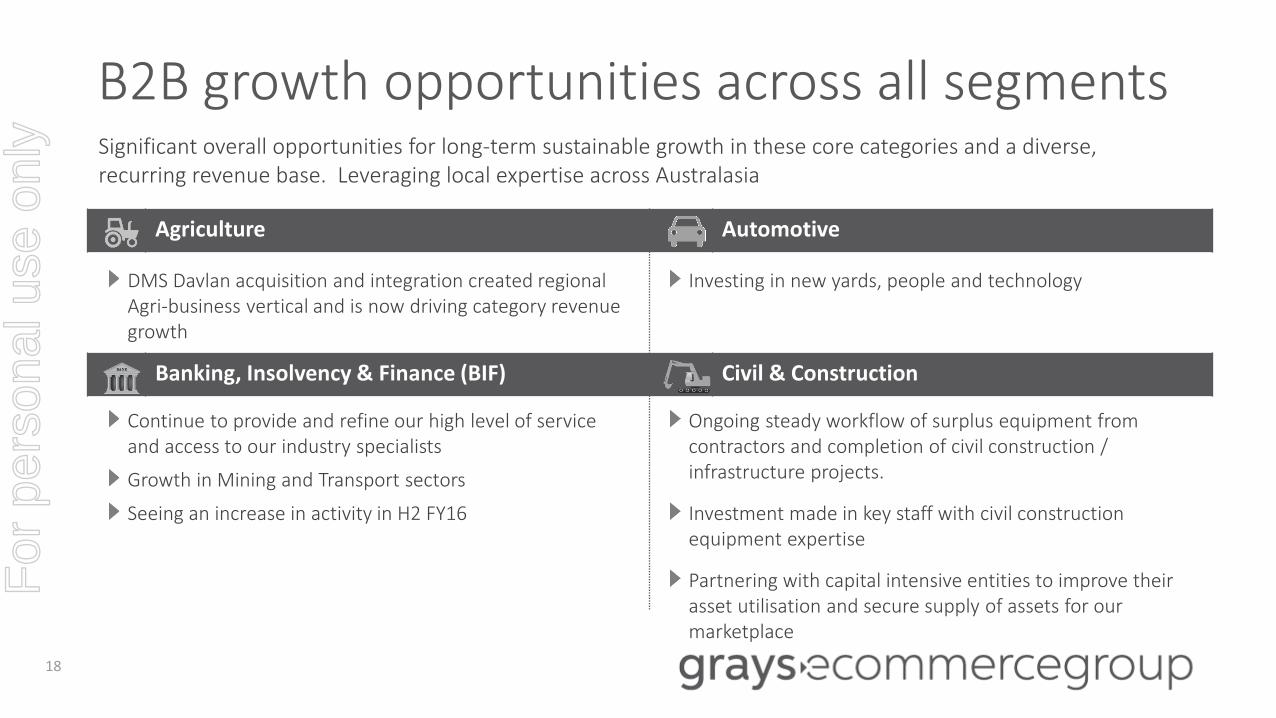
Significant overall opportunities for long-term sustainable growth in these core categories and a diverse, recurring revenue base. Leveraging local expertise across Australasia
Agriculture Automotive
Banking, Insolvency & Finance (BIF) Civil & Construction
DMS Davlan acquisition and integration created regional Agri-business vertical and is now driving category revenue growth
Investing in new yards, people and technology
Continue to provide and refine our high level of service and access to our industry specialists
Growth in Mining and Transport sectors
Seeing an increase in activity in H2 FY16
Ongoing steady workflow of surplus equipment from contractors and completion of civil construction / infrastructure projects.
Investment made in key staff with civil construction equipment expertise
Partnering with capital intensive entities to improve their asset utilisation and secure supply of assets for our marketplace
For
per
sona
l use
onl
y
B2B growth opportunities across all segments
19
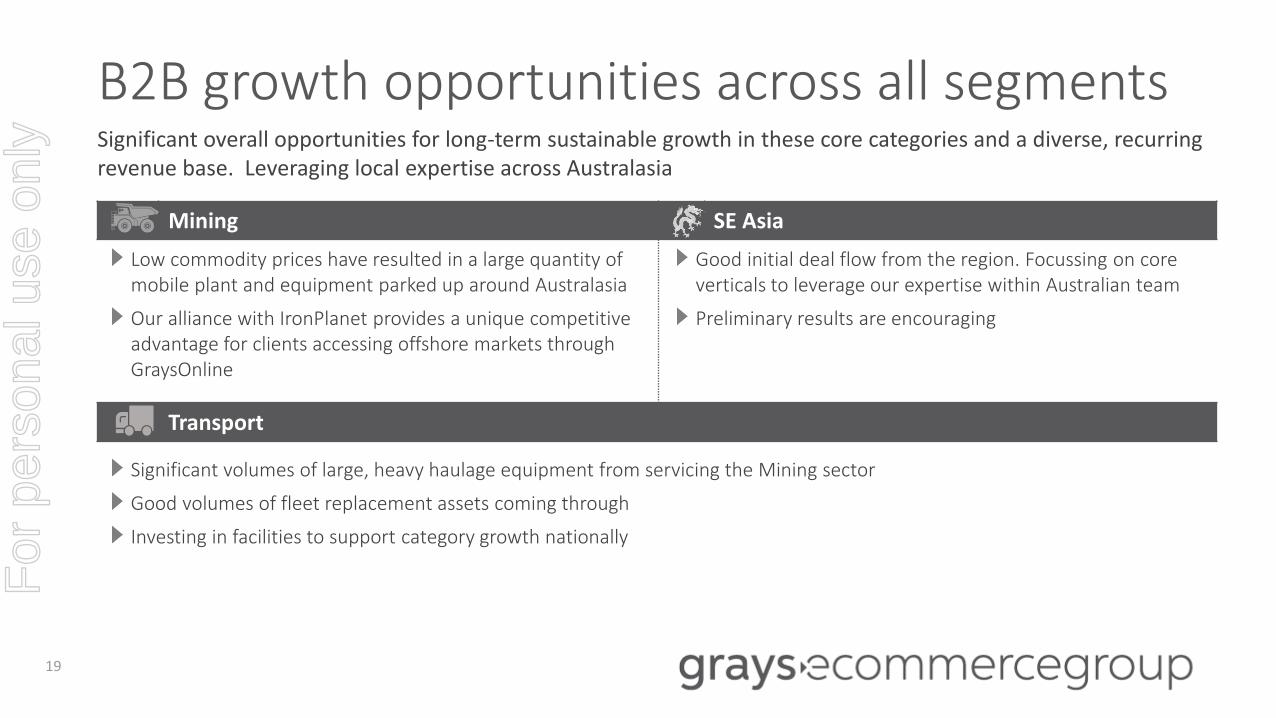
Mining SE Asia
Transport
Low commodity prices have resulted in a large quantity of mobile plant and equipment parked up around Australasia
Our alliance with IronPlanet provides a unique competitive advantage for clients accessing offshore markets through GraysOnline
Good initial deal flow from the region. Focussing on core verticals to leverage our expertise within Australian team
Preliminary results are encouraging
Significant volumes of large, heavy haulage equipment from servicing the Mining sector
Good volumes of fleet replacement assets coming through
Investing in facilities to support category growth nationally
Significant overall opportunities for long-term sustainable growth in these core categories and a diverse, recurring revenue base. Leveraging local expertise across Australasia
For
per
sona
l use
onl
y
Transformed from a mix of retail and auction businesses to a predominantly B2B auction focussed business
Sale of FPR business allows management to focus on our core auction business and exit a underperforming FPR business operating in an highly competitive environment
Delivering on B2B growth strategy:
H1 FY16 saw continued growth in revenue and earnings
Substantial investments made to underpin revenue growth
Promising start to H2FY16. Continued growth in Auto, Mining and Transport. BIF has a strong pipeline of multiple opportunities and a number of projects deferred from H1 FY16
Refocused remaining profitable B2C auction business
Accordingly, we expect our Continuing Operations EBITDA in FY16 to comfortably exceed that achieved during FY15
In summary…
20
For
per
sona
l use
onl
y

Questions
For
per
sona
l use
onl
y

Appendices
For
per
sona
l use
onl
y
B2B Guarantees and Buys
Guarantees and Buys leverage Grays’ distinctive capabilities to unlock value for vendors and utilise our efficient and liquidmarketplace
Robust systems and internal controls in place:
A Board approved delegation matrix and aggregate maximum exposure limits at all times
Standard documentation, terms and conditions
3 stage valuation process, subject to peer review
Monthly review of book by Board and Executive Team
No losses incurred
As at 31 Dec 15 outstanding guarantees totalled $6.8m
23
For
per
sona
l use
onl
y
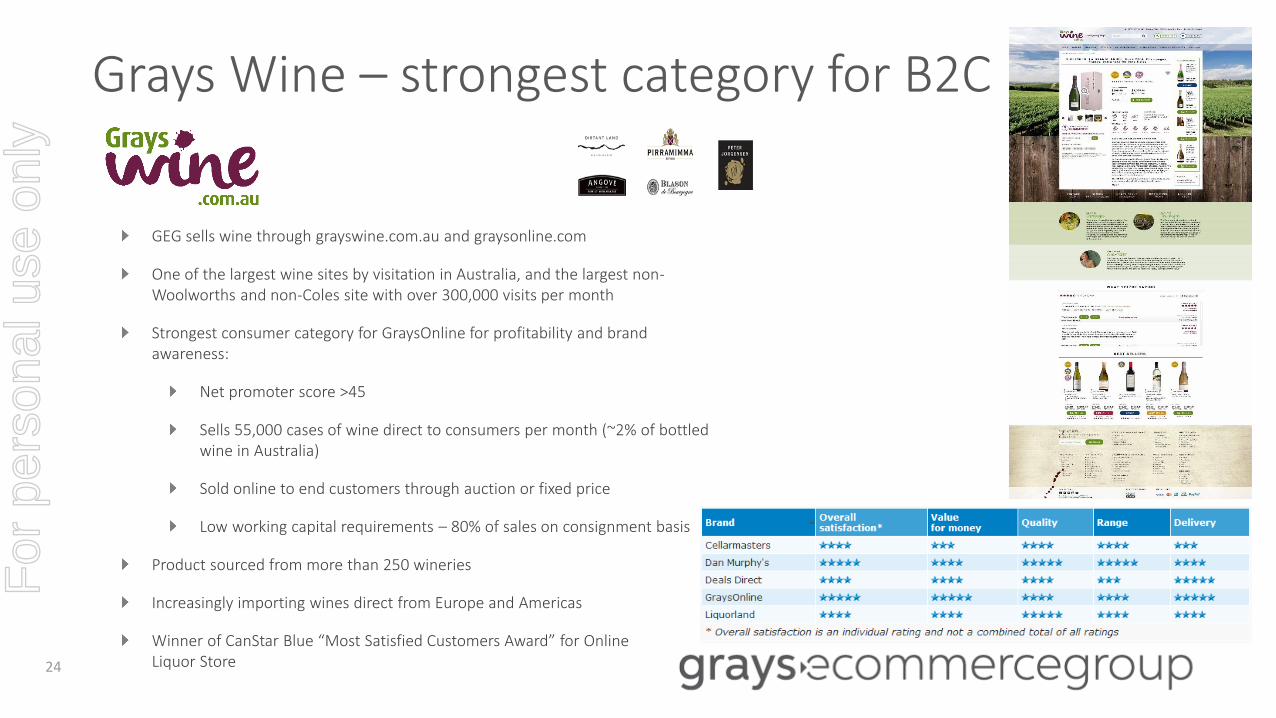
Grays Wine – strongest category for B2C
GEG sells wine through grayswine.com.au and graysonline.com
One of the largest wine sites by visitation in Australia, and the largest non-Woolworths and non-Coles site with over 300,000 visits per month
Strongest consumer category for GraysOnline for profitability and brand awareness:
Net promoter score >45
Sells 55,000 cases of wine direct to consumers per month (~2% of bottled wine in Australia)
Sold online to end customers through auction or fixed price
Low working capital requirements – 80% of sales on consignment basis
Product sourced from more than 250 wineries
Increasingly importing wines direct from Europe and Americas
Winner of CanStar Blue “Most Satisfied Customers Award” for OnlineLiquor Store24
For
per
sona
l use
onl
y
Lidcombe NSW Distribution Facility leases
25
Post the sale of FPR, Lidcombe NSW facility will be downsized. The surplus space is considered “onerous” under accounting
standards, crystallising a liability equal to the present value of future lease payments. This has been taken up as a Significant Item at
H1 FY16
Continuing Operations FY16 forecast lease expense for Lidcombe approximately $4.0m
Continuing Operations FY17 forecast lease expense for Lidcombe approximately $3.7m (including 3% CPI increase). This is a saving
of around $0.3m over FY16
Cash lease cost will remain at c. $6m over FY17
* Forecast includes 3% CPI increase
For
per
sona
l use
onl
y
End
DISCLAIMER Some of the information contained in this presentation contains “forward-looking statements” which may not directly or exclusively relate to historical facts. These forward-looking statements reflect Grays eCommerce Group Limited current intentions, plans, expectations, assumptions and beliefs about future events and are subject to risks, uncertainties and other factors, many of which are outside the control of Grays eCommerce Group Limited.
Important factors that could cause actual results to differ materially from the expectations expressed or implied in the forward-looking statements include known and unknown risks. Because actual results could differ materially from Grays eCommerce Group Limited current intentions, plans, expectations, assumptions and beliefs about the future, you are urged to view all forward-looking statements contained herein with caution.F
or p
erso
nal u
se o
nly