Embed Size (px)
Citation preview
Cromwell Property Group – 2014 Annual General Meeting 1
For
per
sona
l use
onl
y
Important Information & Disclaimer
This presentation including its appendices (“Presentation”) isdated 26 November 2014 and has been prepared by theCromwell Property Group, which comprises Cromwell
advice as they deem necessary or consider appropriate fortheir particular jurisdiction.
Cromwell Property Group does not guarantee any particular
securities. To the extent that general financial product advicein respect of Cromwell Property Group stapled securities isprovided in this Presentation, it is provided by Cromwell
Corporation Limited (ACN 001 056 980) and CromwellProperty Securities Limited (ACN 079 147 809; AFSL 238052)as responsible entity of the Cromwell Diversified PropertyTrust (ARSN 102 982 598). Units in the Cromwell DiversifiedProperty Trust are stapled to shares in Cromwell CorporationLimited. The stapled securities are listed on the ASX (ASXCode: CMW).
Cromwell Property Group does not guarantee any particularrate of return or the performance of Cromwell Property Groupnor do they guarantee the repayment of capital from CromwellProperty Group or any particular tax treatment. Pastperformance information given in this Presentation is given forillustrative purposes only and should not be relied upon as(and is not) an indication of future performance. Actual resultscould differ materially from those referred to in this
Property Securities Limited. Cromwell Property SecuritiesLimited and its related bodies corporate, and their associates,will not receive any remuneration or benefits in connection withthat advice. Directors and employees of Cromwell PropertySecurities Limited do not receive specific payments ofcommissions for the authorised services provided under itsAustralian Financial Services Licence. They do receive
This Presentation contains summary information aboutCromwell Property Group as at 30 June 2013. Statutoryfinancial information has been reviewed by Cromwell PropertyGroup’s auditors. Operating financial information has notbeen subjected to audit review. All financial information is inAustralian dollars and all statistics are as at 30 June 2013unless otherwise stated Any gearing and interest cover ratios
could differ materially from those referred to in thisPresentation.
This Presentation contains certain “forward looking”statements. Forward looking statements, opinions andestimates are based on assumptions and contingencies whichare subject to change without notice. Forward-lookingstatements including projections, indications or guidance on
salaries and may also be entitled to receive bonuses,depending upon performance. Cromwell Property SecuritiesLimited is a wholly owned subsidiary of Cromwell CorporationLimited.
Cromwell Funds Management Limited ABN 63 114 782 777AFSL 333 214 (CFM) is the responsible entity of the managedfunds mentioned in this presentation Before making anyunless otherwise stated. Any gearing and interest cover ratios
for Cromwell Property Group included in the Presentation havebeen calculated in accordance with the formulas stated. Thesemeasures are not measures of, or defined terms of, financialperformance, liquidity or value under AIFRS or US GAAP.Moreover, certain of these measures may not be comparableto similarly titled measures of other companies.
future earnings or financial position and estimates areprovided as a general guide only and should not be reliedupon as an indication or guarantee of future performance.
There can be no assurance that actual outcomes will not differmaterially from these statements. To the fullest extentpermitted by law, Cromwell Property Group and its directors,officers employees advisers agents and intermediaries
funds mentioned in this presentation. Before making anyinvestment decision in relation to managed funds it isimportant that you read the PDS. Each PDS is issued by CFMand, if the fund is open to new investment, is available fromwww.cromwell.com.au or by calling Cromwell on 1300 276693. Applications for units can only be made on an applicationform from a current PDS. Some managed funds are closed tonew investmentsThe information in this Presentation is subject to change
without notice and does not purport to be complete orcomprehensive. It does not purport to summarise allinformation that an investor should consider when making aninvestment decision. It should be read in conjunction withCromwell Property Group’s other periodic and continuousdisclosure announcements lodged with the AustralianS i i E h hi h il bl
officers, employees, advisers, agents and intermediariesdisclaim any obligation or undertaking to release any updatesor revisions to the information to reflect any change inexpectations or assumptions.
The information in this Presentation has been obtained from orbased on sources believed by Cromwell Property Group to bereliable. To the maximum extent permitted by law, Cromwell
new investments.
This Presentation is for information purposes only. ThisPresentation does not constitute an offer to sell, or thesolicitation of an offer to buy, any securities in the UnitedStates or to any ‘US person’ (as defined in Regulation S underthe US Securities Act of 1933, as amended (“Securities Act”)(“US Person”)). Cromwell Property Group stapled securitiesh b d ill b i d d h S i iSecurities Exchange, which are available at www.asx.com.au.
The information in this Presentation does not take into accountyour individual objectives, financial situation or needs. Beforemaking an investment decision, investors should consider,with or without a financial or taxation adviser, the relevantinformation (including the information in this Presentation)having regard to their own objectives, financial situation and
Property Group, their officers, employee, agents and advisorsdo not make any warranty, express or implied, as to thecurrency, accuracy, reliability or completeness of theinformation in this Presentation and disclaim all responsibilityand liability for the information (including, without limitation,liability for negligence).
Cromwell Corporation Limited is not licensed to provide
have not been, and will not be, registered under the SecuritiesAct or the securities laws of any state or other jurisdiction ofthe United States, and may not be offered or sold in the UnitedStates or to any US Person without being so registered orpursuant to an exemption from registration.
NOT FOR DISTRIBUTION OR RELEASE IN THE UNITEDSTATES OR TO US PERSONS OR PERSONS ACTING FOR
Cromwell Property Group – 2014 Annual General Meeting 2
having regard to their own objectives, financial situation andneeds. Investors should also seek such financial, legal or tax
Cromwell Corporation Limited is not licensed to providefinancial product advice in respect of Cromwell Property Group
STATES OR TO US PERSONS OR PERSONS ACTING FORTHE ACCOUNT OR BENEFIT OF US PERSONS.
For
per
sona
l use
onl
y
Directors
Geoffrey H Levy, AOChairman
Paul WeightmanExecutive Director Chief Executive Officer
Daryl WilsonExecutive Director
Richard FosterNon-Executive Director
Robert PullarNon- Executive Director
David UsaszNon-Executive Director
Michelle McKellarNon-Executive Director
Marc WainerNon- Executive Director
Michael WattersNon- Executive Director
Cromwell Property Group – 2014 Annual General Meeting 3
For
per
sona
l use
onl
y
Meeting Agenda
Open
Chairman’s Address
CEO’s Address
Business
Cromwell Property Group – 2014 Annual General Meeting 4
For
per
sona
l use
onl
y
Chairman's AddressMr Geoffrey H. Levy, AO
Cromwell Property Group – 2014 Annual General Meeting 5
For
per
sona
l use
onl
y

Recycling Capital For Future Growth
Sale of 6 assets in FY14 for $253m, plus sale of 321 Exhibition St for $206m post balance date$206m post balance date
Assets have delivered good returns, but expected future returns were below required hurdle rate
Capital recycled to co-investment in Northpoint Tower and to reduce Cap ta ecyc ed to co est e t o t po t o e a d to educegearing with balance retained for future opportunities
Internal management model has created additional value over time
AcquisitionDate
Sale Proceeds
IRR Achieved
321 Exhibition St, VIC September 2010 $205.9m 14.7%$Homebase Centre, NSW October 2012 $40.5m 14.5%
NQX, Distribution Centre, QLD February 2003 $25.0m 11.1%Gillman Woolstore, SA June 2004 $15.6m 11.1%Brooklyn Woolstore, VIC June 2004 $39.1m 9.5%
Recently Sold: 321 Exhibition Street VIC
y , $380 La Trobe St, VIC December 2005 $113.6m 8.9%Smithfield Industrial Property, NSW October 2012 $19.2m 1.3%Weighted Average 11.9%
Cromwell Property Group – 2014 Annual General Meeting 6
Recently Sold: 321 Exhibition Street, VIC
For
per
sona
l use
onl
y
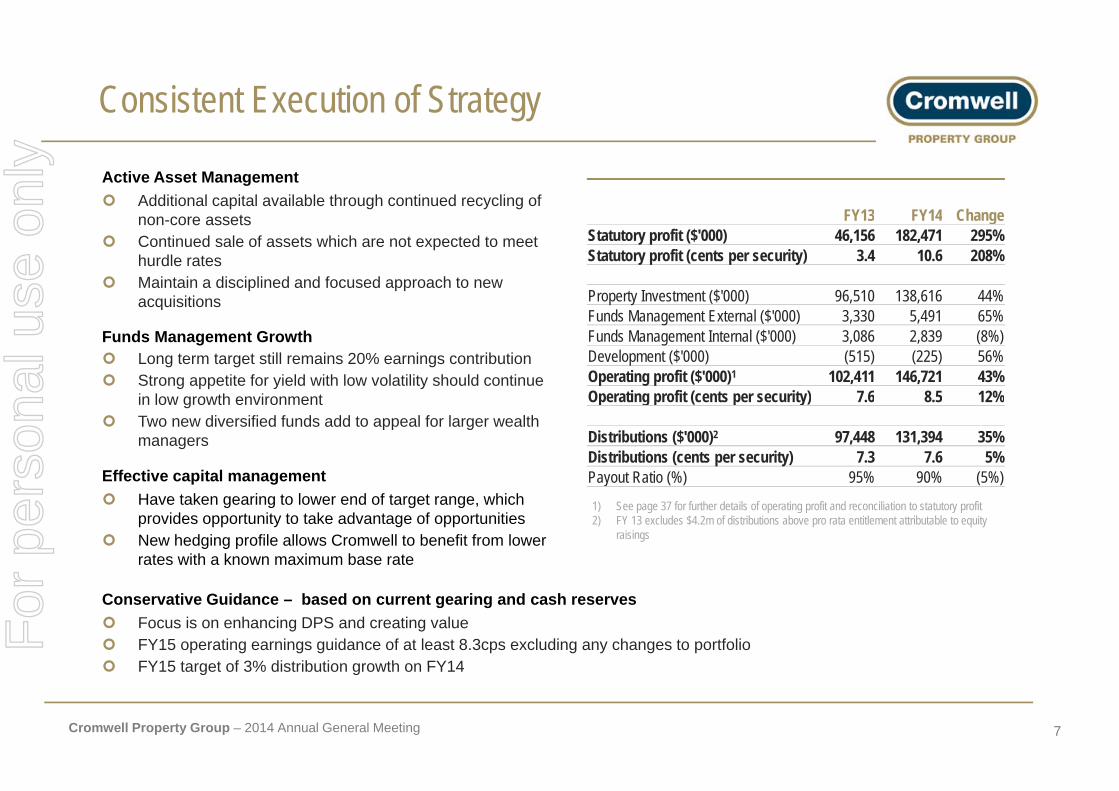
Consistent Execution of Strategy
Active Asset Management Additional capital available through continued recycling of
t FY13 FY14 Changenon-core assets Continued sale of assets which are not expected to meet
hurdle rates Maintain a disciplined and focused approach to new
acquisitions
FY13 FY14 ChangeStatutory profit ($'000) 46,156 182,471 295%Statutory profit (cents per security) 3.4 10.6 208%
Property Investment ($'000) 96,510 138,616 44%acquisitions
Funds Management Growth Long term target still remains 20% earnings contribution Strong appetite for yield with low volatility should continue
i l th i t
Funds Management External ($'000) 3,330 5,491 65%Funds Management Internal ($'000) 3,086 2,839 (8%)Development ($'000) (515) (225) 56%Operating profit ($'000)1 102,411 146,721 43%Operating profit (cents per security) 7 6 8 5 12%in low growth environment
Two new diversified funds add to appeal for larger wealth managers
Effective capital management
Operating profit (cents per security) 7.6 8.5 12%
Distributions ($'000)2 97,448 131,394 35%Distributions (cents per security) 7.3 7.6 5%Payout Ratio (%) 95% 90% (5%)
Have taken gearing to lower end of target range, which provides opportunity to take advantage of opportunities
New hedging profile allows Cromwell to benefit from lower rates with a known maximum base rate
1) See page 37 for further details of operating profit and reconciliation to statutory profit2) FY 13 excludes $4.2m of distributions above pro rata entitlement attributable to equity
raisings
y ( ) ( )
Conservative Guidance – based on current gearing and cash reserves Focus is on enhancing DPS and creating value FY15 operating earnings guidance of at least 8.3cps excluding any changes to portfolio FY15 target of 3% distribution growth on FY14
Cromwell Property Group – 2014 Annual General Meeting 7
FY15 target of 3% distribution growth on FY14
For
per
sona
l use
onl
y
Cromwell’s key points of difference
Actively manage our portfolio
Gear intelligently through the property cycle
Produce value from our funds management businessbusiness
Cromwell Property Group – 2014 Annual General Meeting 8
For
per
sona
l use
onl
y
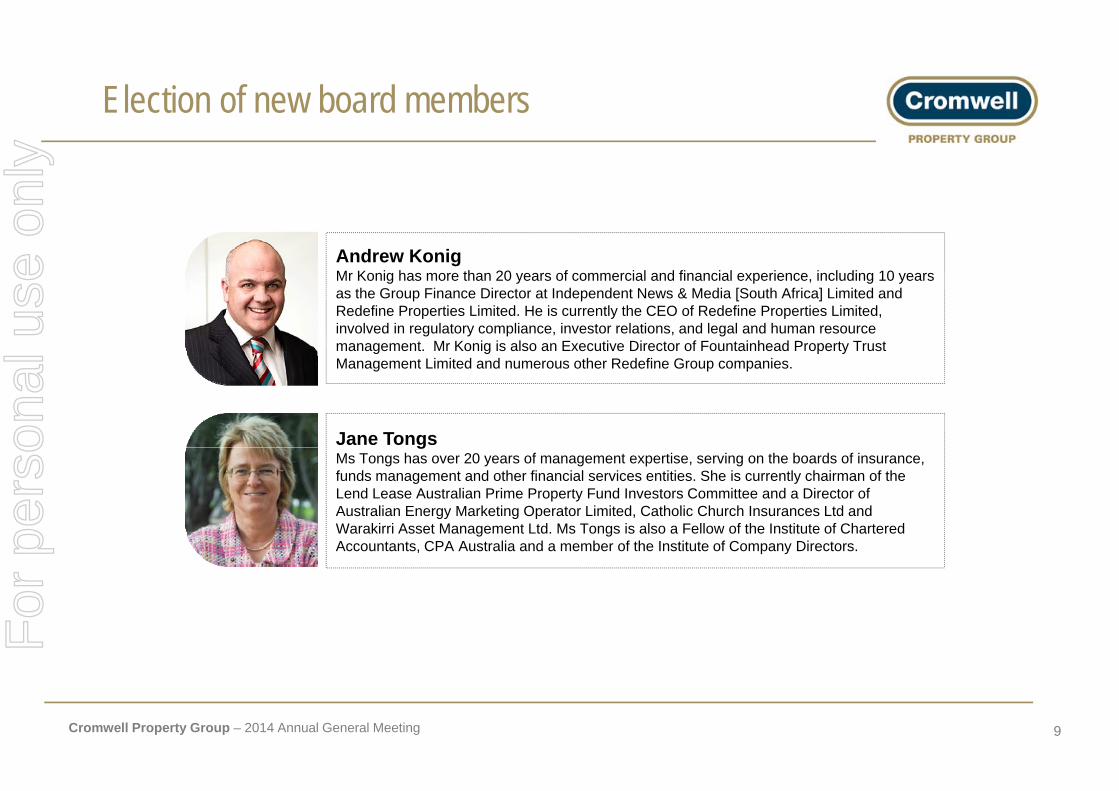
Election of new board members
Andrew KonigMr Konig has more than 20 years of commercial and financial experience, including 10 years as the Group Finance Director at Independent News & Media [South Africa] Limited and R d fi P ti Li it d H i tl th CEO f R d fi P ti Li it dRedefine Properties Limited. He is currently the CEO of Redefine Properties Limited, involved in regulatory compliance, investor relations, and legal and human resource management. Mr Konig is also an Executive Director of Fountainhead Property Trust Management Limited and numerous other Redefine Group companies.
Jane TongsMs Tongs has over 20 years of management expertise, serving on the boards of insurance, funds management and other financial services entities. She is currently chairman of the Lend Lease Australian Prime Property Fund Investors Committee and a Director of Australian Energy Marketing Operator Limited, Catholic Church Insurances Ltd and Warakirri Asset Management Ltd. Ms Tongs is also a Fellow of the Institute of Chartered Accountants, CPA Australia and a member of the Institute of Company Directors.
Cromwell Property Group – 2014 Annual General Meeting 9
For
per
sona
l use
onl
y
CEO's AddressMr Paul Weightman
Cromwell Property Group – 2014 Annual General Meeting 10
For
per
sona
l use
onl
y
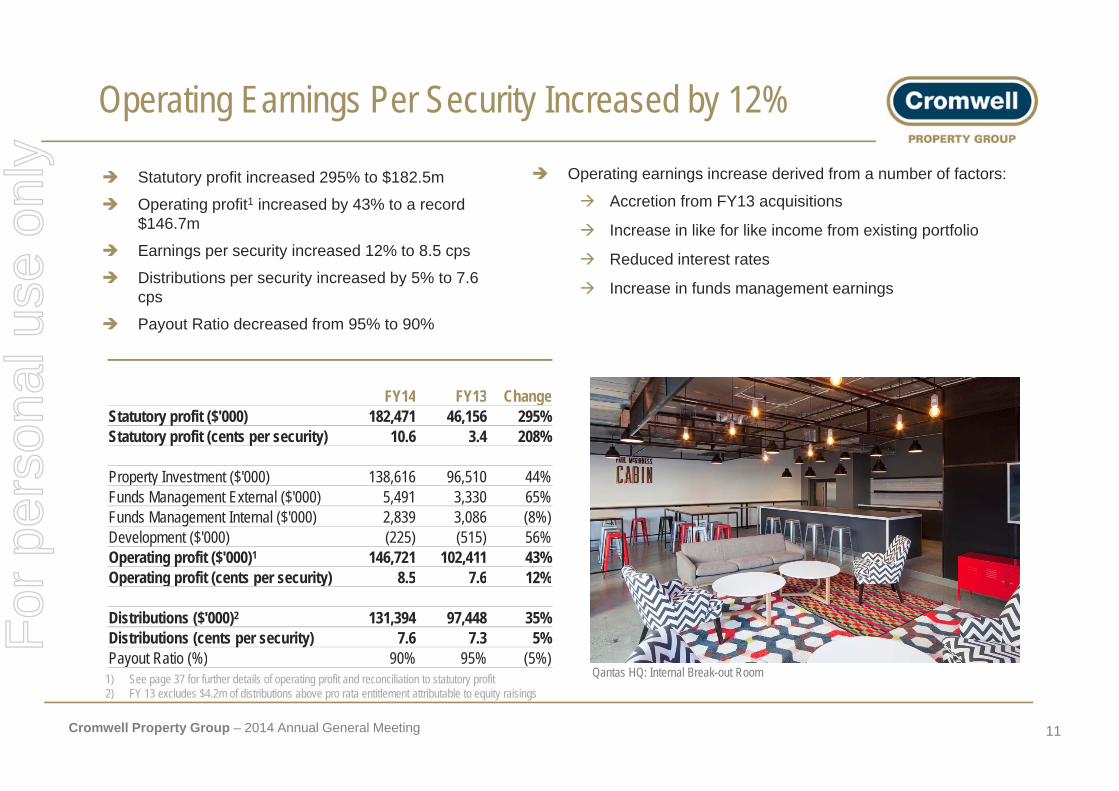
Operating Earnings Per Security Increased by 12%
Statutory profit increased 295% to $182.5m
Operating profit1 increased by 43% to a record
Operating earnings increase derived from a number of factors:
Accretion from FY13 acquisitions$146.7m
Earnings per security increased 12% to 8.5 cps
Distributions per security increased by 5% to 7.6 cps
Increase in like for like income from existing portfolio
Reduced interest rates
Increase in funds management earnings
Payout Ratio decreased from 95% to 90%
FY14 FY13 ChangeFY14 FY13 ChangeStatutory profit ($'000) 182,471 46,156 295%Statutory profit (cents per security) 10.6 3.4 208%
Property Investment ($'000) 138,616 96,510 44%p y ( )Funds Management External ($'000) 5,491 3,330 65%Funds Management Internal ($'000) 2,839 3,086 (8%)Development ($'000) (225) (515) 56%Operating profit ($'000)1 146,721 102,411 43%Operating profit (cents per security) 8 5 7 6 12%Operating profit (cents per security) 8.5 7.6 12%
Distributions ($'000)2 131,394 97,448 35%Distributions (cents per security) 7.6 7.3 5%Payout Ratio (%) 90% 95% (5%)
Cromwell Property Group – 2014 Annual General Meeting 11
1) See page 37 for further details of operating profit and reconciliation to statutory profit2) FY 13 excludes $4.2m of distributions above pro rata entitlement attributable to equity raisings
y ( ) ( )Qantas HQ: Internal Break-out Room
For
per
sona
l use
onl
y

Portfolio improvement
Sale of 7 assets, including 321 Exhibition Street, for $458m
Acquisition Sale IRR
Capital recycled to co-invest in $278m Northpoint Tower
Property StatsDate Proceeds Achieved
321 Exhibition St, VIC Sept 2010 $205.9m 14.7%Homebase Centre, NSW Oct 2012 $40.5m 14.5%NQX, Distribution Centre, QLD Feb 2003 $25.0m 11.1%
y
Address: 100 Miller Street, North SydneySector: Commercial/RetailLand area: 5,020 sqmQ , , Q $ %
Gillman Woolstore, SA Jun 2004 $15.6m 11.1%Brooklyn Woolstore, VIC Jun 2004 $39.1m 9.5%380 La Trobe St, VIC Dec 2005 $113.6m 8.9%Smithfield Industrial Property
NLA:Office: 32,542 sqmRetail: 2,603 sqmCarparks: 423
Purchase Price: $278.7 millionSmithfield Industrial Property, NSW Oct 2012 $19.2m 1.3%Weighted Average 11.9%
$Occupancy: >99%Initial Yield: 8.7%
Cromwell Property Group – 2014 Annual General Meeting 12
For
per
sona
l use
onl
y

Property Portfolio Remains RobustTenant Classification1Geographic Diversification1 Sector Diversification1
1.2%1.1% 2.4%
ACT
50.8%
19.4% Government Authority
Listed Company/Subsidary
Office
Retail
219.2%
26.3%
7.5%ACT
NSW
QLD
VIC
29.8%
p y/ yPrivate Company
98.8%43.5%
TAS
SA
Very strong tenant profile
Government2 contributes 51% of income
Top 5 tenants account for 60% of incomeTop 5 Tenants1
% of GrossIncome
Cumulative %
Credit Rating3
Federal Government 21% 21% AAA
Continued high exposure to office sector
Average ‘like for like’ property income growth of 1.4% for FY14, impacted by bi-annual CPI reviews
NSW State Government 15% 36% AAAQantas 11% 47% AA+QLD State Government 9% 56% BB+ p y
Moved overweight Sydney office in past twelve months following acquisition of NSW Portfolio and Northpoint
1) By gross income2) Includes Government owned and funded entities
AECOM Australia Pty Ltd 4% 60%
TOTAL 60%
Cromwell Property Group – 2014 Annual General Meeting 13
2) Includes Government owned and funded entities3) S&P Ratings as at 15 August 2014
For
per
sona
l use
onl
y

Property Portfolio – Movement In Book Value
Portfolio significantly improved through acquisitions since 2010
I d f iliti t d l d li i t tl l lif l In-sourced facilities management model delivers consistently low lifecycle capex
Average 0.24% of valuation over past 5 years
FY14 FY13 FY12 FY11 FY10FY14($’000)
FY13($’000)
FY12($’000)
FY11($’000)
FY10($’000)
Opening Balance 2,396,000 1,724,400 1,444,850 1,064,100 1,117,175Acquisitions - 661,346 263,422 322,405 -Property Improvements 44,484 76,319 50,199 40,403 1,311p y pLifecycle Capex 6,828 6,301 2,614 3,029 2,231Disposals (250,009) (42,439) (39,329) (33,735) (22,128)Straight Lining of Rental Income 5,648 6,071 6,892 4,883 852Lease costs and incentives 11,927 29,275 15,810 15,879 2,216Amortisation of leasing costs (1 454) (1 484) (1 373) (909) (640)Amortisation of leasing costs (1,454) (1,484) (1,373) (909) (640)Amortisation of leasing incentives (10,180) (8,042) (6,332) (4,864) (4,771)Net gain/(loss) from fair value adjustments 46,226 (55,747) (12,353) 33,659 (32,146)Balance at 30 June 2,249,470 2,396,000 1,724,400 1,444,850 1,064,100Lifecycle Capex as a % on average assets 0.29% 0.31% 0.16% 0.24% 0.20%
Cromwell Property Group – 2014 Annual General Meeting 14
For
per
sona
l use
onl
y
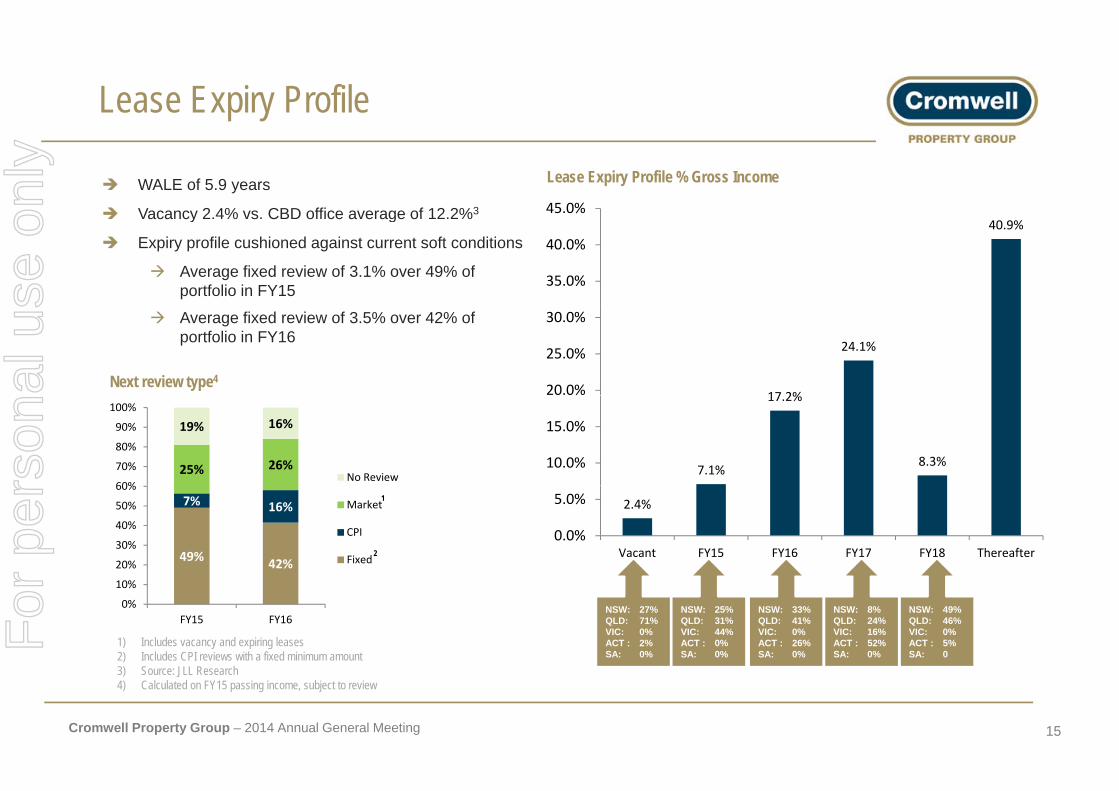
Lease Expiry Profile
WALE of 5.9 years
Vacancy 2 4% vs CBD office average of 12 2%3
Lease Expiry Profile % Gross Income
45.0% Vacancy 2.4% vs. CBD office average of 12.2%
Expiry profile cushioned against current soft conditions
Average fixed review of 3.1% over 49% of portfolio in FY15
40.9%
35.0%
40.0%
Average fixed review of 3.5% over 42% of portfolio in FY16
Next review type417 2%
24.1%
20.0%
25.0%
30.0%
25% 26%
19% 16%
60%
70%
80%
90%
100%
No Review 7.1%
17.2%
8.3%10.0%
15.0%
49% 42%
7% 16%
20%
30%
40%
50%
60%Market
CPI
Fixed
1
2
2.4%
0.0%
5.0%
Vacant FY15 FY16 FY17 FY18 Thereafter
1) Includes vacancy and expiring leases2) Includes CPI reviews with a fixed minimum amount
NSW: 27%QLD: 71%VIC: 0%ACT : 2%SA: 0%
NSW: 33%QLD: 41%VIC: 0%ACT : 26%SA: 0%
NSW: 25%QLD: 31%VIC: 44%ACT : 0%SA: 0%
NSW: 49%QLD: 46%VIC: 0%ACT : 5%SA: 0
NSW: 8%QLD: 24%VIC: 16%ACT : 52%SA: 0%
0%
10%
FY15 FY16
Cromwell Property Group – 2014 Annual General Meeting 15
3) Source: JLL Research4) Calculated on FY15 passing income, subject to review
For
per
sona
l use
onl
y
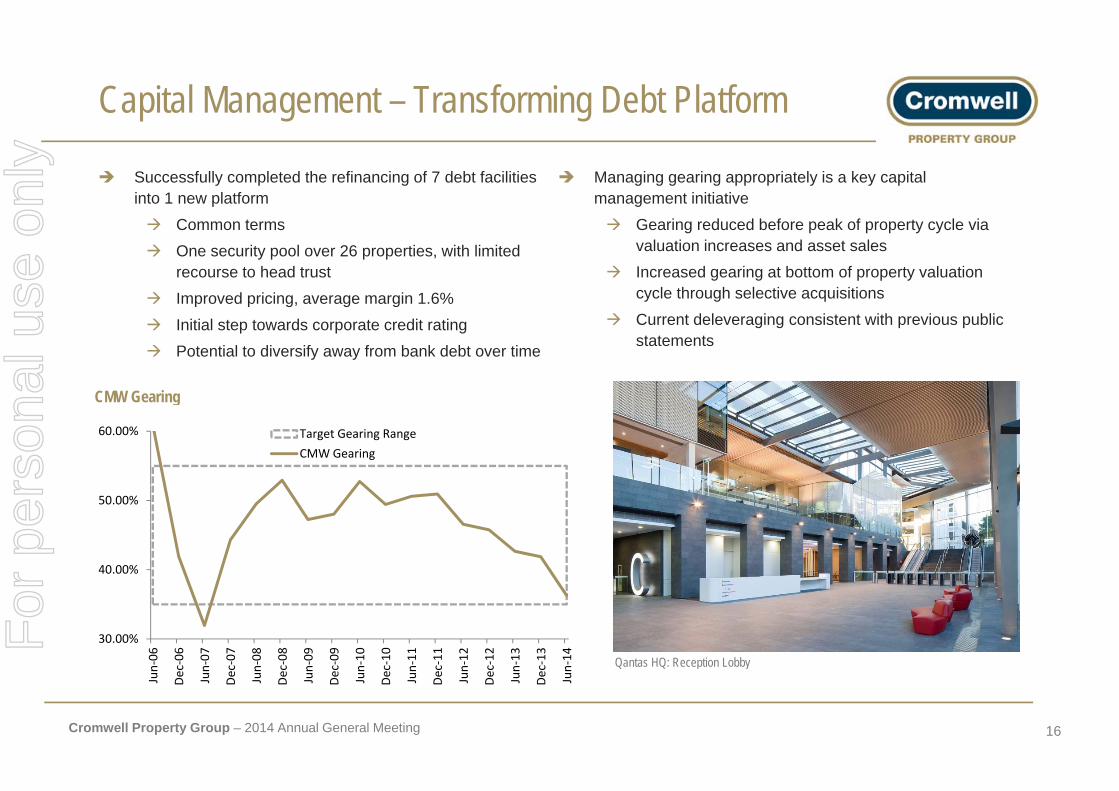
Capital Management – Transforming Debt Platform
Successfully completed the refinancing of 7 debt facilities into 1 new platform
Managing gearing appropriately is a key capital management initiative
Common terms One security pool over 26 properties, with limited
recourse to head trust Improved pricing, average margin 1.6%
Gearing reduced before peak of property cycle via valuation increases and asset sales
Increased gearing at bottom of property valuation cycle through selective acquisitionsp p g, g g
Initial step towards corporate credit rating Potential to diversify away from bank debt over time
Current deleveraging consistent with previous public statements
CMW GearingCMW Gearing
60.00% Target Gearing RangeCMW Gearing
40.00%
50.00%
Qantas HQ: Reception Lobby
30.00%
‐06
‐06
‐07
‐07
‐08
‐08
‐09
‐09
‐10
‐10
‐11
‐11
‐12
‐12
‐13
‐13
‐14
Cromwell Property Group – 2014 Annual General Meeting 16
Qantas HQ: Reception Lobby
Jun
Dec
Jun
Dec
Jun
Dec
Jun
Dec
Jun
Dec
Jun
Dec
Jun
Dec
Jun
Dec
Jun
For
per
sona
l use
onl
y
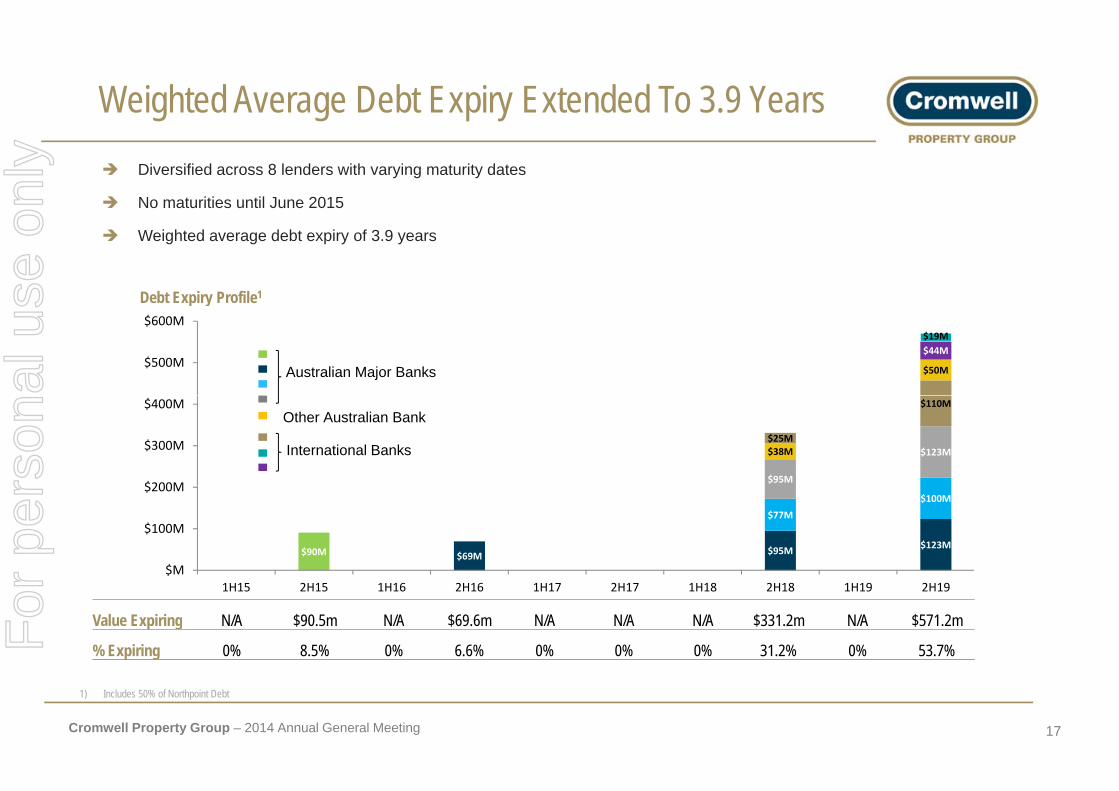
Weighted Average Debt Expiry Extended To 3.9 Years Diversified across 8 lenders with varying maturity dates
No maturities until June 2015
Debt Expiry Profile1
Weighted average debt expiry of 3.9 years
$50M
$44M$19M
$500M
$600M
p y
Australian Major Banks
$95M
$123M$38M
$110M
$25M
$200M
$300M
$400M
International Banks
Other Australian Bank
$90M $69M $95M $123M
$77M$100M
$M
$100M
$200M
$1H15 2H15 1H16 2H16 1H17 2H17 1H18 2H18 1H19 2H19
Value Expiring N/A $90.5m N/A $69.6m N/A N/A N/A $331.2m N/A $571.2m
% Expiring 0% 8.5% 0% 6.6% 0% 0% 0% 31.2% 0% 53.7%
Cromwell Property Group – 2014 Annual General Meeting 17
1) Includes 50% of Northpoint Debt
For
per
sona
l use
onl
y
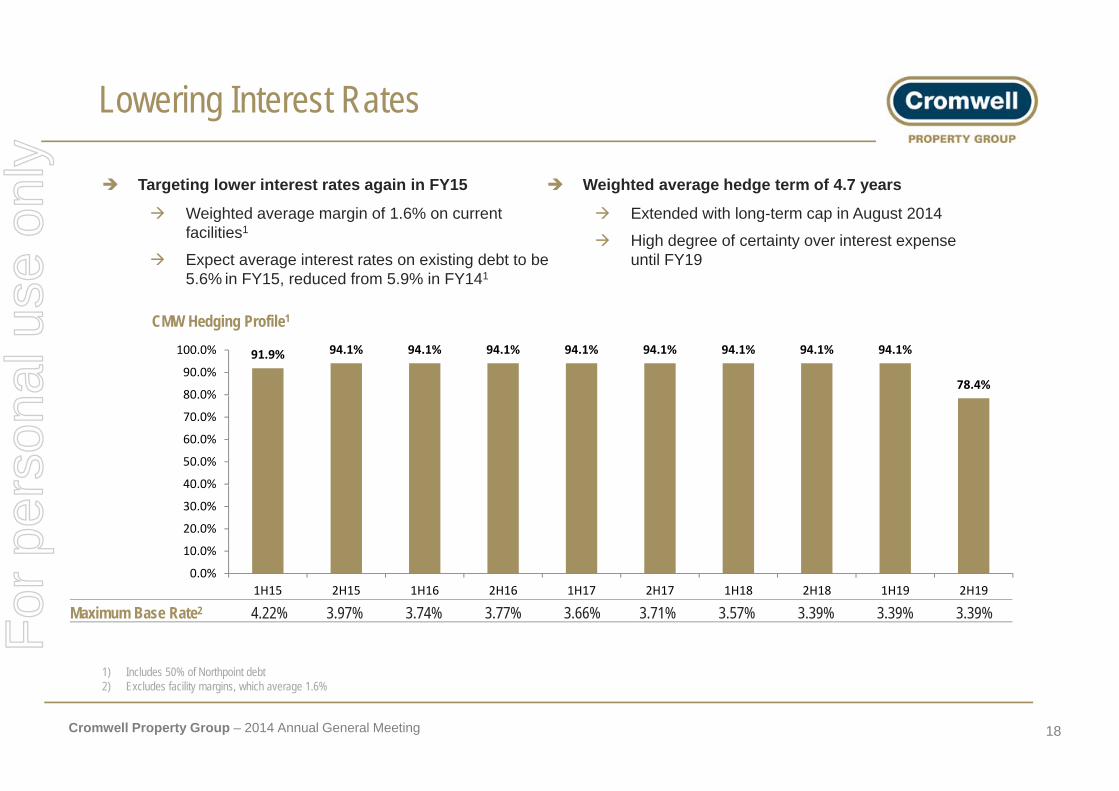
Lowering Interest Rates
Targeting lower interest rates again in FY15
Weighted average margin of 1 6% on current
Weighted average hedge term of 4.7 years
Extended with long-term cap in August 2014 Weighted average margin of 1.6% on current facilities1
Expect average interest rates on existing debt to be 5.6% in FY15, reduced from 5.9% in FY141
Extended with long term cap in August 2014
High degree of certainty over interest expense until FY19
CMW Hedging Profile1
91.9% 94.1% 94.1% 94.1% 94.1% 94.1% 94.1% 94.1% 94.1%
78.4%80 0%
90.0%
100.0%
40 0%
50.0%
60.0%
70.0%
80.0%
0 0%
10.0%
20.0%
30.0%
40.0%
Maximum Base Rate2 4.22% 3.97% 3.74% 3.77% 3.66% 3.71% 3.57% 3.39% 3.39% 3.39%
0.0%1H15 2H15 1H16 2H16 1H17 2H17 1H18 2H18 1H19 2H19
Cromwell Property Group – 2014 Annual General Meeting 18
1) Includes 50% of Northpoint debt2) Excludes facility margins, which average 1.6%
For
per
sona
l use
onl
y
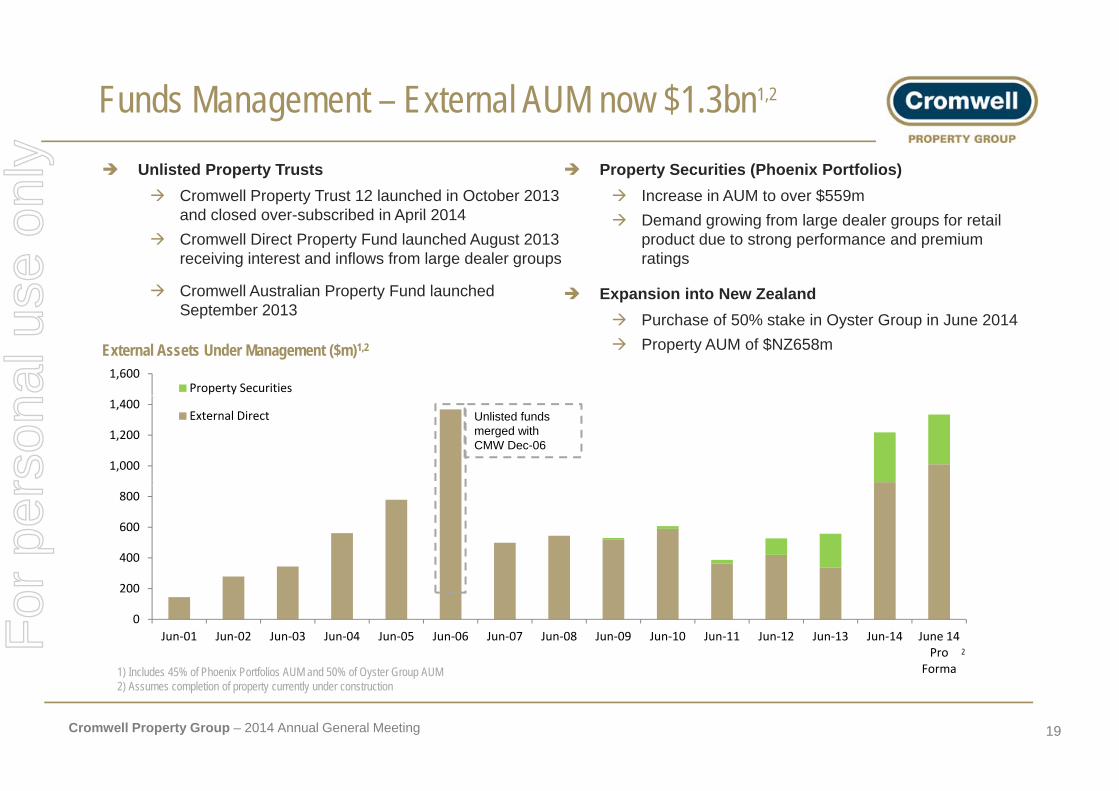
Funds Management – External AUM now $1.3bn1,2
Unlisted Property Trusts Cromwell Property Trust 12 launched in October 2013
and closed over-subscribed in April 2014
Property Securities (Phoenix Portfolios) Increase in AUM to over $559m D d i f l d l f t iland closed over-subscribed in April 2014
Cromwell Direct Property Fund launched August 2013 receiving interest and inflows from large dealer groups
Cromwell Australian Property Fund launched S t b 2013
Demand growing from large dealer groups for retail product due to strong performance and premium ratings
Expansion into New Zealand
1,600Property Securities
September 2013 Purchase of 50% stake in Oyster Group in June 2014 Property AUM of $NZ658mExternal Assets Under Management ($m)1,2
1,000
1,200
1,400External Direct Unlisted funds
merged with CMW Dec-06
400
600
800
0
200
Jun‐01 Jun‐02 Jun‐03 Jun‐04 Jun‐05 Jun‐06 Jun‐07 Jun‐08 Jun‐09 Jun‐10 Jun‐11 Jun‐12 Jun‐13 Jun‐14 June 14 Pro
F2
Cromwell Property Group – 2014 Annual General Meeting 19
Forma1) Includes 45% of Phoenix Portfolios AUM and 50% of Oyster Group AUM2) Assumes completion of property currently under construction
For
per
sona
l use
onl
y
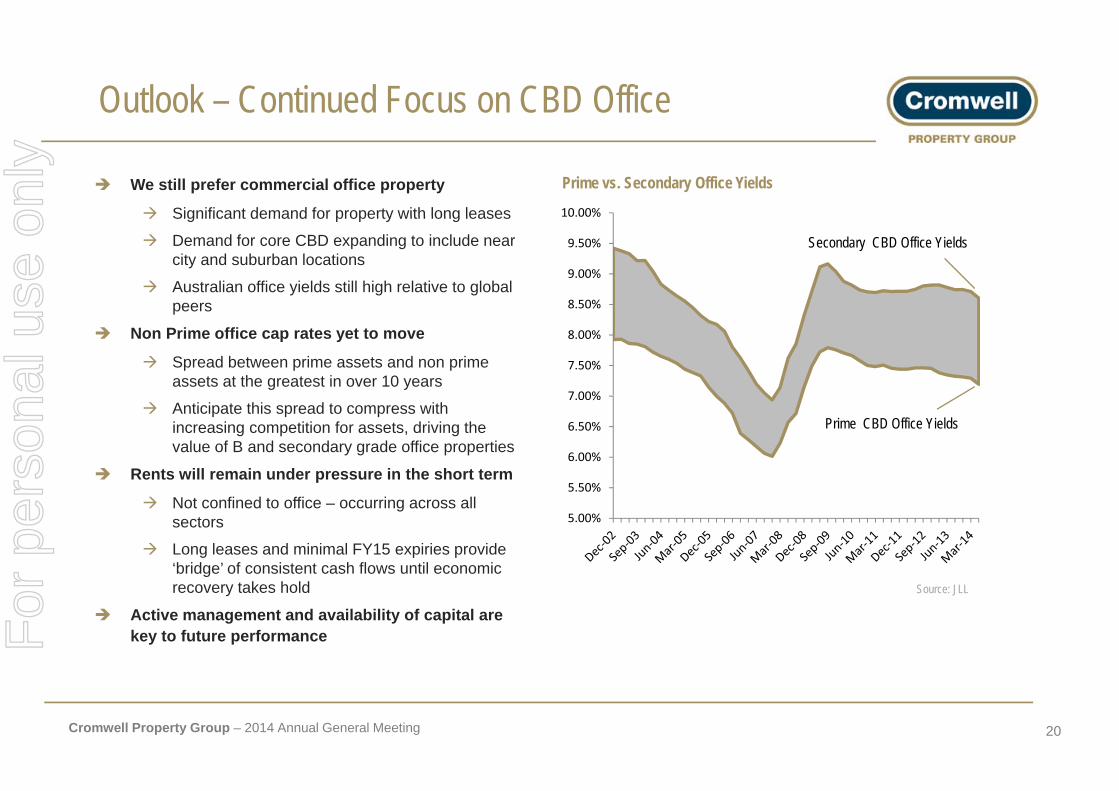
Outlook – Continued Focus on CBD Office
10.00%
We still prefer commercial office property
Significant demand for property with long leases
Prime vs. Secondary Office Yields
8 50%
9.00%
9.50%
10.00% Significant demand for property with long leases
Demand for core CBD expanding to include near city and suburban locations
Australian office yields still high relative to global peers
Secondary CBD Office Yields
7 00%
7.50%
8.00%
8.50%peers
Non Prime office cap rates yet to move
Spread between prime assets and non prime assets at the greatest in over 10 years
5 50%
6.00%
6.50%
7.00% Anticipate this spread to compress with
increasing competition for assets, driving the value of B and secondary grade office properties
Rents will remain under pressure in the short term
Prime CBD Office Yields
5.00%
5.50% Not confined to office – occurring across all
sectors
Long leases and minimal FY15 expiries provide ‘bridge’ of consistent cash flows until economic grecovery takes hold
Active management and availability of capital are key to future performance
Source: JLL
Cromwell Property Group – 2014 Annual General Meeting 20
For
per
sona
l use
onl
y
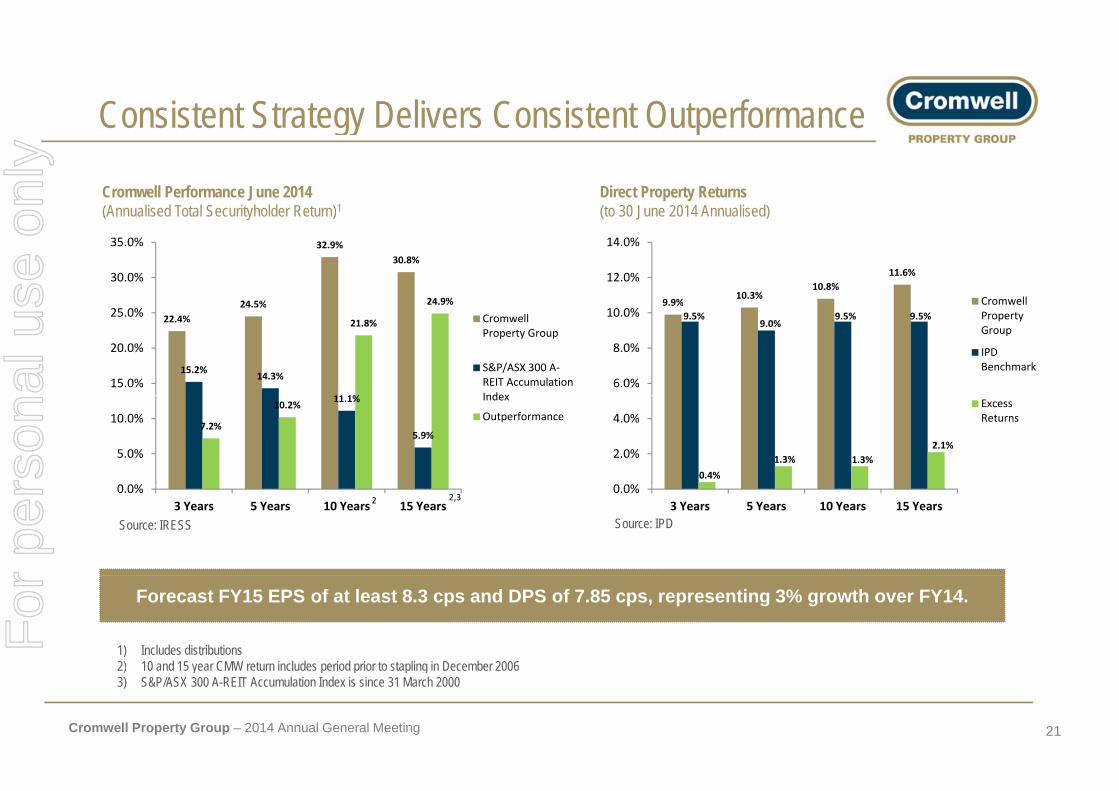
Consistent Strategy Delivers Consistent OutperformanceConsistent Strategy Delivers Consistent Outperformance
Cromwell Performance June 2014(Annualised Total Securityholder Return)1
Direct Property Returns (to 30 June 2014 Annualised)
24 5%
32.9%30.8%
24.9%
30.0%
35.0%
(Annualised Total Securityholder Return) (to 30 June 2014 Annualised)
9.9%10.3%
10.8%11.6%12.0%
14.0%
Cromwell 22.4%
24.5%
15.2% 14.3%
11 1%
21.8%
15.0%
20.0%
25.0% Cromwell Property Group
S&P/ASX 300 A‐REIT Accumulation Index
%9.5%
9.0%9.5% 9.5%
6.0%
8.0%
10.0% Property Group
IPD Benchmark
11.1%
5.9%7.2%
10.2%
0 0%
5.0%
10.0%
Index
Outperformance
0.4%1.3% 1.3%
2.1%
0 0%
2.0%
4.0%Excess Returns
0.0%3 Years 5 Years 10 Years 15 Years
2,3
Source: IRESS Source: IPD
20.0%
3 Years 5 Years 10 Years 15 Years
1) Includes distributions 2) 10 and 15 year CMW return includes period prior to stapling in December 2006
Forecast FY15 EPS of at least 8.3 cps and DPS of 7.85 cps, representing 3% growth over FY14.
Cromwell Property Group – 2014 Annual General Meeting 21
2) 10 and 15 year CMW return includes period prior to stapling in December 20063) S&P/ASX 300 A-REIT Accumulation Index is since 31 March 2000
For
per
sona
l use
onl
y

Voting Cards
Y ll d Bl d Green cardYellow cardVoting card
Blue card Non-voting attendee card
Green cardVisitor card
Cromwell Property Group – 2014 Annual General Meeting 22
For
per
sona
l use
onl
y
Items of Business
Cromwell Property Group – 2014 Annual General Meeting 23
For
per
sona
l use
onl
y
Item 1
Consideration of the Financial, Directors’ and Auditor’s Reports
– This is not the subject of a formal resolution and no proxies apply
Cromwell Property Group – 2014 Annual General Meeting 24
For
per
sona
l use
onl
y
Item 2
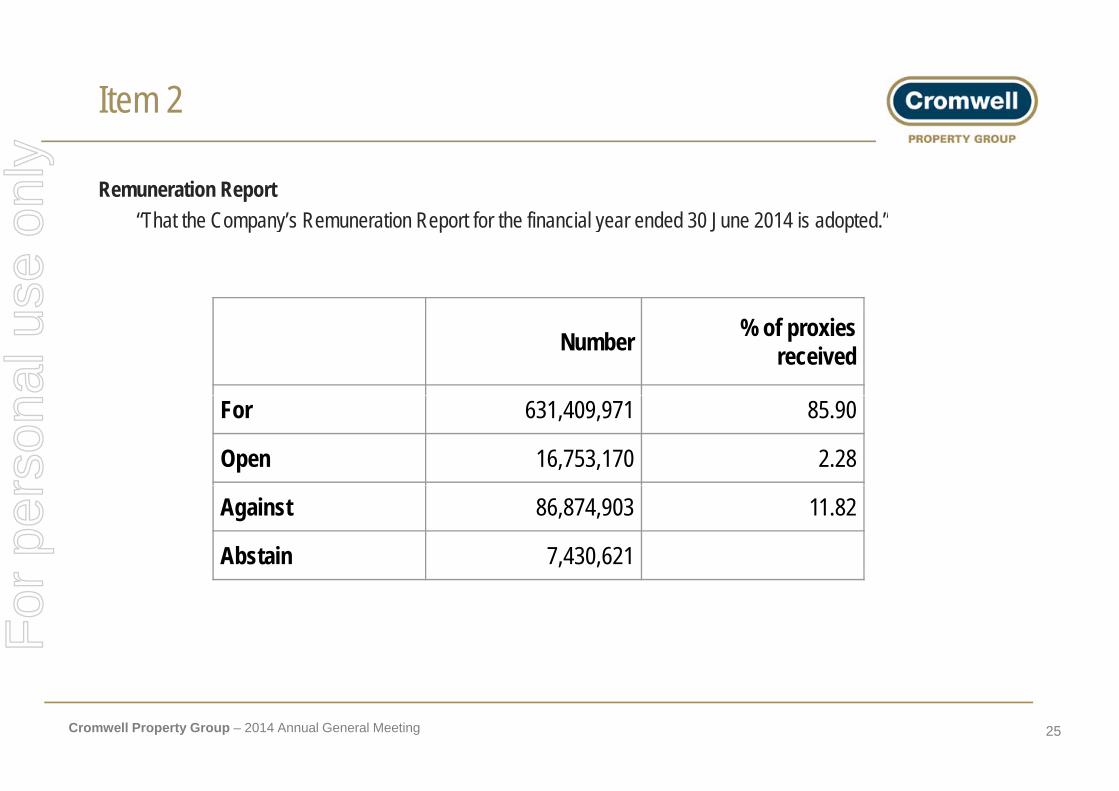
Remuneration Report“Th t th C ’ R ti R t f th fi i l d d 30 J 2014 i d t d ”“That the Company’s Remuneration Report for the financial year ended 30 June 2014 is adopted.”
Number % of proxies received
For 631,409,971 85.90
Open 16,753,170 2.28
Against 86,874,903 11.82
Abstain 7,430,621
Cromwell Property Group – 2014 Annual General Meeting 25
For
per
sona
l use
onl
y
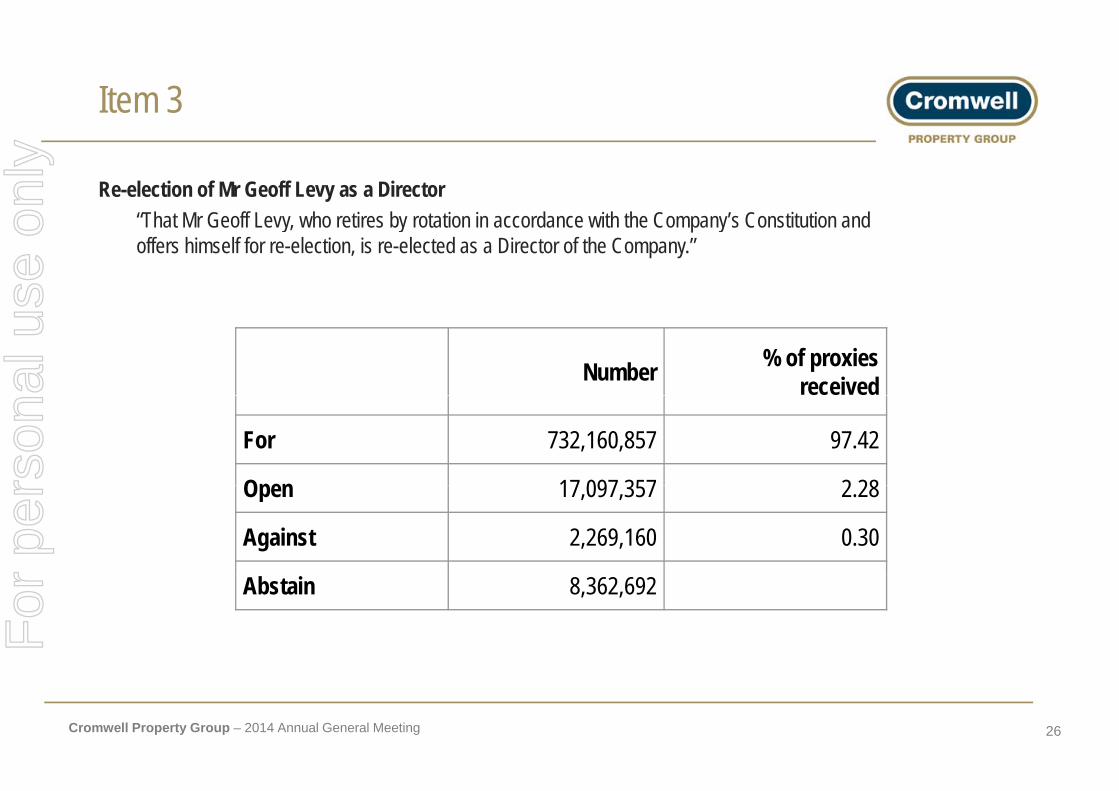
Item 3
Re-election of Mr Geoff Levy as a Director“Th t M G ff L h ti b t ti i d ith th C ’ C tit ti d “That Mr Geoff Levy, who retires by rotation in accordance with the Company’s Constitution and offers himself for re-election, is re-elected as a Director of the Company.”
Number % of proxies received
For 732,160,857 97.42
Open 17 097 357 2 28Open 17,097,357 2.28
Against 2,269,160 0.30
Abstain 8,362,692
Cromwell Property Group – 2014 Annual General Meeting 26
For
per
sona
l use
onl
y

Item 4
Election of Ms Jane Tongs as a Director” Th t M J T h i li ibl d h i ff d h lf f l ti i l t d” That Ms Jane Tongs, who is eligible and having offered herself for election, is elected as a director of of the Company.”
Number % of proxies received
For 735,490,687 97.58
Open 17,127,197 2.27
Against 1,119,192 0.15
Abstain 6,152,990
Cromwell Property Group – 2014 Annual General Meeting 27
For
per
sona
l use
onl
y
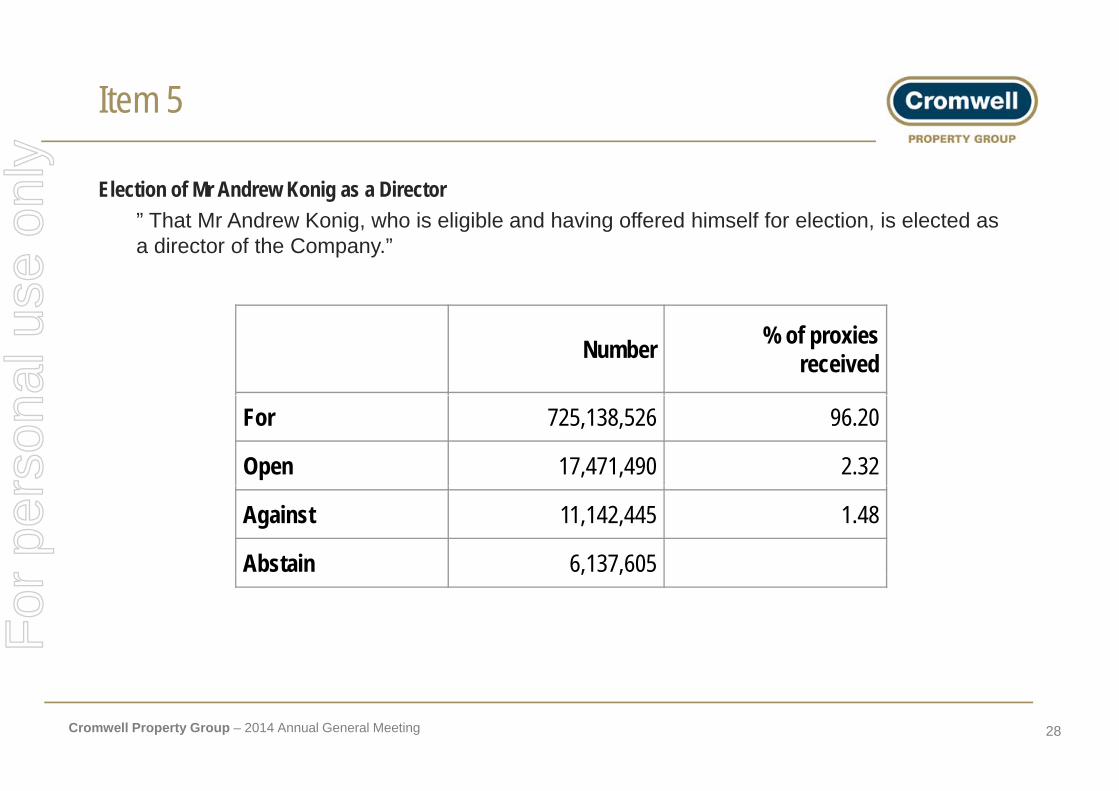
Item 5
Election of Mr Andrew Konig as a Director” Th t M A d K i h i li ibl d h i ff d hi lf f l ti i l t d” That Mr Andrew Konig, who is eligible and having offered himself for election, is elected as a director of the Company.”
Number % of proxies received
For 725,138,526 96.20
Open 17,471,490 2.32
Against 11,142,445 1.48
Abstain 6,137,605
Cromwell Property Group – 2014 Annual General Meeting 28
For
per
sona
l use
onl
y
Questions
Cromwell Property Group – 2014 Annual General Meeting 29
For
per
sona
l use
onl
y
Thank you for your time
Cromwell Property Group – 2014 Annual General Meeting 30
For
per
sona
l use
onl
y

![SHORT COURSE SITE MAP • SATURDAY 6 …...KEY: 20. COOLANGATTA GOLD 2017 Short Course Transi on Area s ] } v 8 v24/08/2017 24. 1.Finish Line 25. 2.Finish Ramp (15.6m x 2.4m) 3.Podium](https://img.pdfslide.us/doc/110x75/5f4809ecea199f5e8503b6e2/short-course-site-map-a-saturday-6-key-20-coolangatta-gold-2017-short-course.jpg)